Embed Size (px)
Citation preview
0
100
200
300
400
500
0 3 6 9 15 24 48
Time post inoculation (h)
SN
O c
on
ten
t (p
mo
le/m
g p
rote
in)
WT
atgsnor1-1
atgsnor1-3
nox1
WT (AvrB)atgsnor1-3 (AvrB)
Pst / Pst (avrB)
Figure S1 | SNO content in atgsnor1 and nox1 plants
following PstDC3000 challenge. Profile of SNO accumulation
over time in the given plant genotypes following infiltration of
either PstDC3000(avrB) or PstDC3000 (containing an empty
vector lacking avrB). Data points represent the mean of 3
samples ± S.E. Strains of PstDC3000 were infiltrated at 1 x 10⁶
cfu/ml.
SUPPLEMENTARY INFORMATIONdoi:10.1038/nature10427
WWW.NATURE.COM/NATURE | 1
Time post inoculation (h)
0
50
100
150
200
250
0 3 6 9 15 24 48
Nit
rite
(n
mo
l/m
g p
rote
in)
WT
atgsnor1-1
atgsnor1-3
nox1
Pst (avrB)
d
0
50
100
150
200
250
Nit
rite
(n
mo
l/m
g p
rote
in)
WT
atgsnor1-1
atgsnor1-3
nox1
Pst (avrRps4)
0 3 6 9 15 24 48
Time post inoculation (h)
WT
0 h 9 h 24 h 24 h + PTIO
atgsnor1-1
atgsnor1-3
nox1
c
ba
0
2
4
6
8
10
12
14
16
18
20
WT atgsnor1-1 atgsnor1-3 nox1
Rela
tiv
e D
AF
-2D
A in
ten
sit
y 0 h
9 h
24 h
24 h + PTIO
Pst (avrB)
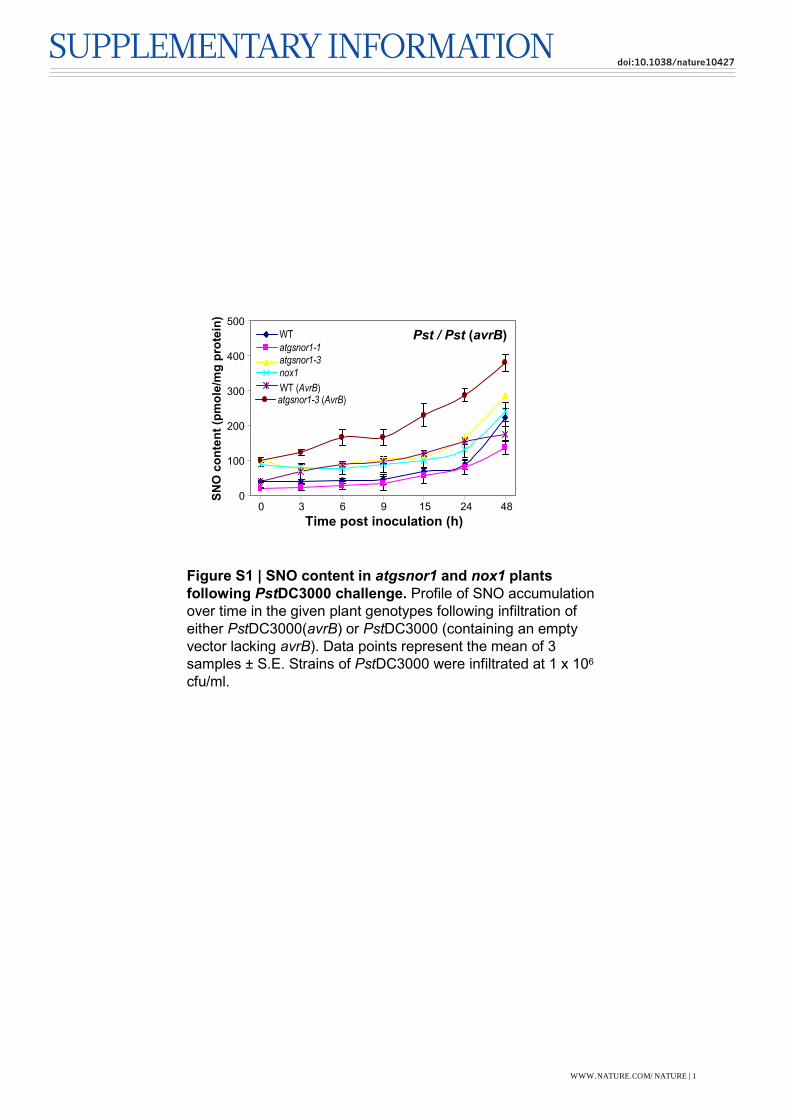
Figure S2 | NO and nitrite levels in atgsnor1 and nox1 plants in response to avirulent PstDC3000
strains. a, DAF-2DA fluorescence (green) reports NO accumulation in response to PstDC3000(avrB). The
NO scavenger carboxy-2-phenyl-4,4,5,5-tetra-methylimidazolinone-3-oxide-1-oxyl (c-PTIO; 100 µM) blunts
DAF-2DA fluorescence, confirming the specificity of this fluorophore for bioimaging. Chloroplasts exhibited
red autofluorescence. b, Quantification of DAF-2DA signals following pathogen challenge. c, Levels of nitrite,
a reporter for NO accumulation, in the given plant genotypes following inoculation of PstDC3000(avrB). d,
Nitrite accumulation following PstDC3000(avrRps4) challenge in the stated plant lines. Data points represent
the mean of 3 samples ± S.E. Strains of PstDC3000 were infiltrated at 1 x 10⁶ cfu/ml.
SUPPLEMENTARY INFORMATIONRESEARCHdoi:10.1038/nature10427
WWW.NATURE.COM/NATURE | 2
d
e
b
c
0
0.1
0.2
0.3
0.4
0.5
0 3 6 9 15 20 24 48
Fre
e S
A (
µg
/gfr
tiss
ue
) WT
atgsnor1-1
atgsnor1-3
nox1
Time post inoculation (h)
Pst (avrB)
Time post inoculation (h)
0
1
2
3
4
5
6
7
8
0 3 6 9 15 20 24 48
SA
G (
µg
/gfr
tis
su
e) WT
atgsnor1-1
atgsnor1-3
nox1
Pst (avrB)
Time post inoculation (h)
0
1
2
3
4
5
6
0 3 6 9 15 20 24 48
SA
G (
µg
/gfr
tis
su
e) WT
atgsnor1-1
atgsnor1-3
nox1
Pst (avrRps4)
Time post inoculation (h)
a
0
1
2
3
4
5
6
7
8
0 3 6 9 15 20 24 48
Time post inoculation (h)
To
tal S
A (
µg
/gfr
tissu
e)
WTatgsnor1-1atgsnor1-3nox1
WT (avrB)atgsnor1-1 (avrB)
Pst / Pst (avrB)
0
0.1
0.2
0.3
0.4
0.5
0.6
0 3 6 9 15 20 24 48
Fre
e S
A (
µg
/gfr
tiss
ue
) WT
atgsnor1-1
atgsnor1-3
nox1
Pst (avrRps4)0.7
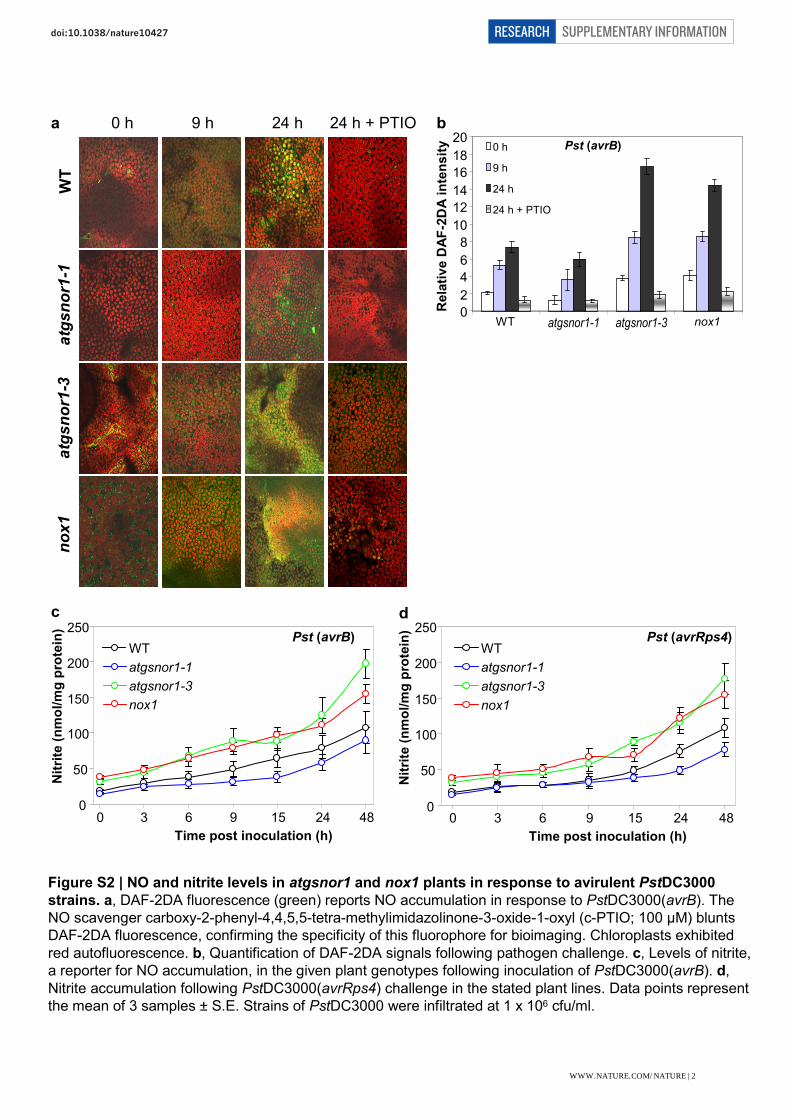
Figure S3 | Total and free SA and also SAG accumulation over time during attempted pathogen
infection. a, Profile of total SA accumulation over time in the given plant genotypes following infiltration
of PstDC3000 strains. b, Free SA accumulation in the stated Arabidopsis lines over time in response to
attempted PstDC3000(avrB) infection. c, Free SA levels in the given plant genotypes over time in
response to PstDC3000(avrRps4) challenge. d, SAG accumulation in the stated plant lines in response
to attempted PstDC3000(avrB) ingress. e, SAG levels following PstDC3000(avrRps4) infiltration in the
stated Arabidopsis plants. Data points represent the mean of 3 samples ± S.E. All strains of PstDC3000
were infiltrated at 1 x 10⁶ cfu/ml.
SUPPLEMENTARY INFORMATIONRESEARCHdoi:10.1038/nature10427
WWW.NATURE.COM/NATURE | 3
0 9 15 24 48 h 0 9 15 24 48 h
a bPst (avrB) Pst (avrRps4)
WT
atgsnor1-1
atgsnor1-3
nox1
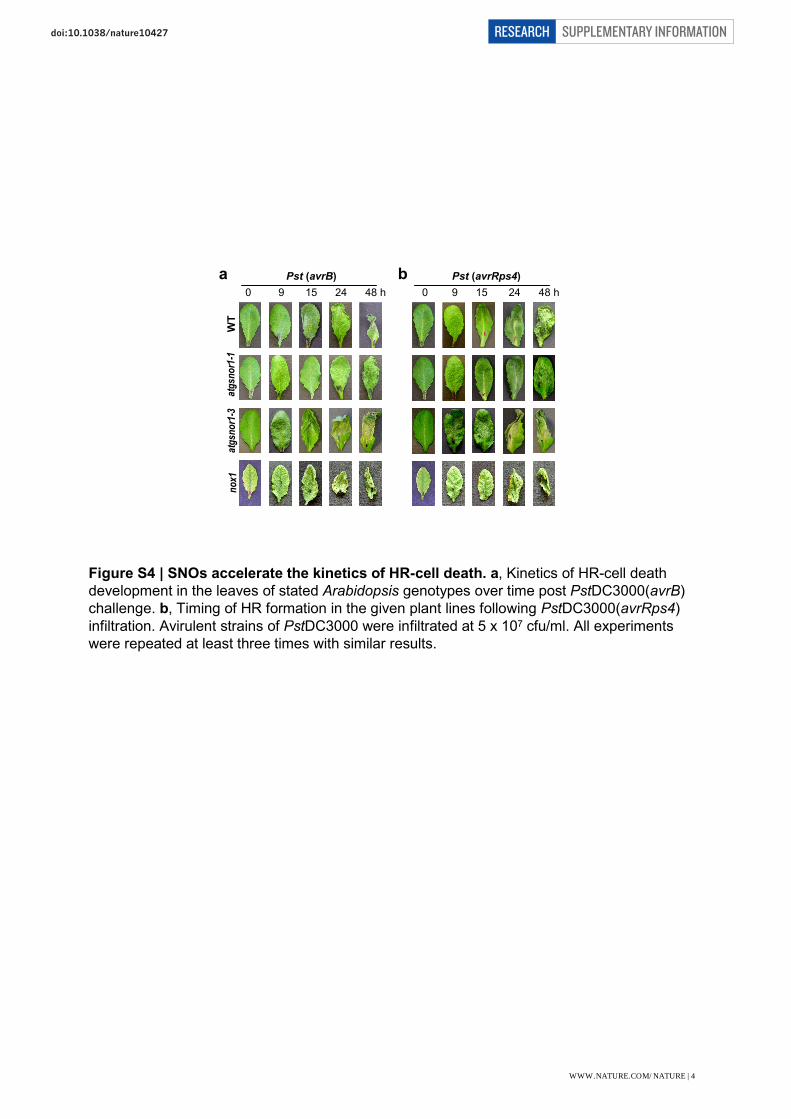
Figure S4 | SNOs accelerate the kinetics of HR-cell death. a, Kinetics of HR-cell death
development in the leaves of stated Arabidopsis genotypes over time post PstDC3000(avrB)
challenge. b, Timing of HR formation in the given plant lines following PstDC3000(avrRps4)
infiltration. Avirulent strains of PstDC3000 were infiltrated at 5 x 10⁷ cfu/ml. All experiments
were repeated at least three times with similar results.
SUPPLEMENTARY INFORMATIONRESEARCHdoi:10.1038/nature10427
WWW.NATURE.COM/NATURE | 4
0
10
20
30
40
50
60
70
80
0 2 4 6 8 10 12 24
Time post inoculation (h)
Ele
ctr
oly
te leakag
e (
µs/c
m)
WT
atgsnor1-1
atgsnor1-3
nox1
WT (avrB)
atgsnor1-3 (avrB)
Pst / Pst (avrB)
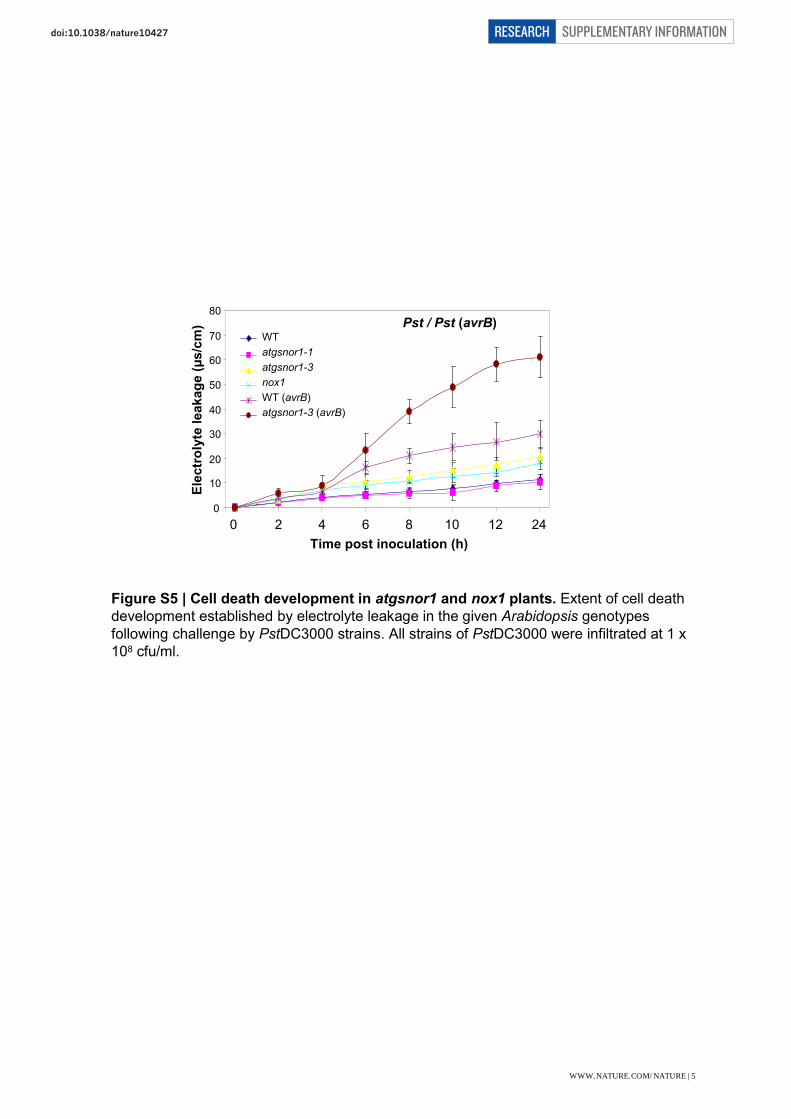
Figure S5 | Cell death development in atgsnor1 and nox1 plants. Extent of cell death
development established by electrolyte leakage in the given Arabidopsis genotypes
following challenge by PstDC3000 strains. All strains of PstDC3000 were infiltrated at 1 x
108 cfu/ml.
SUPPLEMENTARY INFORMATIONRESEARCHdoi:10.1038/nature10427
WWW.NATURE.COM/NATURE | 5
0
20
40
60
80
100
120
140
WT atgsnor1-3 atgsnor1-3 sid2
Cell d
eath
(arb
itra
ry u
nit
) Pst
Pst (avrB)
Pst (avrRps4)
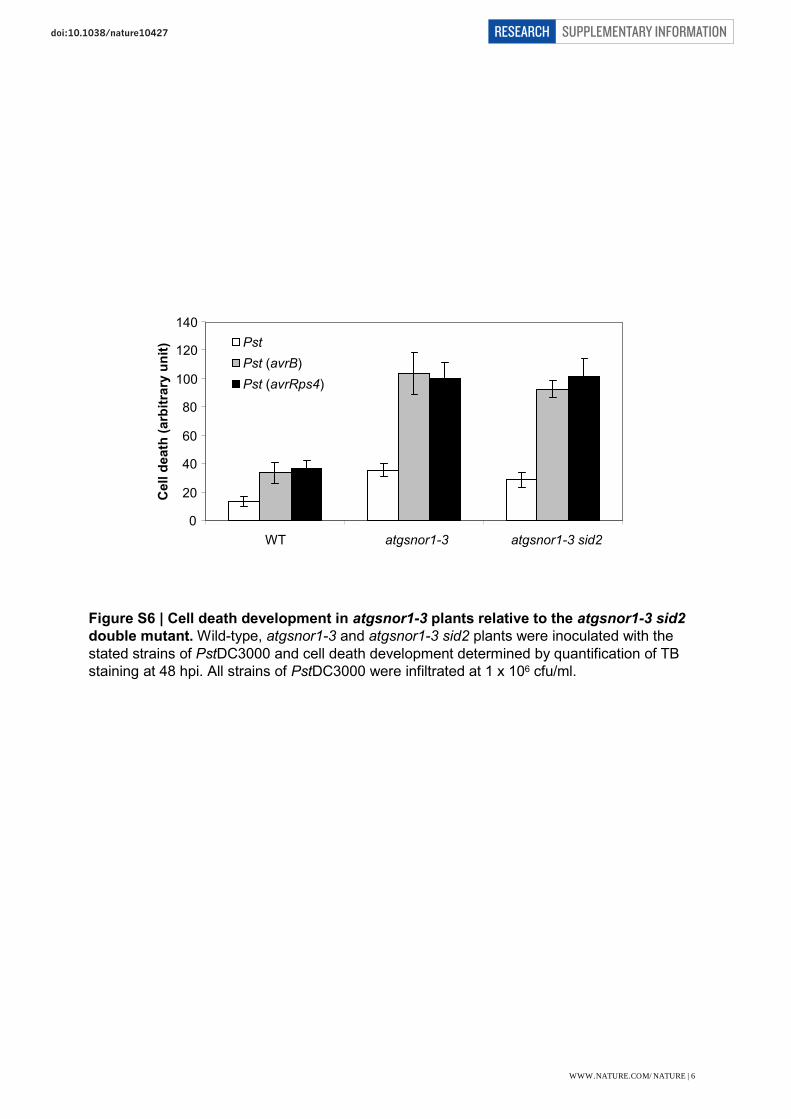
Figure S6 | Cell death development in atgsnor1-3 plants relative to the atgsnor1-3 sid2
double mutant. Wild-type, atgsnor1-3 and atgsnor1-3 sid2 plants were inoculated with the
stated strains of PstDC3000 and cell death development determined by quantification of TB
staining at 48 hpi. All strains of PstDC3000 were infiltrated at 1 x 10⁶ cfu/ml.
SUPPLEMENTARY INFORMATIONRESEARCHdoi:10.1038/nature10427
WWW.NATURE.COM/NATURE | 6
0
10
20
30
40
50
60
70
80
WT atgsnor1-3 sid2 atgsnor1-3 sid2
Cell d
eath
(arb
itra
ry u
nit
)
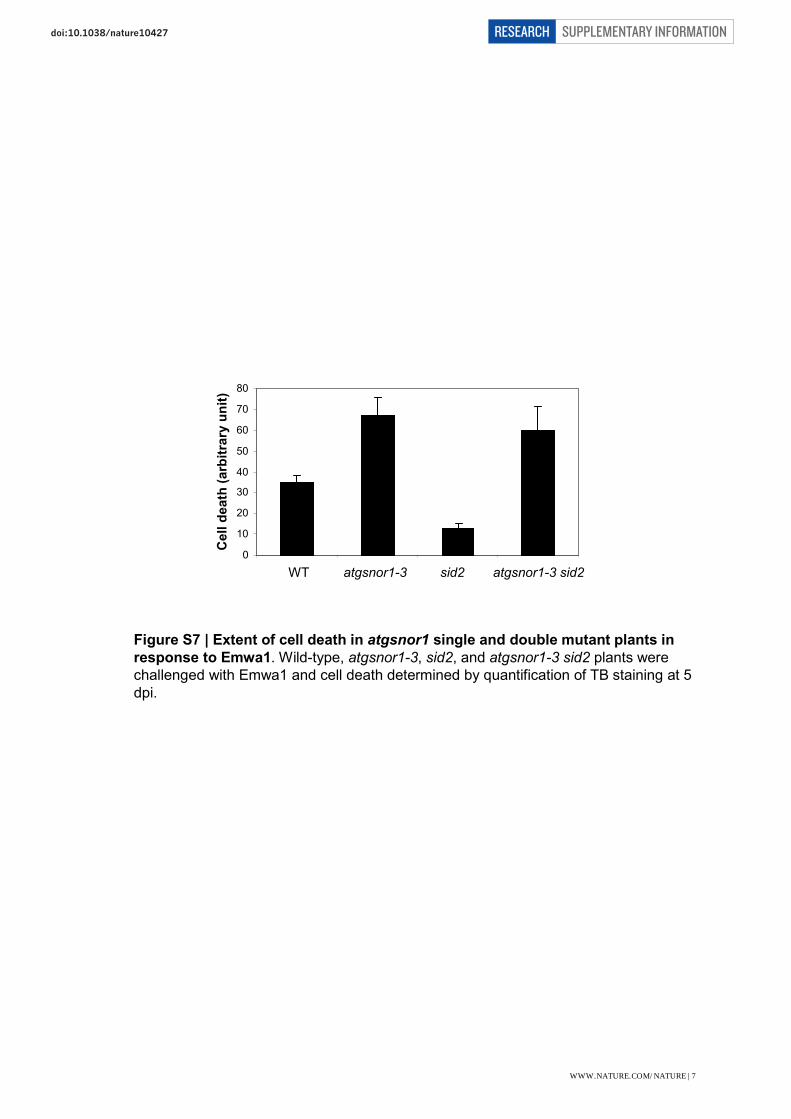
Figure S7 | Extent of cell death in atgsnor1 single and double mutant plants in
response to Emwa1. Wild-type, atgsnor1-3, sid2, and atgsnor1-3 sid2 plants were
challenged with Emwa1 and cell death determined by quantification of TB staining at 5
dpi.
SUPPLEMENTARY INFORMATIONRESEARCHdoi:10.1038/nature10427
WWW.NATURE.COM/NATURE | 7
0.0
0.2
0.4
0.6
0.8
1.0
1.2
1.4
WT atgsnor1-3 sid1 sid2
Fre
e S
A (
µg
/gfr
tissu
e)
0
1
2
3
4
5
6
7
8
9
WT atgsnor1-3 sid1 sid2
SA
G (
µg
/gfr
tissu
e)
a
b
c
0
2
4
6
8
10
12
WT atgsnor1-3 sid1 sid2
To
tal
SA
(µ
g/g
frti
ss
ue
)
MgCl2Pst
Pst (avrB)
1.6
MgCl2Pst
Pst (avrB)
MgCl2Pst
Pst (avrB)
*
*
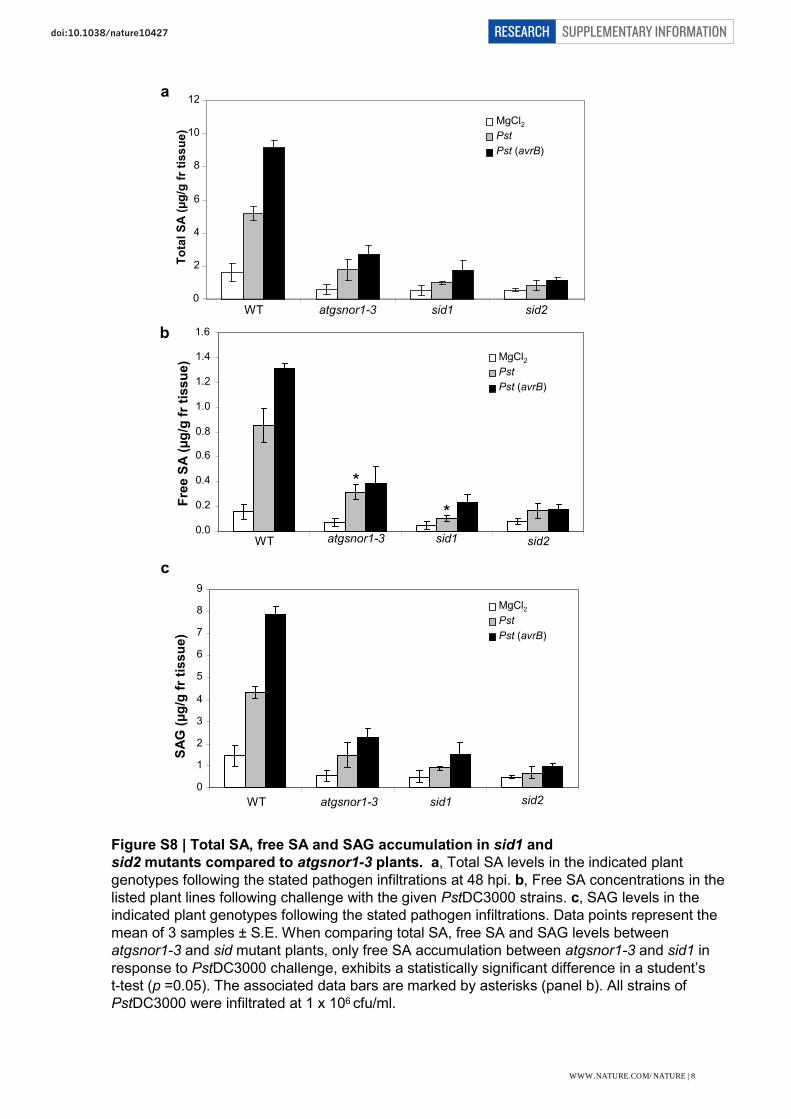
Figure S8 | Total SA, free SA and SAG accumulation in sid1 and
sid2 mutants compared to atgsnor1-3 plants. a, Total SA levels in the indicated plant
genotypes following the stated pathogen infiltrations at 48 hpi. b, Free SA concentrations in the
listed plant lines following challenge with the given PstDC3000 strains. c, SAG levels in the
indicated plant genotypes following the stated pathogen infiltrations. Data points represent the
mean of 3 samples ± S.E. When comparing total SA, free SA and SAG levels between
atgsnor1-3 and sid mutant plants, only free SA accumulation between atgsnor1-3 and sid1 in
response to PstDC3000 challenge, exhibits a statistically significant difference in a student’s
t-test (p =0.05). The associated data bars are marked by asterisks (panel b). All strains of
PstDC3000 were infiltrated at 1 x 10⁶ cfu/ml.
SUPPLEMENTARY INFORMATIONRESEARCHdoi:10.1038/nature10427
WWW.NATURE.COM/NATURE | 8
a b
0
50
100
150
200
250
WT atgsnor1-3 sid1 sid2
SN
O (
pm
ole
/mg
pro
tein
)
Mock
H.a (Emwa1)
0
50
100
150
200
250
WT atgsnor1-3 sid1 sid2
Nit
rite
(n
mo
le/m
g p
rote
in)
Mock
H.a (Emwa1)
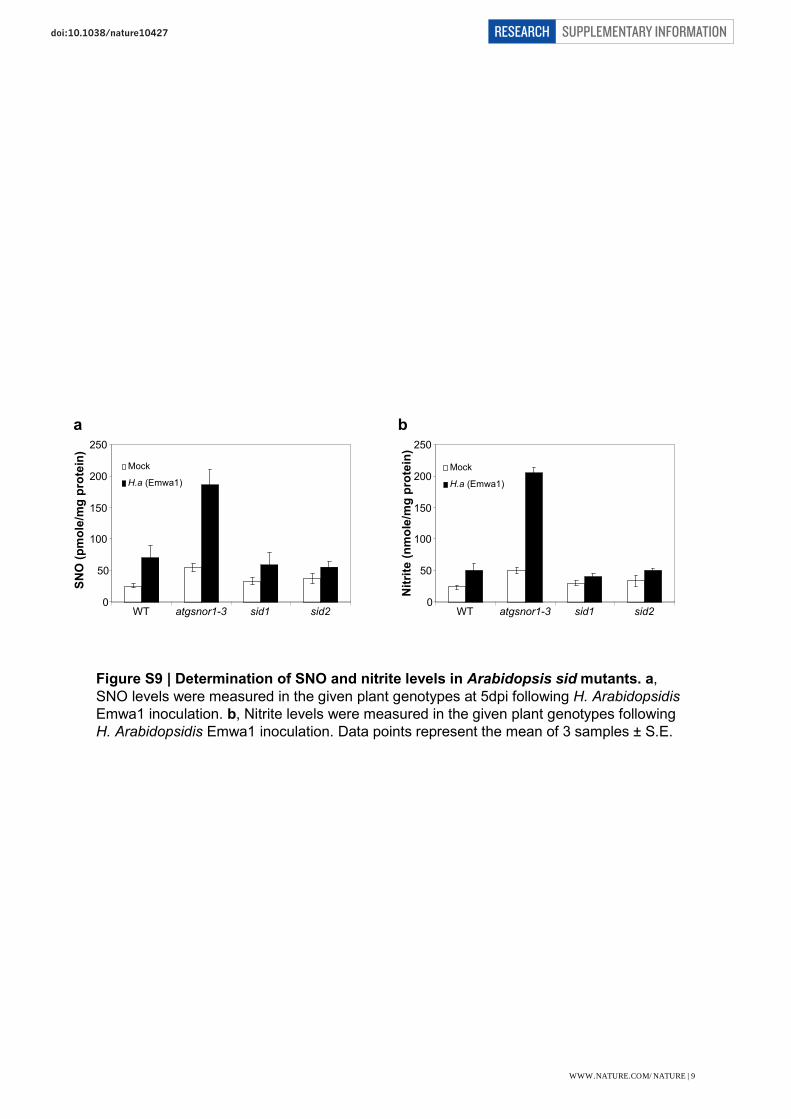
Figure S9 | Determination of SNO and nitrite levels in Arabidopsis sid mutants. a,
SNO levels were measured in the given plant genotypes at 5dpi following H. Arabidopsidis
Emwa1 inoculation. b, Nitrite levels were measured in the given plant genotypes following
H. Arabidopsidis Emwa1 inoculation. Data points represent the mean of 3 samples ± S.E.
SUPPLEMENTARY INFORMATIONRESEARCHdoi:10.1038/nature10427
WWW.NATURE.COM/NATURE | 9
0 3 6 15 h 3 6 15 h
a bPst (avrB) Pst (avrRps4)
WT
atgsnor1-1
atgsnor1-3
nox1
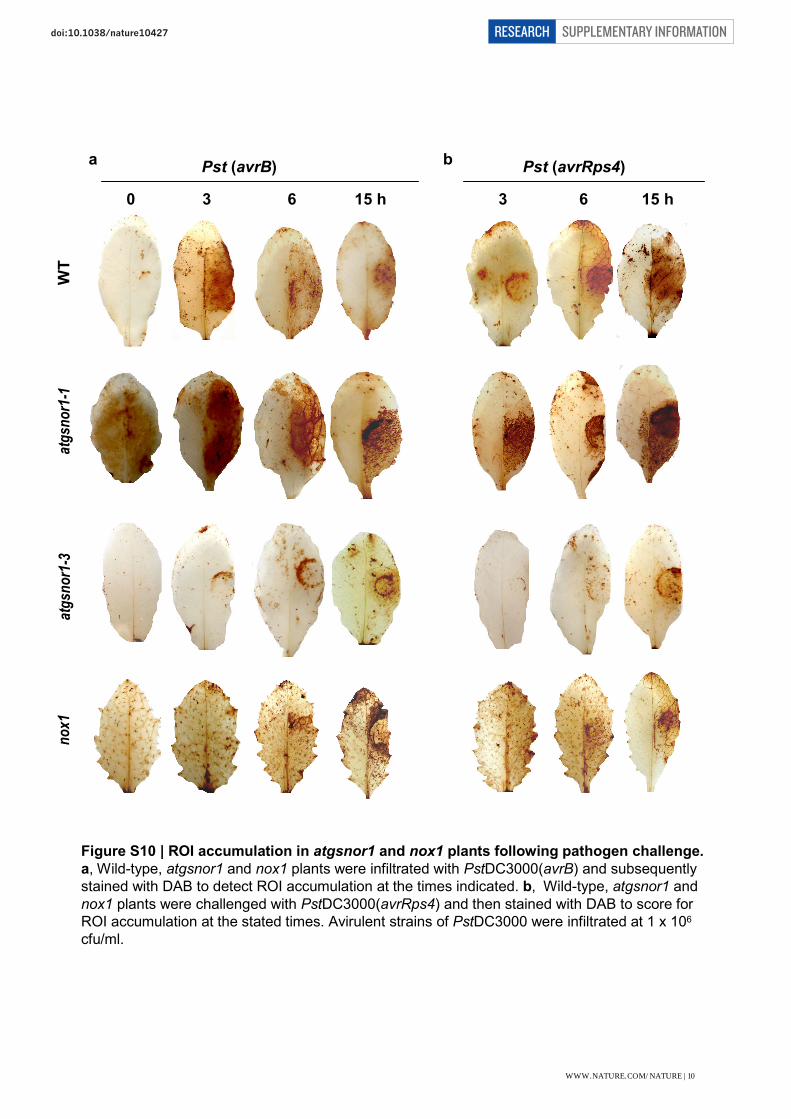
Figure S10 | ROI accumulation in atgsnor1 and nox1 plants following pathogen challenge.
a, Wild-type, atgsnor1 and nox1 plants were infiltrated with PstDC3000(avrB) and subsequently
stained with DAB to detect ROI accumulation at the times indicated. b, Wild-type, atgsnor1 and
nox1 plants were challenged with PstDC3000(avrRps4) and then stained with DAB to score for
ROI accumulation at the stated times. Avirulent strains of PstDC3000 were infiltrated at 1 x 10⁶
cfu/ml.
SUPPLEMENTARY INFORMATIONRESEARCHdoi:10.1038/nature10427
WWW.NATURE.COM/NATURE | 10
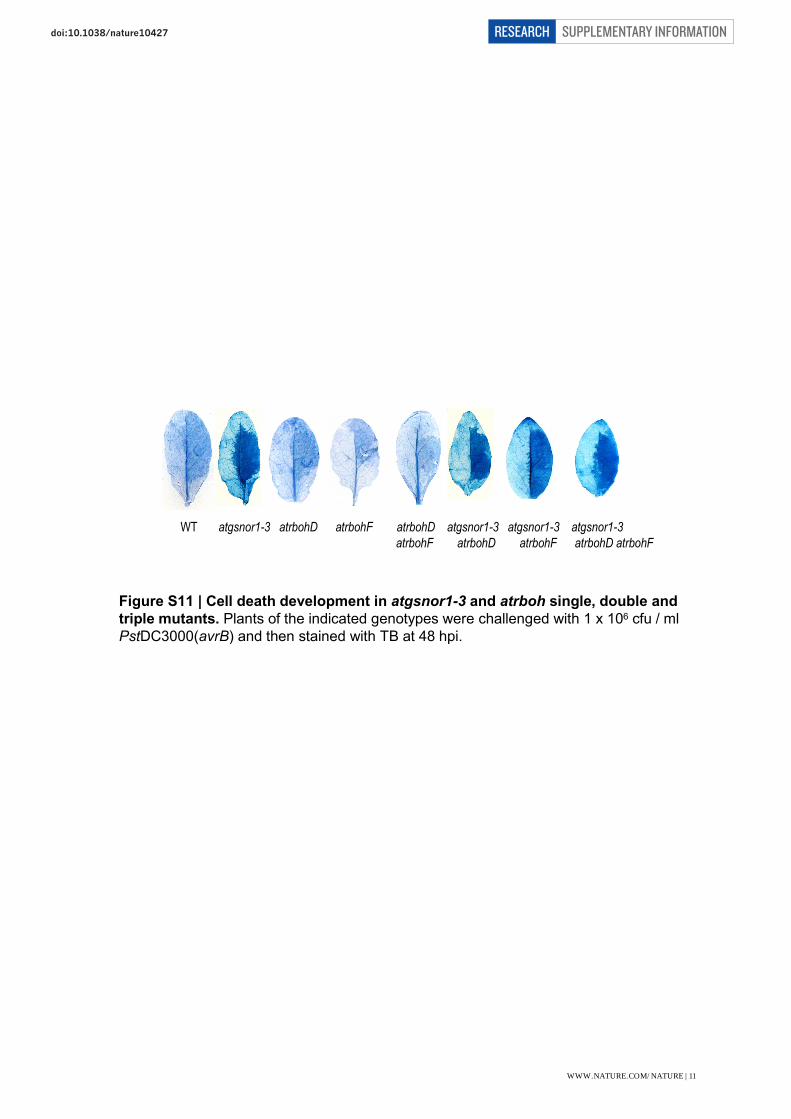
WT atgsnor1-3 atrbohD atrbohF atrbohD atgsnor1-3 atgsnor1-3 atgsnor1-3
atrbohF atrbohD atrbohF atrbohD atrbohF
Figure S11 | Cell death development in atgsnor1-3 and atrboh single, double and
triple mutants. Plants of the indicated genotypes were challenged with 1 x 10⁶ cfu / ml
PstDC3000(avrB) and then stained with TB at 48 hpi.
SUPPLEMENTARY INFORMATIONRESEARCHdoi:10.1038/nature10427
WWW.NATURE.COM/NATURE | 11
0
10
20
30
40
50
60
70
WT atgsnor1-3 atrbohD atgsnor1-3
atrbohD
atrbohD atrbohF
atgsnor1-3
Cell d
eath
(arb
itra
ry u
nit
)
MgCl2
Pst
Pst (avrB)
0
20
40
60
80
100
120
Inte
nsit
y o
f D
AB
sta
in
(arb
itra
ry u
nit
)
MgCl2
Pst
Pst (avrB)
WT atgsnor1-3 atrbohD atgsnor1-3
atrbohD
atrbohD atrbohF
atgsnor1-3
a
b
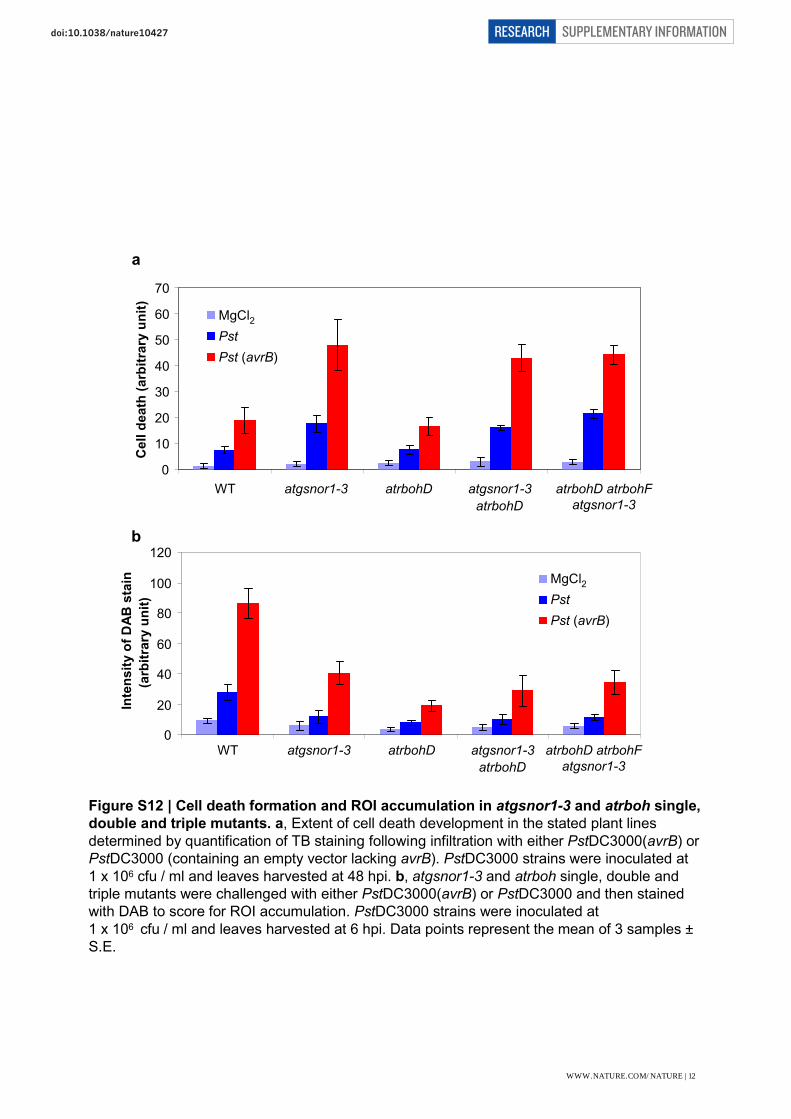
Figure S12 | Cell death formation and ROI accumulation in atgsnor1-3 and atrboh single,
double and triple mutants. a, Extent of cell death development in the stated plant lines
determined by quantification of TB staining following infiltration with either PstDC3000(avrB) or
PstDC3000 (containing an empty vector lacking avrB). PstDC3000 strains were inoculated at
1 x 10⁶ cfu / ml and leaves harvested at 48 hpi. b, atgsnor1-3 and atrboh single, double and
triple mutants were challenged with either PstDC3000(avrB) or PstDC3000 and then stained
with DAB to score for ROI accumulation. PstDC3000 strains were inoculated at
1 x 10⁶ cfu / ml and leaves harvested at 6 hpi. Data points represent the mean of 3 samples ±
S.E.
SUPPLEMENTARY INFORMATIONRESEARCHdoi:10.1038/nature10427
WWW.NATURE.COM/NATURE | 12
AtRBOH D::Myc
anti-c-Myc
Loading
control
0h 6h 12h
WT
atrb
ohD
atgs
nor1
-1
atrb
ohD
atgs
nor1
-3
atrb
ohD
atrb
ohD
atgs
nor1
-1
atrb
ohD
atgs
nor1
-3
atrb
ohD
atrb
ohD
atgs
nor1
-1
atrb
ohD
atgs
nor1
-3
atrb
ohD
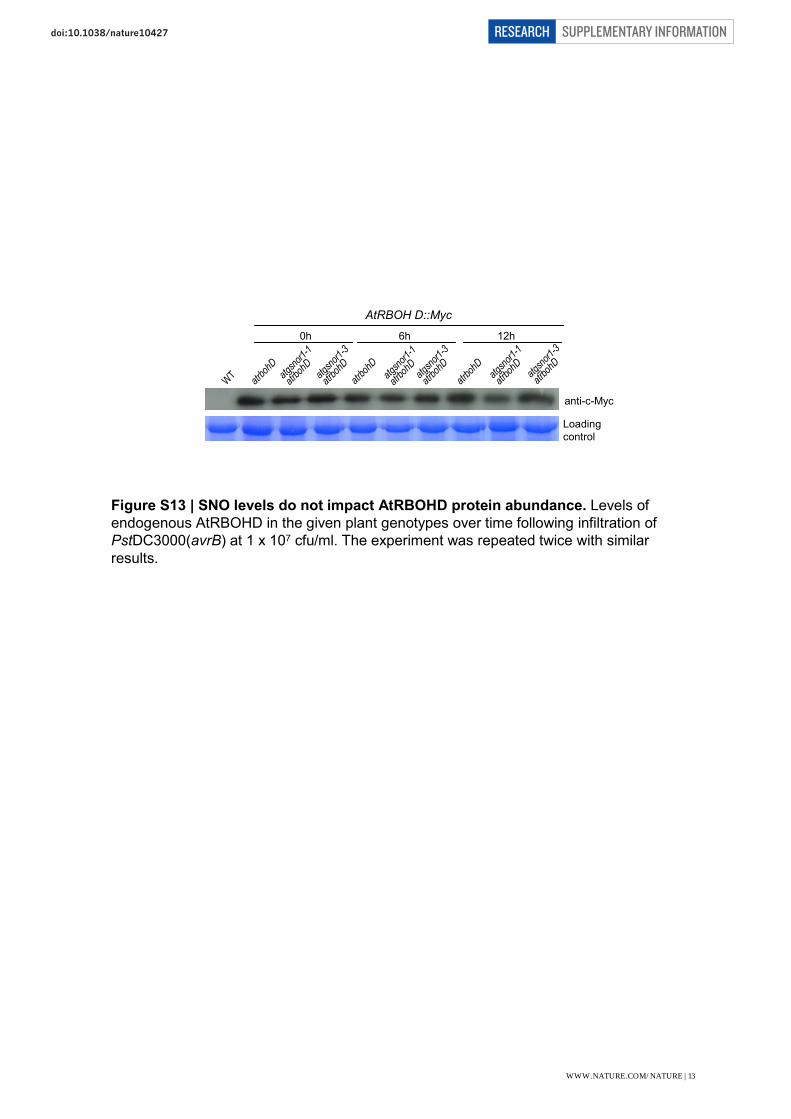
Figure S13 | SNO levels do not impact AtRBOHD protein abundance. Levels of
endogenous AtRBOHD in the given plant genotypes over time following infiltration of
PstDC3000(avrB) at 1 x 10⁷ cfu/ml. The experiment was repeated twice with similar
results.
SUPPLEMENTARY INFORMATIONRESEARCHdoi:10.1038/nature10427
WWW.NATURE.COM/NATURE | 13
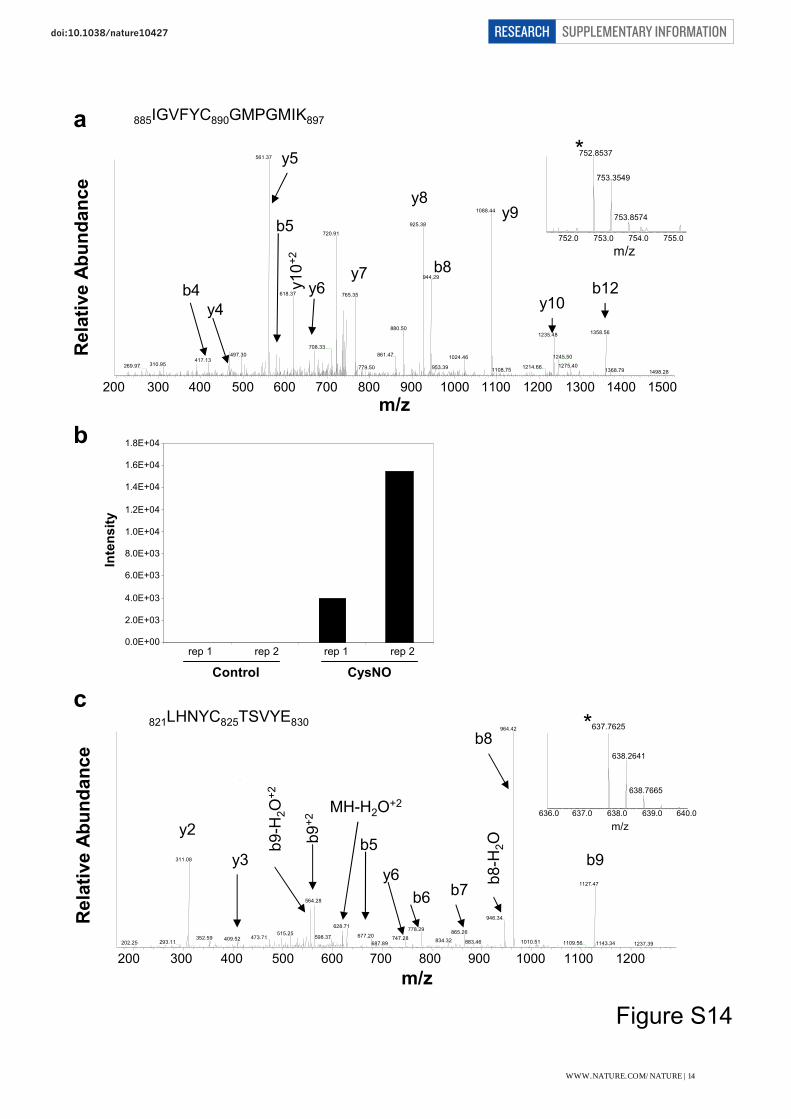
Figure S14
200 300 400 500 600 700 800 900 1000 1100 1200 1300 1400 1500
m/z
561.37
1088.44
925.38
720.91
944.29
618.37 765.35
880.501358.561235.48
708.33
497.30 861.47 1245.501024.46417.13
310.95 1275.40269.97 1214.66953.39779.50 1108.75 1368.79 1498.28
885IGVFYC890GMPGMIK897
b12y10
y9
y5
y1
0+
2
y8
b8y7
y4
b4 y6
b5752.0 753.0 754.0 755.0
752.8537
753.3549
753.8574
m/z
a
*
Rela
tive A
bu
nd
an
ce
c
200 300 400 500 600 700 800 900 1000 1100 1200
964.42
311.08
1127.47
564.28
946.34
628.71778.29
865.26515.25 677.20598.37473.71352.59 747.28409.52 834.32 1010.51883.46293.11202.25 1109.56 1143.34687.89 1237.39
821LHNYC825TSVYE830
b9
b8
b8
-H2O
b7b6
y6
b5
MH-H2O+2
y2
b9
+2
y3
b9
-H2O
+2
636.0 637.0 638.0 639.0 640.0
m/z
637.7625
638.2641
638.7665
*
Rela
tive A
bu
nd
an
ce
0.0E+00
2.0E+03
4.0E+03
6.0E+03
8.0E+03
1.0E+04
1.2E+04
1.4E+04
1.6E+04
1.8E+04
Control CysNO
rep 1 rep 2 rep 1 rep 2
Inte
nsit
y
b
m/z
SUPPLEMENTARY INFORMATIONRESEARCHdoi:10.1038/nature10427
WWW.NATURE.COM/NATURE | 14
Figure S14 | Mass spectrometric analysis identifies C890 as a site of cysteine S-
nitrosylation. a, MSMS spectra of C890 (y8) from tryptic fragment 885IGVFYC890GMPGMIK897 (peptide MSMS spectra shown with two methionine oxidised and
cysteine blocked with carbamidomethyl). This analysis is consistent with C890 S-
nitrosylation. The S-nitrosothiol formed at C890, following NO donor exposure, reacted with
iodoacetamide to form a carbamidomethyl ion. LC-MS spectra of the corresponding peak
(752.8537 amu) of this peptide fragment is shown in inset. b, Changes of MS peak intensity
of the tryptic peptide in (a), 885IGVFYC890GMPGMIK897 containing C890, following NO donor
treatment. As shown in two independent runs, no carbamidomethyl ion formation was
detected at C890 in the absence of NO donor. In contrast, the formation of this ion at C890
was striking following NO donor treatment. c, MSMS spectrum of C825 from tryptic fragment 821LHNYC825TSVYE830. In contrast to C890, no S-nitrosylation of C825 was detected. Rather,
only methylthiol formation was found at C825 following treatment with methyl
methanethiosulfonate (MMTS), suggesting C825 was not S-nitrosylated following NO donor
exposure. LC-MS spectra of the corresponding peak (637.7625 amu) of this peptide
fragment blocked with MMTS is shown in inset.
SUPPLEMENTARY INFORMATIONRESEARCHdoi:10.1038/nature10427
WWW.NATURE.COM/NATURE | 15
AtRbohD
HNOX2
DNOX
AtRbohD
HNOX2
DNOX
HNOX2
DNOX
HNOX2
DNOX
AtRbohD
AtRbohD
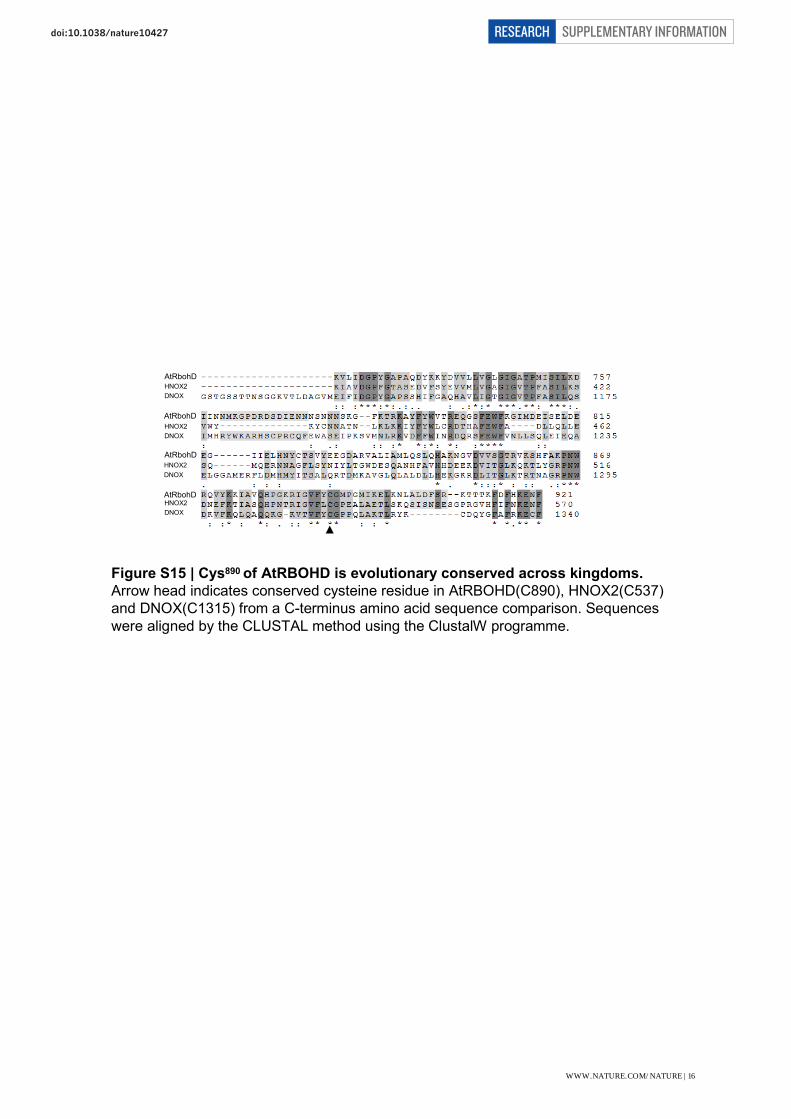
Figure S15 | Cys890 of AtRBOHD is evolutionary conserved across kingdoms.
Arrow head indicates conserved cysteine residue in AtRBOHD(C890), HNOX2(C537)
and DNOX(C1315) from a C-terminus amino acid sequence comparison. Sequences
were aligned by the CLUSTAL method using the ClustalW programme.
SUPPLEMENTARY INFORMATIONRESEARCHdoi:10.1038/nature10427
WWW.NATURE.COM/NATURE | 16
a
b
c
0 50 100 250 500 500 500 500 500 µMDTT
GSNO CysNO GSNO CysNO
HNOX2 C537A HNOX2 WT
0 50 100 250 500 500 GSH 500 500 µMDTT DTT
GSNO CysNO
anti-Biotin
HNOX2
anti-Biotin
HNOX2
0 50 100 250 500 500 GSH 500 500 µMDTT DTT
GSNO CysNO
0 50 100 250 500 500 500 500 500 µMDTT
GSNO CysNO GSNO CysNO
DNOX C1315A DNOX WT
anti-Biotin
anti-Biotin
DNOX
DNOX
d
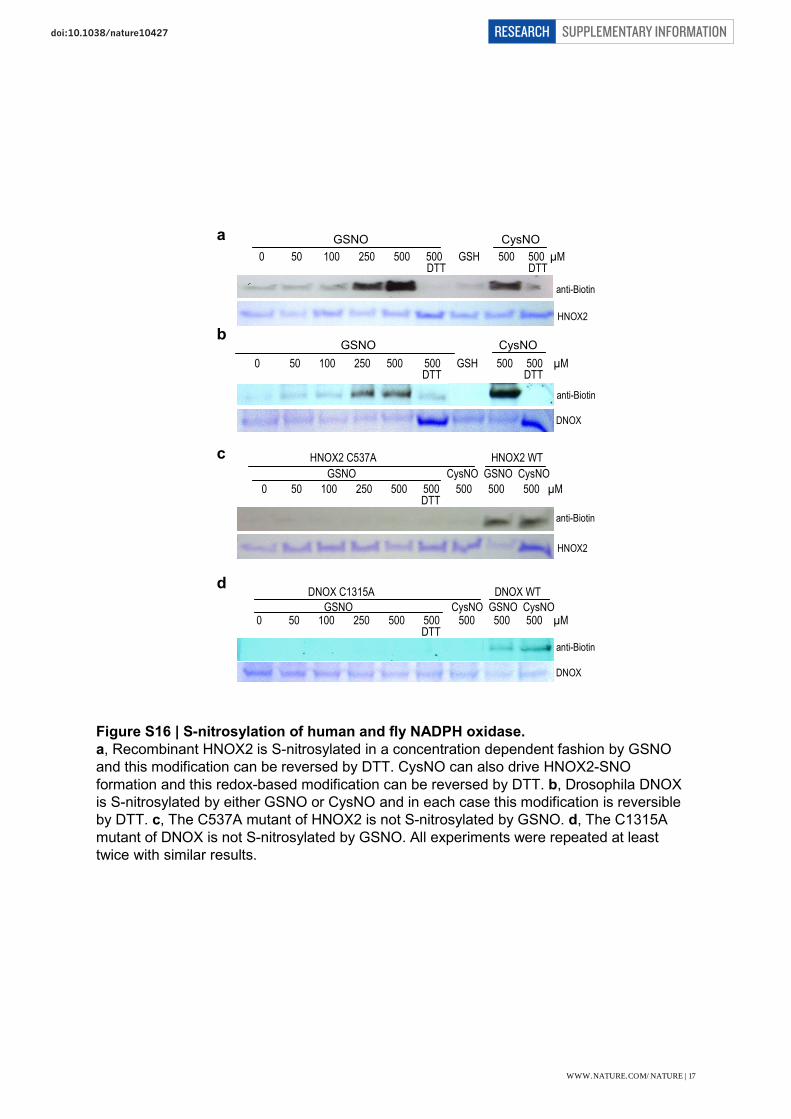
Figure S16 | S-nitrosylation of human and fly NADPH oxidase.
a, Recombinant HNOX2 is S-nitrosylated in a concentration dependent fashion by GSNO
and this modification can be reversed by DTT. CysNO can also drive HNOX2-SNO
formation and this redox-based modification can be reversed by DTT. b, Drosophila DNOX
is S-nitrosylated by either GSNO or CysNO and in each case this modification is reversible
by DTT. c, The C537A mutant of HNOX2 is not S-nitrosylated by GSNO. d, The C1315A
mutant of DNOX is not S-nitrosylated by GSNO. All experiments were repeated at least
twice with similar results.
SUPPLEMENTARY INFORMATIONRESEARCHdoi:10.1038/nature10427
WWW.NATURE.COM/NATURE | 17
FDR HNOX2 AtRBOH Da
b
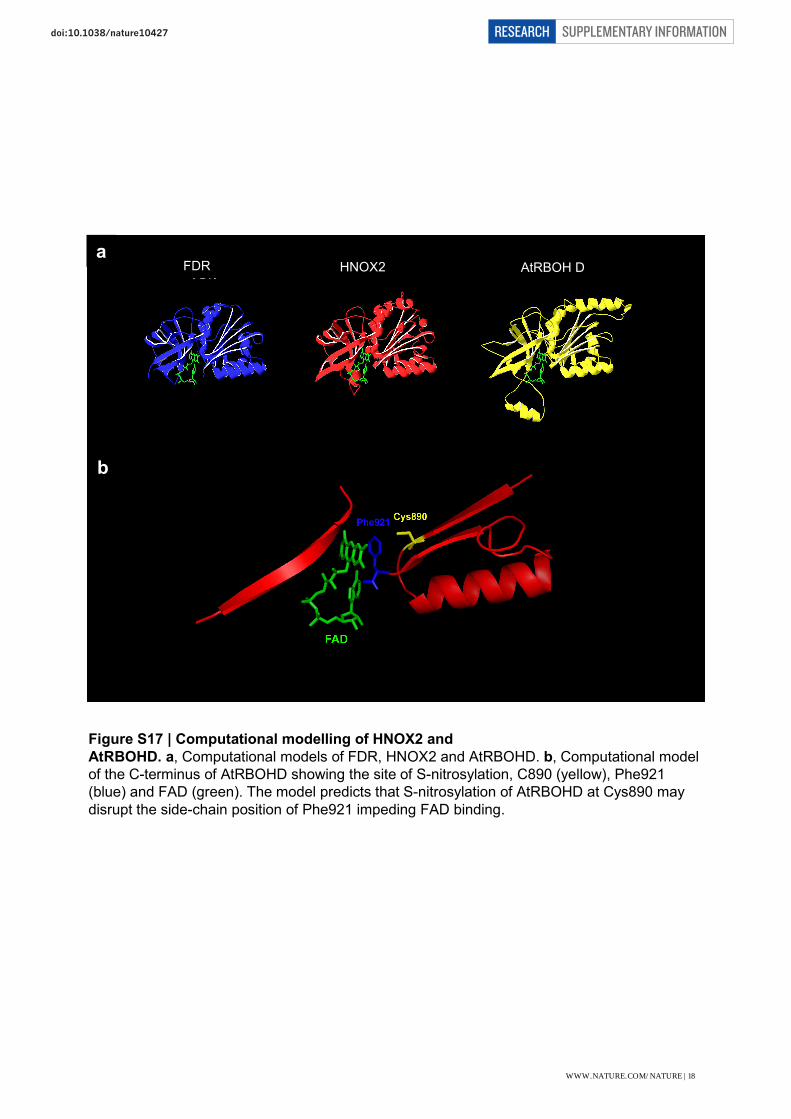
Figure S17 | Computational modelling of HNOX2 and
AtRBOHD. a, Computational models of FDR, HNOX2 and AtRBOHD. b, Computational model
of the C-terminus of AtRBOHD showing the site of S-nitrosylation, C890 (yellow), Phe921
(blue) and FAD (green). The model predicts that S-nitrosylation of AtRBOHD at Cys890 may
disrupt the side-chain position of Phe921 impeding FAD binding.
SUPPLEMENTARY INFORMATIONRESEARCHdoi:10.1038/nature10427
WWW.NATURE.COM/NATURE | 18
a
b
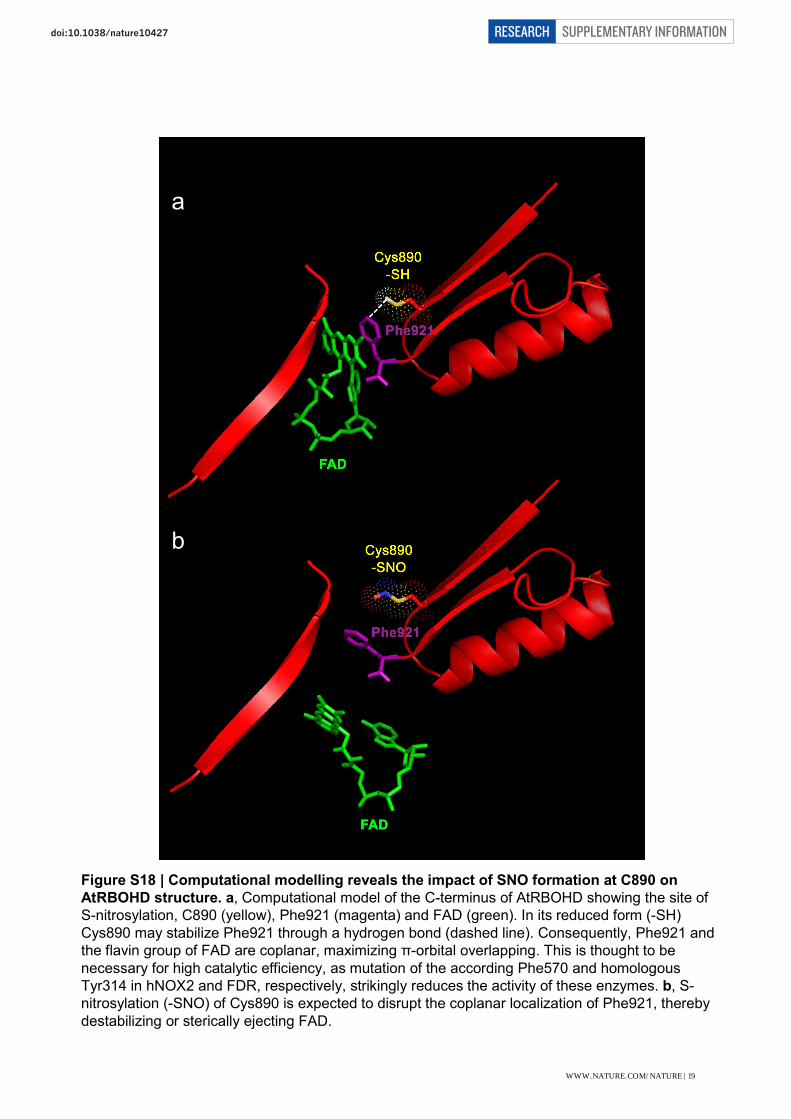
Figure S18 | Computational modelling reveals the impact of SNO formation at C890 on
AtRBOHD structure. a, Computational model of the C-terminus of AtRBOHD showing the site of
S-nitrosylation, C890 (yellow), Phe921 (magenta) and FAD (green). In its reduced form (-SH)
Cys890 may stabilize Phe921 through a hydrogen bond (dashed line). Consequently, Phe921 and
the flavin group of FAD are coplanar, maximizing π-orbital overlapping. This is thought to be
necessary for high catalytic efficiency, as mutation of the according Phe570 and homologous
Tyr314 in hNOX2 and FDR, respectively, strikingly reduces the activity of these enzymes. b, S-
nitrosylation (-SNO) of Cys890 is expected to disrupt the coplanar localization of Phe921, thereby
destabilizing or sterically ejecting FAD.
SUPPLEMENTARY INFORMATIONRESEARCHdoi:10.1038/nature10427
WWW.NATURE.COM/NATURE | 19
NA
DP
H o
xid
as
e a
cti
vit
y
(∆O
D/m
g p
rote
in)
0
5
10
15
20
25
30
0 2 4 6 8 10
Time post inoculation (h)
a
b
c
0
20
40
60
80
100
120
Ele
ctr
oly
te l
ea
kag
e (
µs
/cm
)
0 2 4 6 8 10
Time post inoculation (h)
WT
C890A
0 2 4 6 8 10
Time post inoculation (h)
0
20
40
60
80
100
120
140
160
180
200
SN
O c
on
ten
t (p
mo
le/m
g p
rote
in)
WT
C890A
WT
C890A
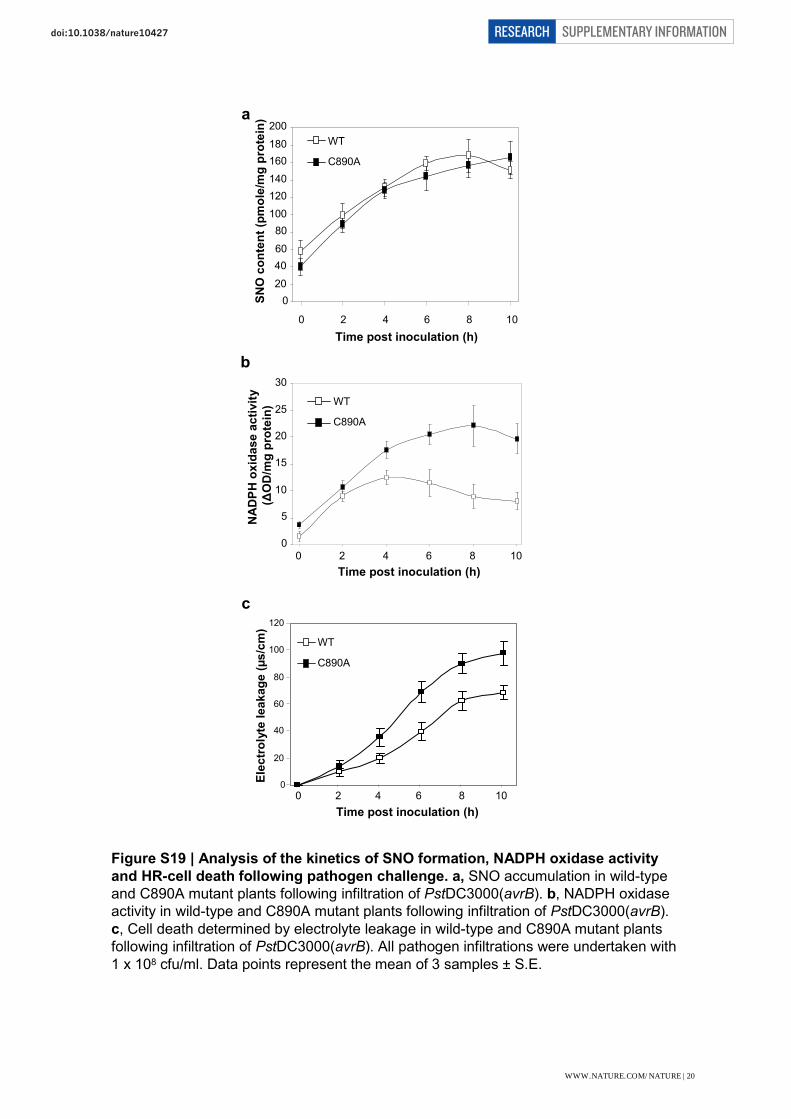
Figure S19 | Analysis of the kinetics of SNO formation, NADPH oxidase activity
and HR-cell death following pathogen challenge. a, SNO accumulation in wild-type
and C890A mutant plants following infiltration of PstDC3000(avrB). b, NADPH oxidase
activity in wild-type and C890A mutant plants following infiltration of PstDC3000(avrB).
c, Cell death determined by electrolyte leakage in wild-type and C890A mutant plants
following infiltration of PstDC3000(avrB). All pathogen infiltrations were undertaken with
1 x 10⁸ cfu/ml. Data points represent the mean of 3 samples ± S.E.
SUPPLEMENTARY INFORMATIONRESEARCHdoi:10.1038/nature10427
WWW.NATURE.COM/NATURE | 20
R/avr
[SA ↑]
[SNOs ↑]HR
Cell Death
[ROIs ↑]
AtRBOHD
Cys890
AtRBOHD
Cys890
SH
SNO
- +SNO SNO
AtGSNOR1
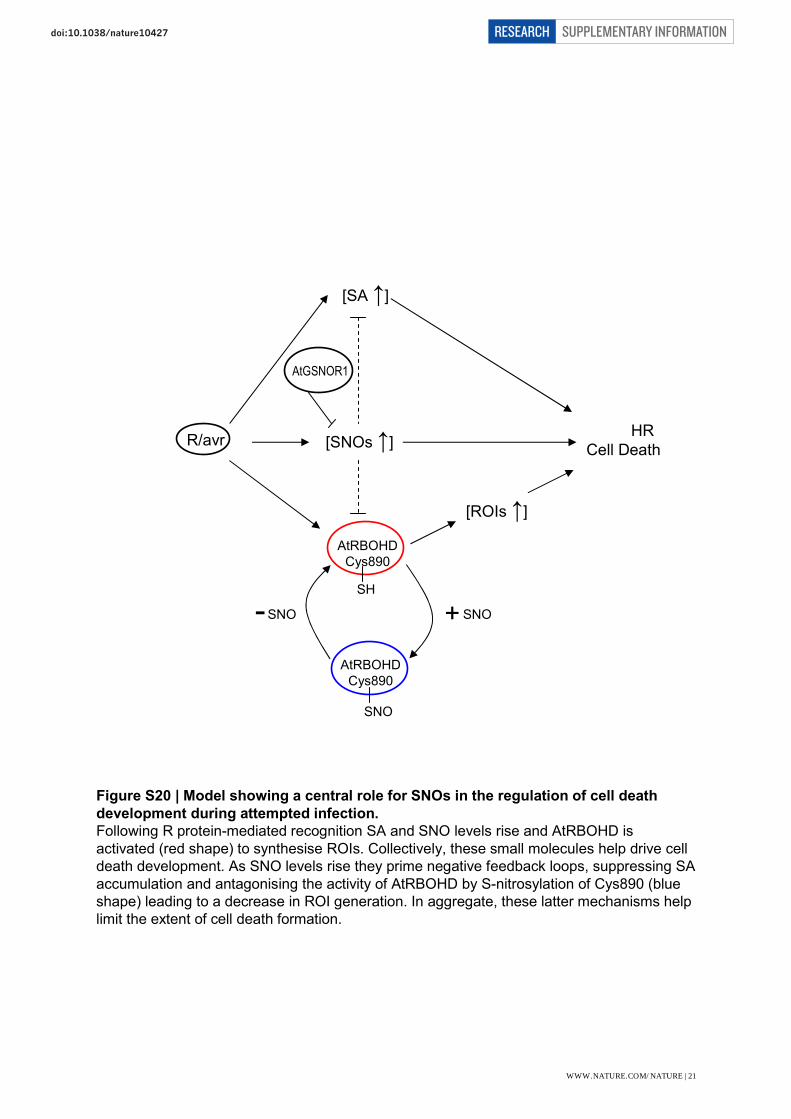
Figure S20 | Model showing a central role for SNOs in the regulation of cell death
development during attempted infection.
Following R protein-mediated recognition SA and SNO levels rise and AtRBOHD is
activated (red shape) to synthesise ROIs. Collectively, these small molecules help drive cell
death development. As SNO levels rise they prime negative feedback loops, suppressing SA
accumulation and antagonising the activity of AtRBOHD by S-nitrosylation of Cys890 (blue
shape) leading to a decrease in ROI generation. In aggregate, these latter mechanisms help
limit the extent of cell death formation.
SUPPLEMENTARY INFORMATIONRESEARCHdoi:10.1038/nature10427
WWW.NATURE.COM/NATURE | 21


![[MS-PST]: Outlook Personal Folders (.pst) File Format · [MS-PST]: Outlook Personal Folders (.pst) File Format Intellectual Property Rights Notice for Open Specifications Documentation](https://img.pdfslide.net/doc/110x75/5e8f5f3d7d0a0a79de358e44/ms-pst-outlook-personal-folders-pst-file-format-ms-pst-outlook-personal.jpg)