Embed Size (px)
Citation preview
www.sciencemag.org/content/356/6343/1188/suppl/DC1
Supplementary Materials for
Transcriptional activation of RagD GTPase controls mTORC1 and promotes cancer growth
Chiara Di Malta, Diletta Siciliano, Alessia Calcagni, Jlenia Monfregola, Simona Punzi, Nunzia Pastore, Andrea N. Eastes, Oliver Davis, Rossella De Cegli,
Angela Zampelli, Luca G. Di Giovannantonio, Edoardo Nusco, Nick Platt, Alessandro Guida, Margret Helga Ogmundsdottir, Luisa Lanfrancone,
Rushika M. Perera, Roberto Zoncu, Pier Giuseppe Pelicci, Carmine Settembre, Andrea Ballabio*
*Corresponding author. Email: [email protected]
Published 16 June 2017, Science 356, 1188 (2017) DOI: 10.1126/science.aag2553
This PDF file includes:
Materials and Methods Figs. S1 to S10 Tables S1 and S2 References
Materials and Methods Materials Reagents were obtained from the following sources: antibodies to human TFEB, phospho-‐T389 S6K1, S6K1, phospho-‐(Ser240/244) S6, S6, phospho-‐Ser757 ULK1, ULK1, phospho-‐(Ser 65) 4E-‐BP1, 4E-‐BP1, mTOR, RagA, RagB, RagC, RagD, FLCN, RAPTOR, ATG5, ATG7 and Histone H3 from Cell Signaling Technology; antibody to LAMP2 from Abcam; antibodies to TFE3 and Actin from Sigma Aldrich; antibody to murine TFEB from Bethyl laboratories; antibody to HA from Covance, antibody to LC3 from Novus Biologicals; antibody to P62 from Abnova; antibody to VAP-‐A was gently donated from De Matteis’ laboratory. MEM, DMEM, McCoy’s, RPMI, Fetal Bovine Serum (FBS) and Donkey Serum (DS) were from Euroclone; dialyzed FBS, Alexa 488 and 568-‐conjugated secondary antibodies, lipofectamine LTX and lipofectamine RNAimax were from Invitrogen; siRNAs were purchased as SMART pool from Dharmacon; torin 1, amino acids, MNase, polybrene, antibody to TFE3, ANTI-‐FLAG BioM2 were from Sigma Aldrich; puromycin was from Calbiochem; FuGENE 6, Complete Protease Cocktail and phosphatase inhibitors (Phos Stop tablets) were from Roche; NeutrAvidin Agarose resin, SDS-‐OUT and D-‐biotin were from Pierce; amino acid-‐free RPMI from DBA; Mini-‐PROTEAN TGX Gels were from Biorad. Cell culture and transfection HeLa, HEK293T, HEPG2, U2OS, HK-‐2 cells were purchased from ATCC. Atg5-‐/-‐, Atg7-‐/-‐ and WT MEFs cells were gently donated from Dr Maurizio Molinari. HPDE, PSN1, 8988T, KP4, SW1990 and YAPC cells were previously described (22). The 501Mel cells were a kind gift from Ruth Halaban (26), and the A375P were from Colin Goding (27). HCR-‐59 cells were gently provided by Dr Malouf (24). Cells were cultured in the following media: HeLa in MEM; HEK293T and MEFs cells in DMEM high glucose; A375P, 501Mel and HEPG2 in RPMI; U2OS in McCoy’s; HK-‐2 in DMEM-‐F12 supplemented with 1% ITS; HCR-‐59 in RPMI supplemented with MEM non-‐essential amino acids (1X), 1% ITS, Hydrocortisone 0,04ng/ml and EGF 0,01 ug/ml. All media were supplemented with 10% FBS. Primary kidney cells were obtained following the protocol described in Calcagni et al (23) and cultured in DMEM-‐F12 culture medium supplemented with 10% FCS, 1% ITS and 1% S1 hormone mixture. Plasmids were transfected with lipofectamine LTX and siRNA with lipofectamine RNAimax using a reverse transfection protocols and plated in 12 or 6-‐well dishes. After 48h of transfection with plasmids, cells were collected for RNA or protein analysis. Cells transfected with siRNAs (20nM) were collected after 72h since transfection.
Western blotting Cells were lysed with ice-‐cold lysis buffer (TrisHcl 10mM pH 8.0-‐SDS 0.2% supplemented with protease and phosphatase inhibitors). Total lysate was briefly sonicated. Liver tissues were solubilized in homogenization buffer (25mM Tris-‐HCl pH 7.4, 10mM EDTA, 10mM EGTA, 1% NP40 supplemented with protease and phosphatase inhibitors). The soluble fractions from tissue lysates were isolated by centrifugation at 13,000 rpm for 10 minutes in a microfuge. From 10 to 30 micrograms of proteins were loaded on 10% or 4-‐15% Mini-‐PROTEAN TGX Gels transferred to PVDF membranes and analyzed by western blot using the ECL method (Pierce). Protein levels were quantified by using ImageJ software analysis. Amino acid starvation/stimulation Cells were rinsed with PBS and incubated in amino acid-‐free RPMI supplemented with 10% dialyzed FBS for 50 min, and then left untreated (0) or stimulated with increasing dosage of a mix of essential and non-‐essential amino acids or with leucine or arginine only for 15 min. Organelle/cytosol fractionation TFEB-‐CA HeLa cells were plated on 15cm plates and left untreated or treated with doxycycline. After 48h, they were rinsed with PBS and incubated in amino acid-‐free RPMI supplemented with 10% dialyzed FBS for 50 min, and then stimulated with a 3X amino acid mixture for 10min. Then, cells were rinsed with PBS and lysed using 10ml/dish of fractionation buffer (FB) (140mM KCl, 250mM Sucrose, 1mM DTT, 2mM EGTA, 2.5mM MgCl2, 25mM HEPES, pH 7.4) supplemented with 5mM glucose, protease inhibitor and 2.5mM ATP. After a brief centrifugation at 1700rpm for 10 minutes, pellet was resuspended in 750ul of FB and lysed by 23G needle; subsequently 750ul more of FB was added to the lysed and then it was centrifuged 10 min at 2700rpm in the 4C centrifuge. Post-‐nuclear supernatant (PNS) was transferred to a clean tube and centrifuged at 100K x g for 20min. The supernatant was the organelle-‐free cytosolic fraction. The pellet (organelles) was washed twice in buffer and eluted in SDS sample buffer. Equal fractions of pellets and supernatants were run on 4-‐15% Mini-‐PROTEAN TGX Gels for direct comparison. Molecular biology TFEB-‐WT and TFEB-‐CA TET-‐ON lentiviral plasmids were from Dr Nick Platt; they carry the cDNAs for TFEB-‐WT or TFEB-‐S142A, S211A (TFEB-‐CA) 3X-‐FLAG tagged and cloned into KpnI and NotI sites of pLVX-‐Tight-‐Puro vector (Clontech). EGFP-‐TFE3 plasmid was acquired from Addgene and used as template to amplify TFE3 cDNA;
this was subcloned into KpnI and NotI sites of pLVX-‐Tight-‐Puro vector. The cDNA for TFE3 was mutagenized to convert the two serins 246 and 321 in alanines using the QuickChange XLII mutagenesis kit (Stratagene). Lentiviral plasmids for TFEB and TFE3 were co-‐transfected with Delta VPR envelope and CMV VSV-‐G packaging plasmids into actively growing HEK-‐293T cells using FuGENE 6 transfection reagent. Virus-‐containing supernatants were collected 48h after transfection, diluted 1:2 and used to infect a 100mm dish (50% confluent) of HeLa Tet-‐ON cells (Clontech) in presence of polybrene (4ug/ml). 24 hours later, cells were selected with puromycin and analyzed 7 days after infection. Stable HeLa TFEB-‐CA and TFE3-‐CA were treated, where indicated, with doxycycline (1ug/ml) for 48 hours. Retroviral plasmids encoding TFEB-‐3X-‐FLAG or GFP (as control) were previously described (10). They were co-‐transfected with pCMV-‐gag/pol and CMV VSV-‐G packaging plasmids into actively growing HEK-‐293T cells using FuGENE 6 transfection reagent. Virus-‐containing supernatants were collected 48h after transfection, diluted 1:2 and used to infect one six-‐well plate of MEFs in presence of 8ug/ml polybrene; then the plate was centrifuged at 2300 rpm RT for 90 min (spin infection). Cells were analyzed 3 days after infection. The plasmid encoding human TFEB was previously described (6); the plasmids for HAGST-‐RagA and HAGST-‐RagD and LAMP1-‐GFP were purchased from Addgene. Luciferase assay The promoter region for RagD spanning from CLEAR 3 to CLEAR5 was amplified by PCR from HeLa genome and subcloned into pGL3-‐basic luciferase reporter plasmid. Consensus sequences for the three CLEARs were mutagenized by using the QuickChange XLII mutagenesis kit. Plasmids were co-‐transfected together with increasing amount of TFEB plasmid and luciferase assays were performed 48 h after transfection using Dual Luciferase Reporter Assay System (Promega) and normalized for transfection efficiency by cotransfected Renilla luciferase. Chromatin Immunoprecipitation assay (ChIP). HeLa TET-‐ON TFEB-‐CA cells were treated with doxycycline for 48h or left untreated (control) and then crosslinked in 1% formaldehyde for 10 min and lysed on ice for 20 min in ChIP-‐Lysis buffer (50 mM Tris–HCl, pH 7.5, 100 mM NaCl, 1% Triton X-‐100, 1% Tween-‐20). After a 13 min MNAse digestion (2 U, Sigma-‐Aldrich) at 37°C, the reaction was stopped by addition of sodium dodecyl sulfate (SDS) and ethylenediaminetetraacetic acid (EDTA) to a final concentration of 1% and 2 mM, respectively. The unbound SDS of the cleared lysate was precipitated using SDS-‐OUT (Pierce, Rockford, IL, USA) to avoid compromising the immunoprecipitation. The lysates were diluted 1:1 with ChIPdilution buffer (50 mM Tris–HCl, pH 7.5, 100 mM NaCl, 0.5% Triton X-‐100, 2 mM EDTA; all from Sigma-‐Aldrich) and preincubated with high capacity NeutrAvidin Agarose (Pierce). Protein-‐DNA complexes were immunoprecipitated for 4 h at 4°C with biotinylated FLAG antibody coupled to
Neutravidin beads (2 mg ANTI-‐FLAG BioM2 from Sigma-‐Aldrich antibody with 50 ml Agarose slurry in ChIP-‐dilution buffer supplemented with 10 mg/ml BSA per sample). After three washings, the DNA was eluted by addition of 8 mM biotin, 1% SDS in TE buffer. The DNA was precipitated after crosslink reversal using 200 mM NaCl at 65°C, overnight. One μl of DNA was used for each quantitative rtPCR reaction. RNA extraction, reverse transcription and quantitative PCR RNA samples from cells were obtained using the RNeasy kit (Qiagen) according to the manufacturer’s instructions. RNA samples from mouse livers were extracted using TRIzol (Invitrogen) and re-‐purified with a RNeasy columns. cDNA was synthesized using QuantiTect Reverse Transcription kit (Qiagen). Real-‐time quantitative RT-‐PCR on cDNAs was carried out with the LightCycler 480 SYBR Green I mix (Roche) using the Light Cycler 480 II detection system (Roche) with the following conditions: 95°C, 5 min; (95°C, 10 s; 60°C, 10 s; 72°C, 15 s) x 40. Fold change values were calculated using the DDCt method. Briefly, internal controls (HPRT1 or B2M for cell samples and Cyclophilin or S16 for mouse samples) were used as ‘normalizer’ genes to calculate the DCt value. Next, the DDCt value was calculated between the ‘control’ group and the ‘experimental’ group. Lastly, the fold change was calculated using 2(-‐DDCt). Biological replicates were grouped in the calculation of the fold change values. Immunofluorescence assays For detection of TFEB or TFE3, HeLa stable clones were grown on Lab-‐Tek chamber slides and treated with doxycycline for 48h. Cells were rinsed with PBS once and then: fixed for 15 min with 4% paraformaldehyde in PBS at RT, rinsed twice with PBS and then permeabilized with 0.2% Triton-‐X100 in PBS for 30min, and then incubated with blocking buffer (0.1% Triton-‐X100 plus 10% donkey serum in PBS) for 1h. Subsequently, Coverslips were incubated with TFEB antibody (1:200) or TFE3 (1:500) in 0.1% Triton-‐X100 plus 5% donkey serum/PBS for 2h at RT, then rinsed three times with PBS and incubated with Alexa-‐Fluor conjugated secondary antibodies (Invitrogen) produced in donkey (diluted 1:700 in 0.1% Triton-‐X100 plus 5% donkey serum/PBS) for 1h at room temperature in the dark, washed four times with PBS. Slides were mounted on glass coverslips using Vectashield (Vector Laboratories) and imaged on a Leica SPE confocal microscope. For detection of mTOR lysosomal localization: HeLa TFEB-‐CA cells were left untreated or treated with doxycycline for 48h; HeLa cells were transfected with scramble si-‐RNA or with siRNA for TFEB and then re-‐transfected with control plasmid and LAMP1-‐GFP plasmid , or with HAGSTRagD and LAMP1-‐GFP plasmid. Cells were grown on Lab-‐Tek chamber slides and the day of experiment they were rinsed with PBS and incubated in amino acid-‐free RPMI supplemented with 10% dialyzed FBS for 50 min, and then left untreated or stimulated with a 3X amino acid
mixture for 10min. Then, slides were rinsed with PBS once and fixed for 15 min with 4% paraformaldehyde in PBS at RT. After fixation, slides were rinsed twice with PBS and cells were permeabilized with Saponine 0.1% in PBS for 10min. After rinsing twice with PBS, the slides were incubated with primary antibody (mTOR and LAMP2, both 1:200) in 5% normal donkey serum for 1 hr at room temperature, rinsed four times with PBS, and incubated with secondary antibodies produced in donkey (diluted 1:700 in 5% normal donkey serum) for 45 min at room temperature in the dark, washed four times with PBS. Slides were mounted on glass coverslips using Vectashield (Vector Laboratories) and imaged on LSM 710 confocal microscope. Co-‐localization analysis was performed using ZEN 2008 software and it is expressed as colocalization coefficient. For detection of LC3 on the lysosome, cells were fixed with 100% methanol and then processed as described above. Analysis was performed using ZEN 2008 software and it is expressed as LC3 Mean Intensity versus LAMP2 Mean Intensity in the co-‐localization region. Cell proliferation For MTT assay 5mg of MTT powder was solubilized in 1mL of PBS and filtered. 10μL of this solution was added to 100μl of cell culture medium without phenol red. At the end of the incubation time, cells were washed twice with PBS and incubated with MTT-‐media solution to form formazan crystals. After four hours, media was removed and 100μl/well of a solubilization solution was added to the cells (2.1mL HCl 10N, 500mL isopropanol) for four hours at 37°C to obtain a complete solubilization of the crystals. As readout, absorbance of the 96-‐well plate was measured recording the Optical Density (OD) at 570nm with a microplate spectrophotometer system. Generation of RagD-‐promoter mutant HeLa cell line HeLa (ATCC CCL-‐2) cells carrying a homozygous deletion of the CLEAR-‐binding sequence in the promoter of the RagD gene were generated by using the CRISPR/Cas9 system. We selected the DNA region with the protospacer adjacent motif (PAM) sites within the CLEAR-‐box sequence GACCACGTGAA (-‐284) of the RagD promoter. The gRNA sequence (CTGTGCGGGGACCACGTGA) with low off-‐target score has been selected using the http://crispr.mit.edu/ tool. An “ALL in One” vector expressing Cas9, the specific gRNA and GFP was obtained from SIGMA (CAS9GFPP). The CAS9GFPP was nucleofected in HeLa cells using the Amaxa (Cat No VCA-‐1003) and transfected GFP-‐positive cells were FACS sorted into 96 well plates to obtain single-‐cell derived colonies carrying the INDEL mutations. Upon genomic DNA extraction and DNA Sanger sequencing, a cell clone carrying a 33bps deletion (-‐266_299del TGCGGGGACCACGTGAAGGAGAGGCGCGTGGGG) was selected and expanded.
Mouse models All mice used were males and maintained in a C57BL/6 strain background. Mouse lines for conditional Tcfeb-‐flox and Tfe3-‐knockout were previously described (10, 28); Albumin-‐Cre mice were obtained from the Jackson laboratory. The mouse line overexpressing Tcfeb in the kidney only was recently reported (23). The HDAd-‐TFEB virus was described previously (29). To generate the HDAd-‐TFE3 virus we amplified hTFE3 cDNA and we cloned it into pdelta21 vector and produced viral vector as done for HDAd-‐TFEB virus. Hepatic transduction was achieved by intravenous administration (retro-‐orbital) of 2x10¹³ viral particles/kg. Mice were analyzed one month after infection. The RagD-‐AAV vector was produced by the TIGEM AAV Vector Core Facility. Briefly, the human HA-‐GST-‐RagD coding sequence was cloned into the pAAV2.1-‐CMV-‐GFP plasmid by replacing the GFP sequence. The resulting pAAV2.1-‐CMV-‐HA-‐GST-‐RagD was then triple transfected in sub-‐confluent 293 cells along with the pAd-‐Helper and the pack 2/9 packaging plasmids. The recombinant AAV2/9 vectors were purified by two rounds of CsCl. Vector titers, expressed as genome copies (GC/mL), were assessed by both PCR quantification using TaqMan (Perkin-‐Elmer, Life and Analytical Sciences, Waltham, MA) and by dot blot analysis. As control virus, GFP-‐AAV vectors were used. Each mouse was retro-‐orbital injected with 1.25 x10¹¹ viral particle and sacrificed after 3 weeks. Experiments of synchronization/fasting of mice were performed as previously reported (30); 30 minutes before to be sacrificed, mice were injected intraperitoneally (IP) with puromycin (21,8mg/kg of mouse in 20 mM HEPES buffer pH 7.4). For exercise experiment, mice were let run for 1h at 25cm/sec on a treadmill, for one week. On the last day of training, mice received oral gavage administration of leucine (1,35g/kg of mouse in H2O); 30 minutes later they were injected IP with puromycin and after 30 minutes sacrificed for the analysis. Experiments were conducted in accordance with the guidelines of the Animal Care and Use Committee of Cardarelli Hospital in Naples and authorized by the Italian Ministry of Health. Histology Livers were dissected, post-‐fixed with buffered 4% paraformaldehyde overnight at 4°C, then they were dehydrated in a graded series of ethanol, cleared with xylene, and infiltrated with paraffin. Paraffin-‐embedded blocks were cut on a microtome in 6-‐μm sections. Immunohistochemistry was performed using the Vectastain ABC kit (Vector Labs) following the manufacturer’s instructions. Signal was developed using 0.05% 3,3-‐diaminobenzidine tetrahydrochloride in 0.02% H2O2. Xenograft experiments Lentiviral particles (shLuc or shRagD) obtained from 293T transfection were added to 501Mel cells together with 4 μg/mL polybrene (Sigma) for 16 hours. After 48

hours, medium was replaced and 2μg/mL of puromycin was added for 72 hours before performing the experiment. 500,000 cells were resuspended in a 3:1 mix of cell medium and Matrigel Matrix (Corning 354248) and injected into the subcutaneous abdominal space of NOD.Cg-‐Prkdcscid Il2rgtm1Wjl/SzJ mice (NSG) mice. Tumor formation was monitored weekly. Mice were sacrificed when tumors of the control group (shLuc) reached the volume of ∼ 0.5 cm3. In vivo data are presented as mean ± s.d. (standard deviation) from three independent experiments. NSG mice were purchased from Charles River. Mice of both sexes, 6-‐12 weeks old, were used for experimental procedures. In vivo studies were performed according to fully authorized animal facility, notification of the experiments to the Ministry of Health (as required by the Italian Law)(IACUCs Nº 758/2015) and in accordance to EU directive 2010/63. Statistics Student t test was used when comparing two groups; Anova was used when comparing more than two groups.
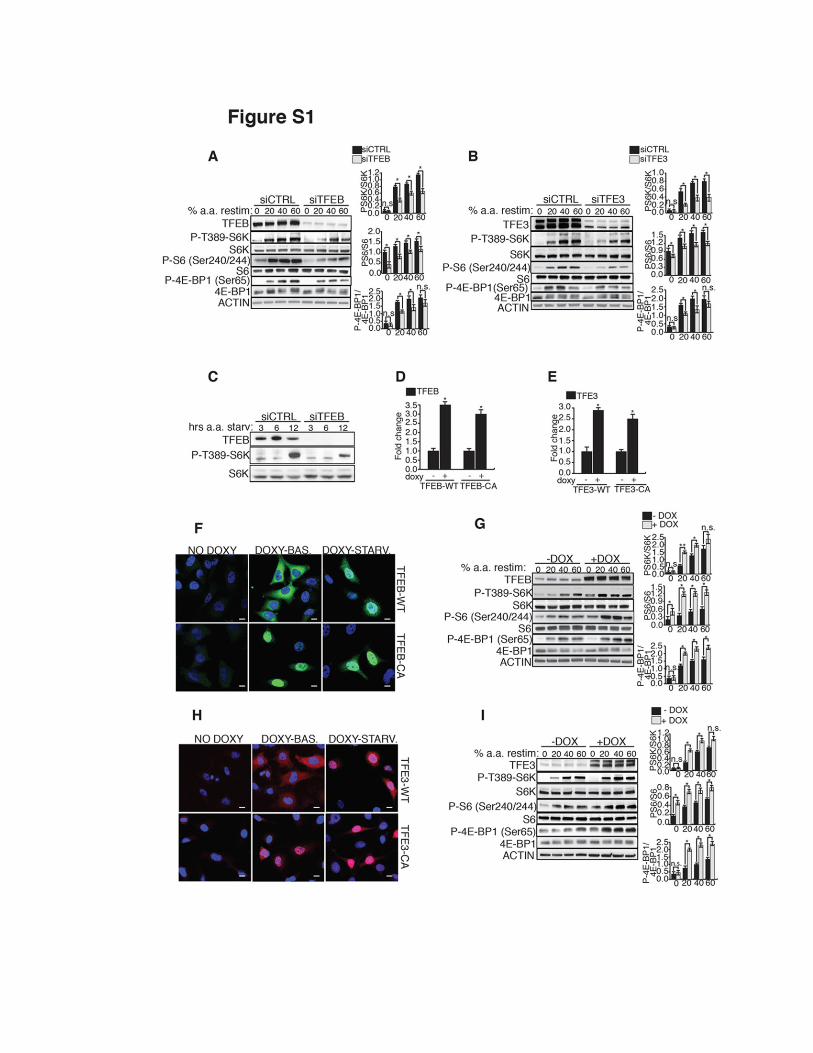
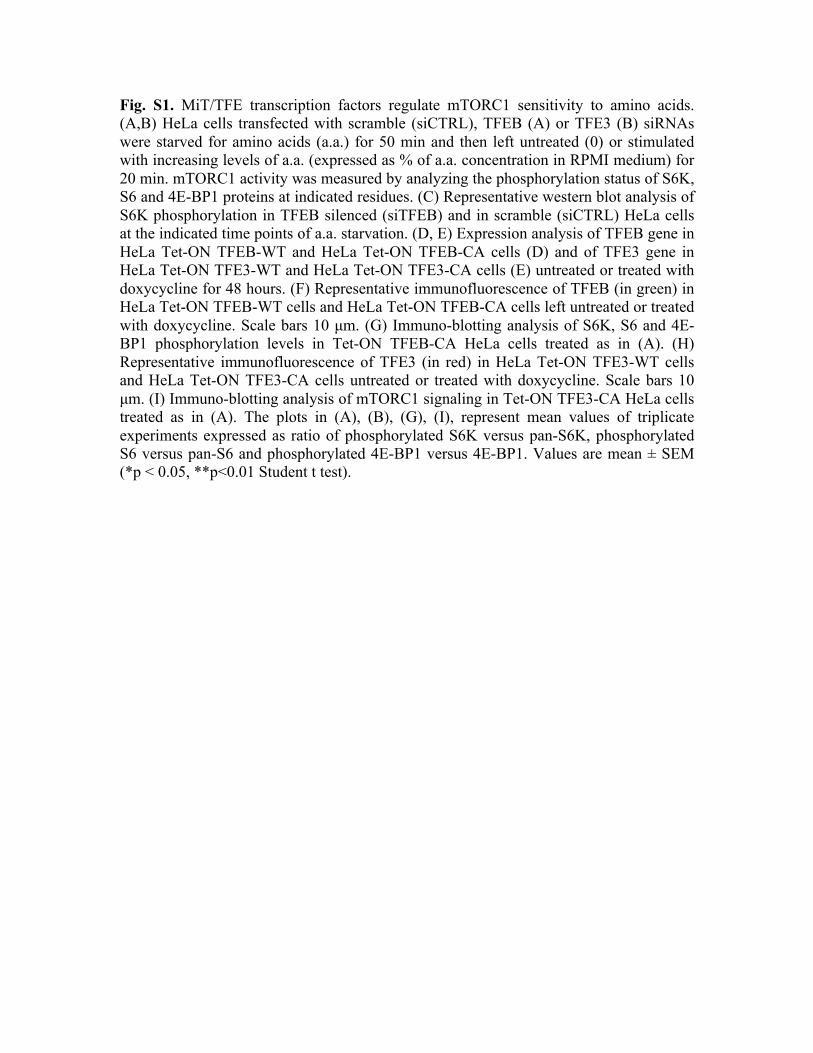
Fig. S1. MiT/TFE transcription factors regulate mTORC1 sensitivity to amino acids. (A,B) HeLa cells transfected with scramble (siCTRL), TFEB (A) or TFE3 (B) siRNAs were starved for amino acids (a.a.) for 50 min and then left untreated (0) or stimulated with increasing levels of a.a. (expressed as % of a.a. concentration in RPMI medium) for 20 min. mTORC1 activity was measured by analyzing the phosphorylation status of S6K, S6 and 4E-BP1 proteins at indicated residues. (C) Representative western blot analysis of S6K phosphorylation in TFEB silenced (siTFEB) and in scramble (siCTRL) HeLa cells at the indicated time points of a.a. starvation. (D, E) Expression analysis of TFEB gene in HeLa Tet-ON TFEB-WT and HeLa Tet-ON TFEB-CA cells (D) and of TFE3 gene in HeLa Tet-ON TFE3-WT and HeLa Tet-ON TFE3-CA cells (E) untreated or treated with doxycycline for 48 hours. (F) Representative immunofluorescence of TFEB (in green) in HeLa Tet-ON TFEB-WT cells and HeLa Tet-ON TFEB-CA cells left untreated or treated with doxycycline. Scale bars 10 µm. (G) Immuno-blotting analysis of S6K, S6 and 4E-BP1 phosphorylation levels in Tet-ON TFEB-CA HeLa cells treated as in (A). (H) Representative immunofluorescence of TFE3 (in red) in HeLa Tet-ON TFE3-WT cells and HeLa Tet-ON TFE3-CA cells untreated or treated with doxycycline. Scale bars 10 µm. (I) Immuno-blotting analysis of mTORC1 signaling in Tet-ON TFE3-CA HeLa cells treated as in (A). The plots in (A), (B), (G), (I), represent mean values of triplicate experiments expressed as ratio of phosphorylated S6K versus pan-S6K, phosphorylated S6 versus pan-S6 and phosphorylated 4E-BP1 versus 4E-BP1. Values are mean ± SEM (*p < 0.05, **p<0.01 Student t test).
Fig. S2 MiT/TFE transcription factors regulate mTORC1 activity in different cell lines. Immuno-blotting analysis of threonine 389-S6K phosphorylation in HEK293-T cells (A), HEPG2 cells (B), and U2OS cells (C) transfected with TFEB or with a control pCDNA plasmid vector. Cells were starved for amino acids (a.a.) for 50 min and then left untreated (0) or stimulated with increasing levels of a.a. for 20 min.
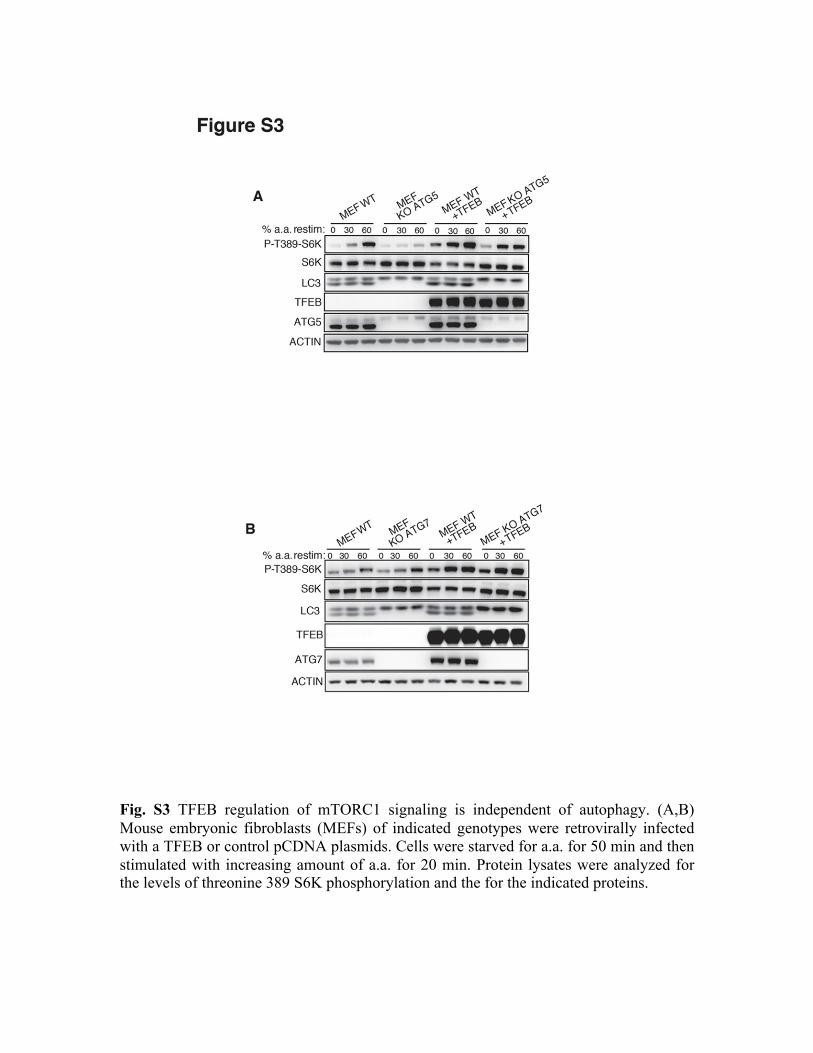
Fig. S3 TFEB regulation of mTORC1 signaling is independent of autophagy. (A,B) Mouse embryonic fibroblasts (MEFs) of indicated genotypes were retrovirally infected with a TFEB or control pCDNA plasmids. Cells were starved for a.a. for 50 min and then stimulated with increasing amount of a.a. for 20 min. Protein lysates were analyzed for the levels of threonine 389 S6K phosphorylation and the for the indicated proteins.

Fig. S4 RagD mediates MiT/TFE regulation of mTORC1 activity. (A-C) Expression analysis of mTORC1-related genes in HeLa cells depleted for TFEB (A), TFE3 (B), or both TFEB and TFE3 (C). B2M mRNA levels were measured as control gene. mRNA levels were normalized using HPRT1 and expressed as relative to cells transfected with scramble siRNA. Bar graphs represent mean ± SEM of 3 independent experiments (*p < 0.05, **p < 0.01, ***p<0.001, Student t test). (D) Expression analysis of RagD gene (and B2M as control gene) in HEK293-T, HEPG2 and U2OS cells transiently transfected with TFEB or TFE3-encoding plasmids. Bars refer to fold changes of mRNA levels in TFEB- or TFE3-transfected cells versus cells transfected with control pCDNA plasmid. Bar graphs represent mean ± SEM of 3 independent experiments (*p < 0.05, **p <0.01 Student t test). (E) Immuno-blotting analysis of the indicated proteins in cell lysates from HeLa Tet-ON TFEB-CA cells untreated (-DOXY) or treated with doxycycline (+DOXY). The plot represents average values of triplicates normalized to histone H3 (*p < 0.05, **p < 0.01 Student t test). (F) Immuno-blotting analysis of RagD protein in lysates from HEK293-T, HEPG2 and U2OS cells transfected with TFEB or TFE3 compared to PCDNA-transfected samples. (G) Transcript levels of RagD were analyzed in liver samples of C57BL6 mice injected with HDad-TFEB (Tfeb-inj) or HDad-TFE3 (Tfe3-inj) compared to control mice injected with PBS. (H) RagD mRNA levels in liver lysates isolated from Tcfeb flox/flox; Alb-CRE + (Tfeb-Li-KO) or TFE3 -/- (Tfe3 KO) mice relative to their controls. In (G), (H) Bars represent means ± SEM for n=5 mice for each group and are expressed as fold change compared with control mice normalized to cyclophilin gene expression (**=p < 0.01, ***p < 0.001 Student t test). S16 expression was shown as control unrelated gene.
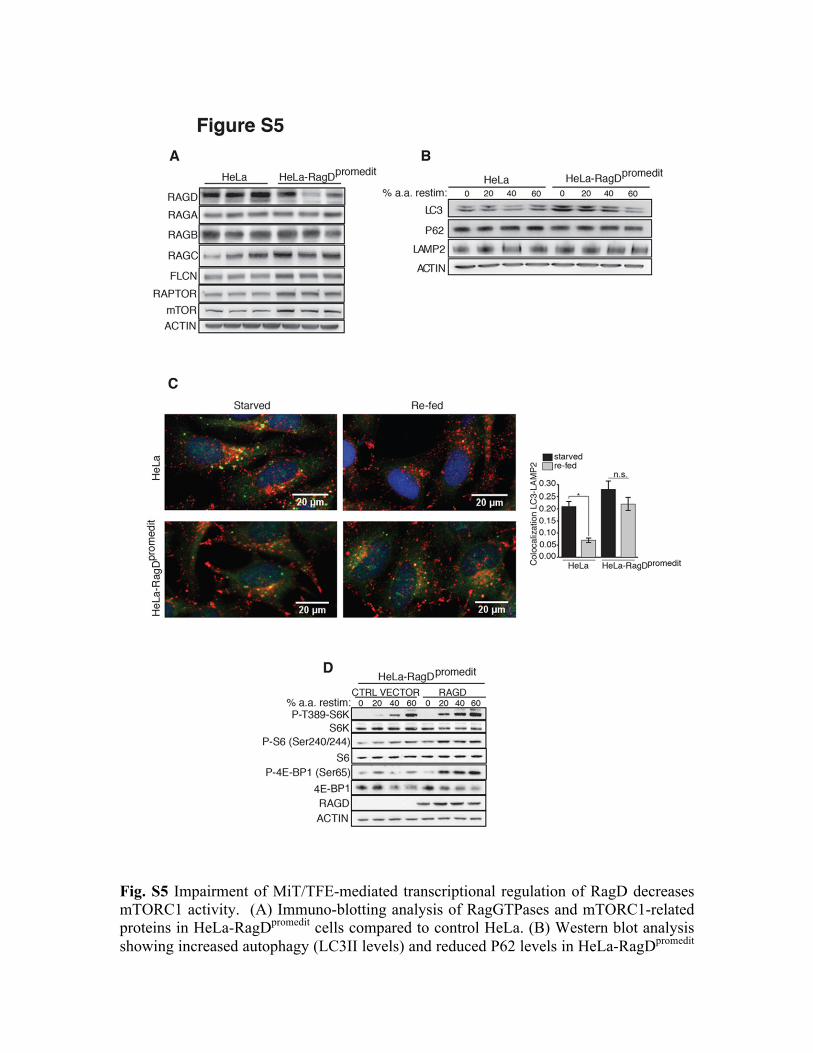
Fig. S5 Impairment of MiT/TFE-mediated transcriptional regulation of RagD decreases mTORC1 activity. (A) Immuno-blotting analysis of RagGTPases and mTORC1-related proteins in HeLa-RagDpromedit cells compared to control HeLa. (B) Western blot analysis showing increased autophagy (LC3II levels) and reduced P62 levels in HeLa-RagDpromedit

cells relative to control cells. Cells were starved for amino acids (a.a.) for 50 min and then left untreated (0) or stimulated with increasing levels of amino acids for 20 min. (C) Representative immunofluorescence images of LC3 (green) and LAMP2 (red) in HeLa-RagDpromedit and control HeLa cells starved or starved and then re-fed for 2 hour with nutrient rich media. The plot shows LC3-LAMP2 co-localization values. n= 20 cells/condition from three independent experiments (mean ± SEM, *p <0.05 Student t-test). Scale bars 20 µm. (D) Western blot analysis mTORC1 activity in HeLa-RagDpromedit
cells transfected with control vector or RagD plasmid. Cells were treated as in (B).
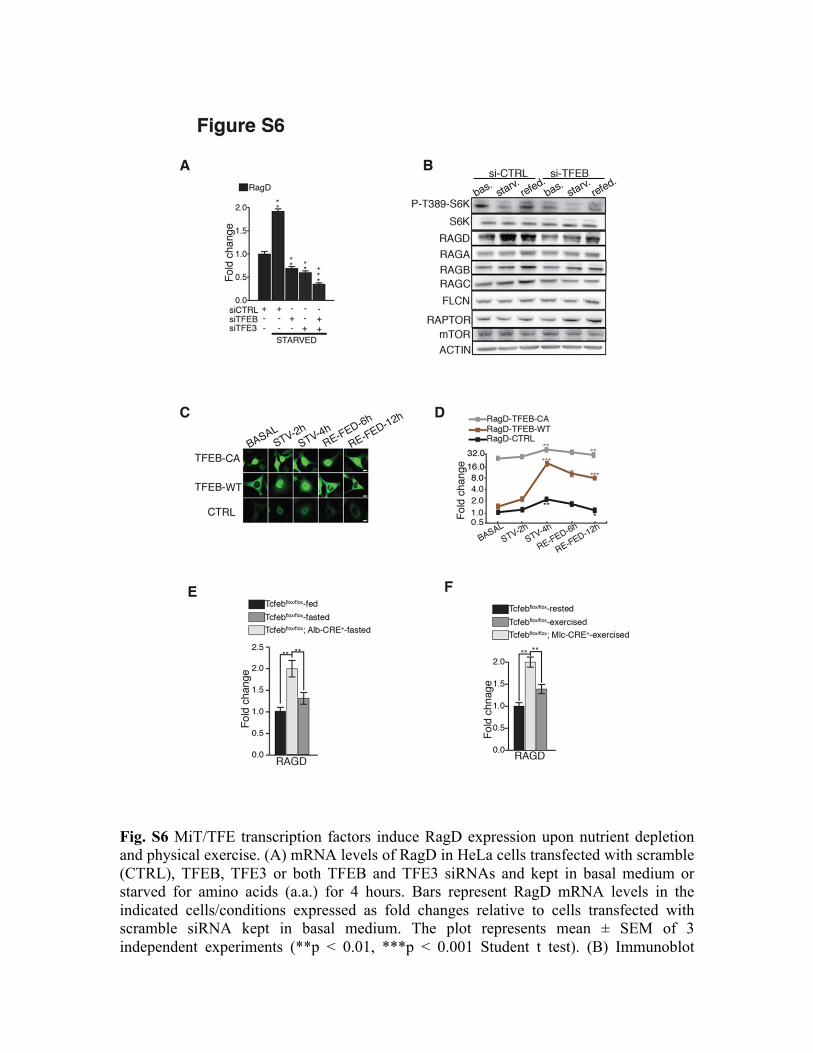
Fig. S6 MiT/TFE transcription factors induce RagD expression upon nutrient depletion and physical exercise. (A) mRNA levels of RagD in HeLa cells transfected with scramble (CTRL), TFEB, TFE3 or both TFEB and TFE3 siRNAs and kept in basal medium or starved for amino acids (a.a.) for 4 hours. Bars represent RagD mRNA levels in the indicated cells/conditions expressed as fold changes relative to cells transfected with scramble siRNA kept in basal medium. The plot represents mean ± SEM of 3 independent experiments (**p < 0.01, ***p < 0.001 Student t test). (B) Immunoblot
analysis of S6K phosphorylation and of mTORC1-related proteins in HeLa cells transfected with CTRL (scramble) or TFEB siRNA, kept in basal medium (bas.), starved for 4 hours (starv.) or starved and then refed (refed) for 6 hours. (C) Immunofluorescence analysis of TFEB localization in TFEB-CA, TFEB-WT and control (CTRL) HeLa cells kept in basal condition (basal), starved for amino acids for 2 and 4 hours (STV-2h, STV-4h), or starved for 4 hours and stimulated with complete medium for 6 (RE-FED-6h) and 12 hours (RE-FED-12h). Scale bars 10 µm. (D) mRNA levels of RagD in TFEB-CA (grey lines), TFEB-WT (brown lines) and in control (black lines) HeLa cells in response to nutrient starvation/stimulation at the indicated times. The plot represents mean ± SEM of 3 independent experiments. Values were normalized to HPRT1 and expressed as relative to basal conditions. (*p < 0.05, **p < 0.01, ***p < 0.001 Anova (two-way)). Scale bar is logarithmic. (E) Transcript levels of RagD in liver tissues isolated from mice with indicated genotypes fasted for 24hours. Values were normalized to cyclophilin gene and expressed as fold change relative to control fed mice. Bars represent means ± SEM (n=5 mice/ group; **=p < 0.01 Anova (one-way) followed by Tukey’s test). (F) mRNA levels of RagD in exercised mice with indicated genotypes. Values were normalized to cyclophilin gene. Bars represent means ± SEM for n=4 mice and are expressed as fold change relative to control rested mice (**=p < 0.01; Anova (one-way) followed by Tukey’s test).
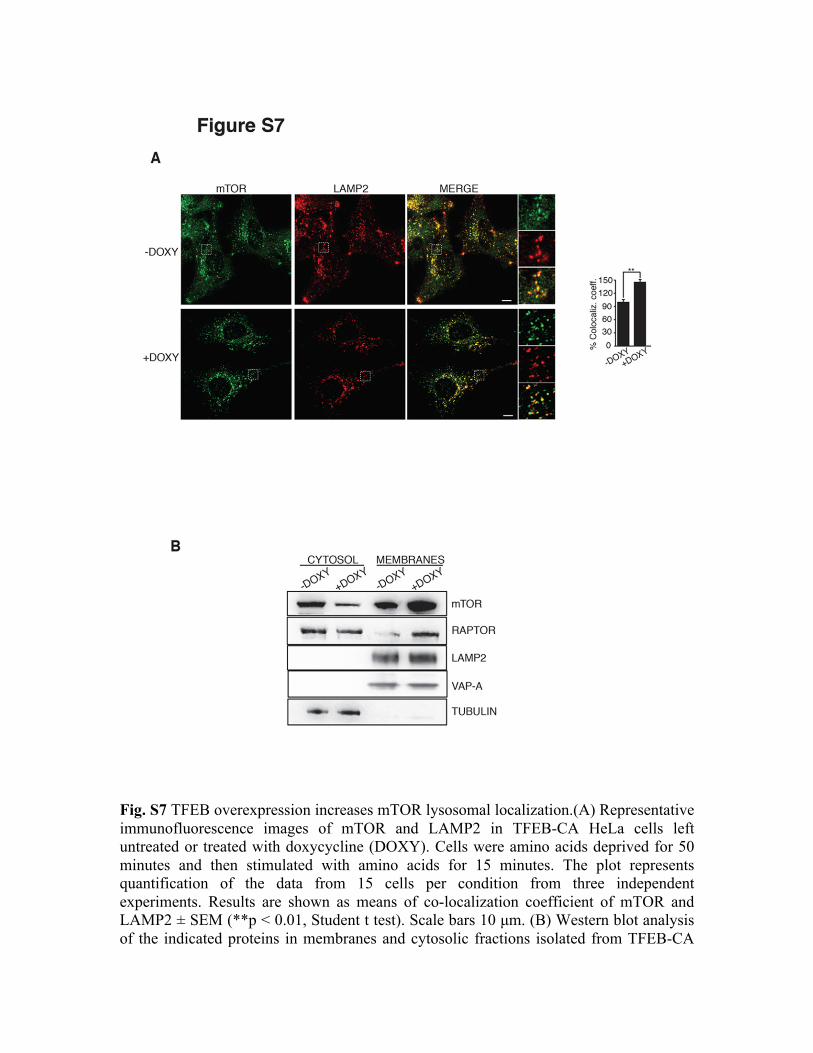
Fig. S7 TFEB overexpression increases mTOR lysosomal localization.(A) Representative immunofluorescence images of mTOR and LAMP2 in TFEB-CA HeLa cells left untreated or treated with doxycycline (DOXY). Cells were amino acids deprived for 50 minutes and then stimulated with amino acids for 15 minutes. The plot represents quantification of the data from 15 cells per condition from three independent experiments. Results are shown as means of co-localization coefficient of mTOR and LAMP2 ± SEM (**p < 0.01, Student t test). Scale bars 10 µm. (B) Western blot analysis of the indicated proteins in membranes and cytosolic fractions isolated from TFEB-CA

HeLa cells left untreated or treated with doxycycline. LAMP2 and VAP-A were used as loading control for membrane fractions, tubulin for cytosolic fractions.
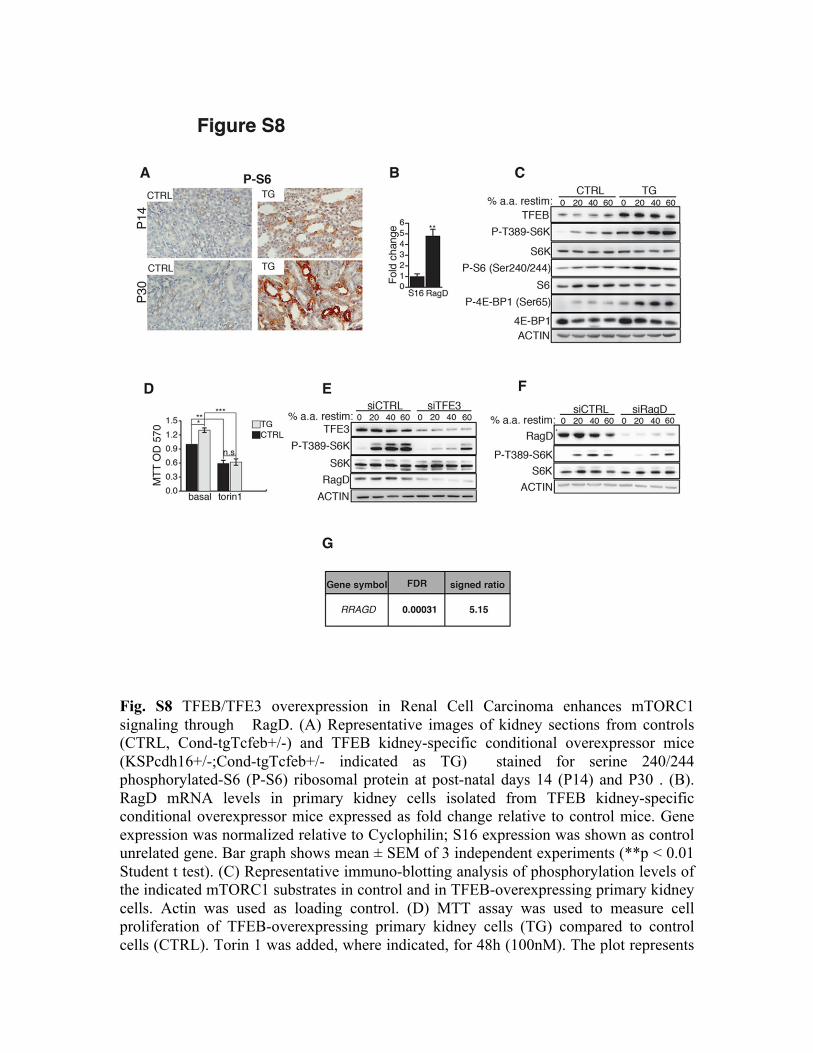
Fig. S8 TFEB/TFE3 overexpression in Renal Cell Carcinoma enhances mTORC1 signaling through RagD. (A) Representative images of kidney sections from controls (CTRL, Cond-tgTcfeb+/-) and TFEB kidney-specific conditional overexpressor mice (KSPcdh16+/-;Cond-tgTcfeb+/- indicated as TG) stained for serine 240/244 phosphorylated-S6 (P-S6) ribosomal protein at post-natal days 14 (P14) and P30 . (B). RagD mRNA levels in primary kidney cells isolated from TFEB kidney-specific conditional overexpressor mice expressed as fold change relative to control mice. Gene expression was normalized relative to Cyclophilin; S16 expression was shown as control unrelated gene. Bar graph shows mean ± SEM of 3 independent experiments (**p < 0.01 Student t test). (C) Representative immuno-blotting analysis of phosphorylation levels of the indicated mTORC1 substrates in control and in TFEB-overexpressing primary kidney cells. Actin was used as loading control. (D) MTT assay was used to measure cell proliferation of TFEB-overexpressing primary kidney cells (TG) compared to control cells (CTRL). Torin 1 was added, where indicated, for 48h (100nM). The plot represents

means of three independent experiments (*p< 0.05 Anova two-way). (E,F) HCR-59 cells were transfected with scramble (siCTRL) or TFE3 (E) or RagD (F) siRNAs and then analyzed for phosphorylation levels of S6K upon stimulation with increasing % of amino acids. (G) RRAGD induction in RNA-Seq data from six patients with TFE3-translocation RCC26.
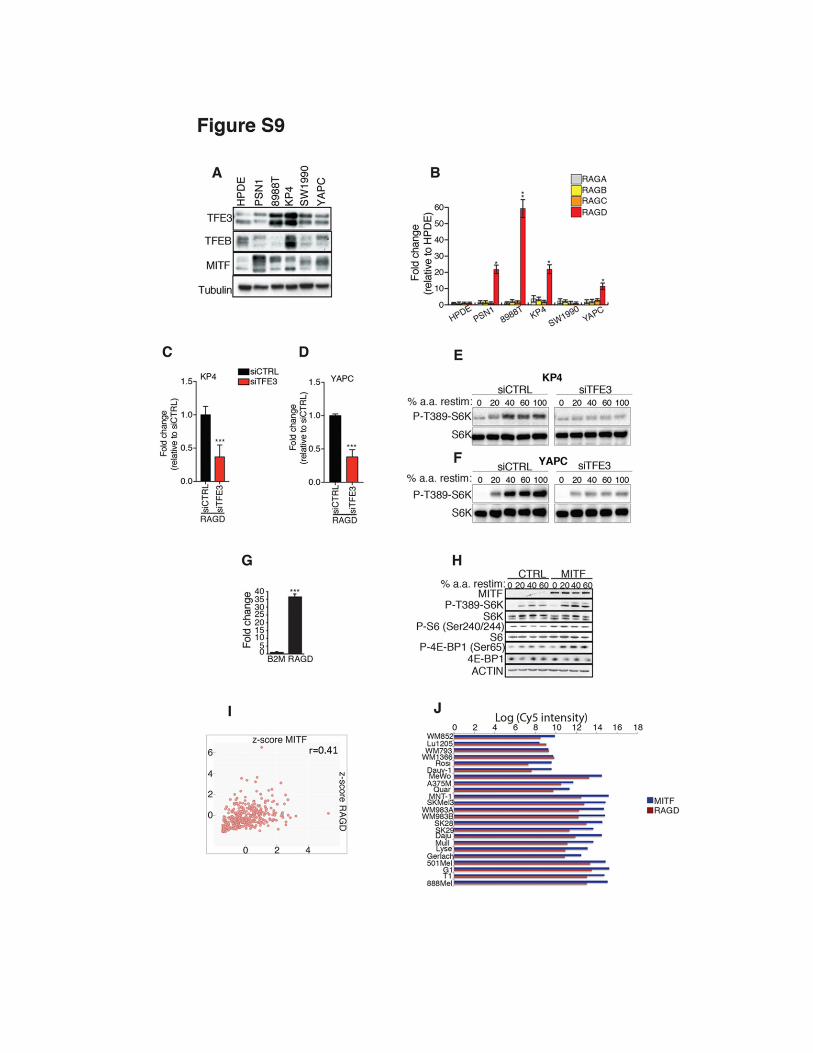
Fig. S9 Induction of RagD and of mTORC1 activity in tumors associated with MIT/TFE hyper-activation. (A, B) A panel of patient-derived PDA cell lines (PSN1, 8988T, KP4, SW1990 and YAPC) were analyzed for protein levels of TFE3, TFEB and MITF (A) and mRNA levels of Rag GTPases (B). Values were compared to normal pancreatic cells (HPDE). (C-F) KP4 and YAPC cells were transfected with scramble (si-CTRL) or TFE3 siRNA and then monitored for mRNA levels of RagD (C, D) and mTORC1 signaling upon amino acid stimulation (E,F). (G, H) HeLa cells were transfected with a vector encoding MITF or with an empty vector and analyzed for RagD mRNA levels (G) and mTORC1 activity (H). Bar graphs in (G) represent fold change of mRNA levels in MITF-transfected cells relative to cells transfected with control vector. In (B), (C), (D), (G) values represent means ± SEM, N=3 (*p < 0.05, **p < 0.01, ***p < 0.001 Student t test). (I) Scatter plot representing co-expression analysis of MITF and RAGD on metastatic melanoma patients from TCGA data set (Pearson correlation: ρ=0.41). (N) Expression levels of MITF and RAGD in 23 melanoma cell lines from microarray analysis (GSE67636, GEO database).
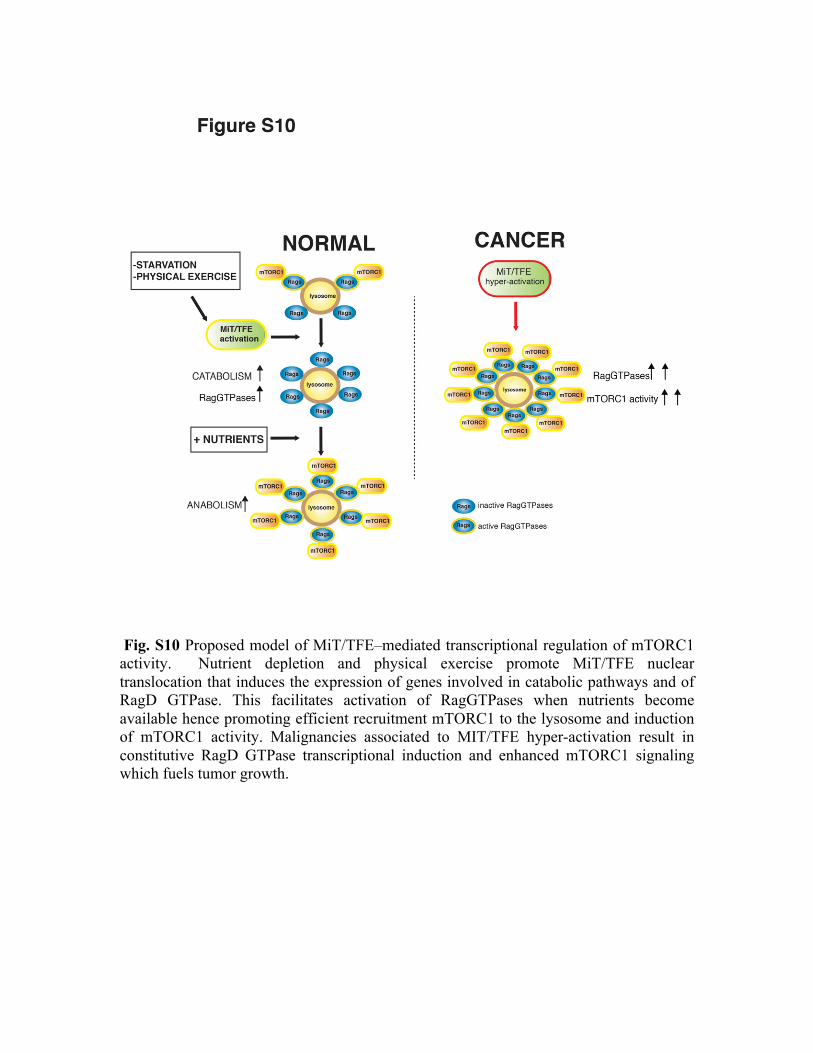
Fig. S10 Proposed model of MiT/TFE–mediated transcriptional regulation of mTORC1 activity. Nutrient depletion and physical exercise promote MiT/TFE nuclear translocation that induces the expression of genes involved in catabolic pathways and of RagD GTPase. This facilitates activation of RagGTPases when nutrients become available hence promoting efficient recruitment mTORC1 to the lysosome and induction of mTORC1 activity. Malignancies associated to MIT/TFE hyper-activation result in constitutive RagD GTPase transcriptional induction and enhanced mTORC1 signaling which fuels tumor growth.
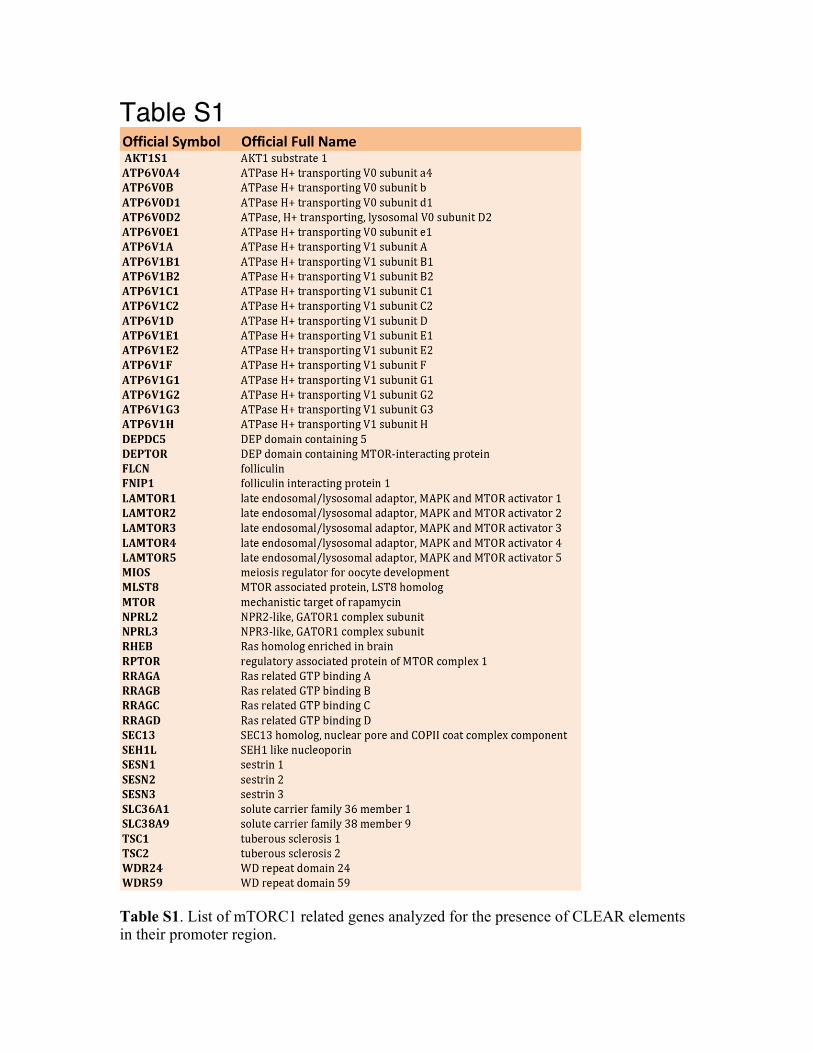
Table S1
Table S1. List of mTORC1 related genes analyzed for the presence of CLEAR elements in their promoter region.
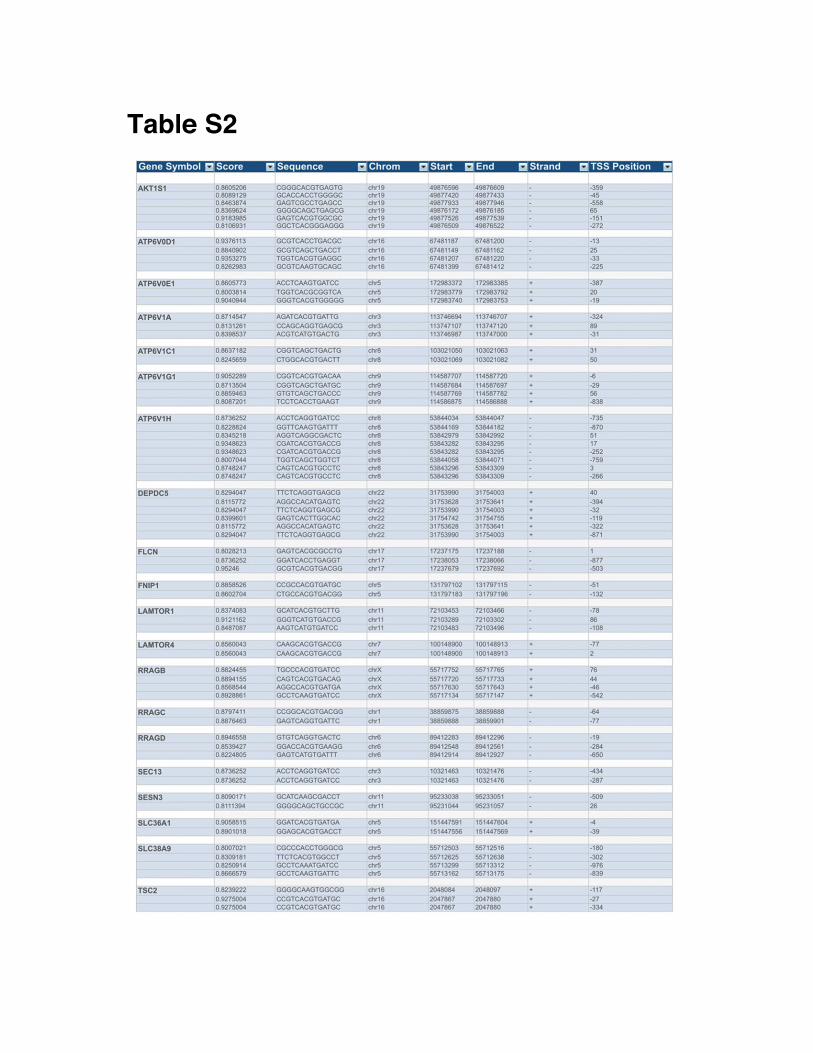
Table S2

Table S2. Distribution of CLEAR elements in the promoters of the selected mTORC1 related genes.
References 1. J. D. Rabinowitz, E. White, Autophagy and metabolism. Science 330, 1344–1348 (2010).
doi:10.1126/science.1193497 Medline
2. R. A. Saxton, D. M. Sabatini, mTOR signaling in growth, metabolism, and disease. Cell 169, 361–371 (2017). doi:10.1016/j.cell.2017.03.035 Medline
3. J. J. Howell, B. D. Manning, mTOR couples cellular nutrient sensing to organismal metabolic homeostasis. Trends Endocrinol. Metab. TEM 22, 94–102 (2011). doi:10.1016/j.tem.2010.12.003 Medline
4. K. Watson, K. Baar, mTOR and the health benefits of exercise. Semin. Cell Dev. Biol. 36, 130–139 (2014). doi:10.1016/j.semcdb.2014.08.013 Medline
5. E. Steingrímsson, N. G. Copeland, N. A. Jenkins, Melanocytes and the microphthalmia transcription factor network. Annu. Rev. Genet. 38, 365–411 (2004). doi:10.1146/annurev.genet.38.072902.092717 Medline
6. M. Sardiello, M. Palmieri, A. di Ronza, D. L. Medina, M. Valenza, V. A. Gennarino, C. Di Malta, F. Donaudy, V. Embrione, R. S. Polishchuk, S. Banfi, G. Parenti, E. Cattaneo, A. Ballabio, A gene network regulating lysosomal biogenesis and function. Science 325, 473–477 (2009). Medline
7. C. Settembre, C. Di Malta, V. A. Polito, M. Garcia Arencibia, F. Vetrini, S. Erdin, S. U. Erdin, T. Huynh, D. Medina, P. Colella, M. Sardiello, D. C. Rubinsztein, A. Ballabio, TFEB links autophagy to lysosomal biogenesis. Science 332, 1429–1433 (2011). doi:10.1126/science.1204592 Medline
8. J. A. Martina, H. I. Diab, L. Lishu, L. Jeong-A, S. Patange, N. Raben, R. Puertollano, The nutrient-responsive transcription factor TFE3 promotes autophagy, lysosomal biogenesis, and clearance of cellular debris. Sci. Signal. 7, ra9 (2014). doi:10.1126/scisignal.2004754 Medline
9. C. A. Hodgkinson, K. J. Moore, A. Nakayama, E. Steingrímsson, N. G. Copeland, N. A. Jenkins, H. Arnheiter, Mutations at the mouse microphthalmia locus are associated with defects in a gene encoding a novel basic-helix-loop-helix-zipper protein. Cell 74, 395–404 (1993). doi:10.1016/0092-8674(93)90429-T Medline
10. C. Settembre, R. Zoncu, D. L. Medina, F. Vetrini, S. Erdin, S. Erdin, T. Huynh, M. Ferron, G. Karsenty, M. C. Vellard, V. Facchinetti, D. M. Sabatini, A. Ballabio, A lysosome-to-nucleus signalling mechanism senses and regulates the lysosome via mTOR and TFEB. EMBO J. 31, 1095–1108 (2012). doi:10.1038/emboj.2012.32 Medline
11. A. Roczniak-Ferguson, C. S. Petit, F. Froehlich, S. Qian, J. Ky, B. Angarola, T. C. Walther, S. M. Ferguson, The transcription factor TFEB links mTORC1 signaling to transcriptional control of lysosome homeostasis. Sci. Signal. 5, ra42 (2012). Medline
12. J. A. Martina, R. Puertollano, Rag GTPases mediate amino acid-dependent recruitment of TFEB and MITF to lysosomes. J. Cell Biol. 200, 475–491 (2013). doi:10.1083/jcb.201209135 Medline
13. C. Settembre, A. Fraldi, D. L. Medina, A. Ballabio, Signals from the lysosome: A control centre for cellular clearance and energy metabolism. Nat. Rev. Mol. Cell Biol. 14, 283–296 (2013). doi:10.1038/nrm3565 Medline
14. D. L. Medina, S. Di Paola, I. Peluso, A. Armani, D. De Stefani, R. Venditti, S. Montefusco, A. Scotto-Rosato, C. Prezioso, A. Forrester, C. Settembre, W. Wang, Q. Gao, H. Xu, M. Sandri, R. Rizzuto, M. A. De Matteis, A. Ballabio, Lysosomal calcium signalling regulates autophagy through calcineurin and TFEB. Nat. Cell Biol. 17, 288–299 (2015). doi:10.1038/ncb3114 Medline
15. L. Yu, C. K. McPhee, L. Zheng, G. A. Mardones, Y. Rong, J. Peng, N. Mi, Y. Zhao, Z. Liu, F. Wan, D. W. Hailey, V. Oorschot, J. Klumperman, E. H. Baehrecke, M. J. Lenardo, Termination of autophagy and reformation of lysosomes regulated by mTOR. Nature 465, 942–946 (2010). doi:10.1038/nature09076 Medline
16. H. Ban, K. Shigemitsu, T. Yamatsuji, M. Haisa, T. Nakajo, M. Takaoka, T. Nobuhisa, M. Gunduz, N. Tanaka, Y. Naomoto, Arginine and leucine regulate p70 S6 kinase and 4E-BP1 in intestinal epithelial cells. Int. J. Mol. Med. 13, 537–543 (2004). Medline
17. Z.-Y. Tsun, L. Bar-Peled, L. Chantranupong, R. Zoncu, T. Wang, C. Kim, E. Spooner, D. M. Sabatini, The folliculin tumor suppressor is a GAP for the RagC/D GTPases that signal amino acid levels to mTORC1. Mol. Cell 52, 495–505 (2013). doi:10.1016/j.molcel.2013.09.016 Medline
18. Y. Sancak, T. R. Peterson, Y. D. Shaul, R. A. Lindquist, C. C. Thoreen, L. Bar-Peled, D. M. Sabatini, The Rag GTPases bind raptor and mediate amino acid signaling to mTORC1. Science 320, 1496–1501 (2008). doi:10.1126/science.1157535 Medline
19. E. Kim, P. Goraksha-Hicks, L. Li, T. P. Neufeld, K.-L. Guan, Regulation of TORC1 by Rag GTPases in nutrient response. Nat. Cell Biol. 10, 935–945 (2008). doi:10.1038/ncb1753 Medline
20. R. Haq, D. E. Fisher, Biology and clinical relevance of the micropthalmia family of transcription factors in human cancer. J. Clin. Oncol. 29, 3474–3482 (2011). doi:10.1200/JCO.2010.32.6223 Medline
21. E. C. Kauffman, C. J. Ricketts, S. Rais-Bahrami, Y. Yang, M. J. Merino, D. P. Bottaro, R. Srinivasan, W. M. Linehan, Molecular genetics and cellular features of TFE3 and TFEB fusion kidney cancers. Nat. Rev. Urol. 11, 465–475 (2014). doi:10.1038/nrurol.2014.162 Medline
22. R. M. Perera, S. Stoykova, B. N. Nicolay, K. N. Ross, J. Fitamant, M. Boukhali, J. Lengrand, V. Deshpande, M. K. Selig, C. R. Ferrone, J. Settleman, G. Stephanopoulos, N. J. Dyson, R. Zoncu, S. Ramaswamy, W. Haas, N. Bardeesy, Transcriptional control of autophagy-lysosome function drives pancreatic cancer metabolism. Nature 524, 361–365 (2015). doi:10.1038/nature14587 Medline
23. A. Calcagnì, L. Kors, E. Verschuren, R. De Cegli, N. Zampelli, E. Nusco, S. Confalonieri, G. Bertalot, S. Pece, C. Settembre, G. G. Malouf, J. C. Leemans, E. de Heer, M. Salvatore, D. J. M. Peters, P. P. Di Fiore, A. Ballabio, Modelling TFE renal cell carcinoma in mice reveals a critical role of WNT signaling. eLife 5, e17047 (2016). doi:10.7554/eLife.17047 Medline
24. G. G. Malouf, X. Su, H. Yao, J. Gao, L. Xiong, Q. He, E. Compérat, J. Couturier, V. Molinié, B. Escudier, P. Camparo, D. J. Doss, E. J. Thompson, D. Khayat, C. G. Wood, W. Yu, B. T. Teh, J. Weinstein, N. M. Tannir, Next-generation sequencing of translocation renal cell carcinoma reveals novel RNA splicing partners and frequent mutations of chromatin-remodeling genes. Clin. Cancer Res. 20, 4129–4140 (2014). doi:10.1158/1078-0432.CCR-13-3036 Medline
25. H. Tsao, L. Chin, L. A. Garraway, D. E. Fisher, Melanoma: From mutations to medicine. Genes Dev. 26, 1131–1155 (2012). doi:10.1101/gad.191999.112 Medline
26. R. Halaban, E. Cheng, Y. Smicun, J. Germino, Deregulated E2F transcriptional activity in autonomously growing melanoma cells. J. Exp. Med. 191, 1005–1016 (2000). doi:10.1084/jem.191.6.1005 Medline
27. A. Primot, A. Mogha, S. Corre, K. Roberts, J. Debbache, H. Adamski, B. Dreno, A. Khammari, T. Lesimple, A. Mereau, C. R. Goding, M.-D. Galibert, ERK-regulated differential expression of the Mitf 6a/b splicing isoforms in melanoma. Pigment Cell Melanoma Res. 23, 93–102 (2010). doi:10.1111/j.1755-148X.2009.00652.x Medline
28. E. Steingrimsson, L. Tessarollo, B. Pathak, L. Hou, H. Arnheiter, N. G. Copeland, N. A. Jenkins, Mitf and Tfe3, two members of the Mitf-Tfe family of bHLH-Zip transcription factors, have important but functionally redundant roles in osteoclast development. Proc. Natl. Acad. Sci. U.S.A. 99, 4477–4482 (2002). doi:10.1073/pnas.072071099 Medline
29. C. Settembre, R. De Cegli, G. Mansueto, P. K. Saha, F. Vetrini, O. Visvikis, T. Huynh, A. Carissimo, D. Palmer, T. J. Klisch, A. C. Wollenberg, D. Di Bernardo, L. Chan, J. E. Irazoqui, A. Ballabio, TFEB controls cellular lipid metabolism through a starvation-induced autoregulatory loop. Nat. Cell Biol. 15, 647–658 (2013). doi:10.1038/ncb2718 Medline
30. J. Ezaki, N. Matsumoto, M. Takeda-Ezaki, M. Komatsu, K. Takahashi, Y. Hiraoka, H. Taka, T. Fujimura, K. Takehana, M. Yoshida, J. Iwata, I. Tanida, N. Furuya, D.-M. Zheng, N. Tada, K. Tanaka, E. Kominami, T. Ueno, Liver autophagy contributes to the maintenance of blood glucose and amino acid levels. Autophagy 7, 727–736 (2011). doi:10.4161/auto.7.7.15371 Medline


![Supporting Online Material forscience.sciencemag.org/highwire/filestream/590781/field_highwire...Verde [Guanacaste] Biological Stations, 2006; Corcovado National Park [Puntarenas],](https://img.pdfslide.net/doc/110x75/5e215cb3bf01800aa4125a36/supporting-online-material-guanacaste-biological-stations-2006-corcovado-national.jpg)