Embed Size (px)
Citation preview
Supplementary webappendixThis webappendix formed part of the original submission and has been peer reviewed. We post it as supplied by the authors.
Supplement to: Calligaro GL, Zijenah LS, Peter JG, et al. Effect of new tuberculosis diagnostic technologies on community-based intensified case finding: a multicentre randomised controlled trial. Lancet Infect Dis 2017; published online Jan 4. http://dx.doi.org/10.1016/S1473-3099(16)30384-X.
1
SUPPLEMENTARYAPPENDIX This appendix has been provided by the authors to give readers additional information about their work. Supplement to: The impact of new TB diagnostic technologies on community-based intensified case-finding: a multi-centre randomised controlled trial Gregory L. Calligaro, Lynn S. Zijenah, Jonathan G. Peter, Grant Theron, Virginia Buser, Ruth McNerney, Wilbert Bara, Tsitsi Bandason, Ureshnie Govender, Michele Tomasicchio, Liezel Smith, Bongani Mayosi and Keertan Dheda. Corresponding author:
Professor Keertan Dheda Head, Division of Pulmonology, Department of Medicine H46.41 Old Main Building Groote Schuur Hospital, Observatory, Cape Town 7925, South Africa Tel: +27 21 404 7650 Fax: +27 21 404 7651 E-mail: [email protected]
2
Table of Contents STUDYINVESTIGATORSANDSTAFF................................................................................................................3SUPPLEMENTARYMETHODS..............................................................................................................................5STUDYOVERVIEW........................................................................................................................................................................5STUDYSITEDESCRIPTIONS.........................................................................................................................................................5SITESELECTIONANDINCLUSION/EXCLUSIONCRITERIA......................................................................................................7
DIAGNOSTICACCURACYOFWHOSYMPTOMSCREENFORCULTURE-POSITIVETB.....................11DETAILSOFXPERTMTB/RIF-POSITIVE,CULTURENEGATIVEPATIENTS(N=13)........................12DIAGNOSTICACCURACYOFSMEARMICROSCOPY(INROUTINEARM)ANDXPERTMTB/RIF(INNOVELARM)..........................................................................................................................................................14DIAGNOSTICACCURACYOFVAN-BASEDVS.CLINIC-BASEDXPERT(CAPETOWN).......................16XPERTOPERATORPROFICIENCY,USERAPPRAISALANDPROBLEMSWITHTHEMOBILEVAN....................................................................................................................................................................................17SUPPLEMENTARYFIGURES..............................................................................................................................18SUPPLEMENTARYTABLES................................................................................................................................20REFERENCES..........................................................................................................................................................25
3
Study investigators and staff Principal investigator: Professor Keertan Dheda (South Africa) South Africa Professor Keertan Dheda (PI) Dr Greg Calligaro (XACT study lead) Dr Jonathan Peter (Study physician) Dr Grant Theron Dr Virginia Buser (SA site project manager) Dr Ureshni Govender Professor Bongani Mayosi Zimbabwe Professor Lynn S. Zijenah (Site PI) Dr Wilbert Bara (Study Physician) Dr Tsitsi Banda (Study Biostatistician) Research nurses and assistants South Africa: M Pretorius, M Pascoe, J Sage, V Ngah. Zimbabwe: M M Chipiti, A Mpete and P Kaguru Technologists F. Makoga and B. Gwambiwa and the data capturers B. Nyauzame and T. Pswarayi. Laboratory teams: South Africa: Michele Tomasicchio and Liezel Smith. Zimbabwe: B Gwambiwa, F Makoga. Data teams South Africa: D Cogill, R Titus, V Louw and M Fadul Zimbabwe: T Pswarayi and B. Nyauzame.

4
Acknowledgments We are indebted to the patients who participated in this study. We thank the Health Directorate of the City of Cape Town and the Zimbabwe Ministry of Health and Child Care. We acknowledge the assistance of hospital clinical and nursing staff at each site, and the assistance of the local institutional review boards

5
Supplementary methods Study overview The study was coordinated by teams at each of the two study sites and led by a steering committee of the TB NEAT consortium. The consortium oversaw the study conduct, reviewed the manuscript and made the decision to submit for publication. The sponsor of the study had no role in study design, data collection, data analysis, data interpretation, or writing of the report. Study site descriptions Langa (Cape Town, South Africa) Langa is a community of low socioeconomic status with a high HIV prevalence (~35%), within the city of Cape Town in the Western Cape province. It is the oldest of many areas in South Africa that were designated for Black Africans in the apartheid era. It has a high population density, with more than 52,000 people living in informal housing in an area of 3.09km2 at the last census (2011). The TB caseload at the Langa Clinic is ±800 new cases per annum, which is one of the highest in Cape Town. Approximately 1-2% of cases are multidrug-resistant. The facility is a specialist TB/HIV primary care clinic and operates in the Cape Town Central Health District of the Metro Region. Xpert was rolled out as the preferred diagnostic test for all respiratory samples in the Western Cape, in November 2012. Chest radiography is not available on-site and patients need to be referred to a nearby Day Hospital (Vanguard Day Hospital). In Langa, the weekly location for community-based screening using the mobile van was chosen after consulting local community leaders. These sites were clustered around community congregate settings or suspected transmission “hot-spots” such as shops, hostels, or transit hubs (taxi ranks and bus stops). Nine such sites were identified: three were around central shopping areas, four around transit hubs, and the remainder among high-density urban slum housing “hostels”. Recruitment and follow-up was rotated between these sites.
6
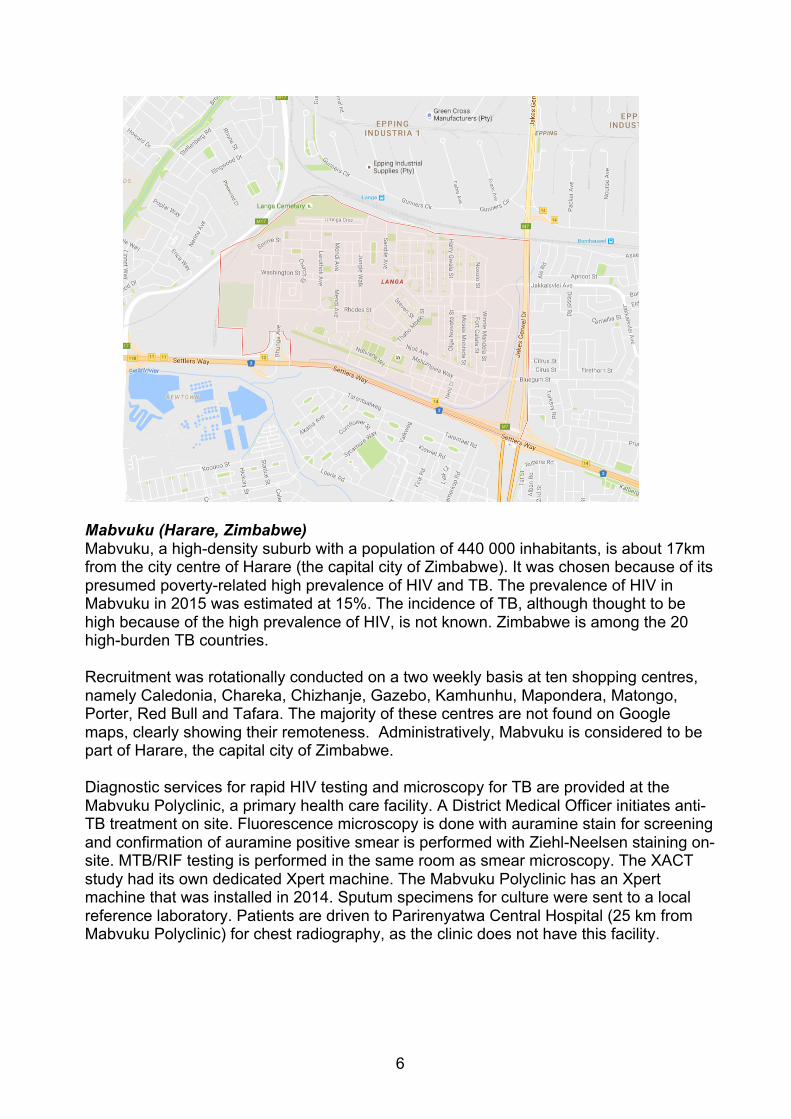
Mabvuku (Harare, Zimbabwe) Mabvuku, a high-density suburb with a population of 440 000 inhabitants, is about 17km from the city centre of Harare (the capital city of Zimbabwe). It was chosen because of its presumed poverty-related high prevalence of HIV and TB. The prevalence of HIV in Mabvuku in 2015 was estimated at 15%. The incidence of TB, although thought to be high because of the high prevalence of HIV, is not known. Zimbabwe is among the 20 high-burden TB countries. Recruitment was rotationally conducted on a two weekly basis at ten shopping centres, namely Caledonia, Chareka, Chizhanje, Gazebo, Kamhunhu, Mapondera, Matongo, Porter, Red Bull and Tafara. The majority of these centres are not found on Google maps, clearly showing their remoteness. Administratively, Mabvuku is considered to be part of Harare, the capital city of Zimbabwe. Diagnostic services for rapid HIV testing and microscopy for TB are provided at the Mabvuku Polyclinic, a primary health care facility. A District Medical Officer initiates anti-TB treatment on site. Fluorescence microscopy is done with auramine stain for screening and confirmation of auramine positive smear is performed with Ziehl-Neelsen staining on-site. MTB/RIF testing is performed in the same room as smear microscopy. The XACT study had its own dedicated Xpert machine. The Mabvuku Polyclinic has an Xpert machine that was installed in 2014. Sputum specimens for culture were sent to a local reference laboratory. Patients are driven to Parirenyatwa Central Hospital (25 km from Mabvuku Polyclinic) for chest radiography, as the clinic does not have this facility.
7
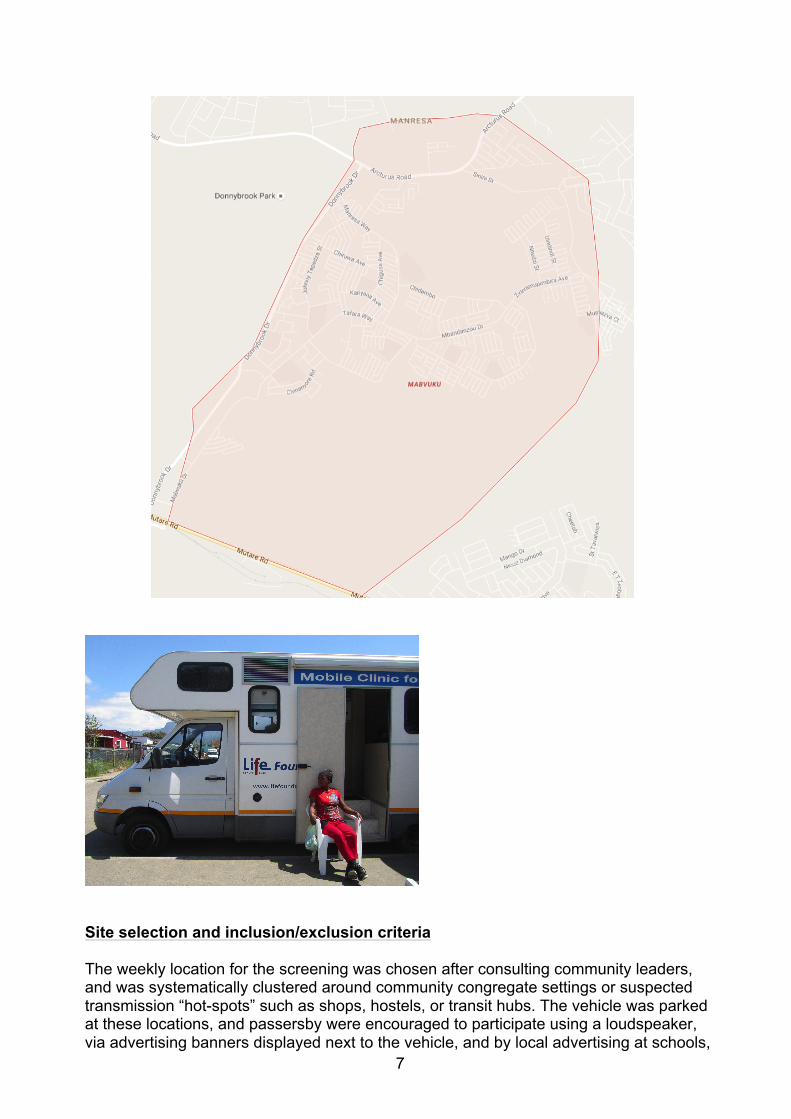
Site selection and inclusion/exclusion criteria The weekly location for the screening was chosen after consulting community leaders, and was systematically clustered around community congregate settings or suspected transmission “hot-spots” such as shops, hostels, or transit hubs. The vehicle was parked at these locations, and passersby were encouraged to participate using a loudspeaker, via advertising banners displayed next to the vehicle, and by local advertising at schools,
8
churches, supermarkets and social clubs. After obtaining informed consent, participants were counseled, and their HIV status confirmed by finger prick tests using two commercially available assays. The screening protocol depended on HIV status: we consecutively enrolled HIV-uninfected patients aged 18 years or older with at least one symptom of TB (cough of any duration, haemoptysis, weight loss, fever or night sweats according to a WHO-recommended screening algorithm1), but enrolled all adult HIV-infected patients regardless of symptoms. The rationale for this latter strategy was that the “rule out” utility of the WHO screening algorithm is suboptimal in HIV-infected persons2. Patients who refused HIV testing were screened as though they were HIV-infected. We excluded all patients who had previously self-presented to a TB community clinic in the last 2 months, had received treatment in the last 60 days, or who were unwilling or unable to give informed consent. A description of each site and the TB symptoms is also presented in the appendix.
9
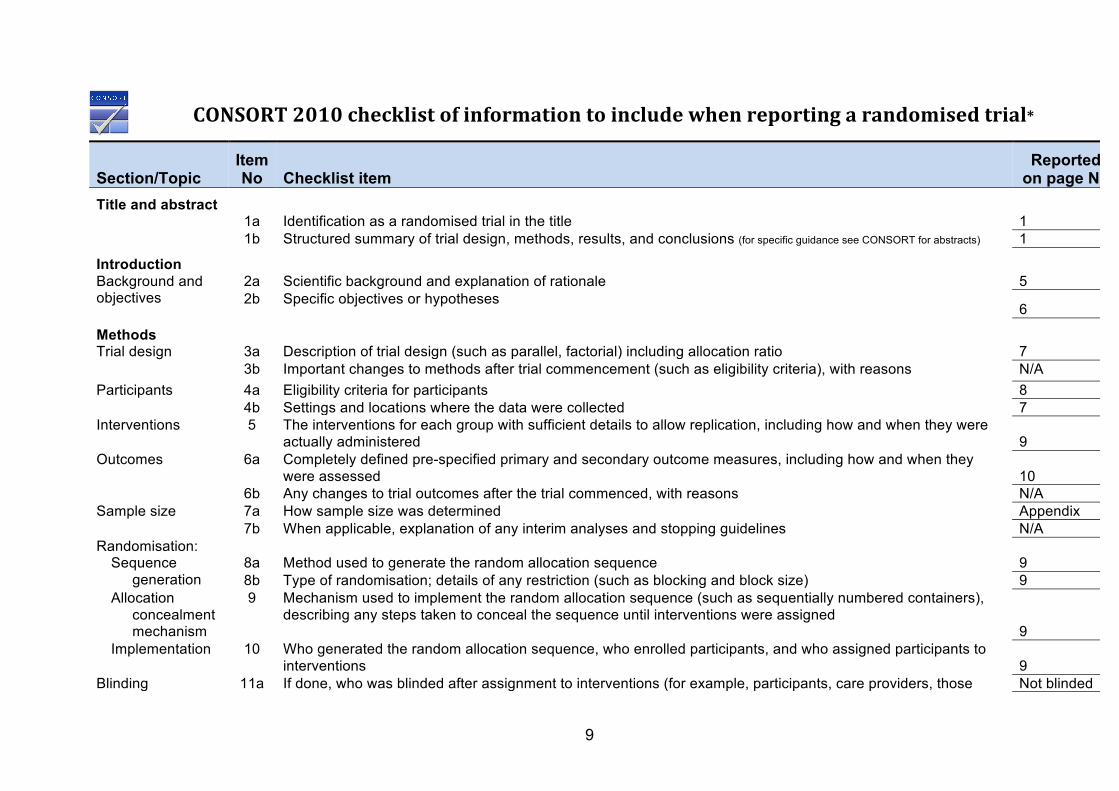
CONSORT2010checklistofinformationtoincludewhenreportingarandomisedtrial*
Section/Topic Item No Checklist item
Reported on page No
Title and abstract 1a Identification as a randomised trial in the title 1
1b Structured summary of trial design, methods, results, and conclusions (for specific guidance see CONSORT for abstracts) 1
Introduction Background and objectives
2a Scientific background and explanation of rationale 5 2b Specific objectives or hypotheses
6
Methods Trial design 3a Description of trial design (such as parallel, factorial) including allocation ratio 7
3b Important changes to methods after trial commencement (such as eligibility criteria), with reasons N/A Participants 4a Eligibility criteria for participants 8
4b Settings and locations where the data were collected 7 Interventions 5 The interventions for each group with sufficient details to allow replication, including how and when they were
actually administered 9 Outcomes 6a Completely defined pre-specified primary and secondary outcome measures, including how and when they
were assessed 10 6b Any changes to trial outcomes after the trial commenced, with reasons N/A
Sample size 7a How sample size was determined Appendix 7b When applicable, explanation of any interim analyses and stopping guidelines N/A
Randomisation: Sequence
generation 8a Method used to generate the random allocation sequence 9 8b Type of randomisation; details of any restriction (such as blocking and block size) 9
Allocation concealment mechanism
9 Mechanism used to implement the random allocation sequence (such as sequentially numbered containers), describing any steps taken to conceal the sequence until interventions were assigned
9 Implementation 10 Who generated the random allocation sequence, who enrolled participants, and who assigned participants to
interventions 9 Blinding 11a If done, who was blinded after assignment to interventions (for example, participants, care providers, those Not blinded
10
assessing outcomes) and how 11b If relevant, description of the similarity of interventions N/A
Statistical methods 12a Statistical methods used to compare groups for primary and secondary outcomes Appendix 12b Methods for additional analyses, such as subgroup analyses and adjusted analyses Appendix
Results Participant flow (a diagram is strongly recommended)
13a For each group, the numbers of participants who were randomly assigned, received intended treatment, and were analysed for the primary outcome
Figure 1
13b For each group, losses and exclusions after randomisation, together with reasons Figure 1 Recruitment 14a Dates defining the periods of recruitment and follow-up 11
14b Why the trial ended or was stopped 11 Baseline data 15 A table showing baseline demographic and clinical characteristics for each group Table 1 Numbers analysed 16 For each group, number of participants (denominator) included in each analysis and whether the analysis was
by original assigned groups Table 1
Outcomes and estimation
17a For each primary and secondary outcome, results for each group, and the estimated effect size and its precision (such as 95% confidence interval)
Table 2 and Figures 2 and 3
17b For binary outcomes, presentation of both absolute and relative effect sizes is recommended Ancillary analyses 18 Results of any other analyses performed, including subgroup analyses and adjusted analyses, distinguishing
pre-specified from exploratory N/A
Harms 19 All important harms or unintended effects in each group (for specific guidance see CONSORT for harms) N/A
Discussion Limitations 20 Trial limitations, addressing sources of potential bias, imprecision, and, if relevant, multiplicity of analyses 19 Generalisability 21 Generalisability (external validity, applicability) of the trial findings 19 Interpretation 22 Interpretation consistent with results, balancing benefits and harms, and considering other relevant evidence 20
Other information
Registration 23 Registration number and name of trial registry 4 Protocol 24 Where the full trial protocol can be accessed, if available Funding 25 Sources of funding and other support (such as supply of drugs), role of funders 4
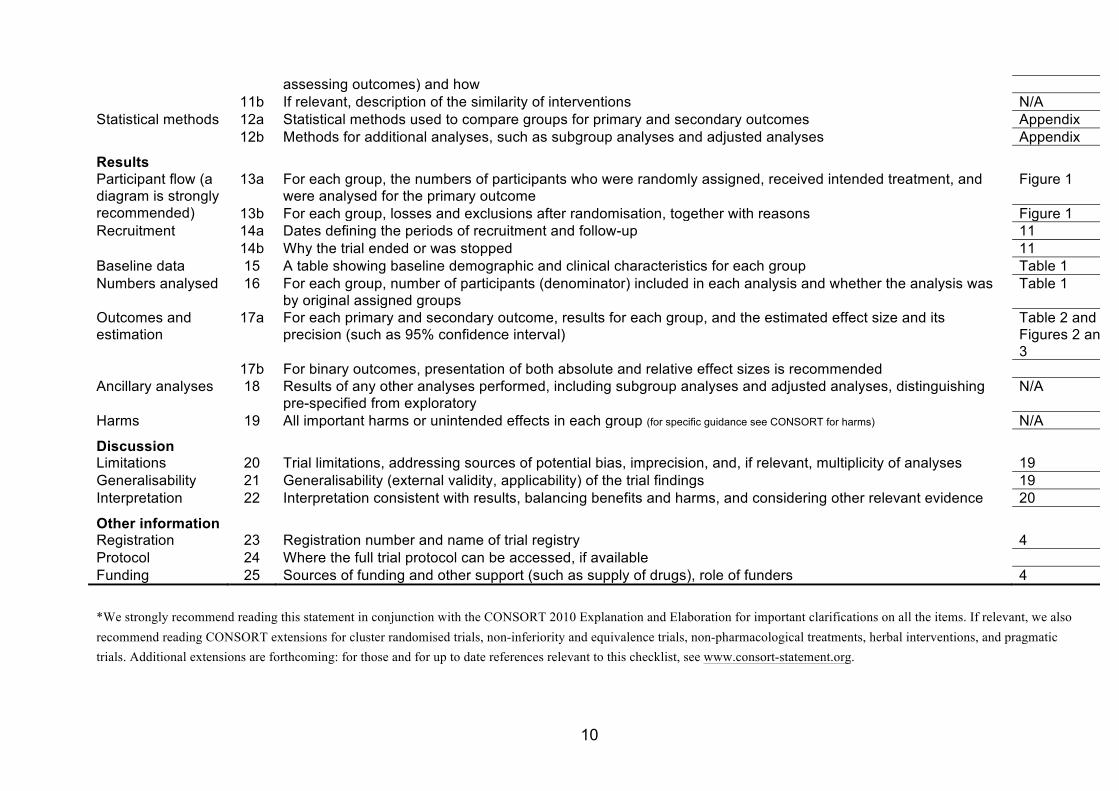
*We strongly recommend reading this statement in conjunction with the CONSORT 2010 Explanation and Elaboration for important clarifications on all the items. If relevant, we also recommend reading CONSORT extensions for cluster randomised trials, non-inferiority and equivalence trials, non-pharmacological treatments, herbal interventions, and pragmatic trials. Additional extensions are forthcoming: for those and for up to date references relevant to this checklist, see www.consort-statement.org.

11
Diagnostic accuracy of WHO symptom screen for culture-positive TB
WHO TB screening symptom Paired culture positive (excluding contaminated/unpaired cultures or cultures not done)
sensitivity specificity PPV NPV AUROC (95%CI)
Cough of any duration
test performance % 95% CI Number
95.9% 88.6%-99.2% 71/74
4.6% 3.2%-6.4% 35/755
9.0% 7.1%-11.2% 71/720
92.1% 78.6%-98.3% 35/38
0.50 (0.48-0.53)
Haemoptysis
test performance % 95% CI Number
10.8 4.8%-20.2% 8/74
86.1% 83.4-88.5% 650/755
7.1% 3.1%-13.5% 8/113
90.8% 88.4%-92.8% 650/716
0.45 (0.45-0.52)
Weight loss
test performance % 95% CI Number
86.5% 76.5%-93.3% 64/74
22.0% 19.1%-25.1% 166/755
9.8% 94.3%-97.2% 64/653
94.3% 89.8%-97.2% 166/176
0.54 (0.50-0.58)
Fever
test performance % 95% CI Number
51.4% 39.4%-63.1% 38/74
52.1% 48.4%-55.7% 393/755
9.5% 6.8%-12.8% 38/400
92.6% 88.6%-94.1% 393/429
0.52 (0.46-0.58)
Night sweats
test performance % 95% CI Number
83.3% 73.4%-91.3% 62/74
25.6% 22.5%-28.8% 193/755
9.9% 7.7%-12.6% 62/624
94.1% 90.0%-96.9% 193/205
0.55 (0.50-0.59)
Night sweats PLUS weight loss
test performance % 95% CI Number
74.3% 62.8%-83.8% 55/74
38.4% 34.9%-42.0% 290/755
10.6% 8.1%-13.5% 55/520
93.9% 90.6%-96.3% 290/309
0.56 (0.51-0.62)
All four WHO screening symptoms
test performance % 95% CI Number
43.2% 31.8%-55.3% 32/74
67.2% 63.7%-70.5% 507/755
11.4% 7.9%-15.7% 32/280
92.3% 89.8%-94.4% 507/549
0.55 (0.49-0.61)
Abbreviations: WHO - World Health Organisation; CI – confidence interval; PPV – positive predictive value; NPV – negative predictive value; AUROC – area under receiver operator curve.

12
Variable Adjusted OR (95% CI)† P-value Number of WHO TB symptoms 1.19 (0.93-1.53) 0.159 Abbreviations: OR - odds ratio; CI - confidence interval; HIV - human immunodeficiency virus; WHO - World Health Organisation; TB – tuberculosis. †Corrected for HIV status and site
Details of Xpert MTB/RIF-positive, culture negative patients (n=13) Age Sex HIV
status Previous TB
Symptomatic at diagnosis?*
Xpert Ct value
Treated Symptoms at 2 months?
Outcome at 6 months
41 Female Positive Yes Yes 26.9 Yes Resolved. Symptomatically better, alive, completed treatment.
42 Male Positive Yes Yes 30.7 Yes Improved. Lost to follow-up. 22 Female Negative No Yes 24.2 Yes Improved. Poor compliance, extended treatment. 45 Female Negative No Yes 33.4 No Resolved. Refused treatment. 47 Male Positive Yes Yes 31.94 Yes Not
documented. Alive, completed treatment.
43 Female Positive No Yes 33.32 Yes Not documented.
Alive, completed treatment.
46 Male Positive No Yes 32.98 Yes Not documented.
Died.
32 Female Positive No Yes 36.84 Yes Not documented.
Alive, completed treatment.
34 Female Positive No Yes 17.82 Yes Not documented.
Alive, completed treatment.
58 Female Positive No Yes 28.4 Yes Not documented.
Alive, completed treatment.
38 Male Positive No Yes 33.52 Yes Not documented.
Alive, completed treatment.
40 Female Positive Yes Yes 33.88 Yes Not documented.
Alive, completed treatment.
36 Male Positive No Yes 32.48 Yes Not documented.
Alive, completed treatment.
* Cough, fever, night sweats or weight loss
13
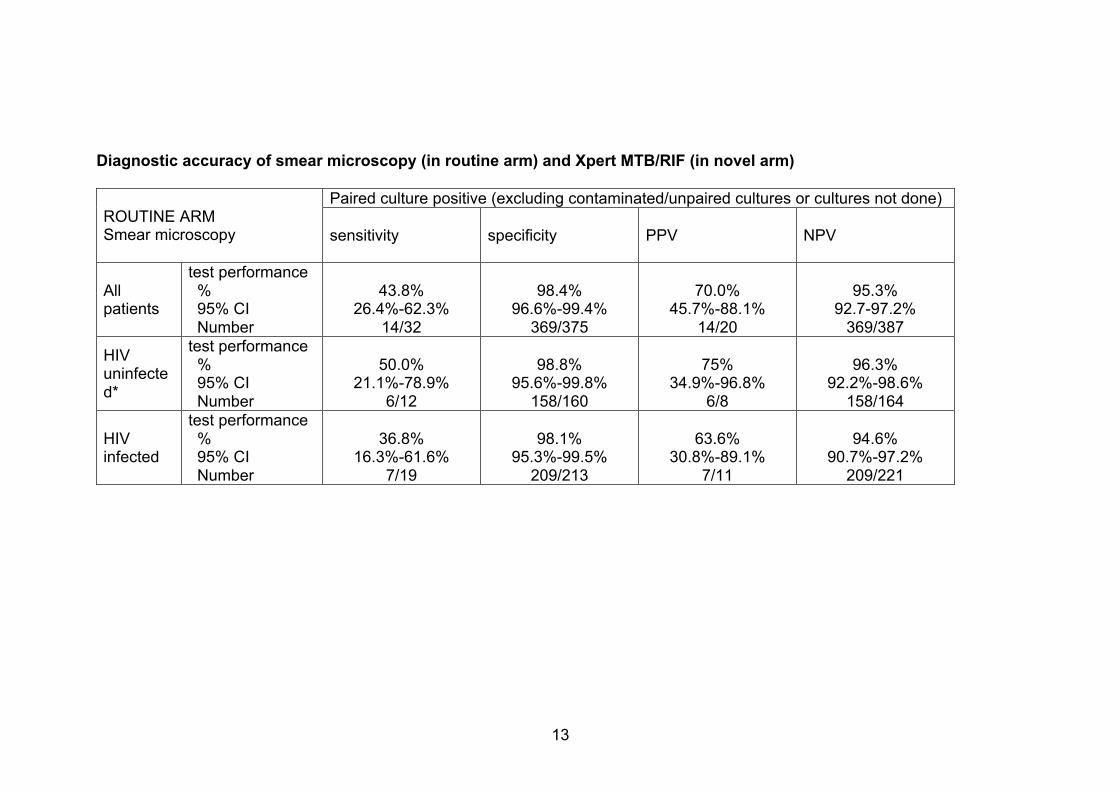
Diagnostic accuracy of smear microscopy (in routine arm) and Xpert MTB/RIF (in novel arm) ROUTINE ARM Smear microscopy
Paired culture positive (excluding contaminated/unpaired cultures or cultures not done)
sensitivity specificity PPV NPV
All patients
test performance % 95% CI Number
43.8%
26.4%-62.3% 14/32
98.4%
96.6%-99.4% 369/375
70.0%
45.7%-88.1% 14/20
95.3%
92.7-97.2% 369/387
HIV uninfected*
test performance % 95% CI Number
50.0%
21.1%-78.9% 6/12
98.8%
95.6%-99.8% 158/160
75%
34.9%-96.8% 6/8
96.3%
92.2%-98.6% 158/164
HIV infected
test performance % 95% CI Number
36.8%
16.3%-61.6% 7/19
98.1%
95.3%-99.5% 209/213
63.6%
30.8%-89.1% 7/11
94.6%
90.7%-97.2% 209/221
14
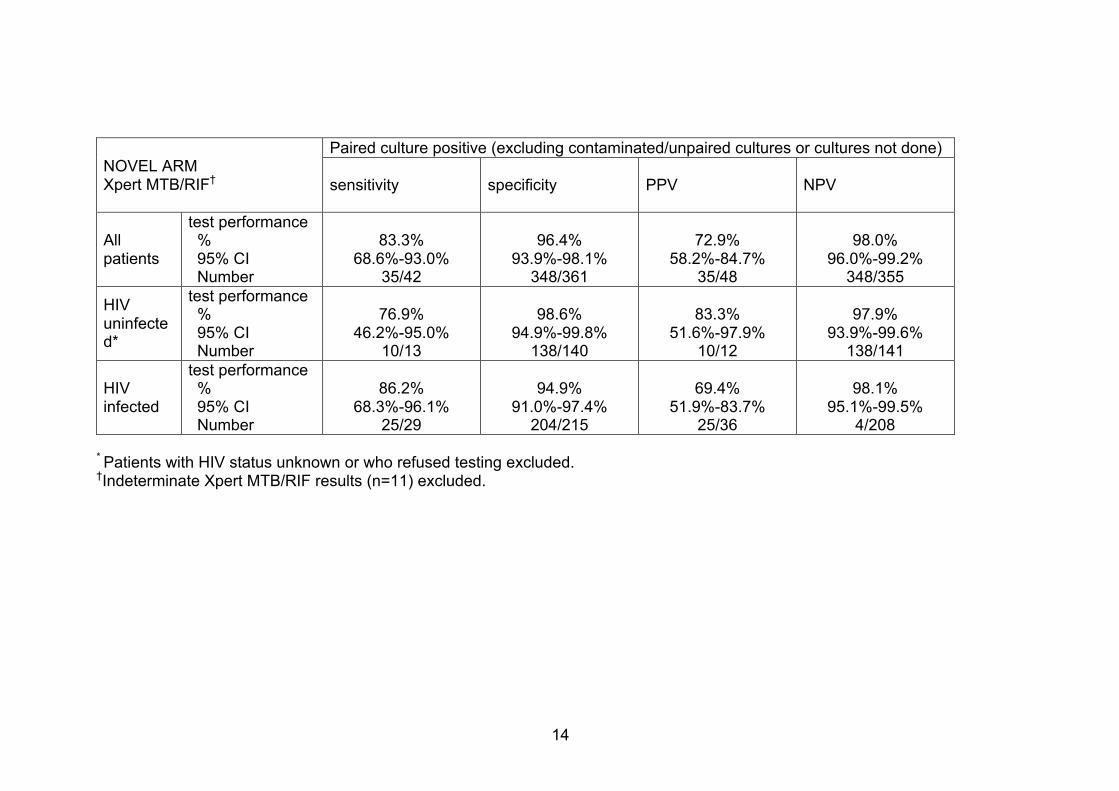
NOVEL ARM Xpert MTB/RIF†
Paired culture positive (excluding contaminated/unpaired cultures or cultures not done)
sensitivity specificity PPV NPV
All patients
test performance % 95% CI Number
83.3%
68.6%-93.0% 35/42
96.4%
93.9%-98.1% 348/361
72.9%
58.2%-84.7% 35/48
98.0%
96.0%-99.2% 348/355
HIV uninfected*
test performance % 95% CI Number
76.9%
46.2%-95.0% 10/13
98.6%
94.9%-99.8% 138/140
83.3%
51.6%-97.9% 10/12
97.9%
93.9%-99.6% 138/141
HIV infected
test performance % 95% CI Number
86.2%
68.3%-96.1% 25/29
94.9%
91.0%-97.4% 204/215
69.4%
51.9%-83.7% 25/36
98.1%
95.1%-99.5% 4/208
* Patients with HIV status unknown or who refused testing excluded.
†Indeterminate Xpert MTB/RIF results (n=11) excluded.
15
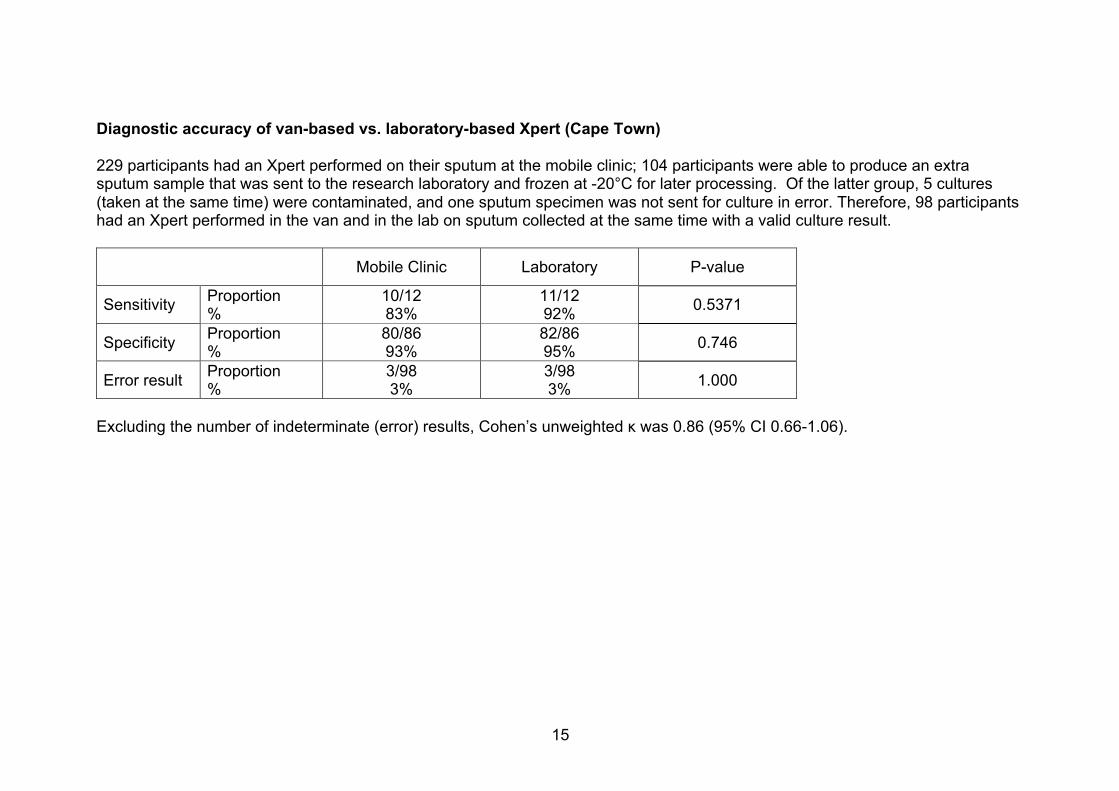
Diagnostic accuracy of van-based vs. laboratory-based Xpert (Cape Town) 229 participants had an Xpert performed on their sputum at the mobile clinic; 104 participants were able to produce an extra sputum sample that was sent to the research laboratory and frozen at -20°C for later processing. Of the latter group, 5 cultures (taken at the same time) were contaminated, and one sputum specimen was not sent for culture in error. Therefore, 98 participants had an Xpert performed in the van and in the lab on sputum collected at the same time with a valid culture result. Mobile Clinic Laboratory P-value
Sensitivity Proportion %
10/12 83%
11/12 92% 0.5371
Specificity Proportion %
80/86 93%
82/86 95% 0.746
Error result Proportion %
3/98 3%
3/98 3% 1.000
Excluding the number of indeterminate (error) results, Cohen’s unweighted κ was 0.86 (95% CI 0.66-1.06).

16
Xpert operator proficiency, user appraisal and problems with the mobile van
Adherence to the test protocol and operator knowledge of the procedure were examined using a standardised form by a qualified laboratory technician who regularly assessed the technical proficiency of the healthcare worker who performed Xpert.
Healthcare workers also completed user appraisal questionnaires on their confidence and satisfaction with the test. All users expressed satisfaction with performing the test and its ease of use, although 2/5 (40%) expressed doubt about what do to if a test failed, if a volume of sputum was inadequate, and were also insecure about trouble-shooting problems with the Xpert machine software. The same 2 users were initially not confident to perform the test unassisted. One user received more training, and was able to perform the test independently, while the other required an additional staff member to assist her for the duration of the study. All users were confident to describe how the test worked to patients, and all were satisfied with the amount of training received.
Problems with vehicle and the mobile Xpert machine that impacted on study performance included:
• 6 non-consecutive days lost to generator problems (unable to power Xpert machine and ultrasonic nebulizer in the field)
• 3 non-consecutive days lost due to tire punctures on vehicle • 3 consecutive days lost due to engine trouble with mobile van
17
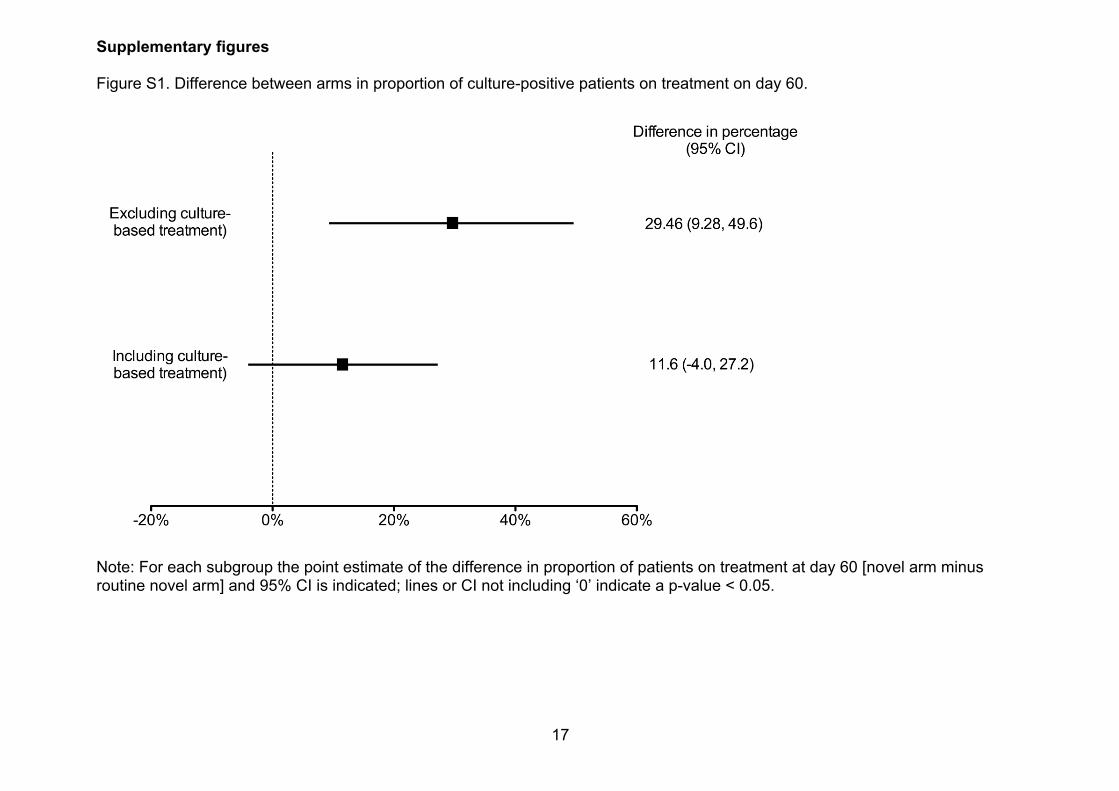
Supplementary figures Figure S1. Difference between arms in proportion of culture-positive patients on treatment on day 60.
Note: For each subgroup the point estimate of the difference in proportion of patients on treatment at day 60 [novel arm minus routine novel arm] and 95% CI is indicated; lines or CI not including ‘0’ indicate a p-value < 0.05.
18
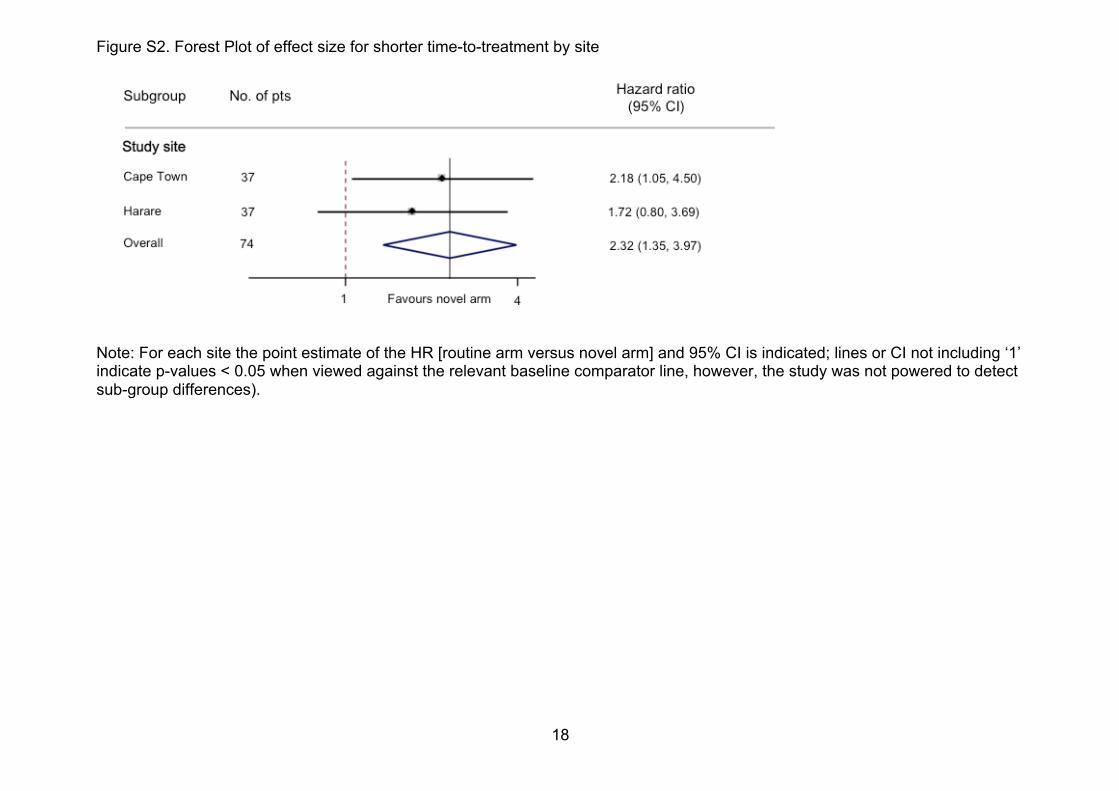
Figure S2. Forest Plot of effect size for shorter time-to-treatment by site
Note: For each site the point estimate of the HR [routine arm versus novel arm] and 95% CI is indicated; lines or CI not including ‘1’ indicate p-values < 0.05 when viewed against the relevant baseline comparator line, however, the study was not powered to detect sub-group differences).
19
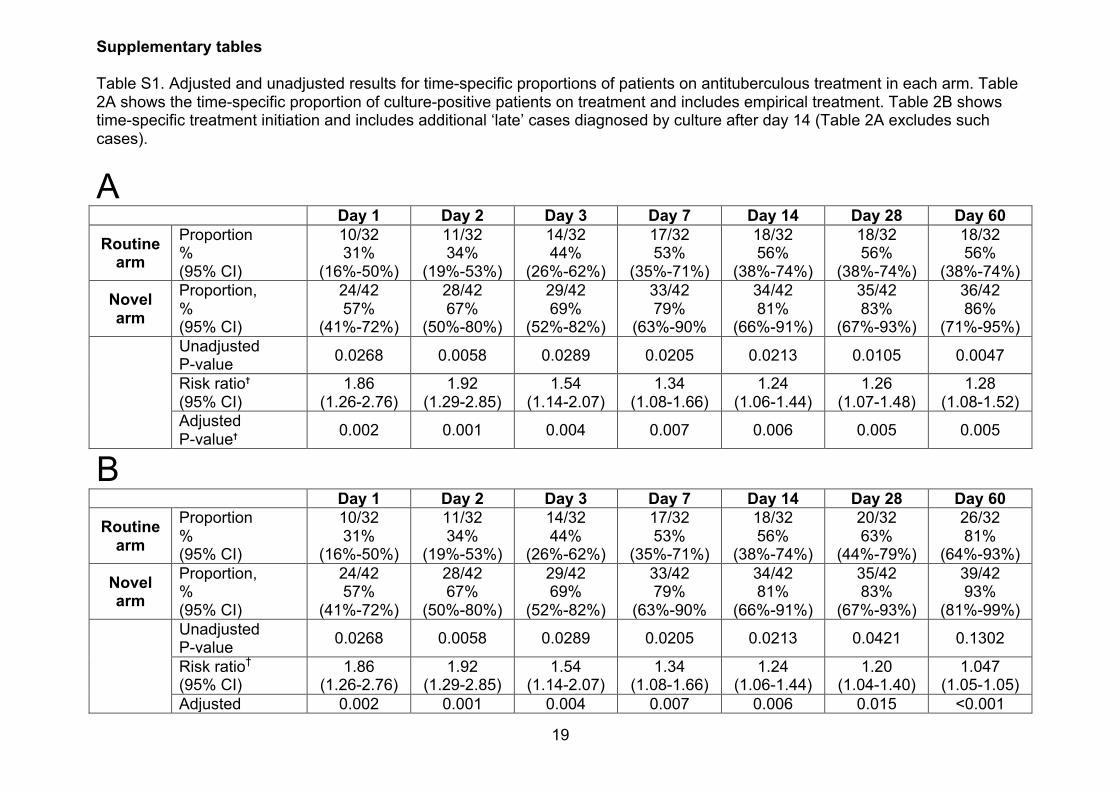
Supplementary tables Table S1. Adjusted and unadjusted results for time-specific proportions of patients on antituberculous treatment in each arm. Table 2A shows the time-specific proportion of culture-positive patients on treatment and includes empirical treatment. Table 2B shows time-specific treatment initiation and includes additional ‘late’ cases diagnosed by culture after day 14 (Table 2A excludes such cases).
A Day 1 Day 2 Day 3 Day 7 Day 14 Day 28 Day 60
Routine arm
Proportion % (95% CI)
10/32 31%
(16%-50%)
11/32 34%
(19%-53%)
14/32 44%
(26%-62%)
17/32 53%
(35%-71%)
18/32 56%
(38%-74%)
18/32 56%
(38%-74%)
18/32 56%
(38%-74%)
Novel arm
Proportion, % (95% CI)
24/42 57%
(41%-72%)
28/42 67%
(50%-80%)
29/42 69%
(52%-82%)
33/42 79%
(63%-90%
34/42 81%
(66%-91%)
35/42 83%
(67%-93%)
36/42 86%
(71%-95%) Unadjusted
P-value 0.0268 0.0058 0.0289 0.0205 0.0213 0.0105 0.0047
Risk ratio† (95% CI)
1.86 (1.26-2.76)
1.92 (1.29-2.85)
1.54 (1.14-2.07)
1.34 (1.08-1.66)
1.24 (1.06-1.44)
1.26 (1.07-1.48)
1.28 (1.08-1.52)
Adjusted P-value† 0.002 0.001 0.004 0.007 0.006 0.005 0.005
B Day 1 Day 2 Day 3 Day 7 Day 14 Day 28 Day 60
Routine arm
Proportion % (95% CI)
10/32 31%
(16%-50%)
11/32 34%
(19%-53%)
14/32 44%
(26%-62%)
17/32 53%
(35%-71%)
18/32 56%
(38%-74%)
20/32 63%
(44%-79%)
26/32 81%
(64%-93%)
Novel arm
Proportion, % (95% CI)
24/42 57%
(41%-72%)
28/42 67%
(50%-80%)
29/42 69%
(52%-82%)
33/42 79%
(63%-90%
34/42 81%
(66%-91%)
35/42 83%
(67%-93%)
39/42 93%
(81%-99%) Unadjusted
P-value 0.0268 0.0058 0.0289 0.0205 0.0213 0.0421 0.1302
Risk ratio† (95% CI)
1.86 (1.26-2.76)
1.92 (1.29-2.85)
1.54 (1.14-2.07)
1.34 (1.08-1.66)
1.24 (1.06-1.44)
1.20 (1.04-1.40)
1.047 (1.05-1.05)
Adjusted 0.002 0.001 0.004 0.007 0.006 0.015 <0.001
20
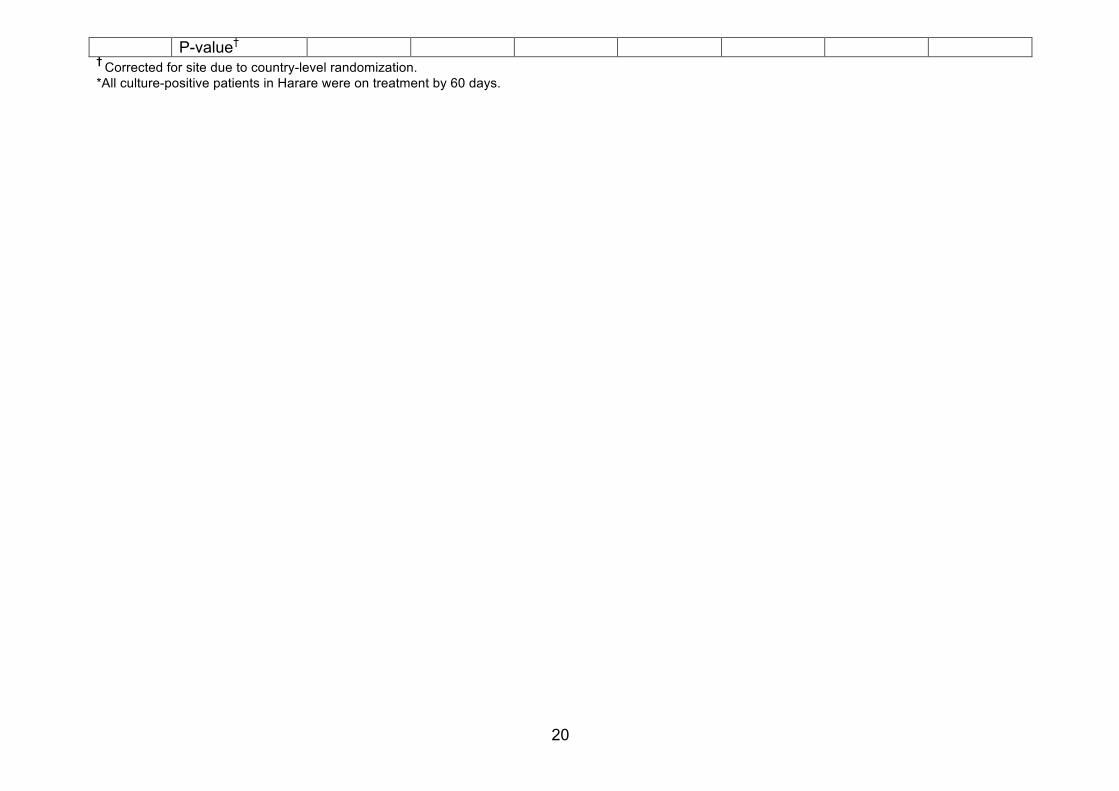
P-value† † Corrected for site due to country-level randomization. *All culture-positive patients in Harare were on treatment by 60 days.
21
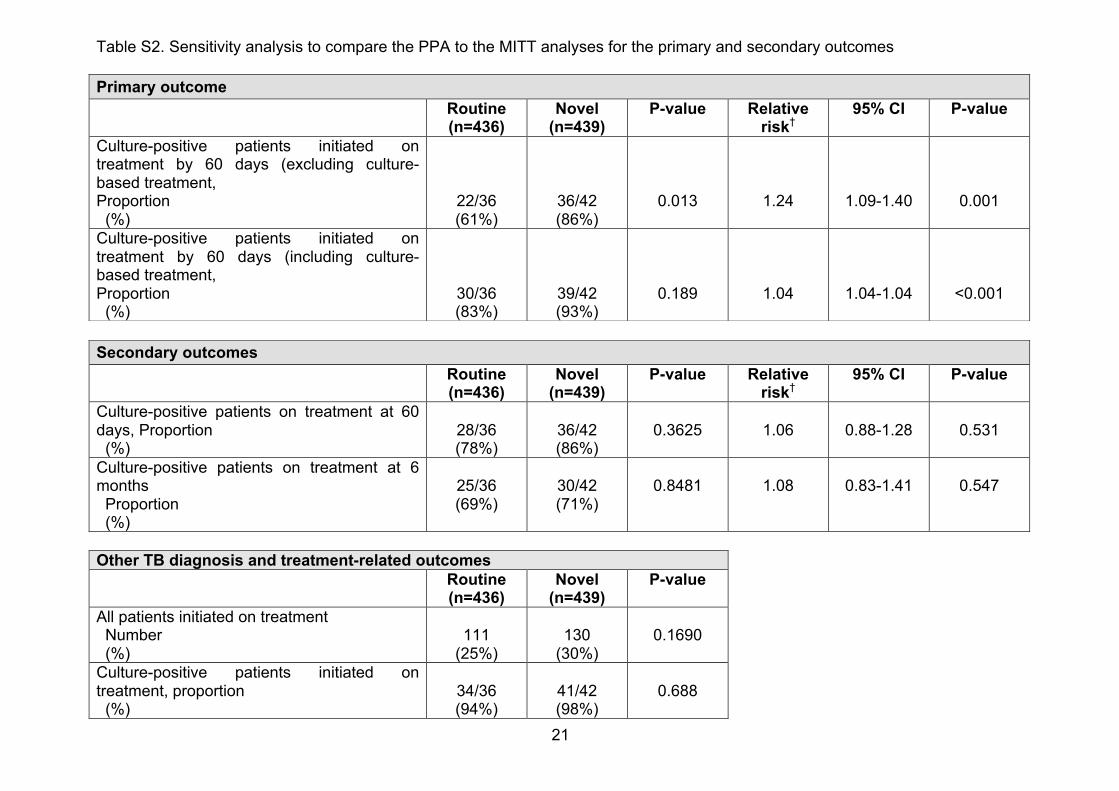
Table S2. Sensitivity analysis to compare the PPA to the MITT analyses for the primary and secondary outcomes
Other TB diagnosis and treatment-related outcomes Routine
(n=436) Novel
(n=439) P-value
All patients initiated on treatment Number (%)
111
(25%)
130
(30%)
0.1690
Culture-positive patients initiated on treatment, proportion (%)
34/36 (94%)
41/42 (98%)
0.688
Primary outcome Routine
(n=436) Novel
(n=439) P-value Relative
risk† 95% CI P-value
Culture-positive patients initiated on treatment by 60 days (excluding culture-based treatment, Proportion (%)
22/36 (61%)
36/42 (86%)
0.013
1.24
1.09-1.40
0.001
Culture-positive patients initiated on treatment by 60 days (including culture-based treatment, Proportion (%)
30/36 (83%)
39/42 (93%)
0.189
1.04
1.04-1.04
<0.001
Secondary outcomes Routine
(n=436) Novel
(n=439) P-value Relative
risk† 95% CI P-value
Culture-positive patients on treatment at 60 days, Proportion (%)
28/36 (78%)
36/42 (86%)
0.3625
1.06
0.88-1.28
0.531
Culture-positive patients on treatment at 6 months Proportion (%)
25/36 (69%)
30/42 (71%)
0.8481
1.08
0.83-1.41
0.547
22
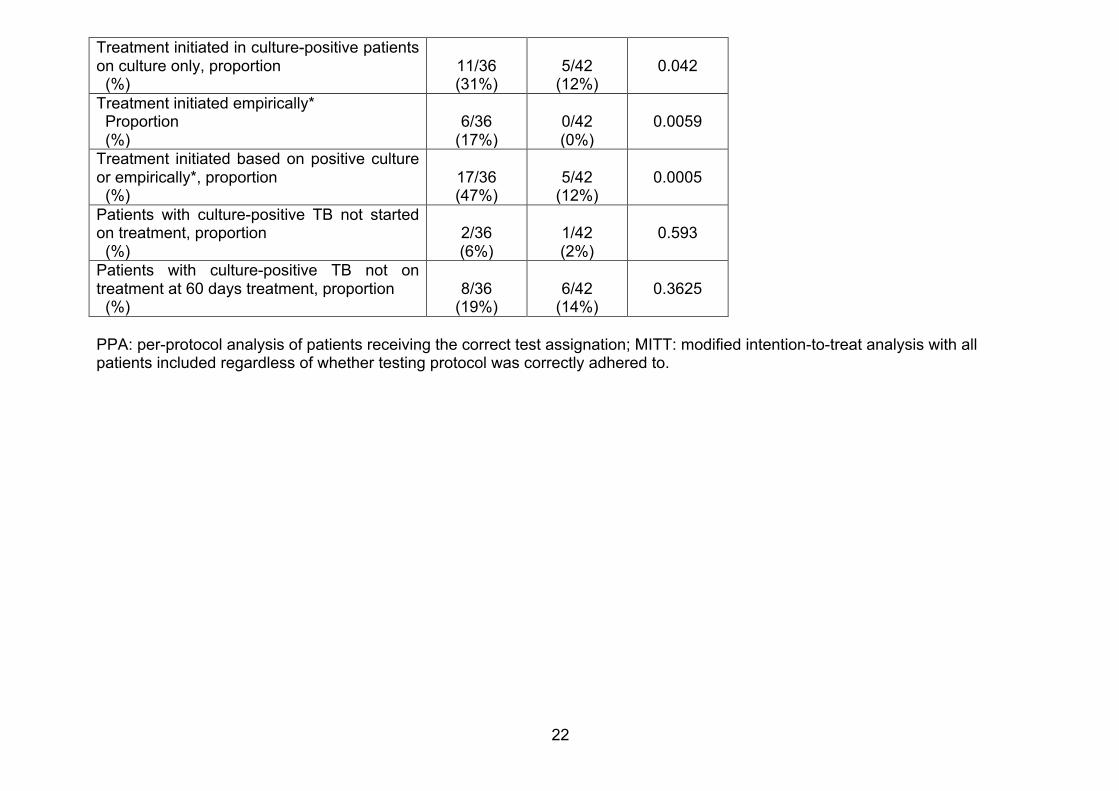
Treatment initiated in culture-positive patients on culture only, proportion (%)
11/36 (31%)
5/42
(12%)
0.042
Treatment initiated empirically* Proportion (%)
6/36
(17%)
0/42 (0%)
0.0059
Treatment initiated based on positive culture or empirically*, proportion (%)
17/36 (47%)
5/42
(12%)
0.0005
Patients with culture-positive TB not started on treatment, proportion (%)
2/36 (6%)
1/42 (2%)
0.593
Patients with culture-positive TB not on treatment at 60 days treatment, proportion (%)
8/36
(19%)
6/42
(14%)
0.3625
PPA: per-protocol analysis of patients receiving the correct test assignation; MITT: modified intention-to-treat analysis with all patients included regardless of whether testing protocol was correctly adhered to.
23
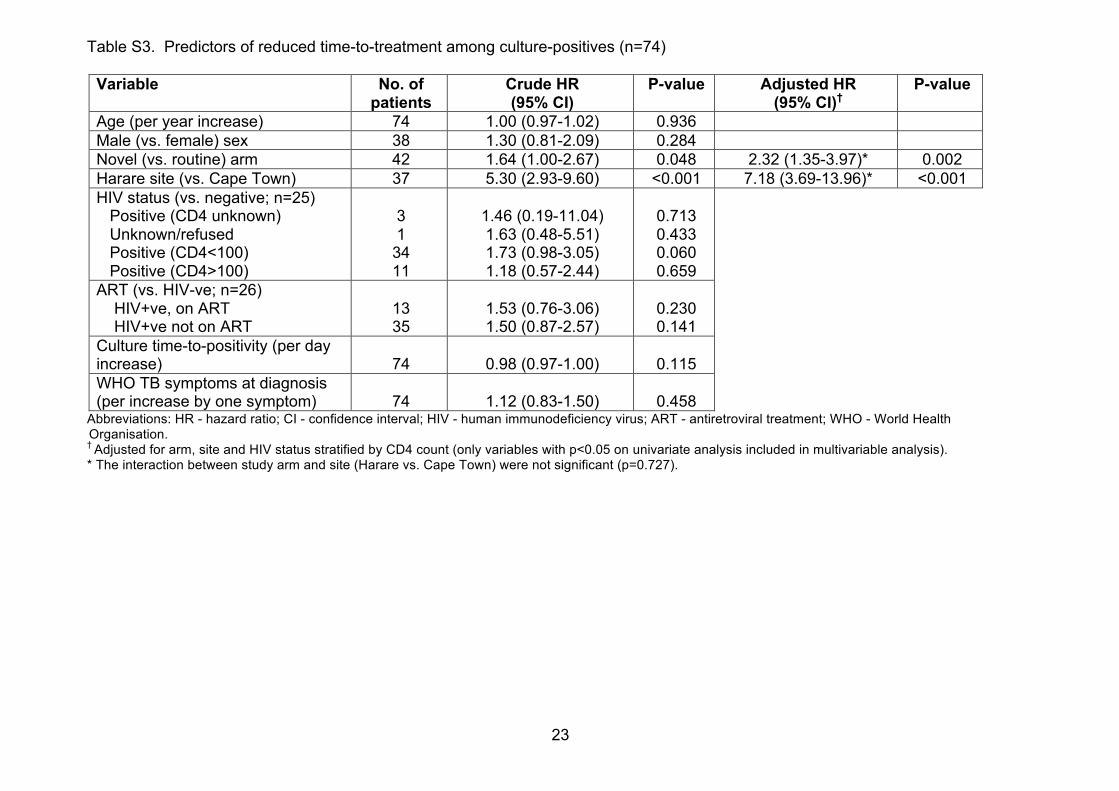
Table S3. Predictors of reduced time-to-treatment among culture-positives (n=74)
Variable No. of patients
Crude HR (95% CI)
P-value Adjusted HR (95% CI)†
P-value
Age (per year increase) 74 1.00 (0.97-1.02) 0.936 Male (vs. female) sex 38 1.30 (0.81-2.09) 0.284 Novel (vs. routine) arm 42 1.64 (1.00-2.67) 0.048 2.32 (1.35-3.97)* 0.002 Harare site (vs. Cape Town) 37 5.30 (2.93-9.60) <0.001 7.18 (3.69-13.96)* <0.001 HIV status (vs. negative; n=25) Positive (CD4 unknown) Unknown/refused Positive (CD4<100) Positive (CD4>100)
3 1
34 11
1.46 (0.19-11.04) 1.63 (0.48-5.51) 1.73 (0.98-3.05) 1.18 (0.57-2.44)
0.713 0.433 0.060 0.659
ART (vs. HIV-ve; n=26) HIV+ve, on ART HIV+ve not on ART
13 35
1.53 (0.76-3.06) 1.50 (0.87-2.57)
0.230 0.141
Culture time-to-positivity (per day increase)
74
0.98 (0.97-1.00)
0.115
WHO TB symptoms at diagnosis (per increase by one symptom)
74
1.12 (0.83-1.50)
0.458
Abbreviations: HR - hazard ratio; CI - confidence interval; HIV - human immunodeficiency virus; ART - antiretroviral treatment; WHO - World Health Organisation. † Adjusted for arm, site and HIV status stratified by CD4 count (only variables with p<0.05 on univariate analysis included in multivariable analysis). * The interaction between study arm and site (Harare vs. Cape Town) were not significant (p=0.727).
24
References 1. WHO. Systematic screening for active tuberculosis: principles and recommendations. 2013. http://www.who.int/tb/publications/Final_TB_Screening_guidelines.pdf (accessed 1st April 2015).
2. Getahun H, Kittikraisak W, Heilig CM, et al. Development of a standardized screening rule for tuberculosis in people living with HIV in resource-constrained settings: individual participant data meta-analysis of observational studies. PLoS medicine 2011; 8(1): e1000391.