Embed Size (px)
Citation preview
This PDF document was made available from www.rand.org as
a public service of the RAND Corporation.
6Jump down to document
Purchase this document
Browse Books & Publications
Make a charitable contribution
Visit RAND at www.rand.org
Explore RAND Arroyo Center
View document details
This document and trademark(s) contained herein are protected by law as indicated in a notice appearing later in this work. This electronic representation of RAND intellectual property is provided for non-commercial use only. Permission is required from RAND to reproduce, or reuse in another form, any of our research documents.
Limited Electronic Distribution Rights
For More Information
Support RAND
The RAND Corporation is a nonprofit research organization providing objective analysis and effective solutions that address the challenges facing the public and private sectors around the world.
CHILD POLICY
CIVIL JUSTICE
EDUCATION
ENERGY AND ENVIRONMENT
HEALTH AND HEALTH CARE
INTERNATIONAL AFFAIRS
NATIONAL SECURITY
POPULATION AND AGING
PUBLIC SAFETY
SCIENCE AND TECHNOLOGY
SUBSTANCE ABUSE
TERRORISM AND HOMELAND SECURITY
TRANSPORTATION ANDINFRASTRUCTURE

This product is part of the RAND Corporation monograph series. RAND
monographs present major research findings that address the challenges facing
the public and private sectors. All RAND monographs undergo rigorous peer
review to ensure high standards for research quality and objectivity.

Value Recovery from the Reverse Logistics Pipeline
David Diener
Eric Peltz
Art Lackey
Darlene J. Blake
Karthik Vaidyanathan
Prepared for the United States ArmyApproved for public release, distribution unlimited
The RAND Corporation is a nonprofit research organization providing objective analysis and effective solutions that address the challenges facing the public and private sectors around the world. RAND’s publications do not necessarily reflect the opinions of its research clients and sponsors.
R® is a registered trademark.
© Copyright 2004 RAND Corporation
All rights reserved. No part of this book may be reproduced in any form by any electronic or mechanical means (including photocopying, record-ing, or information storage and retrieval) without permission in writing from RAND.
Published 2004 by the RAND Corporation1776 Main Street, P.O. Box 2138, Santa Monica, CA 90407-2138
1200 South Hayes Street, Arlington, VA 22202-5050201 North Craig Street, Suite 202, Pittsburgh, PA 15213-1516
RAND URL: http://www.rand.org/To order RAND documents or to obtain additional information, contact
Distribution Services: Telephone: (310) 451-7002; Fax: (310) 451-6915; Email: [email protected]
Library of Congress Cataloging-in-Publication Data
Value recovery from the reverse logistics pipeline / David Diener ... [et al.]. p. cm. “MG-238.” Includes bibliographical references. ISBN 0-8330-3679-3 (pbk.) 1. United States. Army—Supplies and stores. 2. United States. Army—Inventory control. 3. Spare parts—United States—Inventories. I. Diener, David.
UC263.V35 2004 355.6'213—dc22
2004018461
The research described in this report was sponsored by the United States Army under Contract No. DASW01-01-C-0003.

iii
Preface
For the Army to transform into a more mobile force, the logistics footprint mustshrink with a greater reliance on “reach.” This includes the quick and effectiveevacuation of unserviceable items. In that future, parts that are repaired quickly (butnot in the battlespace) in support of a high-tempo operation may be an importantsource of supply to keep vehicles and equipment operationally ready. Longer-than-necessary process times for returning unserviceable components to available service-able stocks cause excess inventory to be held. Thus it is important to improve retro-grade and repair processes wherever practicable and possible, to eliminate unneces-sary delays and non-value-adding steps for the soldier.
This analysis has been conducted in support of the Deputy Chief of Staff, G-4,Headquarters Department of the Army (HQDA), Reverse Logistics Process ActionTeam (RLPAT) and the Combined Arms Support Command (CASCOM) Distribu-tion Management (DM) team. It should be of interest to logisticians throughout theArmy, especially those dealing with spare parts and maintenance. It should also be ofinterest to supply chain managers in the commercial world.
Under the sponsorship of G-4, HQDA, this research was conducted in RANDArroyo Center’s Military Logistics Program. RAND Arroyo Center, part of theRAND Corporation, is a federally funded research and development center spon-sored by the United States Army.

iv Value Recovery from the Reverse Logistics Pipeline
For more information on RAND Arroyo Center, contact the Director of Op-erations (telephone 310-393-0411, extension 6419; FAX 310-451-6952; [email protected]), or visit Arroyo’s web site at http://www.rand.org/ard/.
v
Contents
Preface......................................................................................... iiiFigures ........................................................................................viiTables ......................................................................................... ixSummary...................................................................................... xiAcknowledgments........................................................................... xviiAcronyms and Symbols ...................................................................... xix
CHAPTER ONE
Introduction...................................................................................1Motivation for Improving Reverse Logistics Flows............................................2
Improved Readiness .........................................................................3More Responsive Sustainment...............................................................3Less Inventory Investment...................................................................4
An Illustration of the Impact of Retrograde on Inventory Level ..............................4The Define-Measure-Improve Methodology ..................................................9
CHAPTER TWO
Defining the Reverse Logistics Process.................................................... 11Reverse Logistics in the Commercial Business World ....................................... 11Overview of Differences: Forward Versus Reverse, Commercial Versus Army.............. 12
Forecasting................................................................................. 12Transportation............................................................................. 12Quality, Routing, Disposition............................................................. 13Packaging .................................................................................. 14Pricing ..................................................................................... 14Speed....................................................................................... 14Costs ....................................................................................... 15Inventory Management.................................................................... 15Life Cycle, Negotiation, and Marketing................................................... 15Visibility ................................................................................... 16
vi Value Recovery from the Reverse Logistics Pipeline
From an Army Perspective................................................................... 16Turn-In Process............................................................................ 22Supply Support Activity (SSA) Processing ................................................ 23Transit Process............................................................................. 24Maintenance Processing ................................................................... 25
CHAPTER THREE
Measuring the Reverse Logistics Process.................................................. 27Data Processing Observations ............................................................... 27Overall Characteristics of the Army RL System ............................................. 28Collecting Data and Identifying Process Segments.......................................... 35Developing a Metric Format................................................................. 39Army-Wide RL Performance ................................................................ 41MACOM Performance on Key Segments ................................................... 45
Repaired Endpoint......................................................................... 47DRMO (Condemned) Endpoint.......................................................... 47Evacuated to AMC Depot Endpoint ...................................................... 48Customer Turn-In Segment............................................................... 48On-Post/In-Theater Transit Segments .................................................... 48Transit to Off-Post Centralized Repair Segment.......................................... 49Volume and Value of Reverse Pipeline for Unserviceable Reparables..................... 50Summary of Recommended Measurements............................................... 52
CHAPTER FOUR
Improving the Reverse Logistics Process.................................................. 55Streamline Installation Turn-In Procedures ................................................. 55Route and Hold Items with “Next Step” in Mind .......................................... 57Integrate Reverse Pipeline with Forward Pipeline ........................................... 57Examine Potential Applicability of Commercial Software Solutions ........................ 58Financial Incentives Should Be Consistent with Improvement Efforts ..................... 58Conclusion................................................................................... 59
APPENDIX
The Army’s Four-Level Maintenance System ............................................. 61
Bibliography ................................................................................. 63

vii
Figures
S.1. FSB Processing of Unserviceable Retrograde ........................................xii1.1. Value and Disposition of Army Unserviceable Reparables in FY00..................21.2. Slow Replenishment Time Produces High Recommended Inventory ...............51.3. Computed RO Quantities Are Not Always Affordable...............................61.4. Decreasing Reverse Pipeline Time Could Improve Satisfaction Rate ................71.5. Satisfaction Rate and CWT Both Improve as Reverse Pipeline Time
Decreases..............................................................................81.6. The D-M-I Methodology Leads to Continuous Improvement ......................92.1. Total Reverse Pipeline Depiction for the Army .................................... 172.2. Reverse Flows Have Three Local Endpoints........................................ 182.3. Individual Flows at Local Level Are Varied and Complex.......................... 192.4. RL Process for Unserviceable Reparables Can Be Generalized into Three
Levels................................................................................ 213.1. Different Organizational Levels Have Different Workloads and Endpoints ....... 293.2. Repairs and Condemnations by Organizational Level.............................. 303.3. Selected Weapon Systems Vary by Endpoints and Overall Value.................. 313.4. Value and Quantity of Items Repaired by Federal Supply Class ................... 323.5. High-Value/High-Volume Repairs at FSB, MSB, DOL/Theater .................. 333.6. High-Value/High-Volume Items Sent to DRMO ................................. 343.7. Value and Quantity of Items Sent to AMC Depots ................................ 353.8. High-Value/High-Volume FSCs Sent to AMC Depots............................ 363.9. CTASC Time Stamps and Document Identifier Codes Allow Measurement
of Time Segments................................................................... 373.10. Standard Metric Format for FSB-Level Processing ................................. 403.11. FSB Processing of Unserviceable Retrograde ....................................... 423.12. MSB Processing of Unserviceable Retrograde ...................................... 433.13. Theater/DOL Processing of Unserviceable Retrograde............................. 443.14. Total Time to Reach Endpoints by MACOM ..................................... 473.15. Value Recovery Process Begins with Customer Turn-In Segment ................. 493.16. Local Transit times Indicate Significant Delays .................................... 50
viii Value Recovery from the Reverse Logistics Pipeline
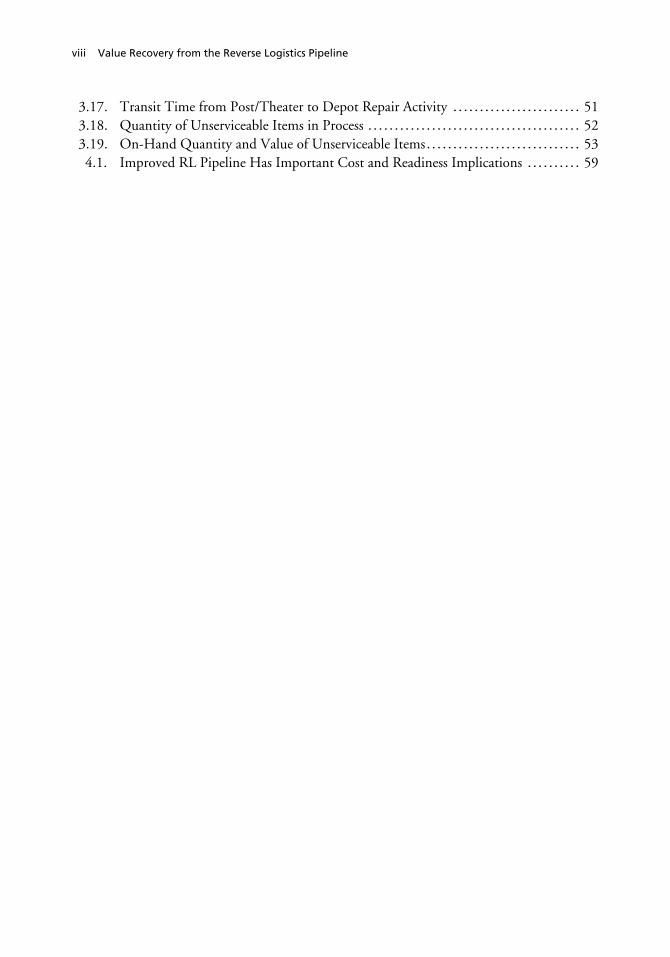
3.17. Transit Time from Post/Theater to Depot Repair Activity ........................ 513.18. Quantity of Unserviceable Items in Process ........................................ 523.19. On-Hand Quantity and Value of Unserviceable Items............................. 534.1. Improved RL Pipeline Has Important Cost and Readiness Implications .......... 59
ix
Tables
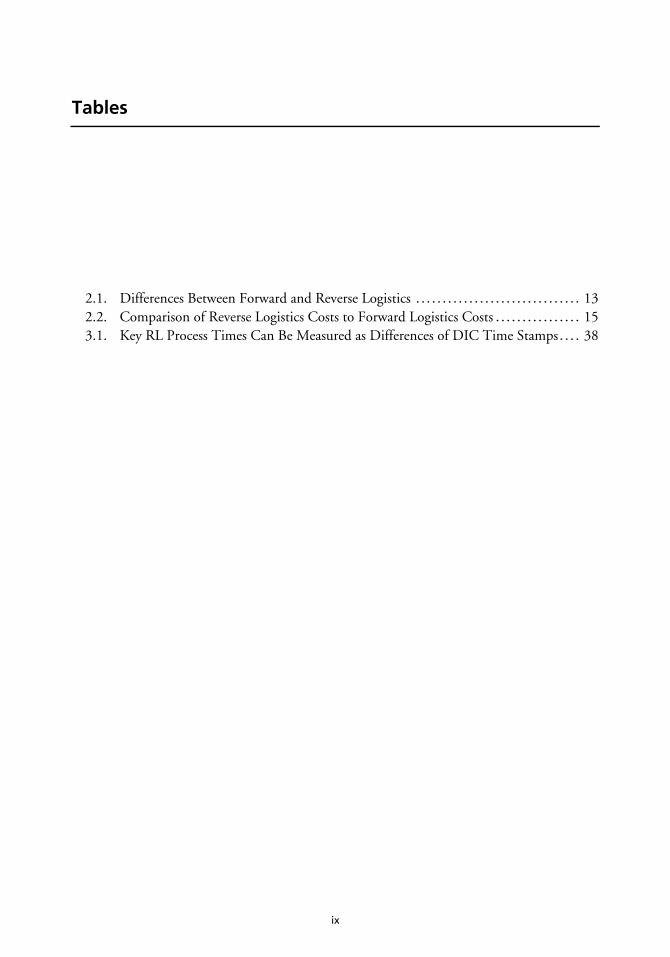
2.1. Differences Between Forward and Reverse Logistics ............................... 132.2. Comparison of Reverse Logistics Costs to Forward Logistics Costs................ 153.1. Key RL Process Times Can Be Measured as Differences of DIC Time Stamps.... 38

xi
Summary
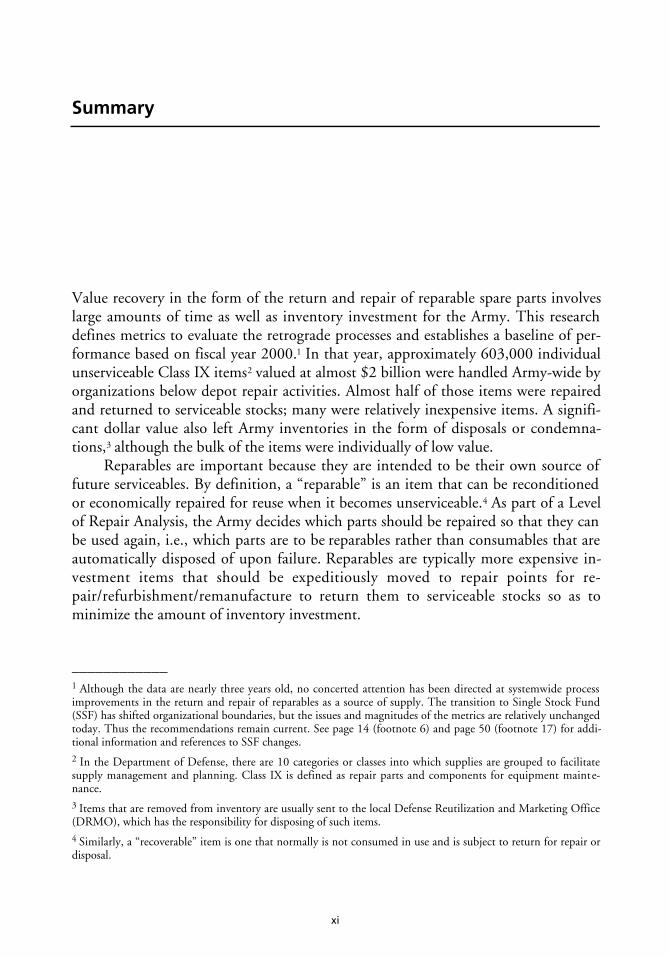
Value recovery in the form of the return and repair of reparable spare parts involveslarge amounts of time as well as inventory investment for the Army. This researchdefines metrics to evaluate the retrograde processes and establishes a baseline of per-formance based on fiscal year 2000.1 In that year, approximately 603,000 individualunserviceable Class IX items2 valued at almost $2 billion were handled Army-wide byorganizations below depot repair activities. Almost half of those items were repairedand returned to serviceable stocks; many were relatively inexpensive items. A signifi-cant dollar value also left Army inventories in the form of disposals or condemna-tions,3 although the bulk of the items were individually of low value.
Reparables are important because they are intended to be their own source offuture serviceables. By definition, a “reparable” is an item that can be reconditionedor economically repaired for reuse when it becomes unserviceable.4 As part of a Levelof Repair Analysis, the Army decides which parts should be repaired so that they canbe used again, i.e., which parts are to be reparables rather than consumables that areautomatically disposed of upon failure. Reparables are typically more expensive in-vestment items that should be expeditiously moved to repair points for re-pair/refurbishment/remanufacture to return them to serviceable stocks so as tominimize the amount of inventory investment.
____________1 Although the data are nearly three years old, no concerted attention has been directed at systemwide processimprovements in the return and repair of reparables as a source of supply. The transition to Single Stock Fund(SSF) has shifted organizational boundaries, but the issues and magnitudes of the metrics are relatively unchangedtoday. Thus the recommendations remain current. See page 14 (footnote 6) and page 50 (footnote 17) for addi-tional information and references to SSF changes.2 In the Department of Defense, there are 10 categories or classes into which supplies are grouped to facilitatesupply management and planning. Class IX is defined as repair parts and components for equipment mainte-nance.3 Items that are removed from inventory are usually sent to the local Defense Reutilization and Marketing Office(DRMO), which has the responsibility for disposing of such items.4 Similarly, a “recoverable” item is one that normally is not consumed in use and is subject to return for repair ordisposal.

xii Value Recovery from the Reverse Logistics Pipeline
Defining and Measuring the Reverse Logistics Process
Using fiscal year 2000 (FY00) as a baseline, we define the processes of recoveringvalue from an unserviceable Class IX reparable—from turn-in by a soldier until it isrepaired, condemned and disposed of, or evacuated to a higher echelon of repair.From the process definitions, metrics are calculated at three levels of activity: (a) for-ward support battalion (FSB), (b) main support battalion (MSB) and aviation sup-port battalion (ASB), and (c) Director of Logistics (DOL) and theater-level repairactivities. As an example, Figure S.1 depicts segment metrics for overall Army per-formance at the FSB level. Segment 1 (circled numbers on the figure depict seg-ments) starts when an unserviceable item has been removed and replaced by a serv-iceable one and is then turned in by a mechanic to the supply system, starting theretrograde process. Once entered into the supply system, the unserviceable item thenmoves through a series of actions until it reaches final disposition: repair in the field,disposal, or unserviceable stock awaiting induction into a national source of repair.Depicted for each segment are the median, 75th percentile, 95th percentile, and
Figure S.1FSB Processing of Unserviceable Retrograde
RAND MG238-S.1
FSB to MSBEvacuateDRMORepairedUnit to FSB FSB to DOL
110
70
60
50
40
30
20
10
120
0
Day
s
80
100
90 95th percentile75th percentile50th percentileMean
Unserviceable Class IXCTASC/FY00
FSB
1
2
3
Unit toFSB
Repaired
Condemned andsent to DRMO
Evacuate4To DOL/theater
To MSB5
6
54321 6
122
Summary xiii
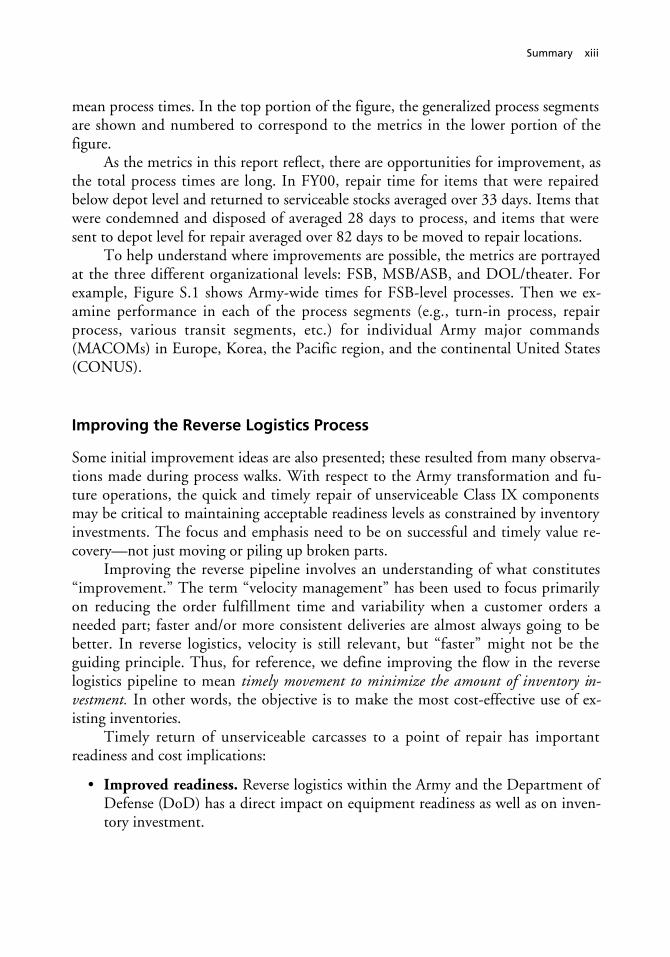
mean process times. In the top portion of the figure, the generalized process segmentsare shown and numbered to correspond to the metrics in the lower portion of thefigure.
As the metrics in this report reflect, there are opportunities for improvement, asthe total process times are long. In FY00, repair time for items that were repairedbelow depot level and returned to serviceable stocks averaged over 33 days. Items thatwere condemned and disposed of averaged 28 days to process, and items that weresent to depot level for repair averaged over 82 days to be moved to repair locations.
To help understand where improvements are possible, the metrics are portrayedat the three different organizational levels: FSB, MSB/ASB, and DOL/theater. Forexample, Figure S.1 shows Army-wide times for FSB-level processes. Then we ex-amine performance in each of the process segments (e.g., turn-in process, repairprocess, various transit segments, etc.) for individual Army major commands(MACOMs) in Europe, Korea, the Pacific region, and the continental United States(CONUS).
Improving the Reverse Logistics Process
Some initial improvement ideas are also presented; these resulted from many observa-tions made during process walks. With respect to the Army transformation and fu-ture operations, the quick and timely repair of unserviceable Class IX componentsmay be critical to maintaining acceptable readiness levels as constrained by inventoryinvestments. The focus and emphasis need to be on successful and timely value re-covery—not just moving or piling up broken parts.
Improving the reverse pipeline involves an understanding of what constitutes“improvement.” The term “velocity management” has been used to focus primarilyon reducing the order fulfillment time and variability when a customer orders aneeded part; faster and/or more consistent deliveries are almost always going to bebetter. In reverse logistics, velocity is still relevant, but “faster” might not be theguiding principle. Thus, for reference, we define improving the flow in the reverselogistics pipeline to mean timely movement to minimize the amount of inventory in-vestment. In other words, the objective is to make the most cost-effective use of ex-isting inventories.
Timely return of unserviceable carcasses to a point of repair has importantreadiness and cost implications:
• Improved readiness. Reverse logistics within the Army and the Department ofDefense (DoD) has a direct impact on equipment readiness as well as on inven-tory investment.
xiv Value Recovery from the Reverse Logistics Pipeline
The “transformed” Army will have a significantly smaller logistics foot-print—especially when deployed. The evacuation of unserviceable reparables toa repair point will be important to expeditiously return key repair parts to serv-iceable condition in order to make them available to deployed soldiers.
• More responsive sustainment. With timely movement and collection of un-serviceable parts at centralized repair points, there is less chance of interruptingrepair flow because of a shortage of carcasses, i.e., unserviceable items that canbe repaired.
A primary measure of supply chain effectiveness in DoD and in the Army is cus-tomer wait time (CWT), or how long the soldier customer has to wait until aneeded part is delivered. The CWT metric links directly to how well the reverselogistics processes function—longer CWT can result in reduced readiness aswell as higher supply and maintenance costs. Reverse logistics process perform-ance, as it affects replenishment wait time (RWT), also drives inventory invest-ment.
• Less inventory investment. If the “return to serviceable” time is shortened,more turnover of reparable assets is realized, and fewer are needed.
• Better visibility and less overall clutter within the system can result if un-serviceables are moved expeditiously and consolidated at known locations. ItemManagers (IM) can manage their reparable inventories with more precision andbe more responsive to unexpected demands. This could be especially importantfor legacy and Army-unique systems for which there is no longer any manufac-turing or commercial support; components and piece parts often have to be sal-vaged from unserviceable stocks with unknown or inconsistent washout rates.
• Savings in transportation costs are possible if forward and reverse pipelinescan be integrated and synchronized from a system perspective versus treatingindividual items independently.
• Financial incentives such as credit policies, transportation fee structures, sur-charges, etc. must necessarily align with and support decisions to improve theflow of unserviceable reparables to an endpoint.
Conclusion
Responsive repair capability plus timely and deliberate throughput are the keys toimproved retrograde flows within the reverse logistics process. A broad range of ac-tivities needs to be examined, understood, and improved—beginning with timelyturn-ins of unserviceable Class IX reparables, to redistribution of serviceable retro-grade, to physical movement of retrograde, to in-transit visibility, and ultimately in-cluding the places of value recovery—repair shops and depots.

Summary xv
The Army should seek to integrate systems between levels—between forwardand reverse processes and between organizations. Ultimately the focus needs to be onthe soldier with equipment that needs to be supported—reverse logistics may be whathe/she depends on for valuable and scarce replacement parts to support a fast-movingoperation.


xvii
Acknowledgments
The authors wish to thank a number of people who had a hand in supporting thisresearch. We thank Mr. Thomas Edwards, Deputy to the Commanding General ofthe Combined Arms Support Command (CASCOM), for his interest and initialguidance and his push in raising this as a significant issue that the Army needs to ad-dress. Once the project was begun, Ms. Sharon Dunfrund and Mr. Les Stern, SupplyChain Integration Office, Sustainment Directorate, Deputy Chief of Staff, G-4 (Lo-gistics), HQDA, were significant contributors and facilitators of this work as leadersof the Reverse Logistics Process Action Team (RLPAT).
Mr. Robert Banks, USAREUR 21st TSC Support Operations, was a major con-tributor in his depictions and descriptions of the various segments making up thereverse logistics flows. His help, along with that of CW5 Bill Hendry of HQUSAREUR, was also invaluable in planning and coordinating several process walk-throughs in USAREUR.
Fort Hood personnel greatly facilitated understanding through their support ofa detailed walk-through of many units in developing our “by-RIC” approach to themetrics.
Fort Campbell hosted several walk-throughs of its supply and maintenanceunits; this helped clarify the issues that soldiers deal with in handling returns. At FortCarson, Mr. Robert Miller, AMC-Installation Maintenance Representative, NationalMaintenance Management Program, was a great help in discussing packaging/cratingissues that affect the return of unserviceable items.
We also appreciate the help of Mr. Stephen Tesh and Mr. James Newell ofLOGSA in supporting data needs from the Materiel Returns Data Base (MRDB).Mr. Jeff Fee of LIA also helped immensely by arranging for a data feed of RFID datathat will be incorporated in follow-on analysis.
We benefited from discussion with Jim Kipers and Ray McCoy at the ArmyMaintenance Summit during discussions of retrograde within the context of ArmyMaintenance Transformation. Dr. Dale Rogers, University of Nevada-Reno, per-formed a technical review that added clarity and precision to the final paper. His in-

xviii Value Recovery from the Reverse Logistics Pipeline
sights were valuable as a subject matter expert in reverse logistics in the commercialsector.
At RAND we’d like to thank our colleagues who provided ideas to improve theanalysis as well as improvement insights. Ken Girardini developed the initial conceptfor using CTASC data to track Army retrograde flows, and he worked with MarkTotten to apply the concept to measure retrograde between customers and FSBs.Mark’s initial programming served as the basis for the development of the logic andprograms to measure retrograde flows. Thanks to John Dumond and Rick Eden foreditorial and analysis insights. Thanks to John Folkeson for his review and contribu-tions to our process improvement ideas. We also wish to thank Mel Wolff for his ad-vice and credibility checks, and his clarifications on maintenance processes. MarcRobbins improved the quality and clarity of the report with valuable insights. NikkiShacklett improved the report with her thorough edit. Pamela Thompson and SaritaAnderson provided valuable help in preparing the document.

xix
Acronyms and Symbols
A5A/A51 Materiel Release Order with NSN
A5J Materiel Release Order – Shipment to DRMO
AMC Army Materiel Command
AMDF Army Master Data File
ASB Aviation Support Battalion
ASL Authorized Stockage Level
AWCF Army Working Capital Fund
CASCOM Combined Arms Support Command
Condition Code A Serviceable
Condition Code F Unserviceable-repairable
Condition Code H Unserviceable-condemned
CONUS Continental United States
CTASC Corps Theatre Automatic [data processing] Service Center
CWT Customer Wait time
D6A Materiel Receipt – Returns
D6K Materiel Receipt – Relocation of assets (from referrals/redistribution)
D6M Materiel Receipt – Returns from testing/repair
DA Department of the Army
DIC Document Identifier Code
DLA Defense Logistics Agency
D-M-I Define-Measure-Improve
DoD Department of Defense

xx Value Recovery from the Reverse Logistics Pipeline
DOL Director of Logistics
DRMO Defense Reutilization and Marketing Office
DS Direct Support
EUSA Eighth U.S. Army (Korea)
FORSCOM Forces Command (CONUS)
FSB Forward Support Battalion
FTM Materiel Returns Shipment Status
FTZ Materiel Receipt Status – From Inventory Control Point toCustomer
FY Fiscal Year
GS General Support
MACOM Major Command
MRO Materiel Release Order
MSB Main Support Battalion
NIIN National Item Identification Number
NSN National Stock Number
OCONUS Outside Continental United States
RF Radio Frequency
RFID Radio Frequency Identification Devices
RIC Routing Identifier Code
RL Reverse Logistics
RO Requisitioning Objective
ROP Reorder Point
RWT Replenishment Wait Time
SAMS Standard Army Maintenance System
SARSS Standard Army Retail Supply System
SDP Strategic Distribution Platform
SOR Source of Repair
SORTS Status of Resources and Training System
SSA Supply Support Activity
Acronyms and Symbols xxi
SSF Single Stock Fund
TMDE Test, Measurement, and Diagnostic Equipment
TRADOC Training and Doctrine Command
ULLS Unit Level Logistics System
USAREUR U.S. Army Europe
USARPAC U.S. Army Pacific
VM Velocity Management
XML Maintenance Work Order created

1
CHAPTER ONE
Introduction
The Reverse Logistics Executive Council defines reverse logistics as “the process ofplanning, implementing, and controlling the efficient, cost-effective flow of raw ma-terials, in-process inventory, finished goods, and related information from the pointof consumption to the point of origin for the purpose of recapturing value or properdisposal.”1
Value recovery is an important focus of the Army reverse logistics (RL) pipeline,since component repair is the primary source of inventory replenishment for manyexpensive Army spare parts or secondary items. “Reparables” are important becausethey are intended to be their own source of future serviceable components. By defini-tion, a “reparable” is an item that can be reconditioned or economically repaired forreuse when it becomes unserviceable. As part of a Level of Repair Analysis (LORA),the Army decides which parts should be repaired so that they can be used again (i.e.,reparables) and which should be thrown away upon failure and replaced with a newpart (i.e., consumables).2 As such, reparables are typically expensive investment itemsthat should be expeditiously moved to repair points for repair/refurbishment/remanufacture to return them to serviceable stocks so as to minimize the amount ofinventory investment.
In FY00, approximately 603,000 unserviceable reparable items conservativelyvalued at over $1.9 billion flowed through the Army’s reverse pipeline,3 not countingthe induction of unserviceable assets already in depot inventory to depot-level repairactivities. As shown in Figure 1.1, these items had three primary dispositions: some
____________1 Dr. Dale S. Rogers and Dr. Ronald S. Tibben-Lembke, Going Backwards: Reverse Logistics Trends and Practices,Reverse Logistics Executive Council, 1999, p. 2.2 The LORA is a two-stage process that considers both noneconomic and economic factors. Noneconomic fac-tors include the design of the item/component, the feasibility of repair, the feasibility of a remove-and-replacerepair strategy, the number and type of lower-level subassemblies, etc. The economic analysis considers the vari-ous elements that drive support cost, such as manpower, support equipment, training, transportation, and inven-tory costs. The goal is an optimized maintenance philosophy.3 In comparison, the forward pipeline (no backorders) of Class IX parts for active Army Major Commands in-volved about 3 million requisitions valued at $1.5 billion during this time period. The mean value of requisi-tioned items was $516, with 75 percent of them valued at less than $115 each.

2 Value Recovery from the Reverse Logistics Pipeline
were repaired locally to be used again, some were disposed of as no longer useable orneeded, and some were passed on to Army Materiel Command (AMC) depots forfuture refurbishment or remanufacturing.
Motivation for Improving Reverse Logistics Flows
The Army’s Distribution Management (DM, formerly velocity management) initia-tive employs a structured Define-Measure-Improve (D-M-I) approach to improveprocesses. The most successful efforts under DM have focused on reducing the time acustomer must wait for a needed part to be delivered through the forward logisticspipeline (i.e., customer wait time or CWT). In reverse logistics, velocity and consis-tency are still relevant, but “faster” might not be the guiding principle. Thus, for ref-erence, we define improving the flow in the RL pipeline to mean timely movement tominimize the amount of inventory investment.4 In other words, the objective is to makethe most cost-effective use of existing inventories.
Timely return of unserviceable carcasses to a point of repair has importantreadiness and cost implications.
Figure 1.1Value and Disposition of Army Unserviceable Reparables in FY00
To depot repair
25% by quantity(148,000)
Repaired locally
16% by quantity(97,600)
Condemned
59% by quantity(357,300)
RAND MG238-1.1
$791.3M42% $915.6M
48%
$193.8M10%
Unserviceablereparables datasource: CTASC/FY00
____________4 This is not to imply that time is the only dimension where improvement efforts should be focused; there arealso quality and cost implications for reverse as well as forward flows. However, as there are data to support themeasurement of this aspect of the improvement effort, we begin with time as a focus.
Introduction 3
Improved Readiness
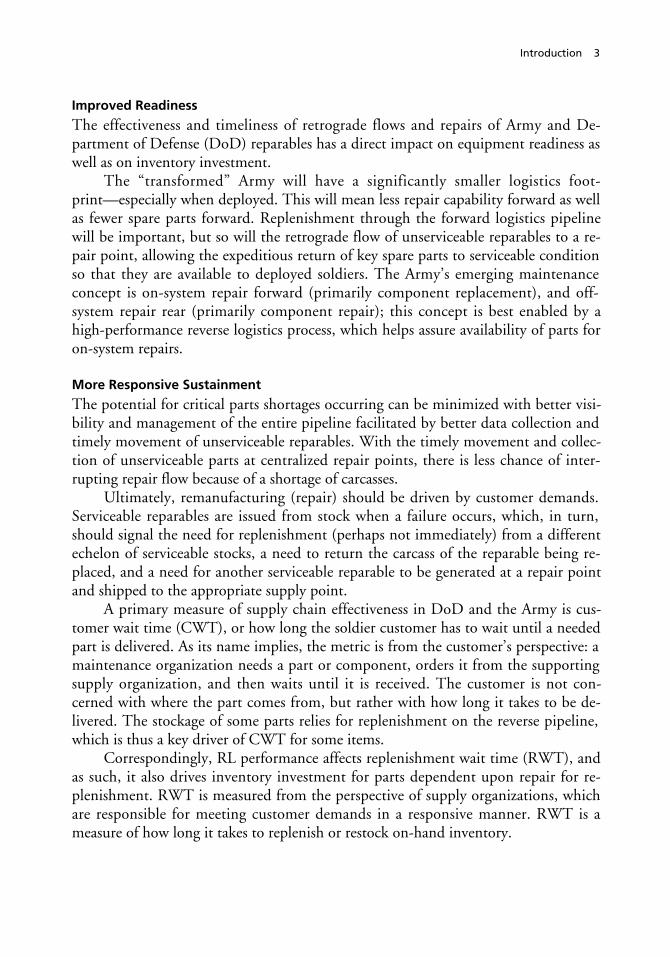
The effectiveness and timeliness of retrograde flows and repairs of Army and De-partment of Defense (DoD) reparables has a direct impact on equipment readiness aswell as on inventory investment.
The “transformed” Army will have a significantly smaller logistics foot-print—especially when deployed. This will mean less repair capability forward as wellas fewer spare parts forward. Replenishment through the forward logistics pipelinewill be important, but so will the retrograde flow of unserviceable reparables to a re-pair point, allowing the expeditious return of key spare parts to serviceable conditionso that they are available to deployed soldiers. The Army’s emerging maintenanceconcept is on-system repair forward (primarily component replacement), and off-system repair rear (primarily component repair); this concept is best enabled by ahigh-performance reverse logistics process, which helps assure availability of parts foron-system repairs.
More Responsive Sustainment
The potential for critical parts shortages occurring can be minimized with better visi-bility and management of the entire pipeline facilitated by better data collection andtimely movement of unserviceable reparables. With the timely movement and collec-tion of unserviceable parts at centralized repair points, there is less chance of inter-rupting repair flow because of a shortage of carcasses.
Ultimately, remanufacturing (repair) should be driven by customer demands.Serviceable reparables are issued from stock when a failure occurs, which, in turn,should signal the need for replenishment (perhaps not immediately) from a differentechelon of serviceable stocks, a need to return the carcass of the reparable being re-placed, and a need for another serviceable reparable to be generated at a repair pointand shipped to the appropriate supply point.
A primary measure of supply chain effectiveness in DoD and the Army is cus-tomer wait time (CWT), or how long the soldier customer has to wait until a neededpart is delivered. As its name implies, the metric is from the customer’s perspective: amaintenance organization needs a part or component, orders it from the supportingsupply organization, and then waits until it is received. The customer is not con-cerned with where the part comes from, but rather with how long it takes to be de-livered. The stockage of some parts relies for replenishment on the reverse pipeline,which is thus a key driver of CWT for some items.
Correspondingly, RL performance affects replenishment wait time (RWT), andas such, it also drives inventory investment for parts dependent upon repair for re-plenishment. RWT is measured from the perspective of supply organizations, whichare responsible for meeting customer demands in a responsive manner. RWT is ameasure of how long it takes to replenish or restock on-hand inventory.

4 Value Recovery from the Reverse Logistics Pipeline
Less Inventory Investment
If the “return to serviceable” time is shortened, more turnover of reparable assets isrealized, and fewer are needed. This is significant from several different perspectives.
• Total investment dollars, where individual items such as turbine engines for anM1 tank cost around $500,000 each, can be significantly affected by a reduc-tion of even a relatively small quantity in stockage levels. Less inventory needsto be stocked “just in case” because of long RL pipeline times, which over timeand for new part numbers reduces the quantity that must be purchased. Ashorter RL pipeline equates to less inventory investment because the same set ofreparables is used more often, i.e., turnover increases.
• There is less likelihood of damage and deterioration as fewer items are “stalled”or “lost” in the pipeline. There is a reduced chance that items will incur furtherdamage from handling and/or insufficient packaging and protection. Also, be-cause such damage can occur, delays can lead to the need to reinspect and reas-sess the condition of items, since the original assessment may no longer be valid.So additional (duplicative) costs can be incurred.
An Illustration of the Impact of Retrograde on Inventory Level
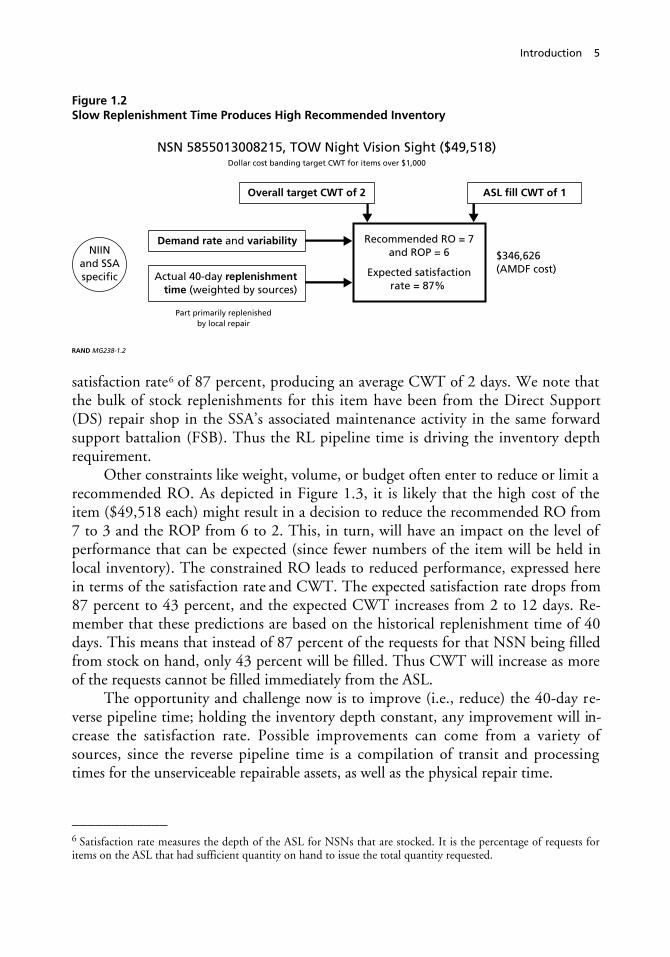
What and how much is stocked in local inventories is computed using various algo-rithms. Dollar cost banding is the recommended approach in the Army today.5 Oncethe dollar cost banding methodology recommends a particular part by NationalStock Number (NSN) for stockage, the recommended depth is computed to providea target service level expressed in terms of average CWT for that NSN for customersof that Supply Support Activity (SSA). The average CWT is a weighted average ofthe CWT for immediate fills from the supporting SSA and the CWT for all othersources of supply. In an example illustrated in Figure 1.2, given the NSN’s demandrate and variability, an authorized stockage level (ASL) fill CWT of 1 day, historicalCWTs from all other sources of supply, and a historical 40-day replenishment time,it was determined that to achieve a target CWT of 2 days or better, the reorder point(ROP) should be 6 parts in stock and the requisitioning objective (RO) should be aquantity of 7 with an investment value of $346,626. This is expected to result in a
____________5 Dollar cost banding expands the breadth of deployable inventories by enabling more critical small and inexpen-sive parts to meet the Army’s stockage criteria. The algorithm also uses customer service level goals that vary de-pending on the unit price of the item to set depth. Recommended stock levels are computed through iterativesimulations against two years of actual demand history. Further details of dollar cost banding can be found inKenneth Girardini et al., Dollar Cost Banding: A New Algorithm for Computing Inventory Levels for Army SSAs,Santa Monica, CA: RAND Corporation, MG-128-A, 2004.
Introduction 5
Figure 1.2Slow Replenishment Time Produces High Recommended Inventory
NSN 5855013008215, TOW Night Vision Sight ($49,518)Dollar cost banding target CWT for items over $1,000
Part primarily replenishedby local repair
RAND MG238-1.2
Demand rate and variability
Overall target CWT of 2 ASL fill CWT of 1
Actual 40-day replenishmenttime (weighted by sources)
$346,626(AMDF cost)Expected satisfaction
rate = 87%
Recommended RO = 7and ROP = 6NIIN
and SSAspecific
satisfaction rate6 of 87 percent, producing an average CWT of 2 days. We note thatthe bulk of stock replenishments for this item have been from the Direct Support(DS) repair shop in the SSA’s associated maintenance activity in the same forwardsupport battalion (FSB). Thus the RL pipeline time is driving the inventory depthrequirement.
Other constraints like weight, volume, or budget often enter to reduce or limit arecommended RO. As depicted in Figure 1.3, it is likely that the high cost of theitem ($49,518 each) might result in a decision to reduce the recommended RO from7 to 3 and the ROP from 6 to 2. This, in turn, will have an impact on the level ofperformance that can be expected (since fewer numbers of the item will be held inlocal inventory). The constrained RO leads to reduced performance, expressed herein terms of the satisfaction rate and CWT. The expected satisfaction rate drops from87 percent to 43 percent, and the expected CWT increases from 2 to 12 days. Re-member that these predictions are based on the historical replenishment time of 40days. This means that instead of 87 percent of the requests for that NSN being filledfrom stock on hand, only 43 percent will be filled. Thus CWT will increase as moreof the requests cannot be filled immediately from the ASL.
The opportunity and challenge now is to improve (i.e., reduce) the 40-day re-verse pipeline time; holding the inventory depth constant, any improvement will in-crease the satisfaction rate. Possible improvements can come from a variety ofsources, since the reverse pipeline time is a compilation of transit and processingtimes for the unserviceable repairable assets, as well as the physical repair time.
____________6 Satisfaction rate measures the depth of the ASL for NSNs that are stocked. It is the percentage of requests foritems on the ASL that had sufficient quantity on hand to issue the total quantity requested.

6 Value Recovery from the Reverse Logistics Pipeline
Figure 1.3Computed RO Quantities Are Not Always Affordable
NSN 5855013008215, TOW Night Vision Sight ($49,518)Dollar cost banding target CWT for items over $1,000
RAND MG238-1.3
Demand rate and variability
Overall target CWT of 2 ASL fill CWT of 1
Impact of lower RO
Constraints: money, mobility, etc.
Actual 40-day replenishmenttime (weighted by sources)
$346,626(AMDF cost)Expected satisfaction
rate = 87%
Recommended RO = 7and ROP = 6
$148,554(AMDF cost)
Constrained RO = 3and ROP = 2
CWT=12 days(instead of 2)
Revised lower expectedsatisfaction rate of 43%
NIINand SSAspecific
As continued in Figure 1.4, given the budget-constrained RO of 3, we canachieve a satisfaction rate of 87 percent if we can shorten the RL process to 12 days,i.e., some combination of reductions in transit, processing, and/or repair time. Thisresulting satisfaction rate would be the same as what we expected with the recom-mended RO of 7 and expected 40-day replenishment time. So there is a tradeoff forreparable stock: reduced RL times versus increased inventory levels/worse customersupport.7
Next, in Figure 1.5 we add in the CWT line and see that a decrease in reversepipeline days from 40 to 12 results in a CWT of 2 days, which was the original tar-get.
Note that reducing the time to repair in this example by 28 days results in asavings of 4 items, negating the need for an additional $198,000 in inventory in-vestment, or the expected CWT is 10 days shorter, with fewer purchases from higherechelons of supply. The reduction in reverse pipeline days is predicated on a success-ful repair—with total time a combination of transit, processing, and repair times.
To summarize this example, we started with a target CWT of 2, which requiredan RO of 7; this in turn would yield an expected satisfaction rate of 87 percent. But
____________7 The other option is to rely not on local repair for replenishment but rather on wholesale inventory, which in-stead would rely on depot-level repair. This would buffer retail inventory against a slow, unreliable RL pipeline.

Introduction 7
Figure 1.4Decreasing Reverse Pipeline Time Could Improve Satisfaction Rate
RAND MG238-1.4
0 45403530252010 125
Reverse pipeline days for successful repairs (Doc date to D6M)
90
70
60
50
40
30
20
10
100
0
Sati
sfac
tio
n r
ate
(%)
80
15
NSN 5855013008215, Night Vision Sight ($49,518), SSA X
RO = 3
87%
43%
we couldn’t afford 7 items, so the RO was reduced to 3. To reach the same perform-ance level for the RO of 7, we need to reduce RL days to 12. This is motivation toexamine the RL process and improve it: reduced CWT with less inventory. In othercases, adequate space may not be available to stock the greater depth.
• Better visibility and less overall clutter within the system can result if un-serviceables are moved expeditiously and consolidated at known locations. Thiswould eliminate or reduce the perceived need to track every individual item be-cause everything is moving expeditiously to an endpoint, i.e., condemned itemsto disposal and unserviceable (but repairable) carcasses to repair points specifiedfor different types of materiel. With the visibility of unserviceable assets cen-tralized at a few collection points, Item Managers (IM) could manage theirreparable inventories with more precision and be more responsive to unexpecteddemands. This could be particularly important for older legacy or Army-uniquesystems that no longer have any manufacturing or commercial support; withthese systems, components and piece parts often have to be salvaged from un-serviceable items with unknown or inconsistent washout rates.

8 Value Recovery from the Reverse Logistics Pipeline
Figure 1.5Satisfaction Rate and CWT Both Improve as Reverse Pipeline Time De-creases
RAND MG238-1.5
0 45403530252010 125 50
Reverse pipeline days for successful repairs (Doc date to D6M)
90
70
60
50
40
30
20
10
100
0
Sati
sfac
tio
n r
ate
(%)
Cu
sto
mer
wai
t ti
me
80
12
6
4
2
14
0
10
8
15
NSN 5855013008215, Night Vision Sight ($49,518), SSA X
Satisfaction
CWT
Improvedpipelinestill with
an RO = 3
Today’spipelinewith anRO = 3
• Potential savings of transportation costs may be achievable if forward and re-verse pipelines can be integrated and synchronized from a system perspectiveversus treating individual items independently.
Establishing a process to move unserviceables routinely and regularly mightproduce sufficient volume for backhaul on scheduled channels, as is done with “for-ward pipeline” carriers through the Defense Distribution System (DDS), both in theUnited States and overseas. Unserviceable returns are often viewed as and shipped asindividual items rather than a batch of items going to a central collection and sortingfacility, which is commonly done in the commercial world.
Defense Logistics Agency (DLA) Strategic Distribution Platforms (SDPs) mightfunction as distributors that sort and consolidate returns for delivery, with unservice-able stocks going to repair points.
A regular practice of linking to backhaul could promote a “sweep the floor”mentality to keep unserviceables moving. There would be no need to collect andhold items until a certain volume accumulated before arranging a shipment. This
Introduction 9
could reduce the management burden of coordinating transportation, reduce thespace consumed by unserviceables, and make the return of unserviceables part of thedaily standard process. Standard processes that are part of a routine are more likely tobe done than “exception” processes.
Particularly for OCONUS, considerable time savings should also be achievableunder this concept with the elimination/reduction of handling overseas.
The Define-Measure-Improve Methodology
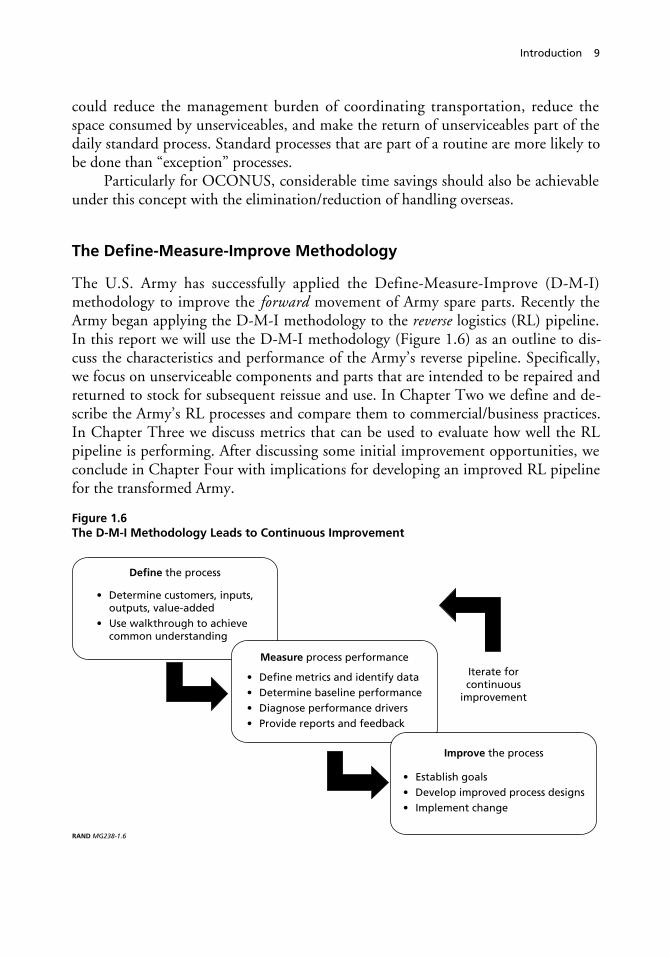
The U.S. Army has successfully applied the Define-Measure-Improve (D-M-I)methodology to improve the forward movement of Army spare parts. Recently theArmy began applying the D-M-I methodology to the reverse logistics (RL) pipeline.In this report we will use the D-M-I methodology (Figure 1.6) as an outline to dis-cuss the characteristics and performance of the Army’s reverse pipeline. Specifically,we focus on unserviceable components and parts that are intended to be repaired andreturned to stock for subsequent reissue and use. In Chapter Two we define and de-scribe the Army’s RL processes and compare them to commercial/business practices.In Chapter Three we discuss metrics that can be used to evaluate how well the RLpipeline is performing. After discussing some initial improvement opportunities, weconclude in Chapter Four with implications for developing an improved RL pipelinefor the transformed Army.
Figure 1.6The D-M-I Methodology Leads to Continuous Improvement
RAND MG238-1.6
Iterate forcontinuous
improvement
• Determine customers, inputs, outputs, value-added• Use walkthrough to achieve common understanding
Define the process
• Define metrics and identify data• Determine baseline performance• Diagnose performance drivers• Provide reports and feedback
Measure process performance
• Establish goals• Develop improved process designs• Implement change
Improve the process

11
CHAPTER TWO
Defining the Reverse Logistics Process
Reverse Logistics in the Commercial Business World
A predominant focus in the commercial retail sector with respect to reverse logistics(also referred to as the reverse supply chain) concerns a customer’s return of un-wanted merchandise. The customer need not be an individual—the customer couldbe a sales point, a distribution point, or a storage warehouse. Reasons for returns in-clude not liking the product, the wrong item was ordered, a damaged or defectiveproduct, or a forecast error, among others. The company’s focus is to collect theitem, return money to the customer, and then “dispose” of the return as appropriate,e.g., return to serviceable stocks for resale, repair the item and return it to stock, sendthe product to a secondary market for sale at a lower price, dispose of it altogether,etc. Significantly, the returns process has typically been handled as separate and dis-tinct from the forward supply chain. Recently, however, there has been more discus-sion of integrating the forward and reverse supply chains. This has been driven byfactors that have recently made it more difficult to just throw away defective or re-turned items. These factors include significant increases in disposal costs, environ-mental laws concerning recycling and disposal, and the discovery by some companiesthat profits can be made in the reverse supply chain.1
Some industries rely on returns of unserviceable carcasses for remanufacture andresale. Prime examples are automotive starters and alternators, where 90–95 percentof the items sold as repair parts have been rebuilt/remanufactured.2 In this situation,carcasses for repair become important items for quick return in order to beremanufactured and put back on the shelf for resale. This is the model most similarto the Army’s repair and reuse of reparable parts for its vast and diverse vehicle(wheeled and tracked) and aviation fleets.
In Europe, a much broader and encompassing perspective on the returns proc-ess has developed. Beginning with Germany, various countries have been looking at
____________1 Thierry, Martijn, Marc Salomon, Jo Van Nunen, et al. “Strategic Issues in Product Recovery Management,”California Management Review, Vol. 37, No. 2, Winter 1995, p. 115.2 Rogers and Tibben-Lembke, p. 6.

12 Value Recovery from the Reverse Logistics Pipeline
the environmentally friendly disposal of packaging materials and have also extendeddisposal policies to include end products. Today many European companies are re-sponsible for the disposal of packing materials after delivery of a product as well asthe disassembly and recycling of product components at the end of the product’s lifecycle. By law, companies are required to take back these products and dispose ofcomponents. For example, automobile manufacturers must take back your no-longer-working automobile, disassemble it, and then appropriately dispose of materi-als—it cannot just be sent to the junkyard.
Overview of Differences: Forward Versus Reverse, CommercialVersus Army
This section provides a general overview of fundamental differences between forwardand reverse supply chains or pipelines. Differences are briefly presented using thestructure of Table 2.1, which is based on commercial practices. When appropriate,differences between the commercial world and the Army’s environment are included.
Forecasting
As displayed in Table 2.1, there are fundamental differences that make the RL pipe-line much more difficult to manage than the forward supply chain. As with customerdemands in the forward supply chain, “demands” in the RL pipeline (i.e., unservice-able items) are generated in a random manner and thus can be difficult to forecast.However, the forecasting of returns is linked to and compounded by the uncertain-ties in the forecasts of the forward flows, typically encountered or seen as time lags inwhat happens in the forward chain. For example, holiday sales can be forecast withsome degree of accuracy, but the magnitude and timing of returns from those sales isdifficult to forecast. Although many turn-ins of unserviceable reparables lag the or-dering of a replacement part, the lags may be significant and not readily recognized asbeing related.3
Transportation
As stated in Table 2.1, forward transportation of products typically is from one or afew sources to many retail destinations, while returns are typically the opposite; thisis from a manufacturer’s viewpoint. By contrast, an Army supply activity usually re-
____________3 The Army’s forward pipeline for equipment repair parts is also difficult to forecast, with random and opera-tional tempo-driven equipment and component failures. Although quite different from forecasting consumerretail demands in the private sector, “forecasting” would be less a problem if the RL process were improved interms of speed, visibility, and standard procedures.

Defining the Reverse Logistics Process 13
Table 2.1Differences Between Forward and Reverse Logistics
Forward Reverse
Forecasting relatively straightforward Forecasting more difficult
One-to-many transportation Many-to-one transportation
Product quality uniform Product quality not uniform
Product packaging uniform Product packaging often damaged
Destination/routing clear Destination/routing unclear
Standardized channel Exception driven
Disposition options clear Disposition not clear
Pricing relatively uniform Pricing dependent on many factors
Importance of speed recognized Speed often not considered a priority
Forward distribution costs closely monitored byaccounting systems
Reverse costs less directly visible
Inventory management consistent Inventory management not consistent
Product life cycle manageable Product life cycle issues more complex
Negotiation between parties straightforward Negotiation complicated by additionalconsiderations
Marketing methods well known Marketing complicated by several factors
Real-time information readily available to track product Visibility of process less transparent
SOURCE: R.S. Tibben-Lembke and D.S. Rogers, “Differences Between Forward and Reverse Logistics in aRetail Environment,” Supply Chain Management: An International Journal, Vol. 7, No. 5, 2002, p. 276.
ceives forward supply chain deliveries in one location but may be required to sendretrograde to multiple locations, depending on the item and its condition.4 Tibben-Lembke and Rogers5 point out that they are unaware of any implementation of atransportation system where forward and reverse shipments are combined. However,the Army and DoD have a unique opportunity to gain some synergy since, for themost part, the same network nodes and modes are used in both directions.
Quality, Routing, Disposition
Unserviceable returns require different levels of effort to determine what needs to bedone and where. It is not simply a matter of sending an item routinely from point Ato point B; the proper action will depend on the condition. Accompanying paper-work that helps identify the part, who is sending it, and what defect(s) have been di-agnosed to date may be incomplete or missing. Thus, in RL there are product qualityand disposition decisions that are nonuniform and so consume more time and effort.____________4 A former Division Support Command (DISCOM) commander in Bosnia indicated that they had central re-ceipt of forward materiel, but retrograde moved in about nine different transportation channels.5 R.S. Tibben-Lembke and D.S. Rogers, “Differences Between Forward and Reverse Logistics in a Retail Envi-ronment,” Supply Chain Management: An International Journal, Vol. 7, No. 5, 2002, p. 276.
14 Value Recovery from the Reverse Logistics Pipeline
Packaging
Packaging may be damaged or missing for returns, whereas this is less of a problem inforward shipments. Packaging design is a critical factor for easier and cheaper move-ment of large quantities in the forward chain; missing and/or improper packaging offewer items causes more handling problems for returns. In the Army, packaging andcleaning are continual problem areas when unserviceable items are being returned.Heavy, bulky items must be protected from further damage; often, fluid leaks mustalso be dealt with. Even small items like circuit cards need to be protected frombreakage and electromagnetic damage. Often the organizations returning unservice-able parts do not have adequate or appropriate packing and crating materials; manyalso have not been trained in packing and crating procedures.
Pricing
Another issue is the relative value of the items being turned in. For commercial re-turns, the quality of the returned item is a major factor, which magnifies the initialprice differences found in the forward supply channels. With the implementation ofthe Single Stock Fund6 in the Army, credit policies have influenced turn-in proce-dures and local policies and, hence, retrograde workload uncertainties. This is overand above the basic issue of what value there is in a particular unserviceable item thatmight be recovered, and whether that value should be recovered.
Speed
Commercially, failure to deliver in a timely manner can result in lost sales and evenlost customers. As a result, the speed of forward supply chains or channels certainlyreceives high-level attention in meeting customer demands in the retail world. Forthe Army, delays are not so much tied to lost customers, but they do affect the abilityof units to train and achieve combat readiness. As a result, significant improvementshave been made Army-wide in the forward logistics channel. However, a commonattitude about items in the RL pipeline can be characterized by the phrase, “It’s just abroken part.” In other words, there is an apparent general lack of concern for movingunserviceable items to the place they can be repaired or disposed of. As Tibben-Lembke and Rogers point out, there is more potential for damage and obsolescenceas returns clutter up the pipeline without reaching an endpoint.7 This also drives up
____________6 The Army’s wholesale inventories of spare parts are financed by a “stock fund,” which uses its income to payfor repairs and procurement of replacement parts. During FY01, the Army’s stock funds were transitioned fromseparate wholesale and retail components to a Single Stock Fund (SSF). The change has also involved the transferof some inventories that had been locally owned at the retail level to the financial control of wholesale logisticsmanagers. For more information on SSF, see the publications by Brauner, Pint, Bondanella, Relles, and Steinberg(2000) and Pint, Brauner, Bondanella, Relles, and Steinberg (2002) listed in the bibliography.7 Tibben-Lembke and Rogers, “Differences Between Forward and Reverse Logistics in a Retail Environment,” p.278.

Defining the Reverse Logistics Process 15
inventory requirements and investment. Additionally, the Army has some uniqueequipment that has no civilian counterpart for support. This means that the timelyreturn and repair of parts may be the only source of supply outside of lengthy andexpensive new procurement, which is not a viable short-term alternative.
Costs
The nature and visibility of costs are another difference. RL has many impacts thatmay not be readily apparent, for example storage, handling, and inventory costs (es-pecially if unserviceables are allowed to stop flowing and accumulate “midstream”without reaching an endpoint). Table 2.2 summarizes a comparison of reverse logis-tics costs and forward logistics costs by various activities/categories.
Inventory Management
Inventory management in RL channels is not consistent, and product life-cycle issuesare more complex. The list of items that have a funded established repair line is setseveral years in advance and is not easily adjusted. This is exacerbated by lengthy andlow-visibility RL flows, creating a difficult situation for item managers to flexiblymanage (as currently structured).
Life Cycle, Negotiation, and Marketing
Life cycle, negotiation, and marketing are noted as being more complex in reverselogistics processes than in forward supply chains. Life cycles of Army reparables arelong, as equipment replacement is an extended process and a wide range of equip-
Table 2.2Comparison of Reverse Logistics Costs to Forward Logistics Costs
Cost Comparison to Forward Logistics
Transportation Greater: lower-volume channels
Inventory holding cost Lower: lower-value items
Shrinkage (theft) Much lower: limited use without repair
Obsolescence May be higher: depends on delays
Collection Much higher: less standardized
Sorting, quality diagnosis Much greater: item-by-item
Handling Much higher: nonstandard sizes and quantities; variable packaging
Refurbishment/repackaging Significant for RL, nonexistent for forward
Change from book value Significant for RL, nonexistent for forward
SOURCE: R.S. Tibben-Lembke and D.S. Rogers, “Differences Between Forward and Reverse Logistics in aRetail Environment,” Supply Chain Management: An International Journal, Vol. 7, No. 5, p. 278.

16 Value Recovery from the Reverse Logistics Pipeline
ment is maintained for long periods, often beyond the time that commercial/industrysupport is available. Negotiation and marketing play relatively minor roles in com-parison to the commercial world.
Visibility
Lastly, the Army’s RL is less transparent than the forward logistics channels; this par-allels the commercial world. The development and analysis of RL metrics could helpmake improvements in this area by capturing and reporting the performance of proc-esses within the reverse logistics supply chain.
From an Army Perspective
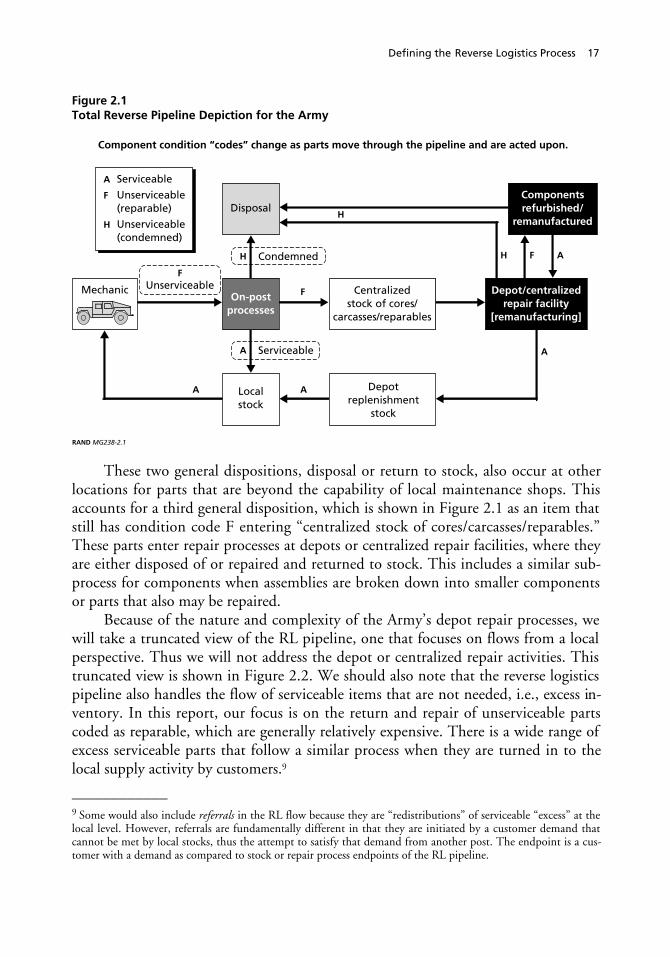
In defining the Army’s reverse logistics pipeline, we’ll first focus on the return of un-serviceable or broken parts by the customer, labeled as “mechanic” in Figure 2.1. TheArmy customer is typically a military mechanic who has identified a broken part on apiece of equipment, ordered a replacement part, and removed the unserviceable partfor turn-in to the supporting Supply Support Activity (SSA).8 Typically there is adelay in removing the unserviceable part for turn-in until a serviceable replacementarrives. The SSA is the entry point to the box titled “on-post processing” in Figure2.1, where a mechanic sends an unserviceable component, condition-coded F, forturn-in to the supply system. From the SSA, there are three general dispositions pos-sible for a returned part. One possibility is disposal. This may occur when the part isdetermined to be no longer repairable, repair is no longer economically beneficial, orthe item is no longer needed (i.e., obsolete or excess pieces exist); in these cases itscondition code becomes H. Evaluation by maintenance technicians may or may notbe involved, depending on the particular item and disposition rules. A second possi-ble disposition is a maintenance action that returns a part to serviceable condition,i.e., its condition code is changed to A as a result of repair, recalibration, or refur-bishment, and it is placed on the shelf ready to be issued to a customer. In Figure2.1, this is labeled “local stock,” a potential final disposition point after an unservice-able part flows through an on-post repair shop.
____________8 A good corresponding analogy in the business world is the field engineer who makes a service call to install orrepair a piece of equipment. Blumberg estimates that 40–70 percent of all service calls require a part or parts to bereplaced. Many of the replacement parts (close to 80 percent in terms of total investment) are high-value repara-ble items. These parts are removed, replaced with serviceable parts, and returned through RL channels to local orcentral repair depots; refurbished or reconditioned parts are restocked for reuse in the field. Donald F. Blumberg,“Strategic Analysis and Evaluation of Reverse Logistics Supply Chain in Approaches to Logistic Management andControl in High Technology Service Operation,” White Paper, D.F. Blumberg & Associates, Inc., 2000.
Defining the Reverse Logistics Process 17
Figure 2.1Total Reverse Pipeline Depiction for the Army
Component condition “codes” change as parts move through the pipeline and are acted upon.
RAND MG238-2.1
A Serviceable
F Unserviceable (reparable)
H Unserviceable (condemned)
Disposal
HH
H
A
A
F
FUnserviceable
Serviceable
Condemned
MechanicOn-post
processes
Depot/centralizedrepair facility
[remanufacturing]
Centralizedstock of cores/
carcasses/reparables
Depotreplenishment
stock
Componentsrefurbished/
remanufactured
Localstock
F
AA
A
These two general dispositions, disposal or return to stock, also occur at otherlocations for parts that are beyond the capability of local maintenance shops. Thisaccounts for a third general disposition, which is shown in Figure 2.1 as an item thatstill has condition code F entering “centralized stock of cores/carcasses/reparables.”These parts enter repair processes at depots or centralized repair facilities, where theyare either disposed of or repaired and returned to stock. This includes a similar sub-process for components when assemblies are broken down into smaller componentsor parts that also may be repaired.
Because of the nature and complexity of the Army’s depot repair processes, wewill take a truncated view of the RL pipeline, one that focuses on flows from a localperspective. Thus we will not address the depot or centralized repair activities. Thistruncated view is shown in Figure 2.2. We should also note that the reverse logisticspipeline also handles the flow of serviceable items that are not needed, i.e., excess in-ventory. In this report, our focus is on the return and repair of unserviceable partscoded as reparable, which are generally relatively expensive. There is a wide range ofexcess serviceable parts that follow a similar process when they are turned in to thelocal supply activity by customers.9
____________9 Some would also include referrals in the RL flow because they are “redistributions” of serviceable “excess” at thelocal level. However, referrals are fundamentally different in that they are initiated by a customer demand thatcannot be met by local stocks, thus the attempt to satisfy that demand from another post. The endpoint is a cus-tomer with a demand as compared to stock or repair process endpoints of the RL pipeline.

18 Value Recovery from the Reverse Logistics Pipeline
Figure 2.2Reverse Flows Have Three Local Endpoints
RAND MG238-2.2
A Serviceable
F Unserviceable (reparable)
H Unserviceable (condemned)
H
H
F
A
A
A
A
A
Mechanic
Depot/centralizedrepair facility
[SOR]
FCentralizedstock
A
Localstock
DRMO
On-postprocesses
FSB/MSB/DOL
In Figure 2.2 the customer, typically the mechanic who works on a piece ofequipment, turns an unserviceable item (or an excess serviceable item) into his/herunit supply system, where it flows through various local organizations until it reachesone of the three endpoints depicted in the shape of stop signs. If the item is service-able or is returned to a serviceable condition by a local repair activity, it may be re-turned to local stock and thus be available for issue when demanded by a customer.
A second endpoint is the Defense Reutilization and Marketing Office (DRMO)or disposal. Reaching this endpoint means that the item cannot be repaired and iscondemned, that it is not economical to repair and is to be discarded, or that it is notneeded and not economical to ship elsewhere.
The third endpoint is a return that reaches centralized stock that is not part oflocally owned stocks—either as a serviceable item or as an unserviceable reparablethat will be centrally held until scheduled and input to a repair program. Centralizedstock under Single Stock Fund (SSF) belongs to Army Materiel Command (AMC),10
and the location where stocks are held may be either on the local installation or in asupply warehouse at an AMC maintenance depot (for example, Anniston, Alabama,or Corpus Christi, Texas).
____________10 AMC has a diverse range of missions, from research and development of new weapons systems, to overhauland maintenance of existing weapons systems in repair depots, to the wholesale distribution of spare parts to sus-tain soldiers throughout the world.
Defining the Reverse Logistics Process 19
Although depot/centralized repairs are depicted on the chart, we will discussflows only up to the supply warehouse that holds unserviceable assets for later induc-tion into a repair activity. Thus we are truncating the total RL pipeline by excludingthe time until induction into a depot repair program and the time to complete therepair; this is because once reparable items reach the depot level, carcass tracking (ac-countability) procedures change such that the linkage cannot be made between a car-cass used in a depot repair or refurbishment action and its original return flow.11
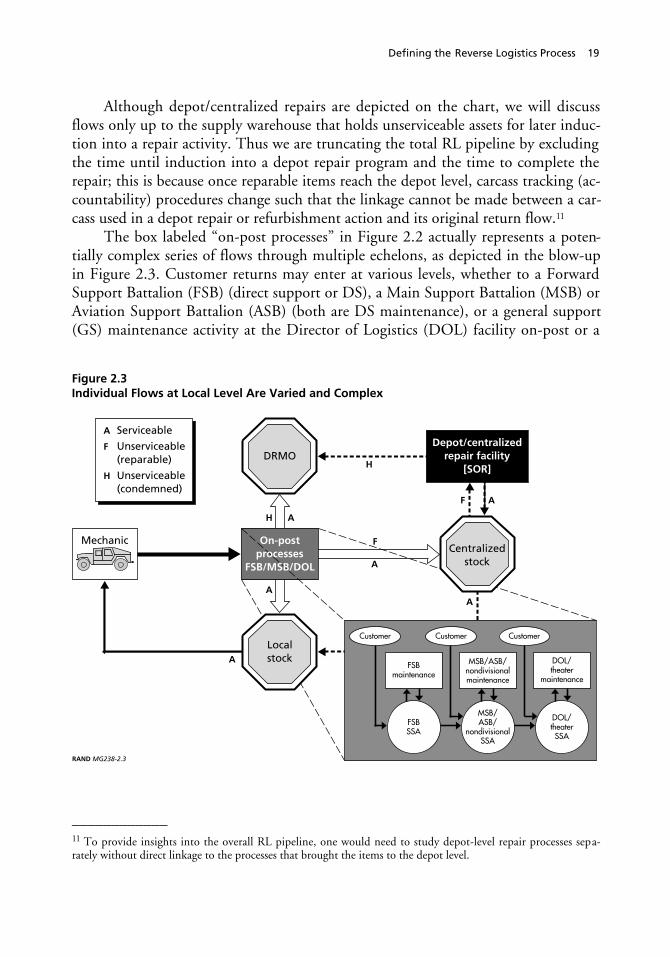
The box labeled “on-post processes” in Figure 2.2 actually represents a poten-tially complex series of flows through multiple echelons, as depicted in the blow-upin Figure 2.3. Customer returns may enter at various levels, whether to a ForwardSupport Battalion (FSB) (direct support or DS), a Main Support Battalion (MSB) orAviation Support Battalion (ASB) (both are DS maintenance), or a general support(GS) maintenance activity at the Director of Logistics (DOL) facility on-post or a
Figure 2.3Individual Flows at Local Level Are Varied and Complex
RAND MG238-2.3
A Serviceable
F Unserviceable (reparable)
H Unserviceable (condemned)
H
H
F
A
A
A
F
A
A
A
Mechanic
Depot/centralizedrepair facility
[SOR]
FCentralizedstock
A
Localstock
DRMO
Customer CustomerCustomer
FSBSSA
FSBmaintenance
MSB/ASB/nondivisionalmaintenance
MSB/ASB/
nondivisionalSSA
DOL/theater
maintenance
DOL/theaterSSA
On-postprocesses
FSB/MSB/DOL
____________11 To provide insights into the overall RL pipeline, one would need to study depot-level repair processes sepa-rately without direct linkage to the processes that brought the items to the depot level.

20 Value Recovery from the Reverse Logistics Pipeline
theater-level operation designed to support units assigned to the theater.12 The na-ture of the part, the complexity of the needed repair, special tools, test, measurementand diagnostic equipment (TMDE), skills/training, etc., and the type/level of unitwill determine the route each follows; these considerations are addressed as part ofthe LORA described earlier. This highlights a primary difference between the for-ward pipeline/supply chain and the reverse: parts moving forward follow a defined,standard sequence. The reverse flow, however, is much more complex, with manypossible routings for an individual part; we can identify and measure time segmentsfor the possible flows, but we cannot say that a part follows the same routing all thetime. Unserviceable reparables (and excess serviceables) begin the RL process whenthe initiating customer turns the part/materiel in to the SSA that supports the cus-tomer’s organization.
From Figure 2.4 we see that there are three different points where a turn-in canbe initiated. Exactly where a part begins the process depends on the type of organiza-tion and the location. The beginning or start time for a turn-in is the date entered ona document record created by maintenance personnel in the Unit Level Logistics Sys-tem (ULLS) or in the Standard Army Maintenance System (SAMS).13 The mainte-nance unit next takes the document and the item to its supply support activity orSSA. Upon turn-in, the SSA processes the part, which includes creating a documentrecord in the Army’s automated supply system, called the Standard Army RetailSupply System or SARSS. SARSS indicates where to ship the item based on recover-ability and maintenance codes as well as established repair programs. If the item is inthe local repair program, the item is sent there and repair is attempted. If the repair issuccessful, the item is returned to local stock or is repositioned as a redistributableserviceable item. If the designated repair shop is not in the SSA’s support battalion, itbegins a transit process, which includes preparation for shipment, actual movementor transit to another location, and then receipt processing at the destination.
If an item cannot be repaired at a given location, it may be evacuated, i.e.,passed on, to an echelon with greater repair capability. Again there is a transit process
____________12 The current Army maintenance system consists of four levels of maintenance: unit or organizational (org),direct support (DS), general support (GS), and depot-level. They are characterized from organizational to depot-level by increasing levels of technical skill, increasing access to specialized tools and equipment, decreasing mobil-ity, and increasing emphasis on sustainment versus a field/daily readiness orientation. The maintenance may beorganic or contract activities. For more details on this four-level Army system, see the Appendix.
The Army uses maintenance allocation charts to designate the lowest authorized level of repair for each functionon all types of repairs. Based upon this, capacity, and readiness needs, organizations designate which componentseach echelon of maintenance will repair. The supply computers automatically route carcasses accordingly.13 ULLS covers organizational maintenance work order management, readiness reporting, dispatching, and vehi-cle history system (mileage, services, etc.). SAMS has two levels: Level 1 is the DS/GS work order managementsystem, and Level 2 provides Materiel Management Center or MMC-level maintenance/fleet management re-ports.

Defining the Reverse Logistics Process 21
Figure 2.4RL Process for Unserviceable Reparables Can Be Generalized into Three Levels
MSB/SSAprocessing
RAND MG238-2.4
Repaired
Repaired
Depot/NationalMaintenanceProgram/SOR
In transit
In transit
Turn in toDOL/theater
SSA
DOL/SSAprocessing
DRMO
Repaired
FSB/SSAprocessing
DRMO
Evacuate
Evacuate
DRMO
Turn in toFSB/SSA
Turn in toMSB/SSA
Evacuate
In transit
that includes several steps. If the item is determined to be unrepairable, uneconomi-cal to repair, or uneconomical to return to another location, it may be disposed of,i.e., sent to DRMO.
Thus, at each organizational level there is a processing activity, followed by oneof three possible dispositions: repair, disposal (DRMO), or evacuation. The remain-ing endpoint for our defined RL pipeline is the receipt processing by the supply ac-tivity associated with a repair activity at an AMC depot. We stop measuring at thatpoint, since the document trail for a return ends and there is an indefinite wait beforea part is inducted for actual repair at that echelon.
For ease of portrayal and general discussion of the RL pipeline, the flow hasbeen depicted in Figure 2.4 as a linear flow or a series of end-to-end segments, simi-lar to how the forward pipeline works. However, this is not true of the RL; it is muchmore complicated, with variable direction flows. Although there is much complexityin the RL flows and a lack of a standard process, we can focus improvement effortson processes or subprocesses that underlie several distinct segments. In defining the RLprocess, we and what was then called the Combined Arms Support Command(CASCOM) Velocity Management team made several visits to Army units, bothCONUS and OCONUS, to observe and understand how unserviceable retrograde isprocessed and moved through the RL pipeline. Below are some observations fromthose visits that indicate potential delays/bottlenecks—a natural starting place forimprovement ideas.
22 Value Recovery from the Reverse Logistics Pipeline
Turn-In Process
Documentation required to turn in an unserviceable item often appears to be morethan is actually needed or even used,14 while other information that might be usefulis often not included.15 Unit personnel who begin the return process indicate that itcan be a time-consuming task to gather and make copies of the documents requiredby their supporting supply activity. Without the documents (type and specifiednumber of copies), they cannot turn in the item. Documents that are typically re-quired include:
1. Turn-in document from the automated maintenance data system(ULLS/SAMS). This identifies the item by part number (NIIN) and includes aserviceability code (e.g., the code F identifies item as unserviceable but repara-ble; G indicates unserviceable and condemned).
2. Technical Inspection worksheet (Form 2404).3. Photocopy of descriptive information from a catalog (the FEDLOG CD-ROM
database of federal part numbers) for the part being turned in.4. Serviceability tag. Identifies item as serviceable or unserviceable. All the infor-
mation entered on the tag is also found on the turn-in document. The issue ofwho is authorized to create and sign the tag also arose; most times it appears tobe signed by a supply clerk—not a technical expert who can determine theserviceability of the item.
If applicable, the following documents might also be required:
5. Drainage statement (3 copies).6. Damage statement (3 copies).7. Photocopy from Technical Manual showing a picture of the item.
Actual physical preparation of the item often appears to be time-consuming:
1. Items are required to be cleaned; by observation, this often is interpreted tomean “steam-cleaned.”
2. Items are required to be completely drained.3. In some locations, items are required to be banded to a pallet (1 item per pallet,
with the exception of track [32 per pallet] and road wheels [5 per pallet]).
____________14 When we walked the process followed by an unserviceable item, the processing personnel often indicated ei-ther that they didn’t use certain documents or that the information was duplicated by one or more documents.15 An example is information that might be useful for diagnosis and repair. It is not unusual for the documents tomerely say “inop” or “broken” without further details of how the component malfunctioned.
Defining the Reverse Logistics Process 23
Supply Support Activity (SSA) Processing
All of the initial paperwork from the mechanic turning in an unserviceable item isperpetuated at the SSA (FSB and MSB), plus 2 or 3 copies of the Materiel ReleaseOrder (MRO). It is not unusual for different SSAs on the same installation to inde-pendently set different requirements, such as the number of copies they want fromthe person turning in an item or the packaging requirement. However, since such apolicy affects the subordinate organizations, the result is that the most stringent re-quirement becomes the standard for all organizations. When one SSA sets a require-ment that may cascade through the chain of command, a central organization couldevaluate the value of this action rather than simply allowing one organization’s re-quirements (desires) to drive everyone else’s.
We also observed that a number of items that are supposed to be disposed of atthe lowest level16 are frequently turned in to the supply activity. This creates unnec-essary work at both the unit and SSA.
We further noted that some DS-level reparable items are being returned formaintenance to the supply activity in condition code H (unserviceable-condemned).Rather than being disposed of directly to DRMO, the items are being recoded as Fand turned in to a higher-echelon SSA. This creates unnecessary handling, workload,and a build-up of condition code H assets in wholesale-level inventory.17
When an unserviceable reparable item is turned in to a supply activity and en-tered into the automated data system (SARSS), there is a look-up table that indicateswhere that item is to be routed for repair. When those tables are inaccurate or out ofdate, items are incorrectly routed, thereby causing additional handling and delays. Ina similar vein, time delays and unnecessary handling can be avoided when items aresent directly to where they are repaired rather than echelon-by-echelon; for example,if an unserviceable item is turned in at the FSB level and the required repair capabil-ity is located at the DOL, it should be sent directly to the DOL, not through the
____________16 These are coded “Z-Z” (Recoverability Code – Maintenance Repair Code), which means they can be thrownin the trash when unserviceable rather than processed through the supply system. An example is a seat cushion.17 There are two issues in this situation. The first is that obvious scrap is sometimes turned in to the SSA fromthe customer level. These items were typically sent to maintenance and returned to the SSA in condition code H.At that point the SSA should send the item directly to DRMO but instead (incorrectly) interprets the regulatoryguidance to say the SSA cannot do that and so recodes the items as unserviceable (condition code F) and sendsthem on to the Army Working Capital Fund (AWCF) SSA. The AWCF SSA does not automatically send themto DRMO; this action has to wait until an item manager directs it. The problem is the interpretation of theregulation and local policy; the SSA is allowed to turn in items directly to DRMO and should not send DS-levelreparables or consumables to the next-higher level.
The second issue is that the AWCF should recognize these items and automatically send them to DRMO; theitems should not have to wait until a manager reviews the AWCF’s assets and recognizes that it has “scrap” andcondemned items in stock.

24 Value Recovery from the Reverse Logistics Pipeline
MSB level (which processes the item through to the DOL without adding any valuein terms of repair or disposal).18,19
Some organizations, both maintenance and supply activities, indicate thathigher echelons limit their turn-in to no more than 15 items (i.e., document num-bers) daily. Numerical limits potentially restrict the turn-in of repair parts; if one hasmore than 15,20 a choice must be made of which ones to turn in—often with littleidea of which are most critical overall. Similarly, units sometimes are limited to cer-tain days and/or hours when items can be turned in for processing.
Transit Process
Significant delays in moving unserviceable retrograde items were noted on walk-throughs. Examinations of paperwork for in-process unserviceable retrograde itemscommonly indicate that it had taken several days to move an item a very short geo-graphical distance. Some of the delays are the result of practices discussed above.Delays also result from the practice of “batching”; unserviceables are sometimes ac-cumulated until a certain amount is on hand before moving them on. In one case,delays were noted as a result of a supply clerk not having a driver’s license; he had tofind someone with a license and a vehicle to transport him and the items to the sup-porting supply activity for turn-in.
Observations of outbound shipments from posts/installations suggest that someimprovements are needed. A major issue is packaging and crating. For many reparableitems this requires special materials as well as special training on how to properly pro-tect items. Further, there may be environmental and hazardous material implicationsif items are moved via public transportation networks. Possible improvements mightfocus on whether to centralize this capability, who should do it, where it should bedone, training issues, stocking of packing material, etc.
One could also examine the value of routing the redistribution of high-valueitems (CONUS as well as OCONUS) through DLA SDPs, since distribution is theircore competence.21
____________18 In deployed/field operations this might not be feasible. It may be necessary to have a central turn-in or evacua-tion point where all unserviceables are processed and then sent to appropriate repair activities.19 A significant time savings is potentially possible here. As will be seen later in the report, the FSB-to-DOL tran-sit times tend to be much shorter than the sum of FSB-to-MSB and MSB-to-DOL transit times.20 Large numbers of turn-ins at one time may indicate that the unit is “batching” or collecting items beforeturning them in. This unnecessarily delays the RL process and should be avoided at the unit level.21 The Defense Logistics Agency (DLA) is a U.S. Department of Defense (DoD) agency that provides worldwidelogistics support for the military, certain federal agencies, foreign governments, international organizations, andothers as authorized. Each of the 24 DLA distribution depots stores, issues, packs, preserves, and provides world-wide transportation of supplies and parts.
Two of the 24 distribution depots are called Strategic Distribution Platforms (SDPs): the Defense DistributionDepot San Joaquin, California (DDJC) and the Defense Distribution Depot Susquehanna, Pennsylvania

Defining the Reverse Logistics Process 25
Maintenance Processing
While not a specific research focus in this effort, some general observations can beoffered on maintenance and repair cycle activities. Movement of reparables to main-tenance activities/shops (within the same echelon) by supply activities appears to beexpeditious. Tables in the automated supply data system (SARSS) identify whetheror not a reparable item can be repaired locally; if so, a work order (with a DocumentIdentifier Code (DIC) of XML22) is issued to transfer the item to a maintenanceshop. If there is no local repair capability, SARSS data tables will indicate where toship the item for repair, and the item is subsequently processed for shipment to thatlocation.
Delays within maintenance shops need to be investigated more thoroughly as aseparate research focus. However, it appears from this research that unserviceableitems are sometimes batched at different steps in the repair process. For example,batching may occur when items are inducted into repair, i.e., the mechanic accumu-lates a number of items before beginning troubleshooting and repair. Sometimes re-pair backlogs occur because mechanics are assigned other jobs unrelated to mainte-nance. Batching also takes place at the end of the process. For example, repairs areattempted, items are tagged as to serviceability, and then the items are stacked on apallet. Turn-in for further processing (e.g., return to stock, disposal, evacuation) isdelayed until the pallet is full.23
The entire process for condemned or condition code H items is not captured inour process diagram. We stop measuring when a return item is coded as condemned,and the rest of the process to move the item to DRMO is not captured. Superficial
__________________________________________________________________(DDSP). These have primary regional customers including those overseas, where DDJC primarily serves the WestCoast and Pacific region and DDSP primarily serves the eastern United States, Europe, and the Middle East.22 DICs are DoD codes that identify processing actions. These codes are captured in automated data systems(e.g., SARSS) and indicate what actions are taken and the time (i.e., day) that action occurs. A series of DICsaligned in time order provide a data trail that can be used for process analysis. More about DICs and data collec-tion will be found in Chapter Three.
The following are the primary DICs used in reverse flows:
D6A Materiel Receipt – Returns
XML Maintenance Work Order created
D6M Materiel Receipt – Returns from testing/repair
A5A/A51 Materiel Release Order (MRO) for domestic shipment with NSN/MRO foroverseas shipment with NSN
D6K Materiel Receipt – Relocation of assets (from referrals/redistribution)
FTM Materiel Returns Shipment Status (indicates item has been turned over to ship-per for movement)
23 One should note, too, that when we discuss measuring repair time in greater detail below, we end the processwhen there is an XML DIC and a corresponding D6M DIC (indicating a return from maintenance) with a serv-iceable condition code. What is difficult to measure for a particular item is how long it takes for that item, oncerepaired, to be returned to serviceable stock where it is available for issue.

26 Value Recovery from the Reverse Logistics Pipeline
observations indicate that there may be bottlenecks in this process as well. Concernshave also arisen as to what items are ending up in DRMO; for example, we knowthat items are sometimes retrieved from DRMO by Army personnel and even bycommercial firms that later resell it to the government. This may be an area for fu-ture investigation.

27
CHAPTER THREE
Measuring the Reverse Logistics Process
An important purpose of measuring in the D-M-I methodology is to determine thelevel of performance, i.e., how well the process is done. The first objective is to es-tablish a set of baseline metrics that can be used to communicate historical perform-ance and future goals. Then as improvement efforts are initiated, one can use thesemetrics to objectively assess the success of specific improvements, as well as im-provement over time.
In this chapter we first provide some observations on data processing, then pro-vide some overall descriptive statistics of the Army RL system, and then concludewith RL metrics and the Army’s historical performance using FY00 as a baseline.
Data Processing Observations
Our analysis is based on data contained in documents. While we would prefer to de-scribe performance based on the flows of materiel, we must rely on the data in thedocuments. For that reason, observations and comments are based primarily on sta-tistical analysis of the flow of documents within the RL pipeline.
When a returned item is first entered into an automated data system, it is as-signed a document number that remains with it until it reaches a “reverse pipelineendpoint” and leaves the system. A document (number) tracks and processes onlyone type of item, i.e., only one National Item Identification Number (NIIN). Thedocument number may, however, contain or account for multiple quantities of thatparticular item. For example, five identical batteries (i.e., all with the same NIIN)may be turned in using a single document. Rather than processing five separatedocuments, only one is used. However, for most Class IX unserviceables, the quanti-ties per document are relatively small—typically one; Army-wide, 88 percent of allturn-in documents contain one item, as do 83 percent of documents ending inDRMO and 93 percent of documents recording a successful repair.
As an item (document) is processed through the RL pipeline, a DIC for differ-ent actions or events and the time at which the action/event occurred is recorded intothe database for that document number. Thus, we can sort large amounts of data by

28 Value Recovery from the Reverse Logistics Pipeline
these unique document numbers, and then arrange the DICs in time order to recon-struct how that document was processed; this serves as a surrogate for how the item(possibly multiple quantities) was processed.
Since our analysis is based on “document flow” through the RL system ratherthan individual pieces, i.e., “materiel flow,” there are some general implications to beaware of. First, counts based on the number of documents usually understate the ac-tual quantities involved because an individual document may contain more than oneof that item.
The second general implication is that time statistics will tend to have some dis-tortion. This is because the document is not processed, i.e., does not receive a timestamp, until the last piece is completed. For example, if five identical components aresent to a maintenance shop (one document, same part number), the processing timeis calculated from the time of entry/receipt into the shop, and the end time is whenthe fifth repair is completed; the first through fourth repairs most likely took ashorter amount of time. However, if like parts are typically processed and handled inbatches, then the time for the batch is more relevant than individual times.
Third, although we use document counts (versus total quantities), we can stillestimate the dollar value of the RL pipeline by multiplying the part value (ArmyMaster Data File (AMDF) price) by the quantity recorded on the document.
Overall Characteristics of the Army RL System
Before describing particular RL metrics, we next present some overall descriptive sta-tistics and views of the overall Army RL system. Figure 3.1 characterizes workloadwithin each organizational level (FSB/MSB/DOL-theater); workload is measured bythe volume of RL documents reaching an endpoint at each level.1 During the base-line period (FY00), most of the Army-wide RL workload2 occurred at the MSB level(42 percent), and at the DOL/theater level (40 percent), with 18 percent at the FSBlevel.
FSBs evacuate almost 70 percent of the unserviceable Class IX items (docu-ments) turned in to them. Eleven percent are repaired by FSBs, with the remaining20 percent condemned and sent to DRMO. This suggests that FSB improvementsmight best focus on processing and handling to move items onward quickly. Consid-eration should also be given to whether there should be any component repair at allat this level.
____________1 Levels are not mutually exclusive. For example, an item (document) might be turned in to an FSB, processed,and then “evacuated” to an MSB where it is “repaired.” Thus, one document can (and often does) create work-load at multiple levels.2 In this context, RL workload is measured by the volume of documents processed that pertain to unserviceableitems.

Measuring the Reverse Logistics Process 29
Figure 3.1Different Organizational Levels Have Different Workloads and Endpoints
DOL/theaterMSBFSB
147,000156,30073,70040%42%18%
Number of documents:
Workload by level
Percent:
RAND MG238-3.1
NOTE: Levels are not mutually exclusive.
90,000
50,000
40,000
30,000
20,000
10,000
100,000
0
Nu
mb
er o
f d
ocu
men
ts(u
nse
rvic
eab
le t
urn
-in
s)
60,000
80,000
70,000
RepairedDRMOEvacuated
Unserviceable Class IXCTASC/FY00
11%
20%
69%
21%22%
57%
19%
27%
54%
Overall
29% repaired
54% DRMO
17% evacuationto depot/SOR
MSBs also evacuate the majority of the items they handle—about 57 percent,although their repair capability is much higher than the FSB level. Interestingly, theDOL/theater-level processing of RL items (documents) resulted in over half going toDRMO (i.e., items were condemned) in the baseline period. The number of repairsis about the same as the MSB level. As the chart shows, 27 percent of items (docu-ments) are evacuated from the DOL/theater level to AMC depots; this equated toover 38,000 documents during the baseline period.
When we look at the overall RL system with the three endpoints we defined, wesee that 29 percent of the items (as measured by the number of documents) are re-paired by FSB/MSB/DOL/theater maintenance shops. Over half (54 percent) arecondemned and sent to DRMO, and 17 percent are evacuated to AMC depots.3
____________3 One should be aware that data are somewhat confounded between depot-level repairs and field repairs. Theproblem is that depot-level repairs are done at places other than AMC depots. For example, depot-level repairs ofaircraft engines and other high-value items have been authorized at some DOLs and some theater-level repairactivities. Current data collection and analysis does not enable us to distinguish DOL/theater repairs as beingeither depot-level or field-level. The result is that we understate the amount of depot-level activity in terms ofvalue and quantity.
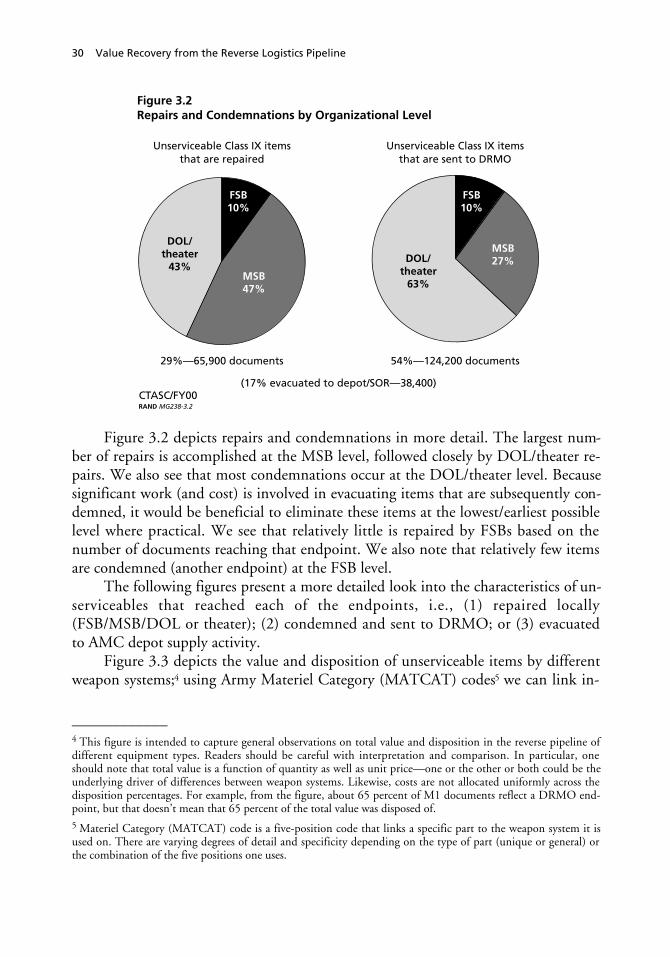
30 Value Recovery from the Reverse Logistics Pipeline
Figure 3.2Repairs and Condemnations by Organizational Level
(17% evacuated to depot/SOR—38,400)
FSB10%
DOL/theater
63%
MSB27%
FSB10%
DOL/theater
43%MSB47%
Unserviceable Class IX itemsthat are repaired
Unserviceable Class IX itemsthat are sent to DRMO
29%—65,900 documents
CTASC/FY00
54%—124,200 documents
RAND MG238-3.2
Figure 3.2 depicts repairs and condemnations in more detail. The largest num-ber of repairs is accomplished at the MSB level, followed closely by DOL/theater re-pairs. We also see that most condemnations occur at the DOL/theater level. Becausesignificant work (and cost) is involved in evacuating items that are subsequently con-demned, it would be beneficial to eliminate these items at the lowest/earliest possiblelevel where practical. We see that relatively little is repaired by FSBs based on thenumber of documents reaching that endpoint. We also note that relatively few itemsare condemned (another endpoint) at the FSB level.
The following figures present a more detailed look into the characteristics of un-serviceables that reached each of the endpoints, i.e., (1) repaired locally(FSB/MSB/DOL or theater); (2) condemned and sent to DRMO; or (3) evacuatedto AMC depot supply activity.
Figure 3.3 depicts the value and disposition of unserviceable items by differentweapon systems;4 using Army Materiel Category (MATCAT) codes5 we can link in-
____________4 This figure is intended to capture general observations on total value and disposition in the reverse pipeline ofdifferent equipment types. Readers should be careful with interpretation and comparison. In particular, oneshould note that total value is a function of quantity as well as unit price—one or the other or both could be theunderlying driver of differences between weapon systems. Likewise, costs are not allocated uniformly across thedisposition percentages. For example, from the figure, about 65 percent of M1 documents reflect a DRMO end-point, but that doesn’t mean that 65 percent of the total value was disposed of.5 Materiel Category (MATCAT) code is a five-position code that links a specific part to the weapon system it isused on. There are varying degrees of detail and specificity depending on the type of part (unique or general) orthe combination of the five positions one uses.

Measuring the Reverse Logistics Process 31
Figure 3.3Selected Weapon Systems Vary by Endpoints and Overall Value
90
80
70
60
50
40
30
20
10
100
0
160
150
140
130
120
110
100
90
80
70
60
50
40
30
20
10
0
Perc
ent
reac
hin
g e
nd
po
int
AM
DF
valu
e ($
mill
ion
s)
Aviation MissilesTactical vehiclesArmor
UH-60
OH-58D
CH-47D BFV
M1 t
ank
AH-64
HEMTT
HMM
WV
FMTV
MLR
S
Avenger
Patri
ot
RAND MG238-3.3
NOTE: Percentage of turn-ins, not value.
$602M
Depot DRMO Repair locally Total dollars
dividual part numbers to the weapon system they are used on. (Note: this is not aperfect process, as many parts are coded as “common” to multiple weapon systems,but this is less prevalent for reparables.) Figure 3.3 depicts major systems that aretracked at DA level for readiness reporting, i.e., known as SORTS (Status of Re-sources and Training System) systems. They have been grouped left to right by avia-tion, armor, tactical vehicles, and missiles.
• Aviation. Most aviation parts are sent to depot level, although 8–15 percent arerepaired locally, and 20+ percent are sent to DRMO. We also note that aviationparts are relatively expensive, leading to a relatively high dollar value of returnsin aggregate.
• Armor. Values for the M1 tank dominate all other weapon systems as the resultof high quantities combined with relatively expensive part prices. Some local re-pairs are noted, there is more DRMO activity than with aviation, and there issome depot-level activity.

32 Value Recovery from the Reverse Logistics Pipeline
• Tactical vehicles. Very little depot-level activity is seen here. These are rela-tively low-value items that are either repaired locally or condemned. (Note: Theabsence of depot activity for FMTV happens because these are under warranty,and contract repair covers repair at that level. Also, much of the depot-level re-pair activity for HMMWV and HEMTT is likely done by authorized DOLsrather than depots.)
• Missiles. Depot-level repair activity is predominant and similar to aviation.However, the total values, driven by lower volumes, are lower, with more localrepair in general.
The next set of figures examines each of the endpoints by Federal Supply Class(FSC).6 Figure 3.4 depicts those items that were repaired at FSB, MSB, DOL, ortheater; in other words, repairs that were accomplished at other than AMC depots.Individual parts with cumulative AMDF values over $100,000 or with more than100 items repaired were sorted by their FSC and plotted left to right in decreasingquantities; corresponding AMDF values are also plotted for each FSC.
Figure 3.4Value and Quantity of Items Repaired by Federal Supply Class
RAND MG238-3.4
19,00018,00017,00016,00015,00014,00013,00012,00011,00010,0009,0008,0007,0006,0005,0004,0003,0002,0001,000
20,000
0
80
75
70
65
60
55
50
45
40
35
30
25
20
15
10
5
85
0
Qu
anti
ty r
epai
red
AM
DF
valu
e ($
mill
ion
s)
Federal supply class
$119.24M $255.75M
NIINs with total AMDF value > $100kor total quantity > 100Class IX unserviceable FY00
Quantity$ millions
____________6 A Federal Supply Class (FSC) is a combination of four numbers that describe the commodity class of an item ofsupply.
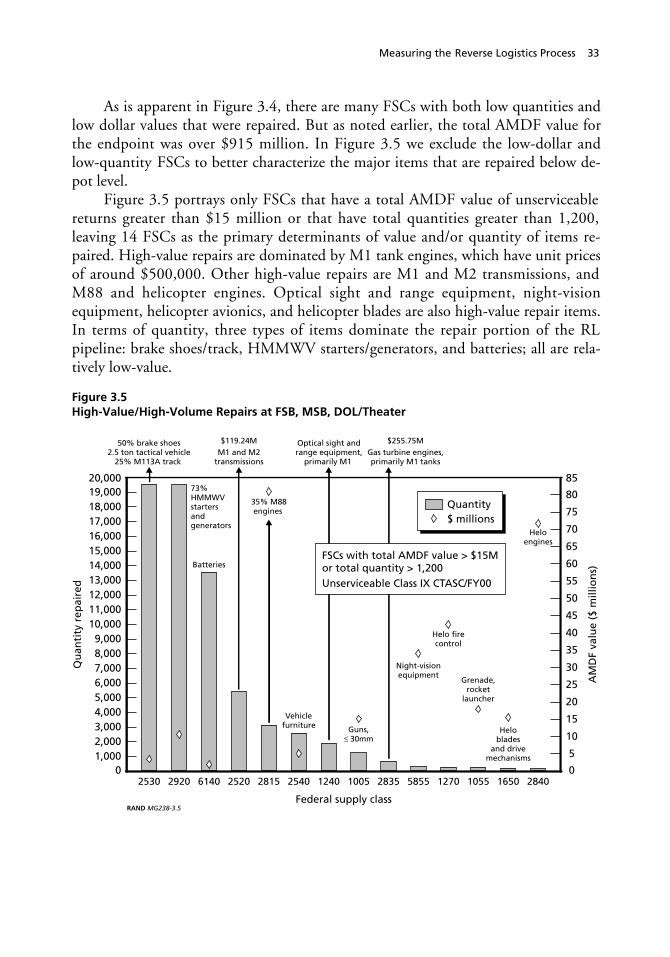
Measuring the Reverse Logistics Process 33
As is apparent in Figure 3.4, there are many FSCs with both low quantities andlow dollar values that were repaired. But as noted earlier, the total AMDF value forthe endpoint was over $915 million. In Figure 3.5 we exclude the low-dollar andlow-quantity FSCs to better characterize the major items that are repaired below de-pot level.
Figure 3.5 portrays only FSCs that have a total AMDF value of unserviceablereturns greater than $15 million or that have total quantities greater than 1,200,leaving 14 FSCs as the primary determinants of value and/or quantity of items re-paired. High-value repairs are dominated by M1 tank engines, which have unit pricesof around $500,000. Other high-value repairs are M1 and M2 transmissions, andM88 and helicopter engines. Optical sight and range equipment, night-visionequipment, helicopter avionics, and helicopter blades are also high-value repair items.In terms of quantity, three types of items dominate the repair portion of the RLpipeline: brake shoes/track, HMMWV starters/generators, and batteries; all are rela-tively low-value.
Figure 3.5High-Value/High-Volume Repairs at FSB, MSB, DOL/Theater
RAND MG238-3.5
19,00018,00017,00016,00015,00014,00013,00012,00011,00010,0009,0008,0007,0006,0005,0004,0003,0002,0001,000
20,000
0
80
75
70
65
60
55
50
45
40
35
30
25
20
15
10
5
85
0
Qu
anti
ty r
epai
red
AM
DF
valu
e ($
mill
ion
s)
$255.75M
FSCs with total AMDF value > $15Mor total quantity > 1,200Unserviceable Class IX CTASC/FY00
Quantity$ millions
Federal supply class
165010551270585528351005124025402815252061402920 28402530
73%HMMWVstartersandgenerators
$119.24MM1 and M2
transmissions
Batteries
50% brake shoes2.5 ton tactical vehicle
25% M113A track
35% M88engines
Guns,≤ 30mm
Vehiclefurniture
Optical sight andrange equipment,
primarily M1
Night-visionequipment
Helo firecontrol
Heloengines
Heloblades
and drivemechanisms
Gas turbine engines,primarily M1 tanks
Grenade,rocket
launcher
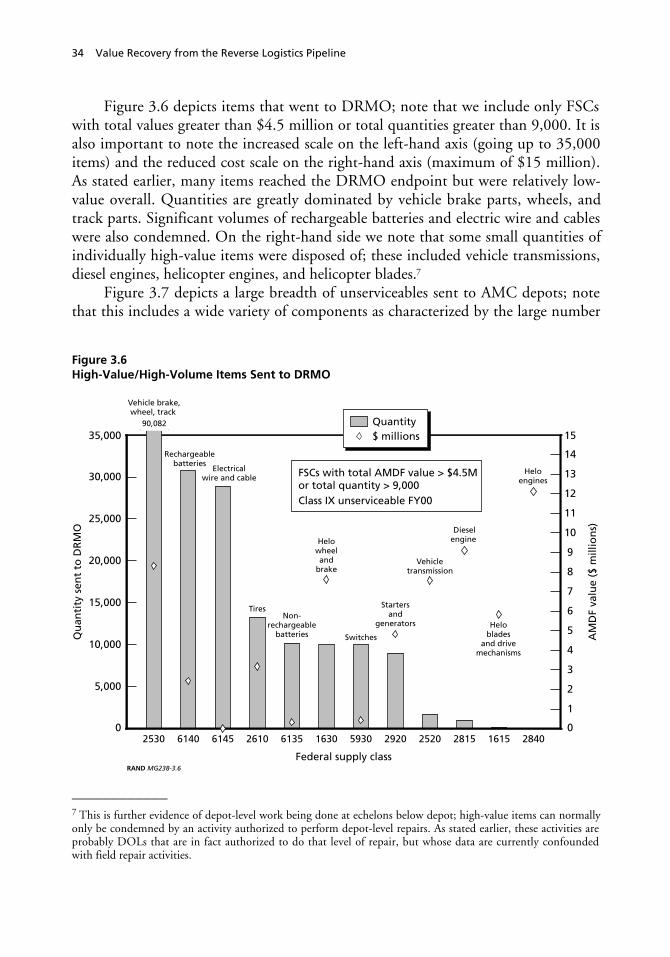
34 Value Recovery from the Reverse Logistics Pipeline
Figure 3.6 depicts items that went to DRMO; note that we include only FSCswith total values greater than $4.5 million or total quantities greater than 9,000. It isalso important to note the increased scale on the left-hand axis (going up to 35,000items) and the reduced cost scale on the right-hand axis (maximum of $15 million).As stated earlier, many items reached the DRMO endpoint but were relatively low-value overall. Quantities are greatly dominated by vehicle brake parts, wheels, andtrack parts. Significant volumes of rechargeable batteries and electric wire and cableswere also condemned. On the right-hand side we note that some small quantities ofindividually high-value items were disposed of; these included vehicle transmissions,diesel engines, helicopter engines, and helicopter blades.7
Figure 3.7 depicts a large breadth of unserviceables sent to AMC depots; notethat this includes a wide variety of components as characterized by the large number
Figure 3.6High-Value/High-Volume Items Sent to DRMO
RAND MG238-3.6
30,000
25,000
20,000
15,000
10,000
5,000
35,000
0
14
13
12
11
10
9
8
7
6
5
4
3
2
1
15
0
Qu
anti
ty s
ent
to D
RM
O
AM
DF
valu
e ($
mill
ion
s)
FSCs with total AMDF value > $4.5Mor total quantity > 9,000Class IX unserviceable FY00
Quantity$ millions
Federal supply class
284016152815252029205930163061352610614561402530
Electricalwire and cable
Rechargeablebatteries
Non-rechargeable
batteries
Dieselengine Helo
wheeland
brake
Tires
Switches
Vehicletransmission
Startersand
generators Heloblades
and drivemechanisms
Heloengines
90,082
Vehicle brake,wheel, track
____________7 This is further evidence of depot-level work being done at echelons below depot; high-value items can normallyonly be condemned by an activity authorized to perform depot-level repairs. As stated earlier, these activities areprobably DOLs that are in fact authorized to do that level of repair, but whose data are currently confoundedwith field repair activities.

Measuring the Reverse Logistics Process 35
Figure 3.7Value and Quantity of Items Sent to AMC Depots
RAND MG238-3.7
2,250
2,000
1,750
1,500
1,250
1,000
750
500
250
2,500
0
130
120
110
100
90
80
70
60
50
40
30
20
10
140
0
Qu
anti
ty s
ent
to d
epo
t
AM
DF
valu
e ($
mill
ion
s)
Federal supply class
97,727
NIINs with total AMDF value > $100kor total quantity > 100Class IX unserviceable FY00
Quantity$ millions
of FSCs. Total value is significant in several FSCs, with a single FSC dominatingquantity. Figure 3.8 expands Figure 3.7 by focusing on the high-aggregate-value/high-volume FSCs; FSCs with total AMDF values less than $15 million andtotal quantities less than 700 have been excluded. First we note that quantities in thissegment of the RL pipeline are huge for one FSC—the one for track—and that it ispredominantly M113 track; while of relatively low value, it does represent significantworkload and transportation cost. Value is significant in several FSCs: M1 tank en-gines, helicopter blades, and helicopter engines. Other high-value items include M1and M2 transmissions, M88 engines, helicopter servo cylinders, and optical sight andrange equipment.
Collecting Data and Identifying Process Segments
In this section, we first look at the process data that were available from Army datasystems and then define data measurements for specific process segments; these corre-spond with previous depictions and discussions of the RL pipeline. Then we portraya general “end-to-end” series of measurements that will comprise a basic RL metricformat, which is used to portray RL performance from an overall Army perspective.
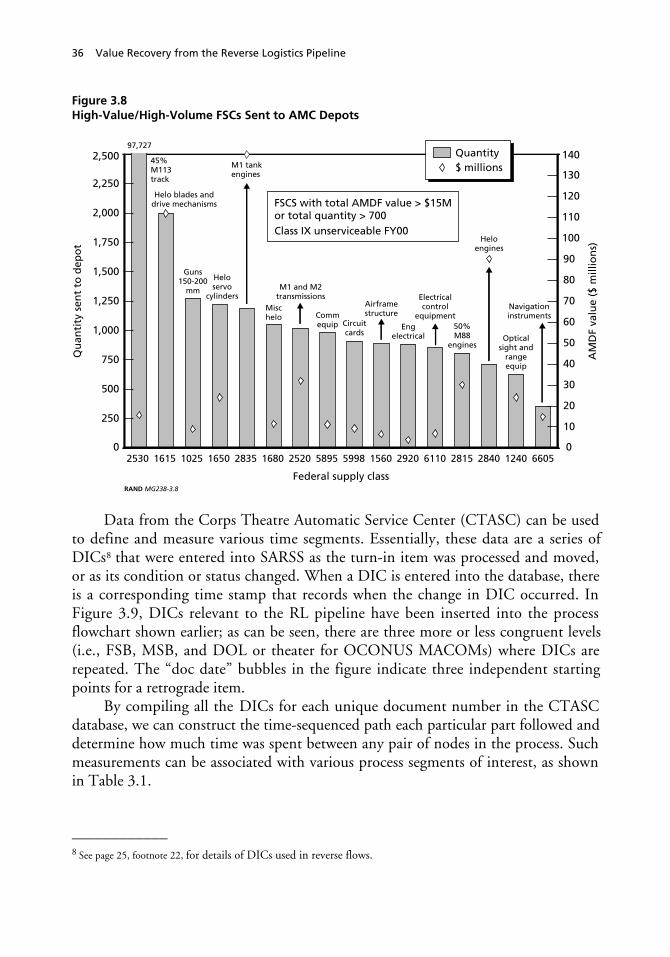
36 Value Recovery from the Reverse Logistics Pipeline
Figure 3.8High-Value/High-Volume FSCs Sent to AMC Depots
RAND MG238-3.8
2,250
2,000
1,750
1,500
1,250
1,000
750
500
250
2,500
0
130
120
110
100
90
80
70
60
50
40
30
20
10
140
0
Qu
anti
ty s
ent
to d
epo
t
AM
DF
valu
e ($
mill
ion
s)
Federal supply class
124028402815611029201560599858952520168028351650102516152530 6605
97,727
FSCS with total AMDF value > $15Mor total quantity > 700Class IX unserviceable FY00
Quantity$ millionsM1 tank
engines
45%M113track
Heloengines
Guns150-200
mm
Heloservo
cylindersMischelo
Helo blades anddrive mechanisms
M1 and M2transmissions
Commequip Circuit
cards
Navigationinstruments
Opticalsight and
rangeequip
Airframestructure
50%M88
engines
Electricalcontrol
equipmentEng
electrical
Data from the Corps Theatre Automatic Service Center (CTASC) can be usedto define and measure various time segments. Essentially, these data are a series ofDICs8 that were entered into SARSS as the turn-in item was processed and moved,or as its condition or status changed. When a DIC is entered into the database, thereis a corresponding time stamp that records when the change in DIC occurred. InFigure 3.9, DICs relevant to the RL pipeline have been inserted into the processflowchart shown earlier; as can be seen, there are three more or less congruent levels(i.e., FSB, MSB, and DOL or theater for OCONUS MACOMs) where DICs arerepeated. The “doc date” bubbles in the figure indicate three independent startingpoints for a retrograde item.
By compiling all the DICs for each unique document number in the CTASCdatabase, we can construct the time-sequenced path each particular part followed anddetermine how much time was spent between any pair of nodes in the process. Suchmeasurements can be associated with various process segments of interest, as shownin Table 3.1.
____________8 See page 25, footnote 22, for details of DICs used in reverse flows.
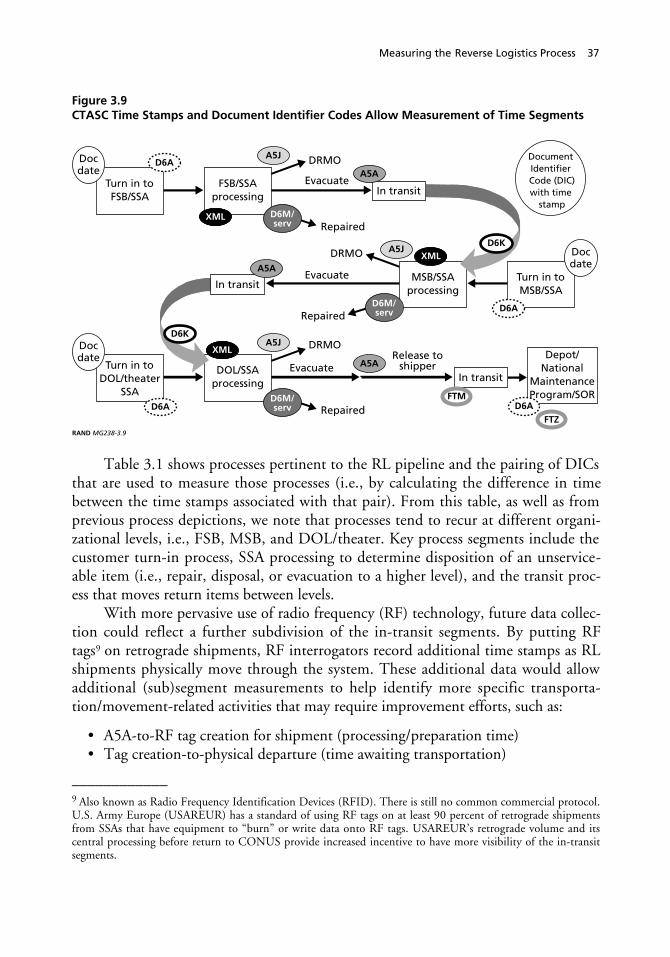
Measuring the Reverse Logistics Process 37
Figure 3.9CTASC Time Stamps and Document Identifier Codes Allow Measurement of Time Segments
MSB/SSAprocessing
XMLXML
RAND MG238-3.9
Repaired
Repaired
Depot/National
MaintenanceProgram/SOR
In transit
In transit
Turn in toDOL/theater
SSA
DOL/SSAprocessing
Release toshipper
DRMO
Repaired
Docdate
FSB/SSAprocessing
DRMO
Evacuate
Evacuate
DRMO
Turn in toFSB/SSA
Document Identifier Code (DIC)with time
stamp
Turn in toMSB/SSA
Evacuate
D6M/serv
D6M/serv
D6M/serv
FTM
FTZ
XMLXML
D6A
D6A D6A
D6A
A5J
A5J
A5J
A5A
XMLXMLA5A
Docdate
Docdate
D6K
D6K
In transit
A5A
Table 3.1 shows processes pertinent to the RL pipeline and the pairing of DICsthat are used to measure those processes (i.e., by calculating the difference in timebetween the time stamps associated with that pair). From this table, as well as fromprevious process depictions, we note that processes tend to recur at different organi-zational levels, i.e., FSB, MSB, and DOL/theater. Key process segments include thecustomer turn-in process, SSA processing to determine disposition of an unservice-able item (i.e., repair, disposal, or evacuation to a higher level), and the transit proc-ess that moves return items between levels.
With more pervasive use of radio frequency (RF) technology, future data collec-tion could reflect a further subdivision of the in-transit segments. By putting RFtags9 on retrograde shipments, RF interrogators record additional time stamps as RLshipments physically move through the system. These additional data would allowadditional (sub)segment measurements to help identify more specific transporta-tion/movement-related activities that may require improvement efforts, such as:
• A5A-to-RF tag creation for shipment (processing/preparation time)• Tag creation-to-physical departure (time awaiting transportation)
____________9 Also known as Radio Frequency Identification Devices (RFID). There is still no common commercial protocol.U.S. Army Europe (USAREUR) has a standard of using RF tags on at least 90 percent of retrograde shipmentsfrom SSAs that have equipment to “burn” or write data onto RF tags. USAREUR’s retrograde volume and itscentral processing before return to CONUS provide increased incentive to have more visibility of the in-transitsegments.
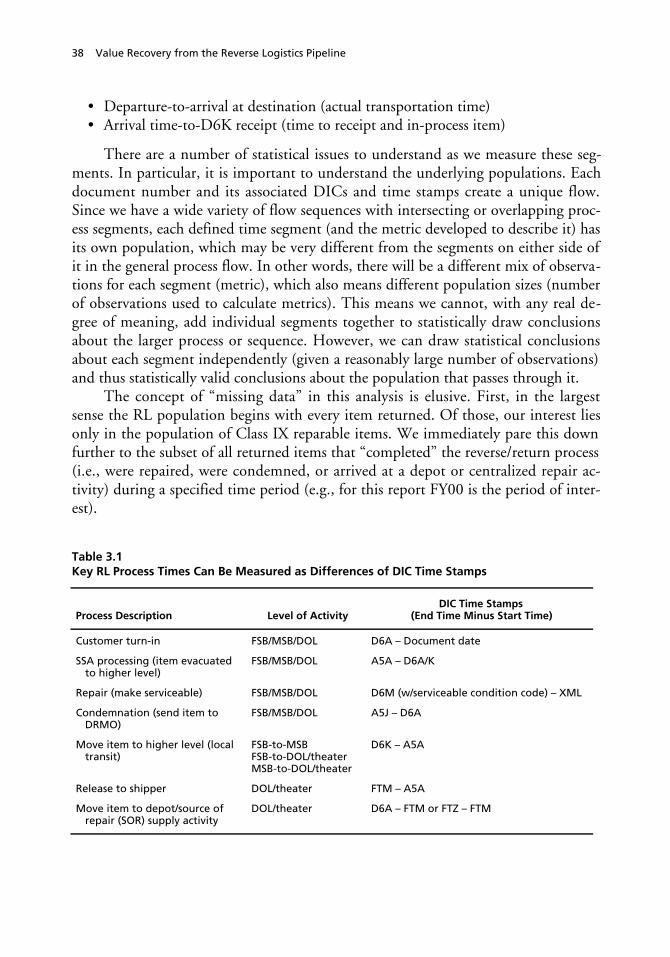
38 Value Recovery from the Reverse Logistics Pipeline
• Departure-to-arrival at destination (actual transportation time)• Arrival time-to-D6K receipt (time to receipt and in-process item)
There are a number of statistical issues to understand as we measure these seg-ments. In particular, it is important to understand the underlying populations. Eachdocument number and its associated DICs and time stamps create a unique flow.Since we have a wide variety of flow sequences with intersecting or overlapping proc-ess segments, each defined time segment (and the metric developed to describe it) hasits own population, which may be very different from the segments on either side ofit in the general process flow. In other words, there will be a different mix of observa-tions for each segment (metric), which also means different population sizes (numberof observations used to calculate metrics). This means we cannot, with any real de-gree of meaning, add individual segments together to statistically draw conclusionsabout the larger process or sequence. However, we can draw statistical conclusionsabout each segment independently (given a reasonably large number of observations)and thus statistically valid conclusions about the population that passes through it.
The concept of “missing data” in this analysis is elusive. First, in the largestsense the RL population begins with every item returned. Of those, our interest liesonly in the population of Class IX reparable items. We immediately pare this downfurther to the subset of all returned items that “completed” the reverse/return process(i.e., were repaired, were condemned, or arrived at a depot or centralized repair ac-tivity) during a specified time period (e.g., for this report FY00 is the period of inter-est).
Table 3.1Key RL Process Times Can Be Measured as Differences of DIC Time Stamps
Process Description Level of ActivityDIC Time Stamps
(End Time Minus Start Time)
Customer turn-in FSB/MSB/DOL D6A – Document date
SSA processing (item evacuatedto higher level)
FSB/MSB/DOL A5A – D6A/K
Repair (make serviceable) FSB/MSB/DOL D6M (w/serviceable condition code) – XML
Condemnation (send item toDRMO)
FSB/MSB/DOL A5J – D6A
Move item to higher level (localtransit)
FSB-to-MSBFSB-to-DOL/theaterMSB-to-DOL/theater
D6K – A5A
Release to shipper DOL/theater FTM – A5A
Move item to depot/source ofrepair (SOR) supply activity
DOL/theater D6A – FTM or FTZ – FTM

Measuring the Reverse Logistics Process 39
In calculating differences between two time stamps to estimate the processingtime for the activity bracketed by those time stamps, it is important to note that weonly have a valid data point or observation when we have both time stamps, i.e., a“start” time and a “stop” time. If one or both time stamps is missing, we cannotcompute a measurement to enter into the analysis. Further, returns enter the processat different echelons, follow different pathways, and receive final disposition at dif-ferent points in the process (i.e., items are repaired or sent to DRMO). So althoughwe begin with a very large set of documents, there can be a much smaller set of ob-servations to measure the various segments.
The reasons for missing time stamps are difficult to assess.10 Most reasons are aform of inaccurate data collection: missing entries, entries with errors, entries thatcreate logical disconnects (e.g., end time is earlier than start time), and so on. How-ever, it is common for data quality to improve when metrics are created and man-agement attention is focused on process improvement.
Developing a Metric Format
From the CTASC data, we developed a set of standard metrics11 to help guide andevaluate improvement efforts. Three sets of metrics, corresponding to logistics eche-lons, were developed to show a generalized end-to-end flow of unserviceable itemsthrough the RL pipeline. The first set depicts FSB-level processes, the second set de-picts MSB-level processes, and the third set depicts DOL/theater-level processes.Figure 3.10 shows the general format for the FSB level with Army-wide data forFY00. In this section we discuss the metric format first; Army-wide RL performancefor all three levels is presented and discussed in subsequent sections.
The metrics in Figure 3.10 correspond to the definitions given in the previoustable. Across the top of the graphic is the process flow, and across the bottom are per-formance measurements. Each column reflects the number of days it takes to com-plete a given process segment. Each segment has been numbered to easily link theprocess or activity to the corresponding measure of performance. The black portionof the column depicts how long it took the fastest 50 percent; the light gray portion
____________10 In particular, the last segment, from theater/installation DOL to depot/centralized repair activity, exhibits largeamounts of missing data. As seen in Table 3.1 and in Figure 3.9, we allowed two different endpoint DICs thatwould indicate arrival at a depot or centralized repair activity, i.e., D6A or FTZ. Below, when we portray anddiscuss Army-wide metrics, we discuss why we chose to use only the D6A as the time stamp for that endpoint.11 Metrics should be dynamic in the sense that they are updated and changed as needed. Once processes are im-proved, the frequency and type of metric measurement might change; possibly the metric will become unneces-sary as improvements are institutionalized. It is also likely that new metrics will need to be developed as processeschange.

40 Value Recovery from the Reverse Logistics Pipeline
Figure 3.10Standard Metric Format for FSB-Level Processing
RAND MG238-3.10
FSB to MSBEvacuateDRMORepairedUnit to FSB FSB to DOL
110
70
60
50
40
30
20
10
120
0
Day
s
80
100
90 95th percentile75th percentile50th percentileMean
Unserviceable Class IXCTASC/FY00
FSB
1
2
3
Unit toFSB
Repaired
Condemned andsent to DRMO
Evacuate4To DOL/theater
To MSB5
6
54321 6
122
depicts the time for the next-fastest 25 percent; and the dark gray portion depicts thenext-fastest 20 percent. From another perspective, the top of the light gray portion ofeach bar is the time for the fastest 75 percent (i.e., the 75th percentile) and the top ofthe dark gray portion of each bar is the time it took to complete the fastest 95 per-cent (i.e., the 95th percentile).
Moving from left to right in Figure 3.10, the flow begins with the customerturn-in process with its corresponding metric labeled with the circled numeral 1. Af-ter turn-in, we consider three possible dispositions at the FSB level: the item is re-paired (metric 2); the item is condemned and sent to DRMO (metric 3); or the itemis evacuated (or passed on) to a higher organizational level (metric 4). Some itemsmay be immediately evacuated to a higher level in accordance with the item’s repair-level code, while others may first be sent to maintenance and then condemned as ap-propriate or evacuated higher if found not repairable at the FSB.
Items that are evacuated from an FSB have two possible destinations—either anMSB or the DOL (for Army units outside the continental United States, there maybe a theater or regional logistics operation that corresponds to the DOL). We canmeasure both in-transit times from DIC time stamps in CTASC; metric 5 is foritems going to an MSB and metric 6 is for items going to the DOL or theater-level

Measuring the Reverse Logistics Process 41
logistics operation.12 FSB shipments to depot repair activities do not typically flowdirectly but rather are processed and shipped through the DOL level first.
Army-Wide RL Performance
Based on our standard metric depiction by level, we next examine actual Army per-formance. For our purposes here, Army performance, or an Army-wide perspective,is defined as pertaining to the active component in the following MACOMs:USAREUR, EUSA, USARPAC, FORSCOM, and TRADOC.13
For purposes of establishing a baseline measurement, the metrics that follow arefor the reverse flow of unserviceable Class IX items during the period 1 October1999 through 30 September 2000 (i.e., FY00). The flows that are extracted from theCTASC database are “completed” documents, i.e., those that reflect an item reachingone of three defined endpoints:
• repaired (returned from maintenance with a serviceable condition code)• condemned (sent to DRMO with condition code H)• evacuated to depot/SOR (receipted by supply activity at wholesale/centralized
repair activity)
As shown in Figure 3.11, more than 73,700 unserviceable Class IX documentsthat were initiated by an FSB customer were completed (i.e., reached one of the de-fined reverse pipeline endpoints: repaired, condemned, evacuated to de-pot/centralized SOR) during the FY00 baseline period. The FSB turn-in process(metric 1, document date to receipt entered into SARSS at the SSA) has a mean of5.9 days, with half of the turn-ins taking 2 days or less. However, 5 percent of theturn-ins took more than 21 days. Although relatively short, the nature of the processsuggests that this is a segment that can easily be improved. The task is fairly simpleand straightforward: take the part for turn-in to the unit’s SSA along with any re-quired paperwork. The measurement of this segment is very conservative, since it be-gins when the mechanic/customer is ready to turn in the unserviceable item and cre-ates the turn-in document.14
____________12 As discussed earlier, if RF data were captured, the overall transit segment (metrics 5 and 6) could be furthersubdivided to capture more details of the movement process.13 USAREUR is U.S. Army Europe, EUSA is Eighth U.S. Army (Korea), USARPAC is U.S. Army Pacific,FORSCOM is Forces Command (CONUS), and TRADOC is Training and Doctrine Command (CONUS).14 Army procedures allow the mechanic a choice as to when the document is created—either at the time the faultis identified and a replacement part ordered, or when that replacement part is received. The first practice is morestringent and reflects a longer turn-in process. Most appear to use the latter procedure, i.e., creating the turn-indocument when the replacement part is received. The different practices may account for the longest 5 percenttaking more than 21 days, as noted above.

42 Value Recovery from the Reverse Logistics Pipeline
Figure 3.11FSB Processing of Unserviceable Retrograde
RAND MG238-3.11
FSB to MSBEvacuateDRMORepairedUnit to FSB FSB to DOL
110
70
60
50
40
30
20
10
120
0
Day
s
80
100
90 95th percentile75th percentile50th percentileMean
Unserviceable Class IXCTASC/FY00
FSB
1
2
3
Unit toFSB
N = 73,70011%
Repaired 33%
67%20%Condemned and
sent to DRMO
69%Evacuate4
To DOL/theater
To MSB5
6
54321 6
122
Metric 2 reflects the repair process time of Army FSB maintenance shops.15 Al-though comparatively long, it encompasses wait time, time to troubleshoot and re-pair, and probably includes batching of items before return to the SSA. The end re-sult is value recovery for the Army, since the process yields a serviceable part. Thesedata are based on more than 6,700 successful repairs by FSBs throughout the activeArmy.
Metrics 3 and 4 reflect that little time is spent to condemn parts or to processunserviceable parts that are not repaired by FSB shops for evacuation to a higherechelon of repair. Seventy-five percent of the items that end up being condemned areprocessed the same day they are turned in; 5 percent take more than 2 days. Almost70 percent of the items turned in to FSBs are evacuated; 95 percent of those areprocessed on the same day they are turned in.
Metrics 5 and 6 reflect another candidate area for process improvement: transittime to another organization. Metric 5 captures movement time to an MSB and is
____________15 Repair time that does not result in a successful repair is not captured in this metric. If the mechanic ends upcondemning the item, the repair time spent becomes part of metric 3. Similarly, if the mechanic cannot repair itand evacuates it to a higher level, any repair time spent becomes part of metric 4.
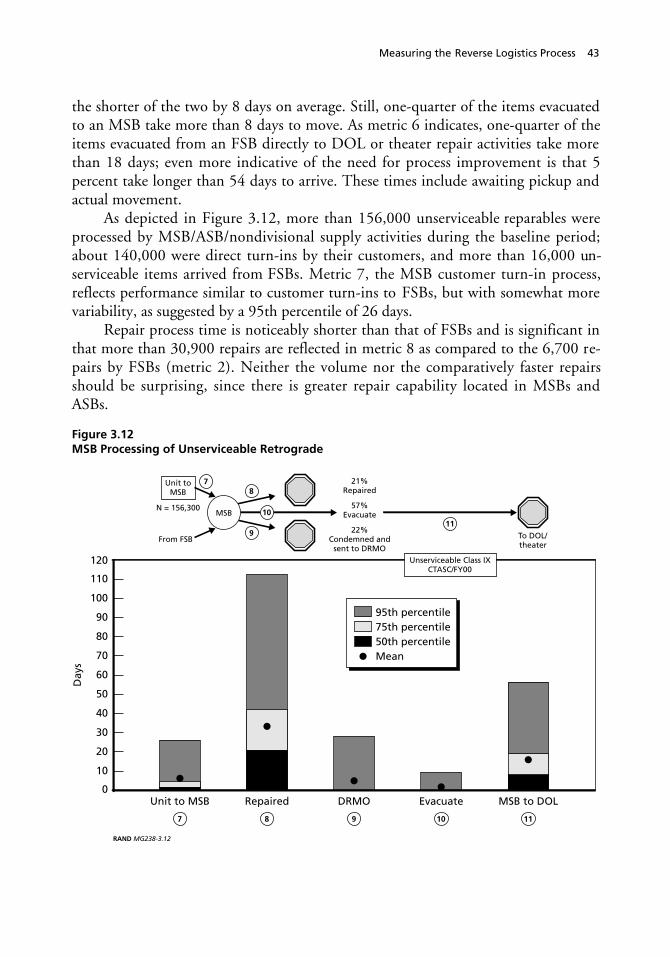
Measuring the Reverse Logistics Process 43
the shorter of the two by 8 days on average. Still, one-quarter of the items evacuatedto an MSB take more than 8 days to move. As metric 6 indicates, one-quarter of theitems evacuated from an FSB directly to DOL or theater repair activities take morethan 18 days; even more indicative of the need for process improvement is that 5percent take longer than 54 days to arrive. These times include awaiting pickup andactual movement.
As depicted in Figure 3.12, more than 156,000 unserviceable reparables wereprocessed by MSB/ASB/nondivisional supply activities during the baseline period;about 140,000 were direct turn-ins by their customers, and more than 16,000 un-serviceable items arrived from FSBs. Metric 7, the MSB customer turn-in process,reflects performance similar to customer turn-ins to FSBs, but with somewhat morevariability, as suggested by a 95th percentile of 26 days.
Repair process time is noticeably shorter than that of FSBs and is significant inthat more than 30,900 repairs are reflected in metric 8 as compared to the 6,700 re-pairs by FSBs (metric 2). Neither the volume nor the comparatively faster repairsshould be surprising, since there is greater repair capability located in MSBs andASBs.
Figure 3.12MSB Processing of Unserviceable Retrograde
RAND MG238-3.12
MSB to DOLEvacuateDRMORepairedUnit to MSB
110
70
60
50
40
30
20
10
120
0
Day
s
80
100
90
Unserviceable Class IXCTASC/FY00
To DOL/theater
MSB
78
9
Unit toMSB
N = 156,300
From FSB
21%Repaired
22%Condemned and
sent to DRMO
57%Evacuate10
11
1110987
95th percentile75th percentile50th percentileMean
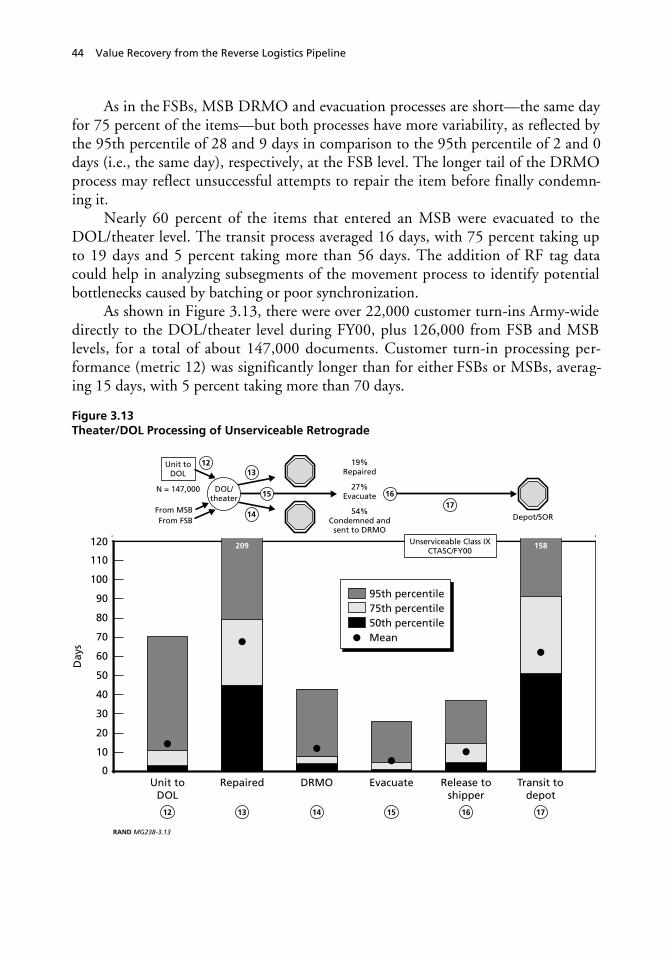
44 Value Recovery from the Reverse Logistics Pipeline
As in the FSBs, MSB DRMO and evacuation processes are short—the same dayfor 75 percent of the items—but both processes have more variability, as reflected bythe 95th percentile of 28 and 9 days in comparison to the 95th percentile of 2 and 0days (i.e., the same day), respectively, at the FSB level. The longer tail of the DRMOprocess may reflect unsuccessful attempts to repair the item before finally condemn-ing it.
Nearly 60 percent of the items that entered an MSB were evacuated to theDOL/theater level. The transit process averaged 16 days, with 75 percent taking upto 19 days and 5 percent taking more than 56 days. The addition of RF tag datacould help in analyzing subsegments of the movement process to identify potentialbottlenecks caused by batching or poor synchronization.
As shown in Figure 3.13, there were over 22,000 customer turn-ins Army-widedirectly to the DOL/theater level during FY00, plus 126,000 from FSB and MSBlevels, for a total of about 147,000 documents. Customer turn-in processing per-formance (metric 12) was significantly longer than for either FSBs or MSBs, averag-ing 15 days, with 5 percent taking more than 70 days.
Figure 3.13Theater/DOL Processing of Unserviceable Retrograde
RAND MG238-3.13
Release toshipper
EvacuateDRMORepairedUnit toDOL
Transit todepot
110
70
60
50
40
30
20
10
120
0
Day
s
80
100
90
Unserviceable Class IXCTASC/FY00
Depot/SOR
DOL/theater
1213
14
Unit toDOL
N = 147,000
From MSBFrom FSB
19%Repaired
54%Condemned and
sent to DRMO
27%Evacuate15 16
17
1615141312 17
209 158
95th percentile75th percentile50th percentileMean

Measuring the Reverse Logistics Process 45
Repair times were lengthy, with a mean of almost 70 days and a 95th percentileof 209 days. Some of this may be expected, as the DOLs typically have greater repaircapabilities and will attempt to make difficult repairs that other levels would not evenconsider. Over 28,200 successful repairs were conducted during FY00 atDOL/theater-level repair activities.
DOL/theater-level DRMO processing and evacuation times are longer thanother echelons. More than half of the items turned in to the DOL/theater were con-demned; most were disposed of within 8 days, but 5 percent took longer than 43days.
Twenty-seven percent of unserviceable reparables flowing throughDOLs/theater levels were evacuated to depot/centralized repair activities. Metric 15includes the time from receipt in the DOL/theater activity until identification thatthe item needs to be evacuated to a higher echelon of repair, i.e., depot/centralizedrepair activity. For metric 15, items averaged 6.3 days and 5 percent took longer than26 days. Metric 16 reflects the performance times for processing/preparing theseitems for shipment to depot or other centralized repair activities. The process beginsfrom the point that an item is identified for evacuation until it is released to a shipperfor transportation; activities include preparation for shipment, such as cleaning,packaging, and crating, as well as wait time for pickup by a shipper. Half the itemstook up to 5 days, with a mean of almost 11 days.
Once picked up, the time to move items to a depot/SOR averaged over 62 daysacross the Army, with 5 percent taking longer than 158 days. The long times for thisprocess segment are affected by long(er) distances and the increased complexity ofoverseas shipments (i.e., increased nodes and modes). However, there may also beprocessing or receiving issues at the wholesale repair points (depot/SOR); RF tag datawould help pinpoint where to focus improvement efforts.
MACOM Performance on Key Segments
To further analyze Army RL performance, we next examine individual MACOMmetrics. The MACOMs included in this report are USAREUR, EUSA in Korea,USARPAC, FORSCOM, and TRADOC. Each MACOM was defined by mappingunit-specific RICs16 by level, i.e., FSB, MSB, or DOL/theater, and RL data were ex-tracted accordingly.
To gain a broad perspective for initial analysis of the RL flows by MACOM, weexamine the disposition of unserviceable reparables in terms of the three defined
____________16 A unique Routing Identifier Code or RIC is assigned to individual SSAs/supply sources at specific geographicallocations. For example, “WBR” is the RIC used to identify the SSA in the 565th Repair Parts Company at FortHood, Texas.
46 Value Recovery from the Reverse Logistics Pipeline
endpoints, i.e., how much in terms of volume and value is (1) repaired, (2) con-demned and sent to DRMO, or (3) evacuated to AMC depot repair activities. Thisprovides an initial perspective on how much activity occurred by endpoint and orga-nization.
Next we examine metrics for key segments in the RL process, such as customerturn-ins, on-post transit, the transit from post to centralized stocks, and repair. Thesecan be tracked and analyzed for possible improvements. The turn-in process beginsthe RL process and has been identified by many as unduly time-consuming, withmany delays. It has also been observed that the transit of retrograde materiel (in-cluding wait time) from one organization to another (even on the same installation)tends to consume large amounts of time—making those segments candidates for im-provement.
The size or volume of the reverse pipeline should also have a reduction goal, asit represents investment in inventory. We measure how many unserviceables are inthe system—in particular, items that appear to have stopped moving toward one ofthe three endpoints. The volume and value of these items reflect investment that isunproductive in its current location and/or condition. Reduction from an Army-wide perspective can lead to less investment in stocks overall as well as increasedequipment readiness.
Figure 3.14 depicts a by-MACOM comparison of the time it took for an un-serviceable reparable to reach one of the three defined endpoints. As is apparent, theMACOMs differ considerably. It is important to remember that there is not a “levelplaying field” when comparing MACOMs; however, we may gain some insights bydoing so. Differences in MACOM characteristics include geographic dispersion ofunits (customers, maintenance shops, and SSAs) and location (OCONUS versusCONUS), missions, and assigned equipment, as well as mere size. For example, themetrics here are based on different volumes of activity; generally the RL data reflectthat FORSCOM units account for about 55 percent of the volume, followed byUSAREUR (22 percent), EUSA (14 percent), TRADOC (5 percent), andUSARPAC (4 percent).
Generally, across the three endpoints, we note in Figure 3.14 that the overseasMACOMs (USAREUR, EUSA, and USARPAC) take longer to move items throughthe RL pipeline and FORSCOM tends to move items more quickly. In other words,the means for overseas MACOMs tend to be higher than the overall Army mean,while the FORSCOM means tend to be lower (faster). Variability, as reflected by the95th percentile, also tends to be higher overseas. OCONUS operations typically facemore complex procedures as the Army interacts with foreign national providers (e.g.,workers, transporters, etc.) and has to deal with greater geographical constraints; inother words, logistics processing and movement of retrograde materiel typically takesomewhat longer than CONUS operations.

Measuring the Reverse Logistics Process 47
Figure 3.14Total Time to Reach Endpoints by MACOM
180
160
140
120
100
80
60
40
300
0
130,000
120,000
70,000
60,000
50,000
40,000
30,000
20,000
10,000
0
Day
s
Nu
mb
er o
f d
ocu
men
ts
RepairedActi
ve A
rmy
USARPA
CEU
SA
TRADOC
FORSC
OM
USAREU
R
Active
Arm
y
USARPA
CEU
SA
TRADOC
FORSC
OM
USAREU
R
Active
Arm
y
USARPA
CEU
SA
TRADOC
FORSC
OM
USAREU
R
DRMO Depot/SOR
RAND MG238-3.14
200
220
280
260
240
20
110,000
100,000
90,000
80,000
95th percentile 75th percentile 50th percentile Mean N
Unserviceable Class IXCTASC/FY00
OverseasMACOMs
Repaired Endpoint
The overall Army mean for unserviceables that are repaired at echelons below the de-pot or centralized source of repair (SOR) level was just over 33 days. That is the timefrom the document date used to turn in the item until the item returns from a main-tenance shop with a serviceable condition code. The 50th percentile for the Armywas 20 days, with MACOMs ranging from 15 to 26 days; MACOM means variedbetween 25 and 42 days. In particular, we also note that USAREUR and USARPACtend to experience greater variability.
DRMO (Condemned) Endpoint
The Army mean time from when unserviceables are turned in until they are con-demned and sent to DRMO is about 28 days. 50th percentiles range from 9 to 22days, and there is notable variability in USARPAC, as reflected by the 95th percen-tile. One observation is that these items are the least valuable in terms of value recov-
48 Value Recovery from the Reverse Logistics Pipeline
ery but are quickest in reaching an endpoint. From another perspective, this is goodbecause they leave the system and reduce clutter.
Evacuated to AMC Depot Endpoint
The Army mean for unserviceable items whose endpoint becomes an AMC depot isalmost 82 days, and this does not include any depot repair time. With longer transitdistances and higher process complexity, the longer times for OCONUS are not un-expected; however, USAREUR’s performance is notably longer—even at the 50thpercentile. As expected, FORSCOM has much shorter times due to CONUS loca-tions. Even so, with the magnitudes of the times reflected, it is likely that there areimprovement opportunities in this area.
Customer Turn-In Segment
Next we examine the beginning point for RL: customer turn-in time. A mechanicusually turns in an unserviceable part, component, or carcass to the maintenanceshop office and the unit parts clerk turns it in to the supporting SSA along with anyrequired documents; this metric measures the elapsed time between the using organi-zation (i.e., the maintenance shop) and entry into the supply system (i.e., receipt atan SSA). The clock starts when maintenance creates a turn-in document. Figure 3.15shows that there is much variability in performance. The median performance formost commands tends to be around 2 days, but the means are higher because of thelarge variability. For this metric, Army Regulation 710-2 sets a goal of 5 days andrequires management-level review at 10 days, shown by the dotted lines on the fig-ure. While many organizations seem to be within those standards, one should ques-tion whether these levels are appropriate—this measures a fairly simple turn-in proc-ess, which begins the whole value recovery effort. As noted earlier, one can make asound argument that the “clock” should begin even earlier, i.e., when the part isidentified as broken and a replacement part is ordered (or at least from the time thereplacement part is received).
On-Post/In-Theater Transit Segments
Local transit time metrics (Figure 3.16) capture the movement from one level orechelon to another, starting with “release” for shipment until receipt at the nextechelon; this includes waiting and transit time. For CONUS MACOMs thesemovements are relatively short—sometimes merely across a parking lot or down thestreet. However, “local” becomes relative for OCONUS posts, where the movementis typically much longer (for example, in USAREUR, from the Frankfurt area toKaiserslautern is around 70 miles). In EUSA, the road conditions and traffic conges-tion can also cause delays in moving unserviceables in the area around Seoul, Koreaand particularly from the 2nd Infantry Division Forward area north of Seoul to

Measuring the Reverse Logistics Process 49
Figure 3.15Value Recovery Process Begins with Customer Turn-In Segment
80
70
60
50
40
30
20
10
90
0
90,000
80,000
70,000
60,000
50,000
40,000
30,000
20,000
10,000
0
Day
s
Nu
mb
er o
f d
ocu
men
ts
FSB
SOURCE: AR710-2, Table 1-1.
Active
Arm
y
USARPA
CEU
SA
TRADOC
FORSC
OM
USAREU
R
Active
Arm
y
USARPA
CEU
SA
TRADOC
FORSC
OM
USAREU
R
Active
Arm
y
USARPA
CEU
SA
TRADOC
FORSC
OM
USAREU
R
MSB DOL/theater
RAND MG238-3.15
Unserviceable Class IXCTASC/FY00
OverseasMACOMs
140,148
N/A N/AN/A
Manage-mentlevel
Goal
95th percentile 75th percentile 50th percentile Mean N
Camp Carroll. The metrics for all MACOMs suggest that these transit times shouldbe investigated for possible improvements. RF tag data could help identify more spe-cifically where time delays occur.
Transit to Off-Post Centralized Repair Segment
Figure 3.17 depicts the elapsed time from when an item is turned over to a shipperuntil it is receipted at a repair depot or centralized SOR (more specifically, the DLAsupply activity at that location). The overall Army mean is over 63 days for an un-serviceable to be delivered from a post or theater to a depot or centralized SOR.However, the Army mean combines the shorter times for FORSCOM in CONUSwith the longer transit times for OCONUS MACOMs—predominantly by sealiftover great distances.
When we compare forward OCONUS transit times for sealift shipments foreach theater with the RL performance for that theater, it is apparent that these times

50 Value Recovery from the Reverse Logistics Pipeline
Figure 3.16Local Transit times Indicate Significant Delays
80
70
60
50
40
N/A
30
20
10
90
0
100,000
90,000
80,000
70,000
60,000
50,000
40,000
30,000
20,000
10,000
0
Day
s
Nu
mb
er o
f d
ocu
men
ts
FSB-to-MSB transitActi
ve A
rmy
USARPA
CEU
SA
TRADOC
FORSC
OM
USAREU
R
Active
Arm
y
USARPA
CEU
SA
TRADOC
FORSC
OM
USAREU
R
Active
Arm
y
USARPA
CEU
SA
TRADOC
FORSC
OM
USAREU
R
FSB-to-DOL transit MSB-to-DOL transit
RAND MG238-3.16
Unserviceable Class IXCTASC/FY00
N/A N/A
95th percentile 75th percentile 50th percentile Mean N
can be significantly shortened. The sailing time performance provides a reasonableestimation of the minimum performance that might be achieved for this RL segment.
Volume and Value of Reverse Pipeline for Unserviceable Reparables
Using the Asset Balance File (ABF) in the CTASC database, we can capture thequantity of unserviceable stock on-hand that is not in a supply activity at an AMCdepot, as shown in Figure 3.18.17 These data were captured once a month (generallyat the end of the month) and plotted to depict the trend over time. The data for2002 reflect that FORSCOM has the most unserviceable reparables at local levels,
____________17 The increase in the amount of unserviceables shown in Figure 3.18 is most likely due to the start of the Army’stransition to Single Stock Fund (SSF) in FY01. Prior to the transition, there were two separate stock funds ownedby different organizations; these have been gradually merged, creating a number of credit and pricing issues. Un-der SSF, AMC also assumes ownership of unserviceable reparables much earlier in the returns process; an ob-served change is that unserviceables do not automatically move to depot storage awaiting induction to a repairline as they did before SSF. See Pint et al. (2002) for further discussion of SSF and related issues.

Measuring the Reverse Logistics Process 51
Figure 3.17Transit Time from Post/Theater to Depot Repair Activity
140
70
60
50
40
30
20
10
150
0
Day
s
Reverse channels
SOURCE: RAND integrated strategic distribution database.
Active
Arm
y
USARPA
CEU
SA
TRADOC
FORSC
OM
USAREU
R
USARPA
CEU
SA
TRADOC
FORSC
OM
USAREU
R
USARPA
CEU
SA
USAREU
R
Forward channels (September 2001)
RAND MG238-3.17
130
120
110
100
90
80
Unserviceable Class IXCTASC/FY00
158 152194
N/A
Surface CWT(–)
RWT Sailing time
95th percentile 75th percentile 50th percentile Mean
followed by USAREUR. Comparing December 2002 with the end of the baselineperiod, September 2000, Figure 3.18 shows that most MACOMs have increasedquantities of unserviceables in process. These stocks are components and parts thathave been identified as reparable items that the Army intends to repair and return tostock if possible; as a metric this should be tracked over time as a measure of the sizeof the RL pipeline that is in work (or in process). The impact of improvement effortsthat are intended to reduce the amount of unserviceable items in process should bereflected in this metric. Increases or high quantities of unserviceables in the RL pipe-line may indicate unproductive investment in inventory.
In Figure 3.19, the total AMDF value of unserviceable on-hand stock through-out the Army is overlaid on the quantities shown in Figure 3.18. The value of theseinventories tends to change in the direction that quantity changes; for example, ifquantity increases, there is a corresponding change in value. However, there are someunexplained anomalies beginning in January 2002, where the quantity decreases but
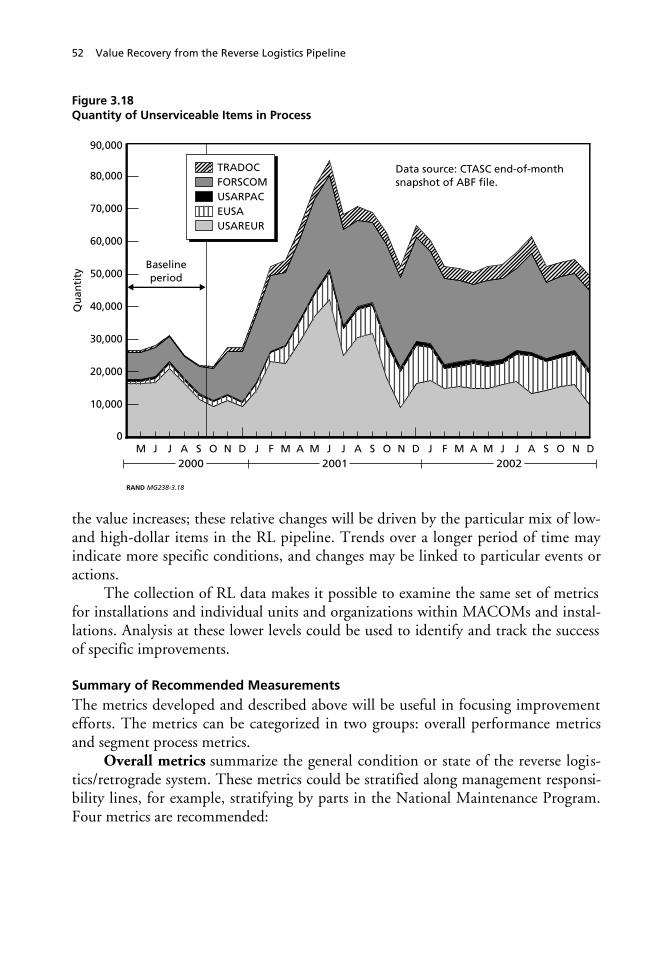
52 Value Recovery from the Reverse Logistics Pipeline
Figure 3.18Quantity of Unserviceable Items in Process
RAND MG238-3.18
NOSAJJMAMFJDNOSAJJMAMFJDNOSAJJM D
Data source: CTASC end-of-monthsnapshot of ABF file.
80,000
70,000
60,000
50,000
40,000
30,000
20,000
10,000
90,000
0
Qu
anti
ty
Baselineperiod
TRADOCFORSCOMUSARPACEUSAUSAREUR
2000 20022001
the value increases; these relative changes will be driven by the particular mix of low-and high-dollar items in the RL pipeline. Trends over a longer period of time mayindicate more specific conditions, and changes may be linked to particular events oractions.
The collection of RL data makes it possible to examine the same set of metricsfor installations and individual units and organizations within MACOMs and instal-lations. Analysis at these lower levels could be used to identify and track the successof specific improvements.
Summary of Recommended Measurements
The metrics developed and described above will be useful in focusing improvementefforts. The metrics can be categorized in two groups: overall performance metricsand segment process metrics.
Overall metrics summarize the general condition or state of the reverse logis-tics/retrograde system. These metrics could be stratified along management responsi-bility lines, for example, stratifying by parts in the National Maintenance Program.Four metrics are recommended:
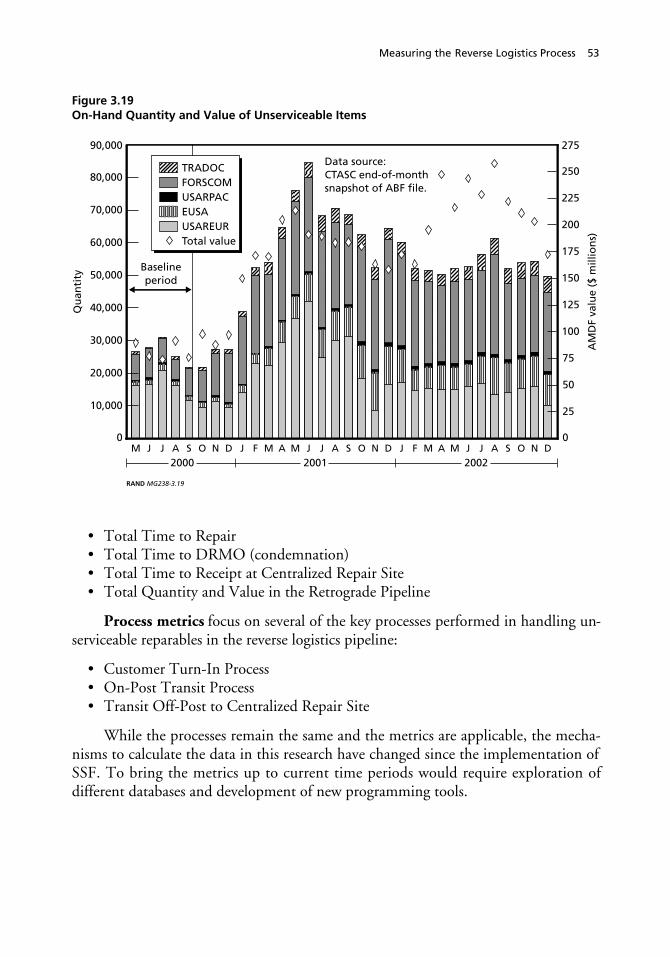
Measuring the Reverse Logistics Process 53
Figure 3.19On-Hand Quantity and Value of Unserviceable Items
RAND MG238-3.19
NOSAJJMAMFJDNOSAJJMAMFJDNOSAJJM D2000
Data source:CTASC end-of-monthsnapshot of ABF file.
80,000
70,000
60,000
50,000
40,000
30,000
20,000
10,000
90,000
0
Qu
anti
ty
20022001
Baselineperiod
250
225
200
175
150
125
100
75
50
25
275
0
AM
DF
valu
e ($
mill
ion
s)
TRADOCFORSCOMUSARPACEUSAUSAREURTotal value
• Total Time to Repair• Total Time to DRMO (condemnation)• Total Time to Receipt at Centralized Repair Site• Total Quantity and Value in the Retrograde Pipeline
Process metrics focus on several of the key processes performed in handling un-serviceable reparables in the reverse logistics pipeline:
• Customer Turn-In Process• On-Post Transit Process• Transit Off-Post to Centralized Repair Site
While the processes remain the same and the metrics are applicable, the mecha-nisms to calculate the data in this research have changed since the implementation ofSSF. To bring the metrics up to current time periods would require exploration ofdifferent databases and development of new programming tools.

55
CHAPTER FOUR
Improving the Reverse Logistics Process
The next steps in the Define-Measure-Improve (D-M-I) methodology are to identifyimprovement opportunities, implement those improvements, measure the resultingperformance, evaluate their success, and look for additional improvement opportuni-ties. “Improvement” has several interrelated dimensions to consider, such as increasedvelocity, reduced variability, and a higher rate of value recovery. Ultimately the goalis more responsive sustainment and support of Army soldiers at reduced inventorycosts. Reduced variability adds another advantage: reducing the workload burdenimposed by the reverse pipeline.
In this chapter, we present some preliminary observations and then suggest areaswhere improvement opportunities are likely to yield systemwide benefits. First effortsshould focus on the process segments where the metrics indicate long delays, as wellas on critical segments.1 Such efforts will improve speed and reduce variability.
Streamline Installation Turn-In Procedures
The following recommendations are offered with the objective of eliminating non-value-adding tasks for the soldier and to reduce overall materiel and transportationcosts for the Army.
• Turn-in requirements appear to cause delays. They should be examined with aneye toward streamlining and a goal of minimizing the requirements on the
____________1 Dowlatshahi (“Developing a Theory of Reverse Logistics,” Interfaces, May–June 2000) offers seven operationalfactors—customer, cost-benefit analysis, transportation, warehousing, supply management, remanufacturing/recycling, and packaging—for a reverse logistics system. In this report, we have restricted our view of the Army’sRL system to primary flows within an existing system—as compared to redesigning that system. Dowlatshahi’sperspective would be useful to examine redefinition/redesign of the Army system to include broader concepts ofwhat should be remanufactured, the design of components and equipment specifically with remanufacturing inmind, etc.
56 Value Recovery from the Reverse Logistics Pipeline
maintenance activity initiating the turn-in process. The resulting requirementsshould be coordinated at all levels.2
• To reduce the turn-in time, the Army should consider establishing a “Due-Infrom Maintenance” requirement for turning in an unserviceable reparable “car-cass” when the serviceable replacement component is ordered and issued. Thisrequirement should include time requirements and reports that focus manage-ment attention on delays.
• Another way to reduce turn-in time is to review and determine the minimumessential documentation needed to process the items being turned in. If adocument is not used or duplicates another, it should be eliminated. Again, thisreview should seek to minimize the burden on organizations initiating a turn-in.
• A review of essential cleaning, draining, safety, and protective measures couldalso lead to streamlining and simplifying the turn-in process, thereby reducingthe workload burden on the field. There are reasonable standards that should bedetermined and consistently applied to balance costs and benefits.
• Consider differences in packaging requirements for intra-post transport versusthose for items that enter commercial or military transportation systems for off-post delivery. Identify the appropriate requirements by level and then placeneeded packaging material and/or equipment there. For example, an unservice-able transfer case at the DS or organizational level should be drained (but notsteam-cleaned) and caps should be installed as appropriate. It could be trans-ported via pallet to the DOL or local repair point. If necessary for off-postshipment, additional or alternative packaging as applicable for transportationover-the-road or air shipment would be applied there.
• When issued parts are received at the point of equipment repair, the packingmaterial should be retained and used to package the unserviceable part for turn-in. This would eliminate many of the packaging issues.
• Similarly, the Army (or DoD) could consider including the paperwork necessaryfor the turn-in of unserviceable reparables with the serviceable issue. As an ex-ample, when customers receive a laser printer toner cartridge from Hewlett-Packard, they also receive a reusable package with all the necessary UPS labels tosend the used cartridge back.3
____________2 In his review of this report, Dr. Dale Rogers offered the following perspectives of commercial turn-in experi-ences. He notes that in the private sector, the front-line gatekeeping personnel at the retail service desk are noto-riously uninterested in documenting much about the returned item unless the service desk system requires themto do so. The turn-in process has to be simplified to make it happen. Farther into the RL process (such as at acentral return center), more detailed data may be developed. It usually increases the velocity of the reverse logisticssystem to evacuate first with simple documentation, with a detailed analysis of the problem occurring later in theflow. Making it easy for frontline personnel will likely speed up the process.3 Ron Giuntini and Tom Andel, “Master the Six R’s of Reverse Logistics,” Integrated Warehousing & Distribu-tion, March 1995.
Improving the Reverse Logistics Process 57
Route and Hold Items with “Next Step” in Mind
Set Routing Identifier Code (RIC) Ship-To table parameters so that items flow asdirectly as possible; for example, components repaired at the DOL should flow di-rectly from the FSB. Under SSF there may be requirements to direct documentationto intermediate organizations, i.e., an Army Working Capital Fund (AWCF) supplyorganization on post, even if the item may be routed more directly.
Expeditious return of all unserviceable reparables to appropriate designated loca-tion(s) for eventual repair has potential advantages. Foremost is visibility of system-wide carcasses to the item manager as well as reduced collection and shipping costand time when a repair decision is made. This should occur whether or not there is acurrent active repair program for the item.
A number of broader, systemwide issues need to be worked out concerning theabove recommendations. In particular, transfer fees that are in place for DLA issuesand receipts from DLA warehouses should be examined and adjusted so that theimmediate economic decision matches a longer-range perspective. Also, second-destination transportation charges should be re-evaluated.
Integrate Reverse Pipeline with Forward Pipeline
Integration of the Army’s forward and reverse pipelines potentially offers better per-formance and perhaps cost savings. The economics of volume can be realized by in-tegrating some of the reverse and forward flows as well as through using the corecompetencies of different organizations like DLA distribution centers.
Studies should be conducted to examine opportunities for integration and toimplement cost-effective, time-definite/scheduled reverse distribution channels. Suchchannels could consist of hub-and-spoke networks or “milk runs.” Further, forOCONUS MACOMs, one might even eliminate in-theater sorting by destination,thus creating higher volumes in return channels to SDPs.
DLA’s core competency in sorting and distribution should be fully explored.Parts repaired at depot or centralized SOR facilities (which represent successful valuerecovery) could be positioned at SDPs for more immediate movement to customerswhen a demand is received. Holding these repaired items at the repair site, as is oftenthe current practice, increases CWT. Careful consideration based on historical de-mands should give an accurate idea of how much of each item to stock at each SDP.
The analyses described here to evaluate reverse distribution networks might becombined with the aforementioned need to streamline the flow so items are routed torepair facilities as directly as possible. The next step might be to expand this broadernetwork analysis to determine opportunities for distribution and repair facility na-tionalization.

58 Value Recovery from the Reverse Logistics Pipeline
Examine Potential Applicability of Commercial Software Solutions
A recent article on returns management4 cites two case studies where software solu-tions helped automate the return process and thus reduced expenses and potentialerrors. In both cases, the RL process innovations were developed in partnership withFedEx and included an online processing system. Examples of improvement applica-tions included online return templates, return label printout capability, scannable barcodes, end-to-end electronic returns processing, and inventory visibility. One com-pany reduced the man-hours required to process a returns pickup by about 70 per-cent; this involved an Internet-based returns management system that streamlinedcoordination between the customer initiating a return, FedEx as the transportationagent, and the company. The Army could potentially achieve similar savings by con-sidering regularly scheduled shipping of unserviceables along with serviceables as dis-cussed above rather than arranging less-than-truckload pickups one by one as needed.The automated and streamlined procedures also provide savings by eliminating un-necessary intermediate handling points in the returns process.
An important point emphasized is that “a haphazard returns process can resultin returns’ not receiving a correct disposition. For example, there is a chance that anitem that could be sold as new will be sent to a salvage or discount company for dis-posal, resulting in lost revenue.”5 Equivalently for the Army, this means the possibleloss of serviceable assets—potentially degrading readiness and increasing inventoryinvestment. Better automation and information processing aids should improve thequality and timeliness of data. Improving both of these data attributes should enablemore effective reverse pipeline process monitoring and control. Additionally, thismay facilitate the development of process redesign ideas by easing analysis.
Financial Incentives Should Be Consistent with Improvement Efforts
Financial incentives such as credit policies, transportation fee structures, surcharges,etc. must necessarily align with and support decisions to improve the flow of unserv-iceable reparables to an endpoint. Such issues are inherent in influencing the behav-ior of the various members of the reverse supply chain. While not investigated di-
____________4 Christopher D. Norek, “Returns Management: Making Order Out of Chaos,” Supply Chain Management Re-view, May/June 2002, p. 36. In place of the term reverse logistics, Norek defines a new term, enterprise returnsmanagement (ERM). He defines ERM as “the management of the return across the enterprise of the company,including return approval, transportation coordination, tracking of a return, receipt and disposition of the return,and crediting the customer account. This view includes all the information related to the return as it progressesfrom the customer back to the supplier’s system.”5 Ibid., pp. 37–38.
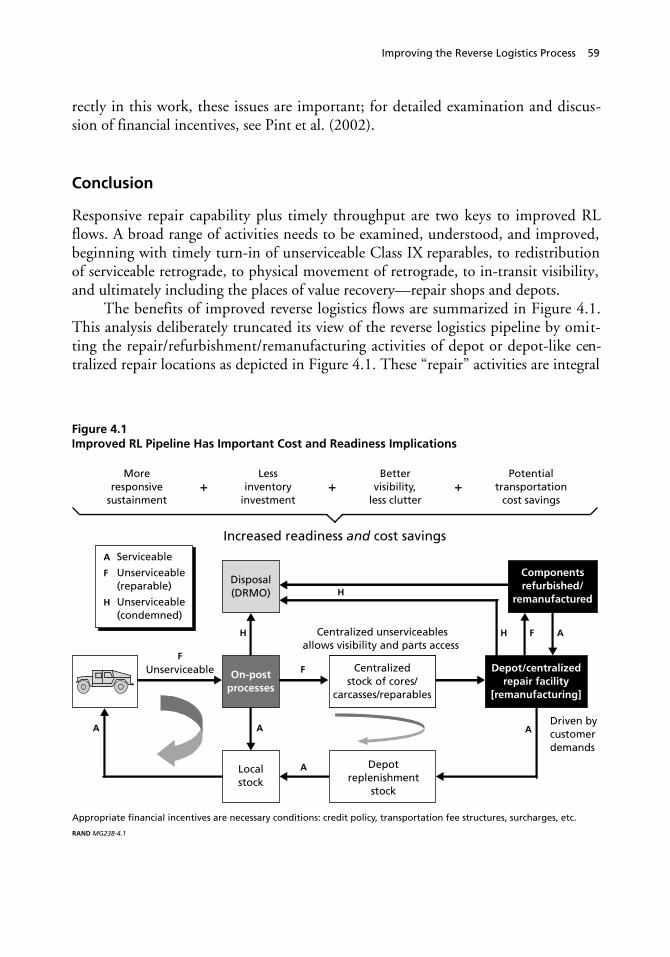
Improving the Reverse Logistics Process 59
rectly in this work, these issues are important; for detailed examination and discus-sion of financial incentives, see Pint et al. (2002).
Conclusion
Responsive repair capability plus timely throughput are two keys to improved RLflows. A broad range of activities needs to be examined, understood, and improved,beginning with timely turn-in of unserviceable Class IX reparables, to redistributionof serviceable retrograde, to physical movement of retrograde, to in-transit visibility,and ultimately including the places of value recovery—repair shops and depots.
The benefits of improved reverse logistics flows are summarized in Figure 4.1.This analysis deliberately truncated its view of the reverse logistics pipeline by omit-ting the repair/refurbishment/remanufacturing activities of depot or depot-like cen-tralized repair locations as depicted in Figure 4.1. These “repair” activities are integral
Figure 4.1Improved RL Pipeline Has Important Cost and Readiness Implications
Potentialtransportation
cost savings
Increased readiness and cost savings
Moreresponsive
sustainment
Lessinventory
investment+ + +
Bettervisibility,
less clutter
RAND MG238-4.1
A Serviceable
F Unserviceable (reparable)
H Unserviceable (condemned)
Disposal(DRMO)
HH
H
A
A
F
F
Unserviceable On-postprocesses
Depot/centralizedrepair facility
[remanufacturing]
Driven bycustomerdemands
Centralizedstock of cores/
carcasses/reparables
Depotreplenishment
stock
Appropriate financial incentives are necessary conditions: credit policy, transportation fee structures, surcharges, etc.
Centralized unserviceablesallows visibility and parts access
Componentsrefurbished/
remanufactured
Localstock
A
F
A
A

60 Value Recovery from the Reverse Logistics Pipeline
parts that must be carefully and deliberately linked (even synchronized to the extentpossible) to the “flow” portions of the RL pipeline. A pull system approach6 todepot/centralized repair can lead to significant savings in inventory investment aswell as improved fill rates.7 A significant benefit of a pull system is the coordinationand linkage of the parts so that parts flow without delay.
The Army also needs to integrate systems between levels—between forward andreverse processes and between organizations. Ultimately the Army needs to supportand focus on the soldier with the equipment—RL may be what he/she depends onfor valuable and scarce replacement parts in a fast-moving operation.
____________6 A pull system is a cascading system of instructions where actions/activities are triggered by a customer demand.The intent is to minimize inventories while meeting expected response time criteria. For more on this and relatedconcepts, see Womack and Jones (1996).7 Blumberg (2000).
61
APPENDIX
The Army’s Four-Level Maintenance System
Organizational maintenance focuses on end item readiness and conducts preventivemaintenance, scheduled services, and end item repair (primarily replacement of com-ponents on end items).
Direct support (DS) units provide mobile, dedicated support to organizationalmaintenance activities, primarily focused on end item repair with limited componentrepair capabilities. They perform limited repair and return of components to units orrepair components and put them into stock at their associated SSA.
General support (GS) is the first level of maintenance that conducts extensivecomponent repair for stock and also handles complex end item repairs and modifica-tions.
Depots are industrial-type activities that are the primary suppliers of serviceablerepairable spare parts, and they perform overhaul and modification of end items.
Organizational and DS maintenance do what is necessary to keep end items op-erational during battle, GS maintenance provides DS backup and supports the thea-ter supply system, and depot maintenance serves as the industrial base for reparableitems and the linkage to the commercial sector.
Within a division (Army of Excellence design), DS maintenance is provided tomaneuver brigades by FSBs. They generally have fire control, armament, automotive,small arms, communication equipment, and night-vision repair capabilities for com-ponents and repairs that do not require sophisticated TMDE and technical skills. Inaddition, the MSB provides backup to the FSBs. MSBs also provide direct support todivisional units (e.g., the Signal Battalion), and they have broader technical capabili-ties than FSBs (adding missile and battery shop capabilities as well as sometimesmore sophisticated capabilities on the other types of repairs).
Aviation DS within a division is provided by a dedicated support battal-ion—usually called an ASB, without MSB backup. Nondivisional units receive DSsupport from separate maintenance units that are part of Corps Support Groups.When units send unserviceable materiel back through the supply chain, it passesthrough their DS unit (in some maneuver brigades it passes through the FSB and theMSB) and then to the appropriate GS organization. At CONUS installations this is
62 Value Recovery from the Reverse Logistics Pipeline
provided by a fixed, nondeployable activity called a DOL, while overseas organiza-tions sometimes have active GS units. CONUS organizations generally have desig-nated GS units in reserve components.

63
Bibliography
Blumberg, Donald F., “Strategic Analysis and Evaluation of Reverse Logistics Supply Chainin Approaches to Logistic Management and Control in High Technology Service Opera-tion,” White Paper, D.F. Blumberg & Associates, Inc., 2000.
Blumberg, Donald F., “Strategic Assessment of Market Opportunities and Potential in theReverse Logistics and Repair Service (RLRS) Market,” Presentation, Council of LogisticsManagement Conference, October 2001.
Brauner, Marygail K., Ellen M. Pint, John R. Bondanella, Daniel A. Relles, and Paul Stein-berg, Dollars and Sense: A Process Improvement Approach to Logistics Financial Management,Santa Monica, CA: RAND Corporation, MR-1131-A, 2000.
Dowlatshahi, Shad, “Developing a Theory of Reverse Logistics,” Interfaces, May–June 2000.
Dumond, John, Marygail K. Brauner, Rick Eden, John Folkeson, Kenneth Girardini,Donna Keyser, Eric Peltz, Ellen M. Pint, and Mark Y.D. Wang, Velocity Management:The Business Paradigm That Has Transformed U.S. Army Logistics, Santa Monica, CA:RAND Corporation, MR-1108-A, 2001.
Girardini, Kenneth, Arthur Lackey, Kristin Leuschner, Daniel A. Relles, Mark Totten, andDarlene Blake, Dollar Cost Banding: A New Algorithm for Computing Inventory Levels forArmy SSAs, Santa Monica, CA: RAND Corporation, MG-128-A, 2004.
Giuntini, Ron, and Tom Andel, “Master the Six R’s of Reverse Logistics,” Integrated Ware-housing & Distribution, March 1995.
Norek, Christopher D., “Returns Management—Making Order Out of Chaos,” SupplyChain Management Review, May/June 2002.
Pint, Ellen M., Marygail K. Brauner, John R. Bondanella, Daniel A. Relles, and Paul Stein-berg, Right Price, Fair Credit: Criteria to Improve Financial Incentives for Army Logistics De-cisions, Santa Monica, CA: RAND Corporation, MR-1150-A, 2002.
Rogers, Dr. Dale S., and Dr. Ronald S. Tibben-Lembke. Going Backwards: Reverse LogisticsTrends and Practices, Reverse Logistics Executive Council, 1999.
Thierry, Martijn, Marc Salomon, Jo Van Nunen, et al. “Strategic Issues in Product RecoveryManagement,” California Management Review, Vol. 37, No. 2, Winter 1995.

64 Value Recovery from the Reverse Logistics Pipeline
Tibben-Lembke, R.S., and D.S. Rogers, “Differences Between Forward and Reverse Logis-tics in a Retail Environment,” Supply Chain Management: An International Journal, Vol.7, No. 5, 2002.
Walker, William J., “Rethinking the Reverse Supply Chain,” Supply Chain Management Re-view, May/June 2000.
Womack, James P., and Daniel T. Jones, Lean Thinking, New York: Simon & Schuster,1996.