Embed Size (px)
Citation preview
IOP PUBLISHING JOURNAL OF PHYSICS D: APPLIED PHYSICS
J. Phys. D: Appl. Phys. 43 (2010) 505204 (13pp) doi:10.1088/0022-3727/43/50/505204
Surface corona-bar discharges forproduction of pre-ionizing UV light forpulsed high-pressure plasmasZhongmin Xiong and Mark J Kushner1
University of Michigan, Electrical Engineering and Computer Science Department, 1301 Beal Ave,Ann Arbor, MI 48109-2122, USA
E-mail: [email protected] and [email protected]
Received 17 September 2010, in final form 1 November 2010Published 2 December 2010Online at stacks.iop.org/JPhysD/43/505204
AbstractMulti-atmospheric pressure, pulsed electric discharge excited lasers require pre-ionization toproduce spatially uniform glows. Many such systems use corona bars to produce ultraviolet(UV) and vacuum ultraviolet (VUV) light as photo-ionization sources for this purpose. Coronabars are transient surface discharges, typically in a cylindrical geometry, that sustain highelectron temperatures and so are efficient UV and VUV sources. In this paper, results from anumerical study of surface corona-bar discharges in a multi-atmosphere pressure Ne/Xe gasmixture are discussed. The discharge consists of a high-voltage electrode placed on the surfaceof a corona bar which is a dielectric tube surrounding a cylindrical metal electrode. After theinitial breakdown an ionization front propagates along the circumference of the corona bar andproduces a thin plasma sheet near the dielectric surface. The propagation speed of theionization front ranges from 2 × 10⁷ to 3.5 × 108 cm s−1, depending on the applied voltage anddielectric constant of the corona-bar insulator. As the discharge propagates around thecircumference, the surface of the corona-bar is charged. The combined effects of surfacecurvature and charge deposition result in a non-monotonic variation of the electric field andelectron temperature as the ionization front traverses the circumference. The UV fluxescollected on a surrounding circular surface correlate with the motion of the ionizationfront but with a time delay due to the relatively long lifetime of the precursor to theemitting species Ne∗
2.
1. Introduction
In transversely excited, multi-atmospheric pressure gasdischarge lasers, such as excimer lasers, maintaining thedischarge in a volumetrically diffuse or glow mode is criticalto efficient laser pumping and having high optical quality [1].Obtaining a glow discharge mode typically requires pre-ionization of the discharge to electron densities of 109–1010 cm−3 [2]. This is typically accomplished by using anultraviolet (UV), vacuum ultraviolet (VUV) or x-ray radiationsource. Sufficient pre-ionization prevents the formationof streamers and their subsequent transition to arcs [3].The density and uniformity of the photo-ionization-producedelectrons as well as the timing of the pre-ionization with respect
1 Author to whom any correspondence should be addressed.
to application of high voltage to the discharge electrodesdirectly affect the laser’s performance [4].
UV or VUV radiation for pre-ionization can be producedby arrays of spark discharges or by corona discharges sustainedover a dielectric surface, often called a corona bar. (Wewill collectively refer to both UV and VUV photon fluxesas UV fluxes.) A corona-bar pre-ionization source typicallyconsists of an annular dielectric tube with a grounded metalcylinder along its centre. The axis of the corona bar isplaced parallel to the axis of the laser discharge in order toilluminate the gap between the electrodes with UV photons.A high voltage electrode, typically with a point contact on thedielectric surface in the axial direction, triggers and sustainsthe corona discharge. The corona discharge begins at thetrigger electrode and propagates along the circumference of
0022-3727/10/505204+13$30.00 1 © 2010 IOP Publishing Ltd Printed in the UK & the USA
J. Phys. D: Appl. Phys. 43 (2010) 505204 Z Xiong and M J Kushner
the dielectric surface, analogous to a corona streamer in thegas phase. Excited states produced by the avalanche frontare the precursors for producing the pre-ionizing UV light[5]. In addition to producing UV light for pre-ionization,surface corona discharges are also widely used in lighting [6],fluorescence spectroscopy [7], waste treatment [8], chemicalsynthesis, surface modification, functionalization [9] and morerecently for active aerodynamic flow control [10, 11].
Surface corona discharges are a combination of a coronadischarge and a dielectric barrier discharge (DBD). Thepropagation of the discharge along the surface is similar tothat of streamers in bulk gases, but is modified by the presenceof the surface through polarization of the surface material,intensification of the electric field and release of secondaryelectrons. The similarity to gas phase streamers is in the spacecharge enhanced electric field at the head of the avalanchefront that propagates in the plasma channel. The similarityto DBDs is in the adjacency of a dielectric surface which ischarged by the plasma channel. Experimentally, the interactionbetween such a discharge and surface has been characterizedusing the speed of propagation of the plasma channel and itsdependence on voltage, pressure and the dielectric constant ofthe surface material. For example, Hidaka and Murooka [12]investigated surface discharge development in a needle-to-discconfiguration at atmospheric pressure in air and found thedischarge propagation speed to be up to 8.4 × 108 cm s−1 fornegative streamers and 1.5×109 cm s−1 for positive streamers.Hong [13] studied corona discharges over a cylindrical surfacein multi-atmospheric pressure Ne and found the azimuthaldischarge propagation speed to be in the range 107–108 cm s−1.Walter [14] investigated surface corona discharges havingdifferent dielectric materials and showed that higher dielectricconstants lead to better laser performance by allowing moreenergy deposition into the gas mixture. Recent experimentsby Kozlov et al [15] found that not only the dielectric constantbut surface properties, thickness and structure of the dielectriclayer play significant roles in the appearance and developmentof the discharge.
Rutkevich [16] analysed the structure of sliding dischargesover a flat dielectric surface based on a self-similar formulation.They found a quantitative agreement between the calculatedand experimental propagation speed as a function of the appliedvoltage, although the propagation speed in the experimentsis not a constant as assumed in the model but decreaseswith propagation distance. Sobota et al [17] modelled pulsedischarges in Ar near a flat dielectric surface and concludedthat the bulk gas processes alone cannot account for thedischarge propagation in the vicinity of the surface. In thecontext of aerodynamic flow control, Boeuf and Pitchford [18]numerically investigated micro-discharges in an asymmetricsurface DBD. They found that the propagation speed of thesliding ionization wave is on the order of 3 × 106 cm s−1 whenincluding only the secondary emission by electron impact asthe electron generation mechanism ahead of the front.
In this paper, we present results from a numericalinvestigation of a corona discharge propagating over acylindrical dielectric surface in a multi-atmosphere Ne/Xemixture. The context is the use of corona bars for the
production of pre-ionizing UV light, as might be used ina pulsed discharge laser. The electrical properties of thedischarges are discussed and correlated with the production ofvisible and UV radiation. We found that the propagation speedof the ionization front ranges from 2×10⁷ to 3.5×108 cm s−1,depending on the applied voltage and dielectric constant of thecorona bar. The variations of the electric field and electrontemperature in the ionization front are non-monotonic as thefront traverses the circumference of the corona bar. Thegoverning equations and the model are briefly described insection 2 along with the reaction mechanism used for Ne/Xemixtures. In sections 3–5, a discussion of the dischargedynamics and the UV production are presented. Section 6contains our concluding remarks.
2. Description of the model
The modelling of the cylindrical surface corona discharge isbased on nonPDPSIM which is a two-dimensional plasmahydrodynamics model with radiation transport. Continuityequations for charged and neutral species, and Poisson’sequation are solved coincidently with the electron energyequation with transport coefficients obtained from solutionsof Boltzmann’s equation. A Monte Carlo simulation is usedto track sheath accelerated electrons produced by secondaryprocesses at the surface. The spatial discretization is basedon finite volume methods on an unstructured mesh and thetime integration is implemented using a fully implicit Newtoniteration method. The details of the model are describedelsewhere [19], but briefly the following equations are solvedfor charge species,
− ∇ · ε∇� =∑
j
njqj + ρs, (1)
∂Ni
∂t= −∇ · �φi + Si, (2)
∂ρs
∂t=
∑i
−∇ · (qi�φi(1 + γi)) + ∇ · (σ∇�), (3)
where ε, �, ρs, N, φ, γ, σ, S and q refer to the permittivity,electric potential, surface charge density, charged speciesnumber density, species flux, secondary electron emissioncoefficient, conductivity of the solid materials, source termsand elementary charge, respectively. The source term Si
contains the production and loss of species i due to electronimpact ionization and excitation, heavy particle reactions,photo-ionization, secondary emission and surface reactions.The charged particle fluxes φi are approximated with theScharfetter–Gummel technique [20] and equations (1)–(3) aresimultaneously solved in each Newton iteration step. Oncethe charged particle densities are updated, the electron energyequation is integrated for average energy ε
∂
∂t(neε) = q �φe · �E−ne
∑i
Niki�εi−∇·( 52ε �φe−λ∇Te), (4)
where ne is electron density, E = −∇� is the electric field,ki is the rate coefficient for collision process i with species
2
J. Phys. D: Appl. Phys. 43 (2010) 505204 Z Xiong and M J Kushner
having density Ni and energy loss �εi , λ is the electron thermalconductivity and �φe is the electron flux and Te is the electrontemperature defined as (2ε/3).
During the short duration of the corona discharge,advective motion of neutral species by temperature or pressuregradients is not important. In the majority of our simulations,the densities of neutral species are given by their continuityequations with only diffusion for transport. These continuityequations for neutral species are solved in a time-slicingmanner with the charged particle continuity equations,
∂Ni
∂t= −∇ ·
(−DiNT∇
(Ni
NT
))+ Si, (5)
where the Ni is the density of neutral species i, NT is thetotal gas density, Di is the diffusion coefficient and Si is thesource or sink due to volumetric or surface processes. Forcomparison purposes, the fully compressible Navier–Stokesequations are solved for the fluid averaged density, momentumand gas temperature. The implementation of these equationsin nonPDPSIM is described in [21].
Photon transport in the plasma is accounted for using apropagator method. The photo ionization source for species m
at location �ri due to the emission of photons at location �rj byspecies k is
Sm(�ri) = σ IkmNm(�ri)Ak
∫Nk(�r ′
j )Gk(�r ′j , �ri) d3�r ′
j , (6)
Gk(�r ′j , �ri) =
exp(− ∫ �r ′
in
�r ′j
∑l σlkNl(�r ′
n) d�r ′n
)4π |�r ′
i − �rj |2 , (7)
where Nk is the density of the radiating species having Einsteincoefficient Ak , σ I
km is the photo-ionization cross section forspecies m by photons emitted by species k and σlk is the totalabsorption cross section for photon k by species l. Gk(�r ′
j , �ri)
is Green’s function for the survival of the photons emitted atthe location �rj to reach location �ri , and also accounts for viewangles and obscuration.
Emission of electrons from the dielectric surface resultsfrom two processes—secondary electron emission by ionbombardment and photoelectron emission. (The values of theelectric fields are not large enough for field emission to beimportant.) Electron emission by photons striking surfaceswas included with probability 0.01. The UV fluxes strikingsurface location �ri are given by
φ(�ri) = Ak
∫Nk(�r ′
j )Gk(�r ′j , �ri) d3�r ′
j . (8)
In this investigation, the source of photons was emission byNe∗
2 with wavelength 85 nm. The rationale was that thereis moderately rapid, though not instantaneous, conversionof Ne atomic excited states to the dimer and the bound-free transition in the dimmer producing this radiation is notresonantly absorbed or trapped. The single photo-ionizationprocess we included was for ground state xenon with crosssection 10−16 cm2. Although the radiative lifetime of Ne∗
2 isonly 11 ns, the precursor states for forming Ne∗
2 are metastable(or effectively metastable due to radiation trapping) excited
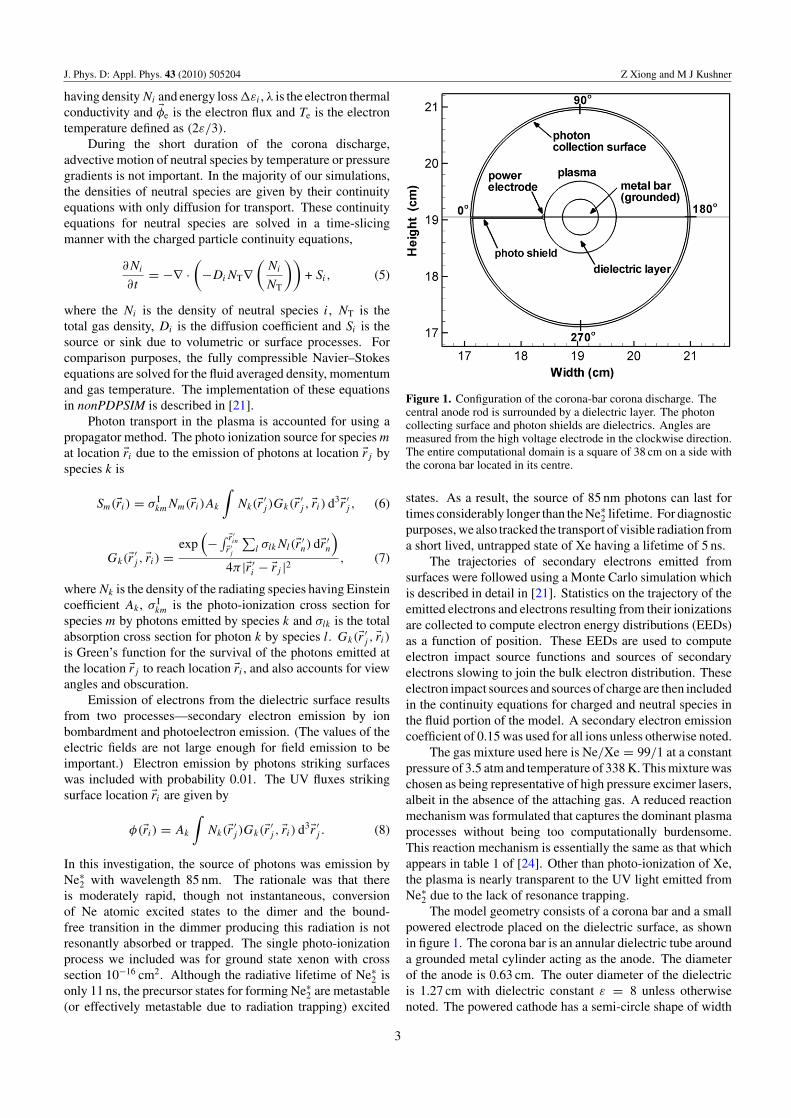
Figure 1. Configuration of the corona-bar corona discharge. Thecentral anode rod is surrounded by a dielectric layer. The photoncollecting surface and photon shields are dielectrics. Angles aremeasured from the high voltage electrode in the clockwise direction.The entire computational domain is a square of 38 cm on a side withthe corona bar located in its centre.
states. As a result, the source of 85 nm photons can last fortimes considerably longer than the Ne∗
2 lifetime. For diagnosticpurposes, we also tracked the transport of visible radiation froma short lived, untrapped state of Xe having a lifetime of 5 ns.
The trajectories of secondary electrons emitted fromsurfaces were followed using a Monte Carlo simulation whichis described in detail in [21]. Statistics on the trajectory of theemitted electrons and electrons resulting from their ionizationsare collected to compute electron energy distributions (EEDs)as a function of position. These EEDs are used to computeelectron impact source functions and sources of secondaryelectrons slowing to join the bulk electron distribution. Theseelectron impact sources and sources of charge are then includedin the continuity equations for charged and neutral species inthe fluid portion of the model. A secondary electron emissioncoefficient of 0.15 was used for all ions unless otherwise noted.
The gas mixture used here is Ne/Xe = 99/1 at a constantpressure of 3.5 atm and temperature of 338 K. This mixture waschosen as being representative of high pressure excimer lasers,albeit in the absence of the attaching gas. A reduced reactionmechanism was formulated that captures the dominant plasmaprocesses without being too computationally burdensome.This reaction mechanism is essentially the same as that whichappears in table 1 of [24]. Other than photo-ionization of Xe,the plasma is nearly transparent to the UV light emitted fromNe∗
2 due to the lack of resonance trapping.The model geometry consists of a corona bar and a small
powered electrode placed on the dielectric surface, as shownin figure 1. The corona bar is an annular dielectric tube arounda grounded metal cylinder acting as the anode. The diameterof the anode is 0.63 cm. The outer diameter of the dielectricis 1.27 cm with dielectric constant ε = 8 unless otherwisenoted. The powered cathode has a semi-circle shape of width
3
J. Phys. D: Appl. Phys. 43 (2010) 505204 Z Xiong and M J Kushner
0.5 mm and is placed on the corona-bar surface. At t = 0,the voltage on the cathode has a stepwise change to −25 kVunless noted. The discharge is initiated by placing a smallspot of plasma at the intersection of the cathode and coronabar in the upper plane, 3×1010 cm−3 in density and 100 µm indiameter. The initial electron density is otherwise zero. Thisinitiates a surface discharge in the clockwise direction. Theresolution of the numerical mesh was approximately 25 µmalong the surface of the dielectric.
A circular dielectric surface was placed at a radius of3.8 cm. The inner surface of this cylinder was used to collectphoton fluxes during the discharge. The entire computationaldomain is a square of 38 cm on a side with the corona barlocated in its centre. A thin dielectric layer is also placedalong the horizontal axis between the powered electrode andthe photon collector. The purpose of this surface is to preventphotons and charges produced during the initial discharge nearthe cathode in the upper half plane from crossing over into thelower half plane and initiating a second discharge propagatingin the counter-clockwise direction. This enables us to study asingle propagating discharge (although an example of counter-propagating discharges will be discussed). To identify thelocation of the streamer, angles relative to the high voltageelectrode will be cited, 0◦ at the high voltage electrode andincreasing in the clockwise direction, as shown in figure 1.
3. Propagation of surface discharges
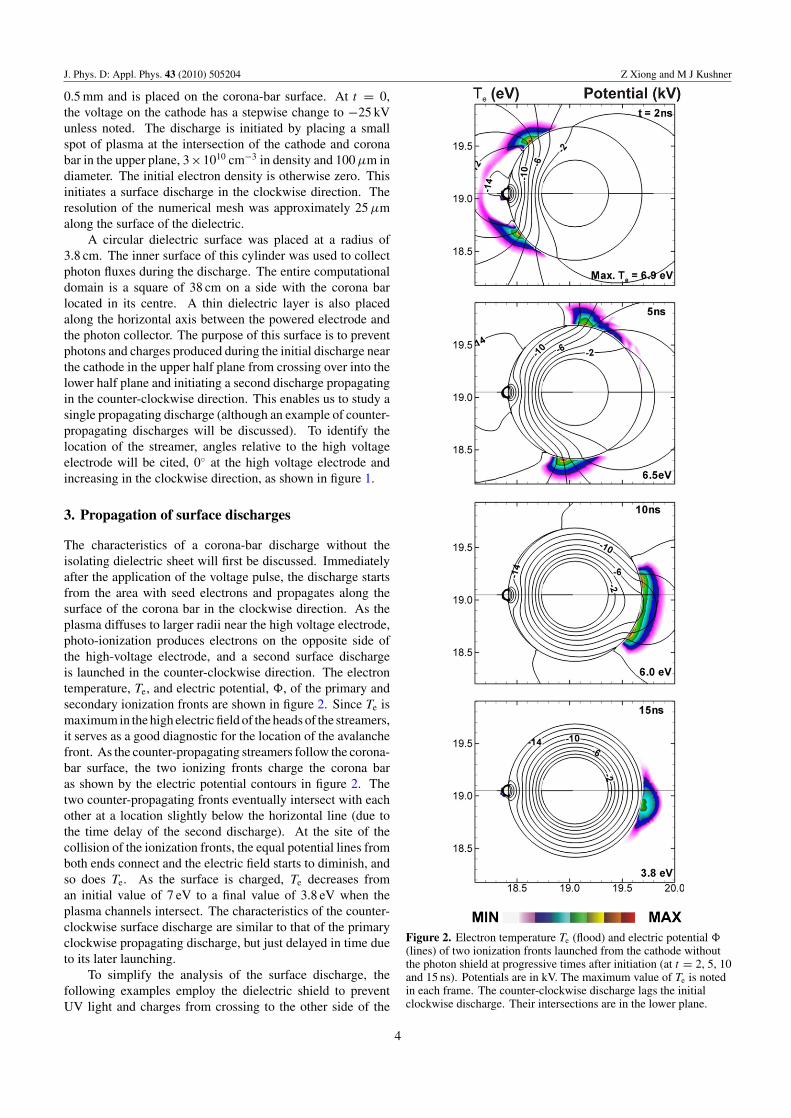
The characteristics of a corona-bar discharge without theisolating dielectric sheet will first be discussed. Immediatelyafter the application of the voltage pulse, the discharge startsfrom the area with seed electrons and propagates along thesurface of the corona bar in the clockwise direction. As theplasma diffuses to larger radii near the high voltage electrode,photo-ionization produces electrons on the opposite side ofthe high-voltage electrode, and a second surface dischargeis launched in the counter-clockwise direction. The electrontemperature, Te, and electric potential, �, of the primary andsecondary ionization fronts are shown in figure 2. Since Te ismaximum in the high electric field of the heads of the streamers,it serves as a good diagnostic for the location of the avalanchefront. As the counter-propagating streamers follow the corona-bar surface, the two ionizing fronts charge the corona baras shown by the electric potential contours in figure 2. Thetwo counter-propagating fronts eventually intersect with eachother at a location slightly below the horizontal line (due tothe time delay of the second discharge). At the site of thecollision of the ionization fronts, the equal potential lines fromboth ends connect and the electric field starts to diminish, andso does Te. As the surface is charged, Te decreases froman initial value of 7 eV to a final value of 3.8 eV when theplasma channels intersect. The characteristics of the counter-clockwise surface discharge are similar to that of the primaryclockwise propagating discharge, but just delayed in time dueto its later launching.
To simplify the analysis of the surface discharge, thefollowing examples employ the dielectric shield to preventUV light and charges from crossing to the other side of the
Figure 2. Electron temperature Te (flood) and electric potential �(lines) of two ionization fronts launched from the cathode withoutthe photon shield at progressive times after initiation (at t = 2, 5, 10and 15 ns). Potentials are in kV. The maximum value of Te is notedin each frame. The counter-clockwise discharge lags the initialclockwise discharge. Their intersections are in the lower plane.
4
J. Phys. D: Appl. Phys. 43 (2010) 505204 Z Xiong and M J Kushner
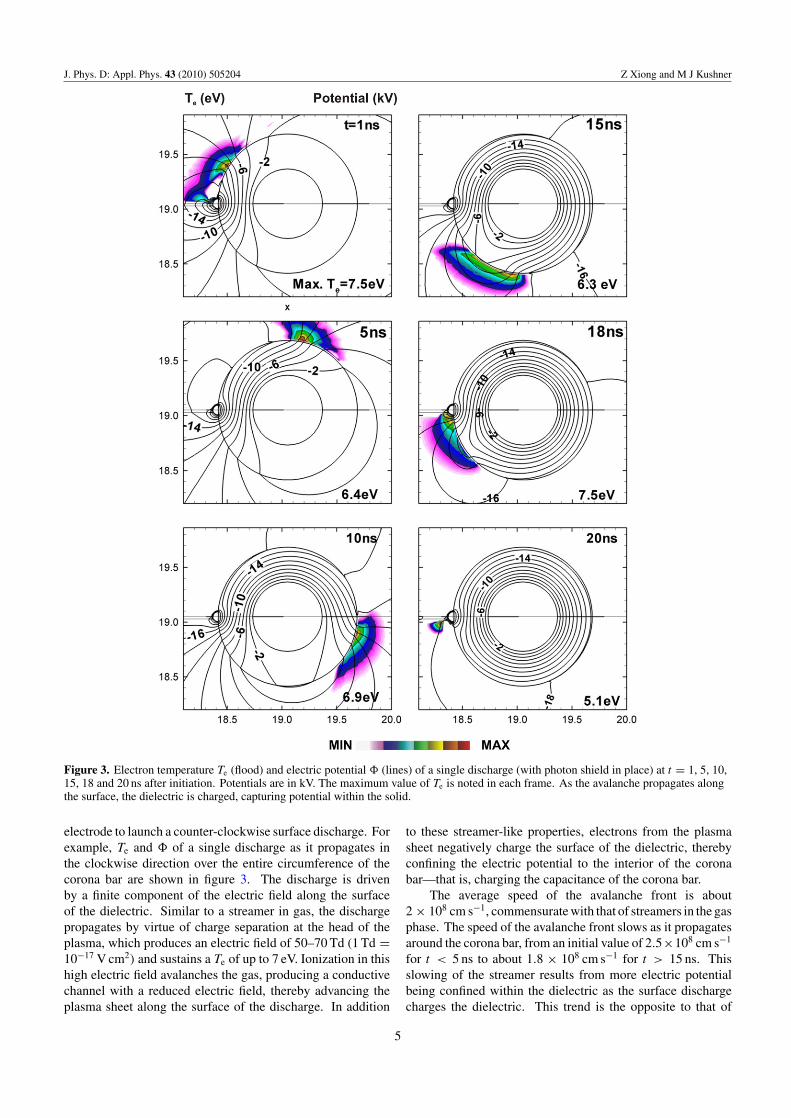
Figure 3. Electron temperature Te (flood) and electric potential � (lines) of a single discharge (with photon shield in place) at t = 1, 5, 10,15, 18 and 20 ns after initiation. Potentials are in kV. The maximum value of Te is noted in each frame. As the avalanche propagates alongthe surface, the dielectric is charged, capturing potential within the solid.
electrode to launch a counter-clockwise surface discharge. Forexample, Te and � of a single discharge as it propagates inthe clockwise direction over the entire circumference of thecorona bar are shown in figure 3. The discharge is drivenby a finite component of the electric field along the surfaceof the dielectric. Similar to a streamer in gas, the dischargepropagates by virtue of charge separation at the head of theplasma, which produces an electric field of 50–70 Td (1 Td =10−17 V cm2) and sustains a Te of up to 7 eV. Ionization in thishigh electric field avalanches the gas, producing a conductivechannel with a reduced electric field, thereby advancing theplasma sheet along the surface of the discharge. In addition
to these streamer-like properties, electrons from the plasmasheet negatively charge the surface of the dielectric, therebyconfining the electric potential to the interior of the coronabar—that is, charging the capacitance of the corona bar.
The average speed of the avalanche front is about2 × 108 cm s−1, commensurate with that of streamers in the gasphase. The speed of the avalanche front slows as it propagatesaround the corona bar, from an initial value of 2.5×108 cm s−1
for t < 5 ns to about 1.8 × 108 cm s−1 for t > 15 ns. Thisslowing of the streamer results from more electric potentialbeing confined within the dielectric as the surface dischargecharges the dielectric. This trend is the opposite to that of
5
J. Phys. D: Appl. Phys. 43 (2010) 505204 Z Xiong and M J Kushner
gas phase streamers in DBD discharges where the speed of theavalanche front generally increases as the streamer approachesthe dielectric barrier. This latter trend in the gas phase resultsfrom the applied voltage being compressed into the non-ionized space ahead of the conductive streamer channel, whichincreases the electric field for subsequent avalanche. In thecase of the corona bar, the compression of the voltage occurswithin the dielectric, and so that potential is not available forsubsequent avalanche. On the other hand, in long, unconfinedcorona streamers, the speed of the streamer tends to decreasewith time as more voltage is dropped across the conductiveplasma channel trailing the avalanche front.
When the clockwise discharge rotates to about 320◦
UV illumination from the approaching ionization front seedselectrons near the high voltage electrode on the bottom sideof the photon shield which then launches a short counter-clockwise discharge. The two discharges then quickly intersectand merge at about 340◦ (t = 18 ns) which reduces the electricfield and Te. After intersection of the counter-propagatingdischarge fronts, the capacitance of the corona bar is essentiallyfully charged and the equipotential lines are nearly parallel tothe surface, as at t = 20 ns. At this point electron impactionization largely ceases. The charging of the surface of thedielectric leaves the surface-hugging plasma electropositive.Following the cessation of the surface discharge, diffusion ofpositive ions from the plasma sheet to the surface neutralizesthe negative surface charge thereby discharging the capacitanceof the corona bar. With this discharging, the electric potentiallines again cross through the surface into the gas.
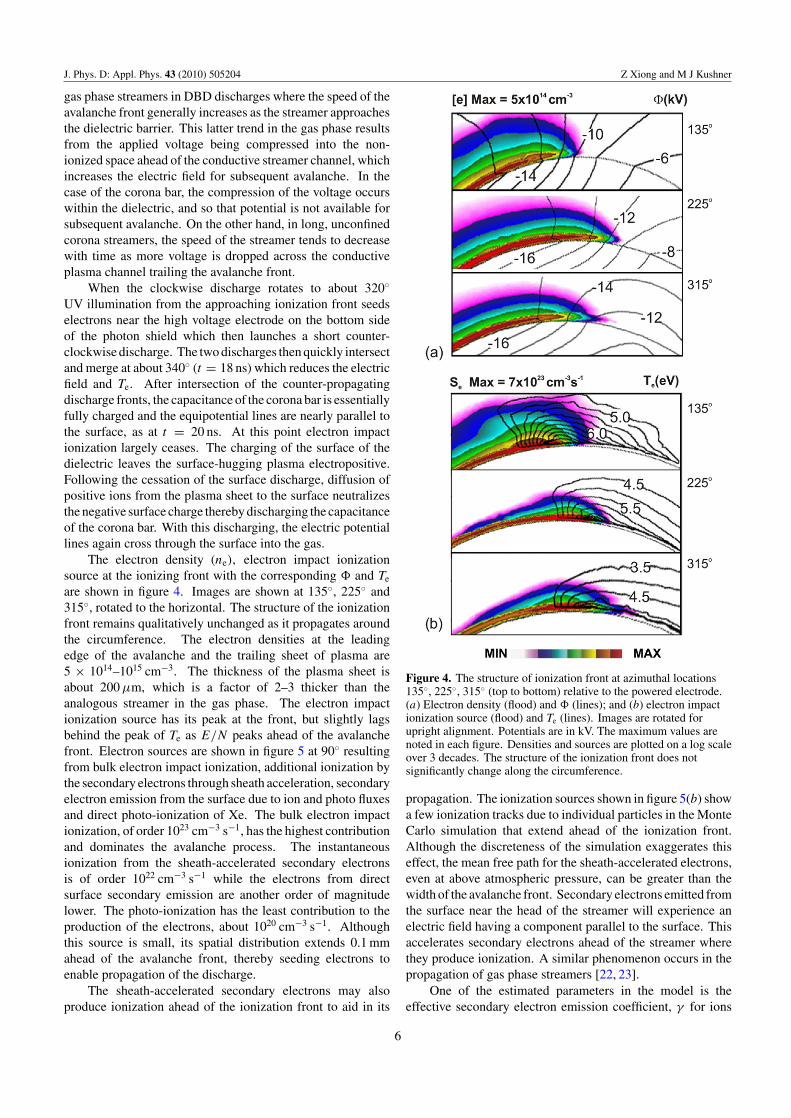
The electron density (ne), electron impact ionizationsource at the ionizing front with the corresponding � and Te
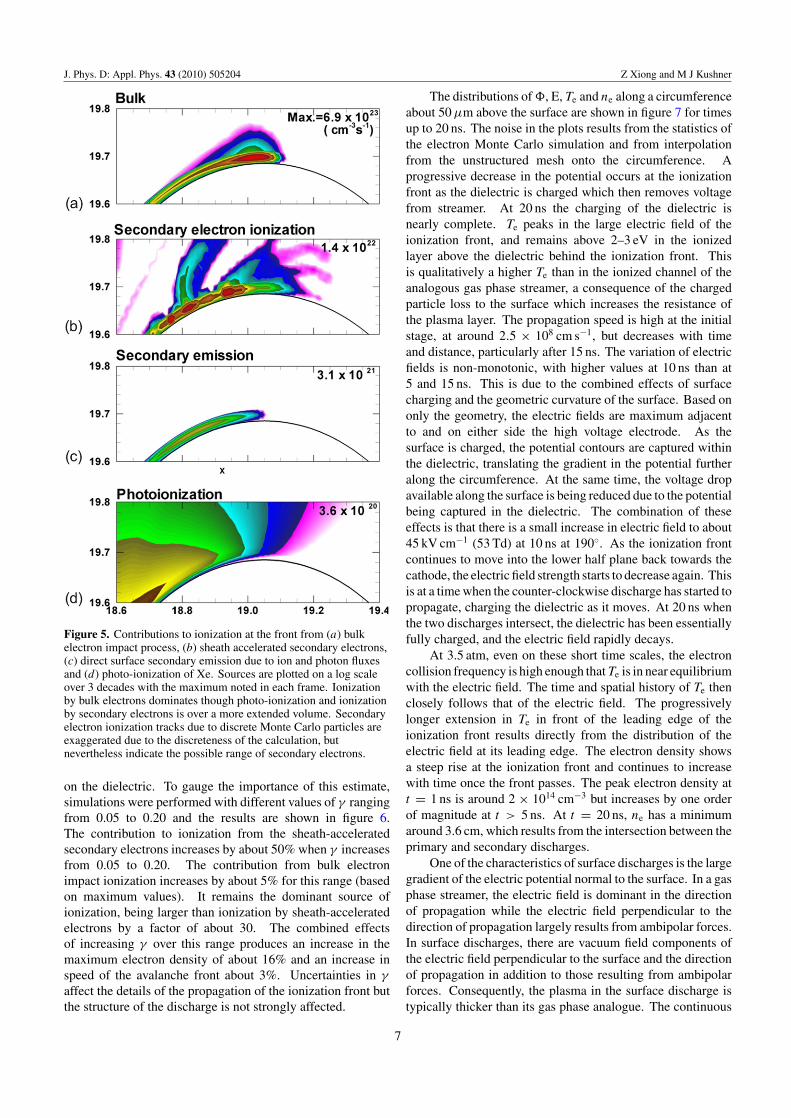
are shown in figure 4. Images are shown at 135◦, 225◦ and315◦, rotated to the horizontal. The structure of the ionizationfront remains qualitatively unchanged as it propagates aroundthe circumference. The electron densities at the leadingedge of the avalanche and the trailing sheet of plasma are5 × 1014–1015 cm−3. The thickness of the plasma sheet isabout 200 µm, which is a factor of 2–3 thicker than theanalogous streamer in the gas phase. The electron impactionization source has its peak at the front, but slightly lagsbehind the peak of Te as E/N peaks ahead of the avalanchefront. Electron sources are shown in figure 5 at 90◦ resultingfrom bulk electron impact ionization, additional ionization bythe secondary electrons through sheath acceleration, secondaryelectron emission from the surface due to ion and photo fluxesand direct photo-ionization of Xe. The bulk electron impactionization, of order 1023 cm−3 s−1, has the highest contributionand dominates the avalanche process. The instantaneousionization from the sheath-accelerated secondary electronsis of order 1022 cm−3 s−1 while the electrons from directsurface secondary emission are another order of magnitudelower. The photo-ionization has the least contribution to theproduction of the electrons, about 1020 cm−3 s−1. Althoughthis source is small, its spatial distribution extends 0.1 mmahead of the avalanche front, thereby seeding electrons toenable propagation of the discharge.
The sheath-accelerated secondary electrons may alsoproduce ionization ahead of the ionization front to aid in its
Figure 4. The structure of ionization front at azimuthal locations135◦, 225◦, 315◦ (top to bottom) relative to the powered electrode.(a) Electron density (flood) and � (lines); and (b) electron impactionization source (flood) and Te (lines). Images are rotated forupright alignment. Potentials are in kV. The maximum values arenoted in each figure. Densities and sources are plotted on a log scaleover 3 decades. The structure of the ionization front does notsignificantly change along the circumference.
propagation. The ionization sources shown in figure 5(b) showa few ionization tracks due to individual particles in the MonteCarlo simulation that extend ahead of the ionization front.Although the discreteness of the simulation exaggerates thiseffect, the mean free path for the sheath-accelerated electrons,even at above atmospheric pressure, can be greater than thewidth of the avalanche front. Secondary electrons emitted fromthe surface near the head of the streamer will experience anelectric field having a component parallel to the surface. Thisaccelerates secondary electrons ahead of the streamer wherethey produce ionization. A similar phenomenon occurs in thepropagation of gas phase streamers [22, 23].
One of the estimated parameters in the model is theeffective secondary electron emission coefficient, γ for ions
6
J. Phys. D: Appl. Phys. 43 (2010) 505204 Z Xiong and M J Kushner
Figure 5. Contributions to ionization at the front from (a) bulkelectron impact process, (b) sheath accelerated secondary electrons,(c) direct surface secondary emission due to ion and photon fluxesand (d) photo-ionization of Xe. Sources are plotted on a log scaleover 3 decades with the maximum noted in each frame. Ionizationby bulk electrons dominates though photo-ionization and ionizationby secondary electrons is over a more extended volume. Secondaryelectron ionization tracks due to discrete Monte Carlo particles areexaggerated due to the discreteness of the calculation, butnevertheless indicate the possible range of secondary electrons.
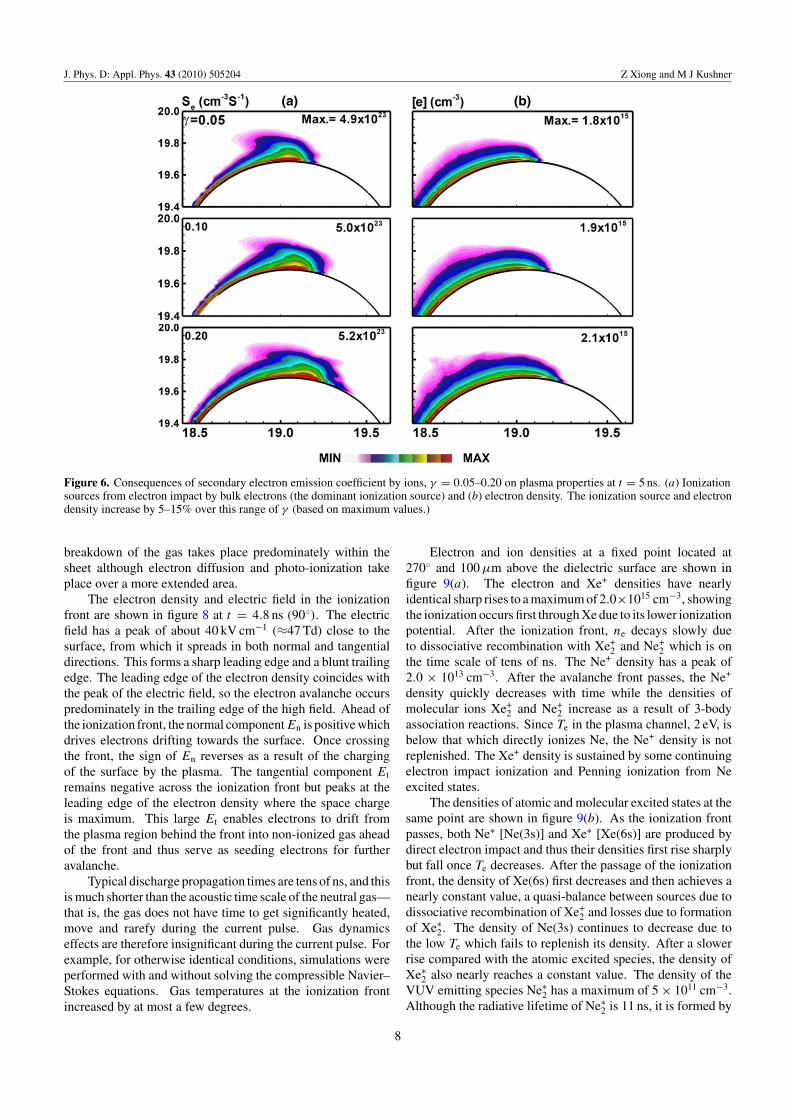
on the dielectric. To gauge the importance of this estimate,simulations were performed with different values of γ rangingfrom 0.05 to 0.20 and the results are shown in figure 6.The contribution to ionization from the sheath-acceleratedsecondary electrons increases by about 50% when γ increasesfrom 0.05 to 0.20. The contribution from bulk electronimpact ionization increases by about 5% for this range (basedon maximum values). It remains the dominant source ofionization, being larger than ionization by sheath-acceleratedelectrons by a factor of about 30. The combined effectsof increasing γ over this range produces an increase in themaximum electron density of about 16% and an increase inspeed of the avalanche front about 3%. Uncertainties in γ
affect the details of the propagation of the ionization front butthe structure of the discharge is not strongly affected.
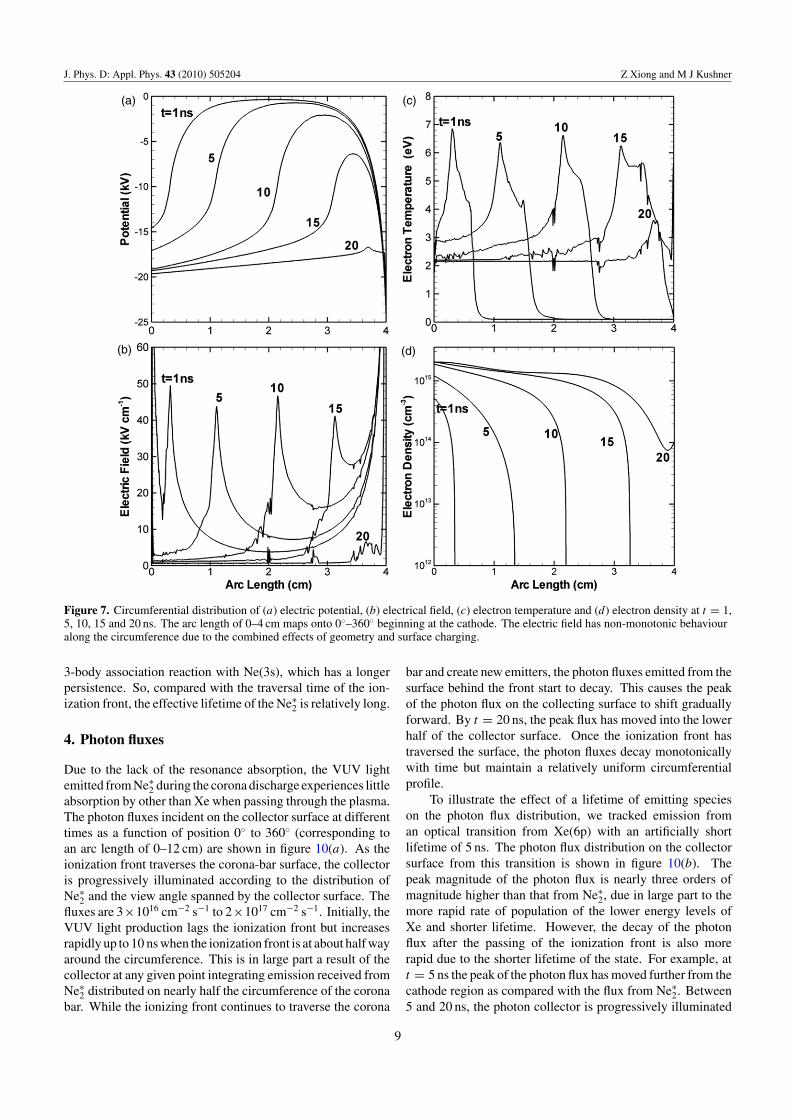
The distributions of �, E, Te and ne along a circumferenceabout 50 µm above the surface are shown in figure 7 for timesup to 20 ns. The noise in the plots results from the statistics ofthe electron Monte Carlo simulation and from interpolationfrom the unstructured mesh onto the circumference. Aprogressive decrease in the potential occurs at the ionizationfront as the dielectric is charged which then removes voltagefrom streamer. At 20 ns the charging of the dielectric isnearly complete. Te peaks in the large electric field of theionization front, and remains above 2–3 eV in the ionizedlayer above the dielectric behind the ionization front. Thisis qualitatively a higher Te than in the ionized channel of theanalogous gas phase streamer, a consequence of the chargedparticle loss to the surface which increases the resistance ofthe plasma layer. The propagation speed is high at the initialstage, at around 2.5 × 108 cm s−1, but decreases with timeand distance, particularly after 15 ns. The variation of electricfields is non-monotonic, with higher values at 10 ns than at5 and 15 ns. This is due to the combined effects of surfacecharging and the geometric curvature of the surface. Based ononly the geometry, the electric fields are maximum adjacentto and on either side the high voltage electrode. As thesurface is charged, the potential contours are captured withinthe dielectric, translating the gradient in the potential furtheralong the circumference. At the same time, the voltage dropavailable along the surface is being reduced due to the potentialbeing captured in the dielectric. The combination of theseeffects is that there is a small increase in electric field to about45 kV cm−1 (53 Td) at 10 ns at 190◦. As the ionization frontcontinues to move into the lower half plane back towards thecathode, the electric field strength starts to decrease again. Thisis at a time when the counter-clockwise discharge has started topropagate, charging the dielectric as it moves. At 20 ns whenthe two discharges intersect, the dielectric has been essentiallyfully charged, and the electric field rapidly decays.
At 3.5 atm, even on these short time scales, the electroncollision frequency is high enough that Te is in near equilibriumwith the electric field. The time and spatial history of Te thenclosely follows that of the electric field. The progressivelylonger extension in Te in front of the leading edge of theionization front results directly from the distribution of theelectric field at its leading edge. The electron density showsa steep rise at the ionization front and continues to increasewith time once the front passes. The peak electron density att = 1 ns is around 2 × 1014 cm−3 but increases by one orderof magnitude at t > 5 ns. At t = 20 ns, ne has a minimumaround 3.6 cm, which results from the intersection between theprimary and secondary discharges.
One of the characteristics of surface discharges is the largegradient of the electric potential normal to the surface. In a gasphase streamer, the electric field is dominant in the directionof propagation while the electric field perpendicular to thedirection of propagation largely results from ambipolar forces.In surface discharges, there are vacuum field components ofthe electric field perpendicular to the surface and the directionof propagation in addition to those resulting from ambipolarforces. Consequently, the plasma in the surface discharge istypically thicker than its gas phase analogue. The continuous
7
J. Phys. D: Appl. Phys. 43 (2010) 505204 Z Xiong and M J Kushner
Figure 6. Consequences of secondary electron emission coefficient by ions, γ = 0.05–0.20 on plasma properties at t = 5 ns. (a) Ionizationsources from electron impact by bulk electrons (the dominant ionization source) and (b) electron density. The ionization source and electrondensity increase by 5–15% over this range of γ (based on maximum values.)
breakdown of the gas takes place predominately within thesheet although electron diffusion and photo-ionization takeplace over a more extended area.
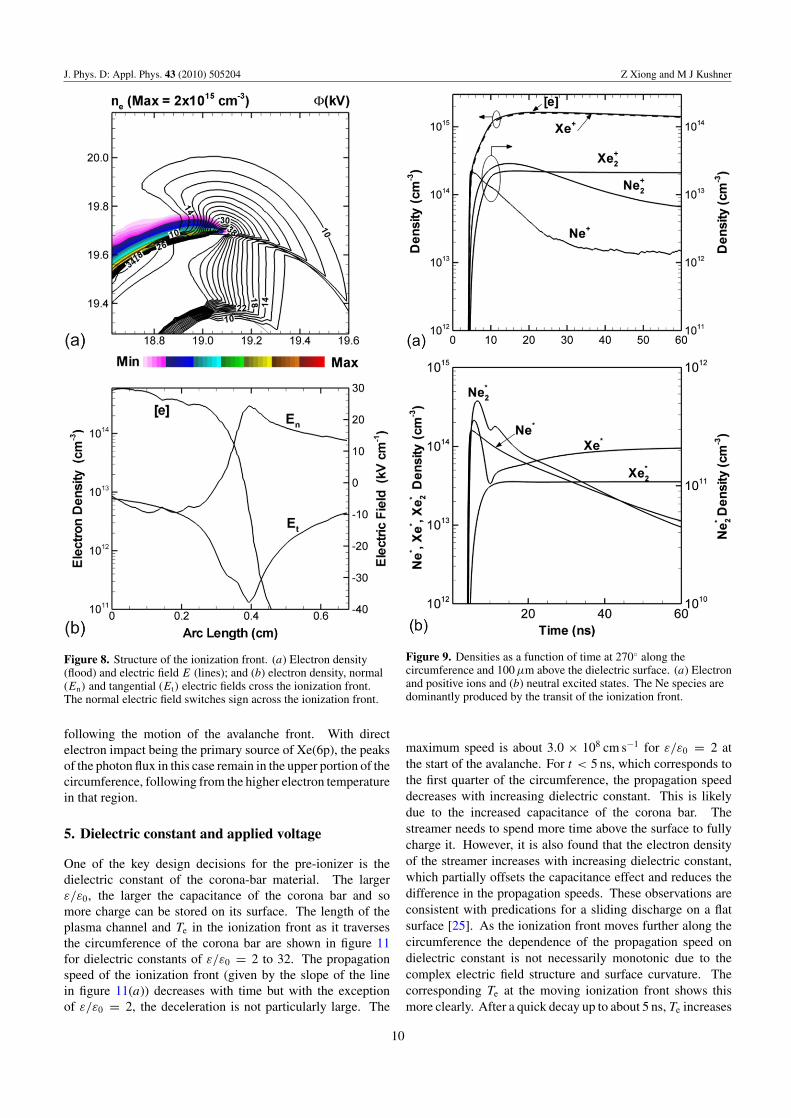
The electron density and electric field in the ionizationfront are shown in figure 8 at t = 4.8 ns (90◦). The electricfield has a peak of about 40 kV cm−1 (≈47 Td) close to thesurface, from which it spreads in both normal and tangentialdirections. This forms a sharp leading edge and a blunt trailingedge. The leading edge of the electron density coincides withthe peak of the electric field, so the electron avalanche occurspredominately in the trailing edge of the high field. Ahead ofthe ionization front, the normal componentEn is positive whichdrives electrons drifting towards the surface. Once crossingthe front, the sign of En reverses as a result of the chargingof the surface by the plasma. The tangential component Et
remains negative across the ionization front but peaks at theleading edge of the electron density where the space chargeis maximum. This large Et enables electrons to drift fromthe plasma region behind the front into non-ionized gas aheadof the front and thus serve as seeding electrons for furtheravalanche.
Typical discharge propagation times are tens of ns, and thisis much shorter than the acoustic time scale of the neutral gas—that is, the gas does not have time to get significantly heated,move and rarefy during the current pulse. Gas dynamicseffects are therefore insignificant during the current pulse. Forexample, for otherwise identical conditions, simulations wereperformed with and without solving the compressible Navier–Stokes equations. Gas temperatures at the ionization frontincreased by at most a few degrees.
Electron and ion densities at a fixed point located at270◦ and 100 µm above the dielectric surface are shown infigure 9(a). The electron and Xe+ densities have nearlyidentical sharp rises to a maximum of 2.0×1015 cm−3, showingthe ionization occurs first through Xe due to its lower ionizationpotential. After the ionization front, ne decays slowly dueto dissociative recombination with Xe+
2 and Ne+2 which is on
the time scale of tens of ns. The Ne+ density has a peak of2.0 × 1013 cm−3. After the avalanche front passes, the Ne+
density quickly decreases with time while the densities ofmolecular ions Xe+
2 and Ne+2 increase as a result of 3-body
association reactions. Since Te in the plasma channel, 2 eV, isbelow that which directly ionizes Ne, the Ne+ density is notreplenished. The Xe+ density is sustained by some continuingelectron impact ionization and Penning ionization from Neexcited states.
The densities of atomic and molecular excited states at thesame point are shown in figure 9(b). As the ionization frontpasses, both Ne∗ [Ne(3s)] and Xe∗ [Xe(6s)] are produced bydirect electron impact and thus their densities first rise sharplybut fall once Te decreases. After the passage of the ionizationfront, the density of Xe(6s) first decreases and then achieves anearly constant value, a quasi-balance between sources due todissociative recombination of Xe+
2 and losses due to formationof Xe∗
2. The density of Ne(3s) continues to decrease due tothe low Te which fails to replenish its density. After a slowerrise compared with the atomic excited species, the density ofXe∗
2 also nearly reaches a constant value. The density of theVUV emitting species Ne∗
2 has a maximum of 5 × 1011 cm−3.Although the radiative lifetime of Ne∗
2 is 11 ns, it is formed by
8
J. Phys. D: Appl. Phys. 43 (2010) 505204 Z Xiong and M J Kushner
Figure 7. Circumferential distribution of (a) electric potential, (b) electrical field, (c) electron temperature and (d) electron density at t = 1,5, 10, 15 and 20 ns. The arc length of 0–4 cm maps onto 0◦–360◦ beginning at the cathode. The electric field has non-monotonic behaviouralong the circumference due to the combined effects of geometry and surface charging.
3-body association reaction with Ne(3s), which has a longerpersistence. So, compared with the traversal time of the ion-ization front, the effective lifetime of the Ne∗
2 is relatively long.
4. Photon fluxes
Due to the lack of the resonance absorption, the VUV lightemitted from Ne∗
2 during the corona discharge experiences littleabsorption by other than Xe when passing through the plasma.The photon fluxes incident on the collector surface at differenttimes as a function of position 0◦ to 360◦ (corresponding toan arc length of 0–12 cm) are shown in figure 10(a). As theionization front traverses the corona-bar surface, the collectoris progressively illuminated according to the distribution ofNe∗
2 and the view angle spanned by the collector surface. Thefluxes are 3×1016 cm−2 s−1 to 2×1017 cm−2 s−1. Initially, theVUV light production lags the ionization front but increasesrapidly up to 10 ns when the ionization front is at about half wayaround the circumference. This is in large part a result of thecollector at any given point integrating emission received fromNe∗
2 distributed on nearly half the circumference of the coronabar. While the ionizing front continues to traverse the corona
bar and create new emitters, the photon fluxes emitted from thesurface behind the front start to decay. This causes the peakof the photon flux on the collecting surface to shift graduallyforward. By t = 20 ns, the peak flux has moved into the lowerhalf of the collector surface. Once the ionization front hastraversed the surface, the photon fluxes decay monotonicallywith time but maintain a relatively uniform circumferentialprofile.
To illustrate the effect of a lifetime of emitting specieson the photon flux distribution, we tracked emission froman optical transition from Xe(6p) with an artificially shortlifetime of 5 ns. The photon flux distribution on the collectorsurface from this transition is shown in figure 10(b). Thepeak magnitude of the photon flux is nearly three orders ofmagnitude higher than that from Ne∗
2, due in large part to themore rapid rate of population of the lower energy levels ofXe and shorter lifetime. However, the decay of the photonflux after the passing of the ionization front is also morerapid due to the shorter lifetime of the state. For example, att = 5 ns the peak of the photon flux has moved further from thecathode region as compared with the flux from Ne∗
2. Between5 and 20 ns, the photon collector is progressively illuminated
9
J. Phys. D: Appl. Phys. 43 (2010) 505204 Z Xiong and M J Kushner
Figure 8. Structure of the ionization front. (a) Electron density(flood) and electric field E (lines); and (b) electron density, normal(En) and tangential (Et) electric fields cross the ionization front.The normal electric field switches sign across the ionization front.
following the motion of the avalanche front. With directelectron impact being the primary source of Xe(6p), the peaksof the photon flux in this case remain in the upper portion of thecircumference, following from the higher electron temperaturein that region.
5. Dielectric constant and applied voltage
One of the key design decisions for the pre-ionizer is thedielectric constant of the corona-bar material. The largerε/ε0, the larger the capacitance of the corona bar and somore charge can be stored on its surface. The length of theplasma channel and Te in the ionization front as it traversesthe circumference of the corona bar are shown in figure 11for dielectric constants of ε/ε0 = 2 to 32. The propagationspeed of the ionization front (given by the slope of the linein figure 11(a)) decreases with time but with the exceptionof ε/ε0 = 2, the deceleration is not particularly large. The
Figure 9. Densities as a function of time at 270◦ along thecircumference and 100 µm above the dielectric surface. (a) Electronand positive ions and (b) neutral excited states. The Ne species aredominantly produced by the transit of the ionization front.
maximum speed is about 3.0 × 108 cm s−1 for ε/ε0 = 2 atthe start of the avalanche. For t < 5 ns, which corresponds tothe first quarter of the circumference, the propagation speeddecreases with increasing dielectric constant. This is likelydue to the increased capacitance of the corona bar. Thestreamer needs to spend more time above the surface to fullycharge it. However, it is also found that the electron densityof the streamer increases with increasing dielectric constant,which partially offsets the capacitance effect and reduces thedifference in the propagation speeds. These observations areconsistent with predications for a sliding discharge on a flatsurface [25]. As the ionization front moves further along thecircumference the dependence of the propagation speed ondielectric constant is not necessarily monotonic due to thecomplex electric field structure and surface curvature. Thecorresponding Te at the moving ionization front shows thismore clearly. After a quick decay up to about 5 ns, Te increases
10
J. Phys. D: Appl. Phys. 43 (2010) 505204 Z Xiong and M J Kushner
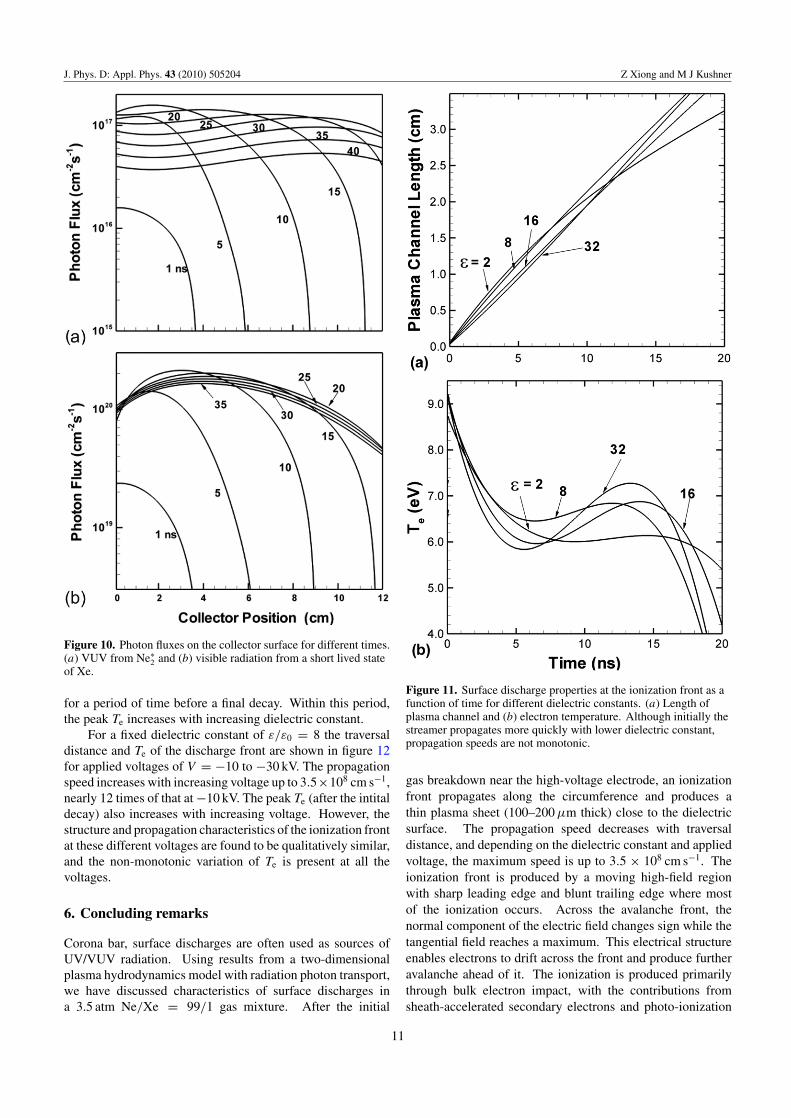
Figure 10. Photon fluxes on the collector surface for different times.(a) VUV from Ne∗
2 and (b) visible radiation from a short lived stateof Xe.
for a period of time before a final decay. Within this period,the peak Te increases with increasing dielectric constant.
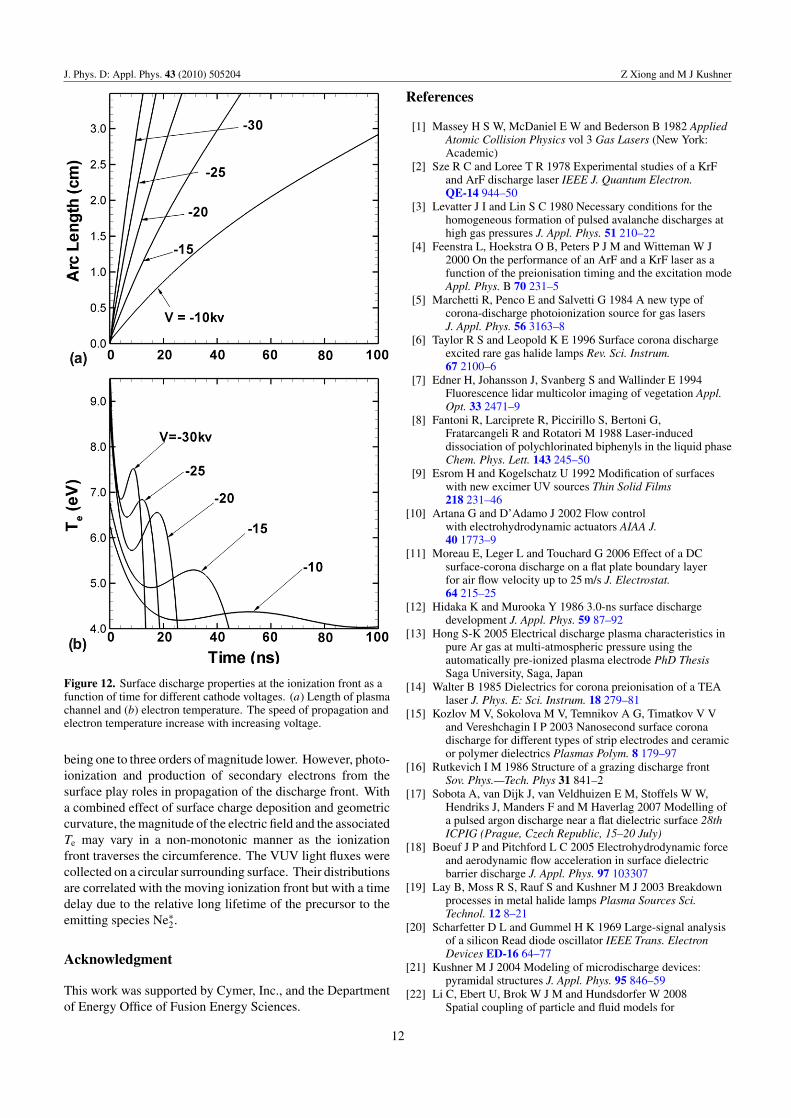
For a fixed dielectric constant of ε/ε0 = 8 the traversaldistance and Te of the discharge front are shown in figure 12for applied voltages of V = −10 to −30 kV. The propagationspeed increases with increasing voltage up to 3.5×108 cm s−1,nearly 12 times of that at −10 kV. The peak Te (after the intitaldecay) also increases with increasing voltage. However, thestructure and propagation characteristics of the ionization frontat these different voltages are found to be qualitatively similar,and the non-monotonic variation of Te is present at all thevoltages.
6. Concluding remarks
Corona bar, surface discharges are often used as sources ofUV/VUV radiation. Using results from a two-dimensionalplasma hydrodynamics model with radiation photon transport,we have discussed characteristics of surface discharges ina 3.5 atm Ne/Xe = 99/1 gas mixture. After the initial
Figure 11. Surface discharge properties at the ionization front as afunction of time for different dielectric constants. (a) Length ofplasma channel and (b) electron temperature. Although initially thestreamer propagates more quickly with lower dielectric constant,propagation speeds are not monotonic.
gas breakdown near the high-voltage electrode, an ionizationfront propagates along the circumference and produces athin plasma sheet (100–200 µm thick) close to the dielectricsurface. The propagation speed decreases with traversaldistance, and depending on the dielectric constant and appliedvoltage, the maximum speed is up to 3.5 × 108 cm s−1. Theionization front is produced by a moving high-field regionwith sharp leading edge and blunt trailing edge where mostof the ionization occurs. Across the avalanche front, thenormal component of the electric field changes sign while thetangential field reaches a maximum. This electrical structureenables electrons to drift across the front and produce furtheravalanche ahead of it. The ionization is produced primarilythrough bulk electron impact, with the contributions fromsheath-accelerated secondary electrons and photo-ionization
11
J. Phys. D: Appl. Phys. 43 (2010) 505204 Z Xiong and M J Kushner
Figure 12. Surface discharge properties at the ionization front as afunction of time for different cathode voltages. (a) Length of plasmachannel and (b) electron temperature. The speed of propagation andelectron temperature increase with increasing voltage.
being one to three orders of magnitude lower. However, photo-ionization and production of secondary electrons from thesurface play roles in propagation of the discharge front. Witha combined effect of surface charge deposition and geometriccurvature, the magnitude of the electric field and the associatedTe may vary in a non-monotonic manner as the ionizationfront traverses the circumference. The VUV light fluxes werecollected on a circular surrounding surface. Their distributionsare correlated with the moving ionization front but with a timedelay due to the relative long lifetime of the precursor to theemitting species Ne∗
2.
Acknowledgment
This work was supported by Cymer, Inc., and the Departmentof Energy Office of Fusion Energy Sciences.
References
[1] Massey H S W, McDaniel E W and Bederson B 1982 AppliedAtomic Collision Physics vol 3 Gas Lasers (New York:Academic)
[2] Sze R C and Loree T R 1978 Experimental studies of a KrFand ArF discharge laser IEEE J. Quantum Electron.QE-14 944–50
[3] Levatter J I and Lin S C 1980 Necessary conditions for thehomogeneous formation of pulsed avalanche discharges athigh gas pressures J. Appl. Phys. 51 210–22
[4] Feenstra L, Hoekstra O B, Peters P J M and Witteman W J2000 On the performance of an ArF and a KrF laser as afunction of the preionisation timing and the excitation modeAppl. Phys. B 70 231–5
[5] Marchetti R, Penco E and Salvetti G 1984 A new type ofcorona-discharge photoionization source for gas lasersJ. Appl. Phys. 56 3163–8
[6] Taylor R S and Leopold K E 1996 Surface corona dischargeexcited rare gas halide lamps Rev. Sci. Instrum.67 2100–6
[7] Edner H, Johansson J, Svanberg S and Wallinder E 1994Fluorescence lidar multicolor imaging of vegetation Appl.Opt. 33 2471–9
[8] Fantoni R, Larciprete R, Piccirillo S, Bertoni G,Fratarcangeli R and Rotatori M 1988 Laser-induceddissociation of polychlorinated biphenyls in the liquid phaseChem. Phys. Lett. 143 245–50
[9] Esrom H and Kogelschatz U 1992 Modification of surfaceswith new excimer UV sources Thin Solid Films218 231–46
[10] Artana G and D’Adamo J 2002 Flow controlwith electrohydrodynamic actuators AIAA J.40 1773–9
[11] Moreau E, Leger L and Touchard G 2006 Effect of a DCsurface-corona discharge on a flat plate boundary layerfor air flow velocity up to 25 m/s J. Electrostat.64 215–25
[12] Hidaka K and Murooka Y 1986 3.0-ns surface dischargedevelopment J. Appl. Phys. 59 87–92
[13] Hong S-K 2005 Electrical discharge plasma characteristics inpure Ar gas at multi-atmospheric pressure using theautomatically pre-ionized plasma electrode PhD ThesisSaga University, Saga, Japan
[14] Walter B 1985 Dielectrics for corona preionisation of a TEAlaser J. Phys. E: Sci. Instrum. 18 279–81
[15] Kozlov M V, Sokolova M V, Temnikov A G, Timatkov V Vand Vereshchagin I P 2003 Nanosecond surface coronadischarge for different types of strip electrodes and ceramicor polymer dielectrics Plasmas Polym. 8 179–97
[16] Rutkevich I M 1986 Structure of a grazing discharge frontSov. Phys.—Tech. Phys 31 841–2
[17] Sobota A, van Dijk J, van Veldhuizen E M, Stoffels W W,Hendriks J, Manders F and M Haverlag 2007 Modelling ofa pulsed argon discharge near a flat dielectric surface 28thICPIG (Prague, Czech Republic, 15–20 July)
[18] Boeuf J P and Pitchford L C 2005 Electrohydrodynamic forceand aerodynamic flow acceleration in surface dielectricbarrier discharge J. Appl. Phys. 97 103307
[19] Lay B, Moss R S, Rauf S and Kushner M J 2003 Breakdownprocesses in metal halide lamps Plasma Sources Sci.Technol. 12 8–21
[20] Scharfetter D L and Gummel H K 1969 Large-signal analysisof a silicon Read diode oscillator IEEE Trans. ElectronDevices ED-16 64–77
[21] Kushner M J 2004 Modeling of microdischarge devices:pyramidal structures J. Appl. Phys. 95 846–59
[22] Li C, Ebert U, Brok W J M and Hundsdorfer W 2008Spatial coupling of particle and fluid models for
12
J. Phys. D: Appl. Phys. 43 (2010) 505204 Z Xiong and M J Kushner
streamers: where nonlocality matters J. Phys. D: Appl. Phys.41 032005
[23] Li C, Ebert U and Hundsdorfer W 2009 3D hybridcomputations for streamer discharges and production of runaway electrons J. Phys. D: Appl. Phys. 42 202003
[24] Rauf S and Kushner M J 1999 Dynamics of acoplanar-electrode plasma display panel cell: I. Basicoperation J. Appl. Phys. 85 3460–9
[25] Lagarkov A N and Rutkevich I M 1994 Ionization Waves inElectrical Breakdown of Gases (New York: Springer) p 149
13