Embed Size (px)
Citation preview
INFORMATION TECHNOLOGY IN HIGHER EDUCATION
2017SURVEY OF CHIEF INFORMATION OFFICERS
EXECUTIVSUMMARY
E
PETER GRECO Saint Mary’s College of California
NAVEED HUSAIN Teachers College, Columbia University
VINCE KELLEN University of California at San Diego
DON MIHULKA University of Nebraska
BRIGITTE MUDUKUTI Texas Wesleyan University
DON STINSON Northern Kentucky University
REID CHRISTENBERRY Tennessee Tech University
BRIAN CORNELL Elmira College
PAUL CZARAPATA Kentucky Community and Technical College System
LEONARD DE BOTTON Berkeley College
JAN FOX Marshall University
DOYLE FRISKNEY University of Kentucky
Sponsored by
TINA STUCHELLUniversity of Mount Union
WALT WEIR University of Nebraska
BEN ZASTROCKY LBCIO
MICHAEL ZASTROCKY LBCIO

Trusted Enterprise Document Management for Higher Education
© 2016 Laserfiche. Laserfiche®, Run Smarter®, and Compulink® are registered trademarks of Compulink Management Center, Inc. All rights reserved.
• Automate critical, paper-intensive business processes
• Secure institutional records in compliance with state and federal regulations
• Support business continuity planning
• Reduce administrative costs campus-wide
Get your copy of Quicker Better Safer: Higher Education —complete with 10 back-office projects that make IT the campus leader in operational efficiency.
Visit laserfiche.com/LBCIO2017 for a complimentary copy.
TABLE OF CONTENTS
Introduction 05Institutional and CIO Characteristics 06Financial and Budget Planning 10IT Organization and Governance 16Consumerization of IT 22Administrative Computing 24Academic Computing 29Infrastructure 34Cloud Computing 43Big Data 52What Keeps CIOs Awake At Night? 55Summary 56
Trusted Enterprise Document Management for Higher Education
© 2016 Laserfiche. Laserfiche®, Run Smarter®, and Compulink® are registered trademarks of Compulink Management Center, Inc. All rights reserved.
• Automate critical, paper-intensive business processes
• Secure institutional records in compliance with state and federal regulations
• Support business continuity planning
• Reduce administrative costs campus-wide
Get your copy of Quicker Better Safer: Higher Education —complete with 10 back-office projects that make IT the campus leader in operational efficiency.
Visit laserfiche.com/LBCIO2017 for a complimentary copy.
The entire content in this report, including but not limited to text, design, graphics, and the selection and arrangements thereof, is copyrighted as a collective work under the United States and other copyright laws, and is the property of the Leadership Board for CIOs.
Copyright © 2017. ALL RIGHTS RESERVED. 1271 Cedar Street Broomfield, CO 80020. Telephone: (303) 807-9408.
You may electronically copy, download, and print hard copy portions of the report solely for your own, noncommercial use. You may not modify, copy, distribute, transmit, display, reproduce, publish, license, create derivative works from, transfer, or sell any information obtained from this report without the express, written authorization of the LBCIO.
ABOUT THE LBCIOThe Leadership Board for CIOs in Higher Education (LBCIO) Survey is a project of the LBCIO, led independently by Dr. Michael Zastrocky. When first fielded in 2010, the survey was a joint effort by Dr. Zastrocky and The Chronicle of Higher Education, Inc. Dr. Zastrocky publishes this global survey to provide CIOs with key metrics to help them do the work of managing and planning IT for their institutions.
2017 SURVEY OF CHIEF INFORMATION OFFICERS
5
This report, the eighth annual global LBCIO survey of Chief Information Officers (CIOs) in higher education, provides us with a few new insights and changes in how we look at the evolving role of the CIO in higher education. We made a few changes in the survey based on feedback from LBCIO members and respondents to previous surveys: The issue of consumerization is so embedded in higher-education culture today that we kept only a few questions and dropped the section on MOOCs due to prior results that indicate low interest in the questions — but this time around, we added a few questions on video surveillance. While budget concerns remain a key issue for CIOs, according to the EDUCAUSE 2017 Top 10 IT Issues, information security is the number one concern again this year. We added a few questions to look at malware and ransomware, and the results show CIOs are very concerned and are putting more resources into security issues. However, as one LBCIO board member said at a meeting, “It seems that the bad guys are getting smarter faster than we are!”
The LBCIO survey provides key metrics to help CIOs manage and plan IT for their institutions. Results from the survey are shared only in the aggregate, and all CIOs who complete the survey receive a copy of the annual report. Survey results are not meant to provide market research or a detailed plan to follow, but simply to tell the story of what CIOs currently are doing and their thoughts about the future. The questions are asked in such a way to make it easy for CIOs to fill out the survey. For example, the survey doesn’t ask for specific budget numbers but asks about budgets in general, with questions such as “Is your IT budget increasing, decreasing, or staying the same?” The responses provide important information for CIOs and other higher-education executives without getting into the actual budget numbers, which are often difficult to provide.
To get a picture of what’s happening with IT on campuses today, LBCIO surveyed a broad range of colleges and universities in April and May of 2017, collecting strategic and tactical information on major issues higher-education CIOs are facing. The survey included questions on topics including:
Characteristics of CIOs in higher educationFinancial and budget information for IT Organization and governance Personnel and staffing Consumerization Administrative computing plans Academic technologies and innovation Infrastructure and networking SecurityPlans for cloud computing and big data
Dr. Michael Zastrocky, Executive Director of LBCIO, was assisted by the following LBCIO members in the analysis of this year’s survey results: Reid Christenberry, CIO Emeri-tus, Tennessee Technological University; Brian Cornell, CIO, Elmira College; Maureen Coughlin, Director of Client Services, Teachers College, Columbia University; Dr. Paul Czarapata, Vice President and CIO, Kentucky Community and Technical College System; Leonard De Botton, CIO and Vice President, Information Systems, Berkeley College; Dr. Jan Fox, CIO Emer-itus, Marshall University; Dr. Doyle Friskney, CTO, University of Kentucky; Peter Greco, CTO, Saint Mary’s College of California; Scott Howder, Assistant CIO, Cedarville University; Naveed Husain, CIO, Teachers College, Columbia University; Dr. Vince Kellen, CIO, University of California at San Diego; Don Mihul-ka, Associate CIO, University of Nebraska; Brigitte Mudukuti, Associate CIO and Director of IT, Texas Wesleyan Universi-ty; Don Stinson, Director of Enterprise Systems, Northern Kentucky University; Dr. Tina Stuchell, Executive Director of IT, University of Mount Union; and Ben Zastrocky, Senior Advisor to LBCIO.
INTRODUCTION
2017 SURVEY OF CHIEF INFORMATION OFFICERS
6
2017 Survey Respondent Demographics
The 2017 survey was sent to almost 1,000 CIOs globally, and the response rate was greater than 20 percent. The survey was conducted for a period of three weeks during April and May 2017.
As in prior years, CIOs from public institutions were the majority of the respondents (61 percent up from 54 percent in 2016) versus private, nonprofit institutions (38 percent down from 45 percent in 2016) and for-profit institutions (1 percent). This year the breakout by classification of institu-tions was as follows:
The size of the responding institutions varied, with 19 percent having enrollment of 3,000 students or less, 14 percent with 3,001- 5,000 students, 17 percent between 5,001 and 10,000, 29 percent with enrollment of 10,001-25,000 students, and 21 percent at more than 25,000 students. The global breakout is as follows: North America, 89 percent; Europe, 5 percent; Australasia, 5 percent; South America, 1 percent and Africa, 1 percent.
CIO Responsibilities
Over the past five years, CIOs consistently reported their management scope included traditional core responsibilities for supporting administrative and academic applications, programming applications, helpdesk, networking, and tele-communications. This year’s survey has shown a decline in library management responsibilities for the second year in a row. The percentage of CIOs responsible for research computing has stayed the same from last year while institu-tional research responsibilities increased from last year. As security continues to be high priority, it is not surprising that 99 percent of CIOs reported that IT security and disaster recovery is included in their scope of management. CIO responsibility for media services, including support of video services, rose this year with 75 percent reporting this in their scope of responsibilities, up from 67% last year.
INSTITUTIONAL AND CIO CHARACTERISTICS
CIO Characteristics
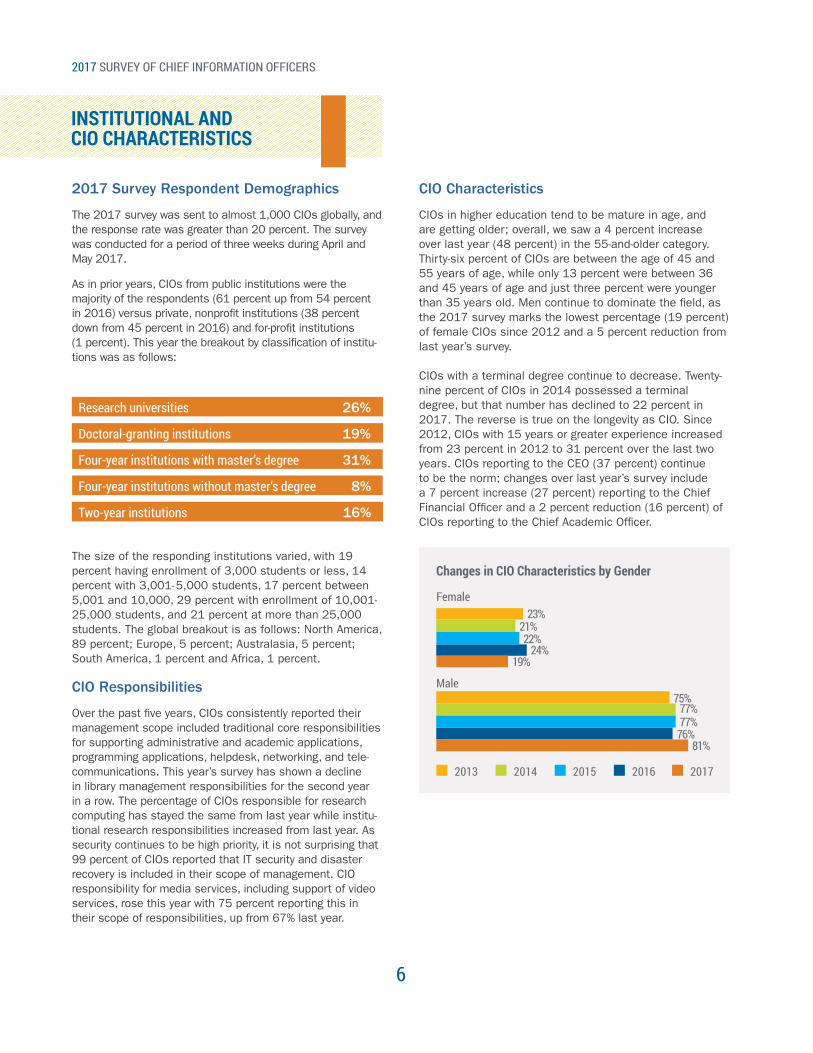
CIOs in higher education tend to be mature in age, and are getting older; overall, we saw a 4 percent increase over last year (48 percent) in the 55-and-older category. Thirty-six percent of CIOs are between the age of 45 and 55 years of age, while only 13 percent were between 36 and 45 years of age and just three percent were younger than 35 years old. Men continue to dominate the field, as the 2017 survey marks the lowest percentage (19 percent) of female CIOs since 2012 and a 5 percent reduction from last year’s survey.
CIOs with a terminal degree continue to decrease. Twenty-nine percent of CIOs in 2014 possessed a terminal degree, but that number has declined to 22 percent in 2017. The reverse is true on the longevity as CIO. Since 2012, CIOs with 15 years or greater experience increased from 23 percent in 2012 to 31 percent over the last two years. CIOs reporting to the CEO (37 percent) continue to be the norm; changes over last year’s survey include a 7 percent increase (27 percent) reporting to the Chief Financial Officer and a 2 percent reduction (16 percent) of CIOs reporting to the Chief Academic Officer.
26%Research universities
19%Doctoral-granting institutions
31%Four-year institutions with master’s degree
8%Four-year institutions without master’s degree
16%Two-year institutions
Changes in CIO Characteristics by Gender
2013 2014 2015 2016 2017
23%
24%19%
21%22%
Female
75%
76%81%
77%77%
Male
2017 SURVEY OF CHIEF INFORMATION OFFICERS
7
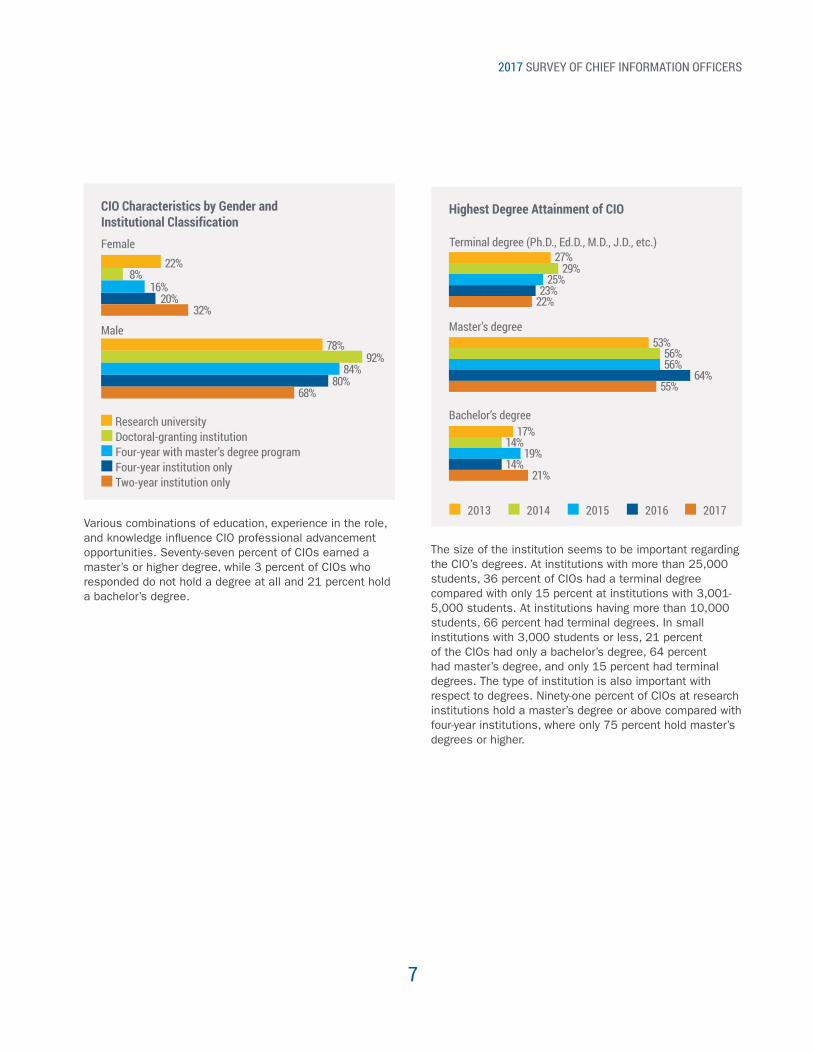
27%29%
25%23%
22%
Terminal degree (Ph.D., Ed.D., M.D., J.D., etc.)
53%56%56%
64%55%
Master’s degree
17%14%
19%14%
21%
Bachelor’s degree
Highest Degree Attainment of CIOCIO Characteristics by Gender and Institutional Classification
Research universityDoctoral-granting institutionFour-year with master’s degree programFour-year institution onlyTwo-year institution only
22%
20%32%
8%16%
Female
78%
80%68%
92%84%
Male
Various combinations of education, experience in the role, and knowledge influence CIO professional advancement opportunities. Seventy-seven percent of CIOs earned a master’s or higher degree, while 3 percent of CIOs who responded do not hold a degree at all and 21 percent hold a bachelor’s degree.
The size of the institution seems to be important regarding the CIO’s degrees. At institutions with more than 25,000 students, 36 percent of CIOs had a terminal degree compared with only 15 percent at institutions with 3,001-5,000 students. At institutions having more than 10,000 students, 66 percent had terminal degrees. In small institutions with 3,000 students or less, 21 percent of the CIOs had only a bachelor’s degree, 64 percent had master’s degree, and only 15 percent had terminal degrees. The type of institution is also important with respect to degrees. Ninety-one percent of CIOs at research institutions hold a master’s degree or above compared with four-year institutions, where only 75 percent hold master’s degrees or higher.
2013 2014 2015 2016 2017
2017 SURVEY OF CHIEF INFORMATION OFFICERS
8
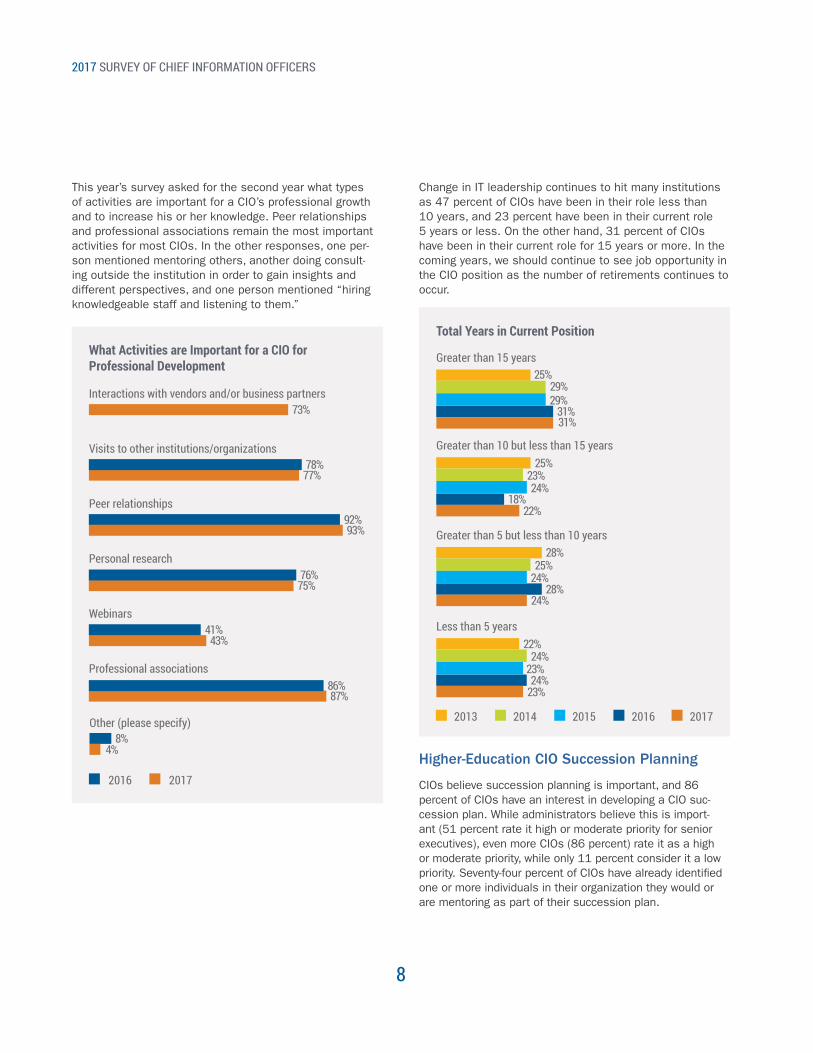
This year’s survey asked for the second year what types of activities are important for a CIO’s professional growth and to increase his or her knowledge. Peer relationships and professional associations remain the most important activities for most CIOs. In the other responses, one per-son mentioned mentoring others, another doing consult-ing outside the institution in order to gain insights and different perspectives, and one person mentioned “hiring knowledgeable staff and listening to them.”
What Activities are Important for a CIO for Professional Development
4%8%
Other (please specify)
73%Interactions with vendors and/or business partners
77%78%
Visits to other institutions/organizations
93%92%
Peer relationships
75%76%
Personal research
43%41%
Webinars
87%86%
Professional associations
2016 2017
Total Years in Current Position
Greater than 15 years25%
31%31%
29%29%
Greater than 10 but less than 15 years25%
18%22%
23%24%
Greater than 5 but less than 10 years28%
28%24%
25%24%
Less than 5 years22%
24%23%
24%23%
Higher-Education CIO Succession Planning
CIOs believe succession planning is important, and 86 percent of CIOs have an interest in developing a CIO suc-cession plan. While administrators believe this is import-ant (51 percent rate it high or moderate priority for senior executives), even more CIOs (86 percent) rate it as a high or moderate priority, while only 11 percent consider it a low priority. Seventy-four percent of CIOs have already identified one or more individuals in their organization they would or are mentoring as part of their succession plan.
Change in IT leadership continues to hit many institutions as 47 percent of CIOs have been in their role less than 10 years, and 23 percent have been in their current role 5 years or less. On the other hand, 31 percent of CIOs have been in their current role for 15 years or more. In the coming years, we should continue to see job opportunity in the CIO position as the number of retirements continues to occur.
2013 2014 2015 2016 2017
2017 SURVEY OF CHIEF INFORMATION OFFICERS
9
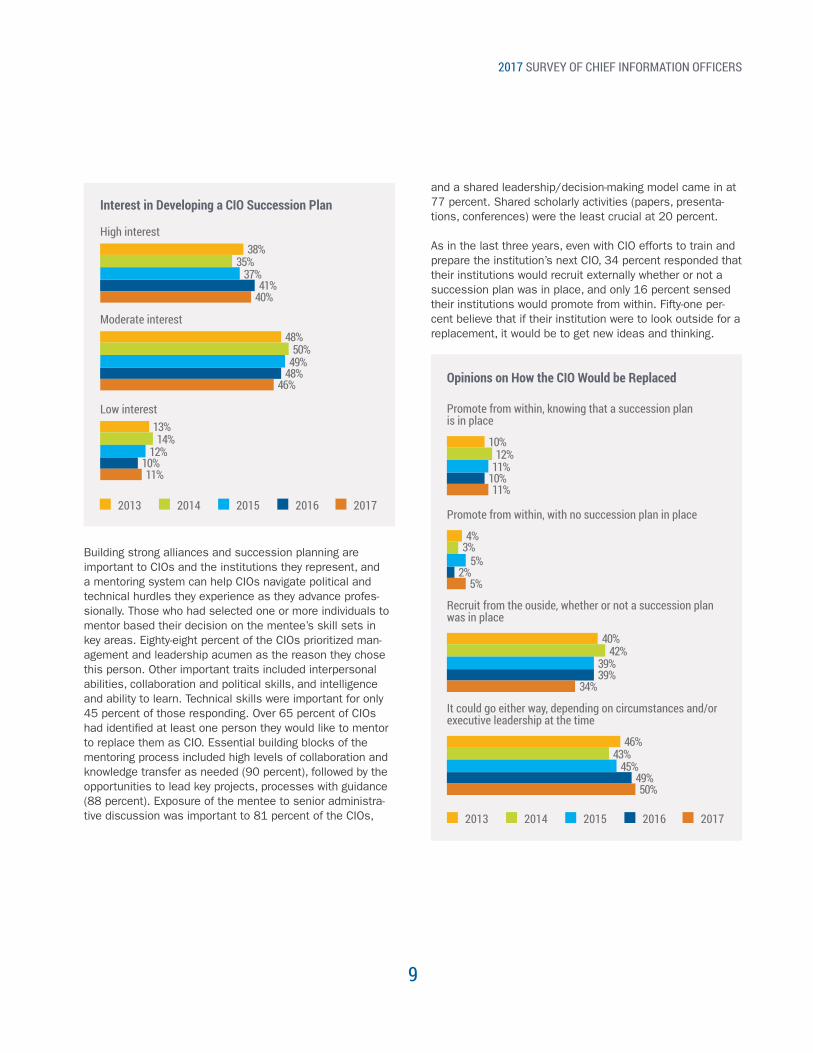
Opinions on How the CIO Would be Replaced
Promote from within, knowing that a succession plan is in place
10%
10%11%
12%11%
Promote from within, with no succession plan in place
4%
2%5%
3%5%
Recruit from the ouside, whether or not a succession plan was in place
40%
39%34%
42%39%
It could go either way, depending on circumstances and/or executive leadership at the time
46%
49%50%
43%45%
Interest in Developing a CIO Succession Plan
High interest38%
41%40%
35%37%
Moderate interest48%
48%46%
50%49%
Low interest13%
10%11%
14%12%
Building strong alliances and succession planning are important to CIOs and the institutions they represent, and a mentoring system can help CIOs navigate political and technical hurdles they experience as they advance profes-sionally. Those who had selected one or more individuals to mentor based their decision on the mentee’s skill sets in key areas. Eighty-eight percent of the CIOs prioritized man-agement and leadership acumen as the reason they chose this person. Other important traits included interpersonal abilities, collaboration and political skills, and intelligence and ability to learn. Technical skills were important for only 45 percent of those responding. Over 65 percent of CIOs had identified at least one person they would like to mentor to replace them as CIO. Essential building blocks of the mentoring process included high levels of collaboration and knowledge transfer as needed (90 percent), followed by the opportunities to lead key projects, processes with guidance (88 percent). Exposure of the mentee to senior administra-tive discussion was important to 81 percent of the CIOs,
and a shared leadership/decision-making model came in at 77 percent. Shared scholarly activities (papers, presenta-tions, conferences) were the least crucial at 20 percent.
As in the last three years, even with CIO efforts to train and prepare the institution’s next CIO, 34 percent responded that their institutions would recruit externally whether or not a succession plan was in place, and only 16 percent sensed their institutions would promote from within. Fifty-one per-cent believe that if their institution were to look outside for a replacement, it would be to get new ideas and thinking.
2013 2014 2015 2016 2017
2013 2014 2015 2016 2017
2017 SURVEY OF CHIEF INFORMATION OFFICERS
10
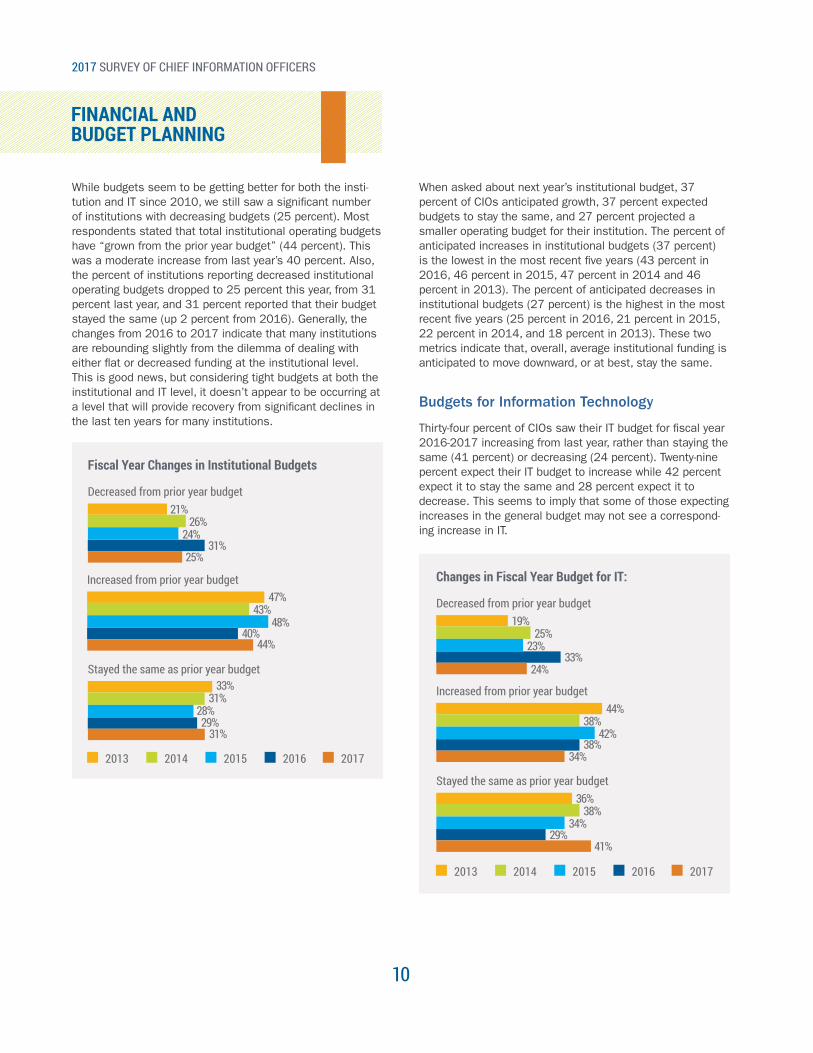
While budgets seem to be getting better for both the insti-tution and IT since 2010, we still saw a significant number of institutions with decreasing budgets (25 percent). Most respondents stated that total institutional operating budgets have “grown from the prior year budget” (44 percent). This was a moderate increase from last year’s 40 percent. Also, the percent of institutions reporting decreased institutional operating budgets dropped to 25 percent this year, from 31 percent last year, and 31 percent reported that their budget stayed the same (up 2 percent from 2016). Generally, the changes from 2016 to 2017 indicate that many institutions are rebounding slightly from the dilemma of dealing with either flat or decreased funding at the institutional level. This is good news, but considering tight budgets at both the institutional and IT level, it doesn’t appear to be occurring at a level that will provide recovery from significant declines in the last ten years for many institutions.
When asked about next year’s institutional budget, 37 percent of CIOs anticipated growth, 37 percent expected budgets to stay the same, and 27 percent projected a smaller operating budget for their institution. The percent of anticipated increases in institutional budgets (37 percent) is the lowest in the most recent five years (43 percent in 2016, 46 percent in 2015, 47 percent in 2014 and 46 percent in 2013). The percent of anticipated decreases in institutional budgets (27 percent) is the highest in the most recent five years (25 percent in 2016, 21 percent in 2015, 22 percent in 2014, and 18 percent in 2013). These two metrics indicate that, overall, average institutional funding is anticipated to move downward, or at best, stay the same.
Budgets for Information Technology
Thirty-four percent of CIOs saw their IT budget for fiscal year 2016-2017 increasing from last year, rather than staying the same (41 percent) or decreasing (24 percent). Twenty-nine percent expect their IT budget to increase while 42 percent expect it to stay the same and 28 percent expect it to decrease. This seems to imply that some of those expecting increases in the general budget may not see a correspond-ing increase in IT.
FINANCIAL AND BUDGET PLANNING
Fiscal Year Changes in Institutional Budgets
Increased from prior year budget47%
40%44%
43%48%
Decreased from prior year budget21%
31%25%
26%24%
Stayed the same as prior year budget33%
29%31%
31%28%
2013 2014 2015 2016 2017
Changes in Fiscal Year Budget for IT:
Increased from prior year budget44%
38%34%
38%42%
Decreased from prior year budget19%
33%24%
25%23%
Stayed the same as prior year budget36%
29%41%
38%34%
2013 2014 2015 2016 2017
2017 SURVEY OF CHIEF INFORMATION OFFICERS
11
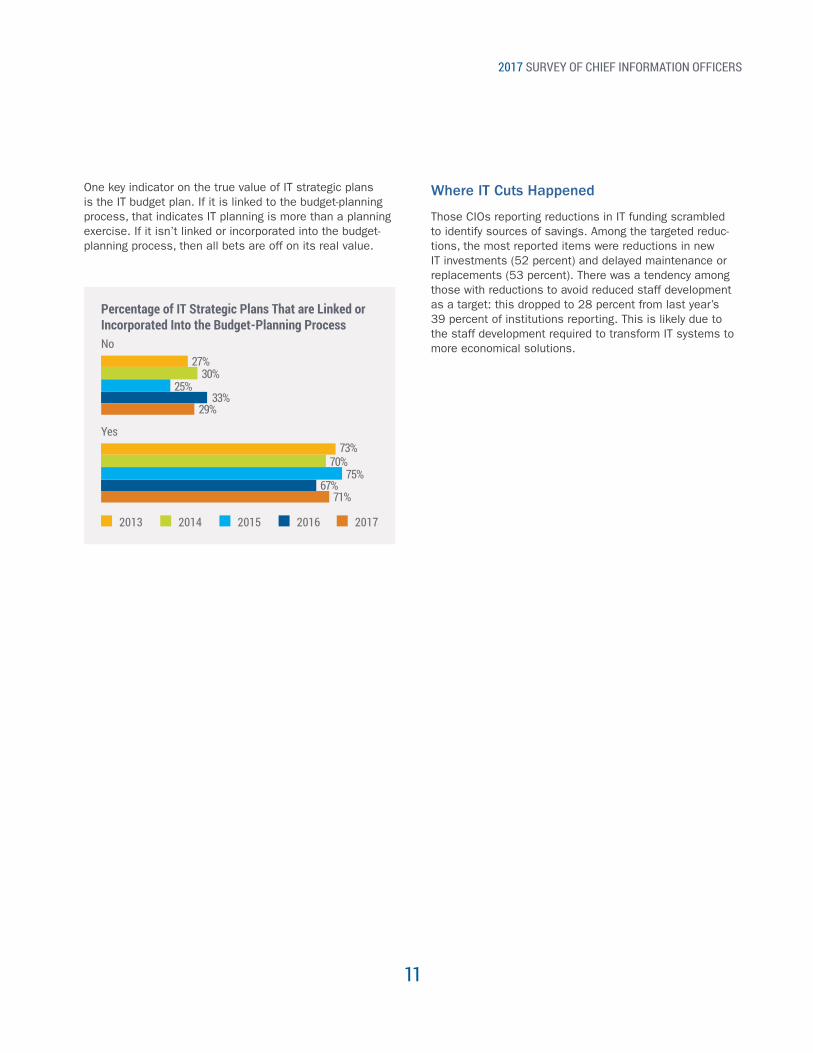
One key indicator on the true value of IT strategic plans is the IT budget plan. If it is linked to the budget-planning process, that indicates IT planning is more than a planning exercise. If it isn’t linked or incorporated into the budget- planning process, then all bets are off on its real value.
Where IT Cuts Happened
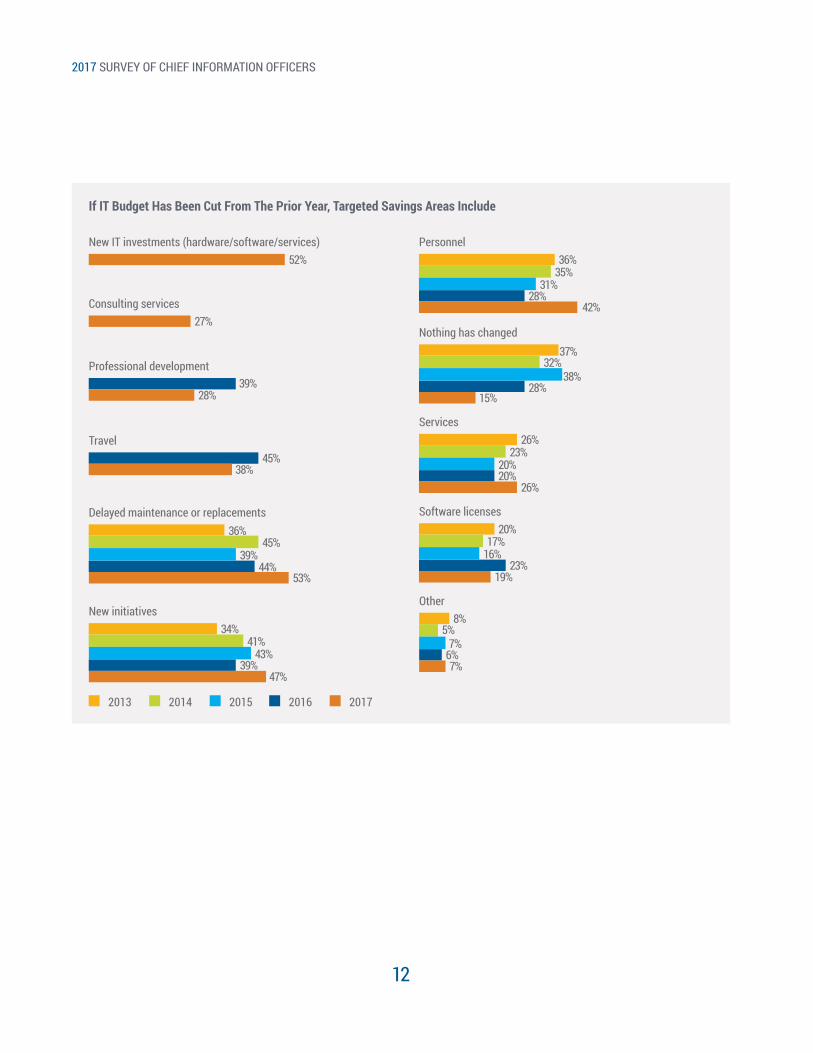
Those CIOs reporting reductions in IT funding scrambled to identify sources of savings. Among the targeted reduc-tions, the most reported items were reductions in new IT investments (52 percent) and delayed maintenance or replacements (53 percent). There was a tendency among those with reductions to avoid reduced staff development as a target: this dropped to 28 percent from last year’s 39 percent of institutions reporting. This is likely due to the staff development required to transform IT systems to more economical solutions.
Percentage of IT Strategic Plans That are Linked or Incorporated Into the Budget-Planning Process
Yes73%
67%71%
70%75%
No27%
33%29%
30%25%
2013 2014 2015 2016 2017
2017 SURVEY OF CHIEF INFORMATION OFFICERS
12
If IT Budget Has Been Cut From The Prior Year, Targeted Savings Areas Include
2013 2014 2015 2016 2017
New IT investments (hardware/software/services)52%
Consulting services27%
Professional development39%
28%
Travel45%
38%
Delayed maintenance or replacements
New initiatives
Personnel
Nothing has changed
Services
Software licenses
Other
36%
34%
36%
37%
26%
20%
8%
44%
39%
28%
28%
20%
23%
6%
53%
47%
42%
15%
26%
19%
7%
45%
41%
35%
32%
23%
17%
5%
39%
43%
31%
38%
20%
16%
7%
2017 SURVEY OF CHIEF INFORMATION OFFICERS
13
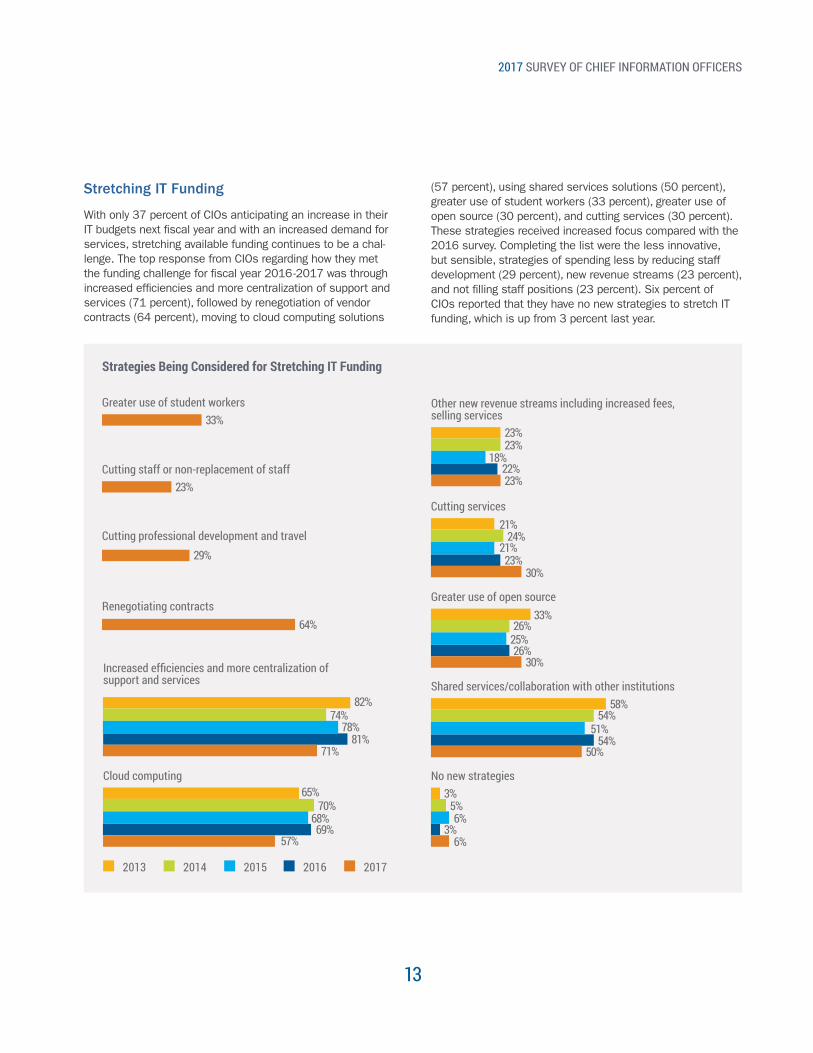
Strategies Being Considered for Stretching IT Funding
2013 2014 2015 2016 2017
Greater use of student workers
Cutting staff or non-replacement of staff
Cutting professional development and travel
Renegotiating contracts
33%
23%
29%
64%
Increased efficiencies and more centralization of support and services
82%
81%71%
74%78%
Cloud computing
Other new revenue streams including increased fees, selling services
Cutting services
Greater use of open source
Shared services/collaboration with other institutions
No new strategies65%
23%
21%
58%
3%
69%
22%
23%
26%
54%
3%57%
23%
30%
30%
50%
6%
70%
23%
24%
26%33%
54%
5%68%
18%
21%
25%
51%
6%
Stretching IT Funding
With only 37 percent of CIOs anticipating an increase in their IT budgets next fiscal year and with an increased demand for services, stretching available funding continues to be a chal-lenge. The top response from CIOs regarding how they met the funding challenge for fiscal year 2016 -2017 was through increased efficiencies and more centralization of support and services (71 percent), followed by renegotiation of vendor contracts (64 percent), moving to cloud computing solutions
(57 percent), using shared services solutions (50 percent), greater use of student workers (33 percent), greater use of open source (30 percent), and cutting services (30 percent). These strategies received increased focus compared with the 2016 survey. Completing the list were the less innovative, but sensible, strategies of spending less by reducing staff development (29 percent), new revenue streams (23 percent), and not filling staff positions (23 percent). Six percent of CIOs reported that they have no new strategies to stretch IT funding, which is up from 3 percent last year.
2017 SURVEY OF CHIEF INFORMATION OFFICERS
14
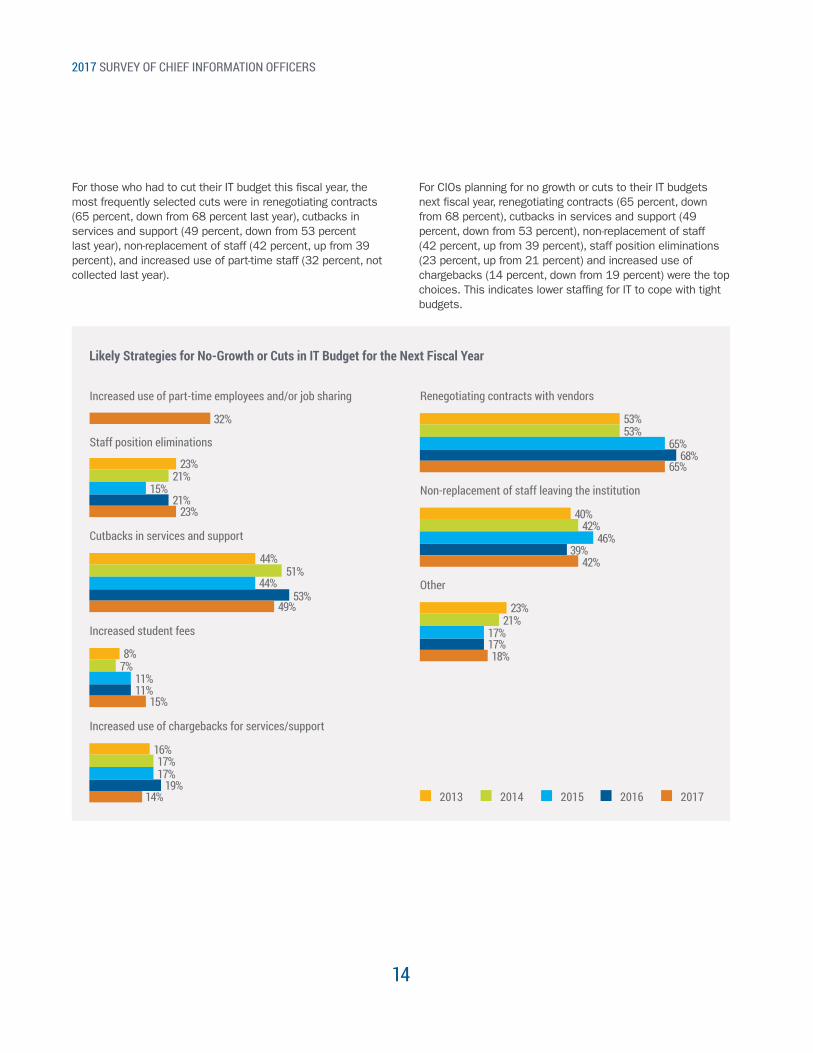
For those who had to cut their IT budget this fiscal year, the most frequently selected cuts were in renegotiating contracts (65 percent, down from 68 percent last year), cutbacks in services and support (49 percent, down from 53 percent last year), non-replacement of staff (42 percent, up from 39 percent), and increased use of part-time staff (32 percent, not collected last year).
Increased use of part-time employees and/or job sharing
32%
Likely Strategies for No-Growth or Cuts in IT Budget for the Next Fiscal Year
Staff position eliminations
23%
21%23%
21%15%
Cutbacks in services and support
44%
53%49%
51%44%
Increased student fees
8%
11%15%
7%11%
Increased use of chargebacks for services/support
16%
19%14%
17%17%
Renegotiating contracts with vendors
53%
68%65%
53%65%
Non-replacement of staff leaving the institution
40%
39%42%
42%46%
Other
23%
17%18%
21%17%
For CIOs planning for no growth or cuts to their IT budgets next fiscal year, renegotiating contracts (65 percent, down from 68 percent), cutbacks in services and support (49 percent, down from 53 percent), non-replacement of staff (42 percent, up from 39 percent), staff position eliminations (23 percent, up from 21 percent) and increased use of chargebacks (14 percent, down from 19 percent) were the top choices. This indicates lower staffing for IT to cope with tight budgets.
2013 2014 2015 2016 2017
2017 SURVEY OF CHIEF INFORMATION OFFICERS
15
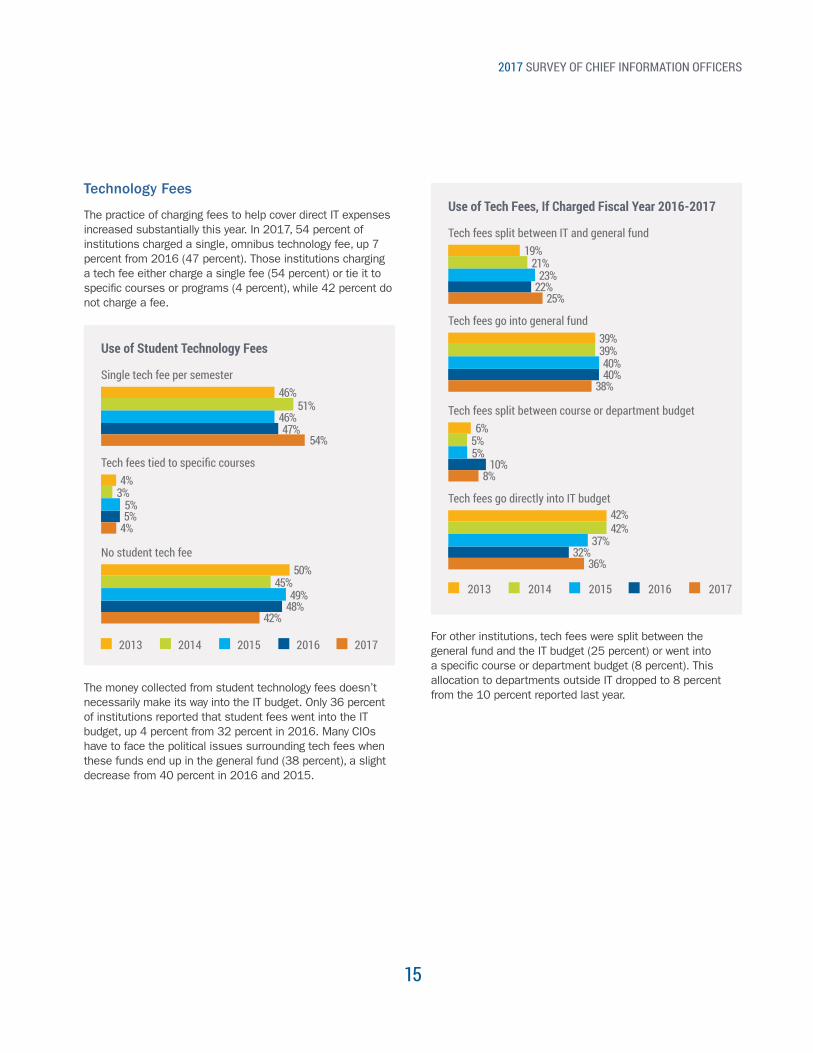
Technology Fees
The practice of charging fees to help cover direct IT expenses increased substantially this year. In 2017, 54 percent of institutions charged a single, omnibus technology fee, up 7 percent from 2016 (47 percent). Those institutions charging a tech fee either charge a single fee (54 percent) or tie it to specific courses or programs (4 percent), while 42 percent do not charge a fee.
Use of Student Technology Fees
Use of Tech Fees, If Charged Fiscal Year 2016-2017
2013 2014 2015 2016 2017
Tech fees tied to specific courses4%
5%4%
3%5%
Single tech fee per semester
Tech fees split between IT and general fund
46%
19%
47%
22%
54%
25%
51%
21%
46%
23%
No student tech fee
Tech fees split between course or department budget
50%
6%
48%
10%
42%
8%
45%
5%
49%
5%
The money collected from student technology fees doesn’t necessarily make its way into the IT budget. Only 36 percent of institutions reported that student fees went into the IT budget, up 4 percent from 32 percent in 2016. Many CIOs have to face the political issues surrounding tech fees when these funds end up in the general fund (38 percent), a slight decrease from 40 percent in 2016 and 2015.
Tech fees go into general fund39%
40%38%
39%40%
Tech fees go directly into IT budget42%
32%36%
42%37%
For other institutions, tech fees were split between the general fund and the IT budget (25 percent) or went into a specific course or department budget (8 percent). This allocation to departments outside IT dropped to 8 percent from the 10 percent reported last year.
2013 2014 2015 2016 2017
2017 SURVEY OF CHIEF INFORMATION OFFICERS
16
IT ORGANIZATIONAND GOVERNANCE
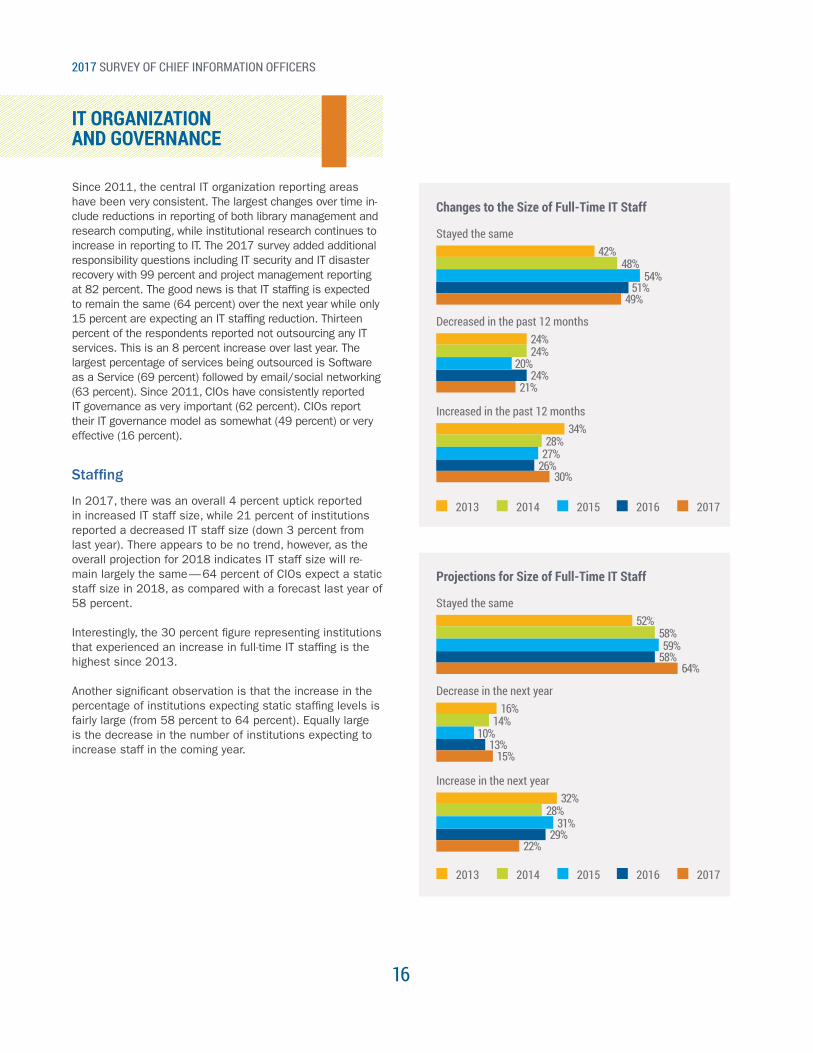
Since 2011, the central IT organization reporting areas have been very consistent. The largest changes over time in-clude reductions in reporting of both library management and research computing, while institutional research continues to increase in reporting to IT. The 2017 survey added additional responsibility questions including IT security and IT disaster recovery with 99 percent and project management reporting at 82 percent. The good news is that IT staffing is expected to remain the same (64 percent) over the next year while only 15 percent are expecting an IT staffing reduction. Thirteen percent of the respondents reported not outsourcing any IT services. This is an 8 percent increase over last year. The largest percentage of services being outsourced is Software as a Service (69 percent) followed by email/social networking (63 percent). Since 2011, CIOs have consistently reported IT governance as very important (62 percent). CIOs report their IT governance model as somewhat (49 percent) or very effective (16 percent).
Staffing
In 2017, there was an overall 4 percent uptick reported in increased IT staff size, while 21 percent of institutions reported a decreased IT staff size (down 3 percent from last year). There appears to be no trend, however, as the overall projection for 2018 indicates IT staff size will re-main largely the same — 64 percent of CIOs expect a static staff size in 2018, as compared with a forecast last year of 58 percent.
Interestingly, the 30 percent figure representing institutions that experienced an increase in full-time IT staffing is the highest since 2013.
Another significant observation is that the increase in the percentage of institutions expecting static staffing levels is fairly large (from 58 percent to 64 percent). Equally large is the decrease in the number of institutions expecting to increase staff in the coming year.
Projections for Size of Full-Time IT Staff
Changes to the Size of Full-Time IT Staff
2013 2014 2015 2016 2017
Decrease in the next year
Decreased in the past 12 months
16%
24%
13%
24%
15%
21%
14%
24%
10%
20%
Stayed the same
Stayed the same
52%
42%
58%
51%
64%
49%
58%
48%
59%
54%
Increase in the next year
Increased in the past 12 months
32%
34%
29%
26%
22%
30%
28%
28%
31%
27%
2013 2014 2015 2016 2017
2017 SURVEY OF CHIEF INFORMATION OFFICERS
17
Projections for Size of Full-Time IT Staff,by Size of Institution
More than 25,000 students
More than 10,000 students but less than 25,000 students
5,001 - 10,000 students
3,001 - 5,000 students
3,000 students or less
Decrease in the next year28%
15%14%
13%3%
Stayed the same44%
69%86%
57%67%
Increase in the next year28%
15%0%
30%30%
Changes to Percent of Work Effort Performed by Student Workers
2013 2014 2015 2016 2017
Between 10 and 20%31%
36%32%
31%30%
More than 20%12%
12%8%
15%13%
10% or less57%
51%59%
54%58%
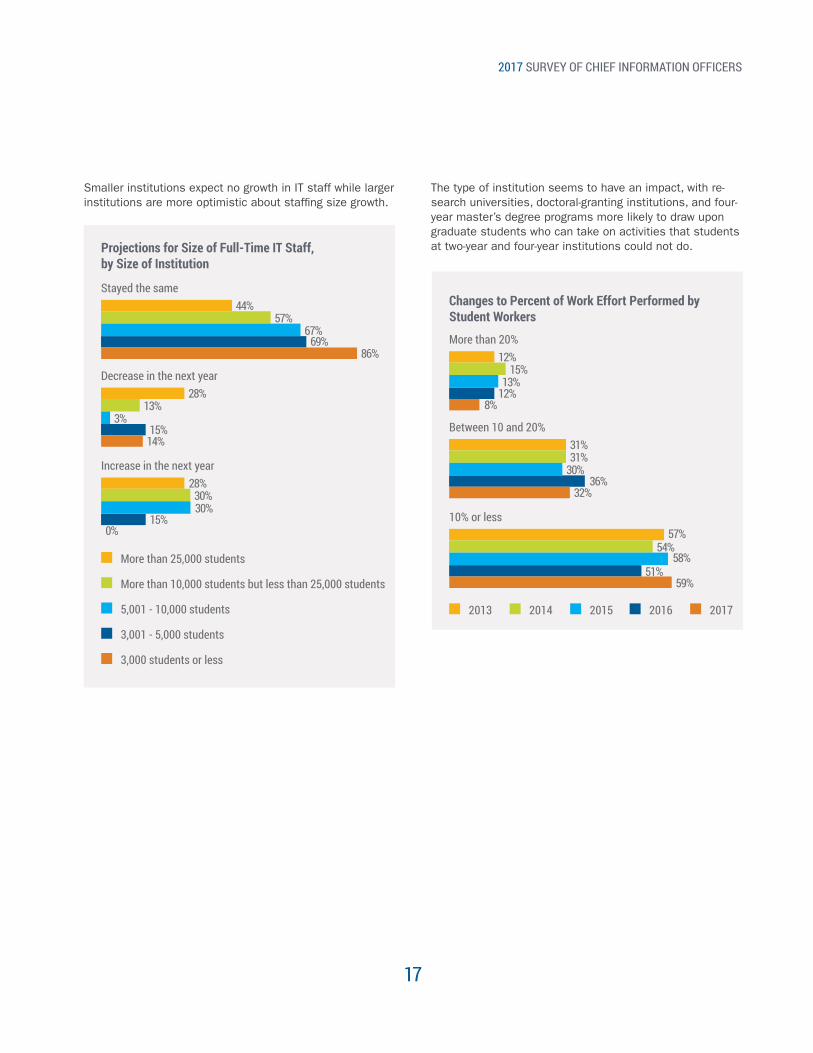
Smaller institutions expect no growth in IT staff while larger institutions are more optimistic about staffing size growth.
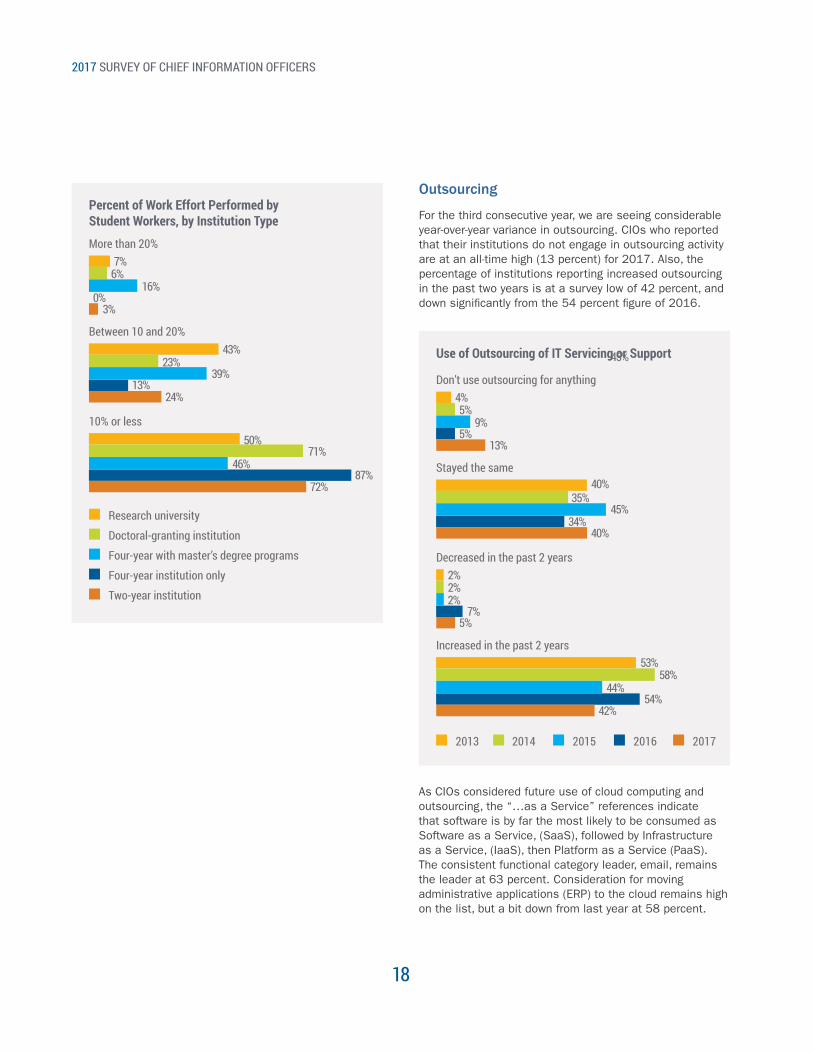
The type of institution seems to have an impact, with re-search universities, doctoral-granting institutions, and four-year master’s degree programs more likely to draw upon graduate students who can take on activities that students at two-year and four-year institutions could not do.
2017 SURVEY OF CHIEF INFORMATION OFFICERS
18
Outsourcing
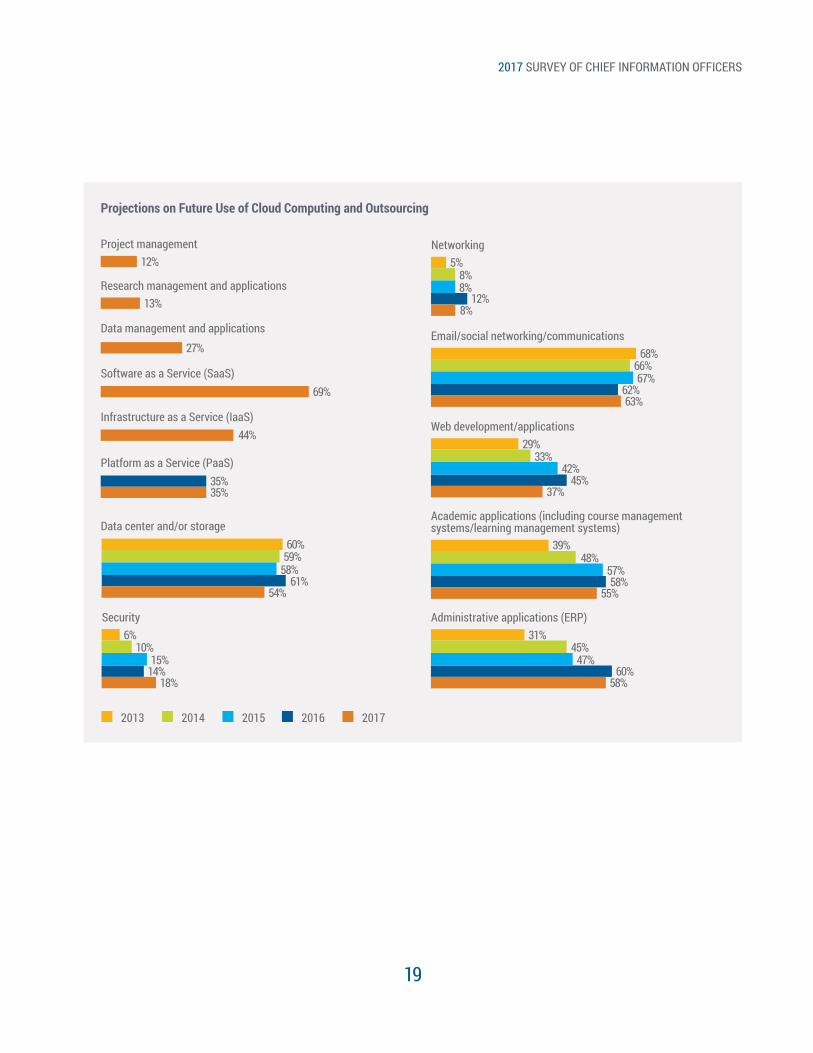
For the third consecutive year, we are seeing considerable year-over-year variance in outsourcing. CIOs who reported that their institutions do not engage in outsourcing activity are at an all-time high (13 percent) for 2017. Also, the percentage of institutions reporting increased outsourcing in the past two years is at a survey low of 42 percent, and down significantly from the 54 percent figure of 2016.
Use of Outsourcing of IT Servicing or Support
2013 2014 2015 2016 2017
Don’t use outsourcing for anything4%
5%13%
5%9%
Decreased in the past 2 years2%
7%5%
2%2%
Stayed the same40%
34%40%
35%
45%
Increased in the past 2 years
45%
42%54%
44%58%
53%
As CIOs considered future use of cloud computing and outsourcing, the “…as a Service” references indicate that software is by far the most likely to be consumed as Software as a Service, (SaaS), followed by Infrastructure as a Service, (IaaS), then Platform as a Service (PaaS). The consistent functional category leader, email, remains the leader at 63 percent. Consideration for moving administrative applications (ERP) to the cloud remains high on the list, but a bit down from last year at 58 percent.
Percent of Work Effort Performed by Student Workers, by Institution Type
Between 10 and 20%43%
13%24%
23%39%
More than 20%7%
0%3%
6%16%
10% or less50%
72%
71%46%
Research university
Doctoral-granting institution
Four-year with master’s degree programs
Four-year institution only
Two-year institution
87%
2017 SURVEY OF CHIEF INFORMATION OFFICERS
19
Projections on Future Use of Cloud Computing and Outsourcing
2013 2014 2015 2016 2017
Project management12%
Research management and applications13%
Data management and applications
27%
Software as a Service (SaaS)69%
Infrastructure as a Service (IaaS)44%
Platform as a Service (PaaS)35%35%
Data center and/or storage60%
61%54%
59%58%
Security
Networking
Email/social networking/communications
Web development/applications
Academic applications (including course management systems/learning management systems)
Administrative applications (ERP)6%
5%
68%
39%
31%
14%
12%
62%
45%
58%
60%18%
8%
63%
37%
55%
58%
10%
8%
66%
33%29%
48%
45%15%
8%
67%
42%
57%
47%
2017 SURVEY OF CHIEF INFORMATION OFFICERS
20
IT Governance
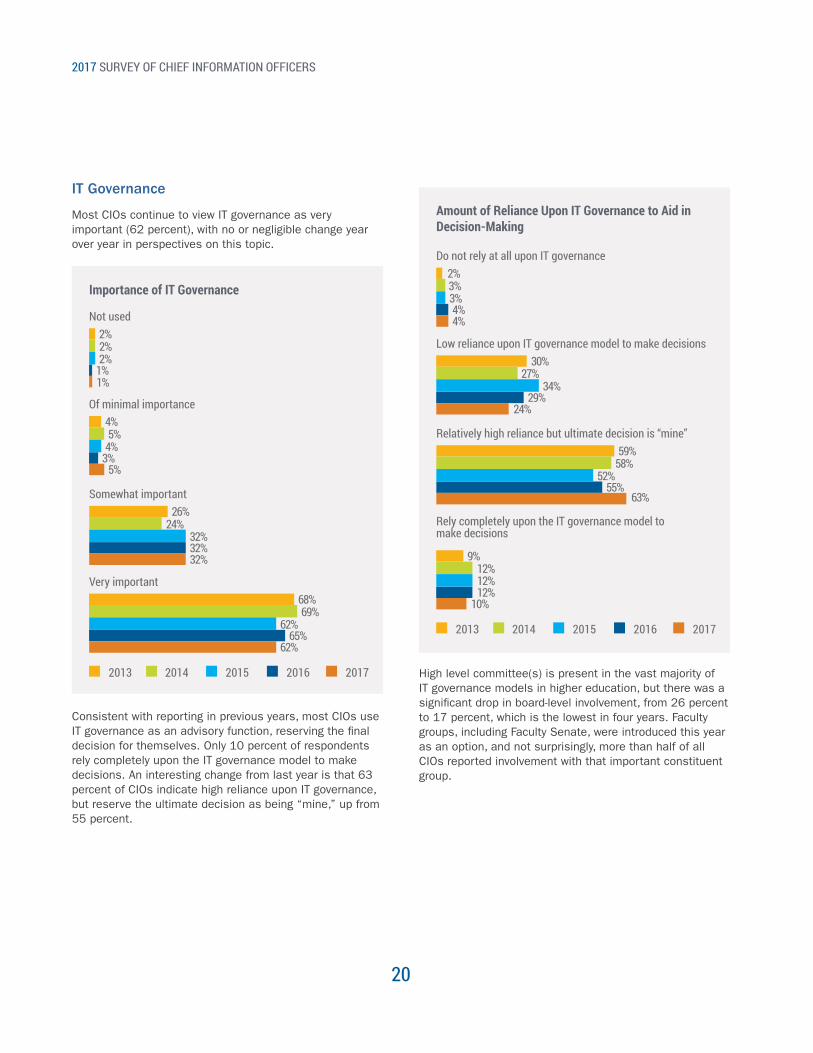
Most CIOs continue to view IT governance as very important (62 percent), with no or negligible change year over year in perspectives on this topic.
Importance of IT Governance
Amount of Reliance Upon IT Governance to Aid in Decision-Making
2013 2014 2015 2016 2017
2013 2014 2015 2016 2017
Not used
Do not rely at all upon IT governance
2%
2%
1%
4%
1%
4%
2%
3%
2%
3%
Somewhat important
Relatively high reliance but ultimate decision is “mine”
26%
59%
32%
55%
32%
63%
24%
58%
32%
52%
Of minimal importance
Low reliance upon IT governance model to make decisions
4%
30%
3%
29%
5%
24%
5%
27%
4%
34%
Very important
Rely completely upon the IT governance model to make decisions
68%
9%
65%
12%
62%
10%69%
12%
62%
12%
Consistent with reporting in previous years, most CIOs use IT governance as an advisory function, reserving the final decision for themselves. Only 10 percent of respondents rely completely upon the IT governance model to make decisions. An interesting change from last year is that 63 percent of CIOs indicate high reliance upon IT governance, but reserve the ultimate decision as being “mine,” up from 55 percent.
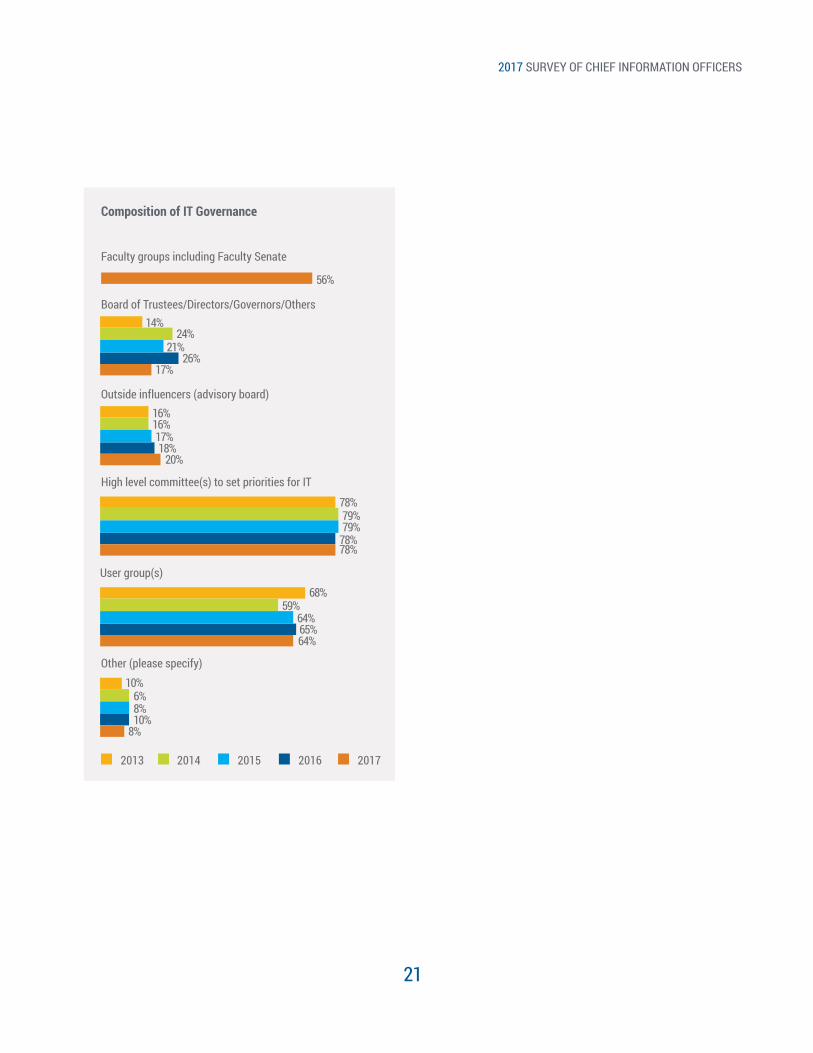
High level committee(s) is present in the vast majority of IT governance models in higher education, but there was a significant drop in board-level involvement, from 26 percent to 17 percent, which is the lowest in four years. Faculty groups, including Faculty Senate, were introduced this year as an option, and not surprisingly, more than half of all CIOs reported involvement with that important constituent group.
2017 SURVEY OF CHIEF INFORMATION OFFICERS
21
Composition of IT Governance
2013 2014 2015 2016 2017
Faculty groups including Faculty Senate
56%
Outside influencers (advisory board)16%
18%20%
16%17%
Board of Trustees/Directors/Governors/Others14%
26%17%
24%21%
High level committee(s) to set priorities for IT
78%
68%
78%
65%
78%
64%
79%
59%
79%
64%
User group(s)
Other (please specify)10%
10%8%
6%8%
2017 SURVEY OF CHIEF INFORMATION OFFICERS
22
Potential Benefits of the Consumerization Movement
2013 2014 2015 2016 2017
Exploration of new technologies
65%72%
More competitive positioning for your institution50%
32%33%
50%44%
Less need for community labs40%
38%26%
41%39%
Less IT staff needed
8%
80%
10%
69%
13%
73%
9%
80%
11%
77%
Freedom of choice
Financial Savings
None
36%
5%
38%
6%
32%
8%
34%
6%
31%
7%
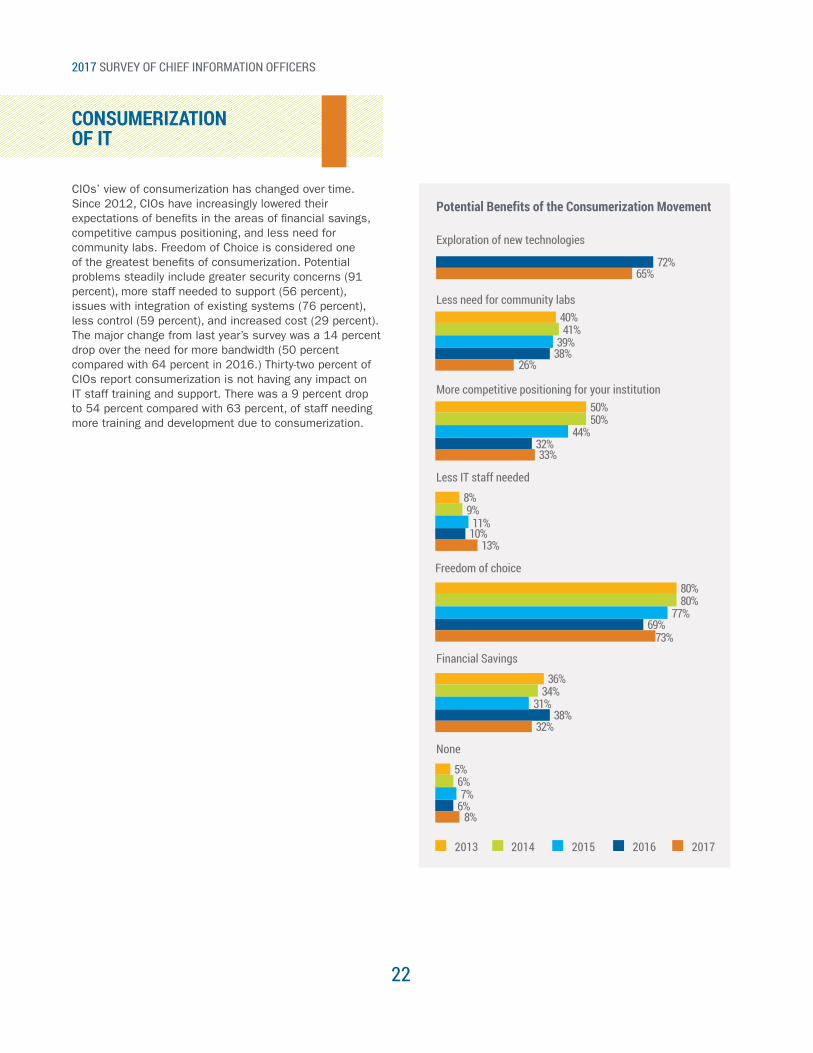
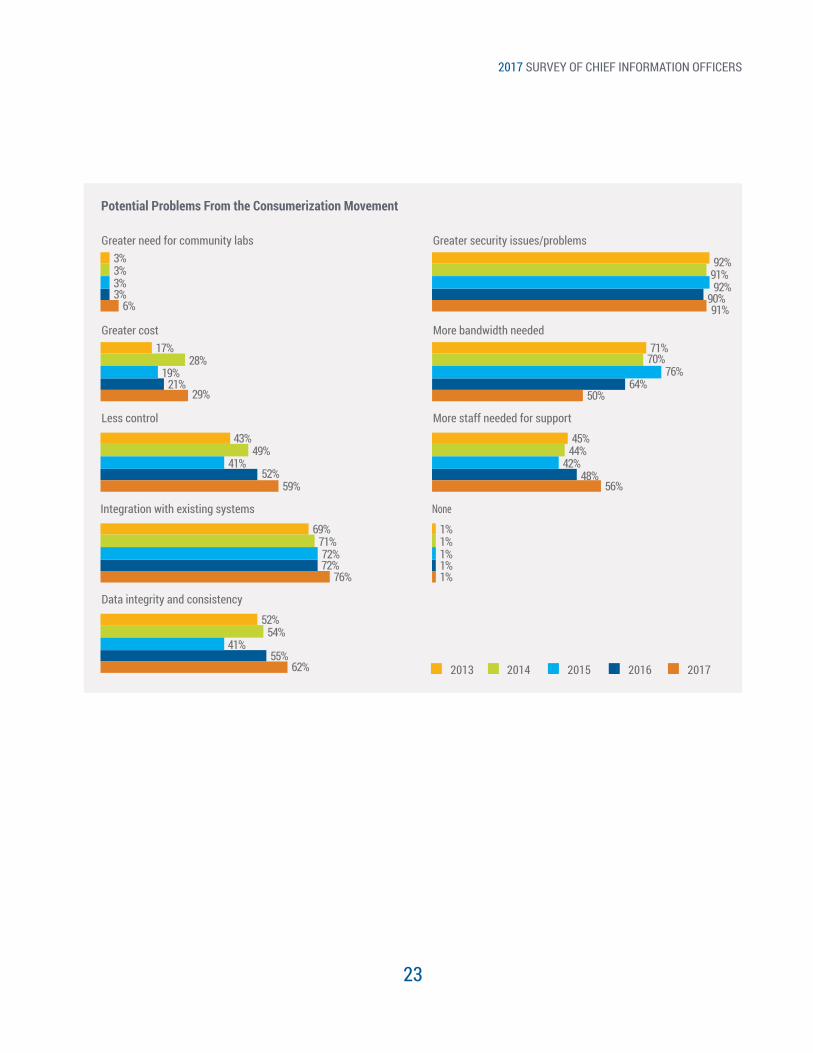
CIOs’ view of consumerization has changed over time. Since 2012, CIOs have increasingly lowered their expectations of benefits in the areas of financial savings, competitive campus positioning, and less need for community labs. Freedom of Choice is considered one of the greatest benefits of consumerization. Potential problems steadily include greater security concerns (91 percent), more staff needed to support (56 percent), issues with integration of existing systems (76 percent), less control (59 percent), and increased cost (29 percent). The major change from last year’s survey was a 14 percent drop over the need for more bandwidth (50 percent compared with 64 percent in 2016.) Thirty-two percent of CIOs report consumerization is not having any impact on IT staff training and support. There was a 9 percent drop to 54 percent compared with 63 percent, of staff needing more training and development due to consumerization.
CONSUMERIZATIONOF IT
2017 SURVEY OF CHIEF INFORMATION OFFICERS
23
Potential Problems From the Consumerization Movement
2013 2014 2015 2016 2017
Greater cost More bandwidth needed17%
21% 64%
71%
29% 50%
70%76%
28%19%
Greater need for community labs Greater security issues/problems3% 92%
3% 90%6% 91%
3% 91%3% 92%
Less control More staff needed for support
43% 45%
69%
52% 48%
72%
59% 56%
1%1%1%1%1%76%
49% 44%
71%
41% 42%
72%
Integration with existing systems None
Data integrity and consistency
52%
55%62%
54%41%
2017 SURVEY OF CHIEF INFORMATION OFFICERS
24
ADMINISTRATIVECOMPUTING
The survey results for 2017 continue to show a significant investment in vendor-based Enterprise Resource Planning (ERP) systems for core student, financial, payroll, human resources, advancement, and grants management services within higher education. Upgrades of these systems increased significantly this past year, most likely due to vendor-provided release schedules that offer new functionality, new features, and provide critical support for security patches and vulnerabilities.
Business-process engineering continued to grow in importance from last year, with heavy involvement by IT. Interestingly, the results for this year also point out an upward trend in both best-of-breed ERP solutions and business process re-engineering. Our assumption is that best-of-breed is desired because it provides far better capabilities and functionality for specific areas paralleling the initiative to improve efficiencies and processes.
While there is much ongoing discussion within higher education in moving administrative computing systems into either a hosted Infrastructure as a Service, (IaaS), Platform as a Service, (PaaS), or even to a Software as a Service (SaaS) model, many ERP and core administrative systems remain on premise, as reflected in this year’s survey results. For higher education, the move to the cloud for ERP systems has been slower than some anticipated based on past survey results. Most cloud offerings from vendors of administrative applications are improving as technology advances and experience in the cloud with academic and social networking activities continue to grow.
However, security concerns persist in having administrative data hosted away from campus. Some of these concerns include the risk of data loss, breaches as well as cost and integration of data to other systems and services. These concerns will most likely lessen as more institutions are successful in moving to cloud ERP solutions over the coming years.
Enterprise Resource Planning (ERP)
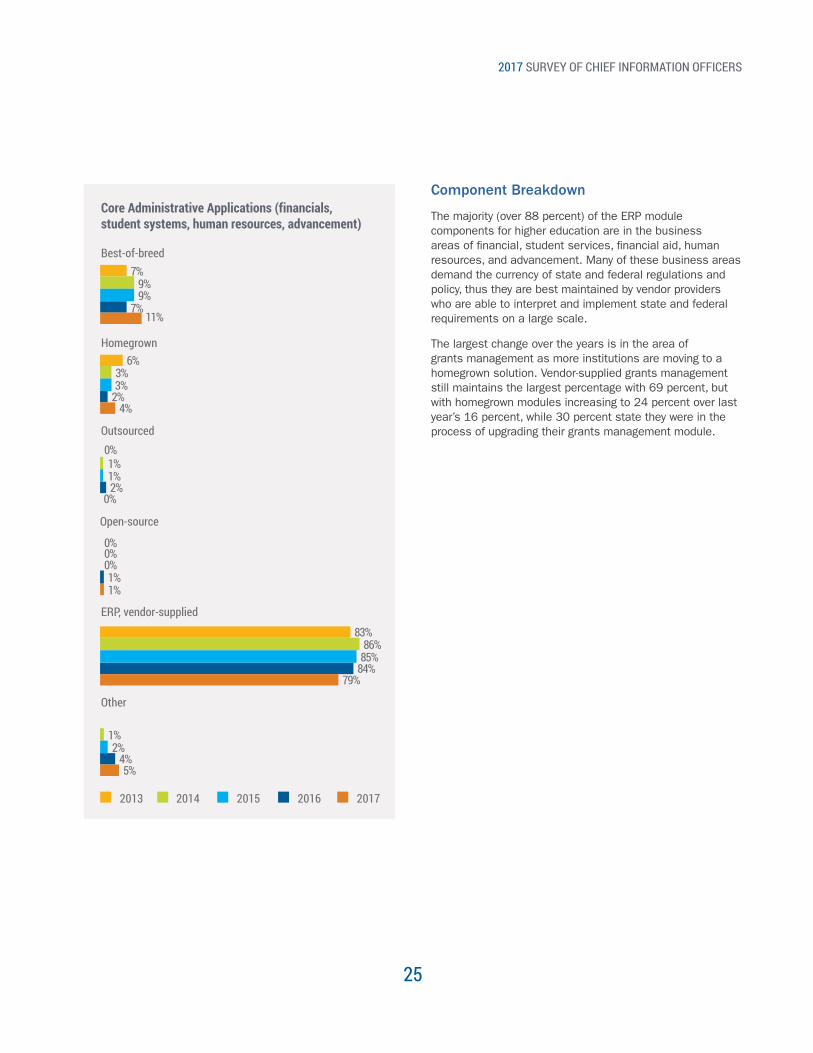
Vendor-supplied ERP systems are still the major players on campus (79 percent), but have lost some ground down 5 percent from 2016 survey results. A continuing, slow decline in overall ERP systems make up the core administrative systems in higher education, down 7 percent from 2014. Best-of-breed solutions increased to 11 percent in 2017, a 4 percent increase from 2016. Overall that means that vendor applications dominate but institutions are more likely to pick and choose (best of breed) than in previous years.
Again this year, ERP systems are primarily supported and maintained on premise. While there was a small increase in outsourced ERP solutions last year, we did not see any significant response (0 percent) in outsourced solutions for 2017 and only 1 percent use open-source solutions. Although cloud solutions for administrative applications continue to be heavily discussed in higher education, few institutions have moved or are in the process of moving these systems into the cloud as reflected in this year’s survey. This may be due to overall cost of changing from current applications, to many institutions waiting to see how others are doing in their move to cloud-based administrative applications, and real numbers on the actual cost of moving to the cloud.
2017 SURVEY OF CHIEF INFORMATION OFFICERS
25
Core Administrative Applications (financials, student systems, human resources, advancement)
2013 2014 2015 2016 2017
Homegrown
7%
7%11%
9%9%
Best-of-breed
Outsourced
6%
0%
0%
2%
2%
0%
4%
0%
1%
3%
1%
0%
3%
1%
1%
Open-source
ERP, vendor-supplied
83%
84%79%
86%85%
Other
4%5%
1%2%
Component Breakdown
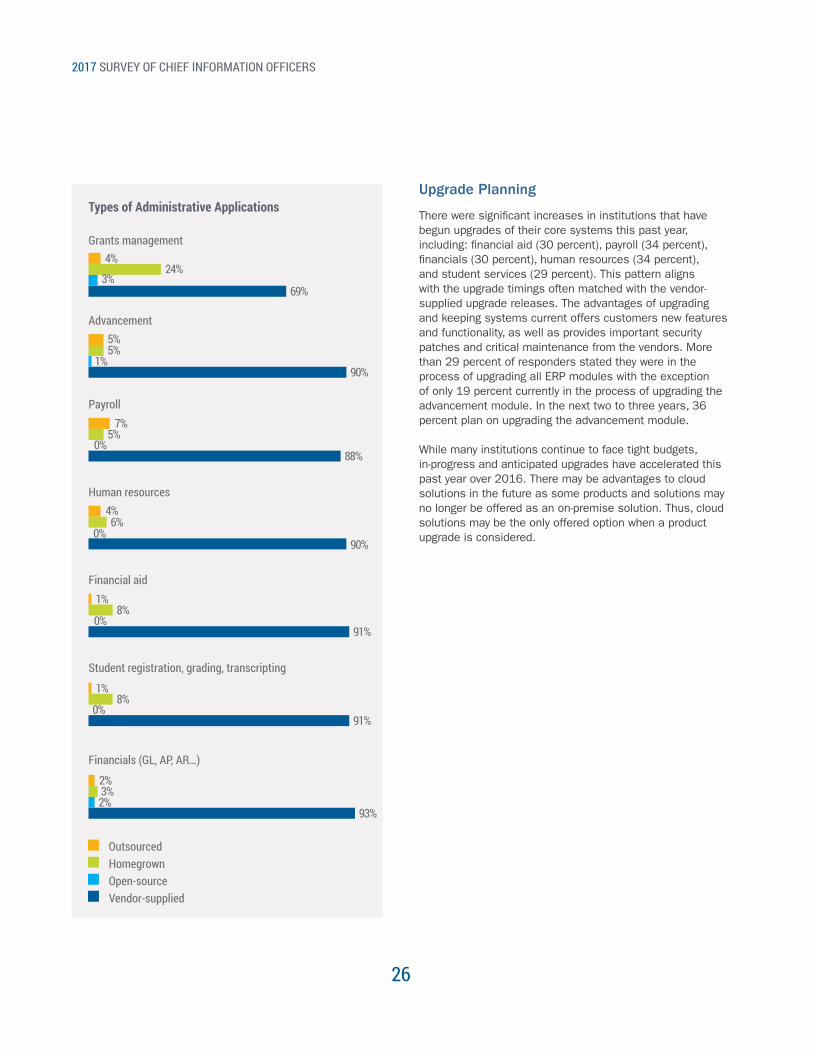
The majority (over 88 percent) of the ERP module components for higher education are in the business areas of financial, student services, financial aid, human resources, and advancement. Many of these business areas demand the currency of state and federal regulations and policy, thus they are best maintained by vendor providers who are able to interpret and implement state and federal requirements on a large scale.
The largest change over the years is in the area of grants management as more institutions are moving to a homegrown solution. Vendor-supplied grants management still maintains the largest percentage with 69 percent, but with homegrown modules increasing to 24 percent over last year’s 16 percent, while 30 percent state they were in the process of upgrading their grants management module.
2017 SURVEY OF CHIEF INFORMATION OFFICERS
26
Types of Administrative Applications
Grants management4%
69%
90%
88%
90%
91%
93%
91%
24%3%
1%
0%
0%
0%
0%
2%
5%
7%
4%
1%
1%
2%
5%
5%
6%
8%
8%
3%
Advancement
Payroll
Human resources
Financial aid
Student registration, grading, transcripting
Financials (GL, AP, AR…)
OutsourcedHomegrownOpen-sourceVendor-supplied
Upgrade Planning
There were significant increases in institutions that have begun upgrades of their core systems this past year, including: financial aid (30 percent), payroll (34 percent), financials (30 percent), human resources (34 percent), and student services (29 percent). This pattern aligns with the upgrade timings often matched with the vendor-supplied upgrade releases. The advantages of upgrading and keeping systems current offers customers new features and functionality, as well as provides important security patches and critical maintenance from the vendors. More than 29 percent of responders stated they were in the process of upgrading all ERP modules with the exception of only 19 percent currently in the process of upgrading the advancement module. In the next two to three years, 36 percent plan on upgrading the advancement module.
While many institutions continue to face tight budgets, in-progress and anticipated upgrades have accelerated this past year over 2016. There may be advantages to cloud solutions in the future as some products and solutions may no longer be offered as an on-premise solution. Thus, cloud solutions may be the only offered option when a product upgrade is considered.
2017 SURVEY OF CHIEF INFORMATION OFFICERS
27
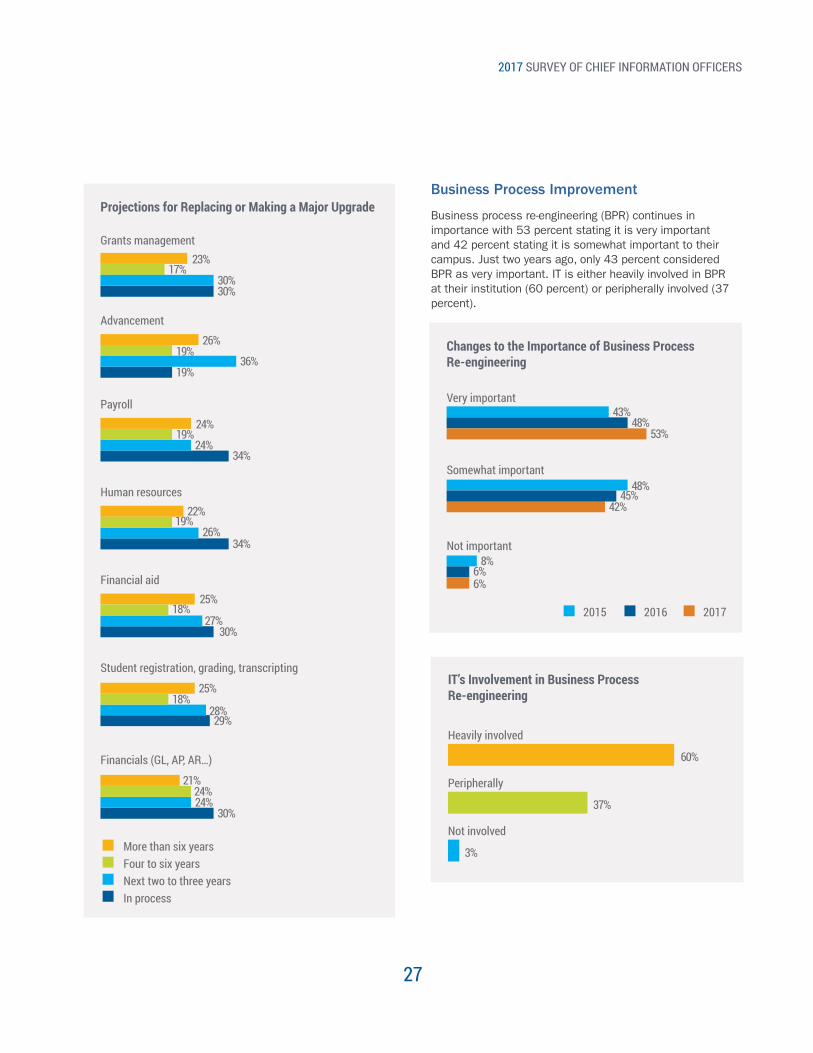
Projections for Replacing or Making a Major Upgrade
Changes to the Importance of Business Process Re-engineering
IT’s Involvement in Business Process Re-engineering
Grants management
Very important
Heavily involved
Peripherally
Not involved
23%
43%
60%
30%
19%
34%
34%
30%
29%
30%
17%
48%
37%
30%
53%
3%
36%
42%
24%
6%
26%
27%
28%
24%
26%
48%
24%
8%
22%
25%
25%
21%
19%
45%
19%
6%
19%
18%
18%
24%
Advancement
Somewhat important
Payroll
Not important
Human resources
Financial aid
Student registration, grading, transcripting
Financials (GL, AP, AR…)
More than six yearsFour to six yearsNext two to three yearsIn process
Business Process Improvement
Business process re-engineering (BPR) continues in importance with 53 percent stating it is very important and 42 percent stating it is somewhat important to their campus. Just two years ago, only 43 percent considered BPR as very important. IT is either heavily involved in BPR at their institution (60 percent) or peripherally involved (37 percent).
2015 2016 2017
2017 SURVEY OF CHIEF INFORMATION OFFICERS
28
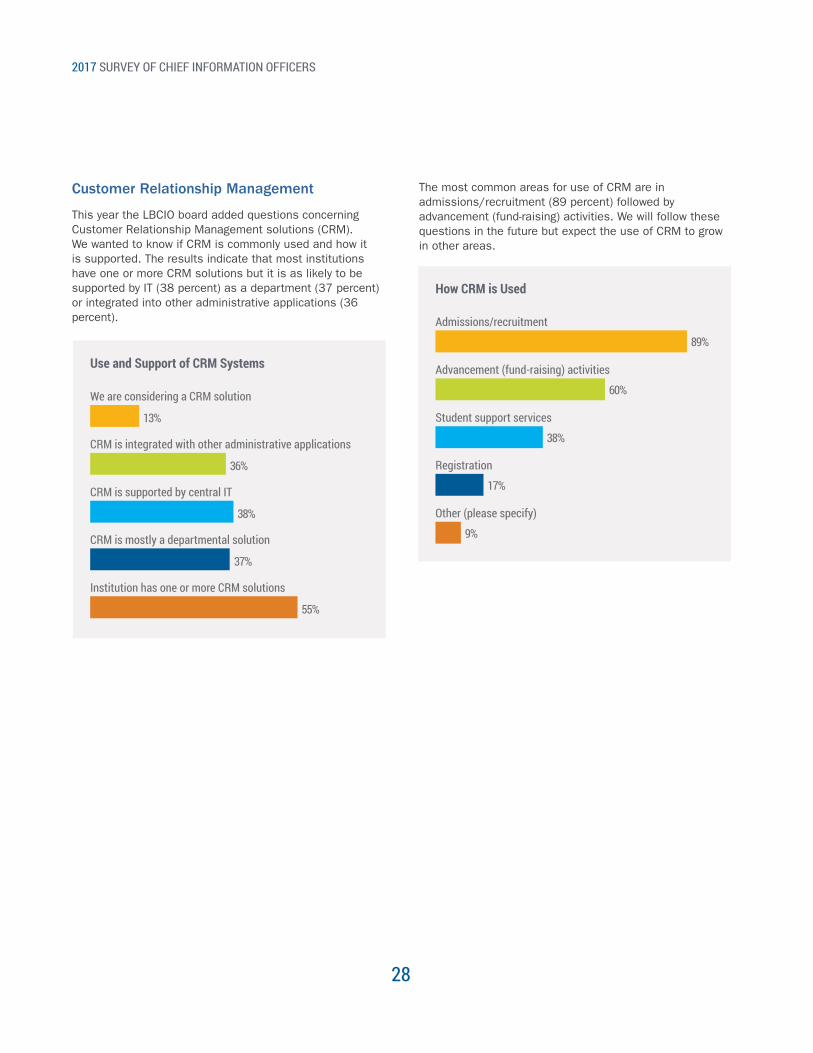
Customer Relationship Management
This year the LBCIO board added questions concerning Customer Relationship Management solutions (CRM). We wanted to know if CRM is commonly used and how it is supported. The results indicate that most institutions have one or more CRM solutions but it is as likely to be supported by IT (38 percent) as a department (37 percent) or integrated into other administrative applications (36 percent).
Use and Support of CRM Systems
We are considering a CRM solution
CRM is integrated with other administrative applications
CRM is supported by central IT
13%
36%
38%
CRM is mostly a departmental solution
Institution has one or more CRM solutions
37%
55%
How CRM is Used
Admissions/recruitment
Advancement (fund-raising) activities
Student support services
89%
60%
38%
Registration
Other (please specify)
17%
9%
The most common areas for use of CRM are in admissions/recruitment (89 percent) followed by advancement (fund-raising) activities. We will follow these questions in the future but expect the use of CRM to grow in other areas.
2017 SURVEY OF CHIEF INFORMATION OFFICERS
29
ACADEMICCOMPUTING
Technology is fundamental to teaching and learning and IT organizations are increasingly challenged by the changes and advances in academic resources. With so many initiatives like BYOD (Bring Your Own Device), online learning, and remote noncampus-based student populations, CIOs have been predicting a major reduction in computer labs or community labs, but this has not transpired. As financial pressures continue to mount for most institutions, many seek ways to cut costs while improving revenue from increases in enrollments and retention, and many are looking to data analytics and business intelligence for accurate and meaningful data to make informed decisions. This year’s survey confirmed a number of trends, as well as provided a few surprises regarding teaching and learning, including the following:
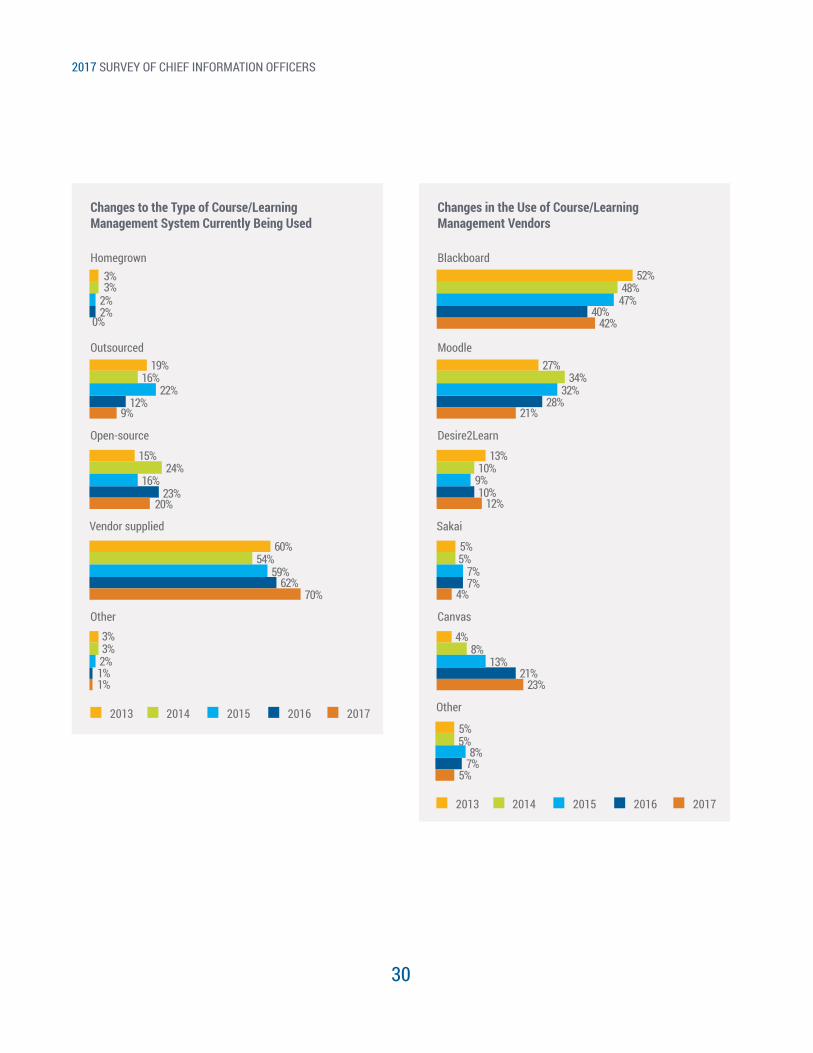
• Instability in vendor dominance in the CMS/LMS market continues, but 70 percent of the institutions reported a vendor-supplied option.
• A big surprise was the further reduction in the CMS/LMS being outsourced, down from 12 percent last year to 9 percent this year. Before 2016, outsourcing of the CMS/LMS maintained an upward trend since the 2012 survey.
• Institutions selecting open-source products decreased this year by 3 percent from last year. The selection of open-source products has fluctuated over the last six years with no real trend.
• The use of Blackboard as a standard has increased by 2 percent in 2017 from last year after a declining trend in past years since the 2013 survey.
• The results show that Desire2Learn is used more by two-year institutions, while four-year institutions preferred Moodle.
• The use of Canvas continued its upward trend as a standard, increasing by 2 percent from last year.
• Over the last six years, there has been little change in the length of time institutions have been using their current CMS/LMS solutions, with 67 percent using the same system for more than five years. Thirty-one percent of the institutions are considering replacing their current systems over the next three years or more.
• Central IT continues to provide the primary support for the CMS/LMS with 53 percent, but that number is down by 2 percent from last year and down from 63 percent in 2012.
• The Office of the Provost/Chief Academic Officer continues to increase as the primary reporting authority for instructional design, course design, and online learning management (40 percent), and separate units for online education have increased to 14 percent this year. Reporting to the Office of the CIO has decreased to 22 percent after having remained steady at 28 percent for the last two years.
• Predictions that community labs would decrease seem to fluctuate every year with a decrease from 21 percent last year to 13 percent this year. Despite the increased pressure for space and a yearly maintenance cost upwards of $500 per device, support for community labs has remained consistent over the last six years.
• Institutions that maintained the same support and plans for community labs for the past five years increased to 43 percent, which is a 10 percent jump from last year. This may be attributed to the decision most institutions have made to continue providing hardware and software for students to use in community labs. Computer hardware and the required software may not be affordable for some students.
Types of Institutional Standard CMS Systems
The majority of institutions (70 percent) continue to use a vendor-supplied CMS/LMS as the standard. Surprisingly, the number of institutions using open-source solutions de-creased from 23 percent in 2016 to 20 percent in 2017. The trend in institutions using an outsourced solution was reversed. Outsourced CMS/LMS declined further from 12 percent in 2016 to 9 percent in 2017. This decline could be an anomaly or due to increased vendor costs or poor outsource experiences.
2017 SURVEY OF CHIEF INFORMATION OFFICERS
30
Changes to the Type of Course/Learning Management System Currently Being Used
2013 2014 2015 2016 2017
Outsourced19%
12%9%
16%22%
Homegrown3%
2%0%
3%2%
Open-source
15%
60%
23%
62%
20%
70%
24%
54%
16%
59%
Vendor supplied
Other3%
1%1%
3%2%
Changes in the Use of Course/Learning Management Vendors
Moodle27%
28%21%
34%32%
Blackboard52%
40%42%
48%47%
Desire2Learn
13%
5%
10%
7%
12%
4%
10%
5%
9%
7%
Sakai
Canvas
4%
21%23%
8%13%
2013 2014 2015 2016 2017
Other
5%
7%5%
5%8%
2017 SURVEY OF CHIEF INFORMATION OFFICERS
31
Longevity in the Use of Current Course Management System
2013 2014 2015 2016 2017
Less than two years9%
7%8%
8%8%
Implementing new CMS3%
4%5%
2%5%
Two to five years
28%
59%
24%
64%
21%
67%
27%
63%
27%
60%
More than five years
Blackboard is the overall Course/Learning Management system institutional standard at 42 percent, which is an increase of 2 percent from last year. Canvas adoption grew by 2 percent, and was most popular at research univer-sities. Desire2Learn was popular in two-year institutions, while Moodle was prominent in four-year institutions.
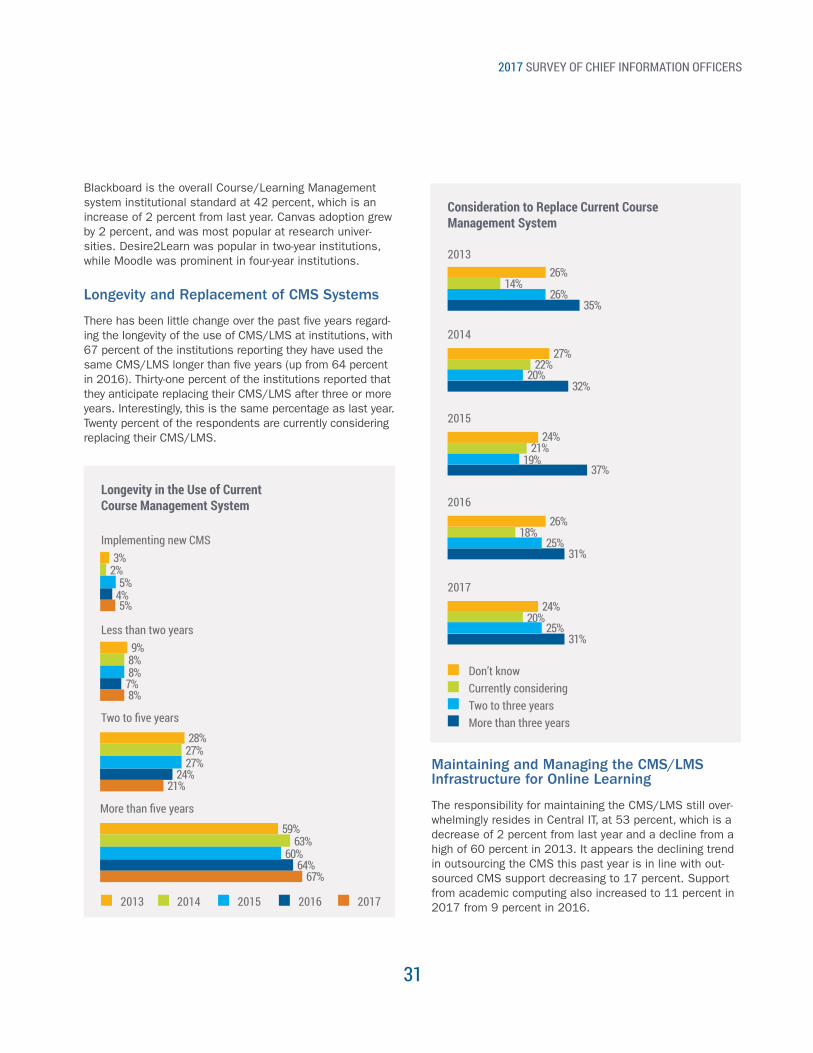
Longevity and Replacement of CMS Systems
There has been little change over the past five years regard-ing the longevity of the use of CMS/LMS at institutions, with 67 percent of the institutions reporting they have used the same CMS/LMS longer than five years (up from 64 percent in 2016). Thirty-one percent of the institutions reported that they anticipate replacing their CMS/LMS after three or more years. Interestingly, this is the same percentage as last year. Twenty percent of the respondents are currently considering replacing their CMS/LMS.
Consideration to Replace Current Course Management System
201326%
35%
32%
37%
31%
31%
26%14%
22%
21%
18%
20%
27%
24%
26%
24%
20%
19%
25%
25%
2014
2015
2016
2017
Don’t knowCurrently consideringTwo to three yearsMore than three years
Maintaining and Managing the CMS/LMS Infrastructure for Online Learning
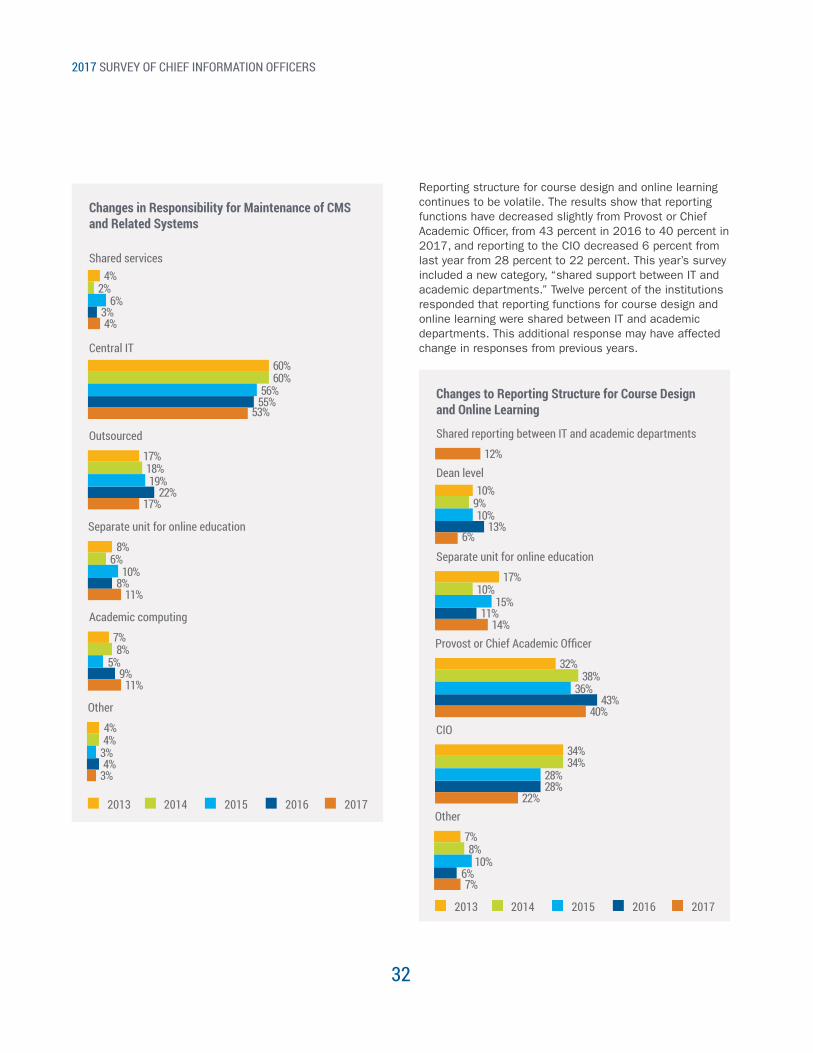
The responsibility for maintaining the CMS/LMS still over-whelmingly resides in Central IT, at 53 percent, which is a decrease of 2 percent from last year and a decline from a high of 60 percent in 2013. It appears the declining trend in outsourcing the CMS this past year is in line with out-sourced CMS support decreasing to 17 percent. Support from academic computing also increased to 11 percent in 2017 from 9 percent in 2016.
2017 SURVEY OF CHIEF INFORMATION OFFICERS
32
Reporting structure for course design and online learning continues to be volatile. The results show that reporting functions have decreased slightly from Provost or Chief Academic Officer, from 43 percent in 2016 to 40 percent in 2017, and reporting to the CIO decreased 6 percent from last year from 28 percent to 22 percent. This year’s survey included a new category, “shared support between IT and academic departments.” Twelve percent of the institutions responded that reporting functions for course design and online learning were shared between IT and academic departments. This additional response may have affected change in responses from previous years.
Changes in Responsibility for Maintenance of CMS and Related Systems
Changes to Reporting Structure for Course Design and Online Learning
Central IT
Dean level
60%
10%
55%
13%
53%
6%
60%
9%
56%
10%
Shared services
Shared reporting between IT and academic departments
4%
3%4%
12%
2%6%
Outsourced
Separate unit for online education
17%
17%
8%
32%
22%
11%
8%
43%
17%
14%
11%
40%
18%
10%
6%
38%
19%
15%
10%
36%
Separate unit for online education
Provost or Chief Academic Officer
Academic computing
CIO
7%
34%
9%
28%
11%
22%
8%
34%
5%
28%
2013 2014 2015 2016 2017
2013 2014 2015 2016 2017
Other
Other
4%
7%
4%
6%
3%
7%
4%
8%
3%
10%
2017 SURVEY OF CHIEF INFORMATION OFFICERS
33
Changes to Community Lab Support and Plans
We no longer support community labs3%
2%6%
3%5%
We are decreasing the number of community labs20%
36%
21%
29%
13%
27%
24%
29%
16%
28%
We are not increasing the numbers of labs but increasing the availability of hot sites for people to connect via LAN or Wi-Fi
We have about the same as we had 5 years ago 29%
33%43%
32%34%
2013 2014 2015 2016 2017
We continue to increase the numbers of labs available for general use
15%
15%11%
12%18%
Support for Community Labs
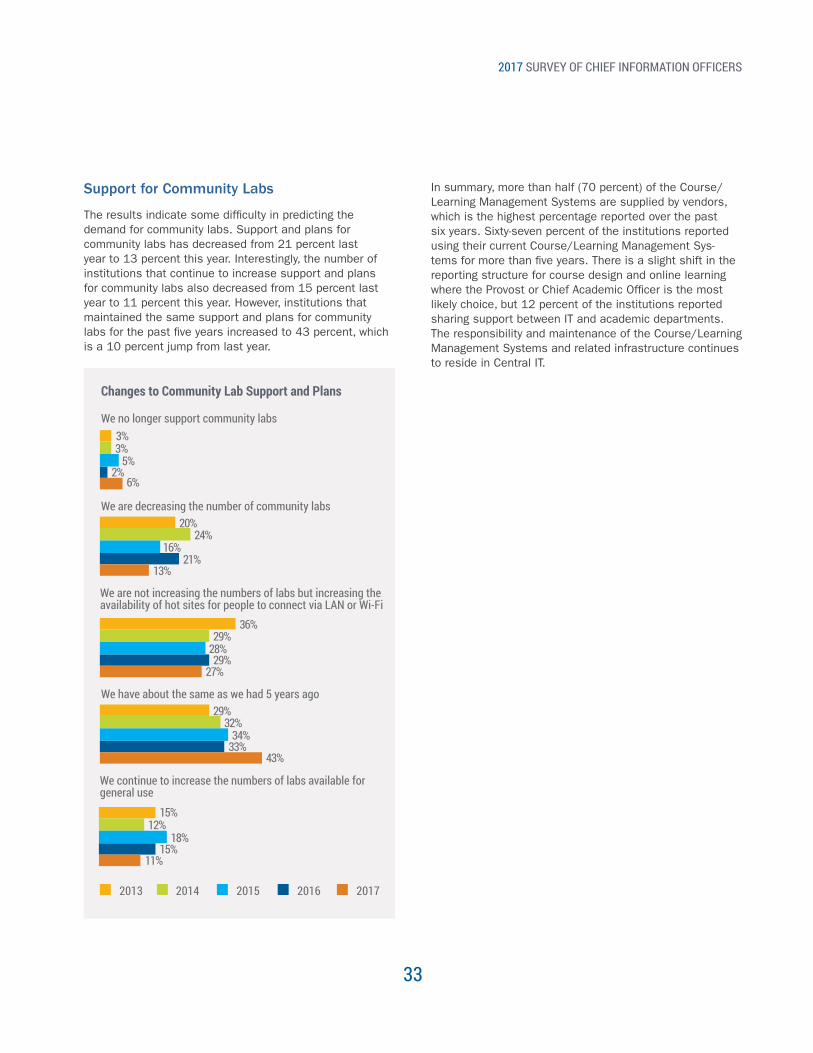
The results indicate some difficulty in predicting the demand for community labs. Support and plans for community labs has decreased from 21 percent last year to 13 percent this year. Interestingly, the number of institutions that continue to increase support and plans for community labs also decreased from 15 percent last year to 11 percent this year. However, institutions that maintained the same support and plans for community labs for the past five years increased to 43 percent, which is a 10 percent jump from last year.
In summary, more than half (70 percent) of the Course/Learning Management Systems are supplied by vendors, which is the highest percentage reported over the past six years. Sixty-seven percent of the institutions reported using their current Course/Learning Management Sys-tems for more than five years. There is a slight shift in the reporting structure for course design and online learning where the Provost or Chief Academic Officer is the most likely choice, but 12 percent of the institutions reported sharing support between IT and academic departments. The responsibility and maintenance of the Course/Learning Management Systems and related infrastructure continues to reside in Central IT.
2017 SURVEY OF CHIEF INFORMATION OFFICERS
34
INFRASTRUCTURE
Security
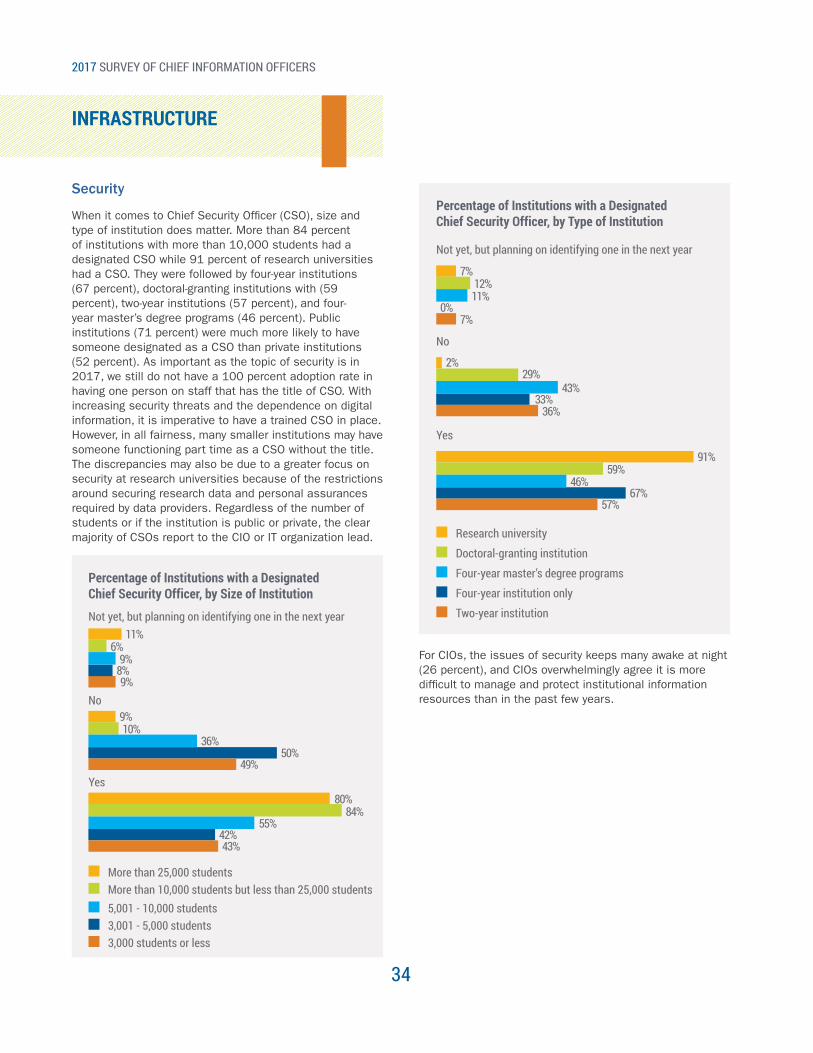
When it comes to Chief Security Officer (CSO), size and type of institution does matter. More than 84 percent of institutions with more than 10,000 students had a designated CSO while 91 percent of research universities had a CSO. They were followed by four-year institutions (67 percent), doctoral-granting institutions with (59 percent), two-year institutions (57 percent), and four-year master’s degree programs (46 percent). Public institutions (71 percent) were much more likely to have someone designated as a CSO than private institutions (52 percent). As important as the topic of security is in 2017, we still do not have a 100 percent adoption rate in having one person on staff that has the title of CSO. With increasing security threats and the dependence on digital information, it is imperative to have a trained CSO in place. However, in all fairness, many smaller institutions may have someone functioning part time as a CSO without the title. The discrepancies may also be due to a greater focus on security at research universities because of the restrictions around securing research data and personal assurances required by data providers. Regardless of the number of students or if the institution is public or private, the clear majority of CSOs report to the CIO or IT organization lead.
Percentage of Institutions with a Designated Chief Security Officer, by Type of Institution
Percentage of Institutions with a Designated Chief Security Officer, by Size of Institution
No
No
2%
33%36%
29%43%
9%
50%49%
10%36%
Not yet, but planning on identifying one in the next year
Not yet, but planning on identifying one in the next year
7%
0%7%
12%11%
11%
8%9%
6%9%
Yes
Yes
91%
67%57%
59%46%
80%
42%43%
84%55%
Research university
More than 25,000 students
Doctoral-granting institution
More than 10,000 students but less than 25,000 students
Four-year master’s degree programs
5,001 - 10,000 students
Four-year institution only
3,001 - 5,000 students
Two-year institution
3,000 students or less
For CIOs, the issues of security keeps many awake at night (26 percent), and CIOs overwhelmingly agree it is more difficult to manage and protect institutional information resources than in the past few years.
2017 SURVEY OF CHIEF INFORMATION OFFICERS
35
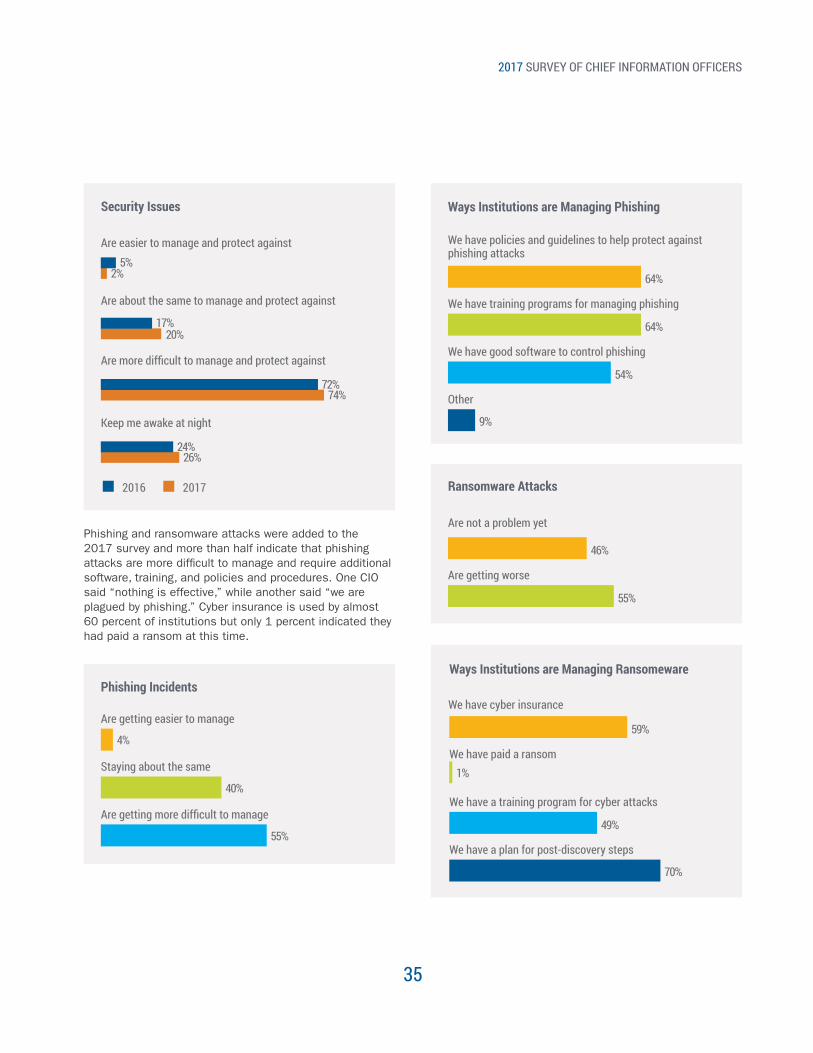
Security Issues
2016 2017
2%5%
Are easier to manage and protect against
20%17%
Are about the same to manage and protect against
74%72%
Are more difficult to manage and protect against
26%24%
Keep me awake at night
Phishing and ransomware attacks were added to the 2017 survey and more than half indicate that phishing attacks are more difficult to manage and require additional software, training, and policies and procedures. One CIO said “nothing is effective,” while another said “we are plagued by phishing.” Cyber insurance is used by almost 60 percent of institutions but only 1 percent indicated they had paid a ransom at this time.
Phishing Incidents
Ways Institutions are Managing Phishing
Ways Institutions are Managing Ransomeware
Ransomware Attacks
Are getting easier to manage
We have policies and guidelines to help protect against phishing attacks
We have cyber insurance
Are not a problem yet
Staying about the same
We have training programs for managing phishing
We have paid a ransom
Are getting worse
Are getting more difficult to manage
We have good software to control phishing
We have a training program for cyber attacks
4%
64%
59%
46%
40%
64%
1%
55%
55%
54%
49%
Other
We have a plan for post-discovery steps
9%
70%
2017 SURVEY OF CHIEF INFORMATION OFFICERS
36
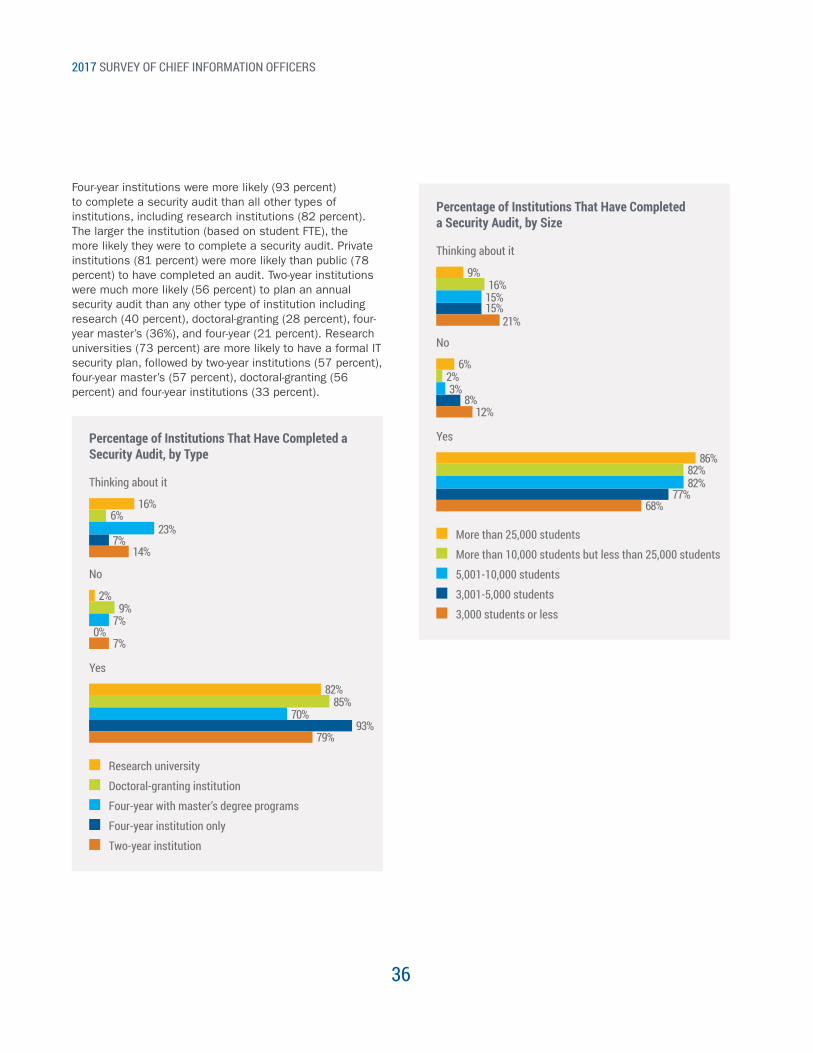
Percentage of Institutions That Have Completed a Security Audit, by Size
No
6%
8%12%
2%3%
Thinking about it
9%
15%21%
16%15%
Yes
86%
77%68%
82%82%
More than 25,000 students
More than 10,000 students but less than 25,000 students
5,001-10,000 students
3,001-5,000 students
3,000 students or less
Four-year institutions were more likely (93 percent) to complete a security audit than all other types of institutions, including research institutions (82 percent). The larger the institution (based on student FTE), the more likely they were to complete a security audit. Private institutions (81 percent) were more likely than public (78 percent) to have completed an audit. Two-year institutions were much more likely (56 percent) to plan an annual security audit than any other type of institution including research (40 percent), doctoral-granting (28 percent), four-year master’s (36%), and four-year (21 percent). Research universities (73 percent) are more likely to have a formal IT security plan, followed by two-year institutions (57 percent), four-year master’s (57 percent), doctoral-granting (56 percent) and four-year institutions (33 percent).
Percentage of Institutions That Have Completed a Security Audit, by Type
No
2%
0%7%
9%7%
Thinking about it
16%
7%14%
6%23%
Yes
82%
93%79%
85%70%
Research university
Doctoral-granting institution
Four-year with master’s degree programs
Four-year institution only
Two-year institution
2017 SURVEY OF CHIEF INFORMATION OFFICERS
37
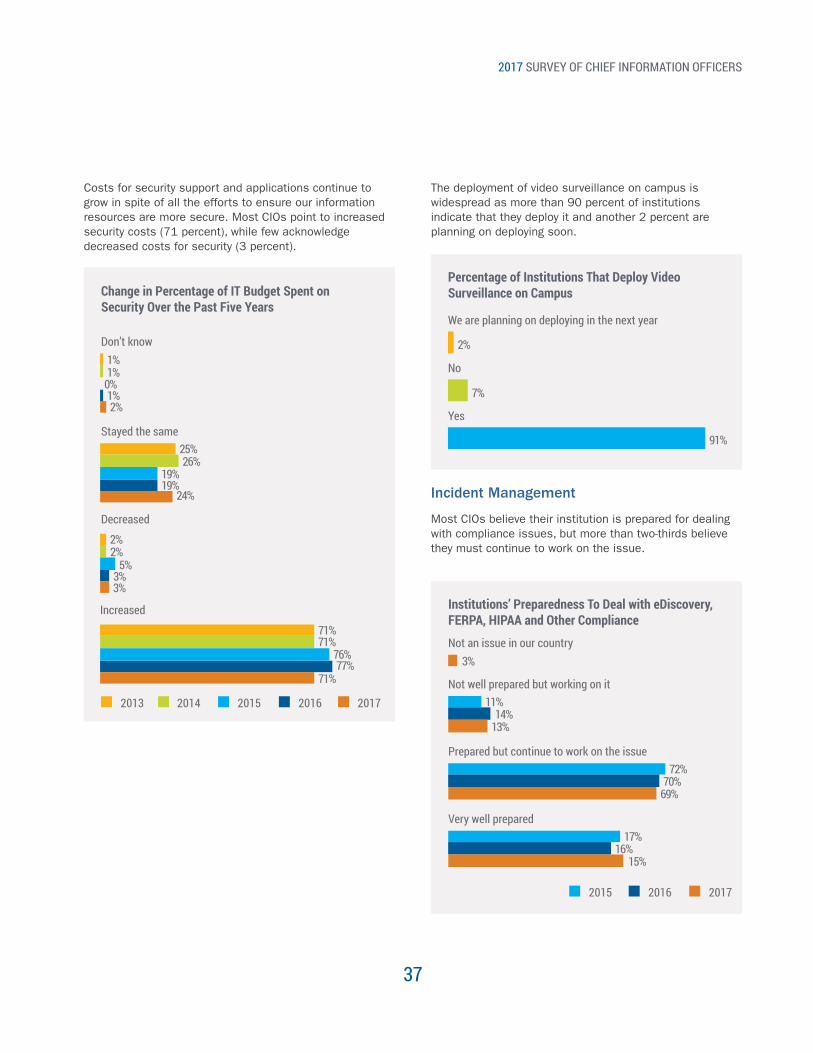
Costs for security support and applications continue to grow in spite of all the efforts to ensure our information resources are more secure. Most CIOs point to increased security costs (71 percent), while few acknowledge decreased costs for security (3 percent).
Change in Percentage of IT Budget Spent on Security Over the Past Five Years
2013 2014 2015 2016 2017
Stayed the same25%
19%24%
26%19%
Don’t know1%
1%2%
1%0%
Decreased
2%
71%
3%
77%
3%
71%
2%
71%
5%
76%
Increased
The deployment of video surveillance on campus is widespread as more than 90 percent of institutions indicate that they deploy it and another 2 percent are planning on deploying soon.
Percentage of Institutions That Deploy Video Surveillance on Campus
We are planning on deploying in the next year
No
Yes
2%
7%
91%
Incident Management
Most CIOs believe their institution is prepared for dealing with compliance issues, but more than two-thirds believe they must continue to work on the issue.
Institutions’ Preparedness To Deal with eDiscovery, FERPA, HIPAA and Other Compliance
2015 2016 2017
Not well prepared but working on it11%
14%13%
Not an issue in our country3%
Prepared but continue to work on the issue
Very well prepared
72%
17%
70%
16%
69%
15%

2017 SURVEY OF CHIEF INFORMATION OFFICERS
38
Plans to resume mission-critical operations in case of an incident are slightly down from previous years (75 percent versus 80 percent in 2016, and 81 percent in 2015 and 2014). For those institutions that have a plan, only 37 percent have tested the plan annually or more frequently.
Frequency of Testing Plan to Resume Mission-Critical Operations
2013 2014 2015 2016 2017
Tested less frequently than annually35%
34%27%
26%26%
Tested more frequently than annually
9%
7%7%
36%
30%30%
28%30%30%
13%
27%32%
35%29%
10%
Never been tested
Tested annually
Percentage of Institutions That Have a Plan to Resume Mission-Critical Operations in Case of a Crisis
2013 2014 2015 2016 2017
Not yet but in process19%
14%21%
15%12%
No
3%
78%
6%
80%
4%
75%
5%6%
81%81%
Yes
2017 SURVEY OF CHIEF INFORMATION OFFICERS
39
Percentage of Institutions With a Fully Redundant Data Center Where All Systems Could Be Up and Running in Less Than a Week
2013 2014 2015 2016 2017
Yes, partially40%
41%48%
35%33%
Planning stage
16%
8%7%
18%
30%27%
30%28%
18%
14%
26%24%25%
22%
12%
No
Yes, fully
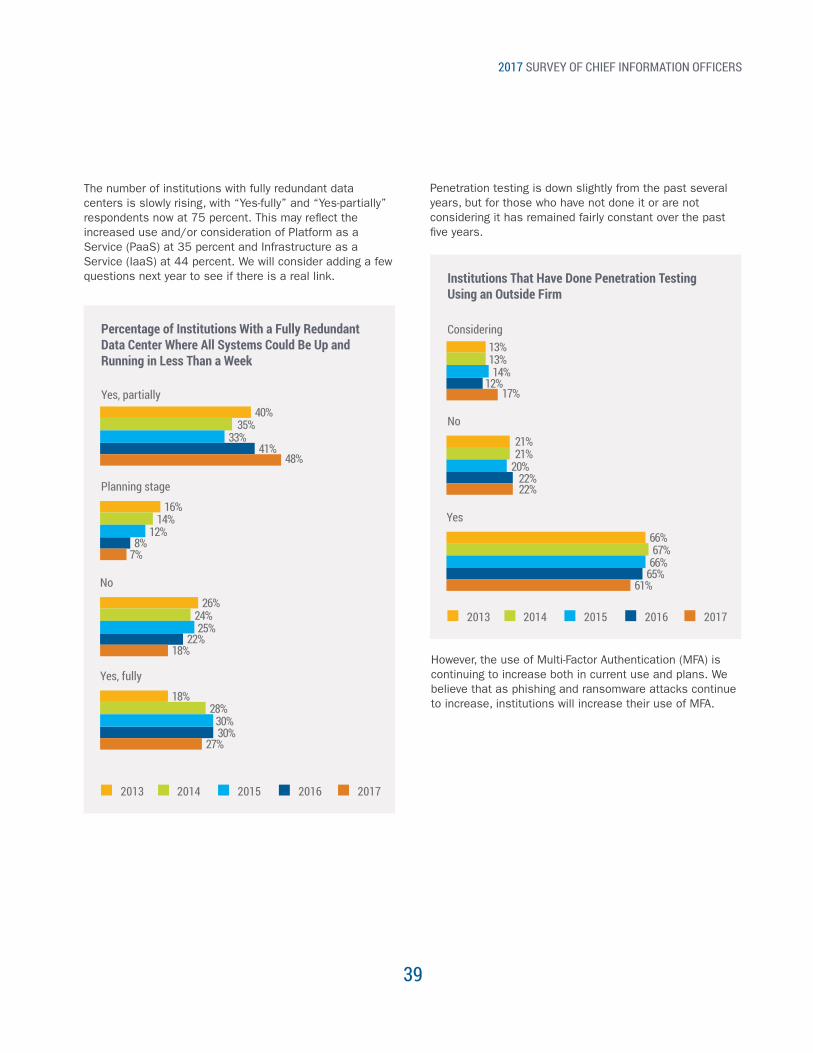
The number of institutions with fully redundant data centers is slowly rising, with “Yes-fully” and “Yes-partially” respondents now at 75 percent. This may reflect the increased use and/or consideration of Platform as a Service (PaaS) at 35 percent and Infrastructure as a Service (IaaS) at 44 percent. We will consider adding a few questions next year to see if there is a real link.
Penetration testing is down slightly from the past several years, but for those who have not done it or are not considering it has remained fairly constant over the past five years.
However, the use of Multi-Factor Authentication (MFA) is continuing to increase both in current use and plans. We believe that as phishing and ransomware attacks continue to increase, institutions will increase their use of MFA.
Institutions That Have Done Penetration Testing Using an Outside Firm
2013 2014 2015 2016 2017
Considering13%
12%17%
13%14%
No
21%
66%
22%
65%
22%
61%
21%20%
67%66%
Yes
2017 SURVEY OF CHIEF INFORMATION OFFICERS
40
Institutions That Have Implemented a Multi-Factor Authentication Solution
Percentage of Institutions That Utilize a Digital Repository Solution (DR)
How Document Management is Managed
How Institutions Describe Document Management
2013 2014 2015 2016 2017
2013 2014 2015 2016 2017
2014 2015 2016 2017
2014 2015 2016 2017
Considering
Considering
At the departmental level
Separate component on the IT stack
34%
25%
40%
17%
49%
52%
46%
20%
41%
51%41%
20%
50%
50%
43%
27%
53%
49%
No
No
At the institutional level
Integrative middleware for core academic and administrative systems
47%
35%
20%
40%
27%
48%
51%
48%
32%
35%
21%
44%
59%
49%
33%
36%
41%
39%
50%
50%
36%
41%
47%
51%
17%
42%
21%
32%
Yes
Yes
Other Observations
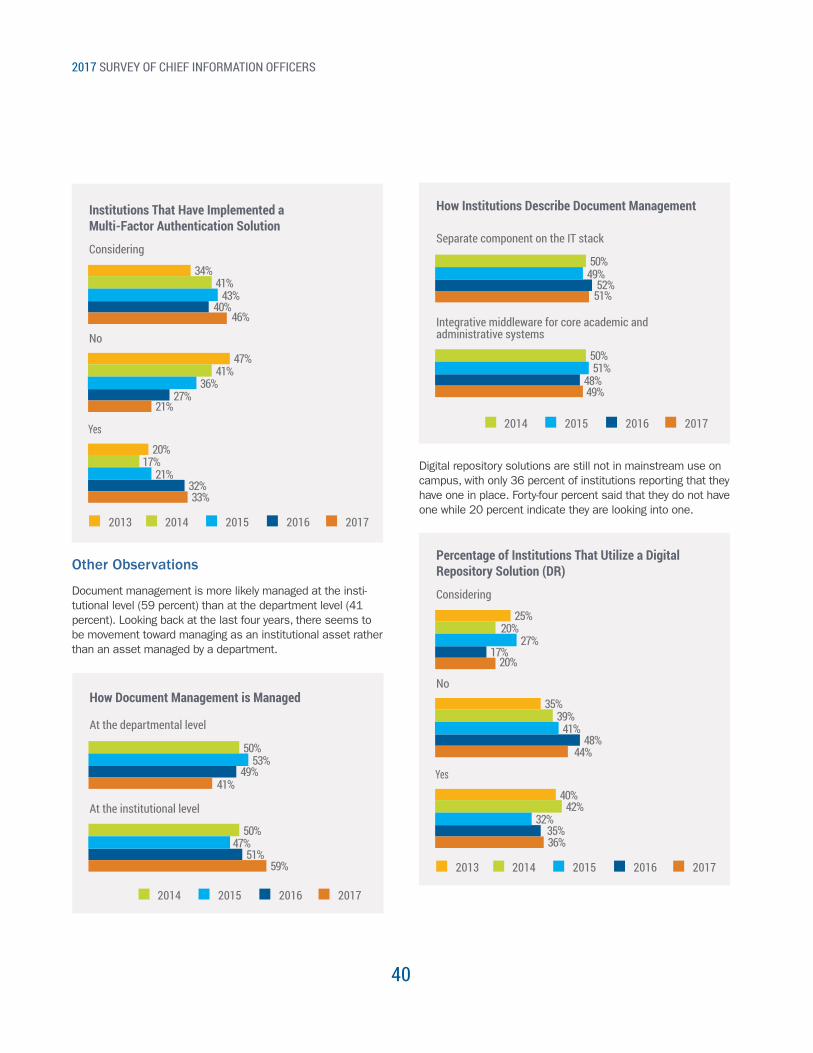
Document management is more likely managed at the insti-tutional level (59 percent) than at the department level (41 percent). Looking back at the last four years, there seems to be movement toward managing as an institutional asset rather than an asset managed by a department.
Digital repository solutions are still not in mainstream use on campus, with only 36 percent of institutions reporting that they have one in place. Forty-four percent said that they do not have one while 20 percent indicate they are looking into one.
2017 SURVEY OF CHIEF INFORMATION OFFICERS
41
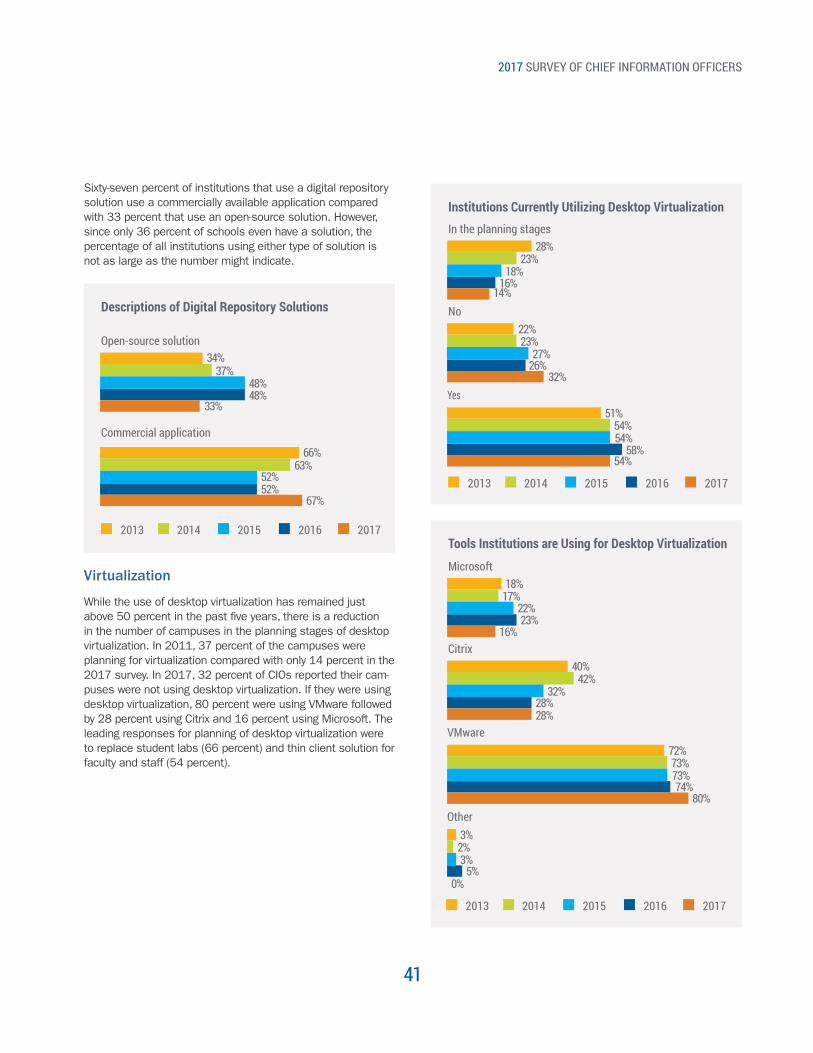
Sixty-seven percent of institutions that use a digital repository solution use a commercially available application compared with 33 percent that use an open-source solution. However, since only 36 percent of schools even have a solution, the percentage of all institutions using either type of solution is not as large as the number might indicate.
Descriptions of Digital Repository Solutions
2013 2014 2015 2016 2017
Open-source solution34%
48%33%
37%48%
Commercial application
66%
52%67%
63%52%
Virtualization
While the use of desktop virtualization has remained just above 50 percent in the past five years, there is a reduction in the number of campuses in the planning stages of desktop virtualization. In 2011, 37 percent of the campuses were planning for virtualization compared with only 14 percent in the 2017 survey. In 2017, 32 percent of CIOs reported their cam-puses were not using desktop virtualization. If they were using desktop virtualization, 80 percent were using VMware followed by 28 percent using Citrix and 16 percent using Microsoft. The leading responses for planning of desktop virtualization were to replace student labs (66 percent) and thin client solution for faculty and staff (54 percent).
Institutions Currently Utilizing Desktop Virtualization
Tools Institutions are Using for Desktop Virtualization
2013 2014 2015 2016 2017
2013 2014 2015 2016 2017
In the planning stages
Microsoft
28%
18%
16%
23%
14%
16%
23%
17%
18%
22%
No
Citrix
22%
40%
51%
72%
3%
26%
28%
58%
74%
5%
32%
28%
54%
80%
0%
23%
42%
27%
32%
54%
73%
2%
54%
73%
3%
Yes
VMware
Other
2017 SURVEY OF CHIEF INFORMATION OFFICERS
42
Descriptions of Plans for Desktop Virtualization
What Central IT Provides Selection Criteria and/or Standards for?
Used to support distance-education students
Desktop computers
32%
99%
29%
97%
36%
94%
33%
97%
32%
97%
Used as a security strategy
Servers
26%
91%
40%
86%
33%
87%
35%
88%
37%
85%Used as a “bring your own device” solution
Notebooks
47%
87%
32%
55%
47%
78%
43%
53%
39%
82%
43%
53%
47%
85%
35%
59%
47%
87%
41%
52%
Used mostly by students
Tablets
Used as a thin client solution for staff/faculty
Smart phones
58%
43%
57%
35%
54%
37%
56%
47%
59%
41%2013 2014 2015 2016 2017
2013 2014 2015 2016 2017
Used to replace student labs
66%
63%66%
66%65%
Standards
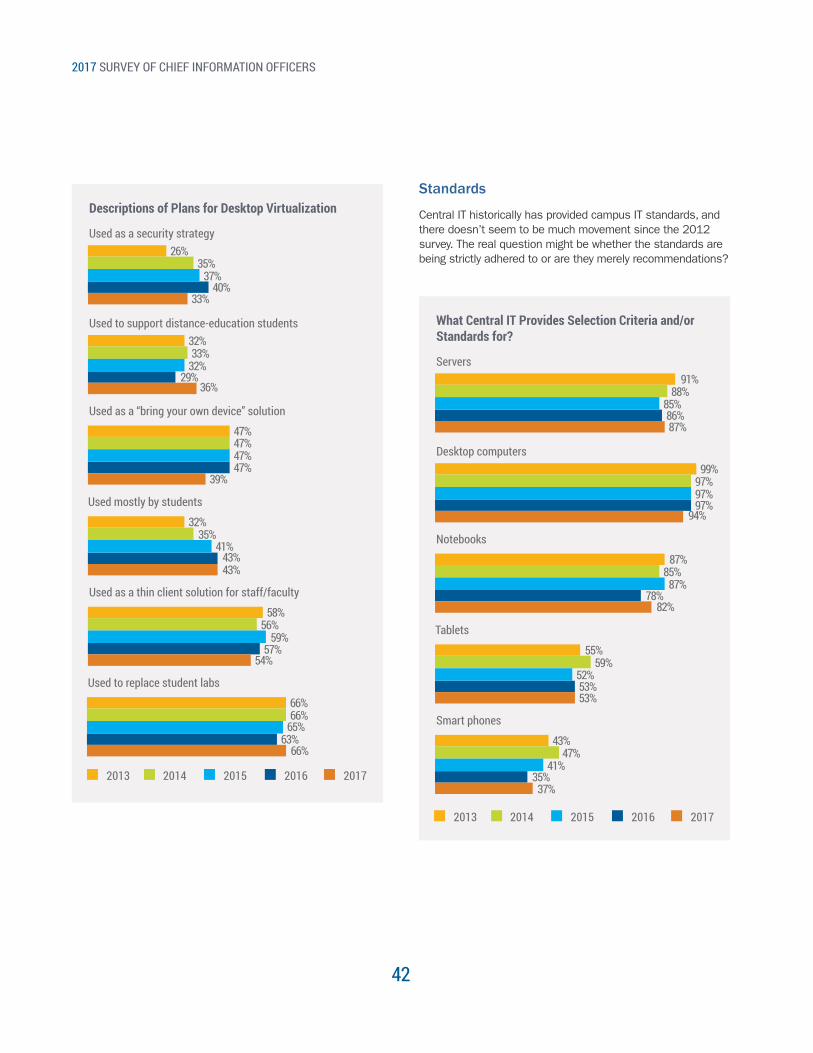
Central IT historically has provided campus IT standards, and there doesn’t seem to be much movement since the 2012 survey. The real question might be whether the standards are being strictly adhered to or are they merely recommendations?
2017 SURVEY OF CHIEF INFORMATION OFFICERS
43
CLOUD COMPUTING
The use of cloud computing in higher education has seen significant growth over the past several years, and institutions are using the cloud for a variety of activities. Results of the survey suggest adoption of cloud services are being initiated by vendors moving their next generation of applications only to the cloud, at times with no supported local hosting option. While this can lead to efficiencies for schools running Software as a Service, there are typically no options for customization, which can be challenging in some use-case scenarios. Cloud-based activities range from common back-office systems such as email to advanced analytic cloud-based platforms. The barriers, particularly around security that initially inhibited cloud adoption, have all but vanished on many fronts. In many cases, cloud providers have security staffing and technologies that many individual institutions would be unable to afford. IT departments and higher-education leadership have embraced the cloud as a means to scale, efficiency, and in some cases, cost-cutting.
Survey trends in cloud computing include increased confidence in moving many applications and services to the cloud. While email, LMS, social networking, and desktop tools are common in the cloud, campuses are increasingly moving the portal, data center, CRM, alumni, financial applications, and data storage to the cloud. Minimal reductions over last year are in the areas of library management, alumni applications, and research management and support. The only notable negative change over last year’s survey was in Course Management/LMS systems being hosted in the cloud, with a 5 percent reduction — 64 percent compared with 69 percent. It will be interesting to watch for any change in LMS cloud changes in next year’s survey.
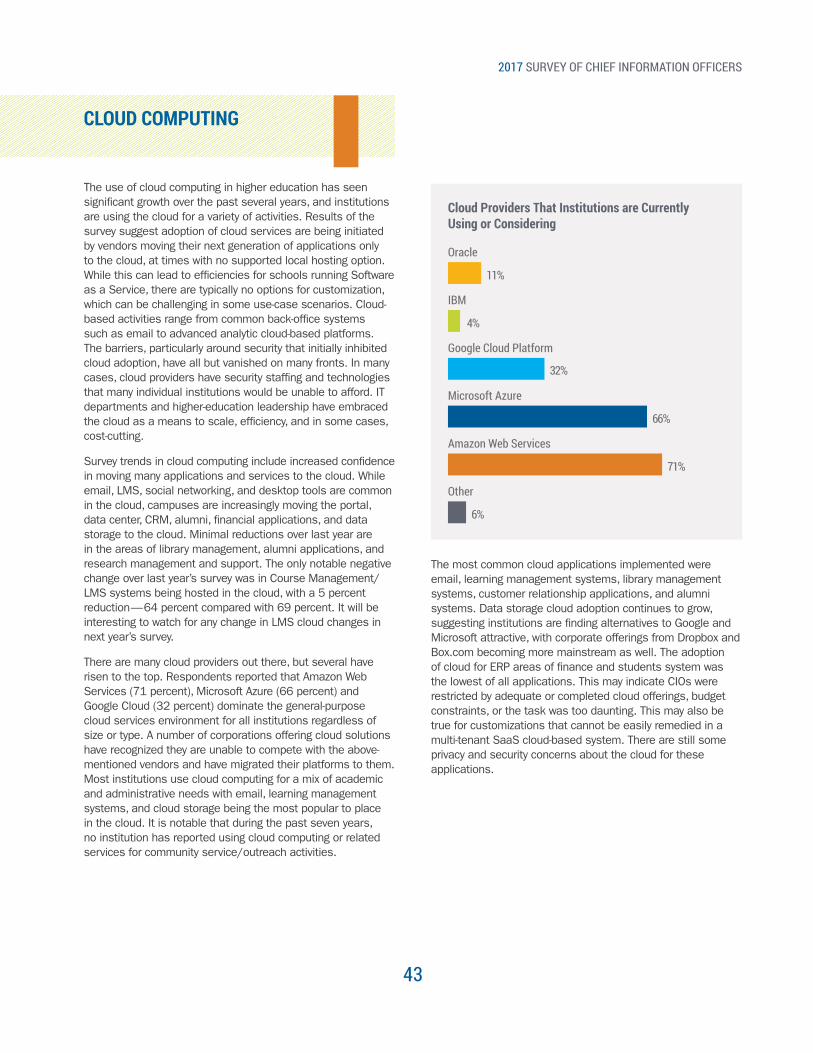
There are many cloud providers out there, but several have risen to the top. Respondents reported that Amazon Web Services (71 percent), Microsoft Azure (66 percent) and Google Cloud (32 percent) dominate the general-purpose cloud services environment for all institutions regardless of size or type. A number of corporations offering cloud solutions have recognized they are unable to compete with the above-mentioned vendors and have migrated their platforms to them. Most institutions use cloud computing for a mix of academic and administrative needs with email, learning management systems, and cloud storage being the most popular to place in the cloud. It is notable that during the past seven years, no institution has reported using cloud computing or related services for community service/outreach activities.
Cloud Providers That Institutions are Currently Using or Considering
Oracle
IBM
Google Cloud Platform
11%
4%
32%
Microsoft Azure
Amazon Web Services
Other
66%
71%
6%
The most common cloud applications implemented were email, learning management systems, library management systems, customer relationship applications, and alumni systems. Data storage cloud adoption continues to grow, suggesting institutions are finding alternatives to Google and Microsoft attractive, with corporate offerings from Dropbox and Box.com becoming more mainstream as well. The adoption of cloud for ERP areas of finance and students system was the lowest of all applications. This may indicate CIOs were restricted by adequate or completed cloud offerings, budget constraints, or the task was too daunting. This may also be true for customizations that cannot be easily remedied in a multi-tenant SaaS cloud-based system. There are still some privacy and security concerns about the cloud for these applications.
2017 SURVEY OF CHIEF INFORMATION OFFICERS
44
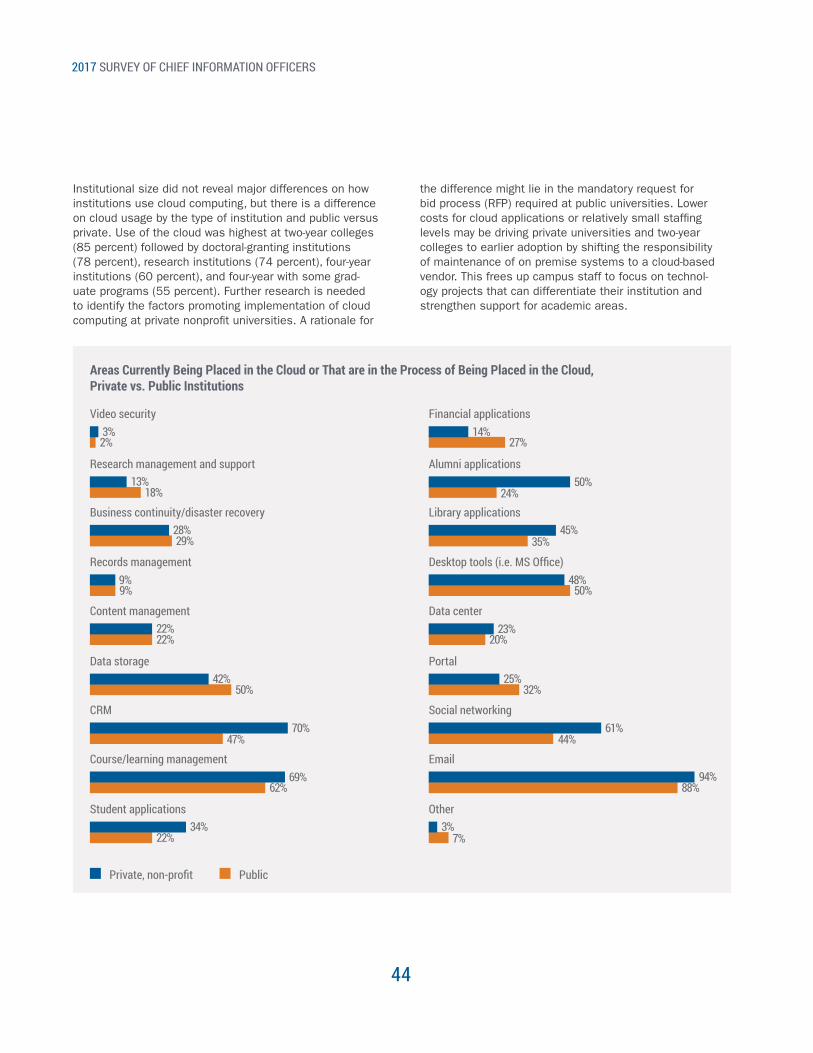
Institutional size did not reveal major differences on how institutions use cloud computing, but there is a difference on cloud usage by the type of institution and public versus private. Use of the cloud was highest at two-year colleges (85 percent) followed by doctoral-granting institutions (78 percent), research institutions (74 percent), four-year institutions (60 percent), and four-year with some grad-uate programs (55 percent). Further research is needed to identify the factors promoting implementation of cloud computing at private nonprofit universities. A rationale for
Areas Currently Being Placed in the Cloud or That are in the Process of Being Placed in the Cloud, Private vs. Public Institutions
Private, non-profit Public
2%3%
Video security
27%14%
Financial applications
18%13%
Research management and support
24%50%
Alumni applications
29%28%
Business continuity/disaster recovery
35%45%
Library applications
9%9%
Records management
50%48%
Desktop tools (i.e. MS Office)
22%22%
Content management
20%23%
Data center
50%42%
Data storage
32%25%
Portal
47%70%
CRM
44%61%
Social networking
62%69%
Course/learning management
88%94%
22%34%
Student applications
7%3%
Other
the difference might lie in the mandatory request for bid process (RFP) required at public universities. Lower costs for cloud applications or relatively small staffing levels may be driving private universities and two-year colleges to earlier adoption by shifting the responsibility of maintenance of on premise systems to a cloud-based vendor. This frees up campus staff to focus on technol-ogy projects that can differentiate their institution and strengthen support for academic areas.
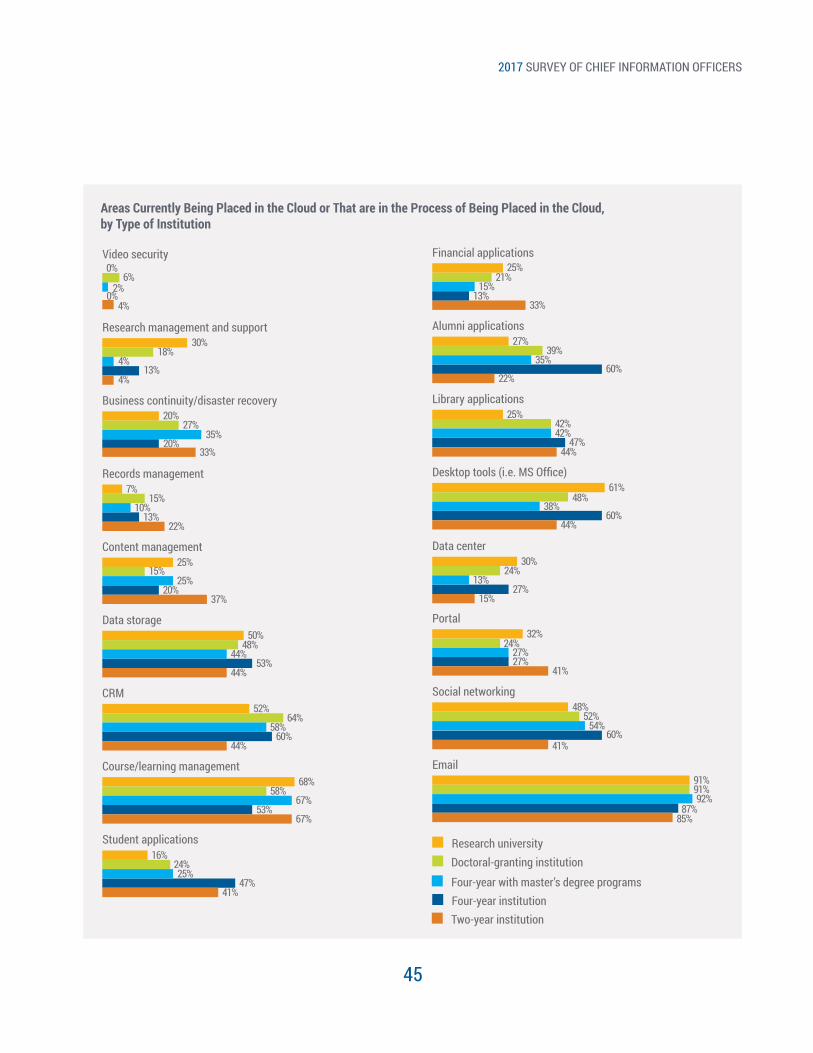
2017 SURVEY OF CHIEF INFORMATION OFFICERS
45
Areas Currently Being Placed in the Cloud or That are in the Process of Being Placed in the Cloud, by Type of Institution
0% 25%
0% 13%4% 33%
6% 21%2% 15%
Video security Financial applications
30% 27%
13% 60%4% 22%
18% 39%4% 35%
Research management and support Alumni applications
20% 25%
20% 47%33% 44%
27% 42%35% 42%
Business continuity/disaster recovery Library applications
7% 61%
13% 60%22% 44%
15% 48%10% 38%
Records management Desktop tools (i.e. MS Office)
25%
20%37%
15%25%
Content management
50% 32%
30%
53% 27%
27%
44% 41%
15%
48% 24%
24%
44% 27%
13%
Data storage Portal
Data center
52% 48%
60% 60%44% 41%
64% 52%58% 54%
CRM Social networking
68% 91%
53% 87%67% 85%
58% 91%67% 92%
Course/learning management Email
16%
47%41%
24%25%
Student applications Research universityDoctoral-granting institution
Four-year with master’s degree programsFour-year institutionTwo-year institution
2017 SURVEY OF CHIEF INFORMATION OFFICERS
46
Factors Influencing the Use of Cloud Computing
Institutions indicated many factors influence their usage of cloud computing, with access to data/information in the cloud the top choice. As noted in past reports, saving money, getting new activities online quickly, and protecting sensitive information are the most frequently cited influenc-es. However, the concern with accessing information in the cloud decreased to 65 percent in 2016 from 73 percent in 2015 and remained flat in 2017. Security and the pro-tection of cloud-based data continues to become a lower concern in recent years, suggesting institutions recognize cloud-based data is often considered equally safe if not more so than campus-based data. Saving money through the cloud dropped as a cloud influencer from 68 percent in 2016 to 61 percent in 2017. Executive leadership pushing the use of the cloud, a new category in 2017, was reported at 19 percent as a cloud influencer.
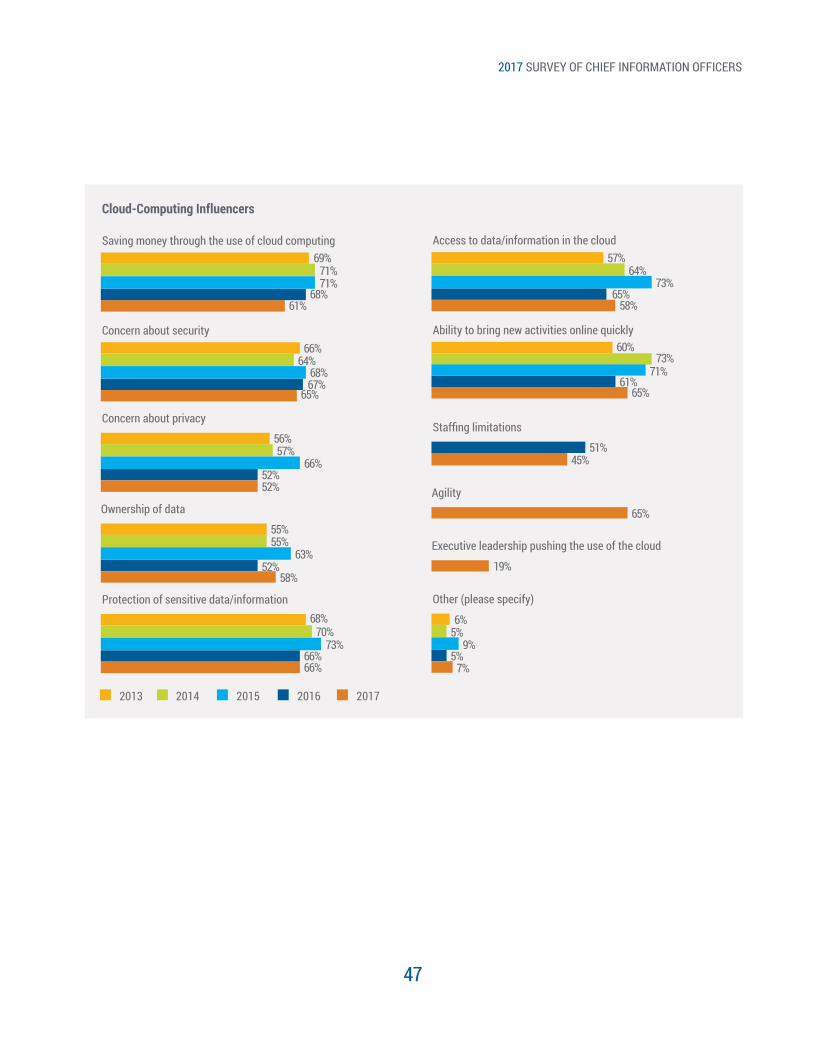
2017 SURVEY OF CHIEF INFORMATION OFFICERS
47
Cloud-Computing Influencers
Concern about security Ability to bring new activities online quickly66% 60%
67% 61%65% 65%
64% 73%68% 71%
Saving money through the use of cloud computing Access to data/information in the cloud69% 57%
68% 65%61% 58%
71% 64%71% 73%
Concern about privacyStaffing limitations
56%51%
55%65%
19%
52%
52%
52%
58%
57%45%
55%
66%
63%
Ownership of dataAgility
Executive leadership pushing the use of the cloud
Protection of sensitive data/information Other (please specify)68% 6%
66% 5%66% 7%
70% 5%73% 9%
2013 2014 2015 2016 2017
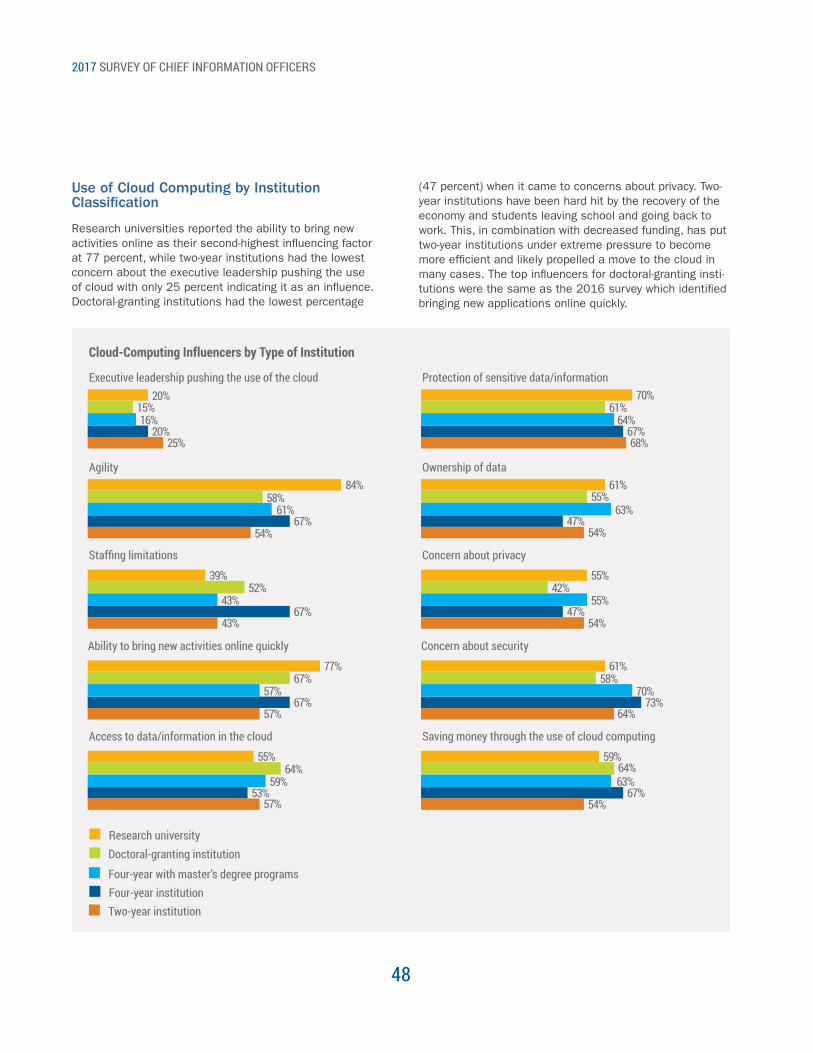
2017 SURVEY OF CHIEF INFORMATION OFFICERS
48
Use of Cloud Computing by Institution Classification
Research universities reported the ability to bring new activities online as their second-highest influencing factor at 77 percent, while two-year institutions had the lowest concern about the executive leadership pushing the use of cloud with only 25 percent indicating it as an influence. Doctoral-granting institutions had the lowest percentage
(47 percent) when it came to concerns about privacy. Two-year institutions have been hard hit by the recovery of the economy and students leaving school and going back to work. This, in combination with decreased funding, has put two-year institutions under extreme pressure to become more efficient and likely propelled a move to the cloud in many cases. The top influencers for doctoral-granting insti-tutions were the same as the 2016 survey which identified bringing new applications online quickly.
Cloud-Computing Influencers by Type of Institution
Agility Ownership of data84% 61%
67% 47%54% 54%
58% 55%61% 63%
Executive leadership pushing the use of the cloud Protection of sensitive data/information20% 70%
20% 67%25% 68%
15% 61%16% 64%
Staffing limitations Concern about privacy
39% 55%
77% 61%
67% 47%
67% 73%
43% 54%
57% 64%
52% 42%
67% 58%
43% 55%
57% 70%
Ability to bring new activities online quickly Concern about security
Access to data/information in the cloud Saving money through the use of cloud computing
55% 59%
53% 67%57% 54%
64% 64%59% 63%
Research universityDoctoral-granting institution
Four-year with master’s degree programsFour-year institutionTwo-year institution
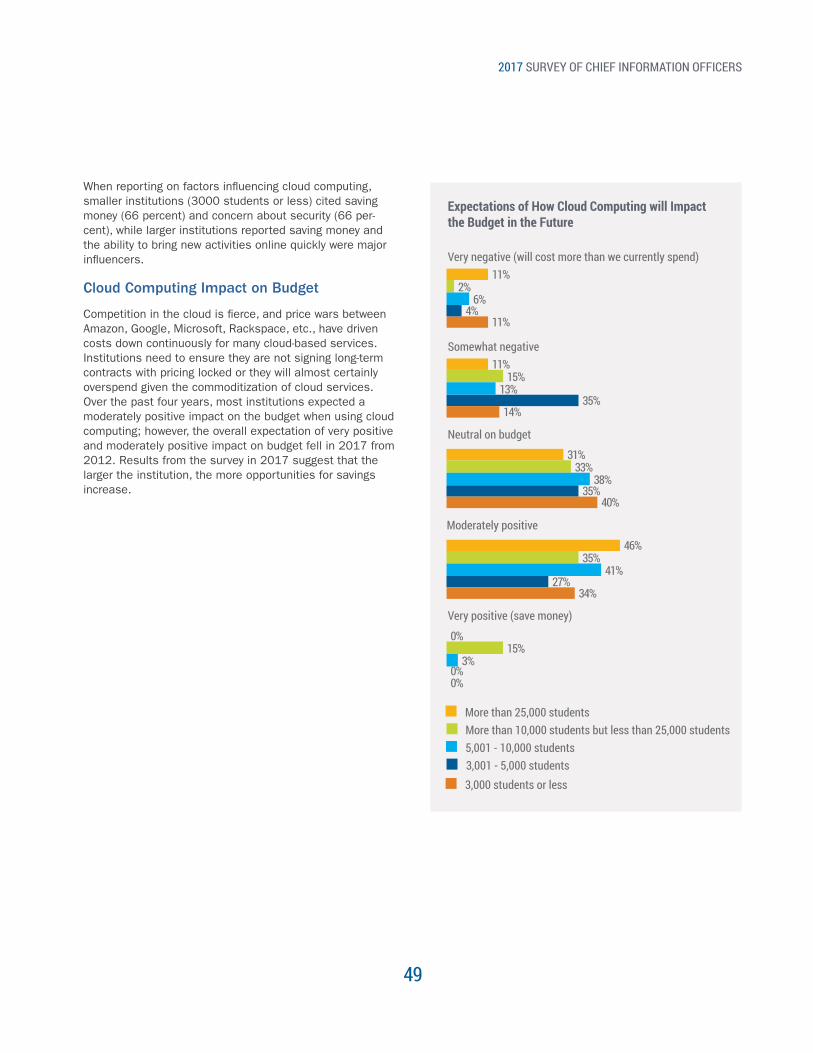
2017 SURVEY OF CHIEF INFORMATION OFFICERS
49
When reporting on factors influencing cloud computing, smaller institutions (3000 students or less) cited saving money (66 percent) and concern about security (66 per-cent), while larger institutions reported saving money and the ability to bring new activities online quickly were major influencers. Cloud Computing Impact on Budget
Competition in the cloud is fierce, and price wars between Amazon, Google, Microsoft, Rackspace, etc., have driven costs down continuously for many cloud-based services. Institutions need to ensure they are not signing long-term contracts with pricing locked or they will almost certainly overspend given the commoditization of cloud services. Over the past four years, most institutions expected a moderately positive impact on the budget when using cloud computing; however, the overall expectation of very positive and moderately positive impact on budget fell in 2017 from 2012. Results from the survey in 2017 suggest that the larger the institution, the more opportunities for savings increase.
Expectations of How Cloud Computing will Impact the Budget in the Future
Somewhat negative11%
35%14%
15%13%
Very negative (will cost more than we currently spend)11%
4%11%
2%6%
Neutral on budget
31%
46%
35%
27%
40%
34%
33%
35%
38%
41%
Moderately positive
Very positive (save money)
0%
0%0%
15%3%
More than 25,000 studentsMore than 10,000 students but less than 25,000 students5,001 - 10,000 students3,001 - 5,000 students3,000 students or less
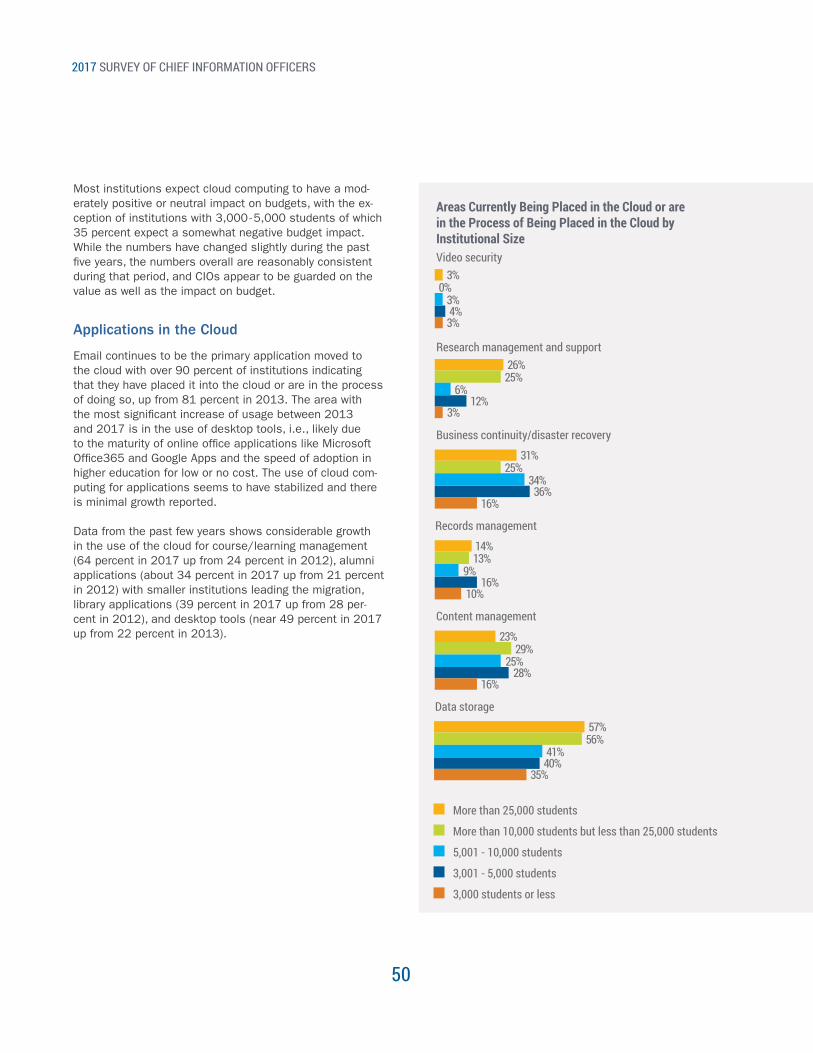
2017 SURVEY OF CHIEF INFORMATION OFFICERS
50
Areas Currently Being Placed in the Cloud or are in the Process of Being Placed in the Cloud by Institutional Size
Research management and support26%
12%3%
25%6%
Video security3%
4%3%
0%3%
Business continuity/disaster recovery
31%
14%
36%
16%
16%
10%
25%
13%
34%
9%
Records management
Content management
23%
28%16%
29%25%
More than 25,000 students
More than 10,000 students but less than 25,000 students
5,001 - 10,000 students
3,001 - 5,000 students
3,000 students or less
Data storage
57%
40%35%
56%41%
Applications in the Cloud
Email continues to be the primary application moved to the cloud with over 90 percent of institutions indicating that they have placed it into the cloud or are in the process of doing so, up from 81 percent in 2013. The area with the most significant increase of usage between 2013 and 2017 is in the use of desktop tools, i.e., likely due to the maturity of online office applications like Microsoft Office365 and Google Apps and the speed of adoption in higher education for low or no cost. The use of cloud com-puting for applications seems to have stabilized and there is minimal growth reported.
Data from the past few years shows considerable growth in the use of the cloud for course/learning management (64 percent in 2017 up from 24 percent in 2012), alumni applications (about 34 percent in 2017 up from 21 percent in 2012) with smaller institutions leading the migration, library applications (39 percent in 2017 up from 28 per-cent in 2012), and desktop tools (near 49 percent in 2017 up from 22 percent in 2013).
Most institutions expect cloud computing to have a mod-erately positive or neutral impact on budgets, with the ex-ception of institutions with 3,000 - 5,000 students of which 35 percent expect a somewhat negative budget impact. While the numbers have changed slightly during the past five years, the numbers overall are reasonably consistent during that period, and CIOs appear to be guarded on the value as well as the impact on budget.
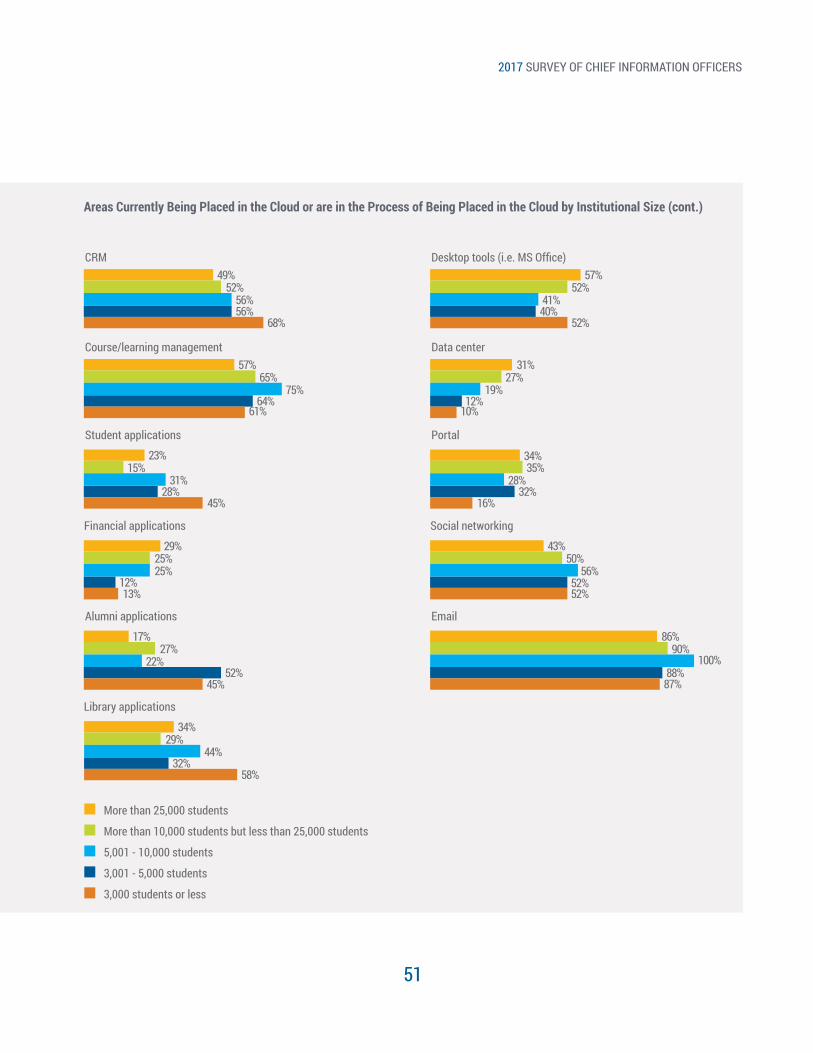
2017 SURVEY OF CHIEF INFORMATION OFFICERS
51
Areas Currently Being Placed in the Cloud or are in the Process of Being Placed in the Cloud by Institutional Size (cont.)
Course/learning management Data center57% 31%
64% 12%61% 10%
65% 27%75% 19%
CRM Desktop tools (i.e. MS Office)49% 57%
56% 40%68% 52%
52% 52%56% 41%
Student applications Portal
23% 34%
29% 43%
28% 32%
12% 52%
45% 16%
13% 52%
15% 35%
25% 50%
31% 28%
25% 56%
Financial applications Social networking
Alumni applications Email
17% 86%
52% 88%45% 87%
27% 90%22% 100%
More than 25,000 students
More than 10,000 students but less than 25,000 students
5,001 - 10,000 students
3,001 - 5,000 students
3,000 students or less
Library applications
34%
32%58%
29%44%
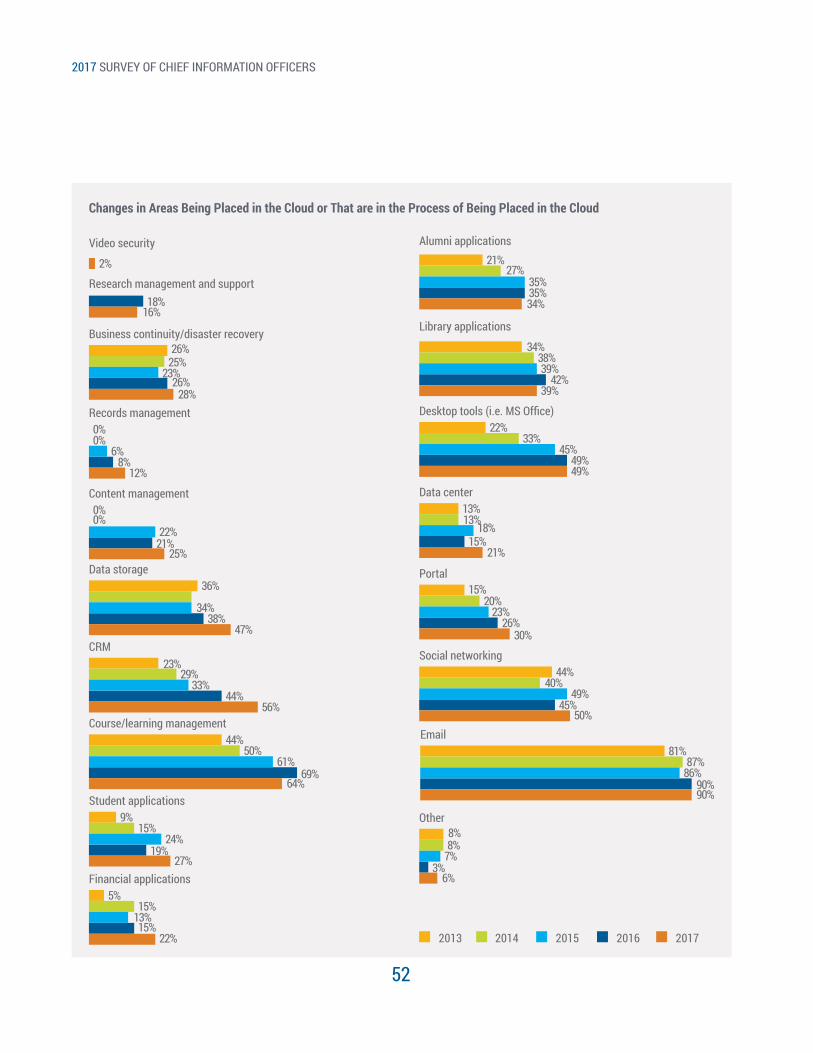
2017 SURVEY OF CHIEF INFORMATION OFFICERS
52
Changes in Areas Being Placed in the Cloud or That are in the Process of Being Placed in the Cloud
2%
Video security
18%16%
Research management and support
26%
26%28%
25%23%
Business continuity/disaster recovery
21%
35%34%
27%35%
Alumni applications
0%
8%12%
0%6%
Records management
34%
42%39%
38%39%
Library applications
0%
21%25%
0%22%
Content management
22%
49%49%
33%45%
Desktop tools (i.e. MS Office)
36%
38%47%
34%
Data storage
13%
15%21%
13%18%
Data center
23%
44%56%
29%33%
CRM
15%
26%30%
20%23%
Portal
44%
69%64%
50%61%
Course/learning management
44%
81%
45%
90%
50%
90%
40%
87%
49%
86%
Social networking
9%
19%27%
15%24%
Student applications
8%
3%6%
8%7%
Other
2013 2014 2015 2016 2017
5%
15%22%
15%13%
Financial applications
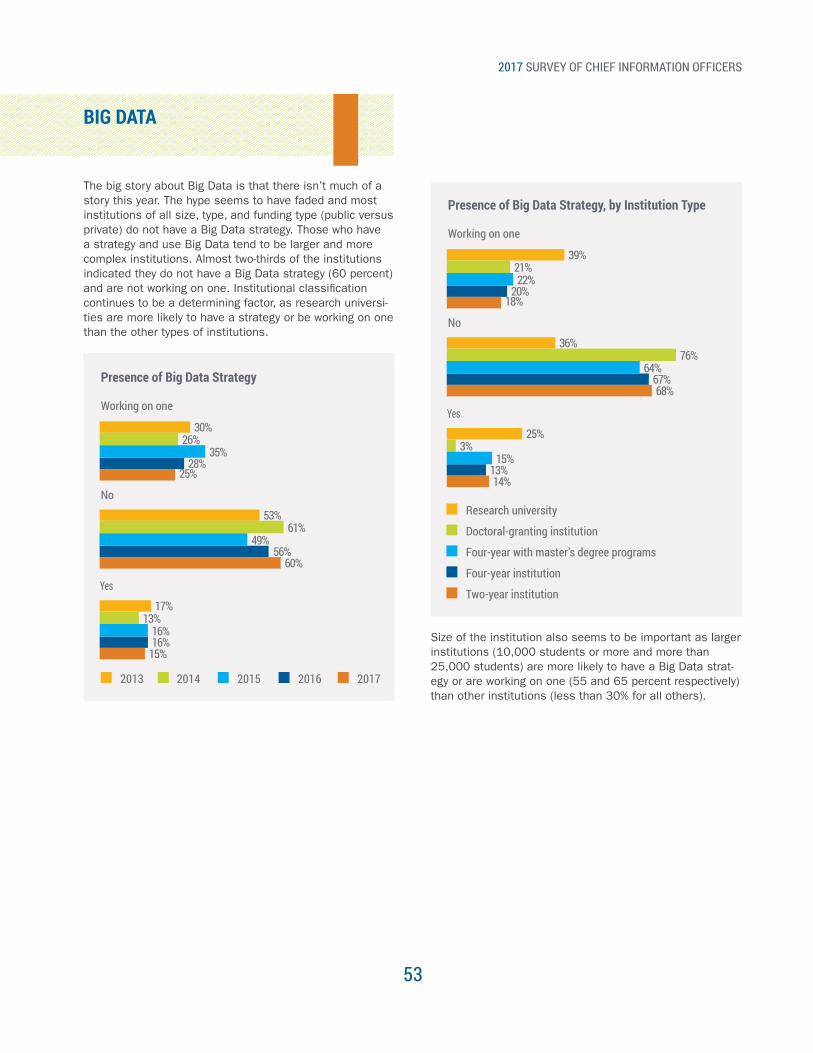
2017 SURVEY OF CHIEF INFORMATION OFFICERS
53
BIG DATA
The big story about Big Data is that there isn’t much of a story this year. The hype seems to have faded and most institutions of all size, type, and funding type (public versus private) do not have a Big Data strategy. Those who have a strategy and use Big Data tend to be larger and more complex institutions. Almost two-thirds of the institutions indicated they do not have a Big Data strategy (60 percent) and are not working on one. Institutional classification continues to be a determining factor, as research universi-ties are more likely to have a strategy or be working on one than the other types of institutions.
Presence of Big Data Strategy, by Institution Type
Working on one
39%
20%18%
21%22%
No
36%
25%
67%
13%
68%
14%
76%64%
3%15%
Yes
Presence of Big Data Strategy
2013 2014 2015 2016 2017
Working on one
30%
28%25%
26%35%
No
53%
17%
56%
16%
60%
15%
61%49%
13%16%
Yes
Size of the institution also seems to be important as larger institutions (10,000 students or more and more than 25,000 students) are more likely to have a Big Data strat-egy or are working on one (55 and 65 percent respectively) than other institutions (less than 30% for all others).
Research university
Doctoral-granting institution
Four-year with master’s degree programs
Four-year institution
Two-year institution
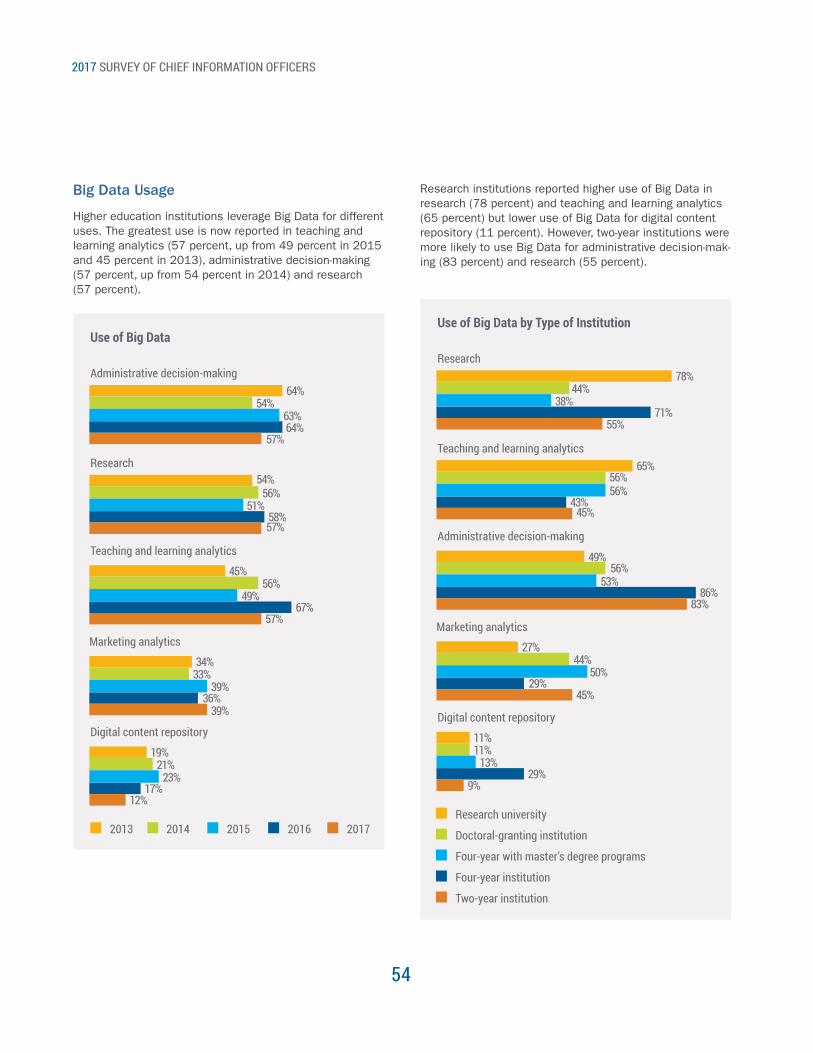
2017 SURVEY OF CHIEF INFORMATION OFFICERS
54
Big Data Usage
Higher education institutions leverage Big Data for different uses. The greatest use is now reported in teaching and learning analytics (57 percent, up from 49 percent in 2015 and 45 percent in 2013), administrative decision-making (57 percent, up from 54 percent in 2014) and research (57 percent).
Use of Big Data
2013 2014 2015 2016 2017
Research54%
58%57%
56%51%
Administrative decision-making64%
64%57%
54%63%
Teaching and learning analytics
45%
34%
67%
36%
57%
39%
56%
33%
49%
39%
Marketing analytics
Digital content repository
19%
17%12%
21%23%
Research institutions reported higher use of Big Data in research (78 percent) and teaching and learning analytics (65 percent) but lower use of Big Data for digital content repository (11 percent). However, two-year institutions were more likely to use Big Data for administrative decision-mak-ing (83 percent) and research (55 percent).
Use of Big Data by Type of Institution
Teaching and learning analytics65%
43%45%
56%56%
Research78%
71%55%
44%38%
Administrative decision-making
49%
27%
86%
29%
83%
45%
56%
44%
53%
50%
Marketing analytics
Digital content repository
11%
29%9%
11%13%
Research university
Doctoral-granting institution
Four-year with master’s degree programs
Four-year institution
Two-year institution
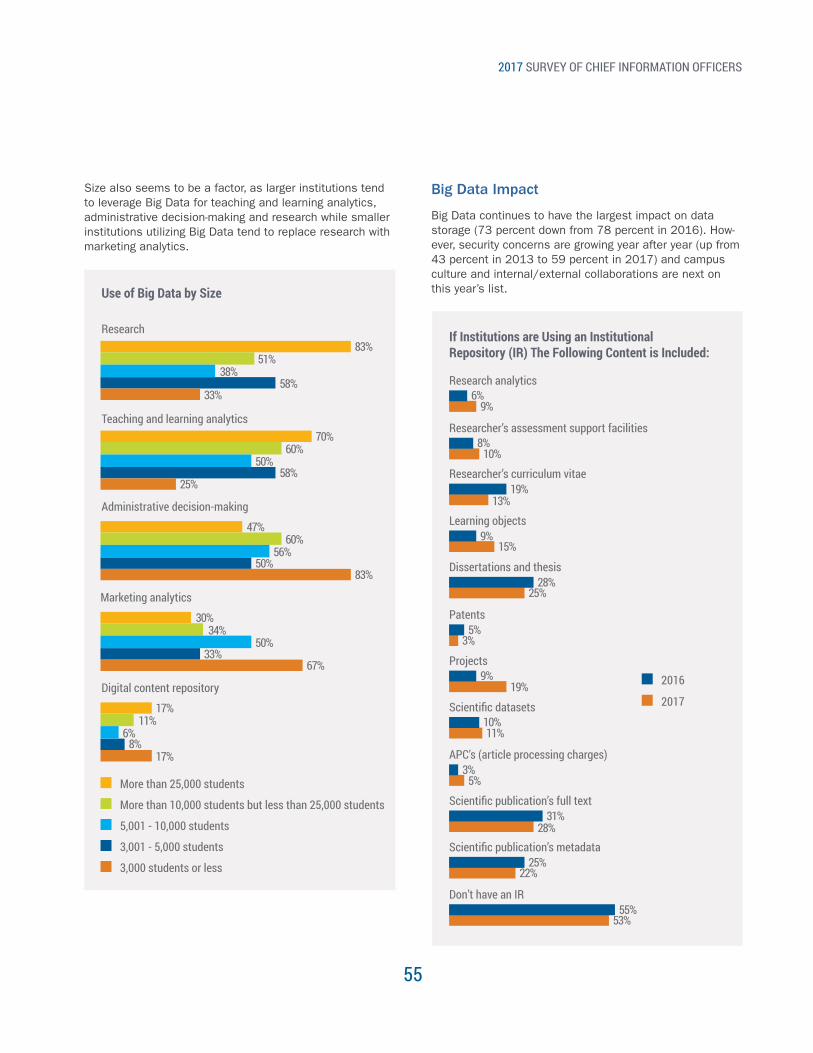
2017 SURVEY OF CHIEF INFORMATION OFFICERS
55
Size also seems to be a factor, as larger institutions tend to leverage Big Data for teaching and learning analytics, administrative decision-making and research while smaller institutions utilizing Big Data tend to replace research with marketing analytics.
Use of Big Data by Size
Teaching and learning analytics70%
58%25%
60%50%
Research83%
58%33%
51%38%
Administrative decision-making
47%
30%
50%
33%
83%
67%
60%
34%
56%
50%
Marketing analytics
Digital content repository
17%
8%17%
11%6%
More than 25,000 students
More than 10,000 students but less than 25,000 students
5,001 - 10,000 students
3,001 - 5,000 students
3,000 students or less
Big Data Impact
Big Data continues to have the largest impact on data storage (73 percent down from 78 percent in 2016). How-ever, security concerns are growing year after year (up from 43 percent in 2013 to 59 percent in 2017) and campus culture and internal/external collaborations are next on this year’s list.
If Institutions are Using an Institutional Repository (IR) The Following Content is Included:
2016
2017
9%6%
Research analytics
10%8%
Researcher’s assessment support facilities
13%19%
Researcher’s curriculum vitae
15%9%
Learning objects
25%28%
Dissertations and thesis
3%5%
Patents
19%
28%
9%
31%
Projects
Scientific publication’s full text
11%
22%
10%
25%
Scientific datasets
Scientific publication’s metadata
5%
53%
3%
55%
APC’s (article processing charges)
Don’t have an IR
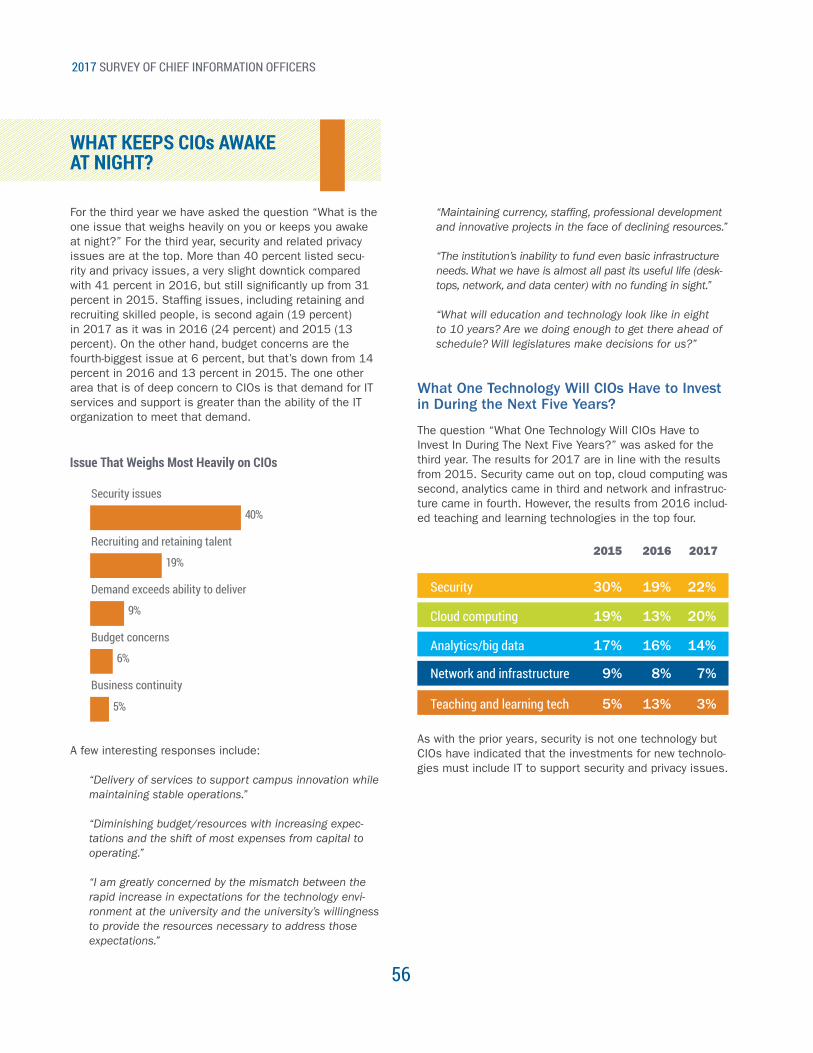
2017 SURVEY OF CHIEF INFORMATION OFFICERS
56
WHAT KEEPS CIOs AWAKE AT NIGHT?
For the third year we have asked the question “What is the one issue that weighs heavily on you or keeps you awake at night?” For the third year, security and related privacy issues are at the top. More than 40 percent listed secu-rity and privacy issues, a very slight downtick compared with 41 percent in 2016, but still significantly up from 31 percent in 2015. Staffing issues, including retaining and recruiting skilled people, is second again (19 percent) in 2017 as it was in 2016 (24 percent) and 2015 (13 percent). On the other hand, budget concerns are the fourth-biggest issue at 6 percent, but that’s down from 14 percent in 2016 and 13 percent in 2015. The one other area that is of deep concern to CIOs is that demand for IT services and support is greater than the ability of the IT organization to meet that demand.
A few interesting responses include:
“Delivery of services to support campus innovation while maintaining stable operations.”
“Diminishing budget/resources with increasing expec-tations and the shift of most expenses from capital to operating.”
“I am greatly concerned by the mismatch between the rapid increase in expectations for the technology envi-ronment at the university and the university’s willingness to provide the resources necessary to address those expectations.”
“Maintaining currency, staffing, professional development and innovative projects in the face of declining resources.”
“The institution’s inability to fund even basic infrastructure needs. What we have is almost all past its useful life (desk-tops, network, and data center) with no funding in sight.”
“What will education and technology look like in eight to 10 years? Are we doing enough to get there ahead of schedule? Will legislatures make decisions for us?”
What One Technology Will CIOs Have to Invest in During the Next Five Years?
The question “What One Technology Will CIOs Have to Invest In During The Next Five Years?” was asked for the third year. The results for 2017 are in line with the results from 2015. Security came out on top, cloud computing was second, analytics came in third and network and infrastruc-ture came in fourth. However, the results from 2016 includ-ed teaching and learning technologies in the top four.
22%19%30%Security
20%13%19%Cloud computing
14%16%17%Analytics/big data
7%8%9%Network and infrastructure
3%13%5%Teaching and learning tech
20162015 2017
As with the prior years, security is not one technology but CIOs have indicated that the investments for new technolo-gies must include IT to support security and privacy issues.
Issue That Weighs Most Heavily on CIOs
Security issues
40%
Recruiting and retaining talent
19%
Demand exceeds ability to deliver
9%
Budget concerns
6%
Business continuity
5%
2017 SURVEY OF CHIEF INFORMATION OFFICERS
57
SUMMARYThe challenges facing higher-education CIOs are many and diverse. Hopefully this year’s LBCIO survey will provide CIOs with insights and peer information to help manage an IT organization that is growing in demand for services and support while holding on to financial and human resource constraints.
One of the goals of formal higher education from the beginning was to protect the integrity of the institution and the physical security of students, faculty, and staff. Security continues to be a major concern for CIOs in higher education. CIOs protect and deal with attacks from all corners of the globe. Some attacks are made for financial gains (ransomware and phishing are examples), while other attacks hit at the integrity of the institution including personal privacy, grades, evaluations, research and even class discussions. It is no wonder that many CIOs are kept awake at night with concerns for security.
The concern for security has long been a major concern for CIOs. The CAUSE Current Issues Forum of 1984 listed security as the number one concern for IT leaders and security has continued to be a major concern up to the present on the EDUCAUSE Top 10 List. Every new and innovative technology that is brought on campus must be secure and support the mission and integrity of the institution. Meanwhile, CIOs have an obligation to provide an open environment where any device can be connected from any place on the globe. As the late CIO from Virginia Tech and EDUCOM president, Dr. Robert Heterick, once said, “The nice thing about standards in higher education is that there are so many of them.” No other industry must be as open and available globally and at the same time secure its information resources literally “forever.” Transactions in higher education must be protected beyond the life of both the individual and even the institution. When an institution dies, the transcripts of all students must live on and be protected! This year’s survey continues to see security as the leading issue facing CIOs.
CIOs in higher education are dealing with massive amounts of technical and cultural change. The role of the cloud has been moving forward, and over the past eight years
of the LBCIO survey, administrative applications were not likely to be moved to the cloud. Data this year suggests that the wall is being broken down and more institutions are investing in cloud-based administrative applications. However, moving administrative and personal information to the cloud is not without concerns. One CIO from a large state system said “I have this feeling that once you do move an app to the cloud you are pretty much locked in. It’s a bit like OPEC, they raise the price of oil and there is nothing you can do about it. Another big thought running around in my head is ‘where will we be in the next 20 - 40 years?’ I personally believe we will continue to see radical changes in almost every aspect of our daily life. From the potential of technological improvements coupled with social media impacting our personal and family life to potential changes in the way the current institutions like higher ed operate. Are we preparing ourselves for that level of change?”
We know that this or any other survey cannot really address all of the issues facing higher education and CIOs in higher education but we hope that this report from the 2017 LBCIO survey will help CIOs plan for the future and better manage their IT organizations and resources.
The entire content in this report, including but not limited to text, design, graphics, and the selection and arrangements thereof, is copyrighted as a collective work under the United States and other copyright laws, and is the property of the Leadership Board for CIOs.
Copyright © 2017. ALL RIGHTS RESERVED. 1271 Cedar Street Broomfield, CO 80020. Telephone: (303) 807-9408.
You may electronically copy, download, and print hard copy portions of the report solely for your own, noncommercial use. You may not modify, copy, distribute, transmit, display, reproduce, publish, license, create derivative works from, transfer, or sell any information obtained from this report without the express, written authorization of the LBCIO.
If you would like more information about the survey or the Leadership Board for CIOs in Higher Educa-tion, or would like to become a member of LBCIO, please contact:
Dr. Michael ZastrockyExecutive Director, LBCIO1271 Cedar StreetBroomfield, CO 80020+1 720 242 5150Mobile +1 303 807 [email protected]
Or visit the LBCIO website at:www.lbcio.org
2017 SURVEY OF CHIEF INFORMATION OFFICERS
58
Edward AractingiCIO, Marshall University
Mark AskrenVice Chancellor for IT and CIOUniversity of Nebraska System
Michael BestulCIO, John Carroll University
Patrick BurnsDean of Libraries. VP for IT and Professor of Mechanical Engineering, Colorado State University
Reid ChristenberryCIO Emeritus, Tennessee Tech
Brian CohenVice Chancellor for Technology and University CIOCity University of New York
Micah CooperAssociate VP and CIO, Cedarville University
Paul CzarapataVP/CIO, Kentucky Community & Technical College System
Mitchel Davis Vice President and CIO, Dartmouth College
Leonard De BottonVice President of Information Systems/CIOBerkeley College
Laura DobsonCIO, Mohawk College (Canada)
Loretta EarlyVice President and CIOGeorge Washington University
Elias G. EldayrieVice President and Chief Information OfficerUniversity of Florida
Tim FergusonAssociate Provost/CIO, Northern Kentucky University
Jan FoxSr. Vice President/CIO Emeritus, Marshall University
Chris GillChief Information Technology OfficerDrake University
Peter GrecoChief Technology Officer, Saint Mary’s College
Naveed HusainAssociate Vice President/CIOTeacher’s College, Columbia University
Bret IngermanVice President for Information TechnologyTallahassee Community College
Vince KellenCIO, University of California, San Diego
Marcus KerrAssociate VP/CIO, Texas Wesleyan University
Mark LeggCIO Emeritus, Flinders University (Australia)
David E. Lewis Vice Provost and Chief Information Officer, University of Rochester
Ed MahonVice President and CIOKent State University
Keith McIntoshVice President/CIO University of Richmond
Judy MolnarAssociate VP and CIOAustin Peay State University
Allan MorrisSenior VP and CIO Southern Cross University (Australia)
John Murphy CIO/Director of Digital Technologies Nottingham Trent University (UK)
Brian Nichols CIO, University of Kentucky
Lígia Maria RibeiroFaculty of EngineeringPró-Reitora para a Universidade Digital (CIO) Emeritus Universidade do Porto (Portugal)
David RotmanCIO EmeritusCedarville University
Tina StuchellExecutive Director of ITUniversity of Mount Union
M. Lewis TemaresVP/CIO, Dean of Engineering, EmeritusUniversity of Miami
Rodney TostenVice President for Information TechnologyGettysburg College
Nelson C. VincentVice President of IT/CIOUniversity of Cincinnati
Walter WeirSenior Advisor to the PresidentUniversity of Nebraska
Current Members of the Leadership Board for CIOs in Higher Education (LBCIO)
The Form ThatIs All Function
To see scalable electronic forms and workflow automation solutions that help institutions increase efficiencies and cut costs, schedule a demo with us at: laserfiche.com/LBCIOFormsDemo.
AdmissionsFinancial AidRegistrar Forms ProcessingAcademic AdvisingStudent Records ManagementStudent Onboarding
Accounts PayableVendor ManagementContract ManagementProcurement & PurchasingHuman ResourcesFacilities Management
Grant AdministrationAdvancement ServicesAthleticsFaculty AdministrationInformation TechnologyCommunication Management
ADDITIONAL CAMPUS SOLUTIONS
BUSINESS ADMINISTRATION
ENROLLMENTMANAGEMENT
© 2016 Laserfiche. Laserfiche®, Run Smarter®, and Compulink® are registered trademarks of Compulink Management Center, Inc. All rights reserved.
Sponsored by
DR. MICHAEL ZASTROCKYExecutive Director
1271 Cedar StreetBroomfield, CO 80020+1 720 242 5150Mobile +1 303 807 [email protected]