Embed Size (px)
Citation preview
2015
Bonnie V. Hancock Executive Director
ERM Initiative North Carolina State University
2801 Founders Drive Raleigh, NC 27695
919.513.0901 | www.erm.ncsu.edu
SURVEY OF RISK ASSESSMENT PRACTICES
1
CONTENTS
INTRODUCTION ..................................................................................................................................................... 2
KEY CONSIDERATIONS IN RISK ASSESSMENT PROCESS .......................................................................................... 3
INDIVIDUALS PROVIDING INPUT ON ASSESSMENT ................................................................................................ 4
MEANS OF GATHERING INPUT ............................................................................................................................... 4
DIMENSIONS USED TO ASSESS RISKS ..................................................................................................................... 5
SCALES USED FOR ASSESSING RISKS ....................................................................................................................... 5
SCORING RISKS ...................................................................................................................................................... 7
USE OF FORCED RANKINGS FOR RISK ASSESSMENT ............................................................................................... 8
FREQUENCY OF UPDATES .................................................................................................................................... 10
SUMMARY ........................................................................................................................................................... 10
SURVEY OF RISK ASSESSMENT PRACTICES
2
Introduction
Enterprise Risk Management (ERM) approaches vary widely across organizations because the process
must be tailored both to the needs of the organization and to the culture or the “way things get done”
among its leadership team. This paper is based on a sampling of practices employed by organizations
who are members of the North Carolina State University Poole College of Management Enterprise Risk
Management Initiative Advisory board. It illustrates the wide range of practices that can be employed to
assess or prioritize the risks facing an organization, highlighting practices that are the most prevalent
within this group of ERM practitioners.
Prior to assessing risks, organizations usually develop a risk inventory or risk register that lists most of
the significant risks facing an organization. Defining risks accurately enhances the risk assessment
process as the ERM practitioner moves between different constituencies – board, management, and
those tasked with risk management - and it helps the organization focus on the most appropriate
response plans for each distinct risk. Accurate risk definitions are particularly important in the non-
financial services environment where big risks are complicated, situational, and often not supported
with ample data. In many organizations this process of identifying and defining risks is distinct from the
process of assessing risks; however, there are some organizations that combine these two activities. In
this paper we only address the process of assessing or prioritizing a list of risks that has already been
developed.
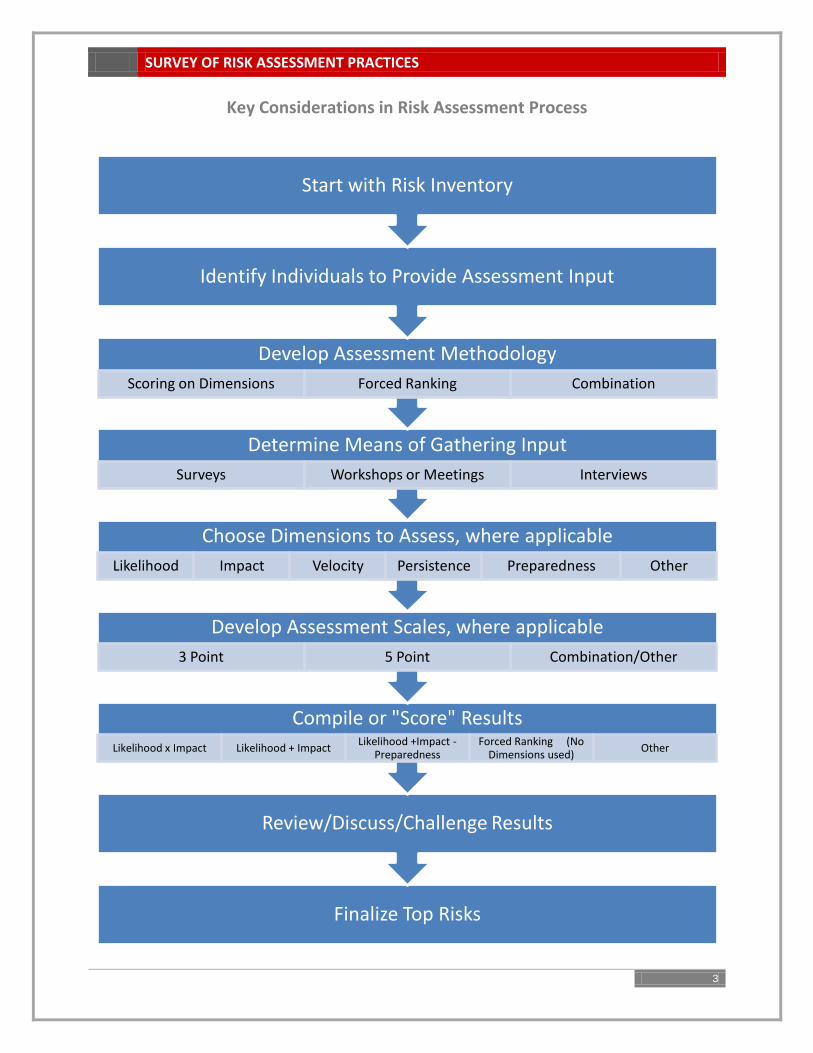
The diagram on the next page illustrates the key considerations in developing a process for assessing
risks.
SURVEY OF RISK ASSESSMENT PRACTICES
3
Key Considerations in Risk Assessment Process
Finalize Top Risks
Review/Discuss/Challenge Results
Compile or "Score" Results
Likelihood x Impact Likelihood + Impact Likelihood +Impact -
Preparedness Forced Ranking (No
Dimensions used) Other
Develop Assessment Scales, where applicable
3 Point 5 Point Combination/Other
Choose Dimensions to Assess, where applicable
Likelihood Impact Velocity Persistence Preparedness Other
Determine Means of Gathering Input
Surveys Workshops or Meetings Interviews
Develop Assessment Methodology
Scoring on Dimensions Forced Ranking Combination
Identify Individuals to Provide Assessment Input
Start with Risk Inventory
SURVEY OF RISK ASSESSMENT PRACTICES
4
Individuals Providing Input on Assessment Almost all organizations providing information for the development of this document gather input from
the C-Suite as part of the risk assessment process. While a few gather input from the Board of Directors,
this is not a common process. The most common practice is to solicit information from the C-suite and
the next two levels below the C-suite. One organization indicated that in business units with more
mature ERM processes, input was gathered at lower levels (two levels below officer level). In addition,
different techniques are commonly used to gather input at different levels within the organization. For
example, interviews may be used at the senior management level while surveys are used at lower levels
in the organization. Finally, in one case, the organization focused on a more “bottoms-up” process and
only gathered input from individuals two levels or more below the officer level.
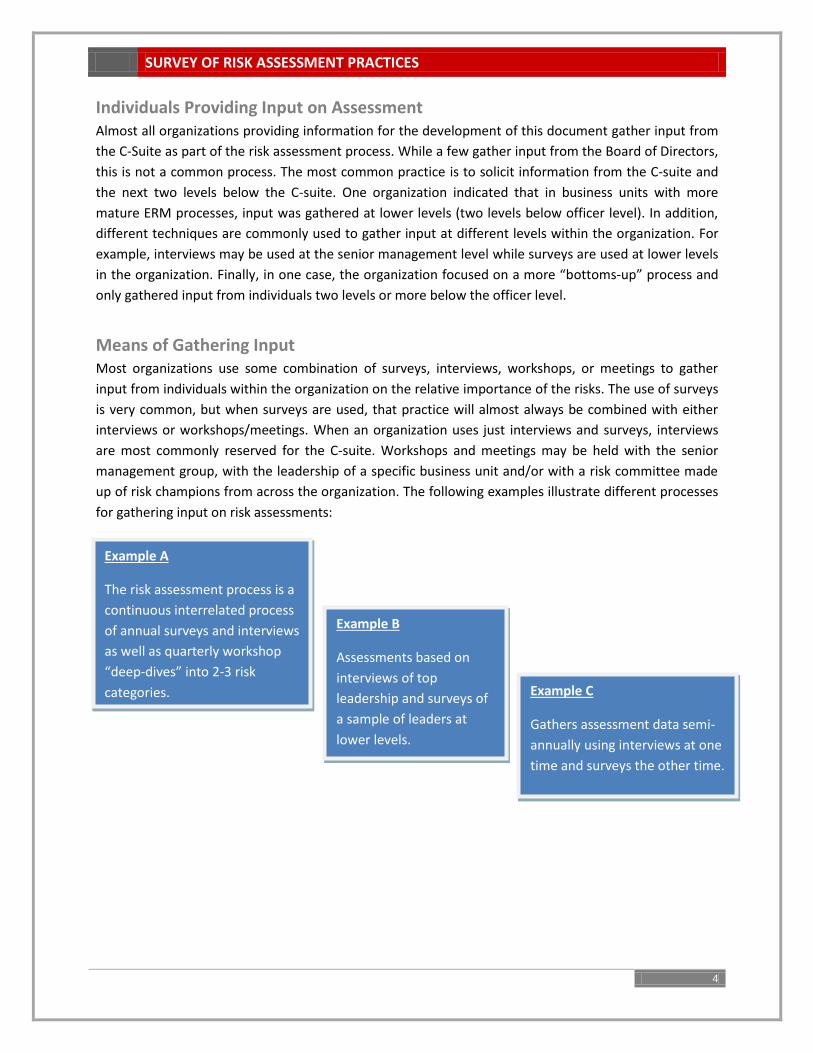
Means of Gathering Input Most organizations use some combination of surveys, interviews, workshops, or meetings to gather
input from individuals within the organization on the relative importance of the risks. The use of surveys
is very common, but when surveys are used, that practice will almost always be combined with either
interviews or workshops/meetings. When an organization uses just interviews and surveys, interviews
are most commonly reserved for the C-suite. Workshops and meetings may be held with the senior
management group, with the leadership of a specific business unit and/or with a risk committee made
up of risk champions from across the organization. The following examples illustrate different processes
for gathering input on risk assessments:
Example A
The risk assessment process is a
continuous interrelated process
of annual surveys and interviews
as well as quarterly workshop
“deep-dives” into 2-3 risk
categories.
Example B
Assessments based on
interviews of top
leadership and surveys of
a sample of leaders at
lower levels.
Example C
Gathers assessment data semi-
annually using interviews at one
time and surveys the other time.
SURVEY OF RISK ASSESSMENT PRACTICES
5
Dimensions Used to Assess Risks Most organizations assess risks by “scoring” the risks on various dimensions. There are quite a few
different dimensions that have been used in assessing risks. The following list captures all the different
dimensions of risks that advisory board members noted that they use:
Likelihood of occurrence
Overall Impact
Financial Impact
Reputational Impact
Other Impact
Velocity – how quickly will the risk event occur
Persistence – how long will the negative effects of the risk event last
Significance-importance of the risk to the organization
Preparedness – how prepared is the organization to respond to the risk
Treatment Confidence or Control Capability – how skilled is the organization in treating risks of
this type
Interdependency – how much influence does this risk have on the occurrence of other risks
Trajectory or Future Trend – how is this risk expected to change in the future
Some organizations do not assess on dimensions explicitly, but instead use forced rankings where
individuals may implicitly consider these dimensions in ranking various risks – we discuss the use of
forced rankings later in this paper.
For organizations that use these dimensions in assessing risks (as opposed to a forced ranking process),
almost all gather specific assessments of both likelihood of occurrence and impact. The next most
common dimensions assessed include velocity and preparedness.
Scales Used for Assessing Risks When risks are assessed using dimensions like probability and impact, scales are usually adopted to
allow for consistent assessment of each of the dimensions across a number of individuals providing
input. The organization develops the scale and defines what each point on the scale means. It is critical
that all participants in an assessment process have a common understanding of the definition for each
point on the scale.
The use of a 5 point scale is the most common, but 2, 3, and 4 point scales are used by some
organizations. In some cases different scales are used for different dimensions; for example, impact may
be scored on a 4 point-scale while velocity may be scored on a 2-point scale. In addition, most
organizations initially assess the inherent risk or the level of the risk before taking into account any risk
responses. When an organization also gathers input on the effectiveness of response plans, this allows
for a second assessment based upon the residual risk.
SURVEY OF RISK ASSESSMENT PRACTICES
6
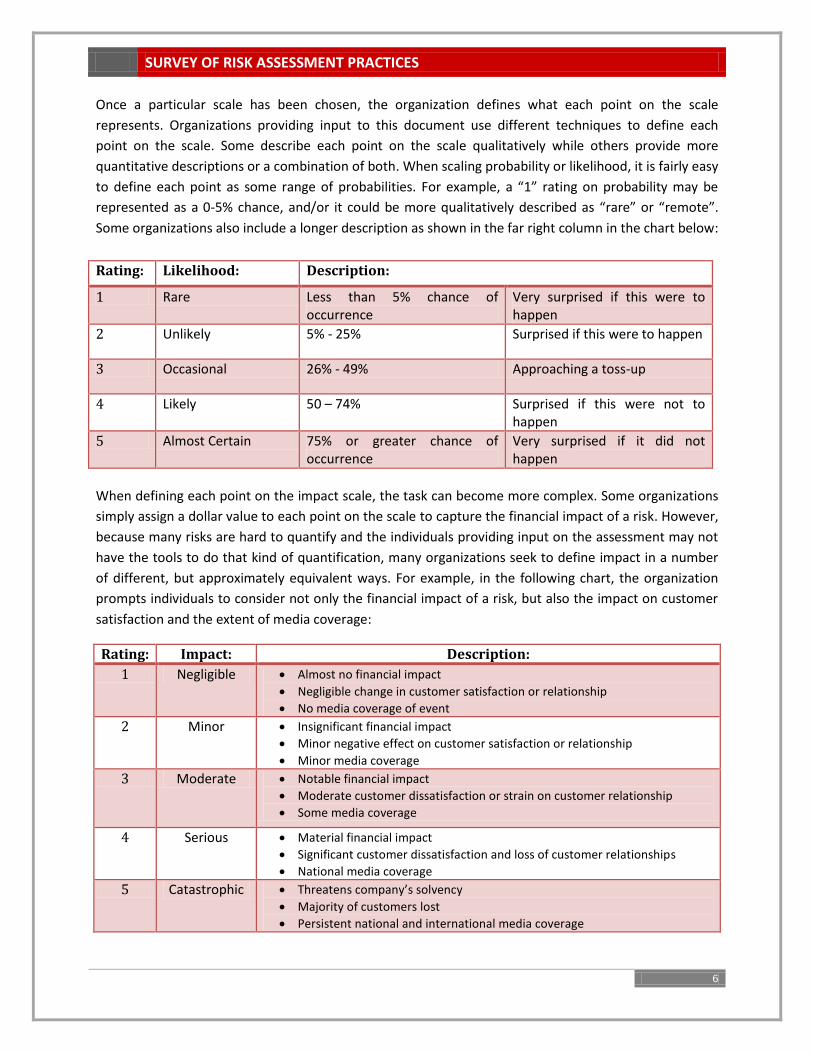
Once a particular scale has been chosen, the organization defines what each point on the scale
represents. Organizations providing input to this document use different techniques to define each
point on the scale. Some describe each point on the scale qualitatively while others provide more
quantitative descriptions or a combination of both. When scaling probability or likelihood, it is fairly easy
to define each point as some range of probabilities. For example, a “1” rating on probability may be
represented as a 0-5% chance, and/or it could be more qualitatively described as “rare” or “remote”.
Some organizations also include a longer description as shown in the far right column in the chart below:
When defining each point on the impact scale, the task can become more complex. Some organizations
simply assign a dollar value to each point on the scale to capture the financial impact of a risk. However,
because many risks are hard to quantify and the individuals providing input on the assessment may not
have the tools to do that kind of quantification, many organizations seek to define impact in a number
of different, but approximately equivalent ways. For example, in the following chart, the organization
prompts individuals to consider not only the financial impact of a risk, but also the impact on customer
satisfaction and the extent of media coverage:
Rating: Impact: Description:
1 Negligible Almost no financial impact
Negligible change in customer satisfaction or relationship
No media coverage of event
2 Minor Insignificant financial impact
Minor negative effect on customer satisfaction or relationship
Minor media coverage
3 Moderate Notable financial impact
Moderate customer dissatisfaction or strain on customer relationship
Some media coverage
4 Serious Material financial impact
Significant customer dissatisfaction and loss of customer relationships
National media coverage
5 Catastrophic Threatens company’s solvency
Majority of customers lost
Persistent national and international media coverage
Rating: Likelihood: Description:
1 Rare Less than 5% chance of occurrence
Very surprised if this were to happen
2 Unlikely 5% - 25% Surprised if this were to happen
3 Occasional 26% - 49% Approaching a toss-up
4 Likely 50 – 74% Surprised if this were not to happen
5 Almost Certain 75% or greater chance of occurrence
Very surprised if it did not happen
SURVEY OF RISK ASSESSMENT PRACTICES
7
All of the above examples display scales for likelihood and impact. When organizations assess risks on
other dimensions, similar scales are typically used. When assessing velocity or speed of onset on a 5-
point scale then a “5” would represent the greatest speed of onset. Likewise, when assessing the
persistence of a risk a score of “5” would indicate the longest persistence of negative effects of the risk
event. In each of these cases, a higher score would indicate a more serious, negative effect.
In the case of potentially risk-reducing dimensions such as treatment confidence and preparedness,
however, a higher score would generally be used to indicate a higher degree of confidence or level of
preparedness. Organizations using those dimensions typically subtract the preparedness or confidence
score from the overall risk score to reflect a “reduction” in the risk due to the preparedness or
confidence in treatment. In this way, a risk can be displayed at its “inherent” level, prior to the
subtraction of the preparedness score, and then at its “residual” level after subtracting the
preparedness score.
In some industries, such as financial services, it may be possible to use modeling to assign a more
precise value on certain risks, and to estimate probabilities of occurrence. In those industries,
companies may use a model to quantify some risks, and use more qualitative assessments on other
risks.
At the other end of the spectrum, some organizations take a more simplistic approach and only use
descriptors such as “high, medium, or low”. The argument for using a more simplistic approach is that
the assessment is necessarily a subjective exercise, and therefore there may not be much value added in
more precisely defining each point on the scale.
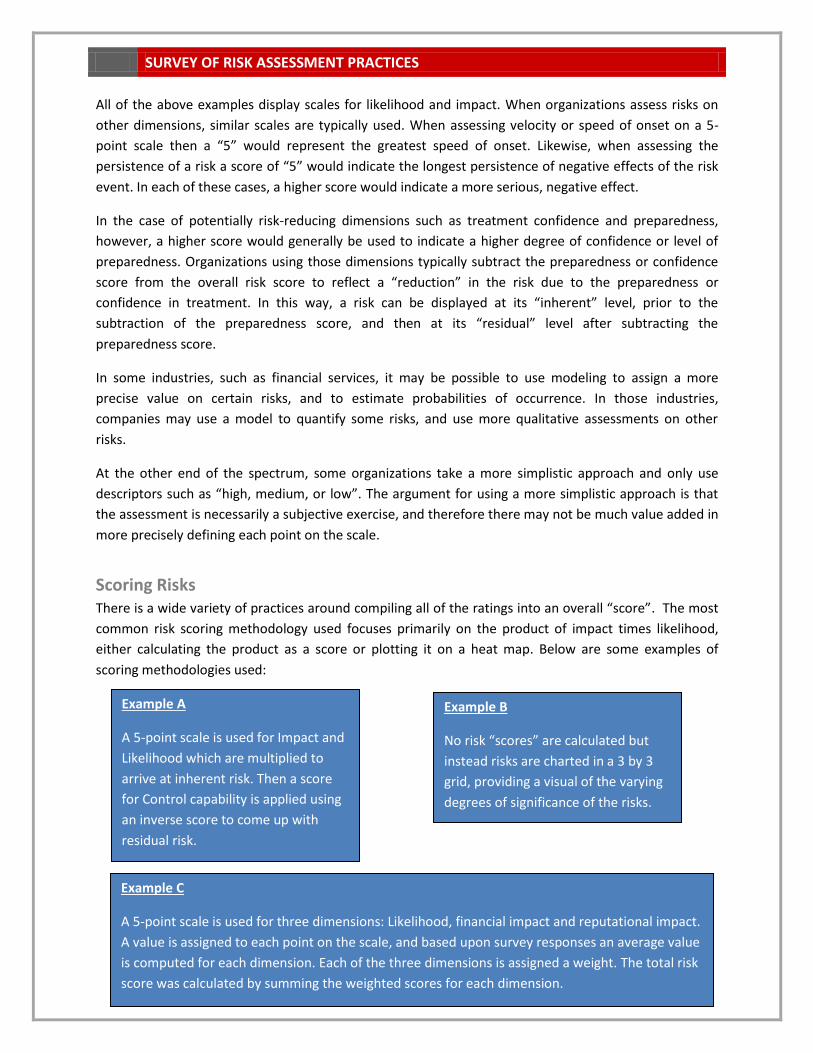
Scoring Risks There is a wide variety of practices around compiling all of the ratings into an overall “score”. The most
common risk scoring methodology used focuses primarily on the product of impact times likelihood,
either calculating the product as a score or plotting it on a heat map. Below are some examples of
scoring methodologies used:
Example B
No risk “scores” are calculated but
instead risks are charted in a 3 by 3
grid, providing a visual of the varying
degrees of significance of the risks.
Example A
A 5-point scale is used for Impact and
Likelihood which are multiplied to
arrive at inherent risk. Then a score
for Control capability is applied using
an inverse score to come up with
residual risk.
Example C
A 5-point scale is used for three dimensions: Likelihood, financial impact and reputational impact.
A value is assigned to each point on the scale, and based upon survey responses an average value
is computed for each dimension. Each of the three dimensions is assigned a weight. The total risk
score was calculated by summing the weighted scores for each dimension.
SURVEY OF RISK ASSESSMENT PRACTICES
8
The one commonality is that the risk scoring is not the final word. Every organization starts with the
scoring to prioritize the risks, but the organization then uses a meeting or workshop, typically with
senior management, to challenge the results. Through that process, additional information may be
gathered and discussed and risk rankings may be shifted. Having a challenge session allows individuals
to share their rationale for the risk rankings they have chosen. This exchange of information may cause
participants to see risks in a new light and potentially change their view of the significance of a specific
risk. Many practitioners also noted that the most important objective is to come up with the “top” risks
(8-15) facing the organization rather than to debate whether a particular risk is number 4 or 5 within the
group of top risks.
Appendix 1 includes a summary of the different risk assessment scales used by several organizations
providing input to this document. We have summarized them by industry and we provide an overview
of how they use the scales to develop risk scores to prioritize the top risks.
Use of Forced Rankings for Risk Assessment In a few cases, organizations have found that it is better to keep things simple, and therefore only ask
respondents to choose and rank order what they think are the top risks – either the top 3 or the top 10
risks. When doing so, individuals will obviously give some implicit consideration to dimensions like
likelihood and impact, but they are only asked to rank order the top risks.
There are several benefits to the forced rankings process. First, no assessment scales are needed when
organizations use this kind of forced rankings process. Second, the risk assessment process can be faster
to complete as compared to requiring individuals to assess a number of risks across multiple dimensions
(e.g., likelihood, impact, velocity, etc.). Third, this methodology typically results in more “separation” of
risk scores making it easier to identify the top risks. In contrast when risk scales are used, the individual
scores for a particular risks are averaged across all participants in the assessment process and those
scores often revert towards a mean that is often close to a 3.0 score, resulting in less dispersion of
scores across a number of risks. While the rank ordering may seem more subjective on the surface, it is
important to note that there is also a high degree of subjectivity when individuals make assessments on
the various dimensions discussed above. The next page contains two examples of the use of forced
rankings.
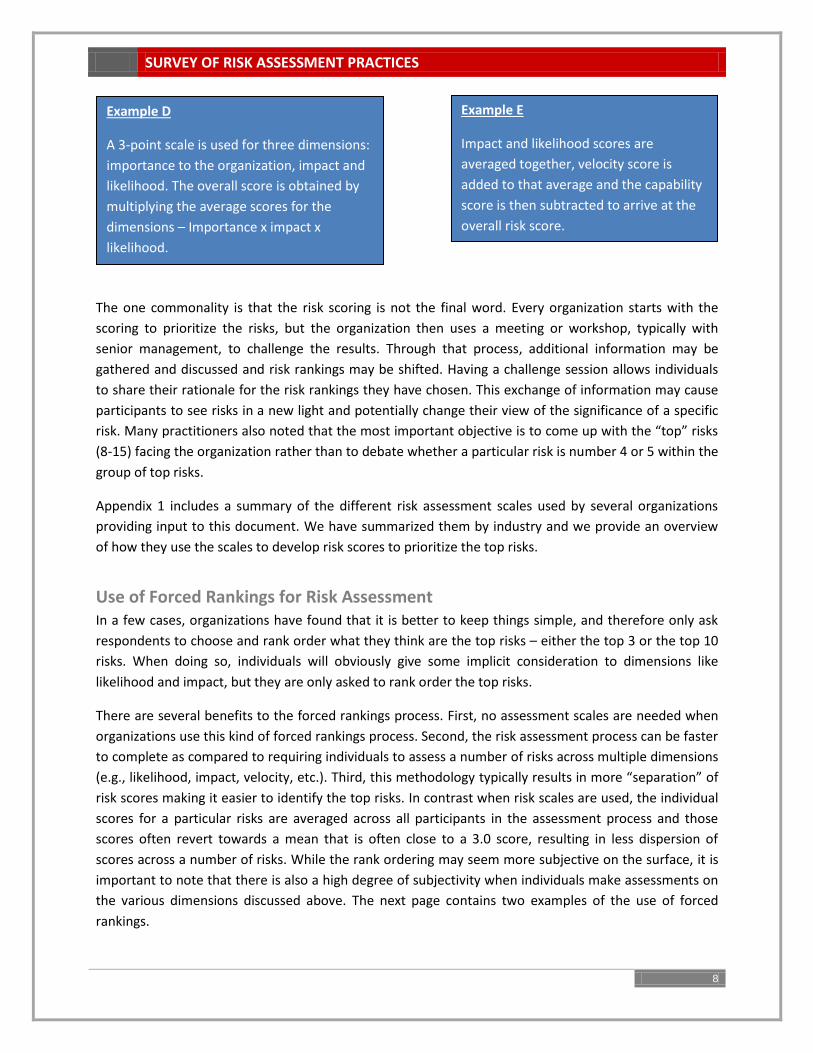
Example E
Impact and likelihood scores are
averaged together, velocity score is
added to that average and the capability
score is then subtracted to arrive at the
overall risk score.
Example D
A 3-point scale is used for three dimensions:
importance to the organization, impact and
likelihood. The overall score is obtained by
multiplying the average scores for the
dimensions – Importance x impact x
likelihood.
SURVEY OF RISK ASSESSMENT PRACTICES
9
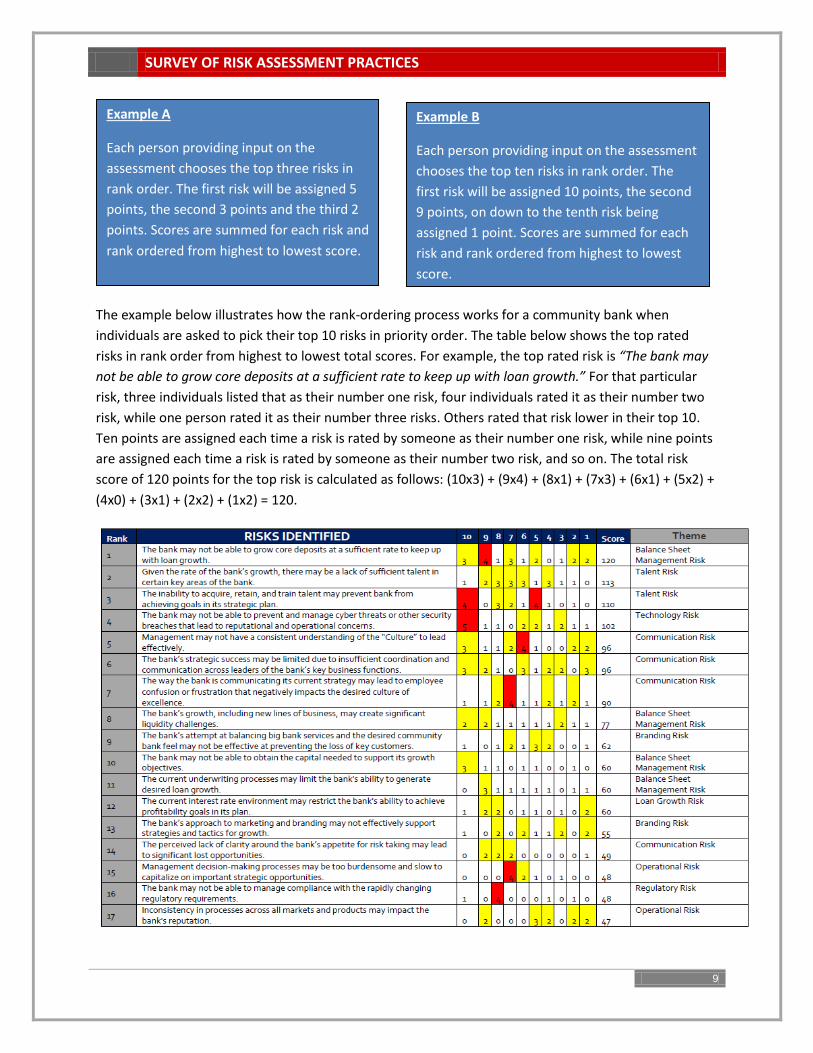
The example below illustrates how the rank-ordering process works for a community bank when
individuals are asked to pick their top 10 risks in priority order. The table below shows the top rated
risks in rank order from highest to lowest total scores. For example, the top rated risk is “The bank may
not be able to grow core deposits at a sufficient rate to keep up with loan growth.” For that particular
risk, three individuals listed that as their number one risk, four individuals rated it as their number two
risk, while one person rated it as their number three risks. Others rated that risk lower in their top 10.
Ten points are assigned each time a risk is rated by someone as their number one risk, while nine points
are assigned each time a risk is rated by someone as their number two risk, and so on. The total risk
score of 120 points for the top risk is calculated as follows: (10x3) + (9x4) + (8x1) + (7x3) + (6x1) + (5x2) +
(4x0) + (3x1) + (2x2) + (1x2) = 120.
Example A
Each person providing input on the
assessment chooses the top three risks in
rank order. The first risk will be assigned 5
points, the second 3 points and the third 2
points. Scores are summed for each risk and
rank ordered from highest to lowest score.
Example B
Each person providing input on the assessment
chooses the top ten risks in rank order. The
first risk will be assigned 10 points, the second
9 points, on down to the tenth risk being
assigned 1 point. Scores are summed for each
risk and rank ordered from highest to lowest
score.
SURVEY OF RISK ASSESSMENT PRACTICES
10
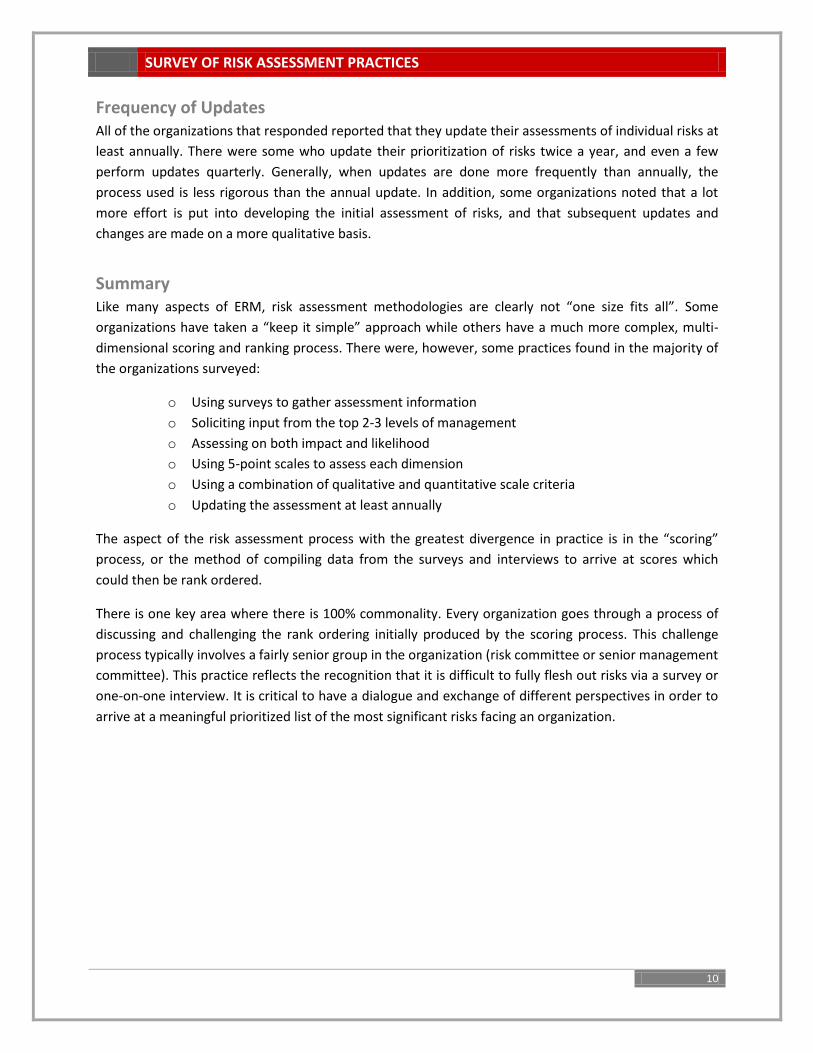
Frequency of Updates All of the organizations that responded reported that they update their assessments of individual risks at
least annually. There were some who update their prioritization of risks twice a year, and even a few
perform updates quarterly. Generally, when updates are done more frequently than annually, the
process used is less rigorous than the annual update. In addition, some organizations noted that a lot
more effort is put into developing the initial assessment of risks, and that subsequent updates and
changes are made on a more qualitative basis.
Summary Like many aspects of ERM, risk assessment methodologies are clearly not “one size fits all”. Some
organizations have taken a “keep it simple” approach while others have a much more complex, multi-
dimensional scoring and ranking process. There were, however, some practices found in the majority of
the organizations surveyed:
o Using surveys to gather assessment information
o Soliciting input from the top 2-3 levels of management
o Assessing on both impact and likelihood
o Using 5-point scales to assess each dimension
o Using a combination of qualitative and quantitative scale criteria
o Updating the assessment at least annually
The aspect of the risk assessment process with the greatest divergence in practice is in the “scoring”
process, or the method of compiling data from the surveys and interviews to arrive at scores which
could then be rank ordered.
There is one key area where there is 100% commonality. Every organization goes through a process of
discussing and challenging the rank ordering initially produced by the scoring process. This challenge
process typically involves a fairly senior group in the organization (risk committee or senior management
committee). This practice reflects the recognition that it is difficult to fully flesh out risks via a survey or
one-on-one interview. It is critical to have a dialogue and exchange of different perspectives in order to
arrive at a meaningful prioritized list of the most significant risks facing an organization.

SURVEY OF RISK ASSESSMENT PRACTICES
11
Appendix 1 – Examples of Company Practices by Sector
Sector Dimensions Scale Scoring
Consumer Goods
Consumer Goods 1
Impact 5 Point (higher= higher impact) Average of likelihood and impact minus effectiveness
plus velocity: ((Likelihood +Impact)/2) -
Effectiveness +Impact
Likelihood 5 Point (higher = higher likelihood)
Effectiveness 3 Point ( higher = more effective)
Velocity 3 Point ( higher = faster)
Consumer Goods 2
Likelihood ( Probability)
5 Point (higher= higher likelihood) Likelihood X Impact
Impact (Severity) 5 Point ( higher= higher impact)
Consumer Goods 3
Probability (Likelihood)
5 Point (higher= higher probability)
(Likelihood x Impact ) - Control
Impact (Severity) 5 Point (higher = higher Impact )
Control 5 Point (higher = higher control )
Services
Services 1 Importance/ Significance
3 Point (high = 3) Importance x Likelihood x Impact
Likelihood 3 Point (high = 3)
Impact 3 Point ( high = 3)
Services 2 Probability (Likelihood)
5 Point (higher= higher probability)
Likelihood x Impact
Impact (Severity) 5 Point (higher = higher impact )
Services 3 Likelihood 5 Point scale using .1, .2, .4, .8, and 1.0 probabilities (i.e., a score of 5 represents one with a 100% chance of occurrence).
Each of the three dimensions is given a weight based upon a separate analysis of the dimension’s relative importance and then the total risk score is calculated as follows: (likelihood average score x likelihood weight)+ (financial impact average score x financial impact weight) + reputation average score x reputation weight).
Financial Impact 5 Point scale using .05, .10, .25, .5, and 1.0.
Reputation Impact 5 Point scale using .1, .2, .3, .7, and 1.0.
SURVEY OF RISK ASSESSMENT PRACTICES
12
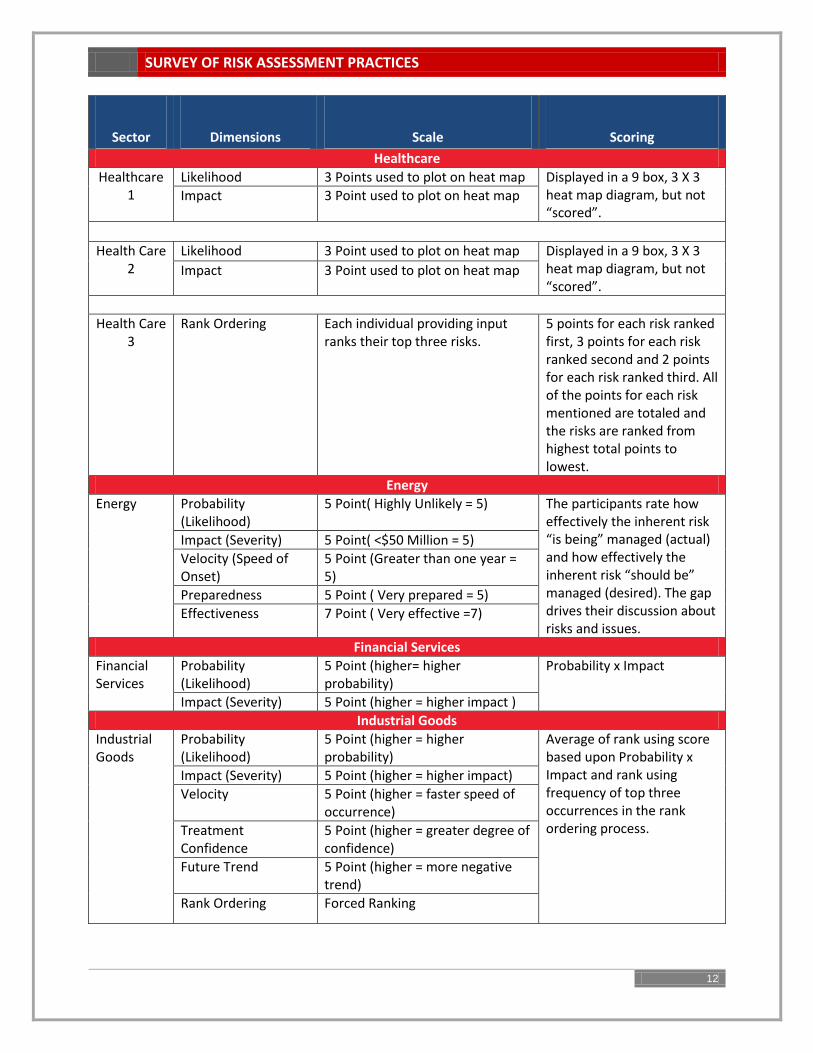
Sector Dimensions Scale Scoring
Healthcare
Healthcare 1
Likelihood 3 Points used to plot on heat map Displayed in a 9 box, 3 X 3 heat map diagram, but not “scored”.
Impact 3 Point used to plot on heat map
Health Care 2
Likelihood 3 Point used to plot on heat map Displayed in a 9 box, 3 X 3 heat map diagram, but not “scored”.
Impact 3 Point used to plot on heat map
Health Care 3
Rank Ordering Each individual providing input ranks their top three risks.
5 points for each risk ranked first, 3 points for each risk ranked second and 2 points for each risk ranked third. All of the points for each risk mentioned are totaled and the risks are ranked from highest total points to lowest.
Energy
Energy Probability (Likelihood)
5 Point( Highly Unlikely = 5) The participants rate how effectively the inherent risk “is being” managed (actual) and how effectively the inherent risk “should be” managed (desired). The gap drives their discussion about risks and issues.
Impact (Severity) 5 Point( <$50 Million = 5)
Velocity (Speed of Onset)
5 Point (Greater than one year = 5)
Preparedness 5 Point ( Very prepared = 5)
Effectiveness 7 Point ( Very effective =7)
Financial Services
Financial Services
Probability (Likelihood)
5 Point (higher= higher probability)
Probability x Impact
Impact (Severity) 5 Point (higher = higher impact )
Industrial Goods
Industrial Goods
Probability (Likelihood)
5 Point (higher = higher probability)
Average of rank using score based upon Probability x Impact and rank using frequency of top three occurrences in the rank ordering process.
Impact (Severity) 5 Point (higher = higher impact)
Velocity 5 Point (higher = faster speed of occurrence)
Treatment Confidence
5 Point (higher = greater degree of confidence)
Future Trend 5 Point (higher = more negative trend)
Rank Ordering Forced Ranking

SURVEY OF RISK ASSESSMENT PRACTICES
13
About ERM Initiative
The Enterprise Risk Management (ERM) Initiative in the Poole College of Management at North Carolina
State University is pioneering thought-leadership about the emergent discipline of enterprise risk
management, with a particular focus on the integration of ERM in strategy planning and governance.
The ERM Initiative conducts outreach to business professionals through executive education and its
internet portal (http://www.erm.ncsu.edu); research advancing knowledge and understanding of ERM
issues; and undergraduate and graduate business education for the next generation of business
executives. Faculty in the ERM Initiative frequently work with boards of directors and senior
management teams helping them link ERM to strategy and governance.
Author Bio Bonnie V. Hancock, M.S., is the Executive Director of the ERM Initiative at NC State University where
she also teaches graduate and undergraduate courses in the Poole College of Management. Her
background includes various executive positions at Progress Energy where she has served as president
of Progress Fuels (a Progress Energy subsidiary with more than $1 billion in assets), senior vice president
of finance and information technology, vice president of strategy and vice president of accounting and
controller. She currently serves on the following corporate boards: AgFirst Farm Credit Bank where she
chairs the risk policy committee, Office of Mortgage Settlement Oversight where she chairs the audit
committee, Powell Industries, a publicly traded company based in Houston, Texas, where she serves on
both the compensation and audit committees, and North Carolina Coastal Pines Girl Scout Council
where she chairs the audit committee
Contact the ERM Initiative at: [email protected] or 919.513.0901.