Embed Size (px)
Citation preview
Survival of adult spring/summer
Chinook salmon (Oncorhynchus tshawytscha)
through the estuary and lower Columbia River
amid a rapidly changing predator population
A. Michelle Wargo Rub, Ben Sandford, Don Van Doornik, David Teel, Matthew Nesbit,
Samuel Rambo, Jesse Lamb, Louis Tullos, Kinsey Frick, April Cameron,
Nicholas Som, Mark Henderson, and David Huff
NOAA Fisheries Northwest Fisheries Science Center (NWFSC)
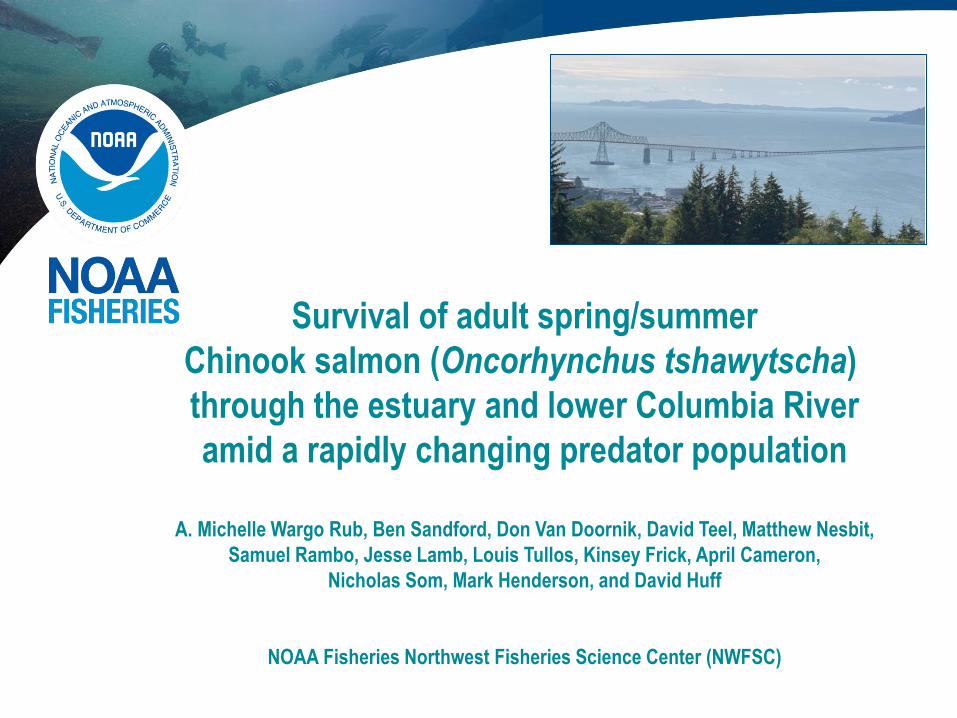
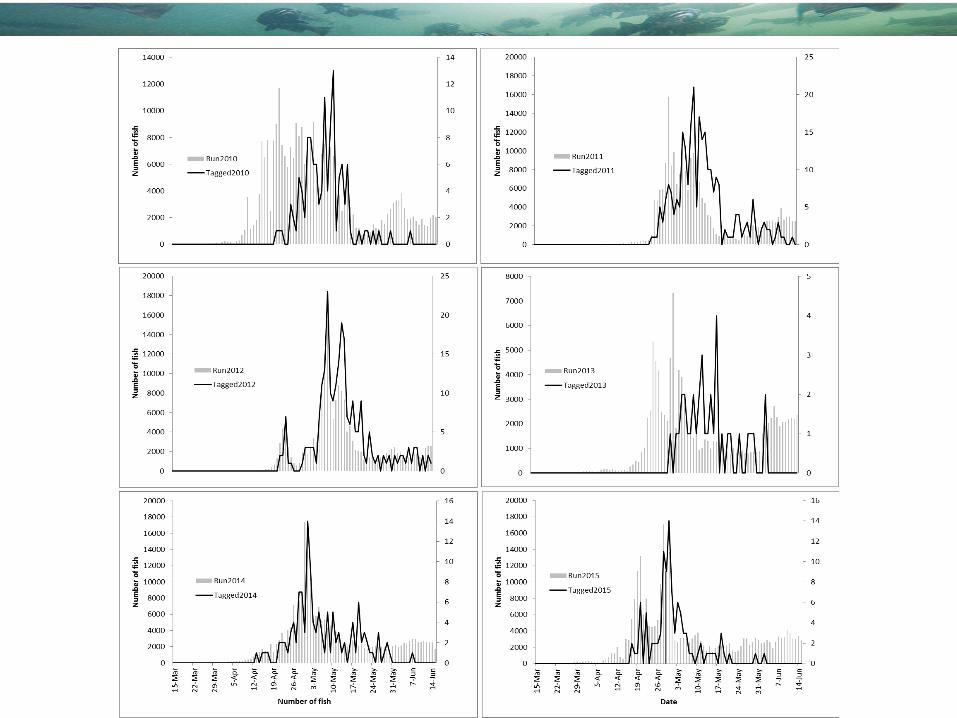
The primary goal of this study is to
provide estimates of survival and run
timing through the estuary and lower CR
for spring/summer Chinook salmon
returning to the Snake &
Middle & Upper Columbia Rivers
Map by Tyler Nodine, Ocean Associates, Inc, Seattle, WA
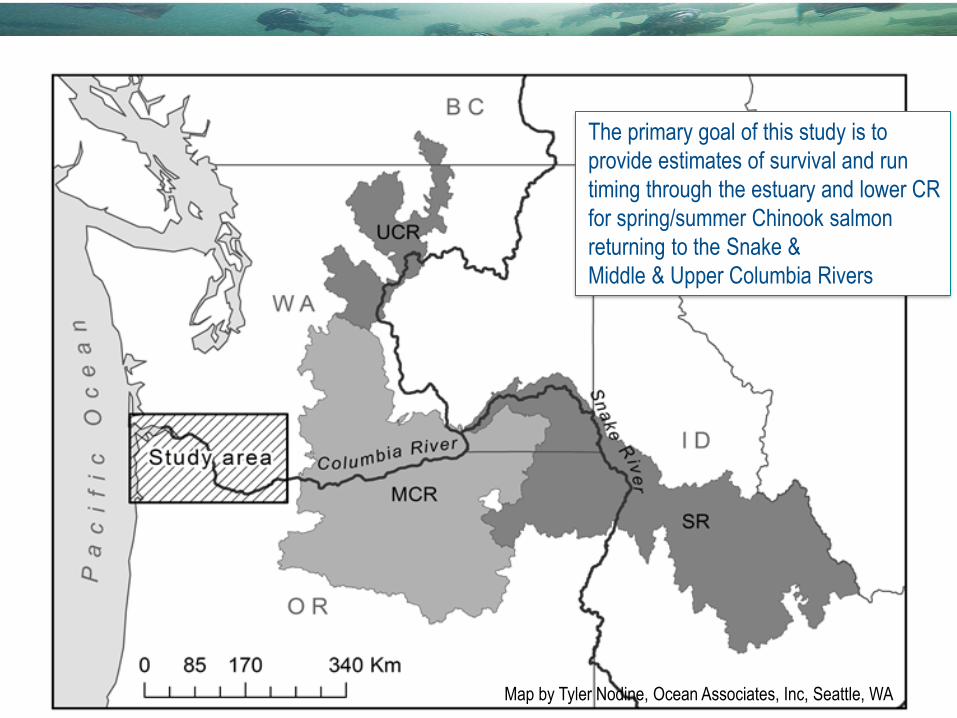
Map by Tyler Nodine, Ocean Associates, Inc, Seattle, WA
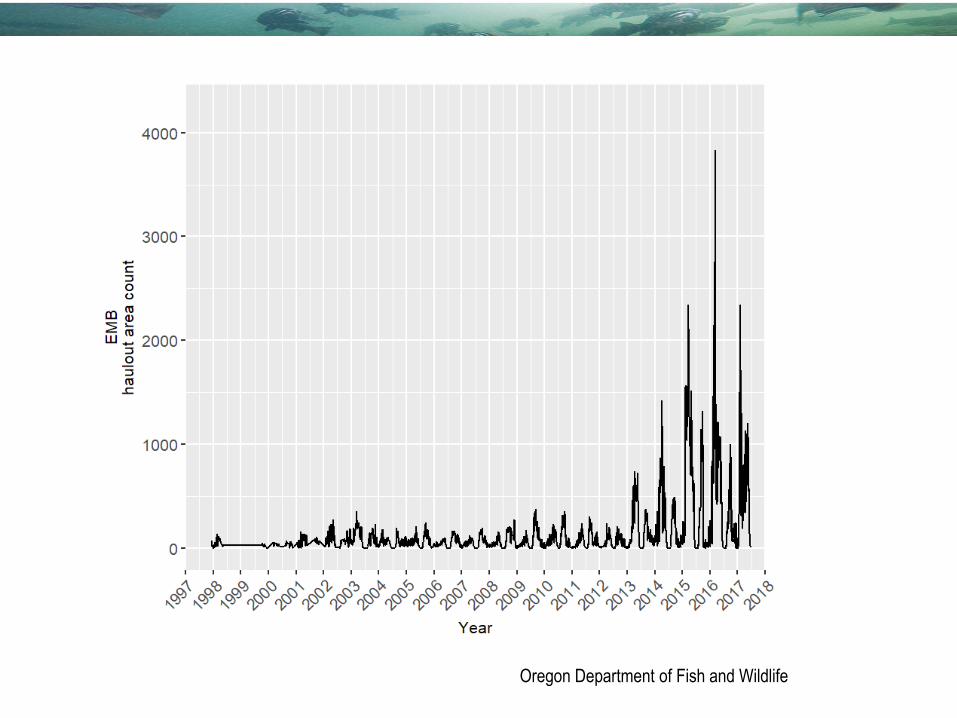
Oregon Department of Fish and Wildlife
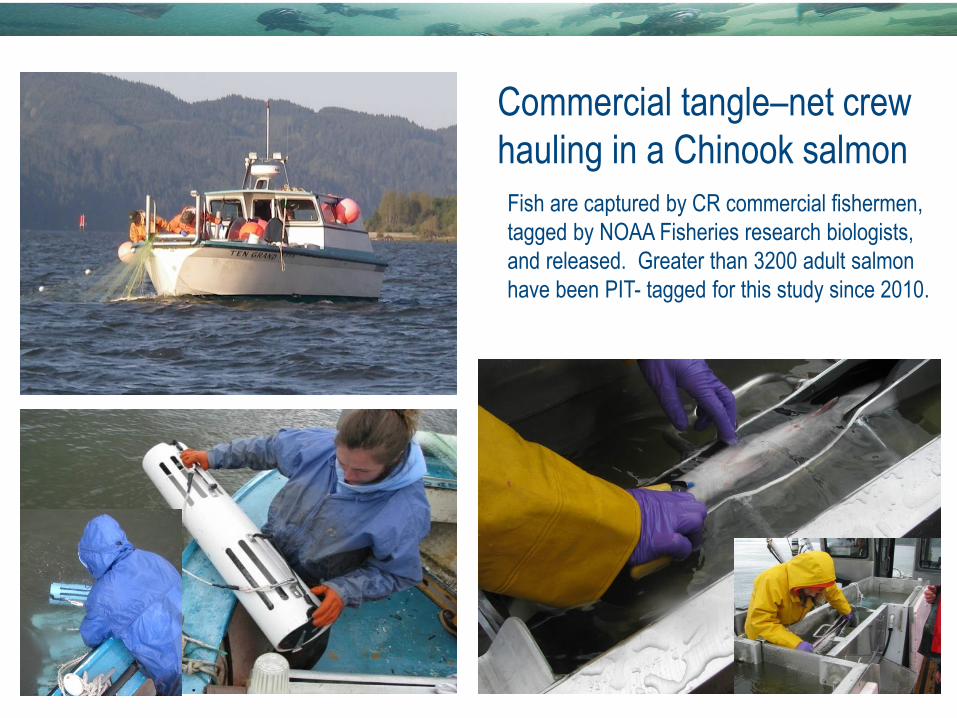
Commercial tangle–net crew
hauling in a Chinook salmon
Fish are captured by CR commercial fishermen,
tagged by NOAA Fisheries research biologists,
and released. Greater than 3200 adult salmon
have been PIT- tagged for this study since 2010.
YearAdult Chinook
salmon (N)
Range of sampling
dates
Baseline Survival
(95% CI)Baseline Mortality Run Size (% Harvest)
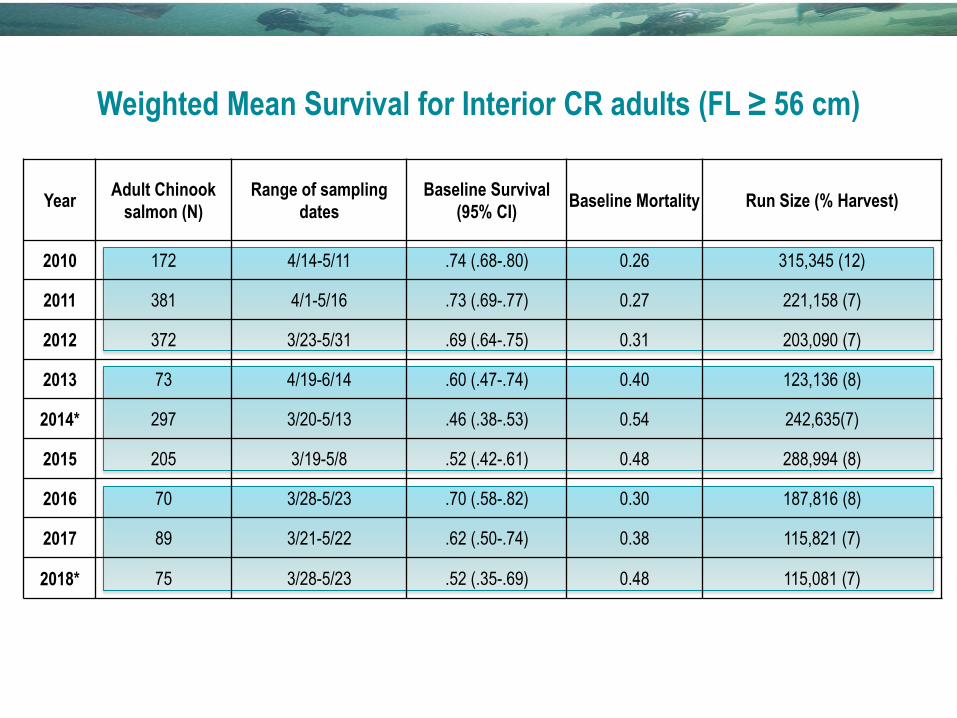
2010 172 4/14-5/11 .74 (.68-.80) 0.26 315,345 (12)
2011 381 4/1-5/16 .73 (.69-.77) 0.27 221,158 (7)
2012 372 3/23-5/31 .69 (.64-.75) 0.31 203,090 (7)
2013 73 4/19-6/14 .60 (.47-.74) 0.40 123,136 (8)
2014* 297 3/20-5/13 .46 (.38-.53) 0.54 242,635(7)
2015 205 3/19-5/8 .52 (.42-.61) 0.48 288,994 (8)
2016 70 3/28-5/23 .70 (.58-.82) 0.30 187,816 (8)
2017 89 3/21-5/22 .62 (.50-.74) 0.38 115,821 (7)
2018* 75 3/28-5/23 .52 (.35-.69) 0.48 115,081 (7)
Weighted Mean Survival for Interior CR adults (FL ≥ 56 cm)
Additional sources of mortality
• Straying
• Disease
• Capture and handling
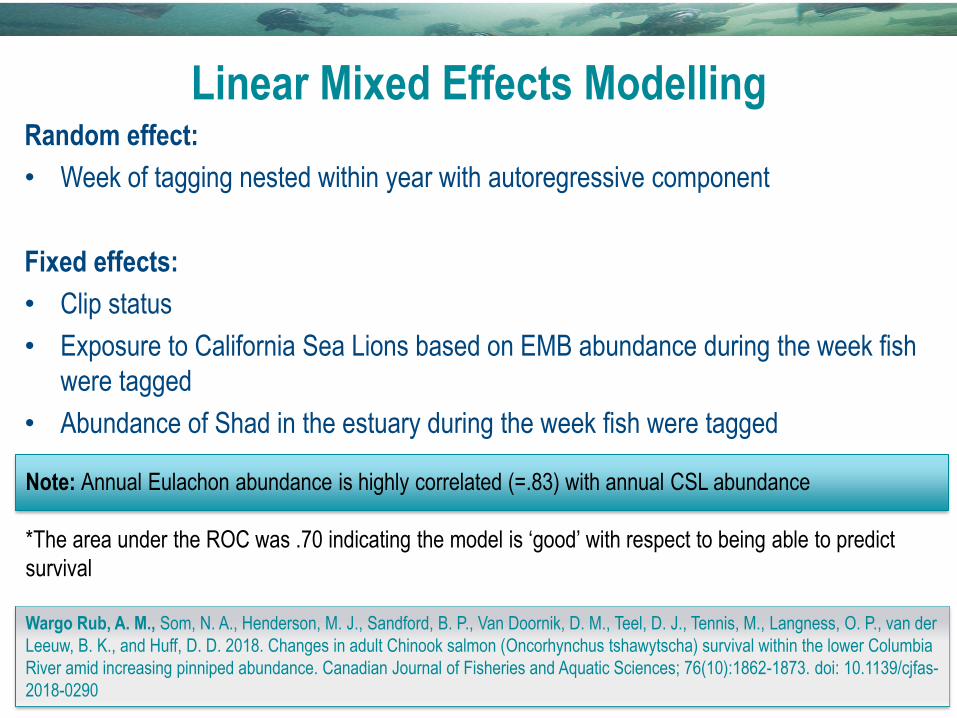
Note: Annual Eulachon abundance is highly correlated (=.83) with annual CSL abundance
*The area under the ROC was .70 indicating the model is ‘good’ with respect to being able to predict
survival
Wargo Rub, A. M., Som, N. A., Henderson, M. J., Sandford, B. P., Van Doornik, D. M., Teel, D. J., Tennis, M., Langness, O. P., van der
Leeuw, B. K., and Huff, D. D. 2018. Changes in adult Chinook salmon (Oncorhynchus tshawytscha) survival within the lower Columbia
River amid increasing pinniped abundance. Canadian Journal of Fisheries and Aquatic Sciences; 76(10):1862-1873. doi: 10.1139/cjfas-
2018-0290
Linear Mixed Effects ModellingRandom effect:
• Week of tagging nested within year with autoregressive component
Fixed effects:
• Clip status
• Exposure to California Sea Lions based on EMB abundance during the week fish
were tagged
• Abundance of Shad in the estuary during the week fish were tagged
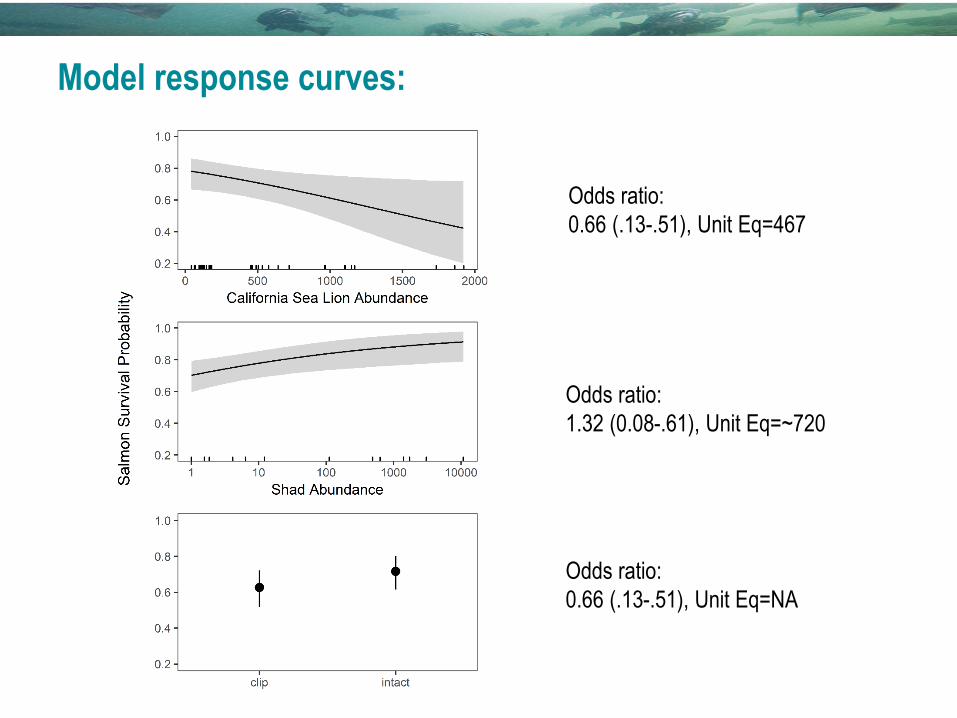
Model response curves:
Odds ratio:
0.66 (.13-.51), Unit Eq=467
Odds ratio:
1.32 (0.08-.61), Unit Eq=~720
Odds ratio:
0.66 (.13-.51), Unit Eq=NA
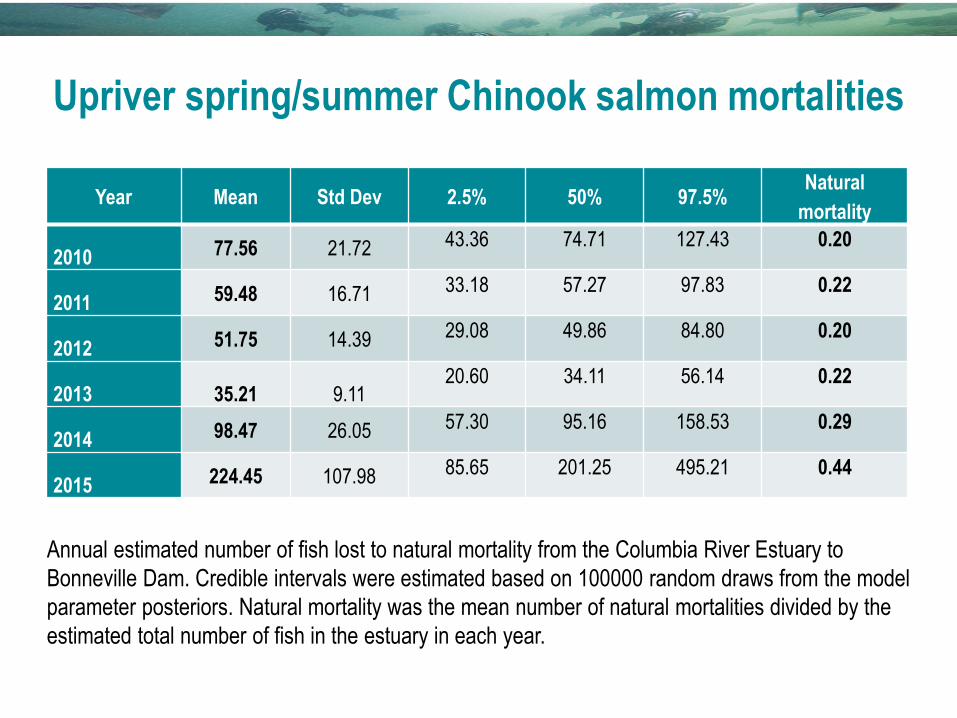
Upriver spring/summer Chinook salmon mortalities
Year Mean Std Dev 2.5% 50% 97.5%Natural
mortality
2010 77.56 21.72 43.36 74.71 127.43 0.20
2011 59.48 16.71 33.18 57.27 97.83 0.22
2012 51.75 14.39 29.08 49.86 84.80 0.20
2013 35.21 9.1120.60 34.11 56.14 0.22
2014 98.47 26.05 57.30 95.16 158.53 0.29
2015 224.45 107.98 85.65 201.25 495.21 0.44
Annual estimated number of fish lost to natural mortality from the Columbia River Estuary to
Bonneville Dam. Credible intervals were estimated based on 100000 random draws from the model
parameter posteriors. Natural mortality was the mean number of natural mortalities divided by the
estimated total number of fish in the estuary in each year.

Collaborative effort with ODFW & WDFW to track pinnipeds and fish
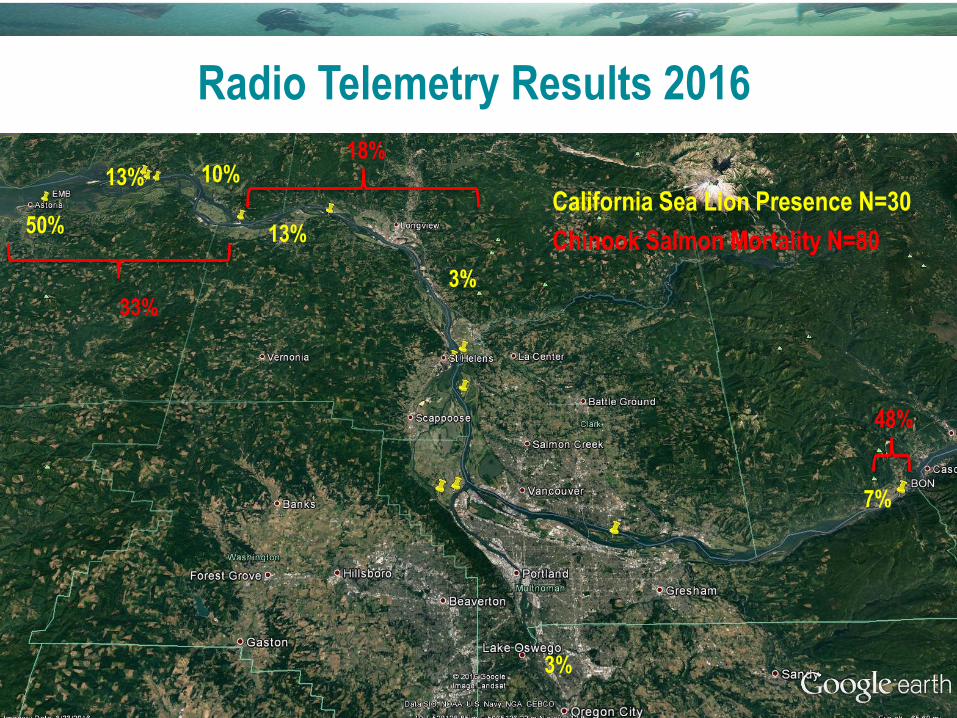
Radio Telemetry Results 2016
50%
13%
3%
7%
10%
3%
13%
33%
18%
48%
California Sea Lion Presence N=30
Chinook Salmon Mortality N=80
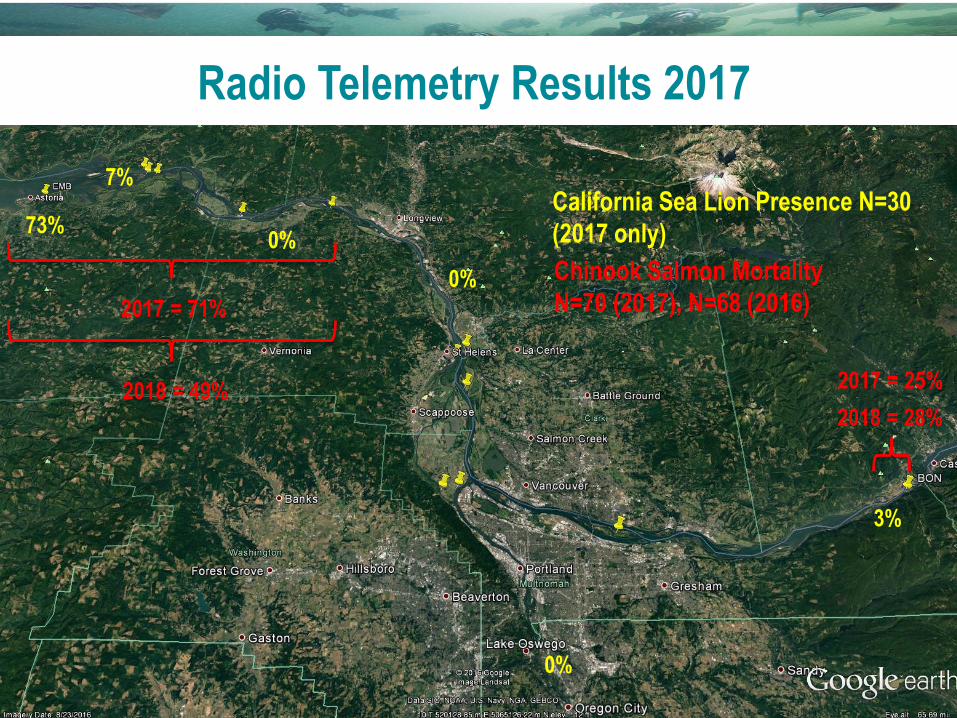
Radio Telemetry Results 2017
73%
7%
0%
3%
0%
0%
2017 = 71%
2017 = 25%
California Sea Lion Presence N=30
(2017 only)
Chinook Salmon Mortality
N=70 (2017), N=68 (2016)
2018 = 49%2018 = 28%
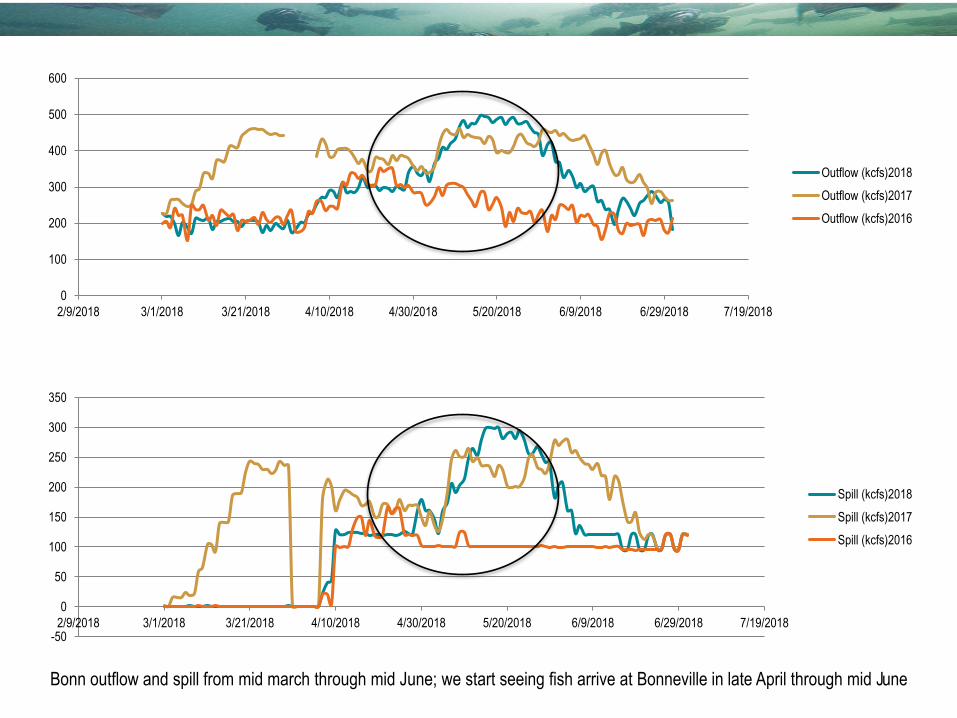
0
100
200
300
400
500
600
2/9/2018 3/1/2018 3/21/2018 4/10/2018 4/30/2018 5/20/2018 6/9/2018 6/29/2018 7/19/2018
Outflow (kcfs)2018
Outflow (kcfs)2017
Outflow (kcfs)2016
-50
0
50
100
150
200
250
300
350
2/9/2018 3/1/2018 3/21/2018 4/10/2018 4/30/2018 5/20/2018 6/9/2018 6/29/2018 7/19/2018
Spill (kcfs)2018
Spill (kcfs)2017
Spill (kcfs)2016
Bonn outflow and spill from mid march through mid June; we start seeing fish arrive at Bonneville in late April through mid June
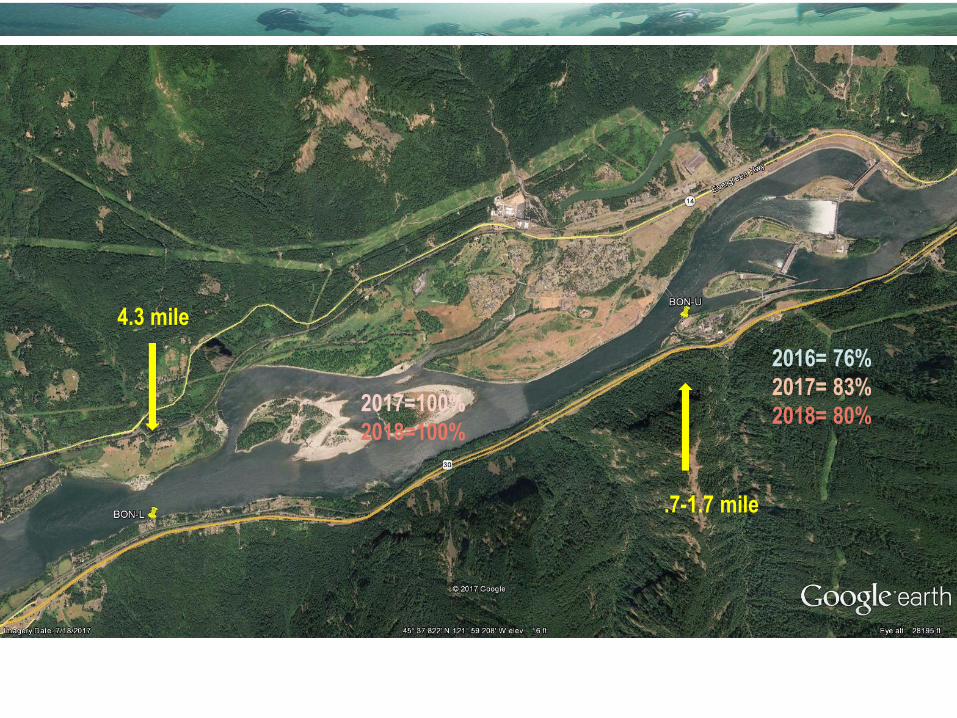
2016= 76%
2017= 83%
2018= 80%2017=100%
2018=100%
4.3 mile
.7-1.7 mile
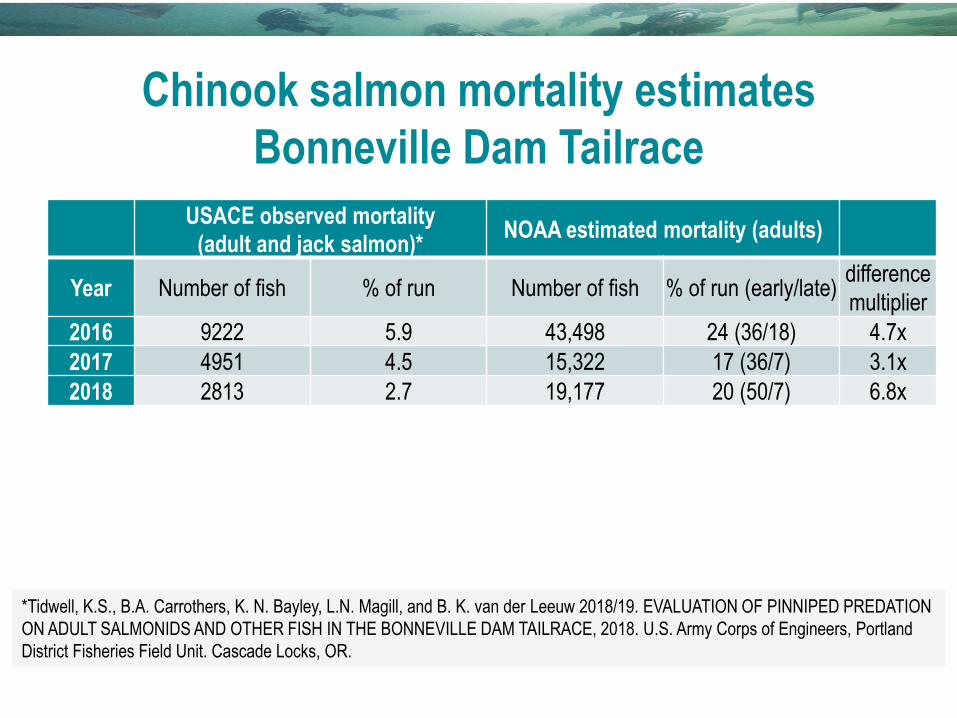
USACE observed mortality
(adult and jack salmon)*NOAA estimated mortality (adults)
Year Number of fish % of run Number of fish % of run (early/late)difference
multiplier
2016 9222 5.9 43,498 24 (36/18) 4.7x
2017 4951 4.5 15,322 17 (36/7) 3.1x
2018 2813 2.7 19,177 20 (50/7) 6.8x
Chinook salmon mortality estimates
Bonneville Dam Tailrace
*Tidwell, K.S., B.A. Carrothers, K. N. Bayley, L.N. Magill, and B. K. van der Leeuw 2018/19. EVALUATION OF PINNIPED PREDATION
ON ADULT SALMONIDS AND OTHER FISH IN THE BONNEVILLE DAM TAILRACE, 2018. U.S. Army Corps of Engineers, Portland
District Fisheries Field Unit. Cascade Locks, OR.
Recap• We have identified significant mortality that is unexplained by harvest
and handling for upriver spring/summer Chinook salmon
• This mortality appeared to peak during 2015 at approximately 200k
fish.
• Pinniped predation is likely the primary source of mortality but not all
animals are equal with respect to the impact they are having on
returning fish
• Additional covariates potentially influencing survival include the clip
status, river flow, and the abundance and timing of alternative prey
species such as eulachon and shad
Susan Hinton, George McCabe, Paul Bentley, and Bob Emmett of NOAA
Fisheries Pt. Adams Research Station, Jim Simonson and crew of NOAA
Fisheries Pasco Research Station, Laurie Weitkamp of NOAA Fisheries NWFSC,
Newport Research Station, David Kuligowski of NOAA Fisheries NWFSC,
Manchester Research Station, John Hess, Doug Hatch & Ryan Brandstetter of
CRITFC, Jason Romine and Mike Parsley of USGS, Chris Kern and Geoffrey
Whisler, Matt Tennis, Bryan Wright, Robin Brown of ODFW, Steve Jeffries of
WDFW, Matt Campbell of IDF&G, Brian, Frank, & Stephanie Tarabochia, and Dan
Marvin of Astoria, OR, Sean Hayes of NOAA Fisheries SWFSC, Kane
Cunningham & Colleen Reichmuth of the Institute of Marine Sciences, Long
Marine Laboratory, UCSC, NOAA Near Term Priority (2010 & 2011) and NOAA
Fisheries Cooperative Research (2012, 2013, & 2014), Albert Little, Wyatt Wullger,
Ben Rudolph, & Cody May of Ocean Associates, Dave Caton & Lila Charlton of
PSMFC
Acknowledgements: