Embed Size (px)
Citation preview

Sustainable Engagement in the Indian and Finnish Business
Kaisa Sorsa &Manodip Ray Chaudhuri (eds.)
99 Comments

Kaisa Sorsa & Manodip Ray Chaudhuri (eds.)
Sustainable Engagement in the Indian and Finnish Business

441 729Painotuote
Comments from Turku University of Applied Sciences 99
Turku University of Applied SciencesTurku 2018
ISBN 978-952-216-704-0 (pdf)ISSN 1459-7756 (electronic)
Cover photos: Unsplash/Mayra Perez and Shutterstock
Distribution: http://loki.turkuamk.fi

Table of contents
Preface ................................................................................................................. 4
Co-branding with Collective Sustainability Schemes – Challenges and Opportunities for Sustainable Governance ...................................................... 6 Kaisa Sorsa & Manodip Ray Chaudhuri
Sustainable Blue Growth and Maritime Spatial Planning ................................. 19Anu Lähteenmäki-Uutela, Sari Repka, Teemu Haukioja, Thaysa Portela de Carvalho & Tuomas Pohjola
Sustainability Model to Favour Healthcare Enrichment .................................... 47Abhijit Pandit
Business Sustainability – Case Study of HUL and McDonald’s ....................... 70Meenakshi Khemka
Role of Frontline Employees’ Job Satisfaction in Sustainable Development of Modern Retail Organizations ...................................................... 85Kriti Priya Gupta & Preeti Bhaskar
Exploring Private Participation in Indian Water Sector: Issues and Options .........................................................................................................119Tirthankar Nag, Juha Kettunen & Kaisa Sorsa

4 Sustainable Engagement in the Indian and Finnish Business
PrefaceAt the juncture when on-shore and off-shore corporations are striving intensely for work process survival and are consistently in the drive for exploration to make an earnest attempt to be the most adaptable in the word of business, the editors of this book present a humble endeavor towards an assimilation of research papers on business process sustenance from various authors of two specific countries, Finland and India. The book has been conceived by the editors from Finland and India under the banner of a two-year (2016–18) Finland-India project on sustainable business, led by the Centre for International Mobility (CIMO), Finland and mentored by Turku University of Applied Sciences (TUAS), Turku, Finland.
The moot point behind the project has been to delve into the depths of the work practices in selected Finnish and Indian businesses to have a clear understanding of the process planning approaches, functional strategies and their mode of implementations, hurdles and hassles, and identifying ways and means to achieve sustainability in the long run in the operational way. The idea has been to understand business operations towards sustainability in the contexts of two significantly distinctive cultures, namely Europe and Asia, by looking into businesses in Finland and India on a practical tune.
This publication envisages a detailed understanding of the notion of business sustainability in its real terms as it unfolds a set of six selected research papers from diverse vistas. The book focuses on a commendable and estimable sundry array of literature and related heterogeneous approaches in investigation of the same, keeping in mind a uniquely pivotal and focal alignment of areas of concern in the modern-day business prevailing in Finland, a leading European developed nation, and India, a leading developing economy in south Asia. The tone and matter of the book revolves broadly around quite an assorted platter for academic reading: co-branding and collective sustainability, blue growth and maritime spatial planning, the element of sustainability in healthcare, business sustainability in typical manufacturing domains and service domains, frontline employees in retail organizations and exploration of private participation in water treatment and distribution business.

5 Sustainable Engagement in the Indian and Finnish Business
The book is a very modest and unpretentious presentation by the editors with support of all the chapter authors, TUAS and CIMO, to reach out to the academicians, scholars and readers who are desirously looking forward to further their study and understanding of sustainability of business in the real sense of the term, across nations and cultural boundaries.
Dr. Manodip Ray Chaudhuri
Associate Professor in Management (HR & OB) Xavier Business School St. Xavier’s University Kolkata, India

6 Sustainable Engagement in the Indian and Finnish Business
Dr. Kaisa Sorsa Principal Lecturer, Research Group Leader Turku University of Applied Sciences, Finland Dr. Manodip Ray Chaudhuri Associate Professor in Management (HR & OB) Xavier Business School St. Xavier’s University Kolkata, India
Abstract
Co-branding involves the combination of two well-known brands. It is used to leverage strong brands. The aim of the article is to discuss the challenges and opportunities of co-branding with a collectively owned trademark using an ecolabel as a communication tool of sustainability. The article focuses only on the alliance of a collectively owned sustainability brand and product or service brand. First, the definitions of co-branding will be discussed. Secondly, the challenges and opportunities of co-branding in the context of sustainable governance will be analyzed. Finally, the role of co-branding for sustainable governance in the future will be discussed.
Co-branding with Collective Sustainability Schemes – Challenges and Opportunities for Sustainable Governance

7 Sustainable Engagement in the Indian and Finnish Business
1. Introduction
Corporations and nongovernmental organizations (NGOs) create partnerships and use these relationships as part of their corporate social responsibility (CSR) activities. One way to use them is co-branding. (Poret, 2014). Historically, the attention has focused on product or ingredient co-branding. (Blackett & Boad, 1999). Only a few research works have been found, in which collectively owned ecolabels has been referred as a means of co-branding (Leslie, 2012, 148; Martin & Schouten, 2012; Lihhavtshuk, 2015, 28).
According to the global ecolabeling network, “an ecolabel is a label which identifies overall environmental preference of a product (i.e., good or service) within a product category based on life cycle considerations. In contrast to a self-styled environmental symbol or claim statement developed by a manufacturer or service provider, an ecolabel is awarded by an impartial third party to products that meet established environmental leadership criteria.” (GEN, 2004). The International Standardization Organization has undertaken efforts to attempt to standardize the principles, practices, and key characteristics relating to three major voluntary environmental labeling types:
Type I - environmental labeling (i.e. ecolabels): These are usually established by an initiator (public or private) independent from the producers, distributors, and sellers of the labeled products. Products supplied by organizations or resources that are certified are then labeled with information to the consumers that the product was produced in an “environmentally friendly” fashion. The label (seal) is typically licensed to a producer and may appear on or accompany a product derived from a certified producer. Producers are usually expected to track the “chain of custody” of their products in order to ensure that the products derived from the certified producer are in fact those that are so labeled.
Type II – self-declaration claims: These are established by industry associations for their members’ products. The members elaborate the certification criteria, sometimes by drawing upon external expertise from academia and environmental organizations. Verification of compliance is achieved through internal certification procedures within the industry, or by employment of external certifying companies.
Type III – environmental declarations (e.g., report cards/information labels): These are established by individual companies based on their own product standards. The standards might be based on criteria related to specific environmental issues known to informed consumers through the media or advertising. This form of ecolabeling can also be referred to as “self-declaration.” This definition emphasizes the environmental aspects of the sustainability. In co-branding, the labels focusing on social responsibility are as well possible for co-branding purposes.

8 Sustainable Engagement in the Indian and Finnish Business
Ecolabels are typically collectively owned marks. Collective marks are usually defined as signs which distinguish the geographical origin, material, mode of manufacture, or other common characteristics of goods or services of different enterprises using the collective mark. The owner may be either an association of which those enterprises are members or any other entity, including a public institution or a cooperative. (WIPO, 2017). These marks and the criteria system behind them are developed in a multi-stakeholder group. The creation of the collective mark, in fact, must go hand in hand with the development of certain standards and criteria and a common strategy. (WIPO 2017). Multi-stakeholder initiatives have emerged as one of the dominant regulatory approaches in the recent years. Some of the schemes have also designed an ecolabel in order to use the scheme as a communication tool in green marketing. (Sorsa 2011; Lihhavtshuk, 2015).
Ecolabels can be perceived as brands (Lihhavtshuk, 2015; Loimukoski, 2016). For example, Reilukauppa – Fairtrade is a strong co-branding tool in sustainability marketing, and in most cases the Fairtrade logo adds credibility to the product’s brand. (Lihhavtshuk, 2015, 77). There is much differentiation between industry sectors in the use of ecolabels or ethical labels.
The history and evolution of ecolabels and certification varies dramatically from one sector to another. In some sectors, concerns related to personal health and safety have been the primary forces behind the certification efforts (e.g., textiles and apparel) whereas other sectors have prioritized broader environmental or social considerations (e.g., forestry). Sectors also vary based on the maturity of the leading systems used to certify products, the relative roles of different sponsoring organizations, the level of consumer awareness, global application, and a variety of other factors. (Golden, 2010). For instance, Norwegian consumers know little about ecolabeled garments as almost none are available on the market. Therefore, consumers who want to make environmentally sound choices have to act based on other information. (Laitala & Klepp, 2013). The three most important issues that textile and apparel ecolabels cover are human health and safety (i.e., Oeko-Tex), environmental pollution (i.e., GOTS), and worker’s rights (i.e., Fair Trade). The labels that have emerged or are emerging as leaders in this space have one key thing in common—they all aim to cover the entire supply chain for textiles and apparel, from raw materials through cut-and-sew operations. (Golden, 2010).
The landscape of sustainability labels is dominated by environmental as opposed to social metrics. This is consistent with the content of supply chain management literature research, which also still favors environmental issues. (Golden, 2010). Seuring and Muller (2008) note that integration of the three dimensions of sustainability and social metrics are rare. There are some fashion brands slowly adapting into sustainable practices, according to Rank a Brand, an NGO that ranks sustainability. However, a large number of the fashion brands researched create the impression that they are doing the right thing for sustainability, but then fail to produce relevant and tangible information about the action they are taking, a concept called “greenwashing” (Rayapura, 2014).

9 Sustainable Engagement in the Indian and Finnish Business
This shows a need for quantitative metrics on clothing labels to 1) raise awareness in consumers and 2) demand responsibility from brands to accurately convey and improve what is happening down the supply chain, which most likely needs the consistency and verification from 3) third-party auditing. The label study shows that consumers are more aware and affected by socially responsible labeling than before. According to Hyllegard’s research in 2012, approximately 60% of participants actively look at hangtag information, whereas a 2005 British study showed that only 11% of British consumers read apparel hangtags. Hyllegard’s study also showed that garments labeled explicitly with SSR information with an official third-party logo provided the best results regarding the consumer perception of the brand and purchase intention. (Hyllegard et al., 2012). Critically reviewing the study, the hangtag labels and fictitious brand “GOOD CLOTHES” created for the study was entirely theoretical and may have resulted in theoretical results, based on ideology but not genuine purchase behavior.
The company specific ecolabels and programs are excluded from the analysis. For instance, Nestlé’s Nespresso AAA program is one example of a company specific system. (The Nespresso AAA Sustainable Quality™ Program was launched in 2003. At the end of 2015, the AAA Program counted over 70,000 coffee farmers in 12 coffee-growing countries.)
This article will fill the knowledge gap discussing the emergence of co-branding between collectively owned ecolabels (brands) and company owned product or service brands. The use of ecolabels in co-branding is gaining popularity in Finland. This study argues that ecolabels can be independently perceived as brands. For example, in Finland, one of the oldest ecolabels, Fairtrade, is perceived to be one of the most well-known ecolabel brands in Finland. According to the Ecolabel Index, there are currently 38 ecolabels represented in Finland.
Typically, a collectively owned brand is owned by the organization governing the multi-stakeholder initiative focusing on sustainability issues, e.g. Fair Trade, Utz Certified, Rainforest Alliance etc. The multi-stakeholder organization creates governance schemes in which NGOs, multilateral, and other organizations together create criteria, certification system, and typically trade mark in order to encourage companies to participate in the schemes. These schemes set social and environmental standards, monitor compliance, promote social and environmental reporting and auditing, certify good practice, and encourage stakeholder dialogue and social learning. (Utting, 2002).

10 Sustainable Engagement in the Indian and Finnish Business
2. Co-branding
Branding in general is viewed as a certain activity by the producer that aims to reach its customer group by the visual identity and message created for the product or service. Branding is described as a name, symbol, design, or a combination of these, which assists in identifying the brand with a unique sustainable competitive advantage (Keller & Lehmann, 2006). Co-branding, instead, can be defined when “two or more well-known brands are combined into a joint market offering or marketed together in some fashion.” (Kotler et al. 2009, 431). A co-branding strategy provides a tool for differentiation that leverages brands through the transfer of positive associations, such as brand-quality, image, or awareness, from one brand to another (McCarthy & Norris, 1999; Simonin & Ruth, 1998; Washburn, Till & Priluck, 2000). For example, associations of SMEs may register collective marks in order to jointly market the products of a group of SMEs and enhance product recognition. (WIPO, 2017).
In order to protect a single brand, the company needs to register its brand as a trademark according to the intellectual property right legislation. A collective trademark is an IP instrument recognized in legislation as a special form of trademark but which fulfils similar roles.
In order to understand the challenges and opportunities of co-branding, we need to use the concept of brand equity. When a company uses co-branding, it may either raise or lower its brand equity. Aaker (1991) defined brand equity as a set of brand assets and liabilities linked to a brand name and symbol, which add to or subtract from the value provided by a product or service. Brand equity has four dimensions—brand loyalty, brand awareness, brand associations, and perceived quality, each providing value to a firm in numerous ways. Brand equity also provides value to customers. It enhances the customer’s ability to interpret and process information, improves confidence in the purchase decision, and affects the quality of the user experience. As consumers in developed markets have become more aware of the social, ethical, and environmental effects of a brand, so too have marketers become more involved with tracking the extent to which social, ethical, and environmental factors can affect a brand’s equity—its value to a company. The term brand social equity is now being used to refer to the value attributed to a brand based on consumer evaluation of the brand’s contribution to wider society. (Lexicon, 2017).
There is a diverse array of potential drivers for business to adopt certification and ecolabel and use it in co-branding. These drivers include reducing risk, differentiating products from competitors, finding new efficiency and cost savings opportunities, ensuring long-term supply, reputational gains, and realizing a price premium for the product. (Golden, 2010). Sustainability matters not just on an environmental level, but on an economic one, too. As consumers and investors become increasingly aware of the impacts of climate change and resource scarcity, they

11 Sustainable Engagement in the Indian and Finnish Business
are looking for companies to demonstrate a high level of corporate social responsibility. There is a growing recognition that good ethics can have a positive economic impact on the performance of firms. Many statistics support the premise that ethics, values, integrity, and responsibility are required in the modern workplace. For consumer groups and society at large, research has shown that good ethics is good business. (Joyner & Payne, 2002). Responsibility has become a sine qua non of carry on business or of an opportunity to achieve competitive advantage. (Blumenthal & Bergstrom, 2003; Kumar & Christodoulopoulou, 2014). The creation of a corporate identity of brand aims to achieve a high level of recognition by relevant stakeholders and to develop the ability to transfer value to them. Using the brand, organization conveys the promise to its stakeholders (Kitchin, 2003). Based on this we suggest that an organization can benefit using co-branding with a well-known ecolabel.
According to Vallaster, Lindgreen, and Maon’s (2012) research, companies use sustainability branding in order to create or protect their brand’s value. In addition, companies either integrate corporate responsibility into the business culture and strategy, or it is left as remote and superficial, marketed only when needed. On the other hand, there are still companies which use ecolabels as a green marketing tool. This may have negative impacts if the companies exaggerate and give false promises to their target customers. From the co-branding perspective, the use of type II or type III ecolabels may not be as successful as the use of type I ecolabel as these labels have a risk of being perceived as green washing. On the other hand, most ecolabeling organizations are unaware of the market share of products, services, or organizations carrying their ecolabels. Only 25% of labelers were aware of studies that assessed the market share of products carrying their label (Golden, 2010, 6). This finding is interesting and surprising, as the market share is one indicator of the extent to which ecolabels and certifications have demonstrated “success in the field.” As the aim of ecolabels is to drive empirical improvements in social and environmental performance, it is important to measure how they work. Empirical assessments also examine the level of “success in the marketplace,” meaning that the extent that ecolabels have raised their visibility to claim market share for the products that go through the labeling/certification process. (Golden 2010, 7).

12 Sustainable Engagement in the Indian and Finnish Business
3. Co-branding for Sustainable Governance – Challenges and Opportunities
Challenges
Creation of credibility continues to be a great challenge for many companies aiming to communicate responsible business. According to GlobeScan’s global public tracking in 2012, in the ten countries tracked over the past decade, only 38% of respondents believe that companies communicate honestly about their social and environmental performance. Other findings revealed a consensus view that companies embrace CSR not because they are genuinely committed to it, but in order to improve their images. (GlobeScan 2012). According to CDP 2017 report, supplier responses revealed that those who identify themselves as being reputationally exposed on their sustainability performance are a lot more likely to engage with their own supply chain (59%) when compared with companies that do not identify exposure to reputational risks (33%).
There is unlikely to be a single solution to the lack of credibility of companies’ communications around social and environmental responsibility. A franker approach to challenges that companies are facing e.g. in the coffee sector (Sorsa, 2011) in the context of co-branding is that an independent third party critically appraises company’s reporting, and an embrace of social media, these both are likely to play important roles. (GlobeScan, 2012). Saying this, there is a need for a company to try to collaborate and make partnerships with organizations which are perceived to be good performers and to make this collaboration visible by using co-branding. The latest GlobeScan’s report confirms that NGOs are seen as having made the largest contribution to sustainable development since the 1992 Earth Summit in Rio, followed by social entrepreneurs, academic organizations and citizen-led social change movements. (GlobeScan, 2016). Therefore, for instance the relationship between an NGO with sustainability agenda and a firm may be limited to a communication campaign, which can be viewed as a co-branding operation. For example, WWF has established a significant co-branding program with its Panda logo.
Secondly, according to the Sorsa and Jolkkonen’s article (2014), a challenge with ecolabels is that consumers do not know the main message of the label. However, according to Sorsa and Jolkkonen’s survey, consumers know the main message of the three long time ecolabels in Finland: Good From Finland (HyvääSuomesta, published in 1993), the Nordic ecolabel Swan (official ecolabel, created in 1992), and Fairtrade label, but awareness of the younger labels, such as MSC for fish products or the Utz Certified label, is quite weak. Nordic Swan was the fifth most well-known brand in 2014. Good from Finland was the sixth most appreciated product

13 Sustainable Engagement in the Indian and Finnish Business
brand and the most appreciated label of origin. An interesting finding was that consumers who perceive Nordic Swan and Fairtrade brands credible told to purchase products using these labels and also other products with other labels. This connection was not found in the case of Good from Finland. (Sorsa & Jolkkonen 2014, 16). This indicates that these ecolabel brands may have a positive impact on its co-brand product.
According to Lihhavsshuk’s survey on university students in Finland about the ecolabels’ role in green marketing, ecolabels influence the credibility of the product’s brand image more often than vice versa (Lihhavtshuk, 2015, 88). For instance, the Rainforest Alliance – Lipton is another exceptional example of the mutual credibility influence in co-branding. Lipton is a strong international brand with a negative image regarding environmental matters and sustainability, thus it can have a strong influence on the ecolabel’s credibility both in a positive (for consumers not concerned about environment) and negative (for consumers concerned about environment) manner. Still, the Rainforest Alliance ecolabel possesses a strong enough image to add credibility to one of Unilever’s brands.
Backhaus, Steiner, and Lügger (2011) found that brand relevance, or the relative importance of the brand in the decision-making process, is positively related to the perceived risk of the purchase and information search costs in B2B settings. In addition, their study, which spanned across 20 industries, showed that brand relevance is slightly higher when the exchange requires high specific investments from the buyer. We might suggest that a company can reduce the perceived risk by co-branding with a well-known ecolabel. However, engaging in corporate social responsibility from the wrong motives may undermine the corporate brand identity and adversely affect a brand’s established reputation.
Co-branding with collectively owned trade mark may pose challenges as the legal framework governing co-branding varies in different countries. Many countries recognize “collective marks” and “certification marks.” Collective marks indicate membership in a group (such as AAA, the American Automobile Association, in the United States). Certification marks – like CE (“European Conformity”) and The Good Housekeeping Seal of Approval – “certify” that products or services meet a particular standard of quality, regional origin or the like, even though the products may come from various unrelated companies. (INTA, 2012). Some countries, however, do not recognize collective marks, which may create uncertainty.

14 Sustainable Engagement in the Indian and Finnish Business
Opportunities
Co-branding may open new markets for the developing country’s operators. Collective marks may be used together with the individual trademark of the producer of a given good. This allows companies to differentiate their own products from those of competitors, while at the same time benefiting from the confidence of the consumers in products or services offered under the collective mark (WIPO 2017; Sorsa et al. 2015).
Manufacturers stand to gain from their involvement with ecolabeling programs. The Rainforest Alliance conducted a study to analyze the changes that SmartWood, a forestry certification program, required of forestry operations in order to become certified. SmartWood is Rainforest Alliance Corporate Sustainability Initiative that is accredited by the Forestry Stewardship Council. The study found that the SmartWood certification provided economic benefits to businesses in addition to an improved protection of high-value conservation habitat. Specifically, the certification enhanced economic sustainability through increasing efficiency and, therefore, profitability. This went hand in hand with improvements in accountability, transparency, management planning, monitoring, and chain-of-custody practices (Green Biz Staff, 2005).
Corporations wishing to attract potential stakeholders are showcasing actions that further a particular social good (Castaldo et al., 2009). Many suppliers describe stakeholder expectations around climate change disclosure and action as an opportunity to derive business benefits, including positive impacts on corporate reputation, stock price, competitive positioning, and even the company’s ability to attract and retain top talent. Purchasing organizations have the potential to incentivize significant environmental changes in their supply chain. (CDP 2017, 16).
According to Willmott’s research (2003), responsible branding impacts directly and indirectly the success of the company. Direct impacts are more efficient processes inside the company and more active customers. Indirect effects materialize via the growth of credibility to company and the improved reputation. Abdolvand and Charsetad (2013) innovatively proved that social corporate performance positively influences positioning, differentiation and, importantly, brand equity.

15 Sustainable Engagement in the Indian and Finnish Business
4. Summary
The article argues that collective sustainability schemes with ecolabel could be viewed as brands and that co-branding with them can be a beneficial strategy for different companies. Co-branding between collective sustainability schemes and private brands has not been thoroughly investigated. This article made an opening of discussion towards that direction. First, we defined co-branding with collectively owned brands, and after that, we discussed the related challenges and opportunities.
The co-branding challenges arise from the lack of credibility of the ecolabel or company marketing message. The goal of both partner organizations is to increase the total value of co-operation. If one partner fails, it may weaken the other partner’s brand image as well. According to literature, brands can influence the credibility of ecolabels, both in a positive and negative manner. However, the influence of brands’ credibility on ecolabels is usually weaker than the other way around.
A private organization may find it beneficial to co-brand with a well-known and reliable NGO in order to improve the success of its sustainability initiatives. In most co-branding cases, ecolabels added credibility to the product’s brand, and furthermore, ecolabels can both strengthen a weak brand image and improve a negative brand image.
Co-branding may open new markets for the developing country’s operators as the consumers in developed countries pay more and more attention to sustainability characteristics. Co-branding has also an impact on value chain management.
16 Sustainable Engagement in the Indian and Finnish Business
References
Abdolvand, M. & Charsetad, P. (2013). Corporate Social Responsibility and Brand Equity in Industrial Marketing. International Journal of Academic Research in Business and Social Science, 3(9), 273–284.
Backhaus, K., Steiner, M. & Lügger, K. (2011). To Invest, or Not to Invest, in Brands? Drivers of Brand Relevance in B2B Markets. Industrial Marketing Management, 40(7), 1082–1092. Available at http://dx.doi.org/10.1016/j.indmarman.2011.09.002
Blackett, T. & Boad, B. (1999). Co-branding: The Science of Alliance. Basingstoke: Macmillan Press Ltd.
Blumenthal, D. & Bergstrom, A. J. (2003). Brand Councils that Care: Towards the Convergence of Branding and Corporate Social Responsibility. Brand Management, 10(4–5), 327–341.
Castaldo, S., Perrini, F., Misani, N. & Tencati, A. (2009). The Missing Link between Corporate Social Responsibility and Consumer Trust: The Case of Fair Trade Products. Journal of Business Ethics, 84 (1), 1–15.
Global Ecolabelling Network (GEN) (2004). Introduction to Ecolabelling. Available at https://www.globalecolabelling.net/assets/Uploads/intro-to-ecolabelling.pdf
Golden, J. (2010). An Overview of Ecolabels and Sustainability Certifications in the Global Marketplace. Nicholas Institute for Environmental Policy Solutions, Duke University. Available at https://center.sustainability.duke.edu/sites/default/files/documents/ecolabelsreport.pdf
Hyllegard, K., Yan, R., Ogle, J. & Lee, K. (2012). Socially Responsible Labeling: The Impact of Hang Tags on Consumers’ Attitudes and Patronage Intentions toward an Apparel Brand. Clothing and Textiles Research Journal, 30(1), 51–66. Available at http://ctr.sagepub.com/content/early/2012/01/27/0887302X11433500.abstract
Joyner, B.E. & Payne, D. (2002). Evolution and Implementation: A Study of Values, Business Ethics and Corporate Social Responsibility. Journal of Business Ethics, 41: 297. DOI: 10.1023/A:1021237420663.
Keller, K. & Lehmann, D. (2006). Brands and Branding: Research Findings and Future Priorities. Marketing Science, 25(6), 740–759.
Kitchin, T. (2003). Corporate Social Responsibility: A Brand Explanation. Brand Management, 10(4–5), 312–326.
Kotler, P., Keller, K. L. & Burton, S. (2009). Marketing Management. Pearson Prentice Hall, Frenchs Forest, N.S.W.

17 Sustainable Engagement in the Indian and Finnish Business
Kourula, A. & Laasonen, S. (2010). Nongovernmental Organizations in Business and Society, Management, and International Business Research—Review and Implications from 1998 to 2007. Business and Society 49(1), 68–87.
Kumar, V. & Christodoulopoulou, A. (2014). Sustainability and Branding: An Integrated Perspective. Industrial Marketing Management, 43, 6–15.
Laitala, K. & Klepp, I. (2013) Environmental and Ethical Perceptions Related to Clothing Labels among Norwegian Consumers. Research Journal of Textile and Apparel, 17(1), 50–58.
Leslie, D. (2012). Tourism Enterprises and the Sustainability Agenda across Europe. Ashgate Publishing, Ltd., Nov 28, 2012.
Leuthesser, L., Kohli, C. & Suri, R. (2003). 2 + 2 = 5? A Framework for Using Co-branding to Leverage a Brand. Henry Stewart publications 1350-231x, Brand Management Vol. 11, No. 1, 35–47 September 2003.
Lexicon (2017). Definition for Brand Social Equity. (http://lexicon.ft.com/Term?term=brand-social-equity).
Lihhavtshuk, R. (2015). Eco-labels as Sustainability Brands: The Role of Visual Design and Co-branding in Credibility of Eco-labels. Master’s Thesis, Aalto University, Helsinki.
Loimukoski, T. (2016). Yhteisömerkin tuoma lisäarvo yritykselle ja sen vaikutus brändipääomaan. Master’s Thesis, University of Helsinki, Faculty of Agriculture and Forestry, Department of Economics and Management.
Martin, D. & Schouten, J. (2012). Sustainable Marketing. Pearson Education, Inc. ISBN: 978-0-13-611707-0
McCarthy, M. S., & Norris, D. G. (1999). Improving Competitive Position Using Branded Ingredients. Journal of Product and Brand Management, 8(4), 267−285.
Poret, S. (2014). Corporate-NGO Partnerships in CSR Activities: Why and How? cahier derecherche 2014–21. 2014. <hal-01070474>
Simonin, B. L. & Ruth, J. A. (1998). Is a Company Known by the Company it Keeps? Assessing the Spillover Effects of Brand Alliances on Consumer Brand Attitudes. Journal of Marketing Research, 35(1), 30−42.
Sorsa, K. (2011). Kansainvälisen kaupan arvoketjujen sääntely. Yhteiskuntavastuun ja ennakoivan oikeuden tarkastelua. Turun yliopiston julkaisuja. Sarja C, Osa 320. 2011. (Regulation of global value chains: Examining corporate social responsibility and proactive law). Turku: The University of Turku.

18 Sustainable Engagement in the Indian and Finnish Business
Sorsa, K. & Jolkkonen, A. (2014). Yksityisen sääntelyn legitimiteetti – luottamus eettisiin merkkeihin ja ympäristömerkkeihin. Edilex 2104/6. Available at: https://www.edilex.fi/artikkelit/12792.pdf.
Sorsa, K., Cafaggi, F., Iamiceli, P. & Ferrari, C. (2015). Transnational Private Regulation, System Level Innovations and Supply Chain Governance in the Coffee Sector. Evidence from Brazil, Italy and Finland. Reports from Turku University of Applied Sciences 224. Turku: Turku University of Applied Sciences. Available at http://julkaisut.turkuamk.fi/isbn9789522165855.pdf
Utting, P. (2002). Regulating Business through Multi-stakeholder Initiatives: A preliminary Assessment. In NGLS/UNRISD (eds.), Voluntary Approaches to Corporate Responsibility: Readings and a Resource Guide. NGLS Development Dossier. United Nations, Geneva.
Washburn, J. H., Till, B. D. & Priluck, R. (2000). Co-branding: Brand Equity and Trial Effects. Journal of Consumer Marketing, 17(7), 591−604.
Willmott, M. (2003). Citizen Brands: Putting Society at the Heart of Your Business. John Wiley & Sons, Chichester, UK.
WIPO (2017). Collective Marks. Available at http://www.wipo.int/sme/en/ip_business/collective_marks/collective_marks.htm.

19 Sustainable Engagement in the Indian and Finnish Business
Sustainable Blue Growth and Maritime Spatial Planning
Dr. Anu Lähteenmäki-Uutela Senior Lecturer, Turku School of Economics, Pori unit, University of Turku Dr. Sari Repka Project Manager, Centre for Maritime Studies, Pori unit, University of Turku Dr. Teemu Haukioja Postdoctoral Research Fellow, Turku School of Economics, Pori unit, University of Turku Thaysa Portela de Carvalho Project Coordinator, Centre for Maritime Studies, Pori unit, University of Turku Tuomas Pohjola Project Researcher, Turku School of Economics, Pori unit, University of Turku
Abstract
Blue growth means sustainable economic growth based on the resources of the seas and the oceans. The EU has chosen as its strategic goal to promote five blue sectors: aquaculture, maritime and coastal tourism, blue biotechnology, renewable blue energy, and seabed mining for minerals. The goal of maritime spatial planning (MSP) is to fit together different activities and to find possible synergies. Multidisciplinary research on the interactions between business and the environment, cross-border cooperation in strategic planning, and efficient legal instruments for protecting the ecosystems and natural resources are needed. Acknowledgement
This work has been supported by the Strategic Research Council at the Academy of Finland, project SmartSea (grant number 292 985).
20 Sustainable Engagement in the Indian and Finnish Business
1. Chapter outline
In section 2, the concept of blue growth and its political targets are defined. In section 3, we explain the notion of Maritime Spatial Planning (MSP) and describe how it can help in promoting blue growth. We comment on the planning goals and how the economic potential of different business fields can be assessed. In section 4, we discuss how MSP is implemented in three case countries and which blue growth sectors are perceived as the most potential in the respective countries. Section 5 aims to critically analyze the goals of the blue growth pursuit, and the efficacy and efficiency of the tools that are used to achieve the goals. Section 6 draws the final conclusions. 1
By the end of this chapter, the reader should be familiar with:
1. The meaning of blue growth;
2. The political targets of blue growth in the European Union;
3. The meaning of Maritime Spatial Planning (MSP), including the goals, methods, and possible benefits of MSP in promoting blue growth;
4. The situation with MSP and blue growth in Finland, France, and Mexico.
1) This chapter is based on a course assignment on the course International and European Environmental Law. The course was taught by Dr. Anu Lähteenmäki-Uutela at Turku School of Economics, Pori unit in March and April 2017. Students were instructed to write on blue growth and maritime spatial planning with a focus on their home countries. The teacher combined the texts and drew conclusions together with colleagues Sari Repka, Teemu Haukioja and Tuomas Pohjola from the University of Turku. The following ten students participated in writing the raw text: Bára Budíková, Jenni Vuorela, Laura Yli-Rantala, Salomé Marais, Karoliina Myllykylä, Eemeli Myllärinen, Elisa Runsas, Eveliina Vuorinen, Fernanda Valenzuela, and Arlette Oukka.

21 Sustainable Engagement in the Indian and Finnish Business
2. The Blue Growth Pursuit in the European Union
Over 70% of our planet is covered by water. Water is not only the requirement for human life, it also supports marine life and offers economic value to societies. Due to overexploited land-based resources, there is a strong pressure worldwide to enhance the economic activity that depends on the oceans, seas, and coastal areas.
Blue growth is a sustainable development initiative (Burgess et al. 2016, 2) that means the use of the oceans and sea areas for sustainable economic development. Set as public policy’s goal, it focuses on the management of aquatic resources and the value chains of marine products. The concept is not entirely clear, as the European Union does apparently now see sustainable growth potential in all blue economy.
According to Eikeset et al. (2018), the term “blue growth” derives from “green growth”, which OECD defines as “fostering economic growth and development while ensuring that natural assets continue to provide the resources and environmental services on which our well-being relies”. This concept took center stage in the Rio+20 conference in 2012, since a group of small island nation states (SIDS) emphasized the importance of the blue economy – that is the multi-faceted economic and social importance of the ocean and inland waters – in contrast with growth derived from terrestrial ecosystems. The concept of “blue growth” was then born.
After that, blue growth became a popular policy concept. To support a shift to this new approach, FAO launched its Blue Growth Initiative to assist countries in developing or implementing blue economy and growth agendas. Blue growth has been included in the European Commission strategy Europe2020, which is aiming at sustainable development in the economic, social, and environmental area (SmartSea). Sea is a huge part of European lives within the European Union, with 22 countries with coastlines. (Ecorys, 2012, 5.) For the European Union, an important goal is to increase the level of employment in the blue sectors. The European Blue Growth strategy focuses on 5 main areas – aquaculture, coastal tourism, marine biotechnology, ocean energy, and seabed mining. Those areas are supposed to have a higher sustainable growth potential and create most of new jobs in the blue economy.
The vision on the economic potential of the seas and oceans has changed a lot in 60 years. In the past, blue economy activity was mainly centered on maritime trade. The growth of maritime traffic is heavily linked to the maintenance and development of maritime and land based infrastructures. The share of world trade through the oceans and seas has risen from 80% of world trade in the early 2000s to 90% in 2015 (Bonus program publication, 7). However, maritime activities, historically, have also caused many detrimental impacts on the structure

22 Sustainable Engagement in the Indian and Finnish Business
and functioning of marine ecosystems. For instance, whale populations have collapsed due to whale hunting (whaling), the exploitation and transportation of offshore oil has caused some of the worst environmental disasters in wildlife-rich spots in the world, and also fish stocks have severely decreased as ocean fish numbers have been cut in half since 1970 due to over-fishing.
The EU Blue Growth Strategy requires the restoration of ecosystem resilience in order to conserve and increase their ability to provide goods and services. (Bonus Publication, 6.) Thus, in Europe, blue growth can be understood to mean ecologically sustainable socio-economic development, where economic growth can exist, but only under certain healthy ecological standards. While a good environmental status of the oceans and seas is ideal, there are challenges in defining the other priorities related to the issue (Jones et al., 2016, 261–262). In Europe, the seas are seen as drivers for the economy. Exploiting the seas requires innovations; and indeed, offshore industry is developing rapidly. Certainly, the oceans offer a vast potential for economic growth for many industries, for example, enzymes and other chemical substances from marine organisms have been used in the most diverse applications, from pharmaceuticals to food and agriculture industries.
To enhance blue growth, the European Commission has defined business activities and business sectors that have great potential for sustainable employment and growth. Furthermore, the goal of the European Commission is to enhance marine knowledge and legal certainty with the goal of enhancing cooperation with different countries. (European Commission, Blue Growth.)
In Europe, the blue economy is calculated to represent 5.4 million jobs and gross value added of around 500 billion euro per year. However, there are yet many sectors to discover and improve in this field. The European Commission has formulated its blue growth strategy to increase jobs, welfare, and safety, going along with the fundamental principles formulated in the Europe 2020 strategy: the growth must be smart, sustainable and inclusive; smart with respect to integration of cutting edge science-based, innovative solutions and industrial leadership, sustainable in economic, social, and ecological terms tackling societal challenges, and inclusive considering the multitude of coastal, marine, and maritime activities and trade-offs between them.
Sea areas mean an expanding source of wealth. Especially with small islands and coastal nations, the blue economy is crucial for the economic growth and for the level of living standards of their inhabitants. On the other hand, rich countries are using the sea as a replacement and augmentation of resources on the land. Similarly to land-based resources, new sea-based resources may become exhausted or too expensive to obtain without planning, boundaries and sustainable approach. For blue growth, we need to find new ways for the safe utilization of marine resources. (Celtic Seas Partnership.)

23 Sustainable Engagement in the Indian and Finnish Business
According to the European Commission (2017), European aquaculture currently provides 20% of the fish production and gives employment to 85 thousand people in Europe. Worldwide, the share of aquaculture is projected to reach 56% in 2024 (FAO, 2015). The driving forces of this sector are the micro, small and medium-sized enterprises, which operate in the coastal and rural areas. The production in this sector is showing 7% rate of growth. The European Union strategy aims to support aquaculture by reducing administrative burdens, improving the access to water, increasing competitiveness, and wishing competitive advantages based on high health and environmental standards.
Due to the high number of coastal areas in Europe and the high number of yearly visitors, the coastal and maritime tourism has become another main areas of interest. By the generation of € 183 billion Gross Value Added, it creates over one-third of the European blue economy, and it employs 3.2 million people. The EU financing possibilities for tourism development have been compiled into an online guide (European Commission, 2017a).
The sector of marine biotechnology concerns the exploration and exploitation of the marine organisms. Those organisms are very diverse and have a big potential for the development of new products, which may be pharmaceuticals or industrial enzymes. The sea biodiversity brings new possibilities and also challenges. This sector will provide jobs for many specialists and high-skilled employees. The European Commission aims to increase the amount of financial resources available for closing gaps in marine biotechnology development. (European Commission: Blue Growth.)
There are several possibilities for producing renewable blue energy. The tides and waves are used to create the energy as well as the differences in temperature and salinity. In a long perspective, the European Union is aiming to a high use of renewable energy. Blue energy will help both with this goal and in the reduction of greenhouse gases. (European Commission: Blue Growth.)
The oceans are sources for minerals. There are plenty of minerals occupying the ocean bottom. Seabed mining is concerned with the ways of retrieval of these minerals. However, the retrieval is not the only issue. The security of supply must be ensured. New technology providers and mine operators are needed due to the lack of knowledge of the deep sea environment. New studies are being provided (supported by European Commission) to clarify and unravel the pros and cons of seabed mining. With new information and data, better knowledge can be provided, and people and society involved in this sector can be further educated. (European Commission: Blue Growth.)

24 Sustainable Engagement in the Indian and Finnish Business
Blue Growth requires skilled workforce for applying and managing new technologies. Unfortunately, there has been a gap in experiences and skills. The European Union aims to help with providing the necessary knowledge, legal certainty, and security for the blue economy and its growth. For that reason, an agenda containing three major actions has been drafted: marine knowledge is being increased to improve access to information about the sea and its potential; maritime spatial planning is being used to ensure an efficient and sustainable management of activities at the sea; integrated maritime surveillance is used to give the authorities a better picture of the activities and impacts in the sea and in its surroundings. The sea basins are not all the same, and strategies have to be tailored for small specific areas. The seven main areas in Europe include (1) the Arctic Ocean; (2) the Atlantic Ocean; (3) the Baltic Sea; (4) the Black Sea; (5) the Mediterranean Sea; (6) the North Sea; and (7) the Adriatic and Ionian Seas. (European Commission: Blue Growth.)
The EU channels its research funding through the Horizon 2020 program. The Blue Growth area has its own Horizon 2020 budget, of which a part is reserved for small and medium-sized enterprises, and cross-thematic funding is available in the areas of food security, energy, transport, materials, information technology, and research infrastructures. (Remotti and Damvakeraki, 2015.) For supporting investments, the EU has created a fund for promoting strategic investment, the ESIR.

25 Sustainable Engagement in the Indian and Finnish Business
3. Maritime Spatial Planning and Blue Growth
3.1 Goals of MSP
Oceans and seas are used in multiple ways and all different business activities are interconnected. When managing all these activities together, there is greater possibility to achieve additional value. (Burgess et al. 2016, 1.) Maritime spatial planning (hereafter MSP) is “a public process of analyzing and allocating the spatial and temporal distribution of human activities to specific marine areas” (Ehler, 2011, 41). It is an instrument for achieving ecological, economic, and social goals and objectives that are specified through a political process. The process of MSP answers three simple questions: (1) where are we today?; (2) where do we want to be?; and (3) how do we get there? (Ehler, 2011, 41).
MSP can be seen as a key instrument for Blue Growth and an important framework for ocean and sea governance. MSP is a key instrument for the Integrated Maritime Policy (IMP). MSP is required, as the competitive uses at “blue space” are becoming more intensified under the alarming conditions of scarce natural resources and ecosystems. MSP has the potential to boost economic growth on the basis of the paradigm in innovation, competitiveness, and knowledge (MSP for Blue Growth). MSP provides a holistic, strategic, and proactive approach that addresses social, economic, and environmental objectives and in that way helps to achieve long-term benefits and sustainable development (Tarvainen et al., 2015, 95). MSP practices and methods have been developed in many countries around the world. A growing body of research is ongoing, for developing new, or adapting existing tools and methodologies to be used in MSP. (Secretariat of the Convention on Biological Diversity 2012, 16.) In some cases, the goal of MSP is to reduce conflicts between sectors and to find possible synergies between different activities. MSP is also seen as a tool to increase the stability, transparency and predictability of the business environment in order to encourage investments. (Secretariat of the Convention on Biological Diversity 2012, 17.) It is hoped by the EU that MSP could advance cross-border cooperation to develop energy grids, shipping lanes, pipelines, underwater cables, etc., but also to develop networks of natural conservation areas. Hence, MSP can potentially be used to protect the environment through early identification of critical impacts and alternative opportunities for multiple use of coasts and sea areas. (European Commission, 2011.)

26 Sustainable Engagement in the Indian and Finnish Business
Tarvainen et al. (2015, 95) present Gilliland and Laffoley’s (2008) list of potential benefits of MSP in their article (slightly modified):
• A holistic approach that addresses social, economic, and environmental objectives,
• better integration of marine objectives,
• a more strategic and proactive approach,
• greater certainty for developers,
• a more efficient and accountable licensing,
• reduced conflicts within different industry sectors,
• reduced risk of marine activities damaging marine ecosystems,
• more informed and rational site selection for development or conservation,
• improved capacity to plan for new and changing activities,
• more efficient use of available marine space and resources,
• broad framework to understand the value of marine protected areas, and
• more strategic and cost-effective information management.
3.2 Governance, MSP Tools, Processes and Methods in the EU
The need to develop cross‐sectoral and integrated governance is a key challenge in developing and implementing MSP, as well as in the implementation of ecosystem‐based management through MSP, which requires extending the scale of coordinated management across different marine ecosystems and social systems (UNEP, 2011). Therefore, MSP is a public process that requires extensive integration and collaboration between and among government agencies and non-governmental individuals and organizations. Without governance, there is no binding plan.
MSP is a fairly new process that an increasing number of EU Member States are practicing or preparing to develop. The European Maritime Spatial Planning Platform is a communication channel which provides a way of sharing information between the member states. It works as a knowledge exchange forum. The European Union aims to provide administrative and technical support through the platform. It contains information about practices, processes, studies,

27 Sustainable Engagement in the Indian and Finnish Business
services, and projects, and it is available for officials, planners, and potential stakeholders. Through this platform it is possible to not just get new knowledge but also to find new partners and necessary support and services. (European MSP Platform.) In addition to the platform, there is funding available for developing MSP. EU-funded projects around Europe have developed planning tools and criteria. The European Regional Development Fund (ERDF) with the objective of European territorial cooperation can support spatial development projects, several of which are relevant for MSP. These projects include mapping exercises, multinational approaches to common criteria for MSP, and sea use management.
Tools available for use in MSP itself range from legislative instruments and policies to planning systems, environmental and economic standards and thresholds, zoning, decision support tools, GIS applications, mathematical models, web-based dissemination and consultation methods, data handling and visualization tools to 3D models and maps. (Secretariat of the Convention on Biological Diversity, 2012, 16.) Tools that are more widely used are policy and legislation, ocean zoning, sustainable financing, and adaptive management.
According to the EU Marine Strategy Framework Directive2, maritime spatial planning means a process by which the relevant Member State’s authorities analyze and organize human activities in marine areas to achieve ecological, economic, and social objectives. The Directive requires Member States to achieve good marine environmental status by 2020, to apply an ecosystem approach, and to ensure that pressure from human activities is compatible with good environmental status. By 2021, the spatial plans must be completed. This marine spatial planning directive is the main European legal instrument guiding MSP. While putting the directive in action, a country can take advantage of its current governance system, regulations, and control mechanisms. The directive emphasizes cross-border collaboration to coordinate and secure consistent marine spatial planning. The coordination can also be executed with existing collaboration structures or other ways. (Government Proposal 62/2016.)
The directive does not stipulate the contents of the spatial plans but instead lists the principles that should be applied. According to the directive, the land-sea interactions must be taken into account. Also, the environmental, economic, social, and safety aspects must be counted in. The directive emphasizes that an ecosystem-based approach should be applied as well as organizing the use of the best available data and ensuring the involvement of stakeholders. The goal is to improve coherence between MSP and the resulting plan or plans and other processes and also to improve cooperation with third countries and while ensuring trans-boundary cooperation between Member States. (Dom, 2016, 3.) The marine area to be planned consists of water areas
2) Directive 2014/89/EU of the European Parliament and of the Council of 23 July 2014 establishing a framework for maritime spatial planning. Available at http://eur-lex.europa.eu/legal-content/EN/ALL/?uri=celex:32014L0089.
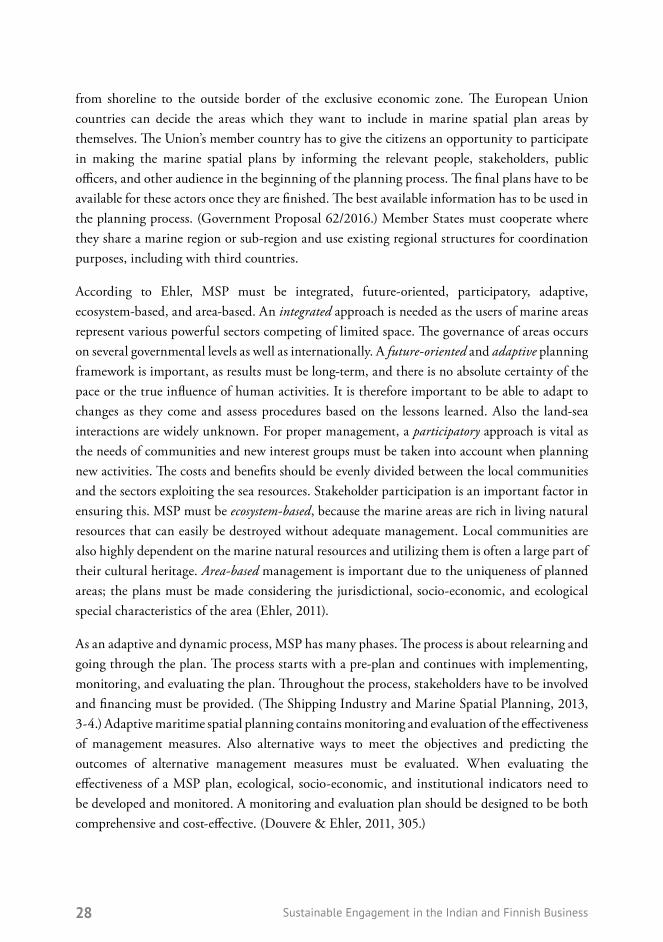
28 Sustainable Engagement in the Indian and Finnish Business
from shoreline to the outside border of the exclusive economic zone. The European Union countries can decide the areas which they want to include in marine spatial plan areas by themselves. The Union’s member country has to give the citizens an opportunity to participate in making the marine spatial plans by informing the relevant people, stakeholders, public officers, and other audience in the beginning of the planning process. The final plans have to be available for these actors once they are finished. The best available information has to be used in the planning process. (Government Proposal 62/2016.) Member States must cooperate where they share a marine region or sub-region and use existing regional structures for coordination purposes, including with third countries.
According to Ehler, MSP must be integrated, future-oriented, participatory, adaptive, ecosystem-based, and area-based. An integrated approach is needed as the users of marine areas represent various powerful sectors competing of limited space. The governance of areas occurs on several governmental levels as well as internationally. A future-oriented and adaptive planning framework is important, as results must be long-term, and there is no absolute certainty of the pace or the true influence of human activities. It is therefore important to be able to adapt to changes as they come and assess procedures based on the lessons learned. Also the land-sea interactions are widely unknown. For proper management, a participatory approach is vital as the needs of communities and new interest groups must be taken into account when planning new activities. The costs and benefits should be evenly divided between the local communities and the sectors exploiting the sea resources. Stakeholder participation is an important factor in ensuring this. MSP must be ecosystem-based, because the marine areas are rich in living natural resources that can easily be destroyed without adequate management. Local communities are also highly dependent on the marine natural resources and utilizing them is often a large part of their cultural heritage. Area-based management is important due to the uniqueness of planned areas; the plans must be made considering the jurisdictional, socio-economic, and ecological special characteristics of the area (Ehler, 2011).
As an adaptive and dynamic process, MSP has many phases. The process is about relearning and going through the plan. The process starts with a pre-plan and continues with implementing, monitoring, and evaluating the plan. Throughout the process, stakeholders have to be involved and financing must be provided. (The Shipping Industry and Marine Spatial Planning, 2013, 3-4.) Adaptive maritime spatial planning contains monitoring and evaluation of the effectiveness of management measures. Also alternative ways to meet the objectives and predicting the outcomes of alternative management measures must be evaluated. When evaluating the effectiveness of a MSP plan, ecological, socio-economic, and institutional indicators need to be developed and monitored. A monitoring and evaluation plan should be designed to be both comprehensive and cost-effective. (Douvere & Ehler, 2011, 305.)

29 Sustainable Engagement in the Indian and Finnish Business
MSP involves the assessment of future economic potential of businesses. Ultimately, this means deciding upon which fields of business can use marine space and how. For example, the increased demand for sea space for renewable energy is competing with the fishing industry. In a study made in the UK, this problem was assessed by trying to understand the way that both parties interact and impact each other. There were also efforts in trying to understand the ways for the two industries to coexist and possibly benefit from each other. Data collection for the study was conducted by stakeholder questionnaires and stakeholder workshops. The analysis was done by trying to understand the key challenges both parties faced in this situation. The result was an acceptable consultation protocol between energy and fishing sectors agreed on by all stakeholders (de Groot et al., 2014). By hearing stakeholders, it is possible to assess and agree on the economic potential and even develop new ways of cooperation to further increase the potential.
Balancing multiple objectives for the ocean and the seas requires accounting for the cumulative impacts of a diverse range of activities. The marine environment provides some benefits to specific sectors that can be easily valued (e.g., shipping, oil and gas, fisheries, recreation, etc.). In contrast, other benefits from oceans reach a broader group of people, often through indirect pathways not as easily valued (e.g., provision of life support systems, climate regulation, protection of coastal communities from storms and sea level rise, biodiversity, and cultural and aesthetic values). Understanding the cumulative pressures resulting from the various uses and how these will evolve in the future is critical, as these pressures will have specific spatial demands, create conflicts among users, and affect the suite of benefits humans can expect from the ocean.
The EU believes that the information related to the blue growth has to be collected and shared as openly as possible (open data principle, the INSPIRE Directive). It is believed that digitalization and key enabling technologies provide lots of growth potential for the blue growth. Furthermore, digitalization helps to create new services for the blue value chains. (Taipale, Helsinki EU Office.)

30 Sustainable Engagement in the Indian and Finnish Business
3.3 Costs-benefitsofMSP
The MSP principles can be presumed to enhance the certainty and predictability for many maritime activities, such as shipping, tourism, oil industry, fishing, aquaculture, and marine tourism. The relationship between the degree of certainty and the investment climate of a region is considered by many economists as positive: it is likely to lead to the acceleration of economic activity and economic growth. MSP is presumed to lead to better coordination and synergy. MSP creates direct and indirect economic effects through increasing certainty and predictability. Direct economic effects include coordination efficiency for governmental organizations, reduced transaction costs for activities in the maritime arena and improved investment climate. Lastly, MSP can be seen to help find optimal locations for maritime activities. (European Commission, 2011, 15–21.) Indirect economic effects provided by MSP come in the form of combining business activities performed in the maritime arena. An example of such is the combination of wind farms with aquaculture (e.g., selfish farming). (European Commission, 2011, 21.) In sum, maritime spatial planning creates economic effects in three different dimensions: coordination efficiency for governments, lower transaction costs for businesses operating in the maritime areas and economic effects for society due to an enhanced investment climate (European Commission, 2011, 23).
There are some methodological difficulties when quantifying the effects of MSP. First of them is coordination efficiency. The application of MSP can inflict the costs of coordination on a European Member State. These costs can be reduced by improving coordination systems and procedures through integration within governmental organizations. Lower administrative, employment, and overhead costs per procedure or activity can then result. On the other hand, additional costs can result from setting up a monitoring, coordination and control system, thereby introducing costs. (European Commission, 2011.) The second difficulty is transaction costs. Search, legal and administrative costs can add up to significant costs for maritime businesses, especially if multiple governmental bodies are involved. The problem in quantifying these costs is their high variability per Member State, maritime activity, the maritime area involved and the size of the activity. One of the main drivers behind developing MSP is allowing maritime activities to take place simultaneously, i.e. without creating conflicts. A conflict in this regard is considered to be a situation in which two or more maritime activities are based on methods or objectives that are incompatible either in terms of space or time. The value of MSP is determined by the level to which conflicts can be prevented.

31 Sustainable Engagement in the Indian and Finnish Business
In 2010, for example, the level of conflicts between activities was small – only a few examples are known of existing conflicts that have led to actual costs. Still, the growth of maritime activities, an increasing pressure on environment and an increasing claim for maritime space by new players may impose competition issues in the future (high variability of transaction costs per Member State, sea area, type of activity, and even individual companies, probability of conflict is dependent on a large number of variables, requiring ex post analysis to be valid and reliable). (European Commission, 2011.) There is a new emerging field of business: the number of firms that mitigate conflicts related to MSP using science-based methods is growing (e.g., http://akordi.fi/.)
Economic growth is dependent on many variables MSP cannot influence, and also the level to which economic activity can be accelerated by MSP is dependent on a number of factors. (European Commission 2011.) Clear rules governing any sector will bring more transparency and predictability, and the sector will become more interesting for investors and potential stakeholders. Investments such as energy grids, shipping lanes, pipelines, and submarine cables require predictability. (European Commission: MSP.) Planning still cannot guarantee risk-taking, creativity, innovation, or future-oriented strategies of business organizations.

32 Sustainable Engagement in the Indian and Finnish Business
4. Blue Growth and MSP in Finland, France, and Mexico
Blue Growth and MSP have been strongly promoted worldwide. Hence, in the table below (Table 1) it is shown three distinctive countries and further is presented what are their MSP and blue economy perspectives. For instance, this section does not intend to compare such countries, but rather present a glimpse of the uniqueness of each case. Finland and France are European countries and state members of the European Union (therefore, both are under the MSP Directive and should comply with the establishment of MSP plans by 2021). Both countries are developed economies where blue economy represents a small portion of it. Finland has a rather small population and Exclusive Economic Zone (EEZ) while France has the largest EEZ in the world due to overseas territories. Both countries have incorporated MSP in their legislation in 2016 and are carrying planning processes. Mexico, on the other hand, located in Central America, is a developing economy, where coastal tourism and oil industry are significant contributors. Mexico’s population size is 21 times bigger than that of Finland and it has one of the largest EEZ areas in the world. MSP plans have been divided in four zones, and part of it has been implemented despite governance issues.
*roughly estimated (GeoMexico, 2012; Faber & Gaubert, 2016; OECD, IEA, 2016; Ceron, 2017)
Table 1. Country profiles of Finland, France and Mexico, regarding socio-economic data, blue economy, and MSP instruments.
11
4. Blue Growth and MSP in Finland, France, and Mexico
Blue Growth and MSP have been strongly promoted worldwide. Hence, in the table below (Table 1) it is shown 3 distinctive countries and further is presented what are their MSP and blue economy perspectives. For instance, this section does not intend to compare such countries, but rather present a glimpse of the uniqueness of each case. Finland and France are European countries and state members of European Union (therefore, both are under the MSP Directive and should comply with the establishment of MSP plans by 2021). Both countries are developed economies where blue economy represents a small portion of it. Finland has a rather small population and Exclusive Economic Zone (EEZ) while France has the largest EEZ in the world due to overseas territories. Both countries have incorporated MSP in their legislation in 2016 and are carrying planning processes. Mexico, on the other hand, located in Central America, is a developing economy, where coastal tourism and oil industry are significant contributors. Mexico’s population size is 21 times bigger than Finland and it has one of the largest EEZ areas in the world. MSP plans have been divided in 4 zones, and part of it has been implemented despite governance issues.
*roughly estimated
Country Pop. size
(million)
GDP US$
per capita
Blue
economy
as % of
total GDP
Main blue
sectors
EEZ size
(sq. km)
MSP Law MSP Plan
Finland 5.5 44.956,00 1.4
Maritime transport,
coastal tourism,
shipbuilding&
repair
29.080
Land Use and
Building Act (1999)
(transposed in
October 2016)
Plans under
analysis
France 64.1 42.858,00 2.75-4.44
Coastal tourism
and fisheries
/aquaculture >11 million
Art.123 of Law
n°2016-1087 (in
August 2016) Plans under
analysis
Mexico 119.7 19.093,00 20*
Offshore Oil&Gas
industry, coastal
tourism and
fisheries
>3 million
General Law of
Ecologic Balance
and Environmental
Protection
(LGEEPA, 1988)
Plans completed
and partly
implemented
(except Central
Pacific)

33 Sustainable Engagement in the Indian and Finnish Business
4.1 Finland
Finland’s National Development Plan for Blue Bioeconomy was adopted in November 2016 and its implementation has begun. The vision of Finland’s strategy for the Baltic Sea Region is “a healthy Baltic Sea with its vital marine life is a well-protected and sustainably used resource. The BSR active develops its know-how and uses its resources as a forerunner of sustainable development. The BSR is stable and safe” (PRIME MINISTERS’ OFFICE 15C/2017).
Finland aims to support the Baltic Sea Region to be a global leader in bioeconomy and circular economy, a forerunner of technological innovations and a producer of model solutions for (1) safe and clean shipping, (2) maritime industry, and (3) sustainable use of marine environment.
The Maritime Spatial Planning Directive was transposed in to Finnish law in 2016, in the Land Use and Building Act. In Finland, the Territorial Sea is a part of local municipalities. Municipalities are aggregated in Regional Councils, which are in charge of drafting maritime spatial plans on Territorial waters and on EEZ by March 2021. There will be three plans; one for the Bothnian Sea by Regional Councils of Lapland, Northern Osthrobothnia, Southern Osthrobothnia and Osthrobothnia, one for the southwestern part of the Finnish coast by Regional Councils of Satakunta and Southwest Finland, and the third for the Gulf of Finland by the Regional Council of Uusimaa and Kymenlaakso. However, the drafted plans are non-binding (HELCOM-VASAB, 2016). The EEZ is governed by the Finnish Government, hence the Ministry of the Environment will develop and guide maritime spatial planning and be in charge for of cooperation with neighboring countries.
The Baltic Sea Region countries have a long history of cooperation for the protection of the Baltic Sea since the approval of Helsinki Convention in the 1970s and creation of Helsinki Commission (HELCOM) secretariat in the 1980s. In the 1990s, VASAB (Vision and Strategies around the Baltic Sea) was founded to support the marine spatial planning in the Baltic Sea area. Together, they created in 2010 a MSP Working Group to ensure cooperation among the Baltic Sea Region countries for coherent regional Maritime Spatial Planning (MSP) processes in the Baltic Sea.

34 Sustainable Engagement in the Indian and Finnish Business
HELCOM-VASAB also have set up principles to guide MSP in the Baltic Sea:
1. Sustainable management
2. Ecosystem approach
3. Long term perspective and objectives
4. Precautionary principle
5. Participation and transparency
6. High quality data and information basis
7. Transnational coordination and consultation
8. Coherent terrestrial and maritime spatial planning
9. Planning adapted to characteristics and special conditions at different areas
10. Continuous planning
Overall, Finland shows good coordination and impressive initiatives for blue economy development and certainly possesses untapped potential. However, the fact that its primary goal is to restore/preserve the Baltic Sea (which has suffered for decades with eutrophication, as a result of farming and toxic air emissions that result in harmful cyanobacteria blooms) imposes a big challenge to development since good environmental status is yet to be achieved in the marine environment, and coupled to global warming threats, the future scenario is closer to a sustainability dilemma.

35 Sustainable Engagement in the Indian and Finnish Business
4.2 France
France owns the largest exclusive economic zone in the world with over 11 million km² of marine waters after jurisdiction claims over vast overseas territories. France has declared an exclusive economic zone (EEZ) off its coasts in the North Sea and English Channel, Atlantic Ocean, Caribbean Sea, Mediterranean Sea, Indian Ocean, and Pacific Ocean – where the majority of its EEZ portion is located.
One could argue if France has the capability and operational instruments to manage such a large area. The management of waters under French jurisdiction has been and still is, to a large extent, the responsibility of the central government. According to Unesco, France has not yet developed a comprehensive ocean legislation. However, there is no overarching legislation addressing the issue of integrated MSP and the legislation applicable to MSP is administered and enforced by a wide range of administrations, government agencies, and regional or local authorities.
The French government has started the implementation of the EU Marine Strategy Framework Directive, however an integrated MSP process has not started yet. There are different working groups including an Atlantic and Mediterranean Maritime Councils.
In European waters, on each side of the French coasts a complex case can be seen: in the Mediterranean, there are many marine borders including several disputed areas that may cause conflicts between countries. (Katsanevakis et al., 2014, 32.) On the northeast Atlantic Ocean, maritime transport and seafood sectors have been and continue to be important to France’s economy. New industries are developing, such as marine renewable energy (including wind, water, and tidal energy) production. Tenders for installing offshore windfarms in six sites were awarded in 2012 and 2014. In 2018, French government threatened to cancel the projects if the wind energy companies would not agree to renegotiate the subsidies as result of progress of technology and drop of wind energy prices compared to four years ago. After an agreement between parties, public subsidies have been cut by 40% and projects are confirmed. Perhaps the installation of offshore wind turbines will, finally, advance MSP development in French waters.

36 Sustainable Engagement in the Indian and Finnish Business
4.3 Mexico
The country of Mexico has approximately 11 thousand kilometers of coasts. Mexico holds the place 16 in World Fisheries Production. The national fish production of Mexico is approximately one million 467 thousand tons (FAO, 2012), however, due to the economic geography of Mexico, fishing is not developed in the same way as other productive sectors such as agriculture despite Mexico’s EEZ and territorial sea of approximately 3,150,000 km². The marine territory of Mexico is almost double the size of its land territory, being in a strategic geographical location with access to two important oceans. The oceans benefits more than two million families that depend on some form of fishing activity, and the millions who depend on marine tourism.
The blue growth strategy of Mexico at its first stage is to develop sectors that have a high potential for sustainable jobs and growth, such as aquaculture, coastal tourism, marine biotechnology, ocean energy, and seabed mining. The second stage is the identification of the components to provide knowledge, legal certainty and security in the blue economy. This involves maritime spatial planning and integrated maritime surveillance that enable the authorities to coordinate the protection of the environment while promoting innovation. The third and last step is one sea basin strategy consisting of measures to promote sustainable growth taking into account the local climatic, economic, cultural and social factors. The perspective of the strategy is mainly in the environmental benefits, but the political target is also in the fundamental change of the conditions for fishing in the country: to combat and reduce illegal fishing and to implement a fisheries management system based on fishing rights. This would lead to a more efficient and profitable marine resources management, allowing to get up to 50% more profits for fishermen, according to Rodrigo Elizarrarás, political analyst.
In Mexico, the Ministry of Environment and Natural Resources (SEMARNAT) oversees the formulating, issuing and executing MSP along with other federal agencies and agencies at the state and municipal levels. Based on ecosystem characteristics, there are four marine planning regions identified in Mexico:
1) the Northern Pacific,
2) the Central Southern Pacific Ocean,
3) the Gulf of California; and
4) the Gulf of Mexico and the Caribbean Sea.

37 Sustainable Engagement in the Indian and Finnish Business
All these regions hold unique ecological importance, for example the coral reefs and rock bottoms, as well as bays, coastal shoals, and sandy beaches. Currently, only the Gulf of California and the Gulf of Mexico have an approved Maritime Spatial Plan that is being implemented. The plan for the Northern Pacific has also been completed, and the MSP for the Central Southern Pacific Ocean is expected to be completed by 2018, as well. (UNESCO MSP Mexico.)
The state of Mexico has prepared the National Development Plan and several sectoral and special programs for coastal and maritime zone development. These include instruments for environmental planning, instruments for the identification of risk and vulnerability, sanitary regulation instruments, and financial and economic instruments. Maritime Spatial Planning in Mexico can bring a significant value for all the activities that require permits, location, or governmental licensing. At the moment, MSP is focusing for the Gulf of Mexico on regulation of activities of the energy, maritime, and fisheries sectors, as the MSP processes in the Pacific areas are currently considering the interactions among the tourism, conservation, and fishery sectors. (UNESCO MSP Mexico).
The main economic potential in Mexico lies in aquaculture, tourism, and fishing. Tourism includes marine, coastal, and cruise tourism. Opportunities can also be found in blue energy, marine mineral resources, marine biotechnology, desalination, coastal protection, maritime security and surveillance, and environmental monitoring, as well as in combined uses of maritime resources. The strengths and opportunities are strongly linked to the geographic position of Mexico and its environment such as its wealth and biological diversity.

38 Sustainable Engagement in the Indian and Finnish Business
5. Analysis and Discussion on the EU Strategies
Blue growth, when optimizing the gains received from the sustainable development of marine environments (United Nations, 2015) will benefit several states and regions of the world, and managing sea resources efficiently, fairly, and sustainably is integral for water protection, biodiversity, food security, and climate change, and for the sake of environmental and social justice. From the beginning, the action on Blue Growth has relied on enabling market forces by removing those barriers and market failures that prevent innovation and investment (European Commission, 2017). It is highly important for governments, businesses, and citizens to find the right balance between economic value and environmental quality when deciding on the use of our water areas. Cross-border planning exercises have then been used to support spatial cross-border planning processes (see overview of cross-border MSP projects at the European MSP platform: http://msp-platform.eu/msp-practice/msp-projects).
The primary challenge of “blue” business activities relates to continued performance in the situation of the strong external pressures and fierce competition from global players. External drivers and megatrends (such as climate change adaptation, ageing populations, urbanization, digitalization) shape the business environment of the blue sectors. As the marine systems have faced pressures, ranging from overfishing, increasing resource extraction, and alteration of coastal zones to various types of pollution (Visbeck et al., 2014), the future success of the sectors will depend on the strategies and business models implemented as well as on the ability of the sectors to adopt increasingly sustainable practices and to export to global markets. The European Blue Growth initiative specifically aims to promote synergies and to foster the framework conditions that support specific maritime economic activities and their value chains. Concretely, this translates into a particular emphasis on activities in the (pre-) development stage and targets the maritime clusters and localities. Blue Growth requires a range of framework conditions to be fulfilled, most obviously: adequate infrastructure (including transport infrastructure, but also high-voltage and cross-border electricity grids) and highly skilled staff with access to low skilled workers. Other essential conditions include public acceptance of the blue sector activities, a solid international legal framework regarding the international waters, and good governance at local and regional levels. A predictable institutional environment can facilitate blue growth. The future is uncertain and clean-tech innovation does not happen automatically. Businesses base strategies on values and adjust to uncertainties that lie in their natural and social environments. Regulation and economic incentives can be used to foster innovation; however, as both economic activities and environmental pressures are transboundary, international coordination and negotiated solutions are needed. At the same time, it should be recognized that choices will need to be made in contexts where space is limited and the combination of all activities is not feasible.

39 Sustainable Engagement in the Indian and Finnish Business
Each of Europe’s sea basins has its own economic, social, environmental, geographic, climatic, and institutional characteristics that will contribute to a differentiated Blue Growth path. Individual maritime economic activities do not always have the critical mass to prosper alone. Furthermore, conditions for growth are not always realized, particularly if they are located in sparsely populated or peripheral regions of Europe. The potential of Blue Growth can be reinforced by taking advantage of synergies. The maximization of such synergies can often be achieved through maritime clusters, information on performance, value chains, main drivers and framework conditions for the sector developments. In order to take advantage of their future potential, maritime economic activities need to be combined: smart combinations will take the advantage of synergies and build critical mass. Innovation is a key to this. New sources of growth are triggered by continuous innovation. At the same time, innovation activates labor productivity improvements, which have a direct impact on economic growth.
The importance of the European Blue Economy has also been assessed on the basis of the research and innovation performance, as these hold the key to creating a future Blue Growth potential and in establishing a strong competitive position for Europe. Europe still has a leading position in patent applications within wind energy and renewable ocean energy, as well as with marine aquatic products and in the field of oil and gas. The pace at which the development occurs is largely determined by context. Research, development, and innovation are at the heart of any Blue Growth strategic framework. The future development potential of a Blue Growth strategy strongly depends on the ability of the economic actors to find business models which fit the developmental stage of the target markets and the global competitive environments.
There are some precautions concerning the European Blue Growth strategy. According to Jones et al. (2016), the realities of MSP contrast with widely recognized concepts and ideals as to how it should work, as political expedience and blue growth priorities are competing with ecosystem-based planning and priorities of good environmental status. During the last decades, the European seas and oceans have been degraded by pollution from land and sea-based sources, such as overfishing and unsustainable fishing practices, and because of the negative effects of climate change. Degradation of marine and coastal ecosystems and marine biodiversity is observed in most seas. The environmental impacts of new and innovative Blue Growth activities are uncertain, as the marine ecosystems are complex where the dependencies in the marine environment are not being understood well. While acknowledging some of the environmental risks, the EU Blue Growth strategy gives little or no indication as to how the precautionary principle will be applied in the further development of the five chosen blue growth focus areas (aquaculture, tourism, renewable energy, marine mineral resources, and blue biotechnology). For these areas, the magnitude and scope of environmental impacts are uncertain and partly unknown. The gaps in data and knowledge can be considered important. There are some

40 Sustainable Engagement in the Indian and Finnish Business
specific features of the sea environment that should be taken into account in planning: the three-dimensional structure of the sea complicates the planning. The sea surface, free water, and the bottom need to be planned separately. In the same spot, there can be different activities in these three levels. Also the freely moving water complicates impact assessment and can transport potential impacts of human activities such as dredging material and chemicals far, even to the territory of another state. Information acquisition from underwater is also much more difficult and expensive than above ground.
The procedure of deep sea mineral mining is especially worrying. Deep-sea minerals are considered as limited resources. Marine mining, by its nature, risks destroying the benthic ecosystems. Within aquaculture, there still are large gaps in knowledge regarding the impacts of the sector, which include pollution, habitat destruction, escaping fish, impacts on ecosystems, diseases, parasites, the use of chemicals, impacts related to fish meal, fish oil, and wild fisheries. An additional risk is the unspecific governance of aquaculture, which is scattered between various policy sectors. The Blue Growth strategy is particularly unclear about the possible environmental implications of blue biotechnology, only mentioning that “the main environmental pressure expected from this activity is the unintended extraction of species.” There is no data about the magnitude of this pressure. Further, the field of marine biotechnology is unclear and poorly regulated. Precautionary approaches should be developed for emerging issues and challenges related to bio-nanotechnology, biomaterials, and the introduction of genetically modified fish, shellfish, and micro-organisms, amongst others. A proper science base should be established to support appropriate ecological risk assessment and management.
The Blue Strategy Communication, clearly inspired by green economy principles, gives a prominent role to technology, efficiency, and innovation. However, it also seems that the constant growth of the last two centuries has been driven by the fossil resources. In reality, efficiency and greener technologies are not always sufficient or able to break the link between environmental damage and economic growth. The accumulation of crises of the past years (economic, food, energy, climate, and environmental crises), is a serious reminder that there are indeed limits to growth. We need efficiency, but we also need a policy that “contains” growth with serious respect to the environment to ensure that development stays within the boundaries of the planet’s environmental limits. The Blue Growth strategy should aim to combine the efficient use of resources with moderate growth goals, based on long-term needs assessments of current and future generations. Maritime spatial planning is an important geography-based tool that aims to protect the environment while allowing economic sectors to grow. MSP needs to be framed by the objectives of the MSFD directive and complemented by a variety of other policy instruments, such as the integration of environmental costs in the pricing of ocean-

41 Sustainable Engagement in the Indian and Finnish Business
based goods and services, and a shift of subsidies away from environmentally harmful activities towards services that enhance public goods. Impacts of MSP processes must be followed to ensure that developments at sea or along Europe’s coasts do not compromise the objectives of nature conservation and environment protection legislation.
Environmental spatial protection measures such as Natura 2000 sites and other marine protected areas (MPAs), both individually and as coherent networks, must be duly considered within the planning process, and MSP must ensure enough space and protection for marine biodiversity, ecosystems, and the wider marine environment. However, environmental protection should not be limited to specific areas, but all activities on the sea should be sustainable. The Blue Growth Strategy should first and foremost ensure a better understanding of the accumulative impacts of human uses of maritime space for the five priority areas and beyond, avoiding the creation of activities that lead to negative effects and depletion of finite marine resources. Ignorance should be acknowledged and addressed by scientific and technological methods and public and participatory policy-making. Innovation can help develop the blue economy in a way that not only fuels the EU growth and job creation but also maintains the public support for the commercial use of marine resources while ensuring the protection of the marine environment.
While MSP is the large-scale process and plan, the finer details of where to place a fish farm, wind mill, national park, or shipping lane will depend on local debate (Nautical Institute). Environmental permit procedures need to be predictable and efficient for blue sector actors while allowing participatory hearings and balancing of stakeholder interests for achieving legitimate management of the blue resources.

42 Sustainable Engagement in the Indian and Finnish Business
6. Final Conclusions
Promoting the blue economies is a high priority for several European countries, the European Union, and also for other countries, such as Mexico. The sea and coasts are drivers of the new economy and therefore support a variety of human activities that provide regional well-being through value chain and jobs (Remotti & Damvakeraki, 2015). Global tourism has experienced continued growth over the last decades and cruise tourism is of the fastest growing economic sectors in the world. Aquaculture is needed for providing nutritious food for the world’s growing population. Blue biotechnology holds the promise of providing societies with new innovative ingredients (i.e. biomedical applications). Marine energy has its role in climate change mitigation, providing energy with lower or zero emissions of greenhouse gases.
Sustainable blue growth is an achievable target, at least in theory. Development of the blue sectors must be sustainable in economic, social, and environmental terms. The goal of environmental and resources law is that ecosystem-based resources are managed efficiently, and that species and their habitats are protected. Social justice requires that the distribution of blue growth benefits is fair between the stakeholders. The multilevel blue growth governance system consists of both generalized and sector-specific agencies and agents, which creates the need to settle between competing or contradictory goals.
More research on the environmental impacts of the new blue sectors is needed, as the marine ecosystems are complex. Policy tools for achieving sustainable blue growth include maritime spatial planning based on the ecosystem approach, policies that integrate the negative externalities in the prices of blue goods and services, and subsidy policies promoting sustainable innovation. Blue growth must not repeat the mistakes of the land-based growth where pollution, deforestation, extinction of species, and exhaustion of both non-renewable and renewable resources are common problems.
43 Sustainable Engagement in the Indian and Finnish Business
References
Bonus – Towards sustainable blue growth: Outline of the joint Baltic Sea and the North Sea research and innovation programme 2018–2023. Bonus Programme Publication. <https://www.bonusportal.org/files/4699/BONUS_Publication_No_15.pdf>, retrieved 23 March 2017.
Burgess, M. G., Clemence, M., McDermott, G. R., Costello, C. & Gaines, S. D. (2016). Five rules for pragmatic blue growth.<http://dx.doi.org/10.1016/j.marpol.2016.12.005>, retrieved 23 March 2017.
Celtic Seas Partnership. Blue Growth in Europe: Is Blue Growth compatible with achieving Good Environmental Status? <http://celticseaspartnership.eu/blog/blue-growth-europe/>, retrieved 18 April 2017.
Ceron, F. (2017). Mexico – Oil and Gas. Mexico country commercial guide. <https://www.export.gov/article?id=Mexico-Upstream-Oil-and-Gas>, retrieved 31 July 2018.
de Groot, J., Campbell, M., Ashley, M. & Rodwell, L. (2014). Investigating the Co-Existence of Fisheries and Offshore Renewable Energy in the UK: Identification of a Mitigation Agenda for Fishing Effort Displacement. Ocean & Coastal Management 102(A), 7–18.
Dom, A. (2016). Seas at risk: MSP Implementation. <http://eeac.eu/wpcontent/uploads/2016/05/Maritime-Spatial-Planning-implementation-by-Ms.-Dom.pdf>, retrieved 23 March 2017.
Douvere, F. & Ehler, C.N. (2011). The importance of monitoring and evaluation in adaptive maritime spatial planning. Journal of Coastal Conservation 15 (2), 305–311.
Eikeset, A. M., Mazzarella, A. B., Davíðsdóttir, B., Klinger, D. H., Levin, S. A., Rovenskaya, E. & Stenseth, N. C. (2018). What is blue growth? The semantics of “Sustainable Development” of marine environments, Marine Policy, Volume 87, 2018, Pages 177-179, ISSN 0308-597X, https://doi.org/10.1016/j.marpol.2017.10.019.
Ecorys (2012). Blue Growth. Scenarios and drivers for Sustainable Growth from the Oceans, Seas and Coasts. Final Report. Rotterdam/Brussels.<https://webgate.ec.europa.eu/.../Blue%20Growth%20Final%20Report%201309202>, retrieved 23 March 2017.
Ehler, C. N. (2011). Marine Spatial Planning In the arctic: A first step toward ecosystem-based management in: The shared Future: a report of the Aspen Institute Commission on Arctic Climate change The Aspen Institute, Washington DC, United States. <http://www.aspeninstitute.org/policy-work/energy-environment/our-policy-work/dialogue-commission-arctic-climate-cha>, retrieved 5 May 2017.
ELY Centre (Finnish Regional Centres for Economic Development, Transport and the Environment) website. <https://www.ely-keskus.fi/en/web/ely-en/>, retrieved 26 March 2017.

44 Sustainable Engagement in the Indian and Finnish Business
European Commission. Blue growth. <http://ec.europa.eu/maritimeaffairs/policy/blue_growth_en>, retrieved 23 March 2017.
European Commission (2008). Komission tiedonanto – Merten aluesuunnittelua koskeva toimintasuunnitelma yhteisten periaatteiden saavuttamiseksi EU:ssa. <http://eurlex.europa.eu/legal-content/FI/TXT/?uri=celex:52008DC0791>, retrieved 23 March 2017.
European Commission (2011). Study on the economic effects of Maritime Spatial Planning. Final report. Study carried out on behalf of the European Commission. European Commission Maritime Affairs, Brussels. <https://ec.europa.eu/maritimeaffairs/sites/maritimeaffairs/files/docs/body/economic_effects_maritime_spatial_planning_en.pdf>, retrieved 26 March 2017.
European Commission (2017a). Guide on EU funding for the tourism sector – updated version <http://ec.europa.eu/growth/tools-databases/newsroom/cf/itemdetail.cfm?item_id=8496, retrieved 18 April 2017.
European commission (2017b). Report on the Blue Growth Strategy Towards more sustainable growth and jobs in the blue economy, Commission staff working document, Brussels, 31.3.2017, https://ec.europa.eu/maritimeaffairs/sites/maritimeaffairs/files/swd-2017-128_en.pdf, retrieved 12 May 2017.
European MSP Platform. <http://www.msp-platform.eu/faq/msp-blue-growth>, retrieved 24 March 2017.
Faber, B. & Gaubert, C. (2016). Tourism and Economic Development: Evidence from Mexico’s Coastline. Seminar Papers. The London School of Economic and Political Science. <http://sticerd.lse.ac.uk/seminarpapers/dg141116.pdf>, retrieved 31 July 2018.
Food and Agriculture Organization [FAO]. 2012. FAO yearbook. Fishery and Aquaculture Statistics, 2010. Rome, FAO. 78 pp.
FAO (2014). Blue Growth: Unlocking the Potential of Seas and Oceans. <http://www.fao.org/zhc/detail-events/en/c/233765/>, retrieved 5 May 2017.
FAO (2015). Achieving Blue Growth through implementation of the Code of Conduct for Responsible Fisheries. http://www.fao.org/fileadmin/user_upload/newsroom/docs/BlueGrowth_LR.pdf, retrieved 26 March 2017.
Finland’s Environmental Administration. Environment.fi. < http://www.ymparisto.fi/enUS/Finlands_environmental_administration(24294)>, retrieved 26 March 2017.
GeoMexico (2012). How important is the fishing industry in Mexico? <http://geo-mexico.com/?p=6594>, retrieved 31 July 2018.

45 Sustainable Engagement in the Indian and Finnish Business
Government proposal 62/2016. Hallituksen esitys eduskunnalle laeiksi maankäyttö- ja rakennuslain ja Suomen talousvyöhykkeestä annetun lain 3 §:n muuttamisesta. <http://www.finlex.fi/fi/esitykset/he/2016/20160062#idp714864>, retrieved 24 March 2017.
Gilliland, P.M. & Laffoley, D. (2008). Key elements and steps in the process of developing ecosystem-based marine spatial planning. Marine Policy 32(5), 787–796.
HELCOM-VASAB. Country fiche. Finland. <http://www.helcom.fi/Documents/Action%20areas/Maritime%20spatial%20planning/Country%20fiche_FI_Oct2016.pdf >, retrieved 31 July 2018.
Jones, P., Lieberknecht, L.M. & Qui, W. (2016). Marine spatial planning in reality: Introduction to case studies and discussion to findings. Marine Policy 71, 256–264.
Katsanevakis, S., Levin, N., Coll, M., Giakoumi, S., Shkedi, D., Macjekworth, P., Levy, R., Velegrakis, A., Koutsoubas, D., Caric, H., Brokovich, E., Öztürk, B. & Kark, S. (2014). Marine conservation challenges in an era of economic crisis and geopolitical instability: The case of Mediterranean Sea. Marine Policy 51, 31–39.
The Nautical Institute (2017). Marine Spatial Planning. http://www.nautinst.org/en/forums/msp/>, retrieved 18 April 2017.
The Nautical Institute (2013). The Shipping Industry and Marine Spatial Planning. A professional approach. <http://www.nautinst.org/download.cfm?docid=9423102B-A083-4C8D-94B6BB215544BB42>, retrieved 26 April 2017.
OECD, IEA. (2016). Mexico Energy Outlook World Energy Outlook Special Report. <https://www.iea.org/publications/freepublications/publication/MexicoEnergyOutlook.pdf>, retrieved 31 July 2018.
OECD. (2018). Country statistical profile. <https://data.oecd.org/>, retrieved 31 July 2018.
PWC (2016). Mexico’s Rising: Resilience and Reforms. https://www.pwc.com/gx/en/growth-markets-centre/assets/pdf/gmc-webcast-mexico.pdf>, retrieved 25 April 2017.
Remotti, L. & Damvakeraki, T. (2015). Ocean research in Horizon 2020: The Blue Growth potential. Study for the ITRE committee, Directorate General for Internal Policies, Policy Department A: Industry, Research and Energy, European Parliament. <http://www.europarl.europa.eu/RegData/etudes/STUD/2015/518775/IPOL_STU(2015)518775_EN.pdf>, retrieved 6 May 2017.
Secretariat of the Convention on Biological Diversity. (2012). Marine Spatial Planning in the Context of the Convention on Biological Diversity. CBD Technical Series No. 68. <https://www.cbd.int/doc/publications/cbd-ts-68-en.pdf>, retrieved 25 March 2017.
Smart Sea project. Blue Growth explained. <http://smartsea.fmi.fi/blue-growth-explained/>, retrieved 26 March 2017.

46 Sustainable Engagement in the Indian and Finnish Business
Taipale, K. (2016). Helsinki EU Office. EU:n meritoimialan kasvunäkymiä pohdittiin EU:n meripäivän suurkonferenssissa. <https://helsinki.eu/wp-content/uploads/2016/06/EUn-merip%C3%A4iv%C3%A4t.pdf>, retrieved 25 March 2017.
Tarvainen, H., Tolvanen, H. & Repka, S. (2015). How Can Maritime Spatial Planning Contribute to Sustainable Blue Growth in the Baltic Sea? BMI 30(1), 86–95.
UNEP (2011). Taking Steps toward Marine and Coastal Ecosystem-Based Management – An IntroductoryGuide. UNEP Regional Seas Reports and Studies No 189.http://www.unep.org/pdf/EBM_Manual_r15_Final.pdf, retrieved 31 July 2018.
UNESCO MSP Programme website, <http://msp.ioc-unesco.org/world-applications/europe/france/>, retrieved 23 March 2017.
UNESCO. Maritime Spatial Planning Programme. France. <http://msp.ioc-unesco.org/worldapplications/europe/france/>, retrieved 26 March 2017.
UNESCO. Marine Spatial Planning Program. Mexico. <http://msp.ioc-unesco.org/world-applications/americas/mexico/>, retrieved 18 April 2017.
United Nations (2015). Environmental Program (UNEP), Blue Economy: Sharing Success Stories to Inspire Change, UNEP Regional Seas Report and Studies N° 195, <http://www.unep.org/greeneconomy> retrieved 8 May 2017.
Visbeck, Kronfeld-Goharani, Neumann, Rickels, Schmidt, van Doorn, Matz-Lück, Ott & Quaas. (2014). Securing blue wealth: The need for a special sustainable development goal for the ocean and coasts, Marine Policy 48, 184–191.
Sustainability Model to Favour Healthcare Enrichment
Dr. Abhijit Pandit Assistant Professor of Amity Business School, Amity University, Kolkata
Abstract
This study identified a sustainable leadership competency model leading to business growth and development for developing healthcare executives in Kolkata, India, based on the Healthcare Leadership (HL) Model. Eleven chief executive officers and chief medical officers were interviewed. They considered 86% of the HL competencies as very important and perceived a gap in the performance of these competencies. They also identified additional vital competencies beyond the scope of the model. The participants also reported that leadership development and succession planning programmes were lacking. Recommendations are to design a leadership development programme by using the HL model as a framework and further customization of the approach as per the organization’s unique mission, vision, strategy, values, and circumstances. The HL is offered as a general strategy for leader development that could be useful in the growth and development of private healthcare industry, based on some “best practices” in the design and implementation of the leadership programmes.
Keywords: healthcare, competencies, growth, development, model.

48 Sustainable Engagement in the Indian and Finnish Business
1. Introduction
As the concept and practices of hospitals have evolved, management models have also changed, from adoption of business management models, which emphasizes self-reliance, productivity and profitability, up to meeting the needs and expectations of all stakeholders.
According to Malagón-Londoño et al. (1996), modern hospitals are companies in which complex processes of various kinds converge, such as healthcare, hospitality services, scientific research, training and education, drug manufacturing, and the attention to the typical areas of any company: human resources, suppliers, legal issues, and finance. Notably, these tasks can only be conducted successfully with an efficient management.
Like any typical modern enterprise, the survival and consolidation of a hospital depends on its effectiveness to meet the expectations of its stakeholders for which it has to drive a complex system composed of elements and processes of various kinds. Hospital stakeholders include clients, patients, employees, investors, suppliers, insurance companies, government agencies, and financial institutions.
To be a good manager it is no longer sufficient to perform the traditional functions of planning, organizing, directing, and controlling. According to Kouzes and Posner (1998), the main functions of a leader should be challenging the process, inspiring shared vision, enabling others to act, modelling the way, and handling the increasing uncertainty and complexity.

49 Sustainable Engagement in the Indian and Finnish Business
2. Background of Study
This study sought to identify a leadership competency model for developing healthcare executives based on the Healthcare Leadership (HL) Model which would lead to growth and development of healthcare organization.
The exercise of effective leadership in any business is crucial for the achievement and sustainability of long-term desired results. This is even more critical for hospital companies because, by their very nature, the impact of success or failure on management is critical. If a company does not succeed either in production or marketing of consumer goods or the provision of certain services, it may disappear, resulting in their stakeholders losing something valuable. However, if a hospital does not fulfil its commitment, what is at stake, ultimately, is people’s lives and health. It is, therefore, crucial that an effective leadership attains proper coordination of people and processes. In the global context, there are large areas of opportunity in business management, particularly in hospital organizations. As such, this study will be a pioneering contribution in this field.
The information for this study was obtained from interviews with chief executive officers (CEOs) and chief medical officers (CMOs) of Indian private healthcare organizations located in Kolkata with 250 to 1,200 employees and serving 3,600 to 15,000 patients per year.

50 Sustainable Engagement in the Indian and Finnish Business
3. Review of Literature
Aitken and Higgins (2010) mention that an organization’s environment has the following characteristics: increasing levels of competence, demands from investors and other stakeholders, globalization, evolving nature of the workforce, technology, legal and regulatory changes, as well as social changes.
Hartley and Bennington (2010) suggest “The Warwick Six C Leadership Framework” which comprises a structure to classify and portray different aspects of leadership. The six Cs are concepts, characteristics, contexts, challenges, capabilities, and consequences. Each one of these elements has a myriad of definitions and approaches.
In the healthcare industry, Goodwin (2006) says that leadership is a dynamic process of pursuing a vision for change in which the leader is supported by two main groups: (a) followers within the leader’s own organization and (b) influential players and other organizations in the leader’s wider, external environment. The leader incorporates a broader view by considering not only the influence they exert in the group and on the key stakeholders within the environment.
There are substantial differences between these definitions. While some emphasize the importance of goals or purposes, others focus on the process or social dynamics. Also, others centre round the group, organization, or social system. While some highlight the intention of satisfying the needs of the followers, others include the existence of challenging situations as detonator. Despite these variations, almost all of them share the idea that leadership is mainly about the exertion of influence among and between human beings with the intention of achieving a certain purpose.

51 Sustainable Engagement in the Indian and Finnish Business
The leadership competencies are as follows:
• Transformation. Visioning, energizing, and stimulating a change process that binds communities, patients, and professionals around new models of healthcare and well-being. The models include achievement orientation, analytical thinking, community orientation, financial skills, information seeking, innovative thinking, and strategic orientation.
• Execution. Translating vision and strategy into optimal organizational performance. These competencies include accountability, change leadership, collaboration, communication, impact and influence, information technology management, initiative, organizational awareness, performance measurement, process management, and organizational design and project management.
• People. Creating an organizational climate that values employees from all backgrounds and provides an energizing environment for them. This competency also includes the leader’s responsibility to understand their impact on others and to improve their capabilities, as well as the capabilities of others. It includes competencies such as human resources management, interpersonal understanding, professionalism, relationship building, self-confidence, self-development, talent development, and team leadership.

52 Sustainable Engagement in the Indian and Finnish Business
4. Methodology
Given the unquestionable significance of counting on effective leaders in the hospital industry, it is required to depend on solid competency models to guide the leadership development efforts in this sector. The research questions were as follows:
• Is there a leadership competencies model applicable to Indian private healthcare organizations?
• How do top leaders in Indian private healthcare organizations perceive their own performance?
• What kind of a framework would be helpful to develop the leadership capability required for top leaders in Indian private healthcare organizations?
Phase 1: Preparation
The Health Leadership Competency Model was developed from an extensive academic research and an implementation in hospital institutions and other kinds of organizations. During the initial stages of the model’s development, interviews, psychometric analysis and comparative studies were carried out in different business sectors.
Phase 2: Data Collection
The interview was conducted in two sections: (a) competency scoring on importance and performance based on the HL Model and (b) open-ended questions.
Interviewees were asked to score each competency, using a scale from 1 (low) to 5 (high) for both importance and performance of the CEOs and CMOs. They were also asked to comment on the reasons behind the scores.

53 Sustainable Engagement in the Indian and Finnish Business
Phase 3: Analysing the Data
For the first part of the interviews, the IPA (Importance-Performance Analysis) method was used, originally developed by Martilla and James (1977). This method allows the evaluation of each item separately, in a double dimension: the value assigned by the interviewee and the actual reality perceived by them. Generally, the results are plotted into a two-by-two matrix, in which the vertical axis represents importance and the horizontal axis represents performance, thus providing the following four quadrants:
• Quadrant A: High importance/low performance. The items placed in this quadrant require immediate attention.
• Quadrant B: High importance/high performance. The items placed in this quadrant represent the main strengths, which must be maintained and reinforced.
• Quadrant C: Low importance/low performance. The items placed in this quadrant represent weaknesses, although, given the fact that they are not considered important, they are not priorities and do not require additional efforts at the moment.
• Quadrant D: Low importance/high performance. The items placed in this quadrant represent efforts, in a certain way wasted or useless, since whatever is done in this regard does not add value.
Phase 4: Merging and Making Sense of the Data
Once the data were grouped and analysed for frequencies, a matchmaking process was made between the data of the two parts to make sense of it.

54 Sustainable Engagement in the Indian and Finnish Business
5. Data Analysis and Discussion
This study sought to identify a leadership competency model for developing healthcare executives in India based on the HL Model. First, the results of the IPA (Importance-Performance Analysis) are presented. General findings, CEO findings, CMO findings, and areas of CEO-CMO agreement are discussed. Next, the interview results are presented.
Importance-Performance Analysis Findings
General findings. The IPA helps find the gap between the competencies that are considered important and the performance perceived in those competencies by CEOs and CMOs. The action plans for improvement will reside in those competencies that have the highest importance together with the biggest gap. An overview of the most important and the least important is described here.
Twenty-two of the 26 competencies (84.61%) scored between 4 and 5 on a scale of 1 (low) to 5 (high). These results mean that 22 competencies are considered very important to vital within the context of the Indian healthcare industry. Only four competencies (community orientation, information seeking, impact and influence, and organizational awareness) received an average score between 3 and 4, meaning desired to very important. None of the competencies received an importance score below 3.2.
It is worth noting that the 22 competencies considered between very important and vital have a performance below 4, which positions them in the deficit quadrant. The competencies on this quadrant demand special attention, as shown in Figure 1 below. These competencies are very important, while simultaneously not reaching the expected performance levels.

55 Sustainable Engagement in the Indian and Finnish Business
Figure 1. Leader Perceptions of Healthcare Leadership Competencies.
The distance between the dot and the diagonal dotted line represents the gap between the scored importance and the perceived performance. The competencies with the greatest gaps are talent development (gap = 2.18), accountability (gap = 1.73), and human resource management (gap = 1.64). The competency with the shortest gap between importance and performance is information seeking (gap = 0.27).
Since one of the purposes of this study is to analyse the degree of adaptation of the HL competencies model to the Indian context, it is particularly relevant to observe the importance assigned to each competency by the interviewees. The following figure shows the competency in rank order by the importance followed by the corresponding level of the perceived performance.

56 Sustainable Engagement in the Indian and Finnish Business
Figure 2. Top Leader Perceptions of Importance and Performance of the Healthcare Leadership Competencies for N=11.
The competencies considered as the most important are professionalism (4.91), accountability (4.82), and talent development (4.70). Differences between importance and performance can be observed in following figure.
A way to interpret difference between perceived performance and scored importance, for example, in the case of talent development is by obtaining a correspondence of 54%, which is equal to ratio between its performance, graded as 2.5, and importance, graded as 4.7 (2.5/4.7 = 0.54=54%).
The differences between importance and performance and their respective percentage should be seen as complementary information, as the overall context is not taken into account in them. For example, information seeking has been graded with an average of 3.7 for importance and 3.5 for performance, meaning they have a 93% correspondence between performance and importance. However, this competency falls into the low priority quadrant.

57 Sustainable Engagement in the Indian and Finnish Business
Figure 3. Top Leader Perceptions of Differences between Importance and Performance for Healthcare Leadership Competencies for N=11.
As Figure 3 below shows, no significant differences appeared in the scores that the interviewees gave to each of the three groups of competencies of the HL Model of Transformation, Execution, and People.
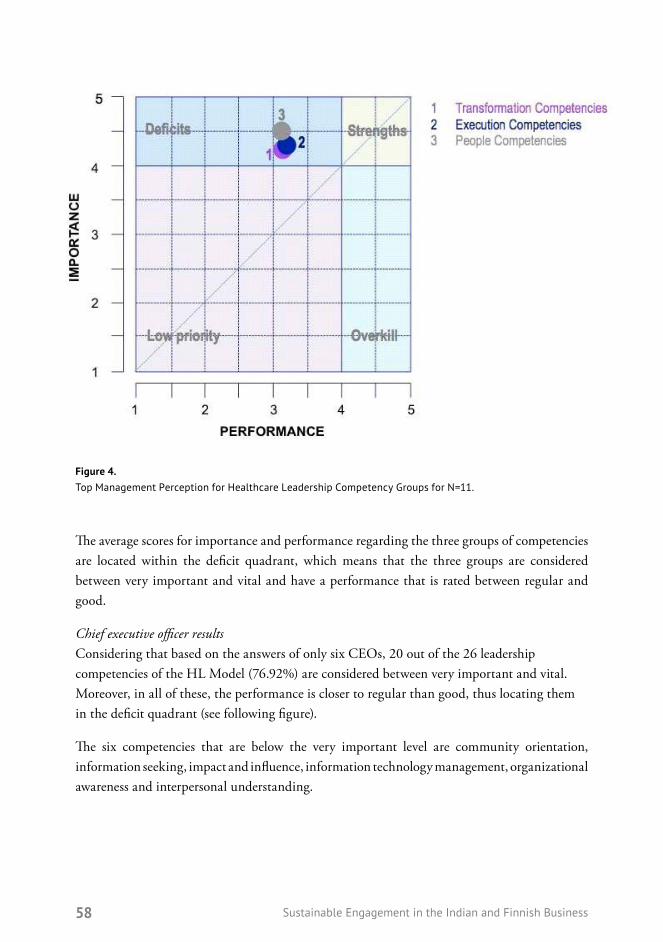
58 Sustainable Engagement in the Indian and Finnish Business
Figure 4. Top Management Perception for Healthcare Leadership Competency Groups for N=11.
The average scores for importance and performance regarding the three groups of competencies are located within the deficit quadrant, which means that the three groups are considered between very important and vital and have a performance that is rated between regular and good.
Chief executive officer results Considering that based on the answers of only six CEOs, 20 out of the 26 leadership competencies of the HL Model (76.92%) are considered between very important and vital. Moreover, in all of these, the performance is closer to regular than good, thus locating them in the deficit quadrant (see following figure).
The six competencies that are below the very important level are community orientation, information seeking, impact and influence, information technology management, organizational awareness and interpersonal understanding.
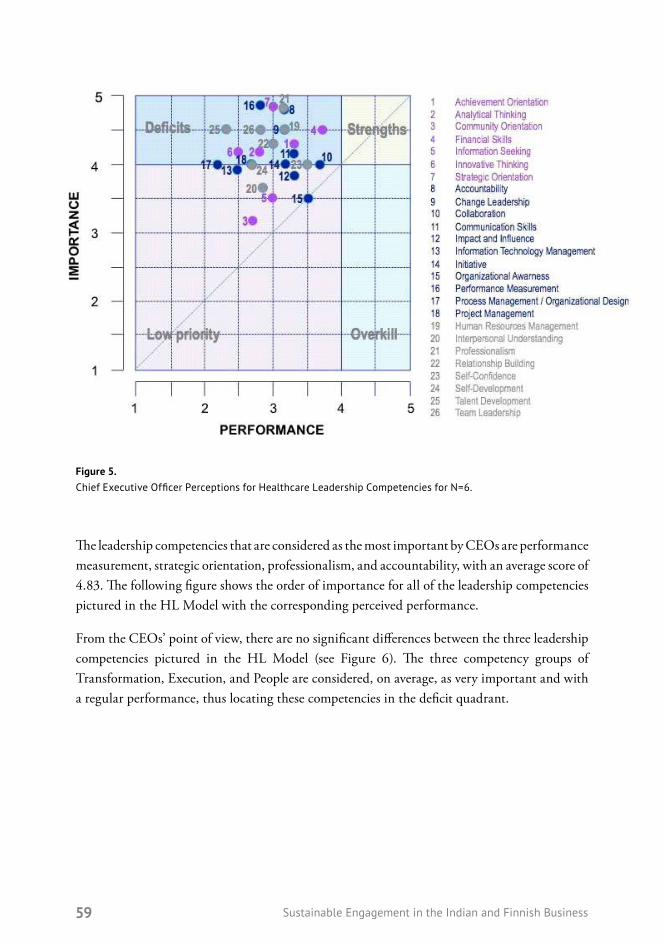
59 Sustainable Engagement in the Indian and Finnish Business
Figure 5. Chief Executive Officer Perceptions for Healthcare Leadership Competencies for N=6.
The leadership competencies that are considered as the most important by CEOs are performance measurement, strategic orientation, professionalism, and accountability, with an average score of 4.83. The following figure shows the order of importance for all of the leadership competencies pictured in the HL Model with the corresponding perceived performance.
From the CEOs’ point of view, there are no significant differences between the three leadership competencies pictured in the HL Model (see Figure 6). The three competency groups of Transformation, Execution, and People are considered, on average, as very important and with a regular performance, thus locating these competencies in the deficit quadrant.

60 Sustainable Engagement in the Indian and Finnish Business
Figure 6. Chief Executive Officer Perceptions for Healthcare Leadership Competency Groups for N=6.
Chief medical officer results Based on data from the five CMOs, 25 of the 26 leadership competencies pictured in the HL Model are very important to vital. It is worth noting that 23 of the competencies considered between very important and vital have a performance close to regular, thus locating them in the deficit quadrant. In contrast to the CEOs’ perceptions, the CMOs believe that two competencies are located in the strengths quadrant: self-confidence and information seeking (see the purple circles in Figure). Only one competency is considered desired, which means a level lower than very important, namely community orientation.
Chief Medical Officer Perceptions for Healthcare Leadership Competencies Leadership competencies that are considered the most important for CMOs are talent development, professionalism and achievement orientation, with an average score of 5.
The following figures show the order of scored importance to all the HL Competencies Model, with the correspondent levels of perceived performance and the difference between the scored importance and the perceived performance of interviewed CMOs. As it can be observed, the competencies with the greatest gap between the scored importance and the perceived performance are financial skills, talent development, and human resources management.

61 Sustainable Engagement in the Indian and Finnish Business
Figure 7. Chief Medical Officer Perceptions of Importance and Performance for HL Competencies for N=5.

62 Sustainable Engagement in the Indian and Finnish Business
Figure 8. Chief Medical Officer Perceptions of Differences between Importance and Performance for Healthcare Leadership Competencies for N=5.
Small differences were produced between the three groups of competencies; however, from the CMOs’ perspective, they are not significant, as the three competency groups (Transformation, Execution, and People) are considered on average very important and have a regular performance (see Figure 9). These results mean that the three groups are plotted in the deficit quadrant. However, it is worth noting that competencies such as people competencies, on average, are considered the most important.

63 Sustainable Engagement in the Indian and Finnish Business
Figure 9. Chief Medical Officer Perceptions for Healthcare Leadership Competency Groups for N=5.
Areas of agreement between chief executive officers and chief medical officers Only in the case of professionalism do CMOs and CEOs concur by scoring the competencies as one of the three most important; however, in general, a high level of coincidence exists with respect of the importance assigned to all competencies.
Regarding the gaps, the only area of CEO-CMO agreement is talent development. Both groups agree that one of the greatest gaps between the scored importance and the perceived performance appears in this competence.

64 Sustainable Engagement in the Indian and Finnish Business
Interview Results
Interviewees were asked six questions to gather additional data about needed leadership competencies within the context of private hospitals in India. This section presents the interview data and differentiates the CEOs’ and CMOs’ perspective.
Additional competencies needed Participants were asked, “After reviewing the HL leadership model competencies, do you think there are other additional competencies needed for the Indian context? Please name them.” Five out of six CEOs affirm that business acumen is fundamental and vital.
Summary
The summarized IPA and interview results are as follows:
• HL Model competencies are well suited for the Indian private healthcare organizations’ context, as 86.61% of the competencies are considered by the interviewees between very important and vital. The rest of the competencies, which add up to the 15.39%, are considered between desired and very important.
• The survey results suggest that CMOs see more room for improvement than the CEOs. Whereas 96.15% of CMOs rated the competencies as either very important or vital, CEOs rated only 76.92% of the competencies in the same range.
• In all competencies considered in the questionnaire as very important by CEOs and CMOs, a performance deficit was noted for each, meaning there is plenty of space for development. The top-ranked disparities found were talent development (gap = 46%), accountability (gap = 36%), process management and organizational design (gap = 36%), human resources management (gap = 35%), and performance measurement (gap = 34%).
• The leadership competencies considered the most important by CEOs were performance measurement, strategic orientation, professionalism, and accountability (mean score = 4.83). The competencies with the greatest gap between the scored importance and the perceived performance were talent development, performance measurement, process management and organizational design and strategic orientation.
• The leadership competencies considered the most important for CMOs were talent development, professionalism and achievement orientation (mean score = 5). The competencies with the greatest gap between the scored importance and the perceived performance were financial skills, talent development, and human resources management.
65 Sustainable Engagement in the Indian and Finnish Business
• The interview data suggested that the CEOs and CMOs consider a majority of the competencies very relevant; however, they identified additional critical competencies, including business acumen, decision making, conflict management, constructive feedback, stress management, empathy, personal administration, quality orientation, uncertainty management, empowerment, ownership, self-knowledge, synthesis capacity, perseverance, resiliency, and effective negotiation.
6. Conclusion
• A total of 86.61% of the leadership competencies identified in the HL Model are considered by the CMOs and CEOs as very important or vital. The most important were professionalism (4.91), accountability (4.82), talent development (4.73) human resources management (4.64), and achievement orientation (4.64).
• There is a gap in performance regarding all of the HL leadership competencies. The most important areas of opportunity (mean score = with an average of 3.11) are talent development, accountability, human resources management, performance measurement, and financial skills.
• In addition to the competencies included in the HL model, the interviewees considered the following additional competencies as relevant for the Indian context: business acumen, decision making, stress management, conflict management, feedback, empathy, personal organization, quality orientation, empowerment, ownership, self-knowledge, perseverance, resiliency, negotiation, and uncertainty management.
• Both CEOs and CMOs emphasized that preparing their successors and strengthening their leadership competencies is of utmost importance; however, they do not have concrete strategies for meeting that purpose.

66 Sustainable Engagement in the Indian and Finnish Business
Limitations of the Study
The results of this study represent the particular perception of a small group of top leaders regarding the importance and performance of certain leadership competencies for CEOs and CMOs within the Indian private healthcare organizations. These results are not to be generalized to the whole healthcare system in India for several reasons. A statistical formula was not used to determine the size of the sample of interviewees regarding the total population of top leaders in the Indian private healthcare organizations (CEOs and CMOs). What was used is the criteria of availability and accessibility for the interviews. The importance and performance evaluation of the leadership competencies was completely subjective. In case of importance, it does not represent a problem because the objective was to understand the interviewee’s perspective regarding the importance of each competency. However, in the case of performance, the interviewees were not evaluating a specific subject but the average of their known CEOs or CMOs. Organization development practitioners should be aware that this general strategy for leaders’ development in the Indian healthcare industry is a theoretical elaboration and that it lacks the experimental research to confirm it.
Suggestions for Future Research
A leader development strategy for the Indian private healthcare industry has been proposed in this section, based on the findings of prior studies of best practices on leadership development. However, this particular strategy is still a theoretical elaboration, the validity of which can only be evaluated by the reality itself.

67 Sustainable Engagement in the Indian and Finnish Business
References
Adair, J. (2005). How to grow leaders: The seven key principles of effective leadership development. Philadelphia PA: Kogan Page.
Adair, J. (2007). Develop your leadership skills. Philadelphia PA: Kogan Page.
Aitken, P. & Higgs, M. (2010). Developing change leaders. Burlington MA: Elsevier.
Bass, B. M. (1990). From transactional leadership to transformational leadership.Learning to share the vision. Organizational Dynamics, 18(3), 19–36.
Bass, B. M. (1998). Transformational leadership. Mahwah NJ: Lawrence Erlbaum.
Blake, R. R. & Mouton, J. S. (1961). Group dynamics: Keys to decision making. Houston, TX: Gulf.
Boyatzis, R. (1982). The competent manager: A model for effective performance. New York, NY: Wiley.
Boyatzis, R. (2006). Leadership competencies. In R. Burke & C. L. Cooper (Eds.),Inspiring leaders (pp. 119–131). London, UK: Routledge.
Boyatzis, R. E., Cowen, S. S. & Kolb, D. A. (1995). Innovation in professional education: Steps on a journey from teaching to learning. San Francisco, CA: Jossey-Bass.
Burns, J. (1978). Leadership. New York, NY: Harper and Row.
Corporate Leadership Council. (2003). Highlights of effective leadership programs(Catalog Number CLC11EZAOJ). Washington DC: Corporate Executive Board.
Corporate Leadership Council. (2004a). Developing leadership competency models(Catalog Number CLC11TC4S2). Washington DC: Corporate Executive Board.
Corporate Leadership Council (2004b). Global leadership development programmes(Catalog Number CLC1-1KEAZN). Washington DC: Corporate Executive Board.
Dye, C. & Garman, A. (2006). Exceptional leadership: 16 critical competencies for health executives. Chicago, IL: Health Administration Press.
Goodwin, N. (2006). Leadership in healthcare: A European perspective. London, UK: Routledge.
Grandshaw, L., & Porter, R. (1989). The hospital in history. London, UK: Routledge.
Groves, K. S. (2011). Talent management best practices: How exemplary healthcare organizations create value in a down economy. Healthcare Manage Review, 36(3), 227–240.

68 Sustainable Engagement in the Indian and Finnish Business
Halpin, A., & Winer, B. (1957). A factorial study of the leader behavior descriptions. InR. Stogdill & A. Coons (Eds.), Leader behavior: Its description and measurement. Columbus, OH: Bureau of Business Research, Ohio State University.
Hartley, J., & Benington, J. (2010). Leadership for healthcare. Bristol, UK: The Policy Press.
Heifetz, R. A. (1994). Leadership without easy answers. Cambridge, MA: Harvard University Press.
Hirsch, W., & Strebler, M. (1994). Defining managerial skills and competencies. In A. Mumford (Ed.), Gower handbook of management development (pp. 79-96). London, UK: Gower.
Homans, C. G. (1961). Social behaviour: Its elementary forms. New York, NY: Harcourt, Brace & World.
Jackson, B., & Parry, K. (2008). A very short, fairly interesting and reasonably cheap book about studying leadership. London, UK: Sage.
Jennings, C., & Wargnier, J. (2011). Effective learning with 70:20:10. The new frontier for the extended enterprise. Retrieved from http://www.crossknowledge.com
Locke, E. A. (1991). The essence of leadership: The four keys to leading successfully.New York, NY: Lexington.
Martilla, J. A., & James, J. C. (1977). Importance-performance analysis. Journal of Marketing, 41(1), 77–79.
McAlearney, A. S. (2008). Using leadership development programs to improve quality and efficiency in healthcare. Journal of Healthcare Management, 53(5), 319–331.
McAlearney, A. S. (2010). Executive leadership development in U.S. health systems.Journal of Healthcare Management, 55(3), 206–222.
Malagón-Londoño, G., Galán, R., & Pontón, G. (1996). Administración hospitalaria.Buenos Aires, Argentina: Ed. Médica Panamericana.
Mirvis, P., Thompson, K., & Marquis, C. (2010). Preparing next generation business leaders. In M. G. Rothstein & R. J. Burke (Eds.), Self-management and leadership development (pp. 464–486). Northampton MA: Edwaard Eglar.
NHS Leadership Academy. (2013). Leadership framework (LF). Retrieved from http://www.leadershipacademy.nhs.uk/discover/leadership-framework/
Osborne, C. (2008) Leadership. New York, NY: DK Publishing.
Parry, K., & Bryman, A. (2006). Leadership in organizations. In S. R. Clegg, C. Hardy,B. Lawrence, & W. R. Nord (Eds.), The Sage handbook of organization studies(pp. 447–468). London, UK: Sage.

69 Sustainable Engagement in the Indian and Finnish Business
Rosen, G. (1985). El hospital. Sociología histórica de una institución comunitaria. In G. Rosen (Ed.), De la policía médica a la medicina social (pp. 316–325). Madrid, Spain: Siglo XXI.
Rubino, L. (2007). Leadership. In S. B. Buchbinder & N. H. Shanks (Eds.), Introduction to healthcare management (pp. 1–22). Sudbury MA: Jones and Bartlett.
Smircich, L., & Morgan, G. (1982). Leadership: The management of meaning. Journal of Applied Behavioral Science, 18(3), 257–273.
Spencer, L. M. (1991). Job competency assessment. In H. Glass (Ed.), Handbook of business strategy (pp. 28-1–28-20). Boston, MA: Warren Gorham and Lamont.
Spencer, L. M., McClelland, D. C., & Spencer, S. M. (1994). Competency assessment methods: History and state of art. London, UK: Hay/McBer Research Press.
Stogdill, R. (1950). Leadership, membership and organization. Psychological Bulletin, 47, 1–14.
Stogdill, R. (1974). Handbook of leadership: A survey of theory and research. New York, NY: Free Press.
Yukl, G. (2006). Leadership in organizations. Upper Saddle River, NJ: Pearson Prentice Hall.

70 Sustainable Engagement in the Indian and Finnish Business
Business Sustainability – Case Study of HUL and McDonald’s
Dr. Meenakshi Khemka Professor, Unitedworld School of Business, Kolkata
Abstract
Business sustainability is here to stay. As already discussed widely, there are three proclaimed pillars of sustainability – planet, people, profit, not necessarily in the same order. Focus on “profit” has been there right from the time industrialization began. Companies look forward to earning enough so that they can also redeploy a portion of profit as investment for further growth. In the Indian context, “people” became more important after liberalization in 1991, when the private players flooded the market increasing the competition multifold. The most difficult and ignored part has been the “planet”, although awareness is increasing.
The previous decade has seen significant advancements in technology and industrialization and the society is reaping the benefits in terms of a comfortable life and increase in the spending ability of the people. However, there are major fallouts of the process in terms of pollution, societal inequity, rapid consumption and depletion of natural resources, information explosion, and the like. With advancing time, these issues are assuming more and more significance and looming large on mankind. The industry is now increasingly becoming conscious of the fact that if these issues are not given due attention, they may have a significant impact on the way businesses are run in the future. It is, probably, easy to understand that a manufacturing concern

71 Sustainable Engagement in the Indian and Finnish Business
has a more direct impact on the “planet” aspect compared to a service sector. As environment is something that affects everyone, rather than having an individual approach to contributing towards a better environment, companies these days are beginning to believe in a collaborated approach for a meaningful act. This paper studies the application of business sustainability in two Indian organizations, one operating in the manufacturing domain (HUL) and the other in the service domain (McDonald’s).
After a brief insight into the concept of business sustainability, the two organizations are studied for their efforts to have a sustainable business. The content presented discusses how people, planet, and profits are taken care of in these two organizations and what collaborative efforts they are engaging in. The learnings generated would be useful for both upcoming and existing organizations and may serve as an inspiration for them.
Keywords: Sustainability, people, planet, collaboration, greenhouse gas, carbon footprints

72 Sustainable Engagement in the Indian and Finnish Business
1. Introduction
Concept
Business sustainability is not a new concept. Way back in 1987, a report submitted to the General Assembly of the United Nations by the Brundtland Commission defined sustainable development as “a development that meets the needs of the present without compromising the ability of future generations to meet their own needs.”
It consists of three sustainable dimensions – people, planet, and profit (Elkington, 1997), also commonly known as the Triple Bottom Line – TBL or 3BL. This is described as three important managerial principles (Hansen et al., 2009; Bradbury-Huang, 2010; Schaltegger & Wagner, 2011):
• The people dimension refers to the availability of equal opportunities for all human beings in terms of fulfillment of basic necessities like food, water, health care, education, and living conditions (Bansal, 2005).
• The planet aspect refers to the reduction of human created footprints and ecological imbalances created by pollution, emission of harmful gases into the atmosphere or discharge of disruptive/toxic effluents into water bodies or solid material strewn over the world surface, and thoughtless and unbridled usage of limited and non-renewable natural resources.
• The profit parameter implies the production of goods and services by organizations so as to earn money while improving the living conditions globally.
A common sense understanding of business sustainability would imply an integrated approach which balances the financial performance of the business with the engagement and contribution of the stakeholders with the utilization of natural resources and the impact on the environment. Increasingly, companies are targeting to earn profit by providing innovative and quality goods to the consumer; stakeholder engagement and contribution is achieved through providing a work-life balance to employees and tapping the extended circle of stakeholders for new ideas and/or feedback; and environmental initiatives are brought into effect by taking initiatives for lesser consumption of non-renewable natural resources and/or limiting the emission of harmful gases, fluids and waste material into the environment. Michel Porter and Mark Kramer (2011) pioneered the idea of “creating shared value,” stating that businesses can generate economic value by identifying and addressing social problems while conducting routine business. Usually

73 Sustainable Engagement in the Indian and Finnish Business
these problems are addressed by providing relevant products (including services) to the society. Unlike traditional forms of business risk, social and environmental risks affect the business on multiple dimensions over a longer term and are largely outside the organization’s control.
The concept of “Blue Ocean Strategy” by W. Chan Kim and Renee Mauborgne (2005) talked about value innovation in order to create new markets and make the competition irrelevant. This is in contrast to the “red ocean strategy” where competitors bleed by competing in the same areas. The concept of business sustainability is tagged as a “green innovation” when companies expand their markets and develop new product benefits (Kim &Mauborgne, 2005). This, of course, is possible only if one has a strong grasp on the fundamentals of business. What matters really is how to understand and operationalize sustainable business models into corporate practices and performances, creating, and testing new sustainable actions for utilizing opportunities and business models on corporate level (Holling, 2001; Newman, 2005).
Unlike many other business processes (and like many people processes), business sustainability is not a one-time effort but a constant, regular affair. Consistent initiatives only help build the confidence of the top management, the stakeholders, and the public at large.
Ben Tran (2009) opined that “green management” is neither about re-packaging and re-inventing approaches to business nor about describing a new business management style but simply rethinking about being more thoughtful of how organizations are operating with respect to the environment.

74 Sustainable Engagement in the Indian and Finnish Business
Phases
The three phases of business sustainability are:
• Compliance: This implies compulsory action to be taken by companies through codes of conduct and regulations. A good example is the CSR (corporate social responsibility) provisions introduced in the New Companies Act, 2013, India. It states that all companies which satisfy the CSR criteria will have to undertake certain philanthropic activities (Figure 1).
• Integration: Factoring in the efforts for business sustainability into the regular functioning of the business is called integration. This helps in having an organized and streamlined approach to sustainability. Integration involves process optimization and digital transformation to improve efficiencies that would move the organization towards continued sustainable practices, rather than a one-time effort.
• Transformation: Launching new products and processes in order to keep in sync with the changing societal and environmental parameters is labeled as transformation. A very small but relevant example of this may be the introduction of paper carry bags instead of plastic ones in shopping malls.
Figure 1. CSR Clause of New Companies Act, 2013. (Source: EY Report, 2013)
Unlike many other business processes (and like many people processes), business sustainability is not a one-time effort but a constant, regular affair. Consistent initiatives only help build the confidence of the top management, the stakeholders, and the public at large.
Ben Tran (2009) opined that “green management” is neither about re-packaging and re-inventing approaches to business nor about describing a new business management style but simplyrethinking about being more thoughtful of how organizations are operating with respect to the environment.
Phases
The three phases of business sustainability are:
• Compliance: This implies compulsory action to be taken by companies through codes of conduct and regulations. A good example is the CSR (corporate social responsibility) provisions introduced in the New Companies Act, 2013, India. It states that all companies which satisfy the CSR criteria will have to undertake certain philanthropic activities (Figure 1).
• Integration: Factoring in the efforts for business sustainability into the regular functioning of the business is called integration. This helps in having an organized and streamlined approach to sustainability. Integration involves process optimization and digital transformation to improve efficiencies that would move the organization towards continued sustainable practices, rather than a one-time effort.
• Transformation: Launching new products and processes in order to keep in sync with the changing societal and environmental parameters is labeled as transformation. A very small but relevant example of this may be the introduction of paper carry bags instead of plastic ones in shopping malls.
Figure 1. CSR Clause of New Companies Act, 2013. (Source: EY Report, 2013) Kommentoinut [VM1]: Saako tästä e-julkaisuun lukukelpoisen? Jos ei, pitää poistaa taulukko + poistaa viite tekstistä + muuttaa seuraavan kuvion numerointi ja tekstiviite

75 Sustainable Engagement in the Indian and Finnish Business
Advantages
Companies are motivated to undertake efforts for sustainability on multiple grounds. The primary objective is to make the business more competitive by saving money on operational costs. This is made possible by deploying more efficient business processes. Significant cost reductions can result from improving operational efficiency through better management of natural resources like energy and water, as well as minimizing waste. One study estimated that companies experience an average internal rate of return of 27% to 80% on their low carbon investments (Whelan & Fink, 2016). A focus on sustainability can also unlock opportunities for savings in the domains of process and logistics. Choice of alternative (raw) materials can also reduce cost and social discomfort. Successful sustainability efforts involve creating value for all stakeholders in the ecosystem and viewing profits as a consequence of such value creation. As a result, the company enjoys increased profit and a better and healthier financial position.
When supported by a healthy working environment, this becomes a prime booster of employee morale and loyalty. Diffusion to the society is a natural phenomenon as happy employees lead to a happy society. Also, there is positive contribution from the company to the society by offering value-added products and services utilizing less natural resources. This helps in building a healthy and safe environment and a stronger public image. Owing to the green process, products and marketing, the company also enjoys stronger brand recognition. A paradigm shift is occurring in the minds of consumers. Instead of only comparing quality vs. cost, today’s consumers expect more transparency, honesty, and tangible global impact from companies. In fact, one study found that among a number of factors surveyed, the media coverage regarding environmental and social responsibility was the only significant factor that affected respondents’ opinion of a firm and their intent to buy.
In the food and beverage industry, for example, a growing number of consumers are considering values beyond price and taste in their purchasing decisions, and factors assuming increasing significance are safety, social impact, and transparency (Deloitte Analysis, 2015). IKEA’s line of sustainable products like LED bulbs and solar panels have been widely accepted in the market.
Climate change, water scarcity, depletion of natural resources and poor labor conditions in much of the world increase the risk of sustainability and customer rejection. The impact is not on a single organization but all are affected. The realization is gradually dawning that individual approaches would not be sufficient and collaboration is the key to sustained success. Hence, companies like Mars, Unilever, and Nespresso have invested in Rainforest Alliance certification to help farmers deal with climate volatility, reduce land degradation, and increase resilience to drought and humidity – all of which ensure the long-term supply of their agricultural products.

76 Sustainable Engagement in the Indian and Finnish Business
Challenges
One of the main reasons that the organizations are not able to contribute meaningfully to business sustainability is because they either tend to operate on the belief that it is a one-time effort or that they focus on only one of the three important aspects of the process. This is not to underscore the effectiveness and importance of the action taken but it needs to be understood that a successful approach should be holistic in nature.
In spite of all the good intentions, organizations face many difficulties while trying to implement business sustainability. The biggest handicap is the lack of internal capacity and knowledge. This means that firms desirous of engaging in sustainability would have to look outside for expert help and consequently, have cash outflow. A cash-strapped company may find it difficult to do so. Even otherwise, there are costs of launching and maintaining the program in a company. In the absence of proper metrics, it may be difficult to assess the return on investment thereby making it difficult for the program to get the support of senior management. This, then, becomes a vicious circle.
Apart from an environmental, social, and governance (ESG) performance, the key to thinking about sustainability and a sustainable business model is to understand “where the world is headed” (Bhattacharya & Polman, 2017).
2. Hindustan Unilever Limited
Hindustan Unilever Limited (HUL) is a huge Indian conglomerate with over 35 brands spanning 20 distinct categories. The company has over 18,000 employees and has an annual turnover of INR 31,425 crores (4.577 billion USD) (financial year 2015–16). HUL is a subsidiary of Unilever with strong local roots in more than 100 countries. Unilever has 67.2% shareholding in HUL.
Launched in 2010, the Unilever Sustainable Living Plan is an outcome of a thorough top management review. The pointers generated from the research were three-fold. The first was that the major drivers for the company’s future growth would be the emerging markets bringing with it the challenges of pricing and distribution. The outcome is the entire portfolio of brands and all countries in which the company sells its products. The second finding was that the company’s product development, manufacturing, and supply chain security were being challenged by aspects like deforestation, water scarcity, and poor sanitation. This was taken care of by working across the whole value chain – from the sourcing of raw materials to the factories and the way consumers used the products. Finally, the realization that to have a greater access to communication among the stakeholders, the company would need to be actively engaged with

77 Sustainable Engagement in the Indian and Finnish Business
Figure 2. Unilever Greenhouse Gas Footprint. (Source: Unilever Website)
multiple stakeholders and be more transparent to limit the reputation risk. This was attempted by ensuring that the products make a difference to health and well-being, and that the business supports the livelihoods of many people by participating in the sourcing, production, and distribution of the products.
The company conducted a survey which proved that Sustainable Living brands delivered nearly half of the growth and grew significantly faster – in fact 30% faster – than the rest of the business. It believes that effecting change at scale can be achieved by making large, successful, category-defining brands recognizably sustainable.
The company proudly talks about its greenhouse gas (GHG) footprint, carbon positive ambition, and lifecycle assessments of its products. In the context of GHG, the company realizes that beyond the direct emissions from the factories and offices, greenhouse gas emissions occur at every stage of the value chain: from raw materials, manufacturing, and transport to consumer use and disposal. It has developed a metric that measures emissions associated with the lifecycle of a large group of products that are representative of their portfolio. GHG metric is calculated annually at an absolute level as well as “per consumer use”. The focus is on products from all sub-categories and key countries.
The above figure shows that manufacturing and distribution represent less than 5% of the total GHG footprint for Unilever, while consumer use accounts for over 60%.

78 Sustainable Engagement in the Indian and Finnish Business
The company aims to manufacture sustainable products by sourcing commodities from areas that are pursuing comprehensive forest climate programs. This approach enables agricultural production and human development goals through increased productivity, better spatial planning and land restoration, whilst protecting and restoring natural forests. It also delivers productivity gains within land-use sectors, enabling net positive environmental impacts and improved people aspect. The company also claims that innovative technologies use raw materials more efficiently, lower the GHG impact of the packaging and products, and help lower the costs. The changing preferences of the customers help to make sustainable brands more attractive, thereby helping to deliver growth in market share. In one of its efforts, Unilever Asia installed a 100 kilowatt solar panel at the Chennai distribution center, which is estimated to help save 60,000 trees every year and reduce the carbon footprint by 130 tons.
Being carbon positive means that in partnership with others, a company directly supports the production of more zero carbon renewable energy than it needs for its own operations, making the surplus available to the markets and communities in general. Unilever has announced an objective of becoming carbon positive in its operations by 2030. An important step towards this would be to eliminate coal from its energy mix. The company already claims to have achieved zero non-hazardous waste to landfill on most of its manufacturing sites. By realigning its transport and packaging, the company proclaims to have achieved over 2% reduction in CO2 emissions from its logistics network in 2015.
The lifecycle of a product is said to cover the sourcing of raw materials through to product manufacture, distribution, consumer use, and disposal. Unilever uses the lifecycle assessment (LCA) as one of a number of techniques to help them understand the impacts of their products on the environment.
While designing new products, the company utilizes LCA information to compare the new and existing products to measure the differences in their respective environmental profiles. These insights are also used to study the existing products to help identify improvement opportunities.
HUL encourages employees to live healthy and work safely, both at work and outside it. The objective is to create a working environment supportive of employees’ personal lives, while meeting the company’s business needs. It is believed that healthier employees are more motivated and more productive. Programs like Sparkle, 70:20:10 Capability Building, and Unilever Future Leaders Programme, as well as the 100% women employee factory at Haridwar are examples of efforts that the company makes in the direction of “people”.
79 Sustainable Engagement in the Indian and Finnish Business
Collaborating for resource conservation, HUL actively engages with the Tamil Nadu Pollution Control Board (TNPCB) in relation to soil remediation and is committed to address the clean-up of its former thermometer factory site. Further, it has launched the “Swachh Aadat, Swachh Bharat” program in line with Government of India’s “Swachh Bharat Abhiyan” (Clean India Mission) to promote good health and hygiene practices through three simple good habits (“Swachh Aadat”) – washing hands five times a day, using a toilet for defecation, and adopting safe drinking water practices.
3. McDonald’s
People are becoming more concerned about the environmental issues and in some cases, it has led to recycling, energy saving, water conservation, and green purchase behavior (Kim, 2002; Kim &Choi, 2003, 2005). This has implications for many industries, one of them being hospitality. This industry includes airlines, hospitals, food services, and hotels, among others. As a continuously growing sector, this industry has social responsibility towards environmental issues and climate change because the natural resources are limited and hence precious (Kasim, 2009).
However, due to the inherent characteristics of the service sector, the pressure to adopt environmental management is weaker than in the manufacturing sector (Grove, Fish, Pickett & Kangun, 1996). Service lacks tangibility and is both highly heterogeneous, being influenced by the human factor, as well as characterized by inseparable transaction between the service provider and the customer (Kotler et al., 2006). The restaurant business, however, has tangible aspects of service products which have a major impact on the environment (Ismail, Kassim & Zahari, 2010).
Gilbert (2007) labels an activity as a green business activity if it is performed in a manner that has limited negative ecological impact or directly benefits the natural environment in some way. Mohindra (2008) believes that green practices encompass three Rs – reduce, reuse, and recycle. Green practices in restaurants involve the practices of using bio-degradable products, saving energy and natural resources actively, purchasing energy-saving equipment, reducing and recycling waste, and engaging in environmental protection programs (Schubert, 2008).
In its effort to contribute towards the “people” aspect, McDonald’s has decided to refocus the “Happy Meal” to make it healthier and give a fun nutrition or well-being message in all of its advertising directed to children, especially in US and Italy. The company, further, claims to be committed to people by offering them opportunities and promoting diversity and inclusion.
80 Sustainable Engagement in the Indian and Finnish Business
In 2013, the company launched a new life cycle assessment (LCA) project to estimate the system’s global carbon footprint. They evaluated the GHG emissions associated with the System including restaurants, company offices, and food and packaging supply chains and delivery systems worldwide. It was found that the majority (over 70%) of the carbon footprint impacts occur in its supply chain and the agriculture systems that produce raw materials for the menu items. It was also discovered that across these raw materials, the major GHG emissions-driving activities included:
• cattle raising for beef, cheese, and dairy;
• electricity usage across farms, plants, and distribution centers;
• grain farming to produce buns, baked goods, and feed for animals.
The study found that GHG emissions from company offices and restaurants, including franchisees, represent nearly 30% of the total emissions– electricity usage being the primary driver. A small proportion is associated with in-restaurant waste and on-site gas combustion for hot water heating and cooking.
As is already known, water is very important for the food and beverage industry and used primarily for irrigation, public amenities, cleaning, and beverage systems. Hence, the company has taken several initiatives, one of them being rainwater harvesting for irrigation and toilet flushing. It is noteworthy here that McDonald’s is one of the pioneers of the concept of “waterless toilet”. Flow rates and water consumption are reduced by having water-efficient fixtures with flows set to optimize use. Crew and managers are provided training on water usage to ensure consistent efforts in the direction.
Another way in which McDonald’s attempts to be a responsible corporation is through promotion of sustainable farming methods. It has joined Unilever and Nestle in its commitment to shift to entirely sustainably-sourced palm oil by 2015. Clear cutting for palm tree plantation systems is a source of greenhouse gases, and the proportion of the materials used in the process indirectly leads to a great deal of this negative outcome. By shifting to sustainable practices for palm oil, this negative climate effect can be mitigated to a certain extent (Scott, 2011). Palm oil is not the only agricultural product that McDonald’s has sought to obtain using sustainable methods. Their program extends to include effective utilization of soil, water, and energy use to animal welfare and employee well-being. This program aims to highlight successful sustainability practices in agriculture to show other farmers and suppliers what can be done (Spackman, 2009). A final example of McDonald’s efforts at corporate responsibility can be

81 Sustainable Engagement in the Indian and Finnish Business
found in its funding and support of the Ronald McDonald House. This entity provides housing and limited indirect financial support for families whose children are undergoing treatment for life-threatening diseases. The group is funded not only by McDonald’s, but also by a number of suppliers in its supply chain (Smith, 1994).
4. Conclusion
Business sustainability is an idea to which organizations are increasingly becoming alert. Going by the trends of global warming and its impact on the life on earth has become a necessity rather than a choice. Adopting practices leading to a sustainable business will benefit the organization, the planet and the mankind at large. While some developed countries have created benchmarks in the field, developing countries have a long way to go. Positive steps in this direction would be to study more of global companies in the market and learn from their practices for a mutually beneficial and supportive system.
Bibliography
Aagaard, A. (2016). Sustainable Business. Business & Economics. River Publishers Denmark.
Bansal, P. (2005). Evolving sustainably: A longitudinal study of corporate sustainable development. Strategic management journal, 26(3), 197–218.
Bradbury-Huang, H. (2010). Sustainability by Collaboration. Organizational Dynamics. doi:10.1016/j.orgdyn.2010.07.001
Brundtland, G. (1987). Our common future: The world commission on environment and development. Oxford, England: Oxford University Press.
Chan Kim, W. & Mauborgne, R. (2005). Value innovation: a leap into the blue ocean. Journal of business strategy, 26(4), 22–28.
Deloitte Consumer Food Value Equation Survey (2015).
Einwiller, S., Carroll, C. & Korn, K. (2010). Under What Conditions Do the News Media Influence Corporate Reputation? The Roles of Media Dependency and Need for Orientation. Corporate Reputation Review, 12, 299. doi:10.1057/crr.2009.28
Elkington, J. (1997). Cannibals with forks – Triple bottom line of 21st century business. Stoney Creek, CT: New Society Publishers.

82 Sustainable Engagement in the Indian and Finnish Business
Gilbert, A. J. (2007). The value of green marketing education at the University of Wisconsin-La Crosse. Journal of Undergraduate Research, 10.
Grove, S.J., Fisk, R.P., Pickett, G.M. & Kangun, N. (1996). Going Green in the Service Sector: Social Responsibility Issues, Implications and Implementation. European Journal of Marketing, 30(5), 56–66. http://dx.doi.org/10.1108/03090569610118777
Hansen, E.G., Große-Dunker, F. & Reichwald, R. (2009). Sustainability Innovation Cube – A Framework to Evaluate Sustainability-Oriented Innovations. International Journal of Innovation Management, 13(4), 683–713.
Holling, C. S. (2001). Understanding the complexity of economic, ecological, and social systems. Ecosystems, 4, 390–405.
Ismail, A., Kassim, A., & Zahari, M.S. (2010). Responsiveness of restaurateurs towards the implementation of environmentally-friendly practices. South Asian Journal of Tourism and Heritage, 3(2), 1–10.
Kasim, A. (2009). Managerial attitudes towards environmental management among small and medium hotels in Kuala Lumpur. Journal of Sustainable Tourism, 17(6), 709–725.
Kim, W. C. & Mauborgne, R. (2005). Blue ocean strategy: From theory to practice. California Management Review, 47(3), 105–121.
Kim, Y. (2002). The Impact of Personal Value Structures on Consumer Pro environmental Attitudes, Behaviours and Consumerism: A Cross-cultural Study. Doctoral Dissertation, College of Communication Arts and Sciences, Michigan State University.
Kim, Y. & Choi, S. (2003). Antecedents of Proenvironmental Behaviours: An Examination of Cultural Values, Self-efficacy, and Environmental attitudes. International Communication Association, Marriott Hotel, San Diego, CA. [Online] Available: http://www.allacademic.com/meta/p111527_index.html.
Kim, Y. & Choi, S. (2005). Antecedents of green purchase behavior: an examination of collectivism, environmental concern, and perceived consumer effectiveness. Advances in Consumer Research, 32, 592–599.
Kotler, P. & Pfoertsch, W. (2006). B2B brand management. Springer Science & Business Media.
Kotler, P., Rackham, N. & Krishnaswamy, S. (2006). Ending the war between sales and marketing. Harvard Business Review, 84(7/8), 68.
Kramer, M. R. & Porter, M. (2011). Creating shared value. Harvard business review, 89(1/2), 62–77.
Lee, K.H. & Vachon, S. (2016). Supply Chain Sustainability Risk. In Business Value and Sustainability (pp. 245–280). Palgrave Macmillan UK.

83 Sustainable Engagement in the Indian and Finnish Business
Mohindra, K. S. (2008). Greening public health conferences: educating ourselves. Health Education, 108(4), 269–271.
Newman, L. (2005). Uncertainty, innovation, and dynamic sustainable development. Sustainability: Science, Practice, & Policy, 1(2).
Newman, P. (2005). Sustainability assessment and cities. International Review for Environmental Strategies, 5(2), 383–398.
Rainforest Alliance. (2012). Rainforest Alliance Certification on Cocoa-Farms in Côte D’Ivoire. Available at: https://www.rainforest-alliance.org/sites/default/files/2016-08/ra-certification-cocoa-cote-divoire-cosa.pdf
Rowley, B. & McMurtrey, M. E. (2016). McDonald’s and the Triple Bottom Line: A Case Study of Corporate Sustainability. Journal of Strategic Innovation and Sustainability, 11(1), 33.
Schaltegger, S. & Wagner, M. (2011). Sustainable Entrepreneurship and Sustainability Innovation: Categories and Interactions. Business Strategy and the Environment, 20(4), 222–237.
Schubert, F. (2008). Exploring and predicting consumers’ attitudes and behaviors towards green restaurants. Doctoral dissertation, The Ohio State University.
Scott, A. (2011). Corporate social responsibility: Greening the supply chain. Chemical Week, 173(8), 21–24.
Smith, C. (1994). The new corporate philanthropy. Harvard Business Review, 72(3), 105–116.
Society for Human Resource Management. (2011). Advancing Sustainability: HR’s Role. Available at: https://www. shrm.org/resourcesandtools/tools-and-samples/toolkits/documents/11-0066_advsustainhr_fnl_full.pdf
Spackman, P. (2009). McDonald’s aims to showcase sustainable farming. Farmers Weekly, 150(26), 22.
Tam, H. (2016). Green management: Road to sustainability & corporate efficiency. IJAR, 2(1), 586–590.
Tran, B. (2009). Green management: the reality of being green in business. Journal of Economics, Finance and Administrative Science, 14(27).
Whelan, T. & Fink, C. (2016). The Comprehensive Business Case for Sustainability. Harvard Business Review, 10, 105–116.
84 Sustainable Engagement in the Indian and Finnish Business
Websites
http://3blmedia.com/theCSRfeed/CBSR-Blog-CSR-Driver-Employee-Engagement
http://blog.aiag.org/unilever-a-successful-business-case-for-sustainability
https://www.hul.co.in/sustainable-living/
http://corporate.mcDonald’s.com/
http://web.archive.org/web/20120417131934/http://www.un.org/esa/sustdev/csd/csd15/media/backgrounder_brundtland.pdf

85 Sustainable Engagement in the Indian and Finnish Business
Kriti Priya Gupta Professor, Symbiosis Centre for Management Studies, NOIDA [Constituent of Symbiosis International (deemed University)], India Preeti Bhaskar Assistant Professor, ICFAI Business School, ICFAI University, Dehradun, India
Abstract
Human capital is the greatest asset for any organization. Retention of good employees is essential for an organization to achieve consistent growth. The productivity and sustainability of an organization depend significantly on the job satisfaction of its employees. Job satisfaction is not only related to the performance of employees but it also contributes to the sustainable development of organizations. The present study attempts to empirically examine the relationship between employee job satisfaction and the sustainable development of modern retail organizations in India, as perceived by the frontline retail employees. Five characteristics of employee job satisfaction have been considered, namely working environment; compensation; employee empowerment; career advancement and growth; and training and development. Similarly, three dimensions of sustainable development of organizations have been considered: economic sustainability; environmental sustainability; and social sustainability. The study has employed descriptive research design wherein survey method has been used to collect data through structured questionnaires from 629 frontline employees working in retail stores in
Role of Frontline Employees’ Job Satisfaction in Sustainable Development of Modern Retail Organizations

86 Sustainable Engagement in the Indian and Finnish Business
Delhi-NCR (National Capital Region). Multiple regression analysis is used to study the impact of five characteristics of employee job satisfaction on the three dimensions of sustainable development of organizations. The findings of the study indicate that the organization’s economic sustainability is most influenced by the employees’ satisfaction with compensation whereas the environmental sustainability is influenced by the working environment of the employees as well as the training and development provided to the employees. The findings also suggest that all the five characteristics of employee job satisfaction carry a significant impact on the social sustainability of an organization. However, training and development as well as career advancement and growth opportunities provided to the employees are the most important indicators of social sustainability.
Keywords: Employee job satisfaction, Sustainable development, Organizational sustainability Frontline retail employees, India

87 Sustainable Engagement in the Indian and Finnish Business
1. Introduction
Sustainable development is a crucial long-term goal of organizations and has been highlighted as a focal point in the corporate world today. Organizational sustainability is the ability of an organization to achieve a range of economic, environmental, and human performance objectives. It involves a broad view of social, environmental, and economic outcomes; a long-term perspective concerned with the interests and rights of future generations as well as of people today; and an inclusive approach to action which recognizes the need for all people to be involved in the decisions that affect their lives (WBCSD, 2005). In order to maintain sustainable development, organizations are required to deal with the issues that arise from rapid globalization, constant organizational change, and employee retention (Aninkan & Oyewole, 2014). Employees bridge the gap between the organization’s sustainability goals and the realization of those goals. Therefore, retention of good employees is essential for organizations in order to achieve sustainable growth. The productivity and sustainability of organizations significantly depends on employee job satisfaction. According to Rane (2011), job satisfaction of employees is of paramount importance for any organization in order for them to achieve their targeted goals on a sustainable basis. Employee job satisfaction is essential for facing the dynamic challenges of maintaining the sustainability of the organizations by keeping their employees constantly motivated and engaged (Rane, 2011). In today’s competitive environment, retaining satisfied employees is imperative for organizational development, as satisfied employees work harder and perform their tasks with devotion and dedication (Ivancevich, 2010).
The present study attempts to explore the relationship between employee job satisfaction and the sustainable development of modern retail organizations in India. Retail is a booming sector in India that provides employment to millions of people. The growth and prosperity of the Indian retail sector have been validated by various researchers (Kabra, 2003; Kaur, 2007; Singh & Tripathi, 2008). According to a report presented by the Federation of Indian Chambers of Commerce and Industry (FICCI), the modern retail sector in India is expected to grow at a compound annual growth rate of 15–20%. India’s modern retail sector employs over 10 million people and has been estimated to reach 70 million by 2018 (Rao, 2015). The sector employs 7% of the total workforce in India, which makes it the second largest employer after agriculture (Charania, 2014). Because of the manpower-intensive nature of the modern retail sector, effective human resource systems are required for its sustainable growth. Frontline employees are the major link between the employer and customers in the retailing industry. They play an important role in developing and maintaining business relationships with customers (Palmatieret al., 2007; Vorhies & Morgan, 2005). The behaviour of frontline employees is important for creating long-term profits for service organizations (Sergeant &

88 Sustainable Engagement in the Indian and Finnish Business
Frenkel, 2000). Job satisfaction of frontline employees plays a significant role in influencing their behaviour with customers (Hoffman & Ingram, 1991). It is an important predictor of employee turnover and also impacts the organization’s performance and sustainability to a great extent (Laschinger, 2004). According to a survey conducted by the Retail Industry Leaders Association (RILA, 2012), employees are the strong ambassadors of sustainability in modern retail organizations and engaging employees in sustainability practices not only improves social and environmental performance of the organization but also leads to innovative responses to key challenges. Nowadays, modern retail organizations are engaging their frontline employees in sustainability programmes by organizing sustainability fairs at their headquarters and putting together intranet sites, employee videos, and blogs. Such efforts are beneficial for retailers in terms of generating innovative ideas, bringing new products to the shelves, and saving money (RILA, 2012).
The purpose of the study is to examine the relationship between the job satisfaction of frontline employees and the sustainable development of modern retail organizations in India. The study is organized as follows: Section 2 presents the review of literature and the proposed research model. The employed research methodology is discussed in section 3 and the data analysis and results are presented in section 4. Section 5 concludes the study with implications and limitations of the research.
2. Literature Review and Conceptual Framework
2.1 Sustainable Development
Sustainable development has been defined in many ways, but the most frequently used definition is as quoted in Brundtland Commission’s Report (WCED, 1987):
“Sustainable development is development that meets the needs of the present without compromising the ability of future generations to meet their own needs. It contains the following two key concepts: (i) the concept of needs, in particular the essential needs of the world’s poor, to which overriding priority should be given and (ii) the idea of limitations imposed by the state of technology and social organization on the environment’s ability to meet present and future needs.”
Hart and Milstein (2003) define organizational sustainability as “an organization’s ability to make a positive contribution to sustainable development by delivering simultaneously economic, social, and environmental benefits – the so-called triple bottom line”. In other words, sustainable organizations have the capability to accomplish economic, environmental, and human performance simultaneously (Spreitzer et al., 2013). Although there is not complete

89 Sustainable Engagement in the Indian and Finnish Business
agreement about the definition of sustainable development due to different and sometimes incompatible interpretations, there is a consensus in the literature that sustainable development must contain economic, social, and environmental dimensions (Epstein, et al., 2010). This approach requires the adoption of a tri-dimensional triple bottom line approach which means that organizations should demonstrate financial feasibility and prosperity and at the same time be able to manage the social (human) and environmental systems positively (Smith & Sharicz, 2011).
Economic Sustainability
Economic sustainability focuses on shifting from a profitable economy to a more steady-state economy (Velazquez et al., 2011). It generates profit and jobs and hence contributes to the general social welfare (Azapagic, 2003). In order to achieve economic sustainability, an organization needs to conduct its activities in a responsible and recognized manner, with social and economic return for its stakeholders (Munck et al., 2011). Economists look at the world in terms of stocks and flows of capital. This not only covers monetary or economic capital but also includes human capital. Azapagic and Perdan (2000) have categorized the indicators of economic sustainability as financial indicators and human capital indicators. Financial indicators measure the economic performance in monetary terms (e.g. value added or contribution to GDP, turnover etc.) whereas human capital indicators assess the economic aspects related to the workforce (e.g. personnel expenses, gross wages, expenditure on health and safety and investment in staff development, etc.) (Azapagic & Perdan, 2000; Dumitrana et al., 2009). Cella-De-Oliveira (2013) suggests that economic sustainability should guarantee sufficient liquidity cash flow by producing above average return for an organization’s stakeholders.
Environmental Sustainability
Environmental sustainability focuses on long-term resource feasibility and usage combined with decreasing the human impact on ecosystems. It attempts to protect the environment from degradation, which has an adverse effect on the existence of humanity. It deals with aspects such as preservation of resource regeneration capacity, biodiversity, constraining non-renewable resources, re-usage and recycling, and waste generation. Companies aligned with environmental sustainability consume natural resources at a rate below their natural regeneration capacity and also minimize practices that may affect the access of future generations to critical natural resources (Dyllick & Hockerts, 2002; Munck et al., 2011). Environmental constraints have important consequences for human development and, therefore, environmental sustainability is said to be a prerequisite for social sustainability (Goodall, 1995).

90 Sustainable Engagement in the Indian and Finnish Business
Social Sustainability
Social sustainability focuses on maintaining cultural and social systems (Edwards, 2005). It is described as the ability of an organization to develop processes and structures which not only meet the needs of its current members but also support the ability of future generations to maintain a healthy environment. Social sustainability encompasses aspects related to human development (e.g. education, training, workplace safety, occupational health, competence development, etc.), equality (e.g. fair salaries and benefits, equal opportunities to all employees, absence of workplace discrimination, etc.), and ethical considerations (e.g. human rights, cultural values, etc.) (Munck et al., 2011). In order to maintain social sustainability, an organization needs to internalize the social costs, maintain and provide growth of the social capital, avoid exploiting its employees, promote democracy, amplify the scope of personal choices, and distribute resources and property rights in a fair manner (Dyllick & Hockerts, 2002).
2.2 Employee Job Satisfaction
Hoppok and Spielgler (1938) have defined employee job satisfaction as “the integrated set of psychological, physiological and environmental conditions that encourage employees to admit that they are satisfied or happy with their jobs”. According to Vroom (1964), employee job satisfaction is “an orientation of emotions that employees possess towards role they are performing at the work place”. Locke (1976) has defined job satisfaction as “a pleasurable emotional state resulting from the appraisal of one’s job”. It can be associated with a personal feeling of achievement. Rice et al. (1989) have proposed that “satisfaction is determined, in part, by the discrepancies resulting from a psychological comparison process involving the appraisal of current job experiences against some personal standards of comparison”. Employee satisfaction is a key variable that gives an estimation about employees’ general emotions and thinking forms about their jobs and workplaces. Thus, employee satisfaction relates to the expectations of an employee about the workplace and their approach towards the job. Job satisfaction is a function of the extent to which one’s needs are satisfied in a job (Togia et al., 2004).
Previous studies have found that job satisfaction of employees is associated with pay satisfaction, advancement opportunities, job security, empowerment, organizational policies, relationship with others at the workplace, training and development opportunities, and the overall working conditions (Weiss, 2002; Smith et al., 1969; Hackman and Oldham, 1974; Spector, 1985). The present study focuses on the following characteristics of job satisfaction:

91 Sustainable Engagement in the Indian and Finnish Business
Working Environment
Working environment refers to “the conditions under which a job is performed” (Bakotić & Tomislav, 2013). A difficult working environment can be influenced by: (1) external factors that consist of climatic conditions, temperature, humidity, lighting in the workplace, noise and interference, dust, smoke, and other harmful factors; (2) subjective factors that relate to the gender and age of the worker, fatigue, monotony, unfavourable posture during work, etc.; and (3) factors related to the organization of production such as the duration of the work shift, work schedule, working time, work pace, excessive strain etc. (Bakotić & Tomislav, 2013). Strong et al. (1999) have observed that the social, organizational, and physical aspects of the work environment significantly influence employees’ performance and work output. Scott et al. (2000) have reported that working conditions associate with employees’ job involvement and job satisfaction.
Compensation
Compensation can be described as the amount of reward that an employee expects from their job. Compensation is a fundamental component of human resource management which includes financial reward in the form of salaries and benefits, indirect compensation, or supplementary pay (Ojo, 1998). Compensation or pay satisfaction is related to all those positive or negative feelings which an employee has towards their salary (Vendenberghe et al., 2008). The employees who are satisfied with their pay feel motivated to improve their work performance (Ghazanfar, 2010; Carraher, 2011). Also, the employees who have high pay satisfaction are more committed and loyal to their organizations (Vendenberghe et al., 2008). Mishra and Gupta (2009) have empirically examined the job motivators used by Indian retail firms for frontline sales personnel and their effectiveness in terms of employees’ satisfaction. Their findings suggest that pay is the most significant predictor of employees’ satisfaction. Bustamam et al. (2014), in their study on the frontline employees of the Malaysian hotel industry, have found that job satisfaction is positively correlated with both financial rewards and non-financial rewards.
Employee Empowerment
Employee empowerment refers to the authority given to the employees in decision-making in routine activities of the organization (Haas, 2010). Hales and Klidas (1998) state that organizations practise empowerment by sharing authority and power with their employees. Empowerment is a construct associated to the employees’ confidence on themselves and the motivation and inspiration to work (Conger & Kanungo, 1988). Various researchers have highlighted the positive link between the psychological empowerment of employees and their job satisfaction (Wang & Lee, 2009).
92 Sustainable Engagement in the Indian and Finnish Business
Career Advancement and Growth
Career advancement refers to the extent to which employees perceive that they have bright career prospects within the organization (Delery & Doty, 1996). Such perceptions of clear growth opportunities contribute to job satisfaction and hence motivate employees to become more dedicated to the organization. Employees perform best when the organizational environment is conducive to growth. When there are abundant growth opportunities in the organization, employees work with considerably more vigour and are more satisfied with their jobs (Lipman, 2014). Researchers have found a positive significant relationship between growth and promotion opportunities and job satisfaction (Danish & Usman, 2010; Mustapha & Zakaria, 2013).
Training and Development
According to Landy (1985), training and development refers to “the set of planned activities on the part of an organization to increase the job knowledge and skills of its employees in a manner consistent with the goals of organization”. Training and development help employees in broadening their knowledge and capacities for better organized teamwork (Jun et al., 2006) as well as in acquiring the skills and knowledge required for performing their jobs. The employees who receive self-growth training develop individual competencies and exhibit high levels of job satisfaction (Martensen & Gronholdt, 2001; Bartlett, 2001). Masood et al., (2014) in their study on factors influencing employee satisfaction of private sector organizations in Pakistan, conclude that training is a useful tool which helps employees in performing their jobs according to the set required standards of the organization.
2.3 Employee Satisfaction and Sustainable Development
Although all the three dimensions of organizational sustainability should be considered in a balanced manner, the social (human) dimension is often given less attention when compared to the economic and environmental dimensions (Florea, 2013). The social dimension, or the human dimension, of organizational sustainability relates to the processes that generate social health and improve the well-being of the employees of organization. Sustainable development requires contribution from all the employees across all the functions of an organization (Randev & Nandan, 2016). The managerial competencies of the employees yield sustained competitive advantage for an organization (Rompa, 2011). There is a diverse range of components to the human dimension of sustainability (e.g. equity, philanthropy, and employee engagement), however a vital element of the human dimension of sustainability is employee satisfaction at the workplace (Florea, 2013). Employee satisfaction at work is one of the most studied topics in organizational science (Lee et al., 2013) and forms a paramount component of the ongoing sustainable success of organizations (Mirvis, 2012). Studies have shown that employee satisfaction has a strong and positive relationship with individual job performance and the overall financial performance of an organization (Harter et al., 2002).
93 Sustainable Engagement in the Indian and Finnish Business
Since satisfied employees tend to have an energetic, committed, and enthusiastic attitude towards their jobs, they perform their tasks in a more capable manner, which may lead to an enhanced individual or group performance thereby building a strong foundation from which organizational sustainability can take place (Harter et al., 2002). Employees feel a higher level of satisfaction in an organization that pursues sustainable practices. According to Bhattacharya et al. (2007), employee satisfaction can be enhanced when the organization’s focus is on value co-creation of social and sustainable practices. The need for job satisfaction of employees, as well as for the retention of capable people, encourages organizations to treat their employees as customers (Berry, 1981). Thus, it is expected that the internal customer or employee satisfaction contributes to satisfying the external customers, thereby leading to the organization’s profit maximization and sustainability (Dumitrescu & Apostu, 2009).
Job satisfaction is indirectly related to the quality of life of employees, which depends on the degree of organization’s sustainable development. Job satisfaction of employees influences the economic performance of organizations, and improving the quality of employees’ lives represents the essence of the sustainable development of organizations (Moldovan, 2016). The achievement of the organizational aims and objectives greatly depends on the quality of their employees’ work performance, which in its turn depends on their job satisfaction.
Thus the review of literature shows that employee job satisfaction influences the sustainable development of organizations. The present study aims to empirically examine the impact of various characteristics of employee job satisfaction on the three dimensions of sustainable development of organizations, as perceived by the frontline employees of modern retail organizations of India. To study this impact, the following hypotheses have been addressed:
H1a: Working environment of employees significantly impacts the economic sustainability of organizations
H1b: Compensation of employees significantly impacts the economic sustainability of organizations
H1c: Employee empowerment significantly impacts the economic sustainability of organizations
H1d: Career advancement and growth opportunities provided to the employees significantly impact the economic sustainability of organizations
H1e: Training and development provided to the employees significantly impact the economic sustainability of organizations

94 Sustainable Engagement in the Indian and Finnish Business
H2a: Working environment of employees significantly impacts the environmental sustainability of organizations
H2b: Compensation of employees significantly impacts the environmental sustainability of organizations
H2c: Employee empowerment significantly impacts the environmental sustainability of organizations
H2d: Career advancement and growth opportunities provided to the employees significantly impact the environmental sustainability of organizations
H2e: Training and development provided to the employees significantly impact the environmental sustainability of organizations
H3a: Working environment of employees significantly impacts the social sustainability of organizations
H3b: Compensation of employees significantly impacts the social sustainability of organizations
H3c: Employee empowerment significantly impacts the social sustainability of organizations
H3d: Career advancement and growth opportunities provided to the employees significantly impact the social sustainability of organizations
H3e: Training and development provided to the employees significantly impact the social sustainability of organizations

95 Sustainable Engagement in the Indian and Finnish Business
The conceptual framework of the study is depicted in Figure 1.
Working Environment
Compensation
Employee Empowerment
Career Advancement and Growth
Training and Development Opportunities
Social Sustainability
Economic Sustainability
Job Satisfaction of Employees Sustainable Development
Environmental Sustainability
Figure 1. Conceptual framework of the study.

96 Sustainable Engagement in the Indian and Finnish Business
3. Research Methodology
3.1 Survey Location and Target Respondents
The survey method has been employed to collect the data with the help of a structured questionnaire. According to the report of KPMG on Indian retail, Delhi-NCR is second among the top ten markets of organized retailing in India. According to another survey conducted by Dutta et al. (2016), modern retail penetration is expected to be 50% in Delhi-NCR. Therefore, in the present study, Delhi-NCR has been chosen as the survey location. Those modern retail outlets which have been operational since 2010 have been selected to conduct the survey. The frontline employees who have been working with these modern retail outlets for at least one year have been chosen as the target respondents for the survey.
3.2 Survey Instrument
A non-disguised and structured questionnaire was used to gather data from the target respondents. The questionnaire consisted of two sections. Section 1 comprised different personal and demographic variables of employees, including age, gender, marital status, qualifications, duration with the present employer, and duration with present career. Section 2 included 34 items related to five characteristics of employee job satisfaction (working environment, compensation, employee empowerment, career advancement and growth, and training and development) and three dimensions of sustainable development of organizations (economic sustainability, environmental sustainability, and social sustainability). The items in this section were measured on a five-point Likert scale ranging from strongly disagree (1) to strongly agree (5). The scales for all the variables of the study were adapted from the previous literature and published studies (Table 1).
The questionnaire was pilot tested on a sample of ten respondents in the real survey settings, that is, at selected modern retail stores in Delhi-NCR. During pilot testing, items that appeared to be problematic were re-worded and refined.

97 Sustainable Engagement in the Indian and Finnish Business
Construct Items Referred to
Job Satisfaction
Working Environment
• I am satisfied with the physical aspects of my working conditions (e.g., toilet facilities, sitting arrangements, air conditioning/heating system, lighting, ventilation, etc.)
• My organization takes care of my health and well being
• My working hours are reasonable
• I am never overworked
• I get the opportunity to mix with my colleagues and to communicate on aspects of our work
Weiss (2002);
Schmidt (2007)
Compensation
• My organization/company has fair compensation policies
• I am satisfied with the existing salary structure of my organization/company
• I am satisfied with the compensation I get and I think it matches with my responsibility
• I am often rewarded for the quality of my efforts
Mo & Buavaraporn (2014)
Employee Empowerment
• I have the authority to correct daily problems when they occur
• I am encouraged to handle daily problems by myself
• My organization/company values my opinions while taking decisions
• My organization/company shares the relevant information (quarterly reports, product-related information etc.) with its employees
Hackman & Oldham (1975)
Career Advancement and Growth Opportunities
• My organization/company has fair promotion policies
• My organization/company promotes internal recruitment
• I am satisfied with the opportunities for advancement on my job
Weiss (2002);
Mo & Buavaraporn (2014)
Training and Development
• My organization/company conducts training programmes on environmental awareness
• My organization/company provides sufficient training and development opportunities for my growth and develop-ment
• My organization/company provides sufficient training relat-ed to policies and practices of the organization
Schmidt (2007)
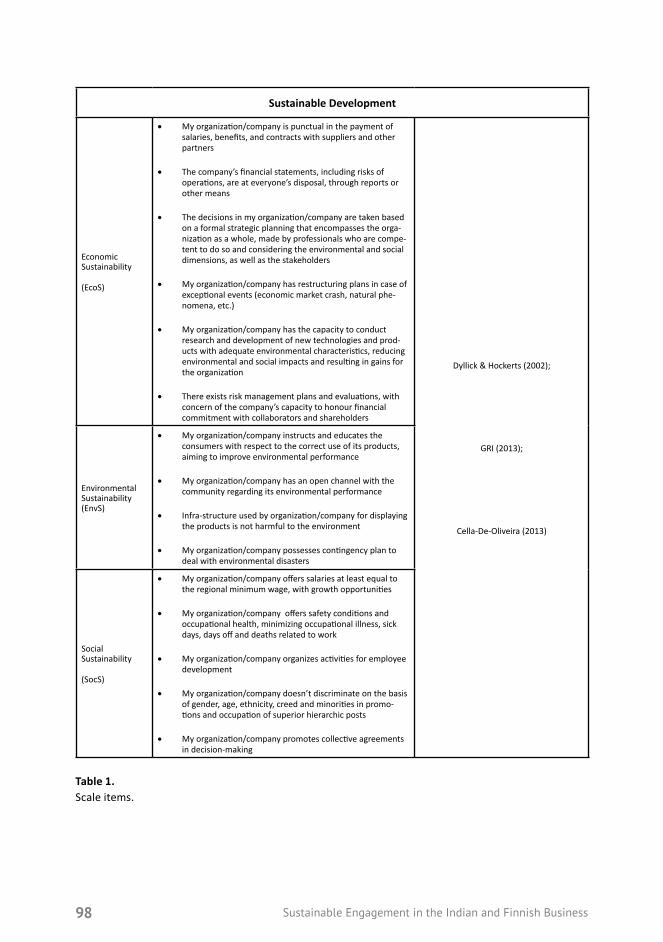
98 Sustainable Engagement in the Indian and Finnish Business
Sustainable Development
Economic Sustainability
(EcoS)
• My organization/company is punctual in the payment of salaries, benefits, and contracts with suppliers and other partners
• The company’s financial statements, including risks of operations, are at everyone’s disposal, through reports or other means
• The decisions in my organization/company are taken based on a formal strategic planning that encompasses the orga-nization as a whole, made by professionals who are compe-tent to do so and considering the environmental and social dimensions, as well as the stakeholders
• My organization/company has restructuring plans in case of exceptional events (economic market crash, natural phe-nomena, etc.)
• My organization/company has the capacity to conduct research and development of new technologies and prod-ucts with adequate environmental characteristics, reducing environmental and social impacts and resulting in gains for the organization
• There exists risk management plans and evaluations, with concern of the company’s capacity to honour financial commitment with collaborators and shareholders
Dyllick & Hockerts (2002);
GRI (2013);
Cella-De-Oliveira (2013)
Environmental Sustainability (EnvS)
• My organization/company instructs and educates the consumers with respect to the correct use of its products, aiming to improve environmental performance
• My organization/company has an open channel with the community regarding its environmental performance
• Infra-structure used by organization/company for displaying the products is not harmful to the environment
• My organization/company possesses contingency plan to deal with environmental disasters
Social Sustainability
(SocS)
• My organization/company offers salaries at least equal to the regional minimum wage, with growth opportunities
• My organization/company offers safety conditions and occupational health, minimizing occupational illness, sick days, days off and deaths related to work
• My organization/company organizes activities for employee development
• My organization/company doesn’t discriminate on the basis of gender, age, ethnicity, creed and minorities in promo-tions and occupation of superior hierarchic posts
• My organization/company promotes collective agreements in decision-making
Table 1. Scale items.

99 Sustainable Engagement in the Indian and Finnish Business
3.3 Sampling and Sample Size
A mixed sampling approach combining both probability and non-probability sampling methods has been used for selecting the sample. The sampling has been carried out in multiple stages. First, the survey location, i.e. Delhi-NCR, is divided into 10 zones: Central Delhi, East Delhi, North Delhi, South Delhi, West Delhi, Faridabad, Ghaziabad, Greater NOIDA, Gurgaon, and NOIDA. Then, the retail outlets of each zone are divided in 13 groups on the basis of 13 product categories: Departmental stores (DS); Apparel (App); Food and Beverages (FB); Entertainment (Ent); Home and Lifestyle (HL); Hyper/Super Markets (HS); Electronics (Elec); Watches and Jewellery (WJ); Personal Care (PC); Footwear (F); Sportswear (S); Books, Gifts and Music (BGM); Accessories (Acc). For each of the 10 zones, a few retail outlets have been selected from each product category, using the proportionate quota sampling technique (non-probability sampling). Quotas are decided on the basis of the product categories’ population proportions in the total population of the zones. From each zone, 20 retail outlets are selected by using convenience sampling, which results into a total of 200 retail outlets from all the 10 zones. Table 2 depicts the zone and category wise percentages of retail outlets in Delhi-NCR, and Table 3 shows the proportionate number of retail outlets constituting the sample. Finally, from the selected retail outlets, few frontline retail employees have been selected using the simple random sampling technique (probability sampling). A sample consisting of approximately 600–650 frontline retail employees was targeted for the study. From 800 distributed questionnaires, 636 responses were received, indicating a response rate of 79.5%. After removing unviable responses, we have chosen 629 usable responses as the final sample.

100 Sustainable Engagement in the Indian and Finnish Business
ZonesProduct Categories
DS App FB Ent HL HS Elec WJ PC F S BGM Acc
Central Delhi 7 48 12 1 9 0 5 3 4 8 2 2 0
East Delhi 19 20 15 2 1 2 22 7 5 3 3 1 0
North Delhi 16 40 10 2 2 6 5 5 5 4 1 1 1
South Delhi 14 31 17 2 8 5 3 5 6 2 3 3 2
West Delhi 22 23 11 4 14 8 4 3 5 3 2 1 1
Faridabad 10 17 17 7 6 15 6 5 8 3 2 3 1
Ghaziabad 15 20 15 5 14 7 8 3 6 2 2 2 0
Greater NOIDA 37 18 9 7 2 10 5 1 5 4 2 1 0
Gurgaon 11 25 10 8 8 12 8 2 6 3 4 1 0
NOIDA 3 47 9 0 2 0 15 3 6 8 5 4 0
Table 2. % Distribution of retail outlets in Delhi-NCR (source: Nimbekar et al., 2015).
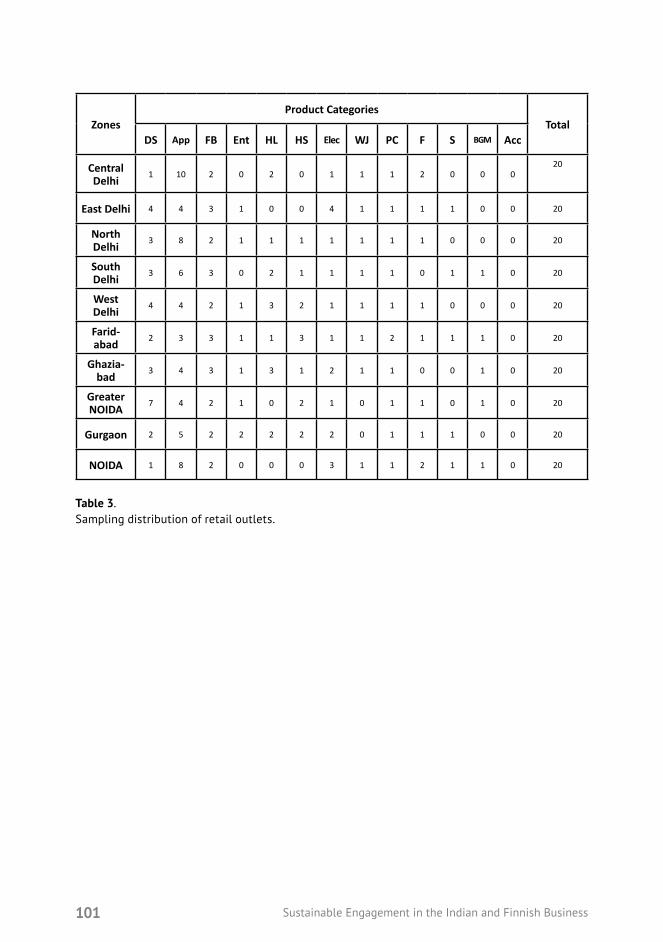
101 Sustainable Engagement in the Indian and Finnish Business
ZonesProduct Categories
TotalDS App FB Ent HL HS Elec WJ PC F S BGM Acc
Central Delhi 1 10 2 0 2 0 1 1 1 2 0 0 0
20
East Delhi 4 4 3 1 0 0 4 1 1 1 1 0 0 20
North Delhi 3 8 2 1 1 1 1 1 1 1 0 0 0 20
South Delhi 3 6 3 0 2 1 1 1 1 0 1 1 0 20
West Delhi 4 4 2 1 3 2 1 1 1 1 0 0 0 20
Farid-abad 2 3 3 1 1 3 1 1 2 1 1 1 0 20
Ghazia-bad 3 4 3 1 3 1 2 1 1 0 0 1 0 20
Greater NOIDA 7 4 2 1 0 2 1 0 1 1 0 1 0 20
Gurgaon 2 5 2 2 2 2 2 0 1 1 1 0 0 20
NOIDA 1 8 2 0 0 0 3 1 1 2 1 1 0 20
Table 3. Sampling distribution of retail outlets.

102 Sustainable Engagement in the Indian and Finnish Business
4. Data Analysis
The data collected by using questionnaires has been analysed using the Statistical Package for Social Sciences (SPSS) version 17.0.
4.1 SampleProfile
Out of 629 participants, 56.1% were male and 43.9% were female, 41.6% were single and 58.4% were married. The data collected also indicated the education levels of the employees. The intermediates, graduates, and postgraduates, were 42.6, 35.3 and 22.1% respectively. The average age of participants was 26.3 years. The duration of the service of participants with the present employer averaged at 3.6 years, whereas the duration of the participants’ present careers averaged at 5.8 years.
4.2 Validity and Reliability
The items of the questionnaire were developed on the basis of extant literature review, thus ensuring the content validity. The questionnaire was also pilot tested with a panel of academicians, researchers and employees of retail stores, after which necessary changes were made to improve the content as well as clarity of the questionnaire. Then, a sample of respondents distinct from those included in the pilot test was asked to pre-test the questionnaire.
Construct validities for both the variables i.e. employee job satisfaction and sustainable development were evaluated by using factor analyses. Tables 4 and 5 show that the Bartlett’s tests of sphericity were significant, indicating the feasibility of factor analyses for both variables. Also, the KMO (Kaiser-Meyer-Olkin) measures were large enough to support the data adequacy for factor analyses.
Kaiser-Meyer-Olkin Measure of Sampling Adequacy .813
Bartlett’s Test of Sphericity Approx. Chi-Square 10765.582
df 171
Sig. .000
Table 4. KMO and Bartlett’s test (employee job satisfaction).

103 Sustainable Engagement in the Indian and Finnish Business
Kaiser-Meyer-Olkin Measure of Sampling Adequacy .762
Bartlett’s Test of Sphericity Approx. Chi-Square 4712.867
df 105
Sig. .000
Table 5. KMO and Bartlett’s test (sustainable development).
Latent root criterion was employed to obtain the number of factors to be retained for further analysis. Using this criterion, five factors were retained for employee job satisfaction which represent 83.27% of the variance of the 19 items, and three factors were retained for sustainable development which represent 62.04% of the variance of the 15 items (Tables 6 and 7).
Factor Eigenvalue % of Variance Cumulative % of Variance
1 3.985 20.972 20.972
2 3.510 18.473 39.445
3 3.280 17.262 56.707
4 2.746 14.450 71.157
5 2.301 12.112 83.269
Table 6. Variance and eigenvalues (employee job satisfaction).
Factor Eigenvalue % of Variance Cumulative % of Variance
1 4.225 28.167 28.167
2 2.562 17.082 45.249
3 2.519 16.796 62.045
Table 7. Variance and eigenvalues (sustainable development).
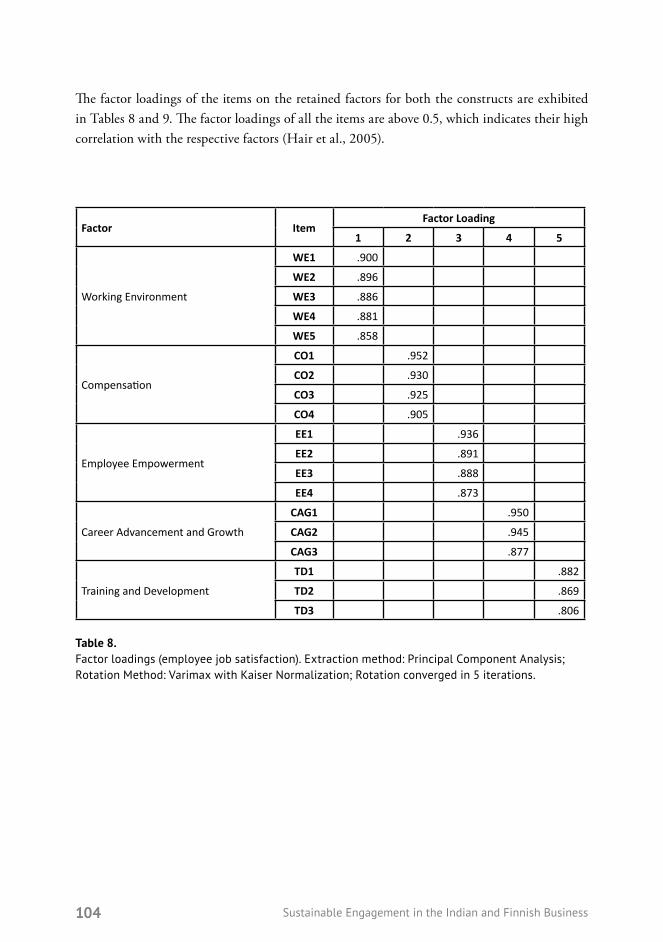
104 Sustainable Engagement in the Indian and Finnish Business
The factor loadings of the items on the retained factors for both the constructs are exhibited in Tables 8 and 9. The factor loadings of all the items are above 0.5, which indicates their high correlation with the respective factors (Hair et al., 2005).
Factor ItemFactor Loading
1 2 3 4 5
Working Environment
WE1 .900
WE2 .896
WE3 .886
WE4 .881
WE5 .858
Compensation
CO1 .952
CO2 .930
CO3 .925
CO4 .905
Employee Empowerment
EE1 .936
EE2 .891
EE3 .888
EE4 .873
Career Advancement and Growth
CAG1 .950
CAG2 .945
CAG3 .877
Training and Development
TD1 .882
TD2 .869
TD3 .806
Table 8. Factor loadings (employee job satisfaction). Extraction method: Principal Component Analysis; Rotation Method: Varimax with Kaiser Normalization; Rotation converged in 5 iterations.
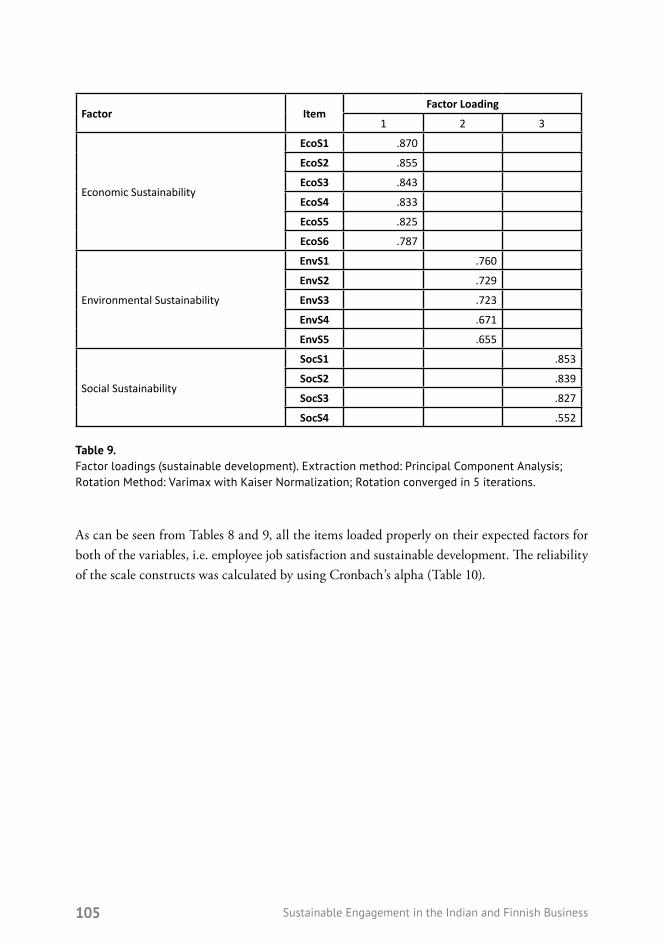
105 Sustainable Engagement in the Indian and Finnish Business
Factor ItemFactor Loading
1 2 3
Economic Sustainability
EcoS1 .870
EcoS2 .855
EcoS3 .843
EcoS4 .833
EcoS5 .825
EcoS6 .787
Environmental Sustainability
EnvS1 .760
EnvS2 .729
EnvS3 .723
EnvS4 .671
EnvS5 .655
Social Sustainability
SocS1 .853
SocS2 .839
SocS3 .827
SocS4 .552
Table 9. Factor loadings (sustainable development). Extraction method: Principal Component Analysis; Rotation Method: Varimax with Kaiser Normalization; Rotation converged in 5 iterations.
As can be seen from Tables 8 and 9, all the items loaded properly on their expected factors for both of the variables, i.e. employee job satisfaction and sustainable development. The reliability of the scale constructs was calculated by using Cronbach’s alpha (Table 10).

106 Sustainable Engagement in the Indian and Finnish Business
Construct No. of Items Cronbach’s alpha
Working Environment 5 .935
Compensation 4 .951
Employee Empowerment 4 .925
Career Advancement and Growth 3 .942
Training and Development 3 .854
Economic Sustainability 6 .915
Environmental Sustainability 5 .757
Social Sustainability 4 .781
Table 10. Reliability of model constructs.
The Cronbach’s reliability coefficients for all constructs were higher than the minimum cutoff value of 0.70 (Nunnally & Bernstein, 1994).
4.3 Model Testing
The hypotheses testing was conducted with five independent variables (working environment, compensation, employee empowerment, career advancement and growth, and training and development) and three dependent variables (economic sustainability, environmental sustainability, and social sustainability). The basic characteristics of these variables are presented in Table 11.
Variable No. of Items Mean Standard Deviation
Working Environment 5 3.6938 1.02940
Compensation 4 3.7055 .98030
Employee Empowerment 4 3.7456 1.08592
Career Advancement and Growth 3 3.7732 .96624
Training and Development 3 3.7340 .90404
Economic Sustainability 6 3.4886 .38688
Environmental Sustainability 5 3.7078 .56784
Social Sustainability 4 4.2285 .47061
Table 11. Regression variables.

107 Sustainable Engagement in the Indian and Finnish Business
Multiple regression analysis was used for hypothesis testing. Before applying the regression analysis, correlation analysis was done with the model constructs. The results reported in Table 12 show that the correlation between all the independent variables was below 0.75, which indicates that multicollinearity was not present and all these variables can be used for regression analysis (Weaver & Wuensch, 2013). Also, the correlations between all the independent variables and dependent variables were significant at 1% level of significance (Table 12).
WE EE CO CAG TD EcoS EnvS SocS
WE
Pearson Correlation 1 .223** .103** .121** .045 .172** .682** .205**
Sig. (2-tailed) .000 .010 .002 .263 .000 .000 .000
EE
Pearson Correlation .223** 1 .032 .066 .025 .207** .167** .242**
Sig. (2-tailed) .000 .426 .096 .526 .000 .000 .000
CO
Pearson Correlation .103** .032 1 .170** .204** .732** .193** .242**
Sig. (2-tailed) .010 .426 .000 .000 .000 .000 .000
CAG
Pearson Correlation .121** .066 .170** 1 .397** .367** .252** .590**
Sig. (2-tailed) .002 .096 .000 .000 .000 .000 .000
TD
Pearson Correlation .045 .025 .204** .397** 1 .364** .494** .653**
Sig. (2-tailed) .263 .526 .000 .000 .000 .000 .000
EcoS
Pearson Correlation .172** .207** .732** .367** .364** 1 .375** .518**
Sig. (2-tailed) .000 .000 .000 .000 .000 .000 .000
EnvS
Pearson Correlation .682** .167** .193** .252** .494** .375** 1 .511**
Sig. (2-tailed) .000 .000 .000 .000 .000 .000 .000
SocS
Pearson Correlation .205** .242** .242** .590** .653** .518** .511** 1
Sig. (2-tailed) .000 .000 .000 .000 .000 .000 .000
Table 12. Correlations.

108 Sustainable Engagement in the Indian and Finnish Business
4.4 Results
The results for the multiple regression analysis between all the five dimensions of employee job satisfaction and economic sustainability dimension of sustainable development are found to be significant (F=227.036, p<.01). All the dimensions of employee job satisfaction except working environment significantly impact the economic sustainability of the organization thereby supporting hypotheses H1b–H1e (Table 13). The four dimensions, i.e. compensation, employee empowerment, career advancement and growth, and training and development, explain the 64.3% variance in the organization’s economic sustainability.
Further, it can be observed from Table 13 that compensation has the greatest contribution in the economic sustainability of an organization. This is followed by career advancement and growth, employee empowerment, and training and development. If the employees are satisfied with the salary structures and compensation policies of their organization, this indicates that the organization is able to distribute economic value and cascade the benefits to its employees, which reflects its economic sustainability. Similarly, offering growth opportunities to the employees indicates that the organization values the competencies of its employees and intends to maintain a long-term association with them. Also, empowering the employees by involving them in decision-making reflects that the organization trusts its employees and shares all the relevant information with them. This shows that decisions in the organization are taken on the basis of formal strategic planning that encompasses the organization as a whole, which is indicative of economic sustainability of the organization.
Variable Standardized Beta (β) Coefficient t p-value VIF
WE .039 1.591 .112 1.073
CO .662 26.931* .000 1.061
EE .161 6.578* .000 1.054
CAG .179 6.823* .000 1.214
TD .152 5.779* .000 1.215
*significant at 0.01 levelDependent Variable: Economic Sustainability
Table 13. Multiple Regression Results: Economic Sustainability.

109 Sustainable Engagement in the Indian and Finnish Business
The results for the multiple regression analysis between the five dimensions of the employee job satisfaction and environmental sustainability dimension of sustainable development are also found to be significant (F=266.502, p<.01). However, it is found that only two dimensions of employee job satisfaction, i.e. working environment, and training and development, significantly impact economic sustainability. Hence, hypotheses H2a and H2e are supported (Table 14). The 67.9% variance in the organization’s environmental sustainability is explained by working environment and training and development.
An organization which is concerned with the physical aspects of working conditions of its employees is also expected to maintain healthy and environment-friendly conditions for the customers, community, and society as well. Hence, employees’ satisfaction with working environment indicates the environmental sustainability of the organization. Also, providing training on environmental awareness to employees results in an increase in the organization’s environmental sustainability. The trained employees can pass on the environmental awareness to the consumers and educate them with respect to the correct use of the products, aiming to improve environmental performance.
Variable Standardized Beta (β) Coefficient t p-value VIF
WE .658 28.096* .000 1.073
CO .034 1.443 .149 1.061
EE .008 .342 .732 1.054
CAG -.018 -.723 .470 1.214
TD .465 18.639* .000 1.215
*significant at 0.01 levelDependent Variable: Environmental Sustainability
Table 14. Multiple regression results: environmental sustainability.
The results for the multiple regression analysis between all the dimensions of employee job satisfaction and social sustainability dimension of sustainable development are also found to be significant (F= 195.598, p<.01). It can be noticed from Table 15 that all the dimensions of employee job satisfaction significantly impact the social sustainability of the organization. Hence, hypotheses H3a–H3e are supported. All the dimensions of employee job satisfaction explain 60.8% variance in the organization’s social sustainability. Out of all the dimensions, training and development followed by career and growth opportunities and employee empowerment have the greatest impact on social sustainability whereas compensation has the least impact (Table 15).

110 Sustainable Engagement in the Indian and Finnish Business
If the organization conducts regular training and development programmes for its employees, it means that the organization is concerned with the sustainable development of its human capital. Also, if the organization has fair promotion policies and offers sufficient growth opportunities to its employees, it indicates that the organization is unbiased and does not discriminate on any basis, which indicates social sustainability. Further, employee empowerment indicates that the organization promotes collective agreements in decision-making. Employees’ satisfaction with working environment shows that the organization offers safety conditions and occupational health, minimizing occupational illness, sick days, and deaths related to work, which is also indicative of the social sustainability of the organization.
Variable Standardized Beta (β) Coefficient t p-value VIF
WE .092 3.539* .000 1.073
CO .066 2.555* .001 1.061
EE .183 7.131* .000 1.054
CAG .362 13.139* .000 1.214
TD .488 17.696* .000 1.215
*significant at 0.01 levelDependent Variable: Social Sustainability
Table 15. Multiple regression results: social sustainability.
5. Conclusions
The present research sought to explore the perceptions of frontline employees of modern retail stores in Delhi-NCR on the relationship between various characteristics of employee job satisfaction (working environment, compensation, employee empowerment, career advancement and growth, and training and development) and three dimensions of sustainable development of organizations (economic sustainability, environmental sustainability, and social sustainability). The study has contributed to the current literature and management practice by increasing empirically validated understanding about the contribution of employee job satisfaction in the sustainable development of organizations.

111 Sustainable Engagement in the Indian and Finnish Business
On the basis of the findings of the study, it can be concluded that employee job satisfaction is necessary for the sustainable development of an organization. If an organization nurtures its employees, the skill inventory can be enhanced and a sustained competitive advantage can be achieved. Employees who are happy with their salary and working environment and foresee a secure future for themselves in the organization can give a better yield, craft good decisions, and contribute positively to the organization’s goals. Employee satisfaction is a premise to achieve the retention and attraction of top talent that leads to organizational success and sustainability. An assured good quality of work life not only attracts young and new talent but also retains the existing and experienced talent necessary for the sustainability of an organization. Satisfied employees feel more connected with their work and feel that their actions make a difference in improving the environment and other social issues of the organization. Having fair organizational practices and creating a healthy work environment where employees have decision-making power represent a critical aspect in the employee satisfaction, in general, and for practising sustainability, in particular.
5.1 Managerial Implications
The results of this study offer several guidelines which may help retail organizations in developing successful sustainability practices. Considering the importance of the job satisfaction of frontline employees in sustainable development, it is essential for retailers to adopt suitable strategies for improving various aspects of job satisfaction of their frontline employees. The organizations should never view their employees as cost; rather, human resources (employees) should be viewed as an opportunity for investment because the more you invest, the more you gain.
Generally, India’s retail workers face poor salary packages and some salespersons are paid even less than the minimum wages, sometimes without a formal contract or a salary slip to prove their employment (Rao, 2015). Thus, compensation is a critical element which determines their level of job satisfaction. Since higher wages contribute to greater economic growth and overall wealth, therefore the retailers can enhance their economic sustainability by offering good pay packages to their frontline employees. Suitable policies should be built with regard to compensation and various benefits for the frontline employees to motivate them, considering the financial position from time to time. During times of financial crisis in an organization, many employees intend to leave the organization due to payroll cuts and layoffs. Despite such crisis, the organization should devote its attention to taking effective steps on a selective basis to improve the job satisfaction of the employees for their retention.

112 Sustainable Engagement in the Indian and Finnish Business
Providing an environment-friendly and healthy working environment to the employees may enhance the environmental sustainability of organizations. Frontline retail employees are constantly engaged in shelf management in retail stores. Therefore, retailers should be cautious regarding the physical aspects of their employees’ working environment and use environment-friendly infrastructure for displaying the products. Also, retailers should possess a contingency plan to deal with environmental disasters. Moreover, as frontline employees are the direct interface to the customers, retailers should provide ample training to them related to the product and environmental awareness so that they can educate the customers with respect to the correct use of the products, aiming to improve the environmental performance of the organization.
Retail organizations can improve their social sustainability by focusing on career advancement and growth opportunities offered to their frontline employees, the training and development of employees, and employee empowerment. Generally, frontline employees perceive their positions as the end of their careers with no or very little opportunities for growth. Retail organizations should define a career path for their frontline employees so that they can see a secure future for themselves in the organization and contribute to its social sustainability. The retailers should train and develop their frontline employees in order to help them in gaining the required job skills and knowledge about the organizational policies and practices. In the short term, training will facilitate the change by developing the potential of the employees; in the long run, training will accompany the culture change and help the adaptability of employees. The frontline employees in many retail organizations do not know the mission, vision, and objectives of the organization in spite of being an integral part of it and contributing effectively to its development through their talents and competencies. Therefore, retailers should build an appropriate corporate culture in order to achieve the organization’s mission and vision by involving each employee. Regular feedback should be obtained from the employees in order to learn their opinions in this regard. This will give a sense of belongingness and empowerment to employees thereby contributing to the social sustainability. The organizations should also carry out proper and fair assessment of the work done by each employee with reasonable justice. This will encourage the employees to perform better and hence help in the sustainable development of the organization.
5.2 Limitations and Future Directions
In this study, quota sampling has been used to select the respondents. The study is based on a sample of 629 users only, which makes the findings of this study probabilistic. Future research needs to use more diversified random samples in order to ensure the generalizability of research findings. Moreover, the study has examined the relationship of only employee job satisfaction with organizational sustainability. Future studies need to investigate the effect of other variables, e.g. employee job performance, organizational citizenship behaviour, and employee engagement, on the sustainable development of organizations.

113 Sustainable Engagement in the Indian and Finnish Business
References
Aninkan, D. O. & Oyewole, A. A. (2014). The influence of individual and organizational factors on employee engagement. International Journal and of Development Sustainability 3(6), 1381–1392.
Azapagic, A. & Perdan, S. (2000). Indicators of sustainable development for industry : a general framework, Institution of Chemical Engineers 78, 243–261.
Azapagic, A. (2003). Systems approach to corporate sustainability: A general management framework. Process Safety and Environmental Protection 81(5), 303–316.
Bakotić, D. & Tomislav, B. (2013). Relationship between working conditions and job satisfaction: The case of Croatian Shipbuilding Company. International Journal of Business and Social Science 4(2), 206–213.
Bartlett, K. R. (2001). The relationship between training and organizational commitment: A study in the health care field. Human Resource Development Quarterly 12(4), 35–352.
Berry, L. L. (1981). The Employee as Consumer. Journal of Retail Banking 3, 33–40.
Bhattacharya, C. B., Sen, S. & Korschun, D. (2007). Corporate social responsibility as an internal marketing strategy. Sloan Management Review.Bustamam, L., Teng, S. S. & Abdullah, F. Z. (2014). Reward management and job satisfaction among frontline employees in hotel industry in Malaysia. Procedia – Social and Behavioral Sciences 144, 392–402.
Carraher, S. M. (2011). Turnover prediction using attitudes towards benefits, pay, and pay satisfaction among employees and entrepreneurs in Estonia, Latvia, and Lithuania. Baltic Journal of Management 6(1), 25–52.
Cella-De-Oliveira, F. A. (2013). Indicators of organizational sustainability: A Proposition from Organizational Competences. International Review of Management and Business Research 2(4), 962–979.
Charania, B. (2014, May 29). Emerging Role of HR in Today’s Retail World [Web log post]. Retrieved from https://www.indiaretailing.com/2014/05/29/retail/emerging-role-of-hr-in-todays-retail-world/.
Conger, J. A. & Kanungo, R. N. (1988). The empowerment process: integrating theory and practice. Academy of Management Review 13(3), 471–82.
Danish, R. Q., & Usman, A. (2010). Impact of reward and recognition on job satisfaction and motivation: An empirical study from Pakistan. International Journal of Business and Management 5(2), 159–167.

114 Sustainable Engagement in the Indian and Finnish Business
Delery, J. E. & Doty, D. H. (1996). Modes of theorizing in strategic human resource management: Tests of universalistic, contingency, and configurations performance predictions. The Academy of Management Journal 39(4), 802–835.
Dumitrana, M., Dumitru, M., Jianu, I. & Jinga, G. (2009). Human resources role in sustainable development. Academy of Economic Studies Bulletin 61(3), 44–53.
Dumitrescu, L. & Apostu, C. (2009). Marketing and the quality of services. Bucharest: Expert Publishing House.
Dutta, S. S., Nimbekar, A., & Sood, A. (2016). Think India. Think Retail. Knight Frank India. Retrieved from http://www.rai.net.in/images/reports-2016/Kight-Frank-think-india-think-retail-2016-3500.pdf. Dyllick, T. & Hockerts, K. (2002). Beyond the business case for corporate sustainability. Business Strategy and the Environment 11, 130–141.
Edwards, A. L. (1957). Techniques of attitude scale construction. New York: Appleton Century Crofts.
Epstein, M. J. & Rejc, A. (2014). Making sustainability work: best practices in managing and measuring corporate social, environmental, and economic impacts. San Francisco: Greenleaf Publishing/Berrett-Koehler, Inc.
Florea, L., Cheung, Y. H. & Herndon, N. C. (2013). For all good reasons: Role of values in organizational sustainability. Journal of Business Ethics 114, 393–408.
Ghazanfar, F., Chuanmin, S., Khan, M. M. & Bashir, M. (2011). A study of relationship between satisfaction with compensation and work motivation. International Journal of Business and Social Science 2(1), 120–131.
Global Reporting Initiative – GRI. (2013). Sustainability Reporting Guidelines. Amsterdam: GRI.
Goodall, B. (1995). Environmental Auditing: a tool for assessing the environmental performance of tourism firms. The Geographical Journal 161(1), 29–37.
Haas, M. R. (2010). The double-edged swords of autonomy and external knowledge: analyzing team effectiveness in a multinational organization. The Academy of Management Journal 53, 989–1008.
Hackman, J. R. & Oldham, C. R. (1975). Development of the job diagnostic survey. Journal of Applied Psychology 60(2), 159–170.
Hahn, T. & Scheermesser, M. (2006). Approaches to Corporate Sustainability among German Companies. Corporate Social Responsibility and Environmental Management 13(3), 150–165.
Hair, J. F. Jr, Black, W. C., Babin, B. J., Anderson, R. E. & Tatham, R. L. (2006). Multivariate data analysis. 6th edition. NJ: Prentice Hall.

115 Sustainable Engagement in the Indian and Finnish Business
Hales, C. & Klidas, A. (1998). Empowerment in five-star hotels: choice, voice or rhetoric? International Journal of Contemporary Hospitality Management 10(3), 88–95.
Hart, S. L. & Milstein, M. B. (2003). Creating sustainable value. Academy of Management Executive 17(2), 56–69.
Harter, J. K., Schmidt, F. L. & Hayes, T. L. (2002). Business-unit-level relationship between employee satisfaction, employee engagement, and business outcomes: A meta-analysis. Journal of Applied Psychology 87, 268–279.
Hoffman, D. K. & Ingram, T. N. (1991). Creating customer-oriented employees: the case in home health care. Journal of Human Capacity Management 11(2), 24–32.
Hoppok, R. & Spielgler, S. (1938). Job satisfaction. Occupations: The Vocational Guidance Journal 16(7), 636–643.
Ivancevich, J. M. (2010). Human resource management. Boston: McGraw-Hill Irwin.
Jun, M., Cai, S. & Shin, H. (2006). TQM practice in maquiladora: antecedents of employee satisfaction and loyalty. Journal of Operations Management 24, 791–812.
Kabra, K. N. (2003). The unorganized sector in India: some issues bearing on the search for alternatives. Social Scientist 31, (11), 23–46.
Kaur, S. (2007). Crisis of retail trade: Alternative economic survey, India, 2006-2007: Pampering Corporates, Pauperizing Masses 167–182.
Klynveld Peat Marwick Goerdeler (KPMG). (2014). Indian Retail: The next growth story. Retrieved from https://assets.kpmg/content/dam/kpmg/pdf/2014/11/BBG-Retail.pdf. Landy, F. J. (1985). Psychology of work behaviour. Homewood, IL: Dorsey Press.
Laschinger, H. K. S., Finegan, J. E., Shamian, J., & Wilk, P. (2004). A longitudinal analysis of the impact of workplace empowerment on work satisfaction. Journal of Organizational Behavior 25, 527–545.
Lee, C., Song, H., Lee, H., Lee, S. & Bernhard, B. (2013). The impact of CSR on casino employees’ organizational trust, job satisfaction, and costumer orientation: An empirical examination of responsible gambling strategies. International Journal of Hospitality Management 33, 406–415.
Lipman, V. (2014, January 24). Want Motivated Employees? Offer Ample Opportunities for Growth [Web log post]. Retrieved from https://www.forbes.com/sites/victorlipman/2014/01/24/want-motivated-employees-offer-ample-opportunities-for-growth/#67ee716152c6.
Locke, E. A. (1976). The nature and causes of job satisfaction. In M. D. Dunnette (Ed.), Handbook of industrial and organizational psychology, Rand McNally, Chicago.
116 Sustainable Engagement in the Indian and Finnish Business
Martensen, A. & Gronholdt, L. (2001). Using employee satisfaction measurement to improve people management: an adaptation of Kano’s quality types. Total Quality Management 2(8), 949–57.
Masood, A., Aslam, R. & Rizwan, M. (2014). Factors affecting employee satisfaction of the public and private sector organizations of Pakistan. International Journal of Human Resource Studies 4(2), 97–121.
Mirvis, P. (2012). Employee engagement and corporate social responsibility: Transactional, relational, and developmental approaches. California Management Review 54 (4), 93–117.
Mishra, S. & Gupta, B. (2009). Work place motivators and employees’ satisfaction: A Study of Retail Sector in India. Indian Journal of Industrial Relations: Economics and Social Development 44(3), 509–519.
Mo, G. & Buavaraporn, N. (2014). The study of front-line employee motivation in retailing business: empirical evidence from department stores in Bangkok. International Journal of Business and Economics, 117–137.
Moldovan, I. A. (2016). Aspects regarding Romania’s progress towards sustainable development, Annals of the Constantin Brâncuşi. University of Târgu Jiu, Economy Series 1, 138–145.
Munck, L., Munck, M. M. G. & Souza, R. B. (2011). Organizational Sustainability: The Proposal of a Representative Framework of Competent Action for its Event. General – Magazine Interinstitutional Psychology 4(2), 147–158.
Mustapha, N. & Zakaria, Z. C. (2013). The effect of promotion opportunity in influencing job satisfaction among academics in higher public institutions in Malaysia. International Journal of Academic Research in Business and Social Sciences 3(3), 20–26.
Nimbekar, A., Sood, A., Bachkaniwala, H., Gupta, H., Dutta, S. S., Rathi, V. & Bangera, Y. (2015). Think India. Think Retail. A definitive view on India’s retail market. India: Knight Frank. Retrieved from https://content.knightfrank.com/research/317/documents/en/india-retail-report-2646.pdf.
Nunnally, J. & Bernstein, I. H. (1994). Psychometric theory, 3rd ed., McGraw-Hill, New York.
Ojo, F. (1998). Personnel Management: Theories and Issues. Lagos: Panaf Publishing.
Palmatier, R. W., Scheer, L. K. & Steenkamp, J.-B. E. M. (2007). Customer loyalty to whom? Managing the benefits and risks of salesperson-owned loyalty. Journal of Marketing Research 44(2), 185–189.
Randev, K. K. & Nandan, T. (2016). Quality of work life indicators for sustainable. International Journal of Management and Applied Science (12), 170–174.
Rane, D. B. (2011). Employee Job Satisfaction: An Essence of Organization. HRM Review 11(7), 10–16.

117 Sustainable Engagement in the Indian and Finnish Business
Rao, M. (2015, October 3). Behind the Glittering Facade, India’s Retail Workers Face Poor Pay, Poorer Prospects [Web log post]. Retrieved from https://thewire.in/economy/behind-the-glittering-facade-indias-retail-workers-face-poor-pay-poorer-prospects.
Retail Industry Leaders Association (2013). 2012 Retail Sustainability Report: Successes, Challenges, and a Vision for the Future. Retrieved from http://www.rila.org/sustainability/sustreport2013/sustainability-report-landing-page/Documents/2012RetailSustainabilityReport.pdf.
Rice, R., McFarlin, D. & Bennett, D. (1989). Standards of comparison and job satisfaction. Journal of Applied Psychology 74, 591–8.
Rompa, I. (2011). Explorative research on sustainable human resource management, Master’s thesis work on organizational psychology. Amsterdam: VU University.
Schmidt, S. W. (2007). The relationship between satisfaction with workplace training and overall job satisfaction. Human Resource Development Quarterly 18(4), 481–498.
Scott, K. D., Jusanne, M. & Steven, M. E. (2000). Factors influencing employee benefits beliefs that, pay is tied to performance. Journal of Business and Psychology 14, 553–562.
Sergeant, A. & Frenkel, S. (2000). When do customer contact employees satisfy customers? Journal of service research 3(1), 18–34.Singh, R. & Tripathi, A. (2008). Diagnosing impact of malls on small shops. Business Review 10, 9(1), 77–85.
Smith, P. A. C. & Sharicz, C. (2011). The shift needed for sustainability. The Learning Organization Journal 18, 73–86.
Smith, P. C., Kendall, L. & Hulin, C. L. (1969). The measurement of satisfaction in work and retirement: A strategy for the study of attitudes. Chicago: Rand McNally.
Spector, P. E. (1985). Measurement of human service staff satisfaction: Development of the Job Satisfaction Survey. American Journal of Community Psychology 13, 693–713.
Spreitzer, G., Sutcliffe, K., Dutton, J., Sonenshein, S. & Grant, A. M. (2005). A socially embedded model of thriving at work. Organization Science 16 (5), 537–549.
Strong, M. H., Jeanneret, P. R., McPhail, S. M., Blakley, B. R. & D’Egidio, E. L. (1999). Work context: Taxonomy and measurement of work environment. In N. G. Peterson, M. D. Mumford, W. C. Borman, P. R. Jeanneret and E. A. Fleishman (Eds.), An occupational information system for the 21st century. American Psychological Association. Washington, D.C.
FICCI. The Federation of Indian Chambers of Commerce and Industry. (2012). The Indian Kaleidoscope. Emerging trends in retail. Retrieved from https://www.pwc.in/assets/pdfs/industries/retail-and-consumer/retail-report-300812.pdf.

118 Sustainable Engagement in the Indian and Finnish Business
Togia, A., Koustelios, A. & Tsigilis, N. (2004). Job satisfaction among Greek academic librarians, Library and Information Science Research, 26, 373–83.Velazquez, L. E., Esquer, J., Munguõa, N. E. & Moure-Eraso, R. (2011). Sustainable learning organizations. The Learning Organization 18, 36–44.
Vendenberghe, C. & Tremblay, M. (2008). The role of pay satisfaction and organizational commitment in turnover intentions: a two-sample study. Journal of Business and Psychology 22(3), 275–286.
Vorhies, D. W. & Morgan, N. A. (2005). Benchmarking marketing capabilities for sustainable competitive advantage. Journal of Marketing 69(1), 80–94.
Vroom, V. H. (1964). Work and motivation. New York: John Wiley and Sons.
Wang, G. & Lee, P. D. (2009). Psychological Empowerment and Job Satisfaction an Analysis of Interactive Effects. Group and Organization Management 34(3), 271–296.
WBCSD & University of Cambridge Programme for Industry (2005). Driving success. Human resources and sustainable development. Cambridge: University of Cambridge Institute for Sustainable Leadership (CISL). Retrieved from https://www.cisl.cam.ac.uk/resources/publication-pdfs/hr-briefing.pdf. Weaver, B. & Wuensch, K. L. (2013). SPSS and SAS programs for comparing Pearson correlations and OLS regression coefficients. Behavior. Research. Methods 45, 880–895.Weiss, H. M. (2002). Deconstructing job satisfaction: Separating evaluations, beliefs affective experiences. Human Resource Management Review 12, 173–194
World Commission on Environment and Development (1987). Report of the World Commission on Environment and Development: Our Common Future. Retrieved from http://www.un-documents.net/wced-ocf.htm.

119 Sustainable Engagement in the Indian and Finnish Business
Exploring Private Participation in Indian Water Sector: Issues and Options
Dr. Tirthankar Nag Professor and Dean, International Management Institute, Kolkata, West Bengal, India
Dr. Juha Kettunen Chancellor & Adjunct Professor, Turku University of Applied Sciences, Turku, Finland
Dr. Kaisa Sorsa Principal Lecturer, Turku University of Applied Sciences, Turku, Finland
Abstract
The study examines the issues around private participation in the water treatment and distribution business in India. The study explores these issues through a series of brief case studies and survey of secondary literature. The study finds that there are a number of issues around contracts, pricing, institutions, and property rights, which need to be addressed for this sector to function properly.
Keywords: Institutions; Water Markets; Contracts
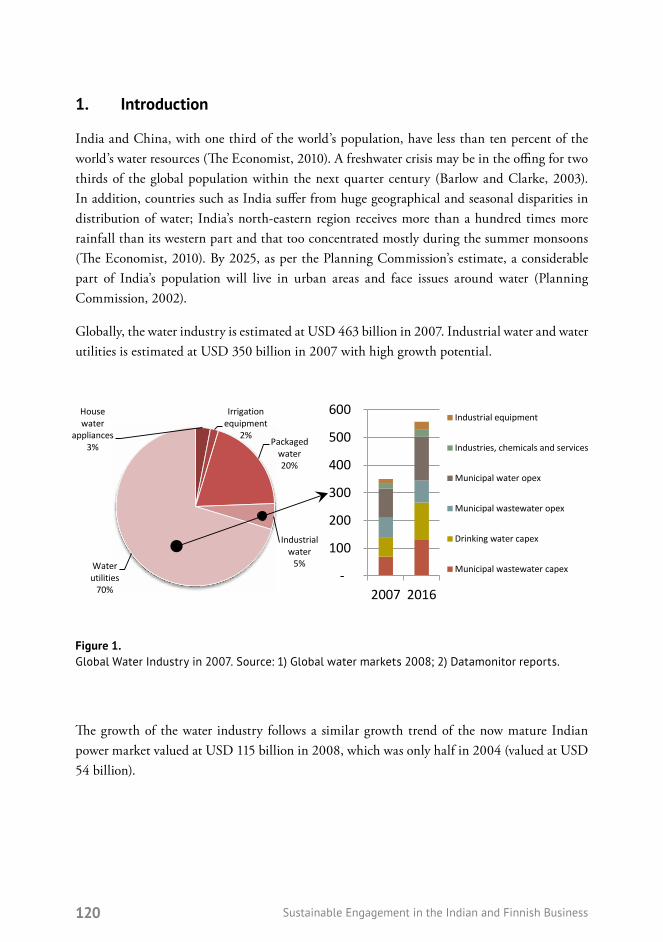
120 Sustainable Engagement in the Indian and Finnish Business
1. Introduction
India and China, with one third of the world’s population, have less than ten percent of the world’s water resources (The Economist, 2010). A freshwater crisis may be in the offing for two thirds of the global population within the next quarter century (Barlow and Clarke, 2003). In addition, countries such as India suffer from huge geographical and seasonal disparities in distribution of water; India’s north-eastern region receives more than a hundred times more rainfall than its western part and that too concentrated mostly during the summer monsoons (The Economist, 2010). By 2025, as per the Planning Commission’s estimate, a considerable part of India’s population will live in urban areas and face issues around water (Planning Commission, 2002).
Globally, the water industry is estimated at USD 463 billion in 2007. Industrial water and water utilities is estimated at USD 350 billion in 2007 with high growth potential.
Figure 1. Global Water Industry in 2007. Source: 1) Global water markets 2008; 2) Datamonitor reports.
The growth of the water industry follows a similar growth trend of the now mature Indian power market valued at USD 115 billion in 2008, which was only half in 2004 (valued at USD 54 billion).
Some authors are of the opinion that public sector has failed to provide water, especially to the poor, in large parts of the developing world (Bhaduri & Kejriwal, 2005). Private participation in the water sector, although a growing phenomenon in India, has been long established in other developed markets. Initiatives for greater private involvement in countries such as the western United States, Europe, Africa, and South America, have resulted in significantly improved water industry performance (Kanazawa, 2006). A global study has also concluded that private participation in electricity and water distribution is associated with stronger gains in productivity and service quality (Gassner, Popov & Pushak, 2009). In many countries, such as in the UK, the private sector plays a major role in developing the water sector supported by strong institutions. In addition to financing, private participation has also improved both coverage and quality of water supply in countries like Chile (Gazmuri & Rosegrant, 1994). Countries like China
House water
appliances3%
Irrigation equipment
2%Packaged
water20%
Industrial water
5%Water utilities
70% -
100
200
300
400
500
600
2007 2016
Industrial equipment
Industries, chemicals and services
Municipal water opex
Municipal wastewater opex
Drinking water capex
Municipal wastewater capex

121 Sustainable Engagement in the Indian and Finnish Business
Some authors are of the opinion that public sector has failed to provide water, especially to the poor, in large parts of the developing world (Bhaduri & Kejriwal, 2005). Private participation in the water sector, although a growing phenomenon in India, has been long established in other developed markets. Initiatives for greater private involvement in countries such as the western United States, Europe, Africa, and South America, have resulted in significantly improved water industry performance (Kanazawa, 2006). A global study has also concluded that private participation in electricity and water distribution is associated with stronger gains in productivity and service quality (Gassner, Popov & Pushak, 2009). In many countries, such as in the UK, the private sector plays a major role in developing the water sector supported by strong institutions. In addition to financing, private participation has also improved both coverage and quality of water supply in countries like Chile (Gazmuri & Rosegrant, 1994). Countries like China have also opened their water market to private participation mainly to plug the financing gap with provision for foreign investors eligible to be majority shareholders in joint ventures (Choi, Chung & Lee, 2010). Some studies are of the opinion that the overall expectations of increased investments and improved efficiency to be gained by expanding private sector participation in water services have not been met, which has been formally recognized by institutions such as the World Bank (Hukka & Vinnari, 2007). There has also been discontent about private involvement in developing countries due to the unwillingness of private operators to expand coverage in low-income areas and the associated steep tariff increase leading to agreement termination in many cases (Hukka & Vinnari, 2007). A study of six developed water markets has produced the results presented below in Table 1.
Countries Status since 1987USA Mainly regulated activities, rather than the non-regulated operations and maintenance (O&M)
outsourcing contracts which emerged in the 1990s
England & Wales 29 statutory water companies serving 13.8 million people by 1989
France The private sector share had advanced from 72% in 1987 to 80% by 2010
Italy 11% of the market was served by the private sector and semiprivate companies in 1987
Spain The private sector share advanced from 35% in 1987 to nearly 50% by 2010
Germany Gelsenwasser and certain local companies hold approximately 8% of the market through long-term contracts
Table 1. Private participation in selected developed countries (GWI, 2010).

122 Sustainable Engagement in the Indian and Finnish Business
1.1 Water Market in India: Supply Side
India receives an annual precipitation of 4000 billion m3 of water, out of which only around 60% is usable. Out of this usable water, around 40% is ground water and the rest is surface water. Out of the water used, only 20% is treated and used and the rest goes waste. India with its large coastline has an abundant supply of sea water. However, treated sea water is expensive due to its high energy requirement and equipment cost.
Figure 2. Water supply in India in billion cubic metres (Grail Research, 2009).
coastline has an abundant supply of sea water. However, treated sea water is expensive due to its high energy requirement and equipment cost.
Figure 2. Water supply in India in billion cubic metres (Grail Research, 2009).
1.2 Water Market in India: Demand Side
Even if India is able to tap all its available water resources, scarcity is unavoidable, as is evident from the demand of water which will far outstrip the supply as shown in the figures below. Other sources of tapping water supply would be through the treatment of sea water and waste water. Thus it may be necessary to explore other sources of financing to improve the current delivery mechanisms as well as plan for the future by tapping other sources of water. Standing Sub-Committee of MoWR NCIWRD
Non usable water;
777
Surface water;
689
Ground water;
387
; 0
Usable water, 1 075
0
200
400
600
800
1000
1200
1400
1600
2010 2025 2050
Billi
on C
ubic
Met
res
0
200
400
600
800
1000
1200
1400
1600
2010 2025 2050
Billi
on C
ubic
Met
res
Others
Energy
Industry
Drinking Water
Irrigation

123 Sustainable Engagement in the Indian and Finnish Business
1.2 Water Market in India: Demand Side
Even if India is able to tap all its available water resources, scarcity is unavoidable, as is evident from the demand of water which will far outstrip the supply as shown in the figures below. Other sources of tapping water supply would be through the treatment of sea water and waste water. Thus it may be necessary to explore other sources of financing to improve the current delivery mechanisms as well as plan for the future by tapping other sources of water.
Figure 3. Water requirements across various sectors; MoWR refers to the Ministry of Water Resources, the Government of India; NCIWRD refers to the National Commission on Integrated Water Resources Development, India (CPCB, 2009; 2030 Water Resources Group).
coastline has an abundant supply of sea water. However, treated sea water is expensive due to its high energy requirement and equipment cost.
Figure 2. Water supply in India in billion cubic metres (Grail Research, 2009).
1.2 Water Market in India: Demand Side
Even if India is able to tap all its available water resources, scarcity is unavoidable, as is evident from the demand of water which will far outstrip the supply as shown in the figures below. Other sources of tapping water supply would be through the treatment of sea water and waste water. Thus it may be necessary to explore other sources of financing to improve the current delivery mechanisms as well as plan for the future by tapping other sources of water. Standing Sub-Committee of MoWR NCIWRD
Non usable water;
777
Surface water;
689
Ground water;
387
; 0
Usable water, 1 075
0
200
400
600
800
1000
1200
1400
1600
2010 2025 2050
Billi
on C
ubic
Met
res
0
200
400
600
800
1000
1200
1400
1600
2010 2025 2050
Billi
on C
ubic
Met
res
Others
Energy
Industry
Drinking Water
Irrigation

124 Sustainable Engagement in the Indian and Finnish Business
2. Need for Private Involvement
Political economy and performance issues in water supply and sanitation have historically slowed the pace of investment in the sector (Planning Commission, 2008). The growing importance of the water sector can be inferred from the increased allocation to the water sector in the eleventh plan (Rs. 143 730 crores in the eleventh plan compared to Rs. 64 803 crores in the tenth plan). This arises from the need to increase coverage of water supply and sanitation services and the necessary finances required for such a venture. Also, some estimates of the enormity of funds requirement can be acquired from India Water Vision 2025 which projected an investment requirement of Rs 5 000 billion in 25 years or Rs 200 billion per year (Iyer, 2001).
Figure 4. Actual and projected annual investments in water supply and sanitation (Planning Commission, 2008).
Figure 3. Water requirements across various sectors; MoWR refers to the Ministry of Water Resources, the Government of India; NCIWRD refers to the National Commission on Integrated Water Resources Development, India (CPCB, 2009; 2030 Water Resources Group).
2. Need for Private Involvement
Political economy and performance issues in water supply and sanitation have historically slowed the pace of investment in the sector (Planning Commission, 2008). The growing importance of the water sector can be inferred from the increased allocation to the water sector in the eleventh plan (Rs. 143 730 crores in the eleventh plan compared to Rs. 64 803 crores in the tenth plan). This arises from the need to increase coverage of water supply and sanitation services and the necessary finances required for such a venture. Also, some estimates of the enormity of funds requirement can be acquired from India Water Vision 2025 which projected an investment requirement of Rs 5 000 billion in 25 years or Rs 200 billion per year (Iyer, 2001).
Figure 4. Actual and projected annual investments in water supply and sanitation (Planning Commission, 2008).
In India, private investments in the water sector have been promoted since long (MoWR, 1995). In the nineties itself, state governments were trying to get private funds directly by inviting bids and indirectly by floating water bonds (Saleth, 1999).
Some of the plans for meeting the investment needs for this sector are covered by the Jawaharlal Nehru National Urban Renewal Mission (JNNURM). JNNURM provides central government investments through urban local municipal organizations. Also, central government investments through JNNURM are supplemented by counterpart financing by the state
0
10 000
20 000
30 000
40 000
50 000
2003 2004 2005 2006 2007 2008 2009 2010 2011 2012
Rs. C
rore
s
125 Sustainable Engagement in the Indian and Finnish Business
In India, private investments in the water sector have been promoted since long (MoWR, 1995). In the nineties itself, state governments were trying to get private funds directly by inviting bids and indirectly by floating water bonds (Saleth, 1999).
Some of the plans for meeting the investment needs for this sector are covered by the Jawaharlal Nehru National Urban Renewal Mission (JNNURM). JNNURM provides central government investments through urban local municipal organizations. Also, central government investments through JNNURM are supplemented by counterpart financing by the state governments. Apart from JNNURM, there are other schemes such as UIDSSMT and ARWSP. However, the existing provisions for supply are poor in terms of access, quality, and supply duration even with a concerted effort through above mentioned stimulus packages. Also the local bodies managing the water delivery systems are financially weak and mostly dependent on state and central grants for sustenance.
Thus the private sector as a source of financing can be explored to plug this gap. However, a multiplicity of risks around, for example, the allocation of property rights, pricing, cost recovery, demand management, supply provisions, and uncertainties around institutional frameworks may deter private participation.
3. Institutions in the Water Sector and Interface with Private Sector
Water institutions can be conceptualized as comprising three main components and their interactions, i.e., water law, water policy, and water administration (Saleth & Dinar, 2000). However, in developing countries where property rights are imperfectly defined and contractual enforcement is costly, involving the private sector has its own challenges (Kanazawa, 2006). Some studies are of the view that social stakes in water regulation and associated latent political pressures may be greater than in electricity regulation (Dubash, 2008).
The water sector in India is subject to evolving institutions with the linkages between water policies, legislations, and organizations maturing over time. After the National Water Policy 2002, only eight states have got state water policies in place. An independent regulatory authority has been implemented in Maharashtra only (MWRRA), and merely a handful of states have initiated actions for setting them up. The sector is characterized by a multitude of implementing agencies with overlapping responsibilities which are burdened with service provisions with scarce access to finances.

126 Sustainable Engagement in the Indian and Finnish Business
Law Policy Administration
Implications for private players
• A move towards independent regulation may increase trans-parency in pricing
• Governed by laws of local bodies with local focus
• Prevention of pollution and ground water depletion are issues that are important
• Individual state water policies being shaped up to provide direction
• National water policy 2002 mentions encouraging private participation
• Central schemes like JNNURM also encourage private sector involvement
• Administration is mostly through contacts and guide-lines of concerned organi-zations
• Recent bidding activities for treatment and supply conces-sions indicate private interest
• Administration of most in-volvements are at the local level
National Level • 73rd and 74th Constitutional Amendments
• Ground Water Regulation and Control of Development and Management Bill, 2005
• Water (Prevention and Control of Pollution) Act, 1974
• Water (Prevention and Control of Pollution) Cess Act, 1977
• Environment (Protection) Act, 1986
• The National Water Policy, 2002
• The National Urban Sanitation Policy, 2008
• The National Environment Policy, 2006
• The Policy Statement for Abatement of Pollution, 1992
• The National Conservation Strategy and Policy Statement on Environment and Develop-ment, 1992
• Ministry of Water Resources
• Ministry of Environment and Forests
State Level • State Acts/ Bills for indepen-dent regulatory commissions
• Water and wastewater re-forms bills
• State water policies • State water boards/ state government ministries and departments
Local Level • Acts of municipal/ local bodies
• Influenced by acts related to pollution control and envi-ronment
• To follow central and state policies and guidelines
• City water boards
• Municipal corporations and urban local bodies
• Public health departments
• Other agencies and Panchaya-ti Raj Institutions
Table 2. Water institutions and implications for private players.

127 Sustainable Engagement in the Indian and Finnish Business
4. Review of Private Interest and Intent in the Water Sector
4.1 Generally Followed Models of Private Participation in the Water Sector
Private sector involvement can take place through two contractual arrangements, concessions and affermage or lease contracts (Lobina & Hall, 2007), although in both cases the ownership is retained by the local body. In the former arrangement, the concessionaire assumes the operational responsibility of the asset and is also responsible for capital and operational expenses. In an affermage contract, the involved party is responsible only for operational expenses. A third option may be full or partial divestiture of ownership to private players.
Concessions:
a) BOT Class of Contracts: In this type of contract, the private operator is expected to finance, construct, operate, and maintain the facility for a specific time period and then transfer it to the owner. There are various variations of this class of contract like BOT (build, operate, transfer), BOO (build, own, operate), BOOT (build, own, operate, transfer), DBOOT (design, build, own, operate, transfer), ROT (rehabilitate, operate, transfer), BROT (build, rehabilitate, operate, transfer), RLT (rehabilitate, lease, transfer) etc.
Affermage:
b) Service contracts: Contracts to a private party for a specific service like billing, collection etc.
c) Management contracts: In this type of contract, the private party is appointed for managing the facility.
d) Operation and maintenance contract: Contracts in which a private operator is expected to operate and maintain the facility.
Divestitures/ Private Operation:
e) Partial and full divestiture: In this case, the partial or full ownership of the facility and the resource are transferred to the private operator. The private operator is expected to be responsible for the operation of the system under a regulatory purview. Examples of divestiture include the Rasmada scheme, under which a stretch of the Sheonath River in Chattisgarh was awarded to Radius Water Inc. for a period of 22 years.
f) Private operation: In this case, the facility is set up, owned and operated by a private player. A single example of this exists in India – the operation of the water utility in Jamshedpur by JUSCO.
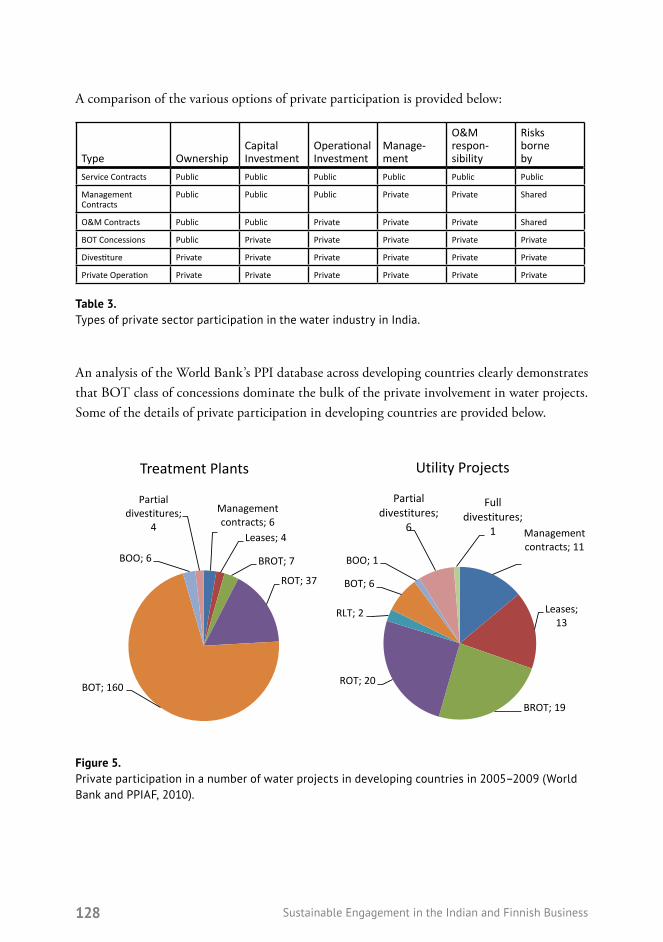
128 Sustainable Engagement in the Indian and Finnish Business
A comparison of the various options of private participation is provided below:
Type OwnershipCapital Investment
Operational Investment
Manage-ment
O&M respon- sibility
Risks borne by
Service Contracts Public Public Public Public Public Public
Management Contracts
Public Public Public Private Private Shared
O&M Contracts Public Public Private Private Private Shared
BOT Concessions Public Private Private Private Private Private
Divestiture Private Private Private Private Private Private
Private Operation Private Private Private Private Private Private
Table 3. Types of private sector participation in the water industry in India.
An analysis of the World Bank’s PPI database across developing countries clearly demonstrates that BOT class of concessions dominate the bulk of the private involvement in water projects. Some of the details of private participation in developing countries are provided below.
Figure 5. Private participation in a number of water projects in developing countries in 2005–2009 (World Bank and PPIAF, 2010).
4.2 Private Participation in the Water Sector in India
In spite of an evolving institutional landscape, the private sector has been taking keen interest in the water sector, with a few players participating through the public–private participation (PPP) route, i.e. joint participation of public and private organizations. Studies carried out in Hubli-Dharwad in north Karnataka have highlighted the fact there is a need to go beyond the privatization debate and instead focus on the specific functions that private parties can undertake (Sangameswaran, Madhav & D'Rozario, 2008). The water sector can be broadly classified into two segments from the supply perspective: treatment of water and distribution to consumers. Whereas the treatment segment has generated a lot of interest among private players, the distribution segment has been slow to take off due to risks around input quality, metering, billing and collection coupled with low tariffs.
India has a rich experience of private participation in the water sector. In India, private participation in water management started with the Chhattisgarh government’s efforts to attract private involvement for a stretch of the Sheonath River, which resulted in failure. Such arrangement excluded use of an earlier public resource which could not stand up to the pressure by water users. Some of the present private players in India in the water business are JUSCO, Doshion Veolia Water Solutions, Degremont, VA Tech Wabag, Subhash Projects, IVRCL,
Management contracts; 6
Leases; 4
BROT; 7
ROT; 37
BOT; 160
BOO; 6
Partial divestitures;
4
Treatment Plants
Management contracts; 11
Leases; 13
BROT; 19
ROT; 20
RLT; 2
BOT; 6
BOO; 1
Partial divestitures;
6
Full divestitures;
1
Utility Projects

129 Sustainable Engagement in the Indian and Finnish Business
4.2 Private Participation in the Water Sector in India
In spite of an evolving institutional landscape, the private sector has been taking keen interest in the water sector, with a few players participating through the public–private participation (PPP) route, i.e. joint participation of public and private organizations. Studies carried out in Hubli-Dharwad in north Karnataka have highlighted the fact there is a need to go beyond the privatization debate and instead focus on the specific functions that private parties can undertake (Sangameswaran, Madhav & D’Rozario, 2008). The water sector can be broadly classified into two segments from the supply perspective: treatment of water and distribution to consumers. Whereas the treatment segment has generated a lot of interest among private players, the distribution segment has been slow to take off due to risks around input quality, metering, billing and collection coupled with low tariffs.
India has a rich experience of private participation in the water sector. In India, private participation in water management started with the Chhattisgarh government’s efforts to attract private involvement for a stretch of the Sheonath River, which resulted in failure. Such arrangement excluded use of an earlier public resource which could not stand up to the pressure by water users. Some of the present private players in India in the water business are JUSCO, Doshion Veolia Water Solutions, Degremont, VA Tech Wabag, Subhash Projects, IVRCL, Jindal Water Infrastructure, Ion Exchange, Mahindra, L&T, and a host of others. There are also many efforts from both the government and corporate side to structure meaningful private public partnerships. Brief case studies of the various models of private participation are discussed below.
4.2.1 Service Contracts: Bangalore
Examples of service contracts include leakage reduction in Bangalore by Thames Water and L&T. The project was launched in 2003 and had an estimated investment of 690 million USD. The total project period was 3 years, the first 1.5 years for implementation and the rest for maintenance.
4.2.2 Management Contracts: Latur
The city of Latur, located in Maharashtra, had been facing a severe shortage of water. The water supply in the city was initially managed by a local body and had been characterized by issues around efficiency and collection. To improve the water supply situation in the city, the Maharashtra Jeevan Pradhikarna (MJP) undertook large capital investments in improving the supply infrastructure. To improve the management of the supply infrastructure, MJP had floated bids for private involvement based on licence fee architecture for a period of 5 years. This involved private firms bidding to get a permission for involvement in the project with a well-defined scope. The bid was won by a consortium of Subhash Projects, UPL-EEL and Hydro Comp Enterprises, who had structured a SPV “Latur Water Management Company Limited” (LWMCL). The scope

130 Sustainable Engagement in the Indian and Finnish Business
of the contract involved metering, billing and collection activities, increasing supply coverage and reducing unauthorized leakages. The standards of performance and tariff were set by MJP and LWMCL was expected to collect and retain the revenues. In return, LWMCL had to pay MJP a fixed licence fee for conducting business in the licensed area.
4.2.3 O&M Contracts: Madurai
Madurai Municipal Corporation has awarded an O&M contract to Subhash Projects and Marketing Limited for a 24 x 7 water supply system to three wards in Madurai, Tamil Nadu. The project would also entail investment planning and project supervision by the private player.
4.2.4 BOT Concessions: Salt Lake
Sector-V of Salt Lake, considered to be the IT & ITeS hub of West Bengal, had no organized water supply and sewerage systems in the township. The industrial units in Sector-V depended on ground water based water supply and on-site sanitation at their own costs. The Government of West Bengal wished to end the indiscriminate extraction of underground water to prevent environmental hazards and a combined water supply-cum-sewerage project for the entire township through BOT was invited by the state government. The implementation and management of the project was to be handed over to a competitively selected private sector entity for a period of 30 years initially and renewable for another 30 years. The details of the contracting process are provided below:
Bidding process followed for JUSCO
a) Fixation of eligibility criteria for the applicant bidders in terms of past experience in the related field, net worth, annual turnover etc.
b) Invitation of bids from prospective private sector entities (developers/BOT operators) through insertion in leading national dailies and KMDA website
c) Technical evaluation and marking of bids by a team of independent experts, including experts from outside KMDA
d) Setting the cut-off mark (60 on a scale of 1–100) that a bidder has to obtain on technical bid evaluation to be considered as technically qualified
e) Evaluation of financial parameters (lowest water-cum-sewerage charges per KL) for selection of one from amongst the technically qualified bidder.

131 Sustainable Engagement in the Indian and Finnish Business
The concession agreement was awarded to SPV of JUSCO (74%) and Voltas (26%) for a period of 30 years. The key contractual points are provided below:
4.2.5 Divestiture: Sheonath River in Chattisgarh
The Sheonath River is a tributary of Mahanadi and flows through the state of Chattisgarh. The project was conceived to supply water to the newly developed industrial hub at Borai located in Durg District. Chhattisgarh State Industrial Development Corporation (CSIDC) had been promoting the development of Borai industrial estate. In 2001, the state awarded a BOOT concession to Radius Water (a part of Kailash Engineering, a local company) for construction of a dam across the Sheonath River. The concession included the rights to a stretch of 23.6 km of the water reservoir for supplying water to the industrial estate as well as maintenance of an effluent treatment plant. The total concession period was 22 years.
Part of the demand risk was covered by CSIDC who had signed a take or pay contract with Radius Water for 4 MLD. The total project cost was estimated at 130 million UD dollars for 30 million litres per day (MLD). The project costs and maintenance were on the responsibility of Radius Water but it was decided that Rs. 6.5 crores would be provided to the private form as loan and the rest would be in the form of equity (Das & Pangare, 2006).
The project faced widespread public opposition due to various issues. Firstly, the project impinged upon the fishing rights of local fishermen and the local farmers were not allowed to lift water from that stretch of the river. Secondly, sand mining activities also suffered, villages were affected and there were reports of groundwater depletion. In 2003, a decision to scrap the project was taken.
a) Fixation of eligibility criteria for the applicant bidders in terms of past experience in the related field, net worth, annual turnover etc.
b) Invitation of bids from prospective private sector entities (developers/BOT operators) through insertion in leading national dailies and KMDA website
c) Technical evaluation and marking of bids by a team of independent experts, including experts from outside KMDA
d) Setting the cut-off mark (60 on a scale of 1–100) that a bidder has to obtain on technical bid evaluation to be considered as technically qualified
e) Evaluation of financial parameters (lowest water-cum-sewerage charges per KL) for selection of one from amongst the technically qualified bidder.
The concession agreement was awarded to SPV of JUSCO (74%) and Voltas (26%) for a period of 30 years. The key contractual points are provided below:
4.2.5 Divestiture: Sheonath River in Chattisgarh The Sheonath River is a tributary of Mahanadi and flows through the state of Chattisgarh. The project was conceived to supply water to the newly developed industrial hub at Borai located in Durg District. Chhattisgarh State Industrial Development Corporation (CSIDC) had been promoting the development of Borai industrial estate. In 2001, the state awarded a BOOT concession to Radius Water (a part of Kailash Engineering, a local company) for construction of a dam across the Sheonath River. The concession included the rights to a stretch of 23.6 km of the water reservoir for supplying water to the industrial estate as well as maintenance of an effluent treatment plant. The total concession period was 22 years.
Part of the demand risk was covered by CSIDC who had signed a take or pay contract with Radius Water for 4 MLD. The total project cost was estimated at 130 million UD dollars for 30 million litres per day (MLD). The project costs and maintenance were on the responsibility of Radius Water but it was decided that Rs. 6.5 crores would be provided to the private form as loan and the rest would be in the form of equity (Das & Pangare, 2006).
The project faced widespread public opposition due to various issues. Firstly, the project impinged upon the fishing rights of local fishermen and the local farmers were not allowed to
Concession Authority (NITA)
• Land - free of cost by KMDA
• Water - Rs. 5/ KL from KMC
• Capital grant of 35% from JNNURM
• Groundwater extraction not allowed
Concessionaire (JUSCO-Voltas)
• Infrastructure Capex (Rs. 63 Crores)
• Tariff of Rs. 25/KL from consumers
• Connection charges of Rs. 10/ sq. ft.
• Other usage charges
Consumers
• Industrial, Commercial & Institutional consumers in sector V of Salt Lake City, Kolkata

132 Sustainable Engagement in the Indian and Finnish Business
4.2.6 Private Operation: JUSCO in Jamshedpur
JUSCO has been managing the municipal services in Jamshedpur for long as a part of Tata Steel. It was only in March 2004 that JUSCO was spun off as an independent subsidiary. The company runs two treatment plants in the city of Jamshedpur, supplies water and power, and collects garbage and waste. The expertise of managing the water supply system of the city of Jamshedpur is behind leveraged to expand business in other cities.
4.3 Entry Strategies Used by Private Players in India
The above cases have amply demonstrated the private sector involvement in the water sector in various forms. As there is enough private interest around this sector, this section explores some of the entry strategies used by private players. Some of the common strategies followed by private players to enter this sector are provided below:
a) Acquisition: A popular and fast way to enter the water market but strategic fit and price needs to be examined.
b) Joint venture: A definitive arrangement to access missing competencies.
c) Strategic alliance: Less durable – may not last the learning curve for competency transfer.
d) Investment play: Limited to investment in the project
e) Internal start-up: Almost all water projects require past credentials.

133 Sustainable Engagement in the Indian and Finnish Business
The table below provides names of water companies and their entry modes.
Company Name Company Type Focus areas Route of entry Alliances
JUSCO Ltd. Utility and services Power, water utility and services
Legacy issues, demerger from Tata Steel
Consulting alliance with Veolia for treatment
IVRCL Ltd. Civil construction & turnkey projects
Water, power transmis-sion, transportation & building infrastructure
Cadagua (for advanced water solutions) and Befesa (for desalina-tion)
Degremont Equipment and construction
Water treatment In India since 1954, Indian subsidiary in 1986 though joint venture (JV)
Joint venture with Anand Automotive Ltd.
Ion Exchange Equipment, construc-tion and chemicals
Water treatment and ion exchange resins
In 1964 as a subsidiary of Permutit UK
Licensing agreements with BMS, ELF Antar, Eutech & Nordic water for plants & filters
Doshion Veolia Water Solutions
Equipment and construction
Water and waste water management
Joint Venture (JV) JV between Doshion (construction/ fabrica-tion) and Veolia (treat-ment technology)
Mahindra Water Utilities
Construction Treatment, supply, network management of water, miscellaneous engineering
Joint Venture (JV) JV between Mahindra Infra (construction) and Utilities interna-tional, UK (technology)
L&T – Water Division
Engineering and construction
Treatment and supply
Ramky Infra- structure
Engineering and construction
Water treatment & supply, building, transportation
Engineering, procure-ment, and construction (EPC) in water projects
SPML water infra limited
Engineering and construction – presently PPP also
Water supply, solid waste, hydro power, transport and industrial infrastructure
Engineering, procure-ment, and construction (EPC) and public– private partnership (PPP) in water projects
Pratibha Engineering and construction
Water supply and other urban infrastructure
In 1994 through JV for fabrication
JV with Coromandal Prescrete for fabri-cation
Unity Infra Engineering and construction
Engineering, procure-ment, and construction (EPC) for water projects
Joint Venture (JV) JV with various developers
VA Tech Wabag Equipment and construction
Water treatment incl. desalination
In 1996 through bidding, acquisition in 2007
Acquisition of Wabag Austria in 2007, 25% IPO
Jindal Water Infra-structure Limited
Infrastructure company EPC/ Build–operate– transfer (BOT) for water projects
Table 4. Water companies in India and their entry modes.

134 Sustainable Engagement in the Indian and Finnish Business
5. Issues Faced by Private Players
Some of the issues that may be faced by private players are outlined as follows:
a) Contracts are not standardized: There have been evidence of increasing private involvement in the water sector. However, while other sectors, such as electricity, roads, and ports, have fairly standardized model agreements and other contractual documents, concession agreements in the water sector are considered on a case by case basis and vary widely in scope.
b) Unclear pricing rules: The water sector generally suffers from low tariffs which do not fully recover the cost of supply, although JNNURM recommends the recovery of full cost of supply. The public characteristics of water coupled with unclear tariff setting rules by local bodies may provide uncertain price signals to the private operator to act on. Also tariff revision and its frequency are somewhat sensitive issues with unclear guidelines. Though some states, such as Maharashtra, have set up an independent regulatory authority, similar instances are not present in other parts of the country.
c) Poor system data: In many local bodies, service fees for water are not clearly defined and in part clubbed with property taxes. Also the absence of large-scale metering makes it impossible to capture data on unaccounted-for water even though some sample surveys exist. Unaccounted-for water varies from 13% to 60% across major cities in India (ADB, 2007). For private sector to participate actively, it is imperative that baseline data can be ascertained accurately. Also tariff fixation is dependent on the quality of data and accounting rules followed for fixing the cost of supply.
d) Poorly defined rights: The property rights for water are poorly defined. Though the provision of water is a state subject, after the implementation of the 74th Constitutional Amendment, the responsibility lies with respective local bodies. Allocation of water rights does not follow a formalized process except in cases where specific projects have been identified and structured. In these cases, usually a process of open competitive bidding is followed.
e) Institutional bottlenecks: The institutional landscape around the water sector is quite fragmented with each state having its own institutional variations, state water policies having differing priorities, and local bodies having their own acts. Some efforts of standardization at the local level were carried out with the initiation of the model municipal law in 2003. There are a number of implementation organizations with overlapping responsibilities.
135 Sustainable Engagement in the Indian and Finnish Business
f) Investment: The local bodies managing water delivery systems are dependent mainly on tax and non-tax revenues supplemented by grants. Thus most local bodies are yet to get full financial autonomy and depend on the state and centre for capital investments. Whereas the investment needs are best understood at the local level, financing for the same is driven externally. Different state finance commissions have different expenditure criteria.
g) Standards of performance: There are no well-defined standards of performance unlike in some other sectors like electricity where regulatory commissions publish expected standards of performance to be adhered to by the service providers. The average water availability in major urban centres is 4.3 hours per day according to a study conducted by ADB (ADB, 2007).
6. Conclusions and Recommendations
There is a lot of private interest around the water sector but the interest is not getting connected to the infrastructure needs. The following policy recommendations may be of help:
a) Designing model contracting documents: It may be useful to design a model concession contract and bidding documents on the lines of other infrastructure sectors, such as electricity, roads, and ports, so that the project risks are shared fairly between the private operator and the project initiator.
b) Providing certainty around pricing principles: There is a need to reduce uncertainties around tariff fixation principles to encourage private operators. Independent regulatory commissions should be set up in all states and empower them to set up principles for tariff fixation. Similar arrangements have been carried out in the electricity sector to reduce regulatory uncertainties.
c) Creating baseline data and accounting systems: To create and maintain sufficient data about water supply delivery, it is essential to meter connections to enable the assessment of the level of unaccounted-for water, which is till now based on sample surveys and estimates.
d) Defining property rights and its allocation: Defining the property rights of water resources and its allocation may be another useful initiative in encouraging private players.
e) Understanding institutional interplays: Local organizations need to follow a standardized and well-studied approach for tapping private participation. A structured approach in conduct, systems, and processes for private participation in the water sector is required.

136 Sustainable Engagement in the Indian and Finnish Business
f) Framing investment guidelines: Investment norms for improving water related infrastructure may be required as such guidelines do not exist. Such guidelines may make local investment plans stand up to scrutiny and far more acceptable. This may lead to system improvement and make it attractive for private sectors to invest.
g) Defining standards of performance: Standards of performance also vary across local bodies and a standardized set of performance parameters may better set the expectations of private operators.
Although the above recommendations may not be comprehensive, it needs to be understood that opportunities for the private needs to be clearly defined with equitable sharing of risks to get more private participation in this sector.
References
2030 Water Resources Group. Charting Our Water Future.
ADB (2007). 2007 Benchmarking and Data Book of Water Utilities in India.
Bhaduri, A. & Kejriwal, A. (2005, December 31). Urban Water Supply: Reforming the Reformers. Economic and Political Weekly.
Choi, J.-H., Chung, J. & Lee, D.-J. (2010). Risk Perception Analysis: Participation in China’s water PPP market. International Journal of Project Management, 28, 580–592.
CPCB (2009). Status of Water Supply, Wastewater Generation and Treatment in Class-I Cities & Class-II Towns of India. New Delhi: Central Pollution Control Board, MoEF, GoI.
Das, B. & Pangare, G. (2006, February 18). In Chhattisgarh, a River Becomes Private Property. Economic and Political Weekly.
Datamonitor (2008). Water Utilities in India: Industry Profile.
Dubash, N. K. (2008, October 4). Independent Regulatory Agencies: A Theoretical Review with Reference to Electricity and Water in India. Economic & Political Weekly.
Gassner, K., Popov, A. & Pushak, N. (2009). Does Private Sector Participation Improve Performance in Electricity and Water Distribution? World Bank and PPIAF.
Gazmuri, R. & Rosegrant, M. (1994). Chilean Water Policy: the Role of Water Rights, Institutions, and Markets. Washington DC: International Food Policy Research Institute.
Grail Research (2009). Water – the India Story.

137 Sustainable Engagement in the Indian and Finnish Business
GWI (2010). The New Crowd at Private Water’s Top Table. Global Water Intelligence, 11 (11).
Hukka, J. J., & Vinnari, E. M. (2007). Public–public Partnerships in the Finnish Water Services Sector. Utilities Policy, 15.
Iyer, R. R. (2001, March 31). Water: Charting a Course for the Future – I. Economic and Political Weekly.
Kanazawa, M. (2006). Investment in Private Water Development: Property Rights and Contractual Opportunism during the California Gold Rush. Explorations in Economic History, 43.
Lobina, E. & Hall, D. (2007). Experience with private sector participation in Grenoble, France and lessons on strengthening public water operations. Utilities Policy, 15.
MoWR (1995). Report of the High Level Committee on Private Sector Participation in Irrigation and Multi-purpose Projects. New Delhi: Ministry of Water Resources.Planning Commission (2008). Projections in the Eleventh Five Year Plan: Investment in Infrastructure. The Secretariat for the Committee on Infrastructure. New Delhi: Planning Commission, GoI.
Saleth, M. & Dinar, A. (2000). Institutional Changes in Global Water Sector: Trends, Patterns and Implications. Water Policy, 2.
Saleth, R. M. (1999). Irrigation Privatization in India: Options, Issues, and Experience. Economic and Political Weekly, 34.
Sangameswaran, P., Madhav, R. & D’Rozario, C. (2008, April 5). 24/7, ‘Privatisation’ and Water Reform: Insights from Hubli-Dharwad. Economic & Political Weekly.
The Economist (2010, May 22). For Want of a Drink: A Special Report on Water. The Economist.
World Bank and PPIAF (2010). PPI Project Database.
![[Report] Indian Marketers are Ready to Adopt and Integrate Digital Marketing in their Businesses](https://img.pdfslide.net/doc/110x75/554ba165b4c905b3618b4a9f/report-indian-marketers-are-ready-to-adopt-and-integrate-digital-marketing-in-their-businesses.jpg)