Embed Size (px)
Citation preview

Chemical Logistics Cooperation in Central and Eastern Europe
SWOT‐Analysis
Austria
Weaknesses
Strengths
Opportunities
Threats
SWOT‐Analysis Project [ChemLog]
Project Partner: AUSTRIA Page 2/47
TABLE OF CONTENT 1 STRUCTURE ........................................................................................................................................................................... 4
2 INTRODUCTION TO REGION / COUNTRY ........................................................................................................................................ 5
2.1 CHEMICAL SALES .......................................................................................................................................................... 8 2.2 COMPANY STRUCTURE – SIZE OF ENTERPRISES AND EMPLOYEES .............................................................................................. 9 2.3 INTERNATIONAL TRADE ................................................................................................................................................ 10 2.4 REGIONAL STRUCTURE OF CHEMICAL INDUSTRY ................................................................................................................. 11
3 DESCRIPTION OF TRANSPORT INFRASTRUCTURE ........................................................................................................................... 13
3.1 INTRODUCTION .......................................................................................................................................................... 13 3.2 INTERMODAL TRANSPORT ............................................................................................................................................. 14
3.2.1 ACTUAL AND PLANNED FIGURES ............................................................................................................................ 15 3.2.2 MAIN CORRIDORS AND MAJOR INFRASTRUCTURE ...................................................................................................... 16 3.2.3 GOVERNMENT PLANS AND POLITICAL PROGRAMS ...................................................................................................... 16
3.3 ROAD TRANSPORT ...................................................................................................................................................... 17 3.3.1 ACTUAL AND PLANNED FIGURES (STATUS: 2005/2007) ............................................................................................ 17 3.3.2 MAIN CORRIDORS AND MAJOR INFRASTRUCTURE ...................................................................................................... 18 3.3.3 GOVERNMENT PLANS AND POLITICAL PROGRAMS ...................................................................................................... 19
3.4 RAILWAY TRANSPORT .................................................................................................................................................. 19 3.4.1 ACTUAL AND PLANNED FIGURES ............................................................................................................................ 20 3.4.2 MAIN CORRIDORS AND MAJOR INFRASTRUCTURE ...................................................................................................... 20 3.4.3 GOVERNMENT PLANS AND POLITICAL PROGRAMS ...................................................................................................... 21
3.5 WATERWAY TRANSPORT .............................................................................................................................................. 21 3.5.1 ACTUAL AND PLANNED FIGURES ............................................................................................................................ 22 3.5.2 MAIN CORRIDORS AND MAJOR INFRASTRUCTURE ...................................................................................................... 22 3.5.3 GOVERNMENT PLANS AND POLITICAL PROGRAMS ...................................................................................................... 23
3.6 PIPELINE TRANSPORT .................................................................................................................................................. 24 3.6.1 ACTUAL AND PLANNED FIGURES ............................................................................................................................ 24 3.6.2 MAIN CORRIDORS AND MAJOR INFRASTRUCTURE ...................................................................................................... 24
4 DESCRIPTION OF CHEMICAL LOGISTICS IN THE REGION / COUNTRY ................................................................................................... 25
5 INTERNAL STRENGTHS AND WEAKNESSES OF CHEMICAL COMPANIES AND LOGISTIC PROVIDERS .............................................................. 26
5.1 STRENGTHS IN PROCUREMENT ....................................................................................................................................... 26 5.2 STRENGTHS IN WAREHOUSING OF RAW MATERIALS, SEMI‐FINISHED AND FINISHED PRODUCTS ....................................................... 26 5.3 STRENGTHS IN PRODUCTION LOGISTICS ............................................................................................................................ 26 5.4 STRENGTHS IN DISTRIBUTION AND TRANSPORT ................................................................................................................... 27 5.5 STRENGTHS IN PLANNING AND CONTROLLING .................................................................................................................... 28 5.6 STRENGTHS IN ORDER PROCESSING ................................................................................................................................. 28 5.7 STRENGTHS IN INFORMATION LOGISTICS ........................................................................................................................... 28
SWOT‐Analysis Project [ChemLog]
Project Partner: AUSTRIA Page 3/47
6 EXTERNAL OPPORTUNITIES, CHANCES AND RISKS FOR CHEMICAL LOGISTICS IN CENTRAL AND EASTERN EUROPE .......................................... 29
6.1 ECONOMIC TRENDS ..................................................................................................................................................... 29 6.2 SOCIOCULTURAL TRENDS .............................................................................................................................................. 31 6.3 TECHNOLOGICAL TRENDS .............................................................................................................................................. 32 6.4 ENVIRONMENT AND ENERGY ......................................................................................................................................... 32 6.5 POLITICS AND INNOVATION ........................................................................................................................................... 33 6.6 TRANSPORT INFRASTRUCTURE ....................................................................................................................................... 35
6.6.1 RAILWAY ........................................................................................................................................................ 35 6.6.2 WATERWAY ..................................................................................................................................................... 36 6.6.3 ROAD ............................................................................................................................................................. 37 6.6.4 INTERMODAL ................................................................................................................................................... 37 6.6.5 PIPELINE ......................................................................................................................................................... 37
6.7 SAFETY AND SECURITY ................................................................................................................................................. 38 6.8 INDUSTRY SECTOR AND COMPETITION .............................................................................................................................. 38
6.8.1 CUSTOMERS .................................................................................................................................................... 38 6.8.2 SUPPLIERS ....................................................................................................................................................... 39 6.8.3 ACCESS TO THE MARKET ..................................................................................................................................... 39
7 NEEDS FOR FUTURE ACTION AND IMPROVEMENTS ‐ CONCLUSION ................................................................................................... 41
7.1 NEED FOR FUTURE ACTIONS AND IMPROVEMENTS – FROM THE LOGISTICAL POINT OF VIEW .......................................................... 41 7.2 NEED FOR FUTURE ACTIONS AND IMPROVEMENTS – IN TERMS OF POLITICS, TRANSPORTATION AND INFRASTRUCTURE ......................... 45 7.3 NEED FOR FUTURE ACTIONS AND IMPROVEMENTS – FROM THE ECOLOGICAL POINT OF VIEW ......................................................... 46
8 LITERATURE ....................................................................................................................................................................... 47
8.1 STUDIES AND STATISTICS USED ....................................................................................................................................... 47 8.2 LIST OF EXPERTS ......................................................................................................................................................... 48

SWOT‐Analysis Project [ChemLog]
Project Partner: AUSTRIA Page 4/47
1 STRUCTURE
Introduction to Region / Country
Description of Chemical Industry
Description of transport infrastructure
Description of chemical logistics in the region /country
Internal Strengths of Chemical Companies and Logistic Providers
Internal Weaknesses of Chemical Companies and Logistic Providers
External opportunities and chances for chemical logistics in Central and Eastern Europe
External Threats,
Problems and Barriers for chemical logistics in Central and Eastern Europe
Needs for future actions and improvements ‐ Conclusions
Literature
SWOT‐Analysis Project [ChemLog]
Project Partner: AUSTRIA Page 5/47
2 INTRODUCTION TO REGION / COUNTRY
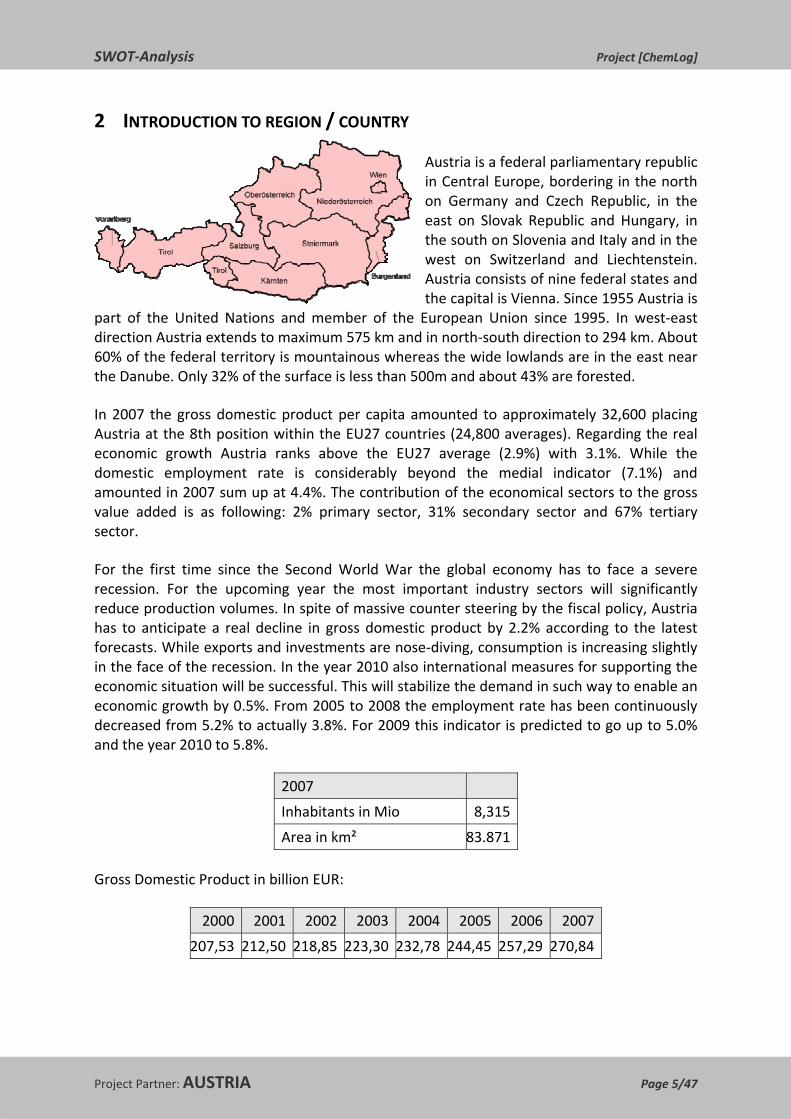
Austria is a federal parliamentary republic in Central Europe, bordering in the north on Germany and Czech Republic, in the east on Slovak Republic and Hungary, in the south on Slovenia and Italy and in the west on Switzerland and Liechtenstein. Austria consists of nine federal states and the capital is Vienna. Since 1955 Austria is
part of the United Nations and member of the European Union since 1995. In west‐east direction Austria extends to maximum 575 km and in north‐south direction to 294 km. About 60% of the federal territory is mountainous whereas the wide lowlands are in the east near the Danube. Only 32% of the surface is less than 500m and about 43% are forested.
In 2007 the gross domestic product per capita amounted to approximately 32,600 placing Austria at the 8th position within the EU27 countries (24,800 averages). Regarding the real economic growth Austria ranks above the EU27 average (2.9%) with 3.1%. While the domestic employment rate is considerably beyond the medial indicator (7.1%) and amounted in 2007 sum up at 4.4%. The contribution of the economical sectors to the gross value added is as following: 2% primary sector, 31% secondary sector and 67% tertiary sector.
For the first time since the Second World War the global economy has to face a severe recession. For the upcoming year the most important industry sectors will significantly reduce production volumes. In spite of massive counter steering by the fiscal policy, Austria has to anticipate a real decline in gross domestic product by 2.2% according to the latest forecasts. While exports and investments are nose‐diving, consumption is increasing slightly in the face of the recession. In the year 2010 also international measures for supporting the economic situation will be successful. This will stabilize the demand in such way to enable an economic growth by 0.5%. From 2005 to 2008 the employment rate has been continuously decreased from 5.2% to actually 3.8%. For 2009 this indicator is predicted to go up to 5.0% and the year 2010 to 5.8%.
Gross Domestic Product in billion EUR:
2000 2001 2002 2003 2004 2005 2006 2007
207,53 212,50 218,85 223,30 232,78 244,45 257,29 270,84
2007
Inhabitants in Mio 8,315
Area in km² 83.871

SWOT‐Analysis Project [ChemLog]
Project Partner: AUSTRIA Page 6/47
Gross Domestic Product / capita:
2000 2001 2002 2003 2004 2005 2006 2007
5.900 26.420 27.070 27.510 28.480 29.690 31.070 32.570 Source: Statistik Austria, www.statistik.at, 2009‐04‐13.
The chemical industry has some unique characteristics: it is a globalized industry sector, highly innovation‐driven and knowledge‐intensive. The companies of the chemical industry are integrated along the value chain into its downstream industries or directly to consumers. Chemical production and process technologies are capital and energy intensive. A long product development time requires stable and predictable policy framework. Due to the high degree of globalization, competition takes place at global level.
Worldwide the chemical industry ranks among the most important industry sectors and especially represents a key success factor for the Austrian economy. 10.3% of the domestic working population is employed in this heterogeneous industry sector, contributing 10.6% of the domestic production value and more than 12% to the gross domestic product of the Austrian industry. Products of the chemical industry can be found nearly in every product or area of life. Upstream sectors are mainly trading companies of fuel, ore, metals and technical chemicals as well as the transport sector as a whole and especially pipelines which are essential for the service provision of the chemical industry. Furthermore the chemical industry sources company‐related services like legal and tax advice, advertisement or provision of leasing staff.
The chemical industry contributes considerably to the production and the value creation of downstream sectors as wells for instance energy, gas and water supply, machines and metal ware industry, electric and electronic sector and paper industry. According to the latest numbers the chemical industry is one of the biggest employing industry group in Austria as more than 10% of all industrial staff or more than 43.000 people are employed in 295 chemical companies as well as about 80.000 workplaces are indirect and secondary employment effects. Impressed by a heterogeneous structure, the chemical industry is impressed by small and medium‐sized companies with about 145 employees at an average and with an SME‐intensity of approximately 85%. The personnel expenses in Austria for staff within the chemical industry amount to 2.23 billion Euros in total and nearly 51,000 Euro per year per employed person.1
1 Bnv cp. FCIO (Jahresbericht 2008) und www.fcio.at, 2009‐04‐13.

SWOT‐Analysis Project [ChemLog]
Project Partner: AUSTRIA Page 7/47
Production of Chemical Industry 1998-2008
0
2000
4000
6000
8000
10000
12000
14000
16000
1998 1999 2000 2001 2002 2003 2004 2005 2006 2007 2008
Mio
€
Source: FCIO – Fachverband der Chemischen Industrie Österreichs, April 2009.
It can be mentioned that the year 2008 was the end of a long lasting economic boom which has already been noticed at mid‐year within the chemical industry. As supplier for several industry sectors which were affected by the economic crises, the chemical industry was hardly hit by the global regression. In the first term of 2008 the chemical sales were higher than in the year before, so from summer on companies remarked a sharp decline in orders by 11%. Especially exports lag behind expectations as for a long time export growth was lower than the domestic sales. The domestic market has proved to be a stabilizing factor, although a high degree of satiation can be determined. Companies are afraid of further weaknesses in demand, stagnating domestic sales, declining degree of capacity utilization, reduced working hours and significant losing in sales. The employment situation reflects the state of the economy. Latest figures show that in July 2008 44.167 people still were employed in the chemical industry, whereas at the end of the year this number amounted only to 43.000.
In order to guarantee a sustainable development of the Austrian business location, massive investments for education are vital. The chemical industry demands a broader base for innovation and research as well as an intensive integration of chemical topics into educational institutions. A higher number of university graduates and researchers mean a better chance for Austria to survive as a sustainable business location in terms of innovation, specialization and qualification.
Forecasts for the year 2009 augur badly: volume of orders and capacity utilization will reach a low, whereas finished goods inventory are predicted to increase significantly. The dominating tasks for the upcoming year will be rationalization and adjustment of capacities. Furthermore investments will go back considerably, as in 2007 and 2008 they amounted beyond 1 billion Euros and are expected to lag clearly behind this range in 2009. In total investments will be reduced by approximately 13%.

SWOT‐Analysis Project [ChemLog]
Project Partner: AUSTRIA Page 8/47
Plastic and rubber products: The first three quarter of the year 2008 brought an increase in sales by 5% as well as exports which augmented by 7.5%. The labour market showed positive developments too as number of employees enlarged by 2.4% until half of the year 2008. Due to extremely high energy costs and the raise in labour costs, the plastic and rubber industry faced massive cost pressure and additionally was hit by the economic regression during the last quarter. Especially for suppliers of the automotive industry the decline in orders is difficult to bear.
Fibres: After a worldwide economical boom in the first quarter 2008, the fibres sector had a remarkable drop in the second quarter as the cotton prices – an important indicator for the price development of fibres – declined massively. Extremely high raw material costs could not be moved to the customer and had high influence on profit. For the future latest figures show that prospectively the fibres boom is over and lower growth and margins are expected.
Paints, varnishes and similar coatings, printing inks and mastics: whereas the growth in sales of about 6% in the first half‐year of 2008 lead to optimisms, the forecast for 2009 are depressing and show the same picture as in other sectors of the chemical industry.
Pesticides and fertilizer: actually the European Union plans to implement a new regulation concerning pesticides with massive impacts on the Austrian agriculture sector. Some substances with acceptable risks for consumer and environment should be banned completely although a harmonized, transparent and standardized system for evaluation of substances is still missing.
Detergents, perfumes and toilet preparations: the domestic market for soap, detergents, perfumes and toilet preparations is saturated, the costs for raw materials and energy are reaching a peak and the cost pressure is increasing. Innovative developments of the product portfolio and a broader spectrum of services for consumer sector as well as for industry enable a positive estimation. Exports were satisfying although yearly growth rates are decreasing.
Technical gases: Nearly the whole year 2008 was successful in terms of economical growth. Only at the end of the year 2008 the difficult economical circumstances lead to a reduction at gas sales. Due to high fuel costs the expenses for manufacturing and transportation went up significantly, so that they could not be compensated totally by optimization measures.2
2.1 CHEMICAL SALES Sales of chemical industry in Mio EUR: 2000 2001 2002 2003 2004 2005 2006 2007
Manufacture of basic chemicals* 2.766 2.768 2.688 2.683 2.859 2.940 3.428 an
Manufacture of pesticides and other agro‐chemical products
45 69 9 an 118 127 141 n/a
Manufacture of paints, varnishes and similar coatings, printing ink and mastics
556 582 593 599 635 625 651 n/a
Manufacture of pharmaceuticals, medicinal chemicals and botanical products**
2.901 2.394 2.407 2.624 2.510 2.694 2.798 n/a
Manufacture of soap and detergents, cleaning 462 528 532 577 572 609 672 n/a
2 Bnv cp. FCIO (Jahresbericht 2008), Schneider Schneider/Brunner/Lengauer/Koller [Chemische Industrie 2008].
SWOT‐Analysis Project [ChemLog]
Project Partner: AUSTRIA Page 9/47
and polishing preparations, perfumes and toilet preparations
Manufacture of other chemical products*** 453 454 473 445 472 526 674 n/a
Manufacture of man‐made fibres 581 601 642 an 658 688 739 n/a
Manufacture of chemicals and chemical products
7.764 7.396 7.394 7.626 7.824 8.209 9.103 n/a
Manufacture of rubber products**** 764 799 839 849 857 910 988 n/a
Manufacture of plastic products***** 3.627 3.817 3.911 3.625 3.905 3.921 4.487 n/a
Manufacture of plastic and rubber products 4.391 4.616 4.750 4.474 4.762 4.831 5.475 n/a
Share of chemical sales in processing industry
2000 2001 2002 2003 2004 2005 2006 2007
Manufacture of chemicals and chemical products
31% 29% 34,2% 30,6% 30% 28% 28% n/a
Manufacture of plastic and rubber product 18% 18% 22% 18% 18% 16% 17% n/a
Source: Statistik Austria [Leistungs‐ und Strukturstatistik 2000‐2006].
Explanations: The Processing Industry consists of the paper manufacturing, manufacturing of chemicals and chemical products, manufacturing of metals and of the manufacture of plastic and rubber product (usually not part of the processing industry): 32.411 Mio EUR sales in total
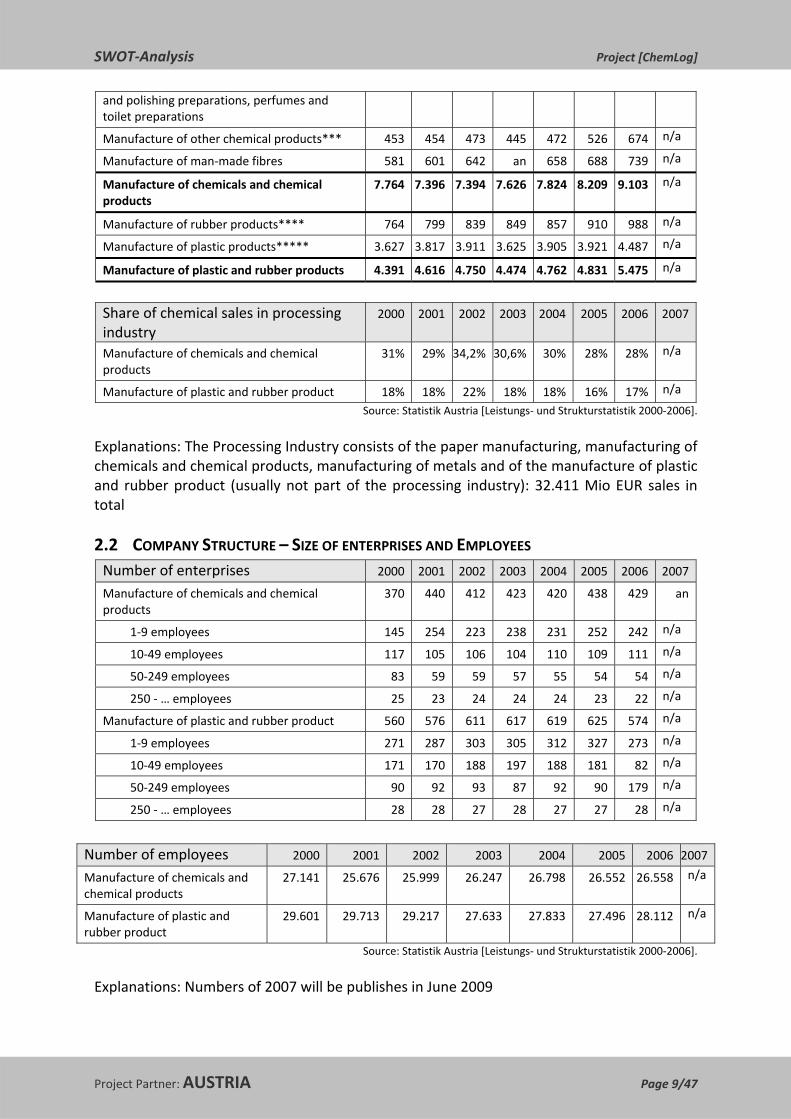
2.2 COMPANY STRUCTURE – SIZE OF ENTERPRISES AND EMPLOYEES Number of enterprises 2000 2001 2002 2003 2004 2005 2006 2007
Manufacture of chemicals and chemical products
370 440 412 423 420 438 429 an
1‐9 employees 145 254 223 238 231 252 242 n/a
10‐49 employees 117 105 106 104 110 109 111 n/a
50‐249 employees 83 59 59 57 55 54 54 n/a
250 ‐ … employees 25 23 24 24 24 23 22 n/a
Manufacture of plastic and rubber product 560 576 611 617 619 625 574 n/a
1‐9 employees 271 287 303 305 312 327 273 n/a
10‐49 employees 171 170 188 197 188 181 82 n/a
50‐249 employees 90 92 93 87 92 90 179 n/a
250 ‐ … employees 28 28 27 28 27 27 28 n/a
Number of employees 2000 2001 2002 2003 2004 2005 2006 2007
Manufacture of chemicals and chemical products
27.141 25.676 25.999 26.247 26.798 26.552 26.558 n/a
Manufacture of plastic and rubber product
29.601 29.713 29.217 27.633 27.833 27.496 28.112 n/a
Source: Statistik Austria [Leistungs‐ und Strukturstatistik 2000‐2006].
Explanations: Numbers of 2007 will be publishes in June 2009

SWOT‐Analysis Project [ChemLog]
Project Partner: AUSTRIA Page 10/47
2.3 INTERNATIONAL TRADE Export quota in % 2.000 2.001 2.002 2.003 2.004 2.005 2.006 2.007
Manufacture of chemicals and chemical products
34% 36% 37% 37% 37% 39% 42% 42%
Manufacture of plastic and rubber products
6% 6% 6% 6% 6% 6% 5% 5%
Relation between exports and the gross domestic product.
Import of chemicals in Mio EUR (Einfuhr)
2.000 2.001 2.002 2.003 2.004 2.005 2.006 2.007
Manufacture of basic chemicals* 21.487 22.336 20.782 21.935 24.979 29.716 33.518 37.059
Manufacture of pesticides and other agro‐chemical products
725 822 724 749 886 882 932 0
Manufacture of paints, varnishes and similar coatings, printing ink and mastics
2.652 2.855 2.671 3.150 3.201 3.524 3.710 3.922
Manufacture of pharmaceuticals, medicinal chemicals and botanical products**
22.249 27.416 32.325 31.864 30.897 34.412 39.596 42.112
Manufacture of soap and detergents, cleaning and polishing preparations, perfumes and toilet preparations
6.548 6.653 7.398 7.827 7.855 8.388 8.592 8.780
Manufacture of other chemical products***
15.116 15.359 15.973 16.622 18.255 18.786 20.354 21.357
Manufacture of man‐made fibres 749 668 684 685 667 602 560 442Manufacture of chemicals and chemical products
69.527 76.108 80.559 82.833 86.740 96.311 107.263 113.673
Manufacture of rubber products**** 7.949 8.493 8.401 8.721 9.223 9.637 9.227 9.974Manufacture of plastic products***** 3.791 4.176 4.427 4.318 4.365 4.488 4.508 3.214Manufacture of plastic and rubber products
11.740 12.669 12.828 13.039 13.588 14.126 13.735 13.188
Export of chemicals in Mio EUR (Ausfuhr)
2.000 2.001 2.002 2.003 2.004 2.005 2.006 2.007
Manufacture of basic chemicals* 17.445 18.957 18.218 18.539 18.740 19.957 25.568 30.205Manufacture of pesticides and other agro‐chemical products
830 1.347 929 1.095 1.319 1.721 1.633 0
Manufacture of paints, varnishes and similar coatings, printing ink and mastics
1.850 1.958 2.013 2.249 2.465 2.727 2.777 2.985
Manufacture of pharmaceuticals, medicinal chemicals and botanical products**
20.315 23.521 30.806 29.840 28.956 36.288 43.629 46.442
Manufacture of soap and detergents, cleaning and polishing preparations, perfumes and toilet preparations
2.424 3.194 3.595 4.079 3.855 4.099 4.749 4.913
Manufacture of other chemical products***
8.290 8.762 19.124 19.084 20.661 22.537 22.342 27.210

SWOT‐Analysis Project [ChemLog]
Project Partner: AUSTRIA Page 11/47
Manufacture of man‐made fibres 2.994 3.200 3.575 3.522 4.036 4.320 4.387 5.238Manufacture of chemicals and chemical products
54.148 60.937 78.260 78.409 80.031 91.649 105.084 116.994
Manufacture of rubber products**** 5.171 5.556 4.985 5.256 5.851 5.956 5.507 6.513Manufacture of plastic products***** 2.678 3.228 3.359 3.594 3.884 3.698 3.186 2.701Manufacture of plastic and rubber products
7.849 8.784 8.344 8.850 9.734 9.654 8.693 9.214
Source: Statistik Austria [Leistungs‐ und Strukturstatistik 2000‐2006].
Geographic breakdown of chemicals export in % (Ausfuhr)
2.000 2.001 2.002 2.003 2.004 2.005 2.006 2.007
EU 27 71% 69% 68% 71% 71% 69% 68% 67%EU 15 Estonia, Latvia, Lithuania, Malta, Poland,
Slovakia, Slovenia, Czech Republic, Hungary, Cyprus
Bulgaria, Rumania Rest of Europe 12% 13% 14% 14% 15% 17% 17% 17%NAFTA 7% 7% 9% 7% 5% 5% 5% 5%Latin America and the Caribbean 2% 2% 2% 1% 1% 2% 2% 2%Asia 6% 7% 6% 6% 6% 6% 6% 7%Africa 1% 1% 1% 1% 1% 1% 1% 1%Australia / Oceania 0% 0% 1% 1% 1% 0% 1% 0%
Geographic breakdown of chemicals import in % (Einfuhr)
2.000 2.001 2.002 2.003 2.004 2.005 2.006 2.007
EU 27 84% 84% 84% 84% 84% 79% 78% 78%EU 15 Estonia, Latvia, Lithuania, Malta, Poland,
Slovakia, Slovenia, Czech Republic, Hungary, Cyprus
Bulgaria, Rumania Rest of Europe 5% 5% 6% 7% 6% 10% 11% 10%NAFTA 5% 5% 5% 5% 4% 4% 4% 5%Latin America and the Caribbean 0% 0% 0% 0% 1% 1% 1% 1%Asia 5% 5% 4% 4% 5% 5% 5% 6%Africa 0% 0% 0% 0% 0% 0% 0% 0%Australia / Oceania 0% 0% 0% 0% 0% 0% 0% 0%
2.4 REGIONAL STRUCTURE OF CHEMICAL INDUSTRY
Additionally to chemical production sites there are two main chemical industry parks in Linz and Krems. In Linz the producer AMI Agrolinz Melamine International, DSM Fine Chemicals Austria GmbH and Borealis GmbH as well as numerous service providers for the chemical companies are situated there. In Krems there is an industrial park too, especially for chemical industry.
The following table shows the Top 30 ranking regarding turnover in Mio EUR of Austrian chemical companies:

SWOT‐Analysis Project [ChemLog]
Project Partner: AUSTRIA Page 12/47
Major Companies and chemical sites Turnover 2007 in mio €
Location / chemical site Number of employees
Alpla Werke Alwin Lehner GmbH & Co KG 2.270€ Hard 10.000HENKEL CENTRAL EASTERN EUROPE GESELLSCHAFT MBH 2.241€ Wien 13.000Borealis Polyolefine GmbH 1.509€ Schwechat 779Sandoz GmbH 1.300€ Kundl 2.818Lenzing Aktiengesellschaft 1.261€ Lenzing 6.043Baxter Aktiengesellschaft 424€ Wien 3.086Boehringer Ingelheim RCV GmbH & Co KG 390€ Wien 1.035M. Kaindl 371€ Wals 655Nycomed Austria GmbH 356€ Linz 549AMI Agrolinz Melamine International GmbH 329€ Linz 798DSM Fine Chemicals Austria Nfg GmbH & CoKG 322€ Linz 941Semperit Technische Produkte Gesellschaft m.b.H. 300€ Wien 831Unilever Austria GmbH 299€ Wien 316Greiner Packaging GmbH 291€ Kremsmünster 2.584Kromberg & Schubert Austria Gesellschaft m.b.H. & Co. KG. 288€ Oberpullendorf 160Johnson Controls Austria GmbH & Co OHG 285€ Mandling 871Teich Aktiengesellschaft 275€ Ober‐Grafendorf 713KAINDL FLOORING GmbH 271€ Wals bei Salzburg 147FACC AG 252€ Ried im Innkreis 1.451AHT Cooling Systems GmbH 210€ Rottenmann 521OMYA GmbH 210€ Gummern 275ISOVOLTA AG 204€ Wiener Neudorf 608Internorm Bauelemente GmbH 203€ Traun 1.333Fresenius Kabi Austria GmbH 192€ Graz‐Puntigam 582TUPACK Verpackungen Gesellschaft m.b.H. 186€ Wien 663Zizala Lichtsysteme GmbH 185€ Wieselburg an der Erlauf 1.200EBEWE Pharma Ges.m.b.H. Nfg.KG 185€ Unterach 292Jungbunzlauer Austria AG 182€ Wien 281Brenntag CEE GmbH 181€ Wien 316Röfix AG 178€ Sulz‐Röthis 540
SWOT‐Analysis Project [ChemLog]
Project Partner: AUSTRIA Page 13/47
Modal Split 2007
Road66%
Railway20%
Waterway2%
Pipeline12%
Air0%
3 DESCRIPTION OF TRANSPORT INFRASTRUCTURE
3.1 INTRODUCTION3
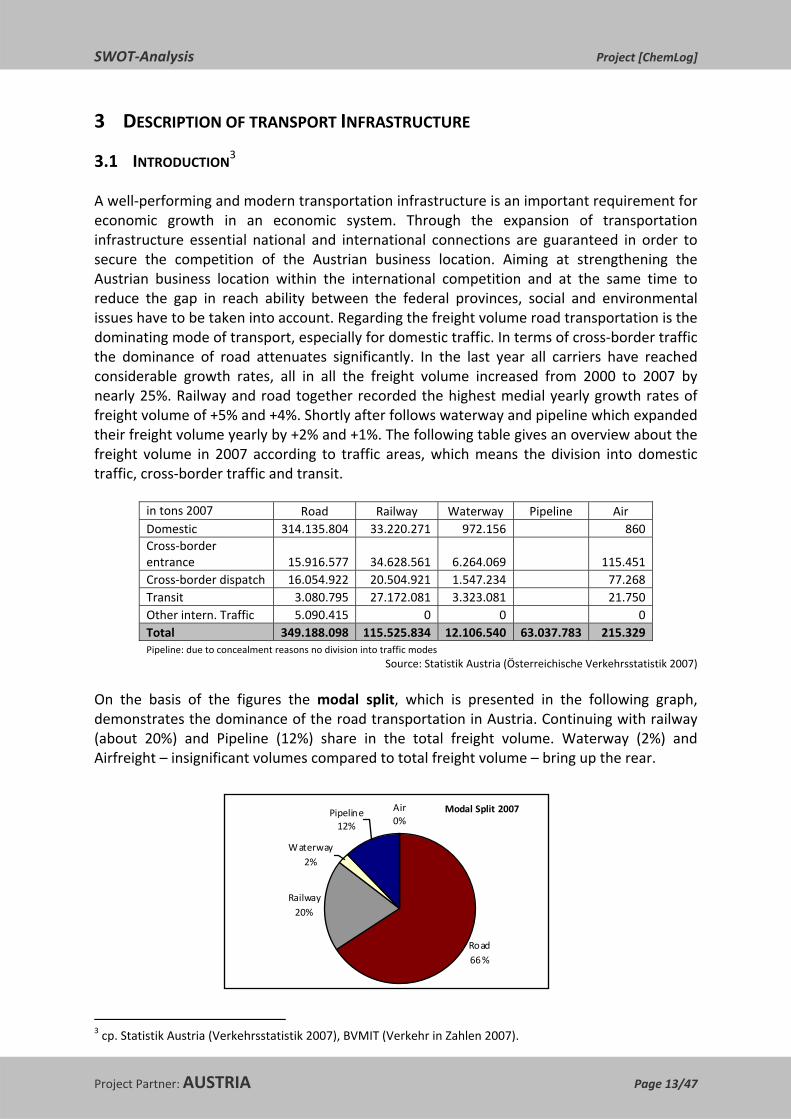
A well‐performing and modern transportation infrastructure is an important requirement for economic growth in an economic system. Through the expansion of transportation infrastructure essential national and international connections are guaranteed in order to secure the competition of the Austrian business location. Aiming at strengthening the Austrian business location within the international competition and at the same time to reduce the gap in reach ability between the federal provinces, social and environmental issues have to be taken into account. Regarding the freight volume road transportation is the dominating mode of transport, especially for domestic traffic. In terms of cross‐border traffic the dominance of road attenuates significantly. In the last year all carriers have reached considerable growth rates, all in all the freight volume increased from 2000 to 2007 by nearly 25%. Railway and road together recorded the highest medial yearly growth rates of freight volume of +5% and +4%. Shortly after follows waterway and pipeline which expanded their freight volume yearly by +2% and +1%. The following table gives an overview about the freight volume in 2007 according to traffic areas, which means the division into domestic traffic, cross‐border traffic and transit.
in tons 2007 Road Railway Waterway Pipeline Air Domestic 314.135.804 33.220.271 972.156 860 Cross‐border entrance 15.916.577 34.628.561 6.264.069 115.451 Cross‐border dispatch 16.054.922 20.504.921 1.547.234 77.268 Transit 3.080.795 27.172.081 3.323.081 21.750 Other intern. Traffic 5.090.415 0 0 0 Total 349.188.098 115.525.834 12.106.540 63.037.783 215.329 Pipeline: due to concealment reasons no division into traffic modes
Source: Statistik Austria (Österreichische Verkehrsstatistik 2007)
On the basis of the figures the modal split, which is presented in the following graph, demonstrates the dominance of the road transportation in Austria. Continuing with railway (about 20%) and Pipeline (12%) share in the total freight volume. Waterway (2%) and Airfreight – insignificant volumes compared to total freight volume – bring up the rear.
3 cp. Statistik Austria (Verkehrsstatistik 2007), BVMIT (Verkehr in Zahlen 2007).
SWOT‐Analysis Project [ChemLog]
Project Partner: AUSTRIA Page 14/47
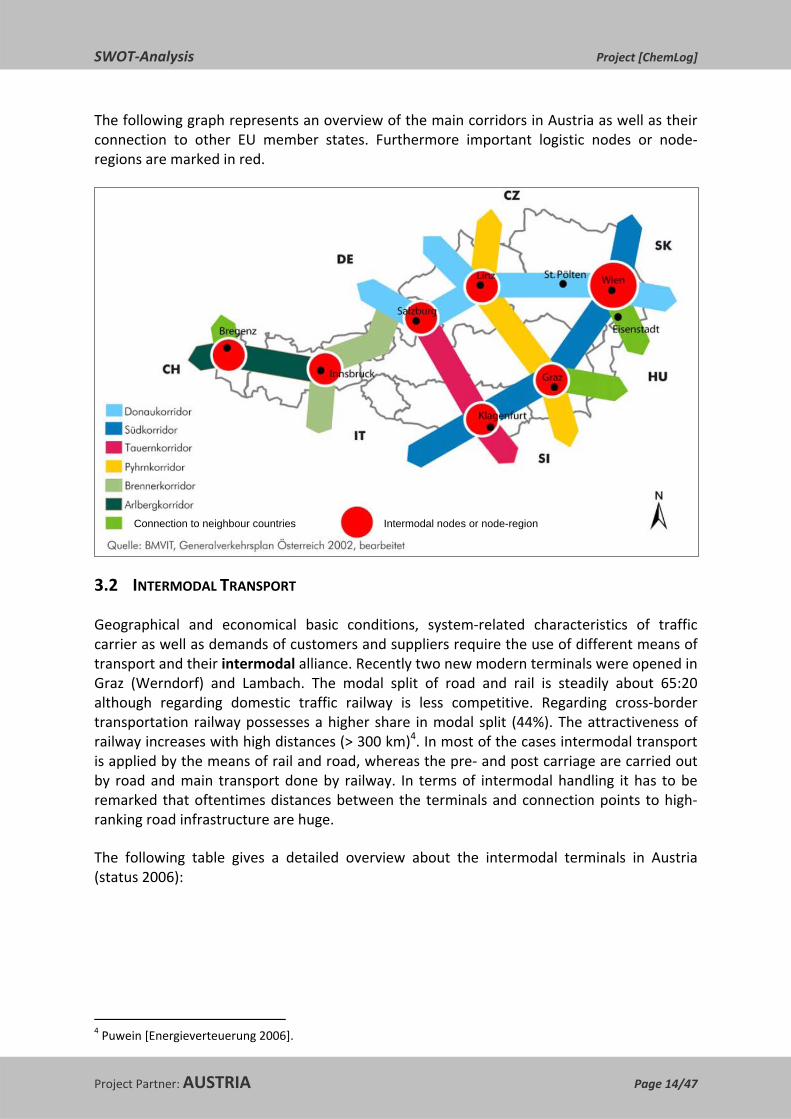
The following graph represents an overview of the main corridors in Austria as well as their connection to other EU member states. Furthermore important logistic nodes or node‐regions are marked in red.
3.2 INTERMODAL TRANSPORT
Geographical and economical basic conditions, system‐related characteristics of traffic carrier as well as demands of customers and suppliers require the use of different means of transport and their intermodal alliance. Recently two new modern terminals were opened in Graz (Werndorf) and Lambach. The modal split of road and rail is steadily about 65:20 although regarding domestic traffic railway is less competitive. Regarding cross‐border transportation railway possesses a higher share in modal split (44%). The attractiveness of railway increases with high distances (> 300 km)4. In most of the cases intermodal transport is applied by the means of rail and road, whereas the pre‐ and post carriage are carried out by road and main transport done by railway. In terms of intermodal handling it has to be remarked that oftentimes distances between the terminals and connection points to high‐ranking road infrastructure are huge.
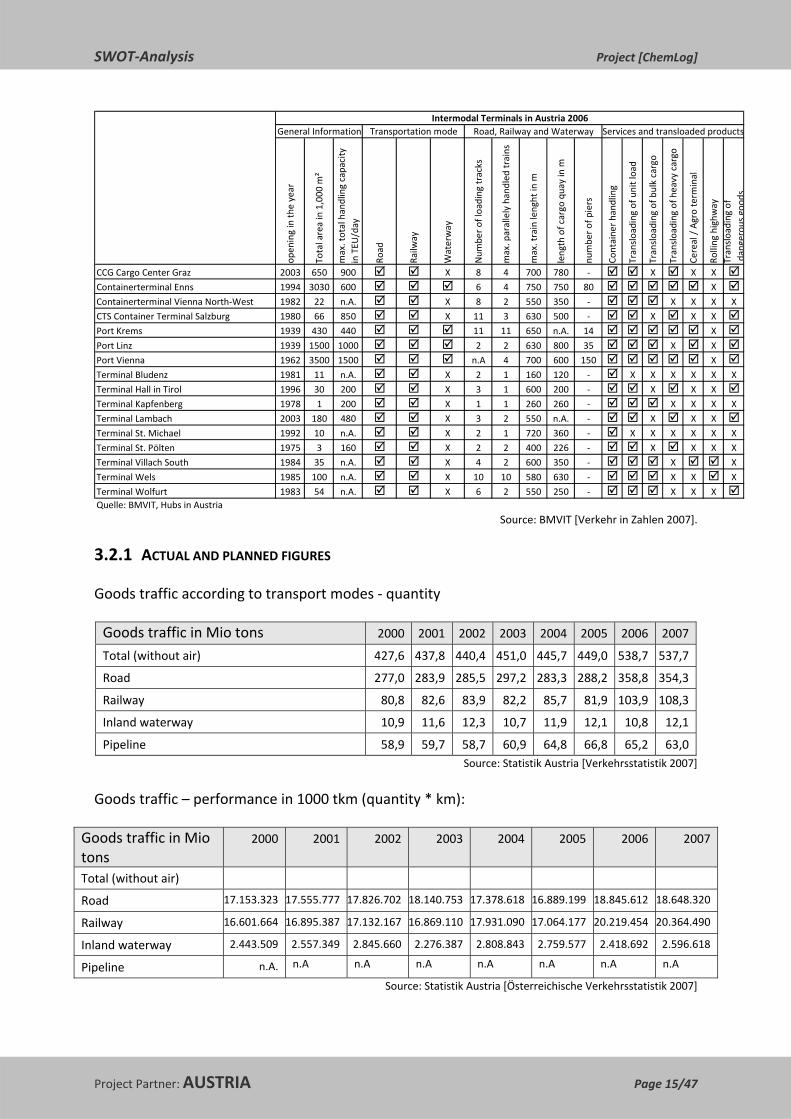
The following table gives a detailed overview about the intermodal terminals in Austria (status 2006):
4 Puwein [Energieverteuerung 2006].
Intermodal nodes or node-region Connection to neighbour countries
SWOT‐Analysis Project [ChemLog]
Project Partner: AUSTRIA Page 15/47
open
ing in th
e year
Total area in 1,000
m²
max. total handling capacity
in TEU
/day
Road
Railw
ay
Waterway
Num
ber of loading tracks
max. parallely handled
trains
max. train lenght in
m
length of cargo
quay in m
numbe
r of piers
Containe
r hand
ling
Transloading
of u
nit load
Transloading
of b
ulk cargo
Transloading
of h
eavy cargo
Cereal / Agro term
inal
Rolling
highw
ayTransloading
of
dangerou
sgood
s
CCG Cargo Center Graz 2003 650 900 X 8 4 700 780 ‐ X X X
Containerterminal Enns 1994 3030 600 6 4 750 750 80 X
Containerterminal Vienna North‐West 1982 22 n.A. X 8 2 550 350 ‐ X X X X
CTS Container Terminal Salzburg 1980 66 850 X 11 3 630 500 ‐ X X X
Port Krems 1939 430 440 11 11 650 n.A. 14 X
Port Linz 1939 1500 1000 2 2 630 800 35 X X
Port Vienna 1962 3500 1500 n.A 4 700 600 150 X
Terminal Bludenz 1981 11 n.A. X 2 1 160 120 ‐ X X X X X X
Terminal Hall in Tirol 1996 30 200 X 3 1 600 200 ‐ X X X
Terminal Kapfenberg 1978 1 200 X 1 1 260 260 ‐ X X X X
Terminal Lambach 2003 180 480 X 3 2 550 n.A. ‐ X X X
Terminal St. Michael 1992 10 n.A. X 2 1 720 360 ‐ X X X X X X
Terminal St. Pölten 1975 3 160 X 2 2 400 226 ‐ X X X X
Terminal Villach South 1984 35 n.A. X 4 2 600 350 ‐ X X
Terminal Wels 1985 100 n.A. X 10 10 580 630 ‐ X X X
Terminal Wolfurt 1983 54 n.A. X 6 2 550 250 ‐ X X XQuelle: BMVIT, Hubs in Austria
Intermodal Terminals in Austria 2006General Information Transportation mode Road, Railway and Waterway Services and transloaded products
Source: BMVIT [Verkehr in Zahlen 2007].
3.2.1 ACTUAL AND PLANNED FIGURES
Goods traffic according to transport modes ‐ quantity
Goods traffic in Mio tons 2000 2001 2002 2003 2004 2005 2006 2007
Total (without air) 427,6 437,8 440,4 451,0 445,7 449,0 538,7 537,7
Road 277,0 283,9 285,5 297,2 283,3 288,2 358,8 354,3
Railway 80,8 82,6 83,9 82,2 85,7 81,9 103,9 108,3
Inland waterway 10,9 11,6 12,3 10,7 11,9 12,1 10,8 12,1
Pipeline 58,9 59,7 58,7 60,9 64,8 66,8 65,2 63,0 Source: Statistik Austria [Verkehrsstatistik 2007]
Goods traffic – performance in 1000 tkm (quantity * km):
Goods traffic in Mio tons
2000 2001 2002 2003 2004 2005 2006 2007
Total (without air)
Road 17.153.323 17.555.777 17.826.702 18.140.753 17.378.618 16.889.199 18.845.612 18.648.320
Railway 16.601.664 16.895.387 17.132.167 16.869.110 17.931.090 17.064.177 20.219.454 20.364.490
Inland waterway 2.443.509 2.557.349 2.845.660 2.276.387 2.808.843 2.759.577 2.418.692 2.596.618
Pipeline n.A. n.A n.A n.A n.A n.A n.A n.A
Source: Statistik Austria [Österreichische Verkehrsstatistik 2007]

SWOT‐Analysis Project [ChemLog]
Project Partner: AUSTRIA Page 16/47
Reliable and selected results of forecasts about the development of the modal split are presented by the German Ministry in charge:5 changes in modal split will be about 3%, whereas the highest growth rates will be recorded at rail traffic (+2%). Share of road transportation will slightly increase by 1% and share of waterway transportation will decline by 2%.
3.2.2 MAIN CORRIDORS AND MAJOR INFRASTRUCTURE
The following picture shows the Austrian network of terminals as well as road, railway and waterway infrastructure:
3.3.3 Government plans and political programs Extension plans, financing ‐ PPP, investment volume, focus on corridors, etc.
Source: BMVIT, Hubs in Austria, http://www.verkehre.co.at/hubs/15.11.2006
3.2.3 GOVERNMENT PLANS AND POLITICAL PROGRAMS6
The basis of the European policy of traffic and transportation is the White paper 2001. In the year 2006 the half time status quo was evaluated and the results of the Access‐Study forced the European Commission to adjust the objectives realistically. The increase of railway transport by 35% until 2010 had been originally planned and was weakened 2006 to a simple recommendation to use railway transportation for long‐distances and overloaded routes. Furthermore numerous To‐Dos in terms of intermodal transport were defined:
5 cp. BMVBS [Güterverkehrsentwicklung 2007]. 6 cp. BMVIT [Halbzeitbilanz Verkehrsweißbuch 2006].
Cargo Terminal
autobahnhighway
Railway
state road
danubeprovince borders
Cargo Terminal
autobahnhighway
Railway
state road
danubeprovince borders
SWOT‐Analysis Project [ChemLog]
Project Partner: AUSTRIA Page 17/47
o Increase of intermodal transport o Optimization of the potentials of each transportation mode o Future‐oriented and innovative solutions in order to guarantee efficient traffic
and transportation systems.
The implementation of TEN corridors is behind schedule. So the main objective for the next year is the optimization of the TEN networks according to a perennial investment program (mobilization of available sources). Austria‐related TEN projects with relevance for intermodal transport are as follows:
o Railway: Berlin‐Verona/Milano‐Bologna‐Neapel‐Messina‐Palermo; Paris‐Straßburg‐Stuttgart‐Vienna‐Bratislava; Athens‐Sofia‐Budapest‐Vienna‐Praha‐Nürnberg/Dresden
o Road: Danzig‐Warsaw‐Brno/Bratislava‐Vienna o Inland waterway: Rhein/Maas‐Main‐Danube
3.3 ROAD TRANSPORT
The total length of the road network in Austria came to 106.987 km in 2005. The high‐ranking road network (highways and autobahn) held a length of about 2,050 km (2%), whereas the rest is distributed to countryside highways (32%) and rural roads (66%). From 2000 to 2005 the road infrastructure increased by 117 km (+6%). Embossed by the Alps the Austrian road infrastructure possesses a high number of tunnels and bridges. In the year 2004 the number of highway bridges came to 3.918 whereas 137 tunnels long ways 290 km in 2005. In the year 2007 Austrian road transportation modes moved 354.3 M tons meaning a slight reduction by 1.3% compared the previous year. On the subject of the transportation performance (transportation volume * kilometres transported) a decrease of 4.6% to 37.4 Billion tkm. Volumes of domestic traffic amounted to 314.1 M tons cargo of cross‐border entrance and dispatch to 15.9 M tons and 16.1 M tons as well as transit to 3.1 M tons. Domestic transportation took the highest share of 88.7% of goods traffic whereas cross‐border entrance and dispatch both had a share of 4.5%. Transit and other transportation abroad completed the list with 1.4% and 0.9% of goods traffic in 2007. Products most transported in 2007 were mineral raw materials and substances with a cargo volume of 183.9 M tons and a share of 51.9% in total transportation volumes. In this ranking, machines, agricultural products and food are following.7
3.3.1 ACTUAL AND PLANNED FIGURES (STATUS: 2005/2007) Actual and planned road network in km in operation in progress planned total
Highway 1.696,068 18,700 91,686 1.787,956
State road 416,672 6,772 304,922 711,567 Source: Statistik Austria [Verkehrsstatistik 2007].
7 cp. BMVIT [Verkehr in Zahlen 2007], Statistik Austria [Verkehrsstatistik 2007].

SWOT‐Analysis Project [ChemLog]
Project Partner: AUSTRIA Page 18/47
Goods traffic in % according to traffic area – road
2000 2001 2002 2003 2004 2005 2006 2007
Domestic traffic 87,0 86,0 86,2 86,1 85,3 86,2 88,0 88,7
Cross‐border entrance 5,0 5,5 5,3 5,5 5,8 5,4 4,7 4,5
Cross‐border dispatch 5,3 5,6 5,7 5,7 6,0 5,4 4,5 4,5
Transit 1,5 1,6 1,6 1,5 1,5 1,4 1,0 0,9
Other transportation abroad 1,2 1,3 1,2 1,3 1,4 1,6 1,8 1,4 Source: Statistik Austria [Verkehrsstatistik 2007].
A reliable forecast about the future development of road traffic was generated by the ÖAMTC Academy8 predicting an increase in transportation performance of 65% until 2030 (in relation to 2005). As the high‐ranking road network will only grow by 30%, it is projected that the infrastructure of road and rail won’t keep up with the development of the transportation performance. According to experts’ opinions the only way to face that economical and ecological unfavourable development are price measures, so to say pricing of external effects.
3.3.2 MAIN CORRIDORS AND MAJOR INFRASTRUCTURE
The following graph gives a detailed overview about the road infrastructure in Austria:
Source: Statistik Austria (Österreichische Verkehrsstatistik 2007) 3.3.3 Government plans and political programs Extension plans, financing ‐ PPP, investment volume, focus on corridors, etc.
Source: Statistik Austria [Verkehrsstatistik 2007].
8 cp. ÖAMTC Academy [Mobilität 2015/2030 2007].
autobahn
highway
selected state roads
remaining state roads
province borders
autobahn
highway
selected state roads
remaining state roads
province borders

SWOT‐Analysis Project [ChemLog]
Project Partner: AUSTRIA Page 19/47
3.3.3 GOVERNMENT PLANS AND POLITICAL PROGRAMS
On the basis of the Austrian General Traffic Plan9 a strategic expansion programme for transportation infrastructure (road, railway and waterway network) was developed in 2002, whereas these plans are not legally fixed. The main objective of the expansion of infrastructure is the sustainable development of the business location Austria within the international competition and to provide the infrastructural requirements for the Austrian economy to stay competitive. The operative implementation of the infrastructure projects should be done by the responsible governmental infrastructure companies. Particularly the focus is put on the following main corridors:
o „Danube“ corridor: D‐Passau/Salzburg‐Linz‐Vienna‐SK/H o „South“ corridor: CZ‐Vienna‐Graz‐Villach‐I („Baltisch‐Adriatisch“, „Pontebbana) o „Brenner“ corridor: D‐Wörgl‐Innsbruck‐I o „Tauern“ corridor: D‐Salzburg‐Villach‐SLO o „Pyhrn“ corridor: CZ‐Linz‐Graz‐SLO o „Arlberg“ corridor: Innsbruck‐Feldkirch/Bregenz‐CH
The extension plans for road with international relevance are concentrated on the highway connections from Linz/Vienna to Czech Republic and Slovakia as well as Graz – Hungary. End of 2007 the highway to Bratislava was opened. 2010 the implementation of the highway connection to Brno will follow. In order to realize the mentioned infrastructure projects an investment volume of about EUR 4.5 billion dedicated for the period 2008‐2010 and EUR 8.1 in total until 2013 s budgeted. The financing is done via road pricing, vignettes and other congestion charges (Arlberg, Brenner, Tauern, Pyhrn).
3.4 RAILWAY TRANSPORT
Fundamentally the Austrian railway network was nearly unmodified for a long time. Since 1990 investments into railway infrastructure have been forced, especially in the course of the European integration and along the Transeuropean axes. The length of the railway network stayed constant between 1970 and 1999. Since 2000 there has been a steadily reduction from originally 6,841 km to 6,273 km in the up to the year 2007. Particularly the eastern part of Austria has a high density due to a large number of branch lines. Compared to member states of the European Union (0.4 m per capita), Austria ranks above‐average with 0.7 m per capita. Similar to road infrastructure a high number of tunnels and bridges are characteristic for the railway network in Austria. In 2000 266 tunnels along the railway network existed. In comparison to road transportation, railway is hardly marked by internationalization and cross‐border traffic as 70% are cross‐border and transit flows.
In the year 2007 108.3 M tons were transported to, from and within Austria, while this signifies an augment by 4.3% from the previous year. The volumes in domestic traffic amounted to 33.2 M tons, whereas about 74 M tons belong to the cross‐border traffic in total (entrance, dispatch and transit). In 2007 more than 95% of the transportation volume was forwarded by Austrian companies.
9 cp. BMVIT [Generalverkehrsplan 2002].

SWOT‐Analysis Project [ChemLog]
Project Partner: AUSTRIA Page 20/47
ÖBB (public) - electrified
double or multi-trackedsingle tracked
ÖBB (public) – non electrified
Private railways
Province borders
ÖBB (public) - electrified
double or multi-trackedsingle tracked
ÖBB (public) – non electrified
Private railways
Province borders
Most important countries in international transportation were the neighbour countries Germany and Hungary with cargo volume adding up to 16.0 and 10.1 M tons and Italy and Slovenia coming to 6.3 and 5.9 M tons. Regarding the international flow of goods in terms of border regions the north‐south dimension dominated as across the northern borders about 45 M tons and 31 M tons were transported in the year 2007 across the southern borders. Whereas the east‐west corridor with 24 and 8 M tons showed less cargo volume.10
3.4.1 ACTUAL AND PLANNED FIGURES Actual and planned railway network in km in operation in progress planned Total
Public 5.703 n.A. n.A. n.A.
Private 570 n.A. n.A. n.A.
Total 6.273 n.A. n.A. n.A.
Source: Statistik Austria [Verkehrsstatistik 2007].
Goods traffic in % according to traffic area – railway
2000 2001 2002 2003 2004 2005 2006 2007
Domestic traffic 25,1 24,5 24,5 23,7 25,1 27,5 29,4 30,7
Cross‐border entrance 35,1 34,5 35,5 36,3 35,4 33,8 34,6 32,0
Cross‐border dispatch 21,5 22,2 22,3 22,4 21,7 21,7 19,4 18,9
Transit 18,3 18,8 17,7 17,6 17,8 17,0 16,6 18,4 Source: Statistik Austria [Verkehrsstatistik 2007].
3.4.2 MAIN CORRIDORS AND MAJOR INFRASTRUCTURE
The following graph gives a detailed overview about the railway infrastructure in Austria:
Source: Statistik Austria [Verkehrsstatistik 2007].
10 cp. BMVIT [Verkehr in Zahlen 2007], Statistik Austria [Verkehrsstatistik 2007].

SWOT‐Analysis Project [ChemLog]
Project Partner: AUSTRIA Page 21/47
3.4.3 GOVERNMENT PLANS AND POLITICAL PROGRAMS
Highest priority within the governmental plans for railway with international relevance is the expansion of the West‐East rail network (Wien‐Linz) to 4 rail tracks. Until 2015 a cross‐border project to integrate the Vienna airport and the „Klederinger Schleife“ to achieve an interconnecting of the East rail network, the airport and the highway (Wien‐Bratislava). This project is mainly financed by the European Union. The finalization of the “Brenner‐Basis‐Tunnel” project is re‐scheduled for 2020, highly supported by the European Union due to the importance for transit traffic. Vital for the south area of Austria is the realization of the new South rail network “Semmering‐Basis‐Tunnel” and “Koralm” railway as the main axis between Poland and Italy. Possibly bringing into service will be 2018. Further expansion plans focus the Arlberg, Tauern‐axe and the Phyrn‐axe. The investment volume for all railway projects for the years 2008‐2013 comes to 10.7 billion EUR.11
3.5 WATERWAY TRANSPORT
The length of the domestic waterway, the Austrian part of the Danube, is 350 km, thereof 21 km is periphery with Germany, 322 km domestic section and 7 km borderline to Slovakia. Alongside the Austrian part 16 bigger ports are located. Most important are trade port and tank port of Linz, port of Enns, port of Krems as well as the ports of Vienna (Albern, Freudenau, Lobau). The nine locks alongside the Danube are in Aschach, Ottensheim, Abwinden, Wallsee, Persenbeug, Melk, Altenwörth, Greifenstein and Freudenau. Freight volume on the Danube increased in total from 2000 2007 by 10.3% with a medial yearly growth rate of +2%. The year 2002 showed the highest freight volume of 12.3 M tons, mainly due to the ending of the Balkan crisis. About 50% of total cargo volume was dedicated to terminating traffic to Austria, whereas 2/3 is supplied from the East. Share of transit came to 30%.
In the year 2007 about 12.1 M tons were transported at the Austrian part of the Danube whereas the volumes increased by 4.3% from 2006 to the actual reporting period. The transportation performance mounted up to 2.6 billion tkm, which signifies an augment of 7.4% between 2006 and 2007. Good flows via cross‐border entrance have been taking the highest share according to the traffic area coming to steadily 50% approximately. The domestic traffic of goods via waterway decreased from 2006 to 2007 significantly, although these percentages have been varying since 2000. The reduction in cargo volume of domestic transportation trace back to the fact, that dredging of the Danube was carried out to a lesser extent. Highest increase in cargo volume in terms of product groups corresponded to ores and metal scrap (3.429.480 tons), due to an upper number of transports from Slovakia and Ukraine to Austria.
Most important ports in Austria are Linz, Enns, Ybbs, Krems and Vienna. All ports have been recorded a significant plus of their water‐side handling volume for the last year. Especially from 2006 to 2007 the port of Linz came up with a plus of 14.5% (5,252,512 tons), Vienna increased their water‐side handling volume by 12.6% (1,655,243 tons) and Enns was
11 cp. BMVIT [Generalverkehrsplan 2002].

SWOT‐Analysis Project [ChemLog]
Project Partner: AUSTRIA Page 22/47
successful in handling plus 13.4% (765,982 tons). Only the port of Krems had to face a reduction due to reduced ballast handling.12
3.5.1 ACTUAL AND PLANNED FIGURES Goods traffic in % according to traffic area ‐ waterway
2000 2001 2002 2003 2004 2005 2006 2007
Domestic traffic 10,4 10,4 4,5 8,6 1,6 3,0 10,5 8,0
Cross‐border entrance 49,6 48,2 51,2 48,7 50,7 50,2 44,4 51,7
Cross‐border dispatch 10,8 10,8 12,6 14,6 13,7 13,7 13,3 12,8
Transit 39,6 30,6 31,7 28,1 34,0 33,1 31,8 35,5 Source: Statistik Austria [Verkehrsstatistik 2007].
3.5.2 MAIN CORRIDORS AND MAJOR INFRASTRUCTURE
The following table gives information about the infrastructure of the most important Danube ports in Austria:
Area (m²)
Water surface (m²)
Basin (number)
Water depth (m)
allowed drafd (m)
landing (number)
winter port
rail connection length (km)
road connection distance to road
infrastructure (km)Linz 1.500.000 450.000 6,0 7,0 2,7 35 yes 27,0 2Linz Industrial Port n.A. 2.000 1,0 8,0 n.A. 1 yes 0,1 2Enns-Ennsdor 3.030.000 500.000 2,0 3,0 2,7 80 yes 1.420,0 1Ybbs 60.000 325 1,0 5,0 3,8 1 yes 2,5 2Krems 250 70.000 2,0 8,0 5,0 8 yes 6,5 1Vienna 3.500.000 665.000 3,0 2,5 1,5 150 yes 45,0 5
Infrastructure of important Danube ports (status 2003)
Source: via donau [Manual on Danube Ports 2003].
12 cp. BMVIT [Verkehr in Zahlen 2007], Statistik Austria [Verkehrsstatistik 2007].

SWOT‐Analysis Project [ChemLog]
Project Partner: AUSTRIA Page 23/47
Important ports
Provinve borders
Barrages with locks
Important ports
Provinve borders
Barrages with locks
Important ports
Provinve borders
Barrages with locks
On the chart below the important ports and barrages with locks over the Austrian part of the Danube are presented:
Source: Statistik Austria [Verkehrsstatistik 2007].
3.5.3 GOVERNMENT PLANS AND POLITICAL PROGRAMS
Extension plans for inland waterway with international relevance are concentrated on the part of the Danube between Vienna and Bratislava. The objectives are to reduce the bottlenecks Straubing‐Vilshofen (D) and Nagymaros (H). A very difficult issue is the nature mead Donau‐March‐Thaya as the expansion of this area is highly discussed due to ecological reasons. Extension plans in terms of regulation of low flow or reconstruction of banks have to be agreed with nature and ecology groups. Until 2015 the bottlenecks shall be abandoned with an investment budget of 270 M EUR, in order to guarantee a permanent water depth of 2.2m.13
13 Cp. BMVIT [Generalverkehrsplan 2002].

SWOT‐Analysis Project [ChemLog]
Project Partner: AUSTRIA Page 24/47
3.6 PIPELINE TRANSPORT
Pipelines in Austria are used for the transport of the raw materials oil and gas. From 2001 to 2007 there was a steady reduction in transport volume of oil by yearly rate of ‐2%, whereas gas increased continuously by 28% in total (from 2000 to 2007). Due to data protection there has not been any information about origin of quantity. The freight volume added up to 63.0 M tons in 2007, meaning a decrease by 2.2 M tons (‐3.4%) from 2006 to 2007. The reasons for this reduction can be attributed to a massive decline in transportation of oil.14
3.6.1 ACTUAL AND PLANNED FIGURES Pipeline transport in thousands of tons
2000 2001 2002 2003 2004 2005 2006 2007
Oil 34.888 37.216 36.163 35.507 34.639 35.417 34.611 32.381
Gas 23.993 22.519 22.557 25.418 30.129 31.334 30.611 30.657
Total 58.882 59.735 58.720 60.925 64.768 66.751 65.221 63.037 Source: Statistik Austria [Verkehrsstatistik 2007].
3.6.2 MAIN CORRIDORS AND MAJOR INFRASTRUCTURE
The following graph gives a detailed overview about the pipeline infrastructure in Austria:
3.6.3 Government plans and political programs Extension plans, financing ‐ PPP, investment volume, focus on corridors, etc.
14 cp. BMVIT [Verkehr in Zahlen 2007], Statistik Austria [Verkehrsstatistik 2007].
Transit pipeline
Gas pipeline
Supply Through domestic transit pipelines
Through intern. Transit pipelines
In operation
Planned
Transit pipeline
Gas pipeline
Supply Through domestic transit pipelines
Through intern. Transit pipelines
In operation
Planned
SWOT‐Analysis Project [ChemLog]
Project Partner: AUSTRIA Page 25/47
4 DESCRIPTION OF CHEMICAL LOGISTICS IN THE REGION / COUNTRY
Logistics has an important role within the Austrian economy as in 2005 more than 14,600 logistic companies delivered a value adding of about 12 billion EUR. Sales within the logistic sector came up to 35.2 billion EUR. Nearly 222,000 people are employed and contribute considerably to the development of the Austrian economy. In the year 2005 gross investments mounted to 5.2 billion EUR.15
Chemical sites in Austria are inland locations with specific requirements regarding logistics. Handling chemical goods requires giving security and safety highest priority. Strict regulations regarding environment and quality have to be considered alongside the whole supply chain and especially in transport and warehousing. Therefore chemical companies need reliable logistic partners who are involved in sector‐ and product‐specific issues. Many logistic providers expand their service from transport and warehousing to contracting and/or value‐added services typical for the chemical industry like filling, temperature control or security and safety advices. A further advantage of the collaboration with specialized Logistic Service Providers is the availability of special equipment (product‐specific mode of transport like tank lorries, silo vehicles, tank wagons and associated specialized equipment) for the transport of various dangerous goods. Furthermore partners can take on the role of external hazardous materials safety advisor for all carriers (road, rail, inland water, deep sea and air).
There are numerous logistic companies in Austria offering logistic services for chemical industry. Most of them are specialized business units of big companies focussing on the individual requirements of chemical logistics. Selected logistic companies in Austria specialized in chemical logistics are as follows:
o Chemserv Industrie Service GmbH o Donau‐Tankschifffahrts GmbH (DTSG) o Danube Shipping Management Service GmbH (DSMS) o ETG Gütertransport GmbH o Hoyer Austria Ges.m.b.H. Intern. Fachspedition o Industrie Logistik Linz o Interliner Transporte & Speditions GmbH o Intermodal Container Logistics GmbH ‐ ICL o LOGOTRADE Logistikservice Wuger & Quehenberger Ges.m.b.H. o LogServ ‐ Logistik Service GmbH o Logwin Solutions Austria o Panta Rhei (PR) Befrachtungs‐ und Spedition GmbH o RCA ‐ Rail Cargo Austria AG o VTG Austria GesmbH o Etc.
15 cp. Statistik Austria [Leistungs‐ und Strukturstatistik 2006].

SWOT‐Analysis Project [ChemLog]
Project Partner: AUSTRIA Page 26/47
5 INTERNAL STRENGTHS AND WEAKNESSES OF CHEMICAL COMPANIES AND
LOGISTIC PROVIDERS
What are actually internal influence able strengths from a company’s point of view regarding chemical logistics in Central and Eastern Europe?
5.1 STRENGTHS IN PROCUREMENT
Procurement of freights (freight management): freights are handled on the basis of contracts or via spots for the transportation modes waterway, road, railway and container. Regarding the procurement of raw materials suppliers are located globally. Chemical sites in Austria have to face a disadvantageous situation as important materials and products are supplied from overseas markets. Some Austrian chemical companies rely on just‐in‐time delivery of raw materials as especially within the commodity sector, high volumes of raw materials are supplied, whereas companies try to avoid huge inventory. There are numerous but unreliable raw material producers in Eastern Europe and due to obsolete sites and technologies just‐in‐time delivery of raw materials is not possible under those circumstances. In order to prevent deviations of raw materials, prices often are agreed monthly instead of quarterly.
5.2 STRENGTHS IN WAREHOUSING OF RAW MATERIALS, SEMI‐FINISHED AND FINISHED PRODUCTS
The share of raw materials on production costs is rather high. Furthermore raw materials are stored over long periods, due to comparably long delivery times and unreliable suppliers. Within the chemical industry products and materials are produced on stock (make‐so‐stock) or on the basis of sales forecast. Only few companies choose make‐to‐order strategies. Experts from chemical companies claim limited inventory capacities for raw materials, semi‐finished and finished products. Furthermore product‐specific characteristics and requirements are limiting the inventory time. In Eastern Europe warehousing facilities are available although in most of the cases adjustments are necessary, own investments have to be placed and qualifications of staff are low.
5.3 STRENGTHS IN PRODUCTION LOGISTICS
Chemical companies in Austria report about stabile production processes with extremely low scrap rates. In general duration of production processes for finished products lasts about 2 days. In most of the chemical companies production is organised by three‐shift models and in some cases also on weekends. Basic chemicals party have to face longer durations for production changes (set‐ups and cleaning of reactors). Production planning is supported by IT‐Tools and major objectives are to maximize delivery reliability and productivity. Furthermore companies try to minimize set‐up and cleaning times.
SWOT‐Analysis Project [ChemLog]
Project Partner: AUSTRIA Page 27/47
5.4 STRENGTHS IN DISTRIBUTION AND TRANSPORT
Highly different product‐specifics lead to special requirements for distribution. Even within sectors of the chemical industry (e.g. commodities), customer demands vary regarding costs and quality of distribution logistics (e.g. fertilizer: high cost pressure, acceptable quality, little time slots for delivery or melamine: high quality demands, exact meeting of delivery dates or urea: high quality demand, not that time‐critical as melamine). Chemical companies try to shift volumes from road to railway; in particular commodities are suited for railway transportation (bulk loads).
Multimodal transport is difficult due to insufficient transloading facilities and railway connections. Transhipment of cargo demands special equipment, but efficiency is depending on volumes and regular product or volume flows. This can only be achieved by generating synergies and cooperation with partners. Therefore major problem remains the last mile and the low utilization. Additionally interoperability between rail systems in West‐ and East‐Europe, bureaucratic barriers, lack of quality of equipment and inflexibility as well as a lack of terminal structure for intermodal transport prevent companies to shift volumes to railway. Due to experts’ view railway transportation is challenged by limited availability of wagons, which are sometimes in a poor condition and badly cleaned. Furthermore it could be the case that some equipment or wagons (e.g. NH3‐wagons) are unsafe in their handling.
In some Eastern European countries road transportation suffers is influenced by low quality and inefficiency of the road infrastructure and in particular country‐specific administrative regulations (e.g. digital tachometer). Many companies remark that the customer defines the mode of transport according to their requirements in terms flexibility. Safety and Security when loading goods at chemical sites in Eastern Europe is challenging companies as partly staff does not wear personal safety equipment and there is a lack of means for cargo safety. Transportation and freight management is often outsourced. Transports to CEE countries usually are organised via international freight carriers, whereas transports within CEE countries often are carried out by local carriers. Main problem is the lack of utilities for cargo securing and insufficient use of personal protective equipment when transloading cargo in CEE countries. In general the equipment and the condition of the freight vehicles are inadequate. Coordination and communication with Logistic Service Providers in CEE countries is sometimes difficult due to language barriers and there is an absence of harmonization of social standards (e.g. driving hours). In addition experts partly claim the non‐availability of people with excellent logistical background in terms of collaborations with Logistic Service Providers in CEE. In general experts see high potential in the development and improvement of the road infrastructure especially in those CEE countries, recently joined the European Union.
Inland waterway is the most important mode of transportation in terms of high quantities and bulk cargo – especially for commodities. The availability and effectiveness of the Danube is hardly calculable due to external influences like flood, low water and icing.
SWOT‐Analysis Project [ChemLog]
Project Partner: AUSTRIA Page 28/47
Therefore this mode of transportation is not suitable for time critical cargo. Furthermore modern unloading facilities within ports in CEE countries are missing (e.g. roofed terminals). In terms of hazardous goods, dedicated transports are necessary although availability of vessels is sometimes not given. Low outbound volumes signify low utilization, which makes the inland waterway less competitive.
5.5 STRENGTHS IN PLANNING AND CONTROLLING
Accuracy and reliability in Demand and Supply Planning or Forecasting with customers is according to experts’ view rarely realizable. The sector is affected by the necessity to act and react flexibly to plan production, distribution, procurement of raw materials and inventory levels.
5.6 STRENGTHS IN ORDER PROCESSING
Companies see their strengths in a standardized and stable order process.
5.7 STRENGTHS IN INFORMATION LOGISTICS
PPS‐Systems are uses for production planning in order to maximize productivity and adherence to delivery schedules as well as to minimize cleaning and set‐up times. In many companies software to manage the Supply Chain is in use. ERP and MRP systems are in action for order processing, procurement, production, inventory and transport.
In order to gain representative results for opportunities and threats expert workshops were organized during the Regional Stakeholder Meetings. The main objective was to get as much information as possible about external non influenceable opportunities and chances for chemical logistics in Central and Eastern Europe? Representatives of the chemical industry, logistic service providers as well as experts from other stakeholder groups attended the workshops.

SWOT‐Analysis Project [ChemLog]
Project Partner: AUSTRIA Page 29/47
6 EXTERNAL OPPORTUNITIES, CHANCES AND RISKS FOR CHEMICAL LOGISTICS IN
CENTRAL AND EASTERN EUROPE
6.1 ECONOMIC TRENDS
Internationalization of selling markets
The majority of experts feel that the internationalization of sourcing markets poses a chance for the chemical industry in total, whereas the opinions in terms of selling markets were differentiated. Consequently this leads to an enlargement of the supply chain as well as to longer transportation distances. The sourcing of energy is put on regional suppliers, but only with limitations. Many experts think that the internationalization of sourcing markets is a huge chance for the logistic sector. From the sales point of view the internationalization of selling markets leads to higher product variety.
The current economic situation is vastly difficult for the chemical industry, but should rather be regarded as chance and not as a threat. According to experts’ opinions and based on experiences in the sectors of bulk, fine and speciality chemicals, German companies examine the economical crisis more critical than Austrian chemical companies. An increasing replacement of production sites has been remarked within the last years, although experts are not sure how long this tendency will proceed in that intensity as labour costs in Eastern Europe are expected to increase further on. In Far East both labour costs and quality of chemical products are low. Event though experts predict that quality will adjust to European level within the next few years. Quality awareness stays a question of mentality.
Intensified competition / global cost pressure
Necessarily representative of the chemical industry mean, that intensified competition and as a consequent higher cost pressure is seen as an opportunity. The competition is vital for innovations and new distribution canals. Although there is a risky situation as European chemical companies have a comparative price and feedstock disadvantage in some products and their derivatives (e.g. Olefins) and are facing an upcoming wave of petrochemical capacity additions, especially in Middle East. In terms of logistics intensified competition secures similar basic conditions. Some experts remark an augmenting shake‐out or market adjustment partly traced back to the economical crisis. Nevertheless a clear market position nowadays plays an important role.
Individualization of products and services
Individualization of products and services is a must especially within the fine chemical sector. For the basic chemicals sector individualization is seen as a neutral factor, although special markets demand individualized products and services. For the mentioned sector this factor could be seen as opportunity as long as the customers are prepared to pay. From the logistical point of view small and medium companies are optimistic to the potential of value‐added services which is not fully tapped yet, especially in the field of infrastructure. The customer is the pushing factor and oftentimes value‐added services in the field of logistics are seen as a must.
SWOT‐Analysis Project [ChemLog]
Project Partner: AUSTRIA Page 30/47
Adjustment of Eastern European wage‐level to Central European’s level
Labour costs in the EU chemical industry are high in a world‐wide context with high differences within EU 27, although ULC levels in the EU are competitive with most countries.16 Due to the adjustment of the Eastern European wage‐level to Central European level, experts feel that Austria companies will be more competitive due to educational level as there will be less focus on staff costs. The challenge is to hand that higher costs on to the customer. In terms of logistics Austrian companies benefit from the lower wage‐level in Eastern Europe as in the future the mentioned trend will result in higher logistic costs. Actually rail prices are advantageous and partially that can be lead back to a low wage‐level in Eastern Europe. On the other hand logistic experts possibly expect an opportunity especially for freight management due to the pullback of business to Austria.
Regional development of production and labour costs compared to CEE
Most of the experts regard that future development as neutral whereas the remaining part of the workshop group tends to see it as advantageous. Reason for that shall be a predicted price in production costs in CEE. Although Austria does not possess own energy or raw material sources, experts expect an increase in taxation in terms of environment (carbon dioxide emissions). Anyway the opinions agree on leveling. Trade restrictions to EU 27 and the reduction in demand for fertilizer are further mentioned as risks for the chemical industry or respectively for chemical logistics.
Currently international acting companies rather disregard a regional or local economic development – focusing on the domestic or regional economy will take some time.
Change of image of the chemical industry
Associations of the different countries have started campaigns in order to create chemical companies more open, especially in terms of environment, climate protection as well as regarding sustainability, safety and security. In general the focus is put on restructuring and redesign of the communication policy and public relations. Main objective is to re‐experience the chemical industry, like “living chemical industry”.
Trend towards smaller production lots
In the course of this trend, the dose rates are increased significantly in order to reduce the production lots, especially within the pharmaceutical industry. Thereby a more valuable effect is achieved as well as lead to higher requirements regarding quality.
Partners with competences in R&D
Customers tend towards partners with well‐developed strengths in the field of Research and Development in order to gain and keep strategic partnerships. During time periods of economic boom this step is easier as strategic co operations in R&D come along with high investments.
16 ULC – Unit Labor Costs, Productivity and International Competitiveness, RuG 2005.

SWOT‐Analysis Project [ChemLog]
Project Partner: AUSTRIA Page 31/47
Think global, act global
Centralization of decision makers within corporate groups poses a threat; therefore companies tend to form smaller decision‐making units. Austrian companies benefit from a large integrated European market with continued strategic restructuring efforts to adapt flexibly to globalized markets and high international orientation and global network to external customer industries.
6.2 SOCIOCULTURAL TRENDS Demographic change in CEE
The opinions regarding the influence of the demographic change in CEE are divided as 50% see that development neutral and the other part of the group expect disadvantageous impacts on the chemical industry.
Availability of human resources in the field of logistics
The availability of human resources in the field of logistics is a risky factor as a lag of employees both in the operative and strategic field is expected. In Austria it is increasingly difficult to find qualified staff in the field of chemistry as well. Few companies have the possibility to stay optimistic, as they have a well‐performing internal education system.
Skills of employees in the field of logistics (professional, social and intercultural)
The experts’ opinions regarding the skills of employees in the field of logistics in terms of professional, social and intercultural qualifications are widespread and seen both as a risk and as chance. Although intercultural competence is an important factor, it should not be overestimated.
Public image of the chemical industry
As there have been a lot of measures and actions in order to put the chemical industry in a sustainable picture (more “green”, responsible care, etc.), experts see a chance to position the chemical industry as a sustainable and secure workplace. For other experts this trend is not visible and has a neutral degree of influence.
Transition to flexible working hours
Concordantly the transition to flexible working hours is seen an opportunity.
International mobility of workplaces
Rather expected as threat.

SWOT‐Analysis Project [ChemLog]
Project Partner: AUSTRIA Page 32/47
6.3 TECHNOLOGICAL TRENDS Technology as core competence
Competence in R&D as well as in production and process technology are seen as huge chance for the chemical industry. Customer‐specific applications come to the fore. Strong innovation efforts will generate new growth clusters: Biotechnology, Renewable feedstock, efficient energy use, health and new materials (e.g. nanomaterials) which have the capability to solve upcoming societal mega challenges.
Information and Communication Technologies
Information and Communication Technologies definitively come along with the opportunity realize standardization along the whole Supply Chain, whereas the potential yet can not be fully tapped as long as the interfaces do not work properly. Standardization also concerns accompanying documents in terms of language and symbols. Furthermore from the logistical point of view Information and Communication Technologies can be a competitive value‐added service.
Innovations in transport, cargo handling and warehousing
Innovations in transportation, cargo handling and warehousing should lead to standardization of infrastructure, vehicles and handling technologies resulting in cost reductions and increase of quality and safety. Especially when talking about cargo securing uniform types of vehicles with fixed platform gates is seen as a huge opportunity. Innovations are further awaited for terminal infrastructure, warehousing, handling and in order to achieve process security and reduce leakage (video control at cross‐docking‐areas and especially mentioned by the pharmaceutical industry). With dissentient vote consent this trend is seen as competitive factor, being.
Screening of Technologies
It is highly important for chemical companies to develop a technology‐portfolio for production and process technologies. In that context the employees play a major role in order to create customer‐oriented solutions.
6.4 ENVIRONMENT AND ENERGY Climate change especially carbon dioxide emissions
This factor means a real threat for the chemical industry as according to the experts’ opinions it results in a distortion of competition. Furthermore the real impact and the prospective possibilities of chemical companies to react on that development can not be determined now. At the same time the climate change provides numerous chances for companies and new potentials as well as opportunities to go into collaborations.
SWOT‐Analysis Project [ChemLog]
Project Partner: AUSTRIA Page 33/47
Availability of non‐renewable energy sources
Due to the fact that non‐renewable energy sources are the main resources and raw materials for the chemical industry this development is a threatening challenge. Gas and oil has to be imported in Austria – respectively in EU – as Europe is neither a strong gas nor oil producer. The security of supply is crucial for a competitive domestic chemical industry. Other countries (Middle East, Russia, India, Brasil, etc.) have preferential access to these energy sources. Prices are lower than in Europe and additionally unfair commercial practices take place (e.g. double pricing). There is a huge threat of closing down or capacity changes of production units in Europe due to a lack of access to energy feedstocks.
Availability to renewable energy sources
Having no significant influence of the chemical logistics, the availability of renewable energy sources poses a chance for sectors within the chemical industry focussing on the exploitation and manufacture of for example biomass, biogas, bio‐lubricants, agro‐materials, bio‐polymers or bio‐fuels etc.
Internalising an externality
The increase in road transport of cargo has decoupled from economic growth for the last years. Only a small part of the caused external costs for infrastructure is paid by the road traffic. The costs will augment disproportionately with the increase of road traffic. Only 56% of all external costs are actually covered by congestion charges.17 This ‐ combined with the fact that there are congestion charges for railway too – leads to a distortion of competition of means of transportation. Doubtless for the logistics internalising an externality means a disadvantageous development.
Energy costs
Actually experts do not see any threat caused by energy costs. Due to expected sharp increases in energy expenses in the future, this development is highly risky for the chemical industry, as an energy‐intensive industry sector. Primary this factor is a danger for the chemical industry, but at the same time as far as possible the sector can detect and benefit from new alternatives. Doubtless energy markets have a “quasi” oligopolistic organization with much too high energy cost for consumers and industry.
6.5 POLITICS AND INNOVATION International harmonization of transport and traffic related laws and regulations
Especially within international corporate groups the cross‐border harmonization of transport and traffic related laws and regulations within Central and Eastern Europe is a huge topic and according to the experts’ views overdue long ago – also in terms of equal opportunities. In particular this concern affects regulations for hazardous goods and safety and security. From the Eastern European Experts’ point of view this development is seen as a threat.
17 cp. VCÖ (LKW‐Maut auf allen Straßen – Daten und Faktoren 2006).

SWOT‐Analysis Project [ChemLog]
Project Partner: AUSTRIA Page 34/47
Prioritization of traffic infrastructure issues within the political programs
Partially neutral and positive were mentions of the experts relating the prioritization traffic infrastructure projects within the political programs as traffic come along with economic development. Focus should be on international coordinated projects, for instance the highway connection Austria – Slovakia. A challenge is to consider each country‐specific interests and requirement.
Financing of traffic infrastructure projects
The opinions regarding financing of traffic infrastructure projects in Austria differ massively. The experts claim on the one hand the lack of logistic competence within the ministry of transport, party political influence as well as the insufficient transparency and inefficient use of the existing infrastructure. On the other hand there are many chances for improvement within the political system.
Infrastructure employment costs (costs of usage)
Although congestion charges are vital for financing infrastructure projects, for the competitiveness of the Austrian business location in an international context, this development is disadvantageous.
Cross‐border capacity planning of traffic infrastructure across‐the‐carriers
This factor is seen as a huge change, but demands an international collection of freight volume.
Policy on financial subsidies in the field of traffic and transportation
When discussing about the policy on financial subsidies in the field of traffic and transportation, the experts did not strike an agreement if this poses a threat or a chance. Especially for traffic infrastructure and carriers, rail and inland waterway the experts expect a reasonable use of financial subsidies. The support of commercial zones without railway siding is hardly criticized, as the opportunity to move to alternative means of transport is prevented. For the dedication of financial subsidies a superior authority is requested. Some experts think that the competition shall regulated by itself.

SWOT‐Analysis Project [ChemLog]
Project Partner: AUSTRIA Page 35/47
6.6 TRANSPORT INFRASTRUCTURE
6.6.1 RAILWAY Location and structure of the railway system
The majority of the experts agree on an insufficient and suboptimal situation of the railway infrastructure in Central and Eastern Europe. There is no budget for investments into the railway network, which has been shrinking for the last years. Especially in the southern part of Eastern Europe the conditions are dramatic as the state railroad went nearly bankruptcy, the equipment is in terms of quality and availability beneath contempt and the price policy is disastrous so that further shifting of freight volume to road is done. Furthermore for the whole region the experts claim inadequate interfaces, lack of integration of road into the planning of railway terminals, no mutual intermodal project activities between road and rail, obsolete equipment, suboptimal schedules and in total an inefficient process of transportation by rail. Experts suppose a potential to use the existing railway network more efficient through the optimal design of handling nodes. In addition the liberalization of the railway transport is seen as a very positive development in terms of service quality and prices due to intensified competition.
Location of terminals
The location of railway terminals is currently evaluated as a threat for chemical industry or respectively for chemical logistics. In particular within the Vienna Region, there is no adequate Terminal. The accessibility of railway terminals is a problem too.
Availability and capacity of railway wagons
Troubles in availability arise especially at ad‐hoc or individual transports, whereas the longer the planning horizon, the better the availability (in particular for block trains). Tank wagons are mainly booked at private railway transport operators. The quality differs, depending on the origin country. Problematic is the sourcing of special equipment or wagons. So the experts’ opinions about the mentioned factor were both neutral and risky.
Capacity and efficiency of terminals
The views regarding the capacity and efficiency of terminals differ: most of the experts think that the terminals are not the bottlenecks within the logistical processes. A minority feels that the capacity and efficiency of terminals are a threat for chemical logistics in Central and Eastern Europe.
Access to terminals
General this factor poses a risk with low influence. Especially mentioned as infrastructural bottleneck are the ports of Vienna and Krems. Krems for instance does not have an access for hazardous goods.

SWOT‐Analysis Project [ChemLog]
Project Partner: AUSTRIA Page 36/47
State‐owned railway systems
Private railway transport operators are well‐situated in Austria and are quite competitive due to the public price policy. Although the price policy of the state‐owned railway system is seen as a threat due to the quasi‐monopoly and non‐transparent situation, numerous experts think that the market is self‐regulating and that there will be further shake‐out in the future. Especially logistic service providers benefit from a liberalized market of railway operators.
Interoperability – international standards
Main problem of railway transportation in Central and Eastern Europe is that rail systems are not compatible, meaning that there are changes of tracks, country‐specific security regulations and isolated systems. In general there is a lack of harmonization of admin, technical and social standards. Experts feel that in some cases interoperable systems are created to protect own structures and to keep proportion of power. Harmonization is expected and a huge chance for all parties within the supply chain.
Multimodality
Experts evaluate a well‐developed and accepted basic railway infrastructure with the potential for improvement within the processes itself. Due to restructuring of the railway network the last mile is lengthened.
6.6.2 WATERWAY Location and structure of the waterway network
Generally the location and structure of waterway network in Austria can not be influenced and is limited to the Danube.
Location of inland ports
Austrian ports are well‐located and strategically well‐positioned as well as in Central and Eastern Europe there is a high density of ports although private ports can not be used by third parties.
Capacity and efficiency of waterway
In order to use the waterway transportation alongside the Danube efficiently, it is essential to improve the navigability by attenuate the ice, flood and low water problems and to eliminate shoals. Due to natural regions alongside the Danube this projects are only partly realizable and therefore to keep the status‐quo poses a threat due to the ongoing dependency on exogenous factors. For the port of Constanta it is planned to establish a container line with pre‐ and post‐carriage via the Danube additionally to full‐container loads. Furthermore there is a lack of pairing between imports and exports.

SWOT‐Analysis Project [ChemLog]
Project Partner: AUSTRIA Page 37/47
Access to ports
The opinions whether the access to ports in Austria is a chance or a threat highly differ. Linz was mentioned as a negative example due to the lack of connections to the traffic and transport infrastructure. In some cases ports and terminals are closes on weekend meaning a significant problem.
Availability and capacity of water vessels
The actual equipment of the water vessels is obsolete and there is a lack of reinvestments and expansion.
6.6.3 ROAD Location and structure of the road network
Generally the infrastructure of road transportation is improvable in terms of quality and quantity.
Capacity and efficiency of trunk roads and motorways
This factor is neither seen as chance nor as a threat. Experts see chances through the intelligent control of traffic, meaning for example to abolish the ban on driving in nights and on holiday in order to regulate the density of traffic or to lower congestion charges within determined time frames to dislocate the traffic.
Development of increase in road toll
Different systems and evaluation methods in Central and Eastern Europe in terms of road toll lead to imbalance in international competition. Experts think that an increase in road tolls is positive on condition that the money is used for investments in infrastructure.
6.6.4 INTERMODAL Location, structure and capacity of intermodal nodes
Generally big terminals at strategic important nodes exist, although there is a lack of decentralized terminals area‐wide. The handling technologies indeed are well‐developed in the bigger terminals, but coverage of decentralized regions is quite difficult due to insufficient compatibility and inflexibility of system components. Furthermore there is a lack of comprehensive national and international concepts.
6.6.5 PIPELINE Location and structure of the pipeline network
Actually there is a highly discussed project to develop a gas pipeline connection called “Nabucco‐Pipeline” from Turkey to Austria supplying the central OMV distribution centre. The main objective of this project is to diversify the gas supply within the European Union especially to reduce the dependency of the main supplier Gazprom. Generally the as‐it‐is

SWOT‐Analysis Project [ChemLog]
Project Partner: AUSTRIA Page 38/47
situation of the pipeline network is seen as a threat, mainly due to the mentioned lack of well‐developed structure.
Capacity and efficiency of pipeline network
Capacities of the pipelines are evaluated as marginal but in general the situation poses neither a threat nor a chance. There is an expansion of the pipeline network in Austria and Hungary, although that factor is not necessarily an Austrian topic.
6.7 SAFETY AND SECURITY International safety standards
Experts think that safety and security is over‐regulated in Austria and poses therefore a threat. A further intensification of safety and security standards on an international level is expected by the experts.
Tracking & Tracing of cargo
Tracking and Tracing due to experts’ opinions does not exist in fact (only via mobile phone).
6.8 INDUSTRY SECTOR AND COMPETITION
6.8.1 CUSTOMERS Degree of concentration
The majority of the experts think that the current high degree of concentration within the different purchasing sectors poses a threat for the producers within the chemical industry. Especially the augmenting development of industrial parks amongst the customers puts pressure on the producers.
Level of product standardisation
There is a high level of product standardization which leads consequently to a replaceability of suppliers on the one hand. Higher purchasing power, reduction of raw materials and lower production costs can pose chances for the chemical industry on the other hand.
Relevance and importance of the industry sector for the customers
Due to a high diversity of consumer sectors the chemical industry perceives itself as highly important.
Collaborations among customers
Collaborations among customers are seen as risky for the experts of the chemical industry in particular regarding co operations to gain purchasing power.

SWOT‐Analysis Project [ChemLog]
Project Partner: AUSTRIA Page 39/47
6.8.2 SUPPLIERS Degree of concentration
Within the suppliers the experts of the chemical industry evaluate the degree of concentration as significant high, whereas this is seen as a threatening situation.
Level of product standardisation
A high level of product standardization at suppliers is highly requested by the chemical industry, as different compositions unavoidably lead to a change or a reorientation of supplying sources. A further possibility could be a higher level of standardization in terms of packaging.
Collaborations among suppliers
Collaborations among suppliers are rare and uncommon. If this situation changed and suppliers focussed more on collaborations, the experts of the chemical industry would evaluate that trend as a risk.
6.8.3 ACCESS TO THE MARKET
Access to markets and a global level playing field are prerequisites for fair and beneficial competition.
Economies of scale
Economies of scale, especially regarding chemical logistics exist and are manifested in higher transportation lots and in general seen as a positive development.
Product differentiation
Low level of product differentiation is posing a threat for the domestic chemical industry.
Brand identity
In all sectors of the chemical industry there is an intensive brand identity, whereas the domestic producers evaluate this factor as neutral and logistic service providers as promising. Especially within the basic chemicals the necessity of brands is questioned critically.
Access to channels of distribution
From the industrial experts point of view the access to channels of distribution is well‐developed.
SWOT‐Analysis Project [ChemLog]
Project Partner: AUSTRIA Page 40/47
Competition
Weaker growth prospects for exports to overseas and much stronger import penetration from polymers and specialities threaten the domestic market. In particular new competitors from Asia are arising. Experts think that companies within the European market can remain an attractive platform for a competitive chemical industry and benefit from growth markets around the world, providing that a balanced regulatory framework in Europe, free access to growing markets, fair competition as a stimulator for further growth and a global level playing field are secured.
SWOT‐Analysis Project [ChemLog]
Project Partner: AUSTRIA Page 41/47
7 NEEDS FOR FUTURE ACTION AND IMPROVEMENTS ‐ CONCLUSION
What are the articulated needs of chemical enterprises and logistic providers for future action to improve framework conditions for chemical logistics in Central and Eastern Europe?
7.1 NEED FOR FUTURE ACTIONS AND IMPROVEMENTS – FROM THE LOGISTICAL POINT OF VIEW
Globalization of logistics: Act and React
The internationalization of business, for example Global Sourcing, the deployment of production and the international division of labour, causes greater distances, an increase in transport volumes and in the number of transports. Under consideration of changing flows of traffic multimodal transport solutions will gain in importance. Decelerating vertical range of manufacturing in western industry countries as well as displacing core competences effect an escalation of intercontinental oversea container transports.
The intensified interdependencies between western industry countries and the Asian market enable novel, innovative and global logistic concepts, which are essential to deal with rising complexity in supply chain networks. Thus, the importance of the discipline of logistics and the demand for experts will go up continuously. Logistics provides potential for rationalization and consequently for reduction of inventory respectively for effective management and bundling of transports and thereby non‐productive return shipments can be diminished.
Innovative network structures and logistical co operations to achieve excellence on both sides
Concentration tendency in markets serves as an important driver for strategic competitiveness, especially in logistics. A growing number of partners and locations lead to increasing complexity within supply chain networks. Thereby the challenge is to connect actors and process in both counts of physical and informational matching. Logistical collaborations predominantly centre on classical and basic functions: procurement and distribution. To ensure successful and sustainable vertical partnerships between logistic service providers and their customers the coverage of the whole range of services is preconditioned. Horizontal co‐ operation opens up new chances when structuring international logistics and supply chain networks and generating synergies especially in freight management, inventory management as well as in information and communication technologies.
Cooperative contacts and networks are important although not every cooperation project is profitable. Intentions to cooperate with high investment effort are only recommendable if there is a strategic benefit for the company. Investing time and resources into collaborations with customers or suppliers in order to drive innovation and differentiate services should pay‐off and create value for all involved companies.

SWOT‐Analysis Project [ChemLog]
Project Partner: AUSTRIA Page 42/47
In terms of logistics reduction of costs and tied‐up capital on both sides by decreasing inventories, reduction of transportation costs and storage costs can be achieved. In addition more effective and efficient processes through reduction of order cycle time, lead time and increase of delivery performance create shared success. Taking out non‐value added activities on both sides like the decline in errors or the reduction of production change over and additional set‐ups pose objectives of a logistic cooperation. Short‐term improvement projects regarding transport and distribution could be the consolidation of shipments on selected products and destinations or the increase of direct shipments in order to reduce shipping, transportation and inventory costs.
To create processes more efficient in the fields of order processing and demand or supply planning better coordination between supplier and customer could lead to a diminishment of lead times and the reduction of safety stocks by collaborative forecasting. More intensive cooperation can be found in strategic product development, joint optimization of product portfolio or collaborative projects on process innovations. For sure trust and openness between partners is the key success factor to build reliable supply chain and logistic chances.
Companies have to face rising demand for superior logistic services
Rising customer requirements for best‐in‐class logistic services and demanded continuous improvement challenge providers within globalized markets. Few fixed capital guarantees flexibility in designing transnational logistics processes. Flexible network structures are increasingly the key factor in dynamic markets. In order to ensure product availability worldwide at customer‐defined conditions, enterprises are challenged to optimize their logistical concepts. This is essential to meet high requirements on flexibility due to necessary short‐term reaction on customer orders, smallish order sizes and decreasing acceptance for delivery failures or delays. The challenges cause adjustments of logistics strategies and have to be orientated towards the following competitive factors:
Customer service: The modern meaning of logistics takes up the position that the customer is the central point of all entrepreneurial activities. For this reason logistics is the ideal initial point for customer‐binding measures and the generation of competitive advantages. Customer‐oriented logistical measures do not have to be attended necessarily by customer‐specific design of logistics concepts; product‐supporting services can generate customer value too.
Delivery performance: Rising quality requirements regarding delivery performance as well as the continuous optimization of logistic costs bring out a conflict of objective. Demanded superior logistic services, shorter periods to response on customers’ requirements and other changes within the supply chain pose difficult challenges for companies. Kröber summarizes as follows: “If product attribute and price does not differ significantly, logistic service will be the decisive purchase criterion as the customer will probably choose that product which is available for adequate conditions. In this case delivery time and reliability are the major competitive factors, crucial for the strategic success of the company.”

SWOT‐Analysis Project [ChemLog]
Project Partner: AUSTRIA Page 43/47
In each field (B2B, B2C, etc.) customers require the personal and institutional perception of responsibility. This involves a new significance of the role of logistic service providers, evolving from typical task fulfillment to innovative and creative designing within a reliable partnership.
Companies are challenged by growing demand for customized logistics solutions
Standardization and Optimization within the management of customers and networks will be determining challenges for logistical processes as at the same time enterprises and logistic service providers have to meet requirements which apply specifically to a concrete problem, sector or customer (“standardized individuality”). Logistic solutions “ready‐made” will not be viable in the future: all the more customized and efficient concepts focused on the customers’ topics represent important success factors for companies to differ from competing companies.
Furthermore the well directed application of logistics technology systems focused on customer‐oriented product and service specifications will be indispensable. Complexity and cost pressure come second to robustness and security in supply chain management as concepts for stockless or low inventory (in times of uncertainty and risks in a worldwide turbulent environment) have to be reconsidered and new optima have to be defined. A return to a European‐wide strengthened networking can not be excluded.
Optimization of logistical processes as the key for cost reduction and transparency
A significantly important objective of logistics is the reduction of costs through optimization of the total system, especially of operational activities which come along with increasing market performance. The growing range of tasks would in fact lead to an increasing share of logistic costs on overall costs, although costs can be further reduced continuously by process optimization. The development of intelligent logistic solutions in mind with the efficient design of operational sequences enables companies to continue cost reduction. Freight costs optimization have high influence, which can be realized by optimizing the payload, re‐evaluate the distance to customers and the transportation mode as well as optimize the freight tariff. Process monitoring and ‐controlling with Supply Chain Event Management Systems highly create competitive advantages. Outsourcing can pose a chance to optimize logistical processes too and therefore stays attractive for companies, even though motives for industry and retail are changing. In addition to required concentration on core competences, cost and quality aspects are centred. Single‐sourcing strategies will gain importance in this context.
Companies shall be prepared for accumulated and intensified safety regulations
Accumulated safety regulations in global trade increase the complexity for logistic processes. Examples would be: (1) long waiting periods in already overloaded entrance ports, hence resulting in (2) demurrage costs for containers, incalculable turn‐around times as well as (3) incomplete information availability and (4) an additional expenditure at administration and handling. Those parameters often entail unpredictable indirect costs and aspects of quality.
SWOT‐Analysis Project [ChemLog]
Project Partner: AUSTRIA Page 44/47
The examination of „Worst Case “‐ scenarios allows to maintain the stability and operability of the supply chain and applies beside flexible processes and structures as a success criterion. A substantial contribution to increase attack security in supply chains is carried out by the information and communication technologies. In container traffic technologies like RFID, GPS and Smart Container enable consistent transmission pursuit and the identification of deviations and potential dangers. In the scope of sensor engineering the electronic seal is a possibility for the recording of incidents; the market penetration is inhibited because of the lack of standardization. The topic security in global supply chains does not require only the operational, but likewise the strategic viewpoint of all elements and parties, in particular the focus has to be put on the weakest member link in the chain. Due to the strategic importance and in the sense of prevention and response it is essential to place this topic on the level of management.
Rising importance of intelligent information and communication technologies in the field of logistics
The technological progress opens up new ways for process innovations within the logistical field. A possible and potential solution instrument for many logistics‐relevant, in particular traffic related problems, is the Information and Communications Technology (ICT). Experts assume that in the future many vehicles will be equipped with Information and Communications Technology interfaces resulting in an eased implementation of additional options (e.g. improvement of the extent of utilization of the vehicles). Beyond that the future vehicles are interlaced and equipped with just‐in‐time (JIT) information services. The customers will call for transparency and information availability at any time in the supply chain; fulfilling this customer demands will also be a competitive advantage for the companies. By the use of information and communication technologies as well as the integration of internet‐based solutions, the speed and transparency can be ensured to enable cross‐company planning and the control of complex logistics chains. To cope with the complexity of the supply chain and to integrate the partners and the processes of global cooperative networks and logistic operational sequences of international enterprise activities, intelligent information systems were required. In logistics research in the field of self‐monitoring is needed, namely the tracking of goods during the transport by systems reacting in case of deviations.
Increasing requirements for the logistics staff
The global dimension of the flows of goods and information leads to higher and differentiated requirements to the logistics personnel. Apart from the cross‐cultural competence special attention has to be put on the cooperative strategy, plan and target setting. Further the technological requirements will rise notably. To handle the complexity of logistics solutions in accordance with the requirements of the economy and the customers, technical and overall know‐how, cross‐company cerebration and acting as well as soft skills are necessarily. In the future on average better skilled qualified employees will operate in the logistics industry. Expert related further education in companies will become more important und amplifies the innovation in the range of logistics.

SWOT‐Analysis Project [ChemLog]
Project Partner: AUSTRIA Page 45/47
Sustainable management of logistic systems
The consequences of a rising environmental sensitivity of the population for logistics should not be underestimated: increasing aversion against road transport could force companies to rearrange their transport‐intensive delivery chains and change over to the carriers’ rail and inland‐water way or sea. However, this could not be the only reason for a restructuring of logistics. Today the cost analysis concentrates only on the indirect traceable costs, for example warehousing, transport and inventory costs. To a lesser extent considered are environmental costs caused by logistic activities. Because of the still missing methodical agreement of calculating the external costs and the lack of political willingness to internalize those, these costs and the resulting macroeconomic adversity can not be assigned to logistics. In the future, the stronger environmental adjustment of the society, for example the regionalization of the transportation flows, will possible causes a decrease of transportation volumes. Undisputable is the fact that because of new legal requirements to reduce emissions and to save resources additional tasks to the supply chain management will be assigned. This requires detailed knowledge of the entire value chain, since each part can directly or indirectly generate or avoid emissions. The management itself has to act in line with long‐term goals and to ensure the sustainable use of the potentials for success, not for short term profit maximization.
Integration of logistics in the business strategy
Referring to the companies the above listed and discussed opportunities and threats require a strategic view of the logistics‐relevant challenges. The logistics strategies and targets have to be integrated in the strategic plan and system of objectives of the companies. Continuous changes and re‐orientations within the logistic processes as well as global economic dynamics require both a company‐wide and cross‐company oriented approach and also flexible processes and structures.
7.2 NEED FOR FUTURE ACTIONS AND IMPROVEMENTS – IN TERMS OF POLITICS, TRANSPORTATION AND INFRASTRUCTURE
According to the experts’ opinions, traffic and transport infrastructure are of prime importance for the successful future of the chemical industry and especially for chemical logistics. The transport policy should place the centre of attention on an integrated, long‐term and legislation‐period‐overlapping approach. The main objective is to develop an optimized global traffic system. Challenges of the complex traffic system can only be met through the all‐embracing consideration of the relevant political sub areas and by taking the mutual consequences into account. By the means of an integrated transport policy rational, coherent and sustainable goals are pursued. In order to reach the political objectives in terms of multimodality, the conditions have to be adjusted to the requirements of the economy. Main target is the optimization of the quality along the whole multimodal supply chain. Depending on economical demand and geographical location the expansion and customization of neutral bimodal and trimodal terminals shall be forced.

SWOT‐Analysis Project [ChemLog]
Project Partner: AUSTRIA Page 46/47
Improved assurance of areas to expand infrastructure and the transparent land‐use planning procedure along high‐ranking infrastructures can be ensured by mutual commitment, reconcilement of interests and long‐term planning and financing reliability. Every measure to increase capacity and efficiency of infrastructure shall be coordinated both with traffic and land‐use planning issues. This recommendation accompanies the request for analysis of existing, planned and needed infrastructure – a comparison of estimated demand and existing capacity – as a basis for infrastructure building projects or to improve efficiency in operating. Through traffic control measures the degree of utilization of transport infrastructure can be enhanced. Further possibilities to guarantee the efficiency of traffic systems are innovative instruments of use optimization: for example timely different and demand‐reliant pricing of the infrastructure as well as intelligent traffic control depending on capacity utilization are able to optimize the degree of efficiency and to prevent or reduce time of congestion and loss. Thereby self‐organizing effects are stimulated.
o Long‐term, rational and sustainable‐oriented transport policy o Institutionalization of an integrated planning of traffic infrastructure and land‐
use o Infrastructure analysis creates a transparent basis for decisions to increase
efficiency and utility and/or to expand transport infrastructure. o Efficient use of infrastructure by mileage‐related charges and intelligent control o Increase in efficiency of cargo handling between the transport modes and the
capacities of cargo terminals o Standardization of legislation within the sectors of traffic and land‐use planning o Standards for traffic planning and control throughout the European Union o Intensified utilization of Information and Communication Technologies (ICT) in
the area of multimodality
7.3 NEED FOR FUTURE ACTIONS AND IMPROVEMENTS – FROM THE ECOLOGICAL POINT OF
VIEW o Strategic orientation of the environment and energy policy regarding a
sustainable development o Support of research and utilization of alternative energy sources o Provision of neutral terms of competition by European‐wide harmonization of
the taxation of energy considering prior performance
SWOT‐Analysis Project [ChemLog]
Project Partner: AUSTRIA Page 47/47
8 LITERATURE
8.1 STUDIES AND STATISTICS USED BMVBS [Entwicklung des Güterverkehrs 2007] BMVBS – Bundesministerium für Verkehr, Bau und Stadtentwicklung: Abschätzung der langfristigen Entwicklung des Güterverkehrs in Deutschland bis 2050 – Schlussbericht, Basel 2007. BMVIT [Generalverkehrsplan 2002] BMVIT – Bundesministerium für Verkehr, Innovation und Technologie: Generalverkehrsplan Österreich 2002, Wien 2002. URL: http://www.bmvit.gv.at/verkehr/gesamtverkehr/generalverkehrsplanung/downloads/gvk.pdf
BMVIT [Halbzeitbilanz Verkehrsweißbuch 2006] BMVIT – Bundesministerium für Verkehr, Innovation und Technologie: Die Halbzeitbilanz der EU Kommission zum Verkehrsweißbuch von 2001‐ Information für die Sektionsleitung; eine Analyse, Abteilung II/GV – Gesamtverkehr und Infrastrukturfinanzierung, Wien 2006. BMVIT [Verkehr in Zahlen 2007] BMVIT – Bundesministerium für Verkehr, Innovation und Technologie: Verkehr in Zahlen – Ausgabe 2007, Wien 2007. URL: http://www.bmvit.gv.at/verkehr/gesamtverkehr/statistik/downloads/viz07gesamt.pdf
FCIO [Jahresbericht 2008] FCIO – Fachverband der Chemischen Industrie: Jahresbericht der chemischen Industrie 2008, Wien 2008. URL: http://www.fcio.at/uploads/Jahresbericht_FCIO_2008_FINAL_128457_DE.pdf
ÖAMTC Akademie [Mobilität 2015/2030 2007] ÖAMTC Akademie: Mobilität 2015/2030 – Potentiale für eine nachhaltige Entwicklung, Band 5 der ÖAMTC Akademie Schriftenreihe, Wien 2007. Puwein [Energieverteuerung 2006] Puwein, W.: Langfristige Auswirkungen einer Energieverteuerung auf den Verkehr, WIFO Monatsberichte 10/2006, Wien 2006. Statistik Austria [Verkehrsstatistik 2007] Statistik Austria: Österreichische Verkehrsstatistik 2007, Wien 2009 URL: http://www.statistik.at/web_de/dynamic/services/publikationen/14/publdetail?id=14&listid=14&detail=510

SWOT‐Analysis Project [ChemLog]
Project Partner: AUSTRIA Page 48/47
Schneider/Brunner/Lengauer/Koller [Chemische Industrie 2008]
Schneider, H.W. / Brunner, Ph. / Lengauer, S.D. / Koller, W.: Die Chemische Industrie Österreichs – eine detaillierte Branchenuntersuchung, Wien 2008.
URL: http://www.fcio.at/uploads/studie_21022008_127596_DE.pdf
Further sources:
Statistik Austria: Leistungs‐ und Strukturstatistik 2000‐2006
8.2 LIST OF EXPERTS
Rene Abpfolter LogServ ‐ Logistikservice GmbH
Mag.(FH) Gerald Aschauer FH OÖ Forschungs & Entwicklungs GmbH
Thomas Czapek EHG Ennshafen GmbH
Mag. Hans‐Christian Graf FH OÖ Forschungs & Entwicklungs GmbH
Andreas Hartl Panta Rhei (PR) Befrachtungs und Spedition GmbH
Alfred Heiserer Via Donau ‐ Österreichische Wasserstraßen Gesellschaft mbH Hofrat Univ. Doz. DI Dr. Leonhard Höfler Amt der Oberösterreichischen Landesregierung
Mag.(FH) Hannelore Hofmann‐Prokopczyk FH OÖ Forschungs & Entwicklungs GmbH
Dr. Klaus Hofstadler Borealis
Volodymyr Klimov Danube Shipping Management Service GmbH (DSMS)
Wilfried Lehmbacher Sandoz GmbH
Mag.(FH) Heidelinde Luksch Nufarm GmbH & Co KG
Mag. Oliver Mayr Verein Netzwerk Logistik
DI Ernst Meijnders Sandoz GmbH
Ladislav Novak Association of Chemical Industry of the Czech Republic
Miran Petrinja Luka Koper, d.d
Dr. Andrea Pollak Expert
Franz Riegler Dachser Austria
Ing. Felix Spitzer Solay Österreich GmbH
Prof.(FH) Dr. Friedrich Starkl FH OÖ Forschungs & Entwicklungs GmbH
Armin Stein Mühringer Montage GmbH
Vadim Vdovitchenko Danube Shipping Management Service GmbH (DSMS)
Herbert Wied Schenker & Co AG
Josef Wimmer Dynea Austria GmbH


![SWOT FINAL Hungary - chemlog.info · SWOT‐Analysis Project [ChemLog] Project Partner: Hungary Page 3/31 1 STRUCTURE Introduction to Region / Country Description of Chemical Industry](https://img.pdfslide.net/doc/110x75/5afb25007f8b9ae92b8ea5fe/swot-final-hungary-analysis-project-chemlog-project-partner-hungary-page.jpg)