Embed Size (px)
Citation preview
Syddansk Universitet
Industry 4.0 in Danish Industry
Stentoft, Jan; Rajkumar, Christopher; Madsen, Erik Skov
Publication date:2017
Document versionPublisher's PDF, also known as Version of record
Document licenseUnspecified
Citation for pulished version (APA):Stentoft, J., Rajkumar, C., & Madsen, E. S. (2017). Industry 4.0 in Danish Industry: An empirical investigation ofthe degree of knowledge, perceived relevance and current practice.
General rightsCopyright and moral rights for the publications made accessible in the public portal are retained by the authors and/or other copyright ownersand it is a condition of accessing publications that users recognise and abide by the legal requirements associated with these rights.
• Users may download and print one copy of any publication from the public portal for the purpose of private study or research. • You may not further distribute the material or use it for any profit-making activity or commercial gain • You may freely distribute the URL identifying the publication in the public portal ?
Take down policyIf you believe that this document breaches copyright please contact us providing details, and we will remove access to the work immediatelyand investigate your claim.
Download date: 31. May. 2017
Industry 4.0 in Danish Industry
An empirical investigation of the degree of knowledge, perceived relevance and current practice
June 2017Jan StentoftChristopher RajkumarErik Skov Madsen
University of Southern Denmark
Industry 4.0 in Danish Industry
An empirical investigation of the degree of knowledge, perceived importance and current practice
ISBN: 978-87-91070-90-7
Design and layout: Red Ink A/SPrinted in 300 copies.Printed by: OAB Tryk A/S
Funded by University of Southern Denmark (ReCoE – recoe.dk)© The authors
The survey is carried out by researchers from University of Southern Denmark, Department of Entrepreneurship and Relationship Management, Kolding and Department of Technology Management, Odense
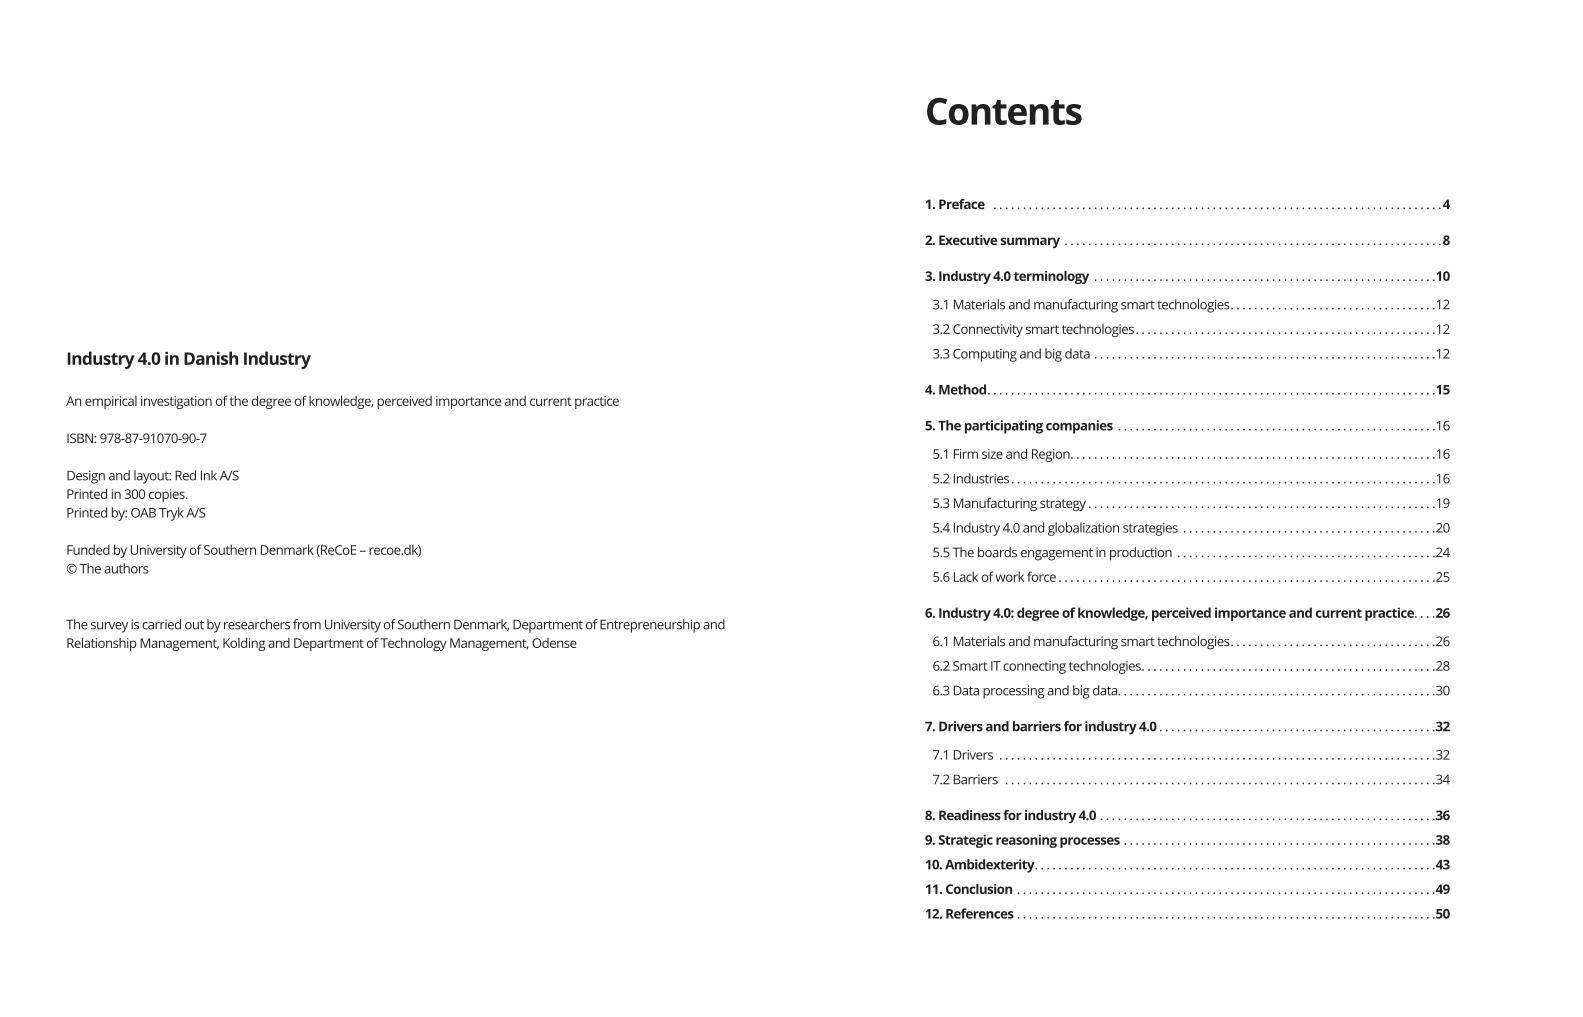
1. Preface . . . . . . . . . . . . . . . . . . . . . . . . . . . . . . . . . . . . . . . . . . . . . . . . . . . . . . . . . . . . . . . . . . . . . . . . . . . .4
2. Executive summary . . . . . . . . . . . . . . . . . . . . . . . . . . . . . . . . . . . . . . . . . . . . . . . . . . . . . . . . . . . . . . . .8
3. Industry 4.0 terminology . . . . . . . . . . . . . . . . . . . . . . . . . . . . . . . . . . . . . . . . . . . . . . . . . . . . . . . . . .10
3.1 Materials and manufacturing smart technologies. . . . . . . . . . . . . . . . . . . . . . . . . . . . . . . . . . .12
3.2 Connectivity smart technologies. . . . . . . . . . . . . . . . . . . . . . . . . . . . . . . . . . . . . . . . . . . . . . . . . . .12
3.3 Computing and big data . . . . . . . . . . . . . . . . . . . . . . . . . . . . . . . . . . . . . . . . . . . . . . . . . . . . . . . . . .12
4. Method. . . . . . . . . . . . . . . . . . . . . . . . . . . . . . . . . . . . . . . . . . . . . . . . . . . . . . . . . . . . . . . . . . . . . . . . . . . .15
5. The participating companies . . . . . . . . . . . . . . . . . . . . . . . . . . . . . . . . . . . . . . . . . . . . . . . . . . . . . .16
5.1 Firm size and Region. . . . . . . . . . . . . . . . . . . . . . . . . . . . . . . . . . . . . . . . . . . . . . . . . . . . . . . . . . . . . .16
5.2 Industries. . . . . . . . . . . . . . . . . . . . . . . . . . . . . . . . . . . . . . . . . . . . . . . . . . . . . . . . . . . . . . . . . . . . . . . .16
5.3 Manufacturing strategy . . . . . . . . . . . . . . . . . . . . . . . . . . . . . . . . . . . . . . . . . . . . . . . . . . . . . . . . . . .19
5.4 Industry 4.0 and globalization strategies . . . . . . . . . . . . . . . . . . . . . . . . . . . . . . . . . . . . . . . . . . .20
5.5 The boards engagement in production . . . . . . . . . . . . . . . . . . . . . . . . . . . . . . . . . . . . . . . . . . . .24
5.6 Lack of work force . . . . . . . . . . . . . . . . . . . . . . . . . . . . . . . . . . . . . . . . . . . . . . . . . . . . . . . . . . . . . . . .25
6. Industry 4.0: degree of knowledge, perceived importance and current practice. . . .26
6.1 Materials and manufacturing smart technologies. . . . . . . . . . . . . . . . . . . . . . . . . . . . . . . . . . .26
6.2 Smart IT connecting technologies. . . . . . . . . . . . . . . . . . . . . . . . . . . . . . . . . . . . . . . . . . . . . . . . . .28
6.3 Data processing and big data. . . . . . . . . . . . . . . . . . . . . . . . . . . . . . . . . . . . . . . . . . . . . . . . . . . . . .30
7. Drivers and barriers for industry 4.0 . . . . . . . . . . . . . . . . . . . . . . . . . . . . . . . . . . . . . . . . . . . . . . .32
7.1 Drivers . . . . . . . . . . . . . . . . . . . . . . . . . . . . . . . . . . . . . . . . . . . . . . . . . . . . . . . . . . . . . . . . . . . . . . . . . .32
7.2 Barriers . . . . . . . . . . . . . . . . . . . . . . . . . . . . . . . . . . . . . . . . . . . . . . . . . . . . . . . . . . . . . . . . . . . . . . . . .34
8. Readiness for industry 4.0 . . . . . . . . . . . . . . . . . . . . . . . . . . . . . . . . . . . . . . . . . . . . . . . . . . . . . . . . .36
9. Strategic reasoning processes . . . . . . . . . . . . . . . . . . . . . . . . . . . . . . . . . . . . . . . . . . . . . . . . . . . . .38
10. Ambidexterity. . . . . . . . . . . . . . . . . . . . . . . . . . . . . . . . . . . . . . . . . . . . . . . . . . . . . . . . . . . . . . . . . . . .43
11. Conclusion . . . . . . . . . . . . . . . . . . . . . . . . . . . . . . . . . . . . . . . . . . . . . . . . . . . . . . . . . . . . . . . . . . . . . . .49
12. References . . . . . . . . . . . . . . . . . . . . . . . . . . . . . . . . . . . . . . . . . . . . . . . . . . . . . . . . . . . . . . . . . . . . . . .50
Contents
4 5
Where companies should localize their manufacturing units have received much awareness in academy and practice during the last decades. There had been many success stories as well as failures of moving manufac-turing abroad to low countries through globalization strategies such as outsourcing and offshoring (Arlbjørn and Lütjhe, 2012; Broedner et al., 2009). Recently, research has addressed opposite movements of manufacturing back to home destinations (in terms of insourcing, backshoring or reshoring) (Arlbjørn et al., 2013; Fratocchi et al., 2016; Kinkel, 2012; Stentoft et al, 2016a,b). Motives to bring production back or to reshore to other locations are reduced labor cost advantages (Fratocchi et al., 2016; Kinkel, 2012; Stentoft et al., 2016b), quality problems (Arlbjørn and Mikkelsen, 2014; Kinkel, 2012), lack of flexibility and increased logistics costs (Fratocchi et al. 2016; Tate, 2014), among others. However, new drivers for moving manufacturing back has been discussed in the literature in terms of automa-tion (Arlbjørn and Mikkelsen, 2014; Barberi and Stentoft, 2016; Stentoft et al., 2016b; Forestl et al., 2016).
Automation of manufacturing can take place using robots, which again can be grouped under a wider new term “the fourth industrial revolution” or “Industry 4.0”. Industry 4.0 is based on Cyper-Physical Systems where virtual and physical production systems are integrated (Colotla et al., 2016, p. 9). Extant literature has demanded more research on offshoring and reshoring issues in the light of robotization, digitalization and automation (Brennan et al., 2015; Stentoft et al., 2016c; Tate and Bals, 2017). Such new research is demanded from various perspectives such as firm size (Arlbjørn and Mikkelsen, 2014; Stentoft et al, 2015; Tate, 2014) and technological intensity of industries (Forestl et al., 2016).
Academic research disseminated in peer-reviewed journals is still sparse (Oesterreich and Teuteberg, 2016).
A recent literature review found that most academic articles are found in conference contributions (Liao et al., 2017). The literature that is available is dominated by technical contents (e.g. what it is, conceptualization), and to our knowledge not yet treating the business economic, strategic and organizational perspectives on using Industry 4.0. Extant literature is dominated by grey literature from consultants such as Colotla et al. (2016), Deloitte (2015), Dujin et al., (2014) McKinsey (2015), and white papers from commissions (e.g. IEC, 2015).
According to the Danish government, Danish companies are in front when compared to other EU companies regarding the first digitalization wave concerning a digital infrastructure (Regeringen, 2016). However, the Danish companies need to prepare for the next level of digitalization covering the utilization of technologies such as 3D-printing, sensor technologies, network communication (Internet of Things), artificial intelligence and advanced robotics. As they write: The challenge is to integrate the new digital solutions into all the companies’ processes, incorporate them into products and to adjust and developed the business models. This is more difficult and more risky. It demands an eye for the opportunities, resources and the right competences. Regeringen (2016, p. 5). They further emphasize the importance to invest in digital solutions:
1. Denmark needs to increase productivity. Digitaliza-tion can work as driver for increased growth in pro ductivity
2. Denmark is close to running out of steam regarding how fast new technologies are grasped. The competitiveness is challenged ahead. Denmark and Danish companies are challenged on a number of growth areas, on IT competences, on investments and potentially also on IT security.
The digital report from the Danish government do show good visions regarding what Danish companies need to focus at in order to better brace for future competitive-ness. However, as argued by Stentoft (2016), the report lacks suggestions on how companies should approach this task. And how should small and medium-sized enterprises (SMEs), that accounts for more than 90 % of the Danish manufacturing firms, approach this; compared to large enterprises SMEs differ along a number of factors such as scarcity in resources, lack of competences, a production mode focus at the expense of strategic planning, need for multi-skilled employees, and an owner deeply involved in the operations (Arlbjørn et al., 2009; Forsman, 2008). Due to such differences, SME’s also display a low IT readiness (Haug et al., 2011). Stentoft (2016) further points to the need to spend public resources so as to help Danish SMEs to understand, evaluate and implement Industry 4.0. This perspective is also supported by Sommer (2015) that question which qualifications needs to take part of the fourth industrial revolution. Based on a study of nine German Industry 4.0 questionnaire-surveys, Sommer (2015) concludes that there is a large awareness of the importance of Industry 4.0 but a low readiness, especially for SMEs. Thus, to date there is little academic empirical evidence of the actual practice of Industry 4.0 in a Danish context. Recently, a consultant driven survey has been conducted (Syddansk Vækstforum, 2016).
There is no doubt that digitalization for some companies already play an important role in their manufacturing setup. But it will also play an important role in more companies in the future. The question is how fast? In business press, the fortune is indicated as “digitalize or die within ten years” (Jørgensen et al., 2017). One small Danish manufacturing company has recently changed their ERP platform from an old Navigator to a new Microsoft Dynamics Nav. They were advised very
strongly to change their IT system before the last millen-nium; but their system continued to function until they changed in December 2016. On the one hand, there is something like “cry wolf too often”. But on the other hand, there is also a pressure to be prepared for digital-ization. Jørgensen et al. (2017) describe six managerial competences that are needed in the transformation processes towards digital enterprises: 1) Existence, Mission: Understanding the company’s mission, its raison d’etre, 2) Technology, software: A business exists tomorrow only if it understands the underlying tech-nology, 3) Method, approach: Managers are responsible for choosing the approach that exploits technologies efficiently in order to reach the company’s mission, 4) Method, adaptability: Continuous adjustments to the environment and technological changes, 5) Human beings, organization: Importance of understanding the organization; mangers must have the capabilities to exploit and motivate the organization to implement the management approach to reach its mission, and 6) Human beings, communication: The management must have the capabilities to communicate the mission and approach. Thus, there is of course a need to under-stand the new technologies and get familiarities with them, but alternatively, there is also a need for under-standing how such technologies can support business processes (i.e., how important the human aspect is in relation to technology, Stentoft et al., 2016d).
PurposeThe purpose of the research report is to advance the understanding of degree of knowledge, the perceived relevance and the current practice of Industry 4.0 among Danish manufacturing companies. Further, the report will investigate drivers as well as barriers for Industry 4.0 and provide an assessment of Industry 4.0 readiness and their strategic reasoning processes. Several empirical studies reveal a dilemma in industry
1. Preface
to balance operational task and development oriented tasks in a busy work day. Thus, the report will also provide empirical and operationalized data about ambidexterity among the surveyed companies (Lubatkin et al., 2006; O’Reilly and Tushman, 2004; O’Reilly and Tushman, 2013). The analysis will be conducted to allow a focus on variances across firm sizes, regional locations in Denmark and the technology intensity classification by OECD (2011) (separating industries in high-technology, medium-high-technology, medium-low-technology and low-technology industries).
Thank youWe would like to thank the engineering students from University of Southern Denmark in Odense1 that have assisted in the data collection process – calling all the companies and distributing the survey-questionnaire. You have definitely helped to increasing the response rate in the present survey. Finally, we would like to thank all the persons that have spent time on answering the
Industry 4.0 questionnaire that provides the foundation for this report. We are grateful that you have prioritized your scarce time to give your perceptions of your companies’ stages within this topic area; these percep-tions have made it possible for us to identify where initiatives should be developed in order to secure long term competitiveness for the Danish industry.
We would also like to thank Ditte Rønde Veise, Peter Lind and Peter Engel-Andreasen from the Triangle Region for valuable discussions in the development of the survey and on its conclusions.
On behalf of the research teamJan StentoftProfessorDepartment of Entrepreneurship and Relationship ManagementUniversity of Southern Denmark
1We would like to thank Mathias Boe Riisgaard Nielsen, Saranka Thyagarajah, Peter Kiel Bjørnholt Jensen, Michelle Søe Damsgaard, Frederik Lindekilde Rasmussen, Peter Jensen and Nina Aslak.
8 9
This report provides an analysis and evaluation of the degree of knowledge, perceived relevance, and current practice of Industry 4.0. Furthermore, investigates the various drivers and barriers of Industry 4.0 along with the employee’s/company’s readiness to implement Industry 4.0. Lastly, the report examines the promi-nence of ambidexterity within the context of Industry 4.0. This report is based on a questionnaire-survey with reference to Industry 4.0.
The questionnaire was distributed among 1,580 Danish companies and 570 companies agreed to participate in the survey. Out of these 570 responses, a net of 270 complete and usable responses (47.4%) was considered for the analysis. Results of the investigation reveal that:
• Companies do have an acceptable knowledge about Industry 4.0 which includes materials and smart production technologies, smart IT connecting technologies, data processing and big data. On the whole, the large-sized companies are much advanced in knowledge about Industry 4.0.
• Companies do understand the importance/relevance of Industry 4.0 however; there is no evidence of effective practice. Of course, there is a gap between perceived importance/relevance and current/actual practice. Largely, the large-sized companies are extremely active in practicing materials and smart production technologies, smart IT connecting technologies, data processing and big data.
• The analysis reports the topmost three drivers of Industry 4.0 as cost reduction, improvisation of time-to-market, and legal/legislation condition and barriers of Industry 4.0 as lack of knowledge, more focus on operation than that of development, and
lack of understanding of the strategic importance. Drivers and barriers for Industry 4.0 are the same for all the companies irrespective of their size.
• With regard to readiness, in general, firms are not much ready or willing to work with Industry. On the other hand, the large-sized companies, to a larger extent, are willing to work with Industry 4.0 than the small and medium-sized companies. Then, with respect to industry technology intensity, companies, regardless of the technology intensity, are only to some extent ready or willing to work with Industry 4.0.
• Companies are much higher in strategic reasoning than the readiness to work with Industry 4.0. In addition, companies, irrespective of their size, are extremely high in strategic reasoning/thinking than the readiness towards Industry 4.0. Furthermore, statistical analysis was carried out to check the relationship between strategic reasoning, industry technology intensity and readiness to work with Industry 4.0. The results clearly indicate that the industry technology intensity does not have any relationship with strategic reasoning and readiness to work with Industry 4.0. In general, the higher the strategic reasoning/thinking, the higher the readiness towards Industry 4.0.
• An ambidextrous company will certainly focus simultaneously on both operation and develop-ment however; companies are, at present, more concentrating on exploiting the current production process (operation) than that of exploring new production process (development). Additionally, statistical analysis was carried out to check the relationship among industry technology intensity, operation and development. The results indicate
2. Executive summary
that the higher the industry technology intensity, the higher the companies move towards devel-opment of new production process (exploration).
• Companies, in spite of having a manufacturing strategy, they are still remaining domestic (i.e. neither moved it out nor moved it back during the last three years). There are companies, to some extent, without any strategies for new equipment/technology in this digital world. With regards to the globalization strat-egies (which includes remain domestic, offshore, backshore, both offshore and backshore), company size and industry technology intensity does have an impact on globalization strategy. For instance, the larger the company in size and the higher industry technology intensity, the more offshoring of manu-facturing take place. Regarding the companies that have offshored production during the last three years, the data reveals a perception that the more the automation, the lesser the level of offshoring (i.e. automation of manufacturing can decrease the level of offshoring). Among the companies that have backshored manufacturing during the last three years, there is also a perception that the more they do invest in automation, the more they will backshore manufacturing.
This report, based on the results, recommends the companies to continuously make effort:
• To increase their current knowledge base regarding Industry 4.0
• To actively work with Industry 4.0
• To sustain their readiness to work with Industry 4.0
• To practice both exploitation of existing productio-process and exploration of new production process
In a nutshell, this report documents the awareness towards Industry 4.0, but is also clear that companies are still not practicing it efficiently. There are variations among the companies with respect to their size. The report also documents the urgent need for compe-tence development both in terms of understanding the specific technologies and how they can support their business processes. In addition, the report also document the need for competence development in terms of strategic reasoning i.e. advancing knowledge levels in strategizing and organizational development under new technological advancements.
10 11
Discussions on Industry 4.0 are much centered about conceptualizations of the constituents of Industry 4.0 (or cyber-physical systems, cf. Kagermann et al., 2013) and how existing production systems can be ready for Industry 4.0 (Schlechtendahl et al., 2015). A cyber-physi-cal-system can, according to Yu et al. (2015), be defined as “integration of computation with physical processes. Embedded computers and networks monitor and control the physical processes, usually with feedback loops where physical processes affect computations and vice versa.” Kagermann et al. (2013) describes the four stages of industrial revolution from water and steam-powered mechanical manufacturing facilities to at present cyber-physical systems. The first industrial revolution started with mechanization of manufac-turing in the end of 18th century. This was followed by the second industrial revolution in the late 19th and beginning of the 20th century where electrically-pow-ered mass production was developed (i.e. division of labor). The third industrial revolution took place in the beginning of the 1970 where manufacturing began to utilize programmable logic controllers (PLCs) (intensive us of digitalization) in further automation of manu-facturing. The fourth industrial revolution is going on right now based on cyber physical systems that connect physical and digital systems (combining smart objects with internet technologies).
Within Industry 4.0, the term smart factory addresses the vertical integration and networked manufacturing systems for smart production (Wang et al., 2016). Some literature, academic and grey literature, discusses several technology drivers (or game changers) that enables the production of the future such as big data and analytics, additive manufacturing (e.g. 3D printing and 3D scanning), simulation, horizontal/vertical integration, industrial internet of things, cyber-security, cloud technology, mobile internet, advanced robotics,
advanced materials, augmented reality (Colotla et al., 2016; Dujin et al., 2014; Holmström et al., 2016). Prinz et al. (2016) have identified the need for more knowledge about Industry 4.0 and the lack of standards to bring continuous connectivity into manufacturing plants as potential challenges (Lee et al., 2016). Hermann et al. (2015) argue that Industry 4.0 may be little known outside Germany whereas other concepts character-izing the similar contents may found under labels such as Industrial Internet, Advanced Manufacturing, and Smart Industry and Smart Manufacturing.
Lasi et al (2014) describes two development directions behind Industry 4.0: 1) an application-pull and 2) a tech-nology push. The application pull are:
1. A need for shorter product development periods (time-to-market).
2. Increased individualization of products (batch size one).
3. Need for higher flexibility in manufacturing.4. Need for decentralization in order to obtain faster
decision making processes. 5. Need for improved resource efficiency
The technology push is related to:
1. Further increasing mechanization and automation (using more technical aids in work processes)
2. Digitalization and networking (increased amount of actor and sensor data supporting functions of control an analysis)
3. Miniaturization (electronical devices become smaller and smaller that created new fields of application in production and logistics)
3. Industry 4.0 terminology
From an Industry 4.0 perspective, there is a possibility of learning from research about ERP implementation in SMEs. Buonanno et al. (2005) found that the larger the firm is, the higher the probability for ERP implemen-tation; SMEs always schedule a limited organizational change in the case of ERP adoption, and are therefore not considering ERP systems as a keystone for organi-zational innovation; SMEs also seem to be less inclined to radical change and less aware of the organizational impact caused by the implementation of an ERP system; SMEs consider financial constraints as the main cause for non-adoption of ERP systems; and SMEs’ traditional focus on operations and day-by-day management, coupled with a lack of strategic view on IT, could be, to some extent, accountable for these findings. Thus, SMEs have other conditions for working with Industry 4.0. The dominated focus on daily operations at the expense of development is termed ambidexterity (O’Reilly and Tushman, 2004). Larger firms have additional resource pool than SMEs to manage the development processes
by creating structurally separate units for development (Lubatkin et al., 2006). With this, they have the ability to pursue simultaneous ambidexterity whereas SMEs often rely to sequential ambidexterity, which include periodical shifts between operation and innovation modes (O’Reilly and Tushman, 2013).
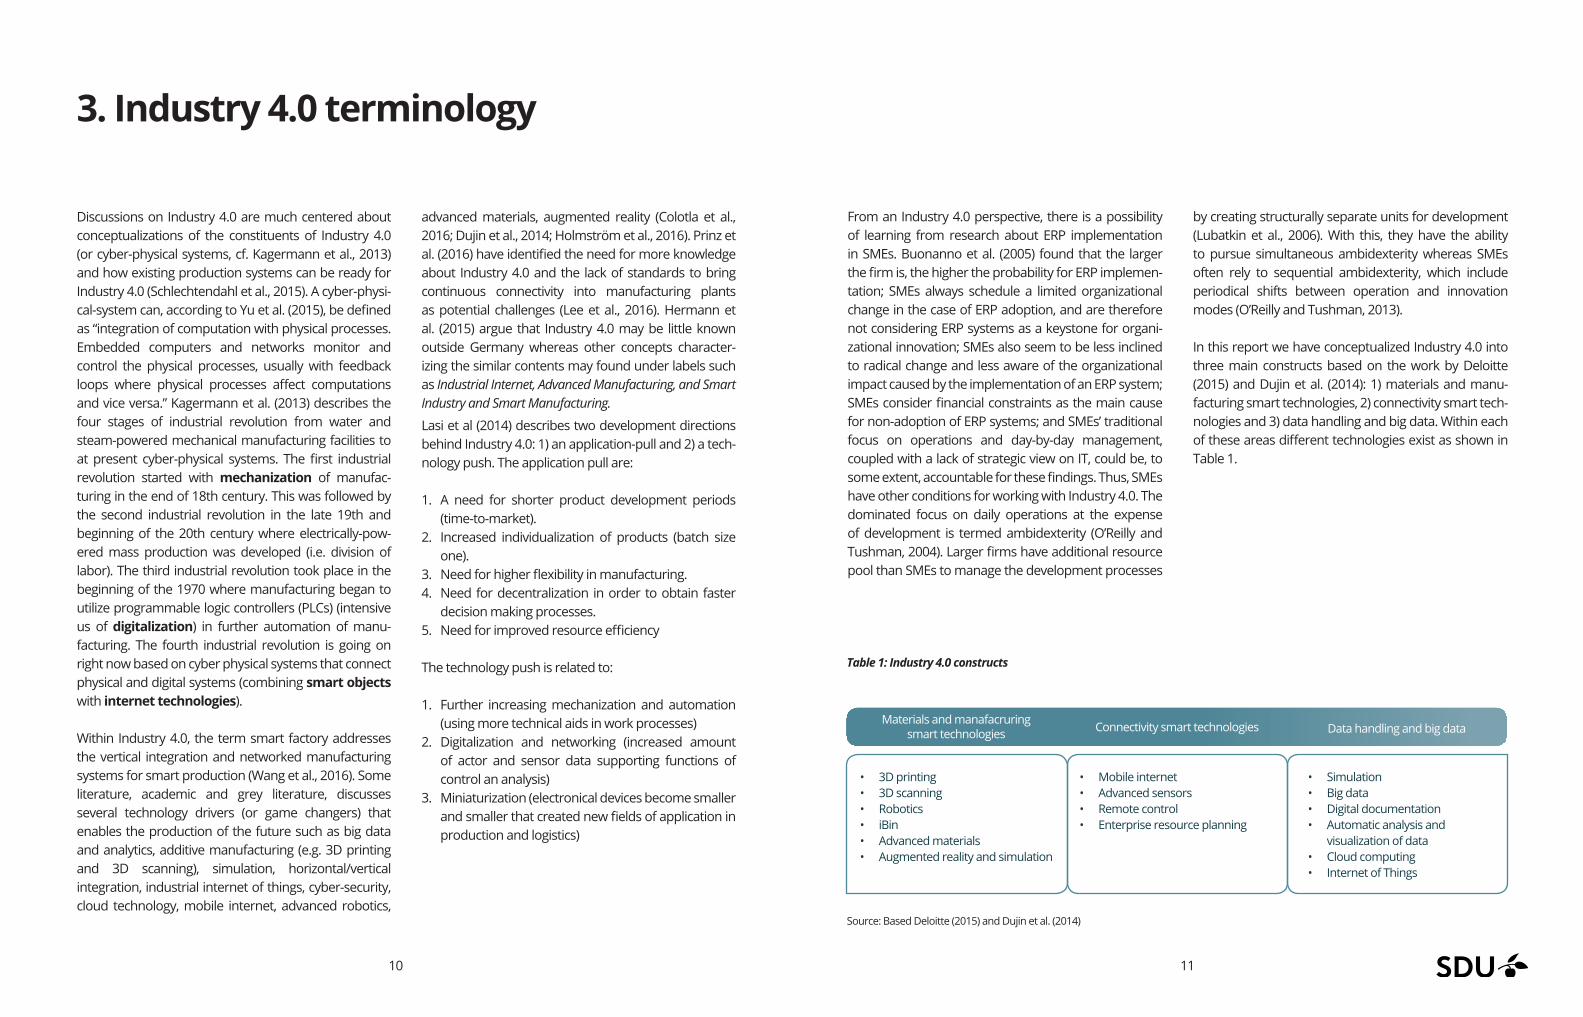
In this report we have conceptualized Industry 4.0 into three main constructs based on the work by Deloitte (2015) and Dujin et al. (2014): 1) materials and manu-facturing smart technologies, 2) connectivity smart tech-nologies and 3) data handling and big data. Within each of these areas different technologies exist as shown in Table 1.
Table 1: Industry 4.0 constructs
Source: Based Deloitte (2015) and Dujin et al. (2014)
Materials and manafacruring smart technologies Connectivity smart technologies Data handling and big data
• 3D printing• 3D scanning• Robotics• iBin• Advanced materials• Augmented reality and simulation
• Mobile internet• Advanced sensors • Remote control• Enterprise resource planning
• Simulation• Big data• Digital documentation• Automatic analysis and
visualization of data• Cloud computing• Internet of Things
12 13
3.1 Materials and manufacturing smart technologies In this study, the materials and manufacturing smart technologies is operationalized into six areas: 1) 3D printing, 2) 3D scanning, 3) Robots, 4) iBin, 5) advances materials and 6) augmented reality.
3D printing is a technology that prints an object in layers. 3D printing is an additive technology often used in prototyping and manufacturing of individual compo-nents. Today, 3D printing is used
in many different industries with various materials (e.g. plastic and metal). This technology is predicted to make huge impacts of the design of future supply chains in terms of reduced supply risk, lead-times and capital tight up in inventories when one, for example, can print a spare part when it is needed.
3D scanning is a device that enable one to analyze real objects by capturing their shapes, colors and their look in digital information.
Robots are programmable manufacturing equipment with manipulators such as a gripper arms and sensors that controls the robots behavior.
iBin or intelligent Bin systems is a material management system that automatically order items when they are needed (when the amount reach the reorder point) by a connection with the company’s ERP system.
Advanced materials (also termed ‘lightweight materials’) are in general divided into three categories, including metals, composites and polymers and new materials such as ceramics, carbon nanotubes and others nano-materials (Walendowski et al., 2016).
Augmented reality is a technology that extends the real world elements with 2D or 3D computer generated components enabling the users to interact with them. Recent examples of augmented reality are Google GlassTM and Pokémon Go.
3.2 Connectivity smart technologiesThis group of technologies provides connection between the physical and the digital world. Four technologies are investigated: 1) Mobile internet, 2) Advanced sensors, 3) Remote control and 4) Enterprise resource planning.
Mobile internet is a technology that allows one to access the internet through a mobile smartphone.
Advanced sensors are devices that take input from the physical environment and uses integral compute resources to make predefined functions upon detection of specific input and then process data before passing it on.
Remote control is the establishment of individual communication solutions between the machine supplier and the user. The technician can connect to machines directly via a modem. The objective is to remotely diagnose and control the machine in order to reduce the duration of unscheduled stoppages and downtime (Kagermann et al., 2013).
Enterprise Resource Planning is computer software that integrates all the company’s main functions (e.g. customer, orders, inventory management, manu-facturing planning, purchasing and finance) into one database.
3.3 Computing and big dataThis group of technologies is divided into six specific technologies: 1) simulation, 2) big data, 3) digital docu-
mentation, 4) automatic analysis and visualization of data, 5) cloud computing and 6) internet of things.
Simulation is a process of creating a model of an ongoing or a new proposed system with the purpose to identify and understand the factors that control the system as well as predicting the future behavior of the system.
Big data is related to business intelligence and business analytics and has emerged as a separate concept (Chen et al., 2012). Big data can be perceived as a holistic approach for to obtain actionable insights to create competitive advantages, which differs from business analytics in terms of the 5V’s: volume, variety, velocity, veracity, and value (Fosso Wamba et al., 2015).
Digital documentation covers areas such as digital production orders (e.g. on tablets), and other founda-tion for production such as bill-of-materials, production routings and technical drawings. Furthermore it covers digital product and service manuals.
Automatic analysis and visualization of data is a process that helps in handling data as well as in gaining knowledge from data. Nowadays, data is produced at an unbe-lievable rate and the capability to collect and store the data is increasing rapidly than the capability to analyze the data. This technique combines automated analysis practices with interactive visualizations for an effective understanding, reasoning and decision making on the basis of very large and complex data sets. The key goal is: a) to create information and derive understanding from inconsistent, dynamic and ambiguous data; b) to identify the expected and learn the unexpected; and c) to gain knowledge from visualization, automatic analysis, as well as the preceding interactions between visualizations, models, and the human analysts.Cloud computing is a concept denoting the distribution
of software and services through the internet. With data being made available in the “cloud”, it can be more easily and ubiquitously accessed which increases its potential value with enhanced integration, collabora-tion, and data analysis enabled by a shared platform. These services encompass three different service delivery models: 1) SaaS (software as a service), 2) PaaS (platform as a service), and 3) IaaS (infrastructure as a service). SaaS entails a software application that is being made available by a third party provider as a chargeable service. PaaS facilitates the development and deploy-ment of applications without the cost and complexity of buying and managing the underlying hardware and software layers. IaaS involves storage and computing capabilities offered as a service (Xu, 2012).
Internet of Things refers to a network of internet-con-nected devices that are able to collect and exchange data using embedded sensors.
14 15
This study is based on a questionnaire-survey regarding Industry 4.0 that was distributed among Danish manu-facturing companies with 25 or more employees late 2016 and early 2017. The questionnaire is developed on the basis of literature and theoretical studies, as well as to certain extent on previous similar studies completed between the year 2013 and 2016. The questionnaire was pilot tested by two personnel representing the target group in order to ensure that the questions asked are understandable. The questionnaire consisted of six sections:
• Background information• trategic reasoning processes• Industry 4.0• Readiness for Industry 4.0• Drivers and barriers for Industry 4.0• Operations and development
The questions were of two types: 1) yes or no questions and 2) statements on a 5-point Likert Scale. Criteria for selecting companies was:
• ≥25 employees at the Central Business Register• Exclusion of companies legally protected against
unsolicited advertising• Exclusion of holding companies• Normal operation
To identify the relevant population, the up-to-date Danish company database “Names and numbers, business” (NN Markedsdata, 2016) has been used to focus on small, medium-sized and large Danish manufacturing companies (companies with minimum 25 employees and above). The database allowed us to search for these companies in a structured manner. The process resulted in a gross of 1,580 companies. All companies were approached through phone by the
hired students from University of Southern Denmark. The call was first picked by the receptionist and then redirected to the person responsible for manufacturing, and if they agree to contribute then the questionnaire was emailed to the participants. In all, 570 companies agreed to participate in this survey. Reminder e-mails were sent to increase the response rate and this provides an opportunity to compare early and late responses (before and after the initial deadline). This process provided us with a net population of 270 companies providing complete and useful answers. The companies are divided into 110 small companies (from 25 to 50 employees; 127 medium-sized companies (from 51 to 250 employees; and 33 large companies (> 250 employees).
The respondents were provided with a clear definition of Industry 4.0 in the questionnaire for them to under-stand the concept and answer the questions related to Industry 4.0: “Industry 4.0 is also denoted the fourth industrial revolution. Industry 4.0 is characterized by increased automation especially through integration of the digital world and the physical production. It is a question about combining technologies, connecting products and value chains and integrated digital systems”.
4. Method
16 17
This section includes the general information concerning firm size, region, various industry types, manufacturing, production and workforces. The respondents were asked related questions and the results are presented below.
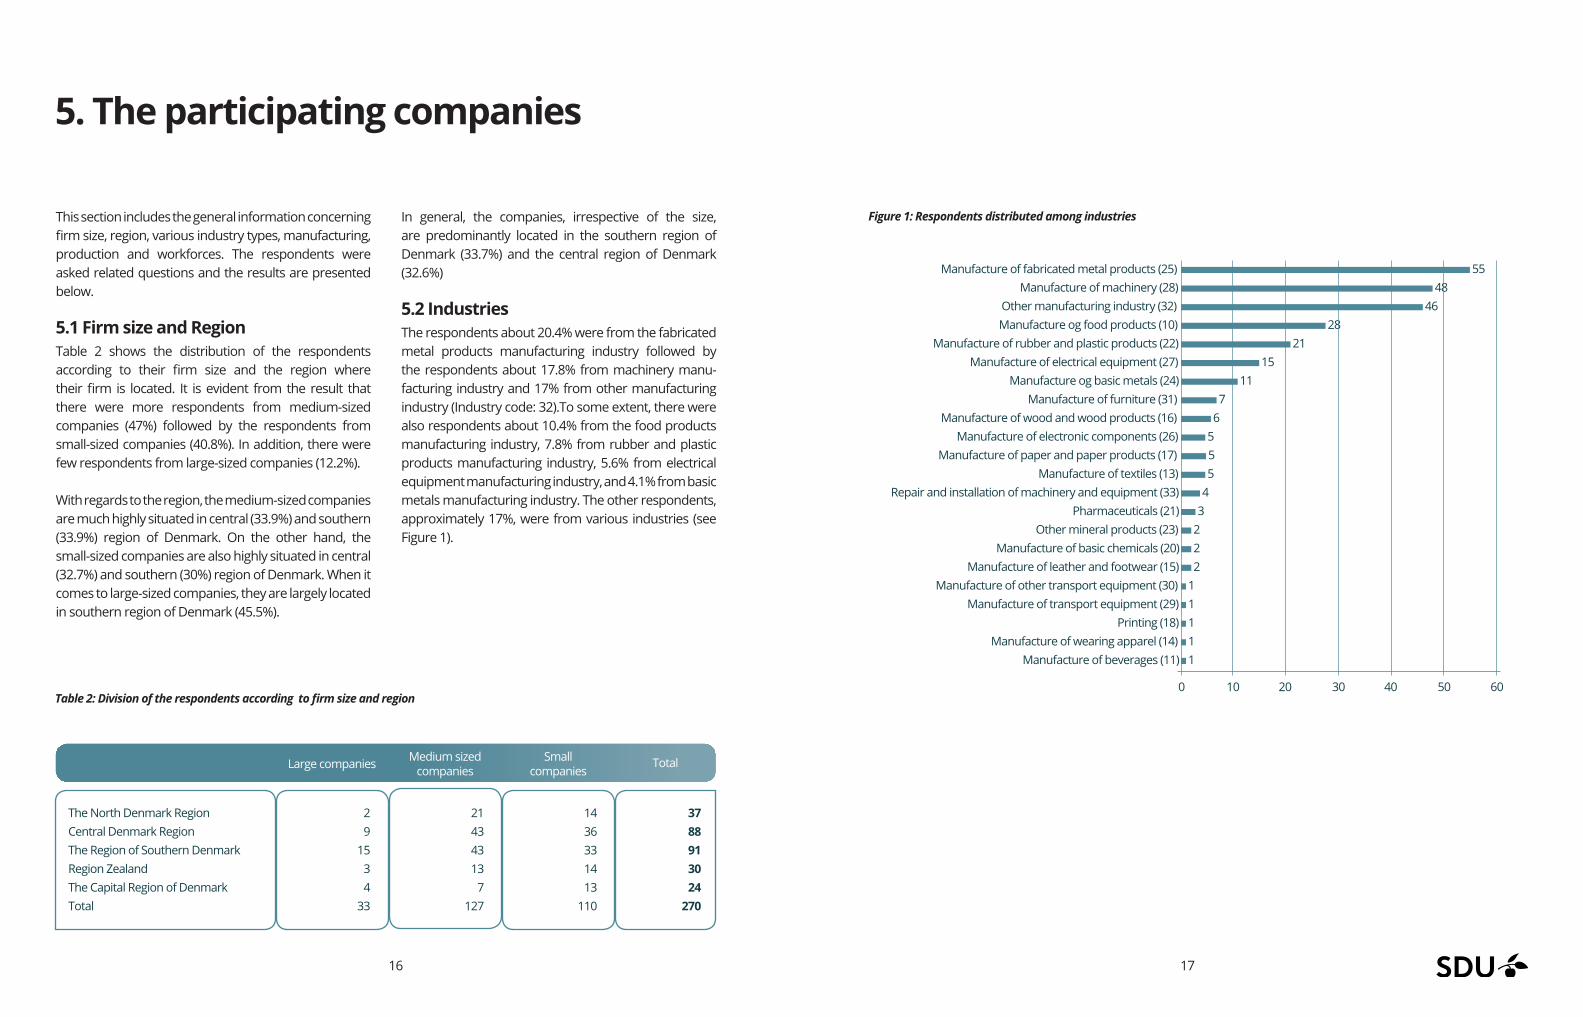
5.1 Firm size and RegionTable 2 shows the distribution of the respondents according to their firm size and the region where their firm is located. It is evident from the result that there were more respondents from medium-sized companies (47%) followed by the respondents from small-sized companies (40.8%). In addition, there were few respondents from large-sized companies (12.2%).
With regards to the region, the medium-sized companies are much highly situated in central (33.9%) and southern (33.9%) region of Denmark. On the other hand, the small-sized companies are also highly situated in central (32.7%) and southern (30%) region of Denmark. When it comes to large-sized companies, they are largely located in southern region of Denmark (45.5%).
In general, the companies, irrespective of the size, are predominantly located in the southern region of Denmark (33.7%) and the central region of Denmark (32.6%)
5.2 IndustriesThe respondents about 20.4% were from the fabricated metal products manufacturing industry followed by the respondents about 17.8% from machinery manu-facturing industry and 17% from other manufacturing industry (Industry code: 32).To some extent, there were also respondents about 10.4% from the food products manufacturing industry, 7.8% from rubber and plastic products manufacturing industry, 5.6% from electrical equipment manufacturing industry, and 4.1% from basic metals manufacturing industry. The other respondents, approximately 17%, were from various industries (see Figure 1).
5. The participating companies
Figure 1: Respondents distributed among industries
Table 2: Division of the respondents according to firm size and region
Large companies Medium sized companies
Small companies
Total
The North Denmark RegionCentral Denmark RegionThe Region of Southern DenmarkRegion ZealandThe Capital Region of DenmarkTotal
29
1534
33
21 43 4313
7127
1436331413
110
3788913024
270
Manufacture of fabricated metal products (25) 55 Manufacture of machinery (28) 48 Other manufacturing industry (32) 46 Manufacture og food products (10) 28 Manufacture of rubber and plastic products (22) 21 Manufacture of electrical equipment (27) 15 Manufacture og basic metals (24) 11 Manufacture of furniture (31) 7 Manufacture of wood and wood products (16) 6 Manufacture of electronic components (26) 5 Manufacture of paper and paper products (17) 5 Manufacture of textiles (13) 5 Repair and installation of machinery and equipment (33) 4 Pharmaceuticals (21) 3 Other mineral products (23) 2 Manufacture of basic chemicals (20) 2 Manufacture of leather and footwear (15) 2 Manufacture of other transport equipment (30) 1 Manufacture of transport equipment (29) 1 Printing (18) 1 Manufacture of wearing apparel (14) 1 Manufacture of beverages (11) 1
0 10 20 30 40 50 60
18 19
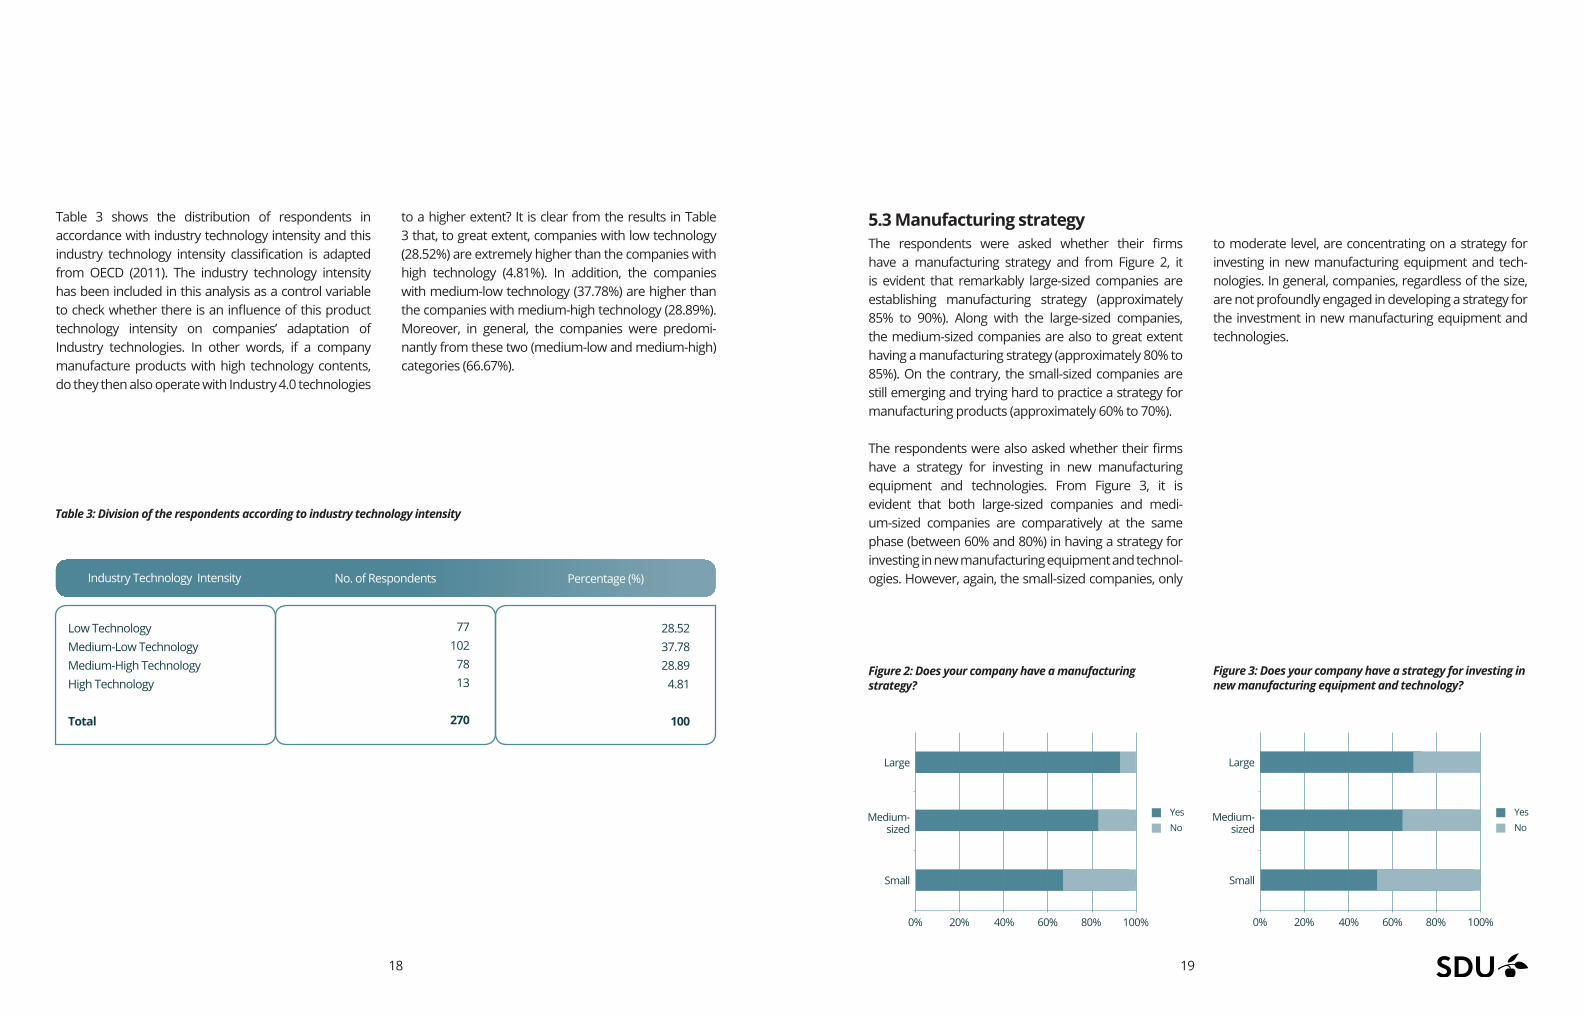
Table 3 shows the distribution of respondents in accordance with industry technology intensity and this industry technology intensity classification is adapted from OECD (2011). The industry technology intensity has been included in this analysis as a control variable to check whether there is an influence of this product technology intensity on companies’ adaptation of Industry technologies. In other words, if a company manufacture products with high technology contents, do they then also operate with Industry 4.0 technologies
to a higher extent? It is clear from the results in Table 3 that, to great extent, companies with low technology (28.52%) are extremely higher than the companies with high technology (4.81%). In addition, the companies with medium-low technology (37.78%) are higher than the companies with medium-high technology (28.89%). Moreover, in general, the companies were predomi-nantly from these two (medium-low and medium-high) categories (66.67%).
Figure 2: Does your company have a manufacturing strategy?
Figure 3: Does your company have a strategy for investing in new manufacturing equipment and technology?
5.3 Manufacturing strategyThe respondents were asked whether their firms have a manufacturing strategy and from Figure 2, it is evident that remarkably large-sized companies are establishing manufacturing strategy (approximately 85% to 90%). Along with the large-sized companies, the medium-sized companies are also to great extent having a manufacturing strategy (approximately 80% to 85%). On the contrary, the small-sized companies are still emerging and trying hard to practice a strategy for manufacturing products (approximately 60% to 70%).
The respondents were also asked whether their firms have a strategy for investing in new manufacturing equipment and technologies. From Figure 3, it is evident that both large-sized companies and medi-um-sized companies are comparatively at the same phase (between 60% and 80%) in having a strategy for investing in new manufacturing equipment and technol-ogies. However, again, the small-sized companies, only
to moderate level, are concentrating on a strategy for investing in new manufacturing equipment and tech-nologies. In general, companies, regardless of the size, are not profoundly engaged in developing a strategy for the investment in new manufacturing equipment and technologies.
Table 3: Division of the respondents according to industry technology intensity
Industry Technology Intensity No. of Respondents Percentage (%)
Low TechnologyMedium-Low TechnologyMedium-High TechnologyHigh Technology
Total
77102
7813
270
28.5237.7828.89
4.81
100
Large
Medium- sized
Small
0% 20% 40% 60% 80% 100%
Yes No
Large
Medium- sized
Small
0% 20% 40% 60% 80% 100%
Yes No
20 21
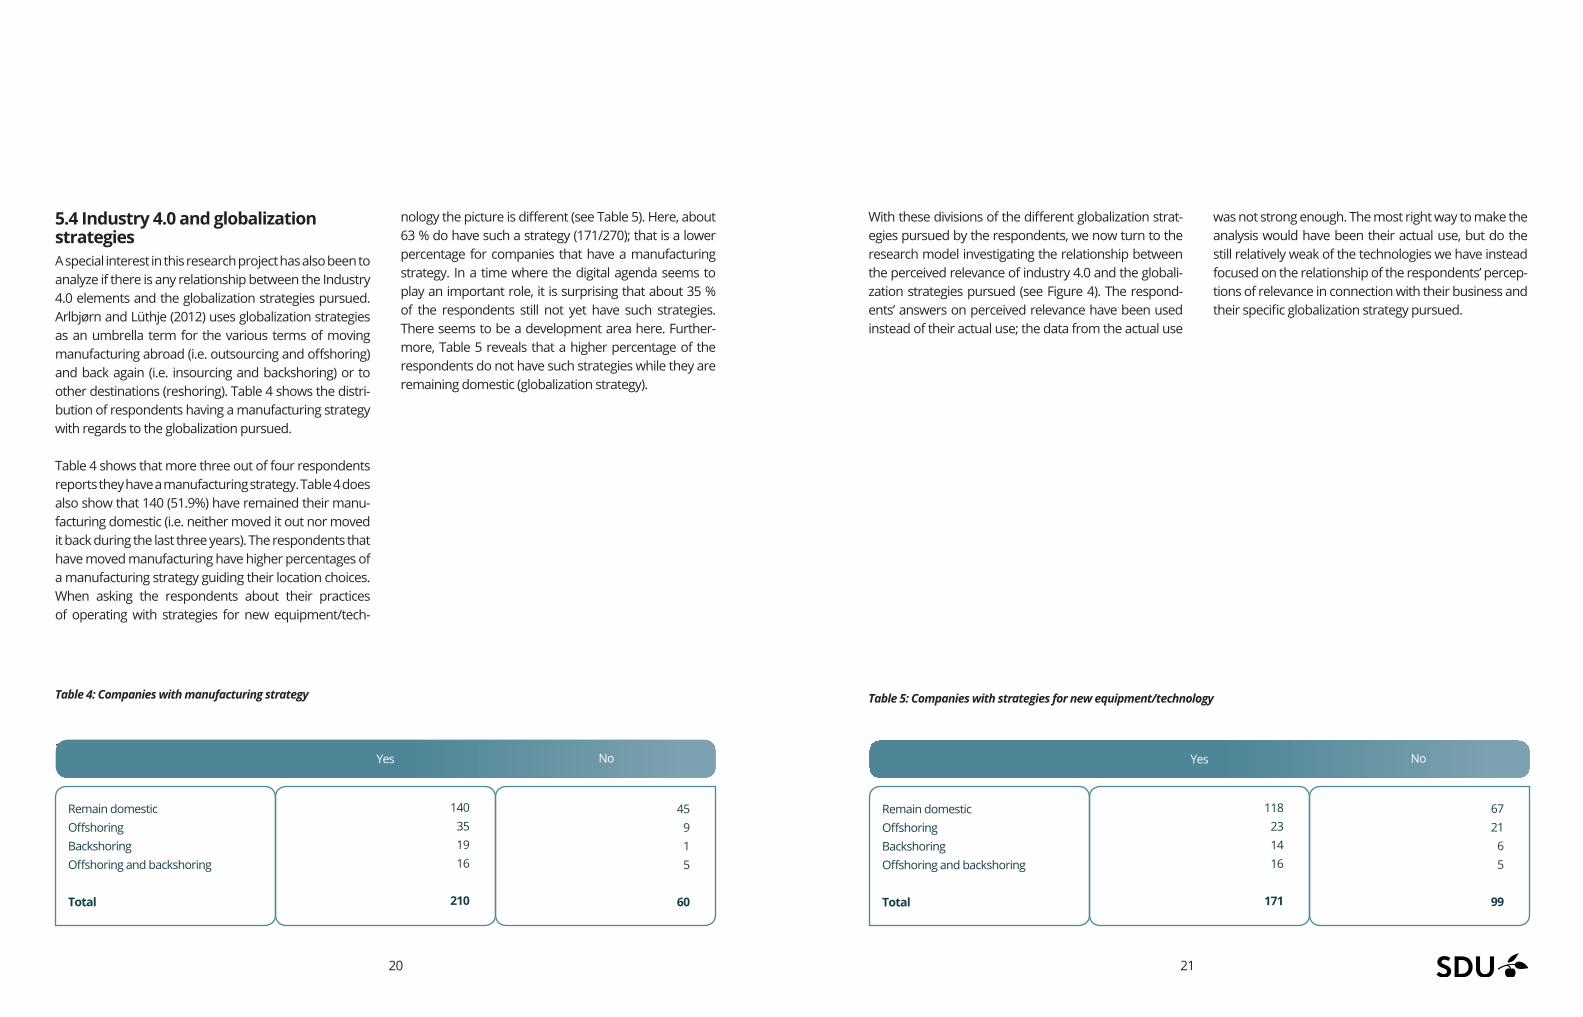
5.4 Industry 4.0 and globalization strategies A special interest in this research project has also been to analyze if there is any relationship between the Industry 4.0 elements and the globalization strategies pursued. Arlbjørn and Lüthje (2012) uses globalization strategies as an umbrella term for the various terms of moving manufacturing abroad (i.e. outsourcing and offshoring) and back again (i.e. insourcing and backshoring) or to other destinations (reshoring). Table 4 shows the distri-bution of respondents having a manufacturing strategy with regards to the globalization pursued.
Table 4 shows that more three out of four respondents reports they have a manufacturing strategy. Table 4 does also show that 140 (51.9%) have remained their manu-facturing domestic (i.e. neither moved it out nor moved it back during the last three years). The respondents that have moved manufacturing have higher percentages of a manufacturing strategy guiding their location choices. When asking the respondents about their practices of operating with strategies for new equipment/tech-
nology the picture is different (see Table 5). Here, about 63 % do have such a strategy (171/270); that is a lower percentage for companies that have a manufacturing strategy. In a time where the digital agenda seems to play an important role, it is surprising that about 35 % of the respondents still not yet have such strategies. There seems to be a development area here. Further-more, Table 5 reveals that a higher percentage of the respondents do not have such strategies while they are remaining domestic (globalization strategy).
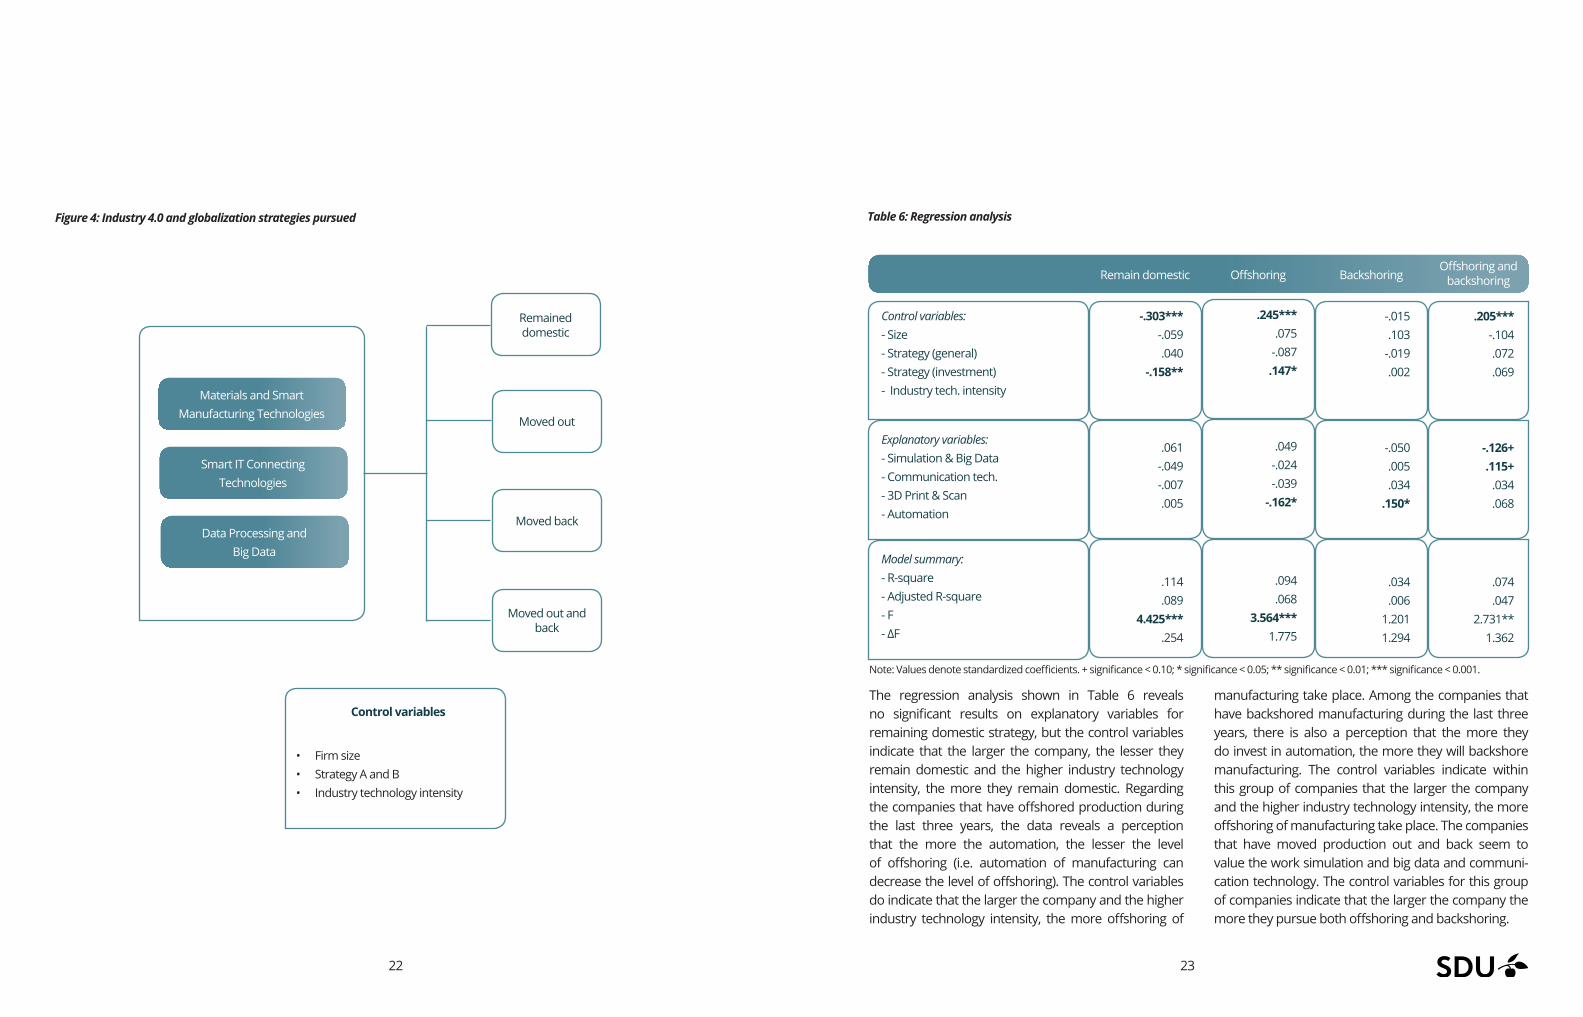
With these divisions of the different globalization strat-egies pursued by the respondents, we now turn to the research model investigating the relationship between the perceived relevance of industry 4.0 and the globali-zation strategies pursued (see Figure 4). The respond-ents’ answers on perceived relevance have been used instead of their actual use; the data from the actual use
was not strong enough. The most right way to make the analysis would have been their actual use, but do the still relatively weak of the technologies we have instead focused on the relationship of the respondents’ percep-tions of relevance in connection with their business and their specific globalization strategy pursued.
No NoTable 4: Companies with manufacturing strategy
Table 4: Companies with manufacturing strategy Table 5: Companies with strategies for new equipment/technology
Yes No Yes No
Remain domesticOffshoringBackshoringOffshoring and backshoring
Total
Remain domesticOffshoringBackshoringOffshoring and backshoring
Total
140351916
210
118231416
171
45915
60
6721
65
99
22 23
Figure 4: Industry 4.0 and globalization strategies pursued
The regression analysis shown in Table 6 reveals no significant results on explanatory variables for remaining domestic strategy, but the control variables indicate that the larger the company, the lesser they remain domestic and the higher industry technology intensity, the more they remain domestic. Regarding the companies that have offshored production during the last three years, the data reveals a perception that the more the automation, the lesser the level of offshoring (i.e. automation of manufacturing can decrease the level of offshoring). The control variables do indicate that the larger the company and the higher industry technology intensity, the more offshoring of
manufacturing take place. Among the companies that have backshored manufacturing during the last three years, there is also a perception that the more they do invest in automation, the more they will backshore manufacturing. The control variables indicate within this group of companies that the larger the company and the higher industry technology intensity, the more offshoring of manufacturing take place. The companies that have moved production out and back seem to value the work simulation and big data and communi-cation technology. The control variables for this group of companies indicate that the larger the company the more they pursue both offshoring and backshoring.
Materials and Smart Manufacturing Technologies
Smart IT Connecting Technologies
Data Processing and Big Data
Remained domestic
Moved out
Moved back
Moved out and back
• Firm size• Strategy A and B• Industry technology intensity
Control variables
Table 6: Regression analysis
Remain domestic Offshoring BackshoringOffshoring and
backshoring
Control variables:- Size- Strategy (general)- Strategy (investment)- Industry tech. intensity
Explanatory variables:- Simulation & Big Data- Communication tech.- 3D Print & Scan- Automation
Model summary:- R-square- Adjusted R-square- F- ∆F
-.303***-.059.040
-.158**
.061-.049-.007.005
.114
.0894.425***
.254
.245***.075
-.087.147*
.049
-.024-.039
-.162*
.094 .068
3.564***1.775
-.015.103
-.019.002
-.050.005.034
.150*
.034
.0061.2011.294
.205***-.104.072.069
-.126+.115+
.034
.068
.074
.0472.731**
1.362
Note: Values denote standardized coefficients. + significance < 0.10; * significance < 0.05; ** significance < 0.01; *** significance < 0.001.
24 25
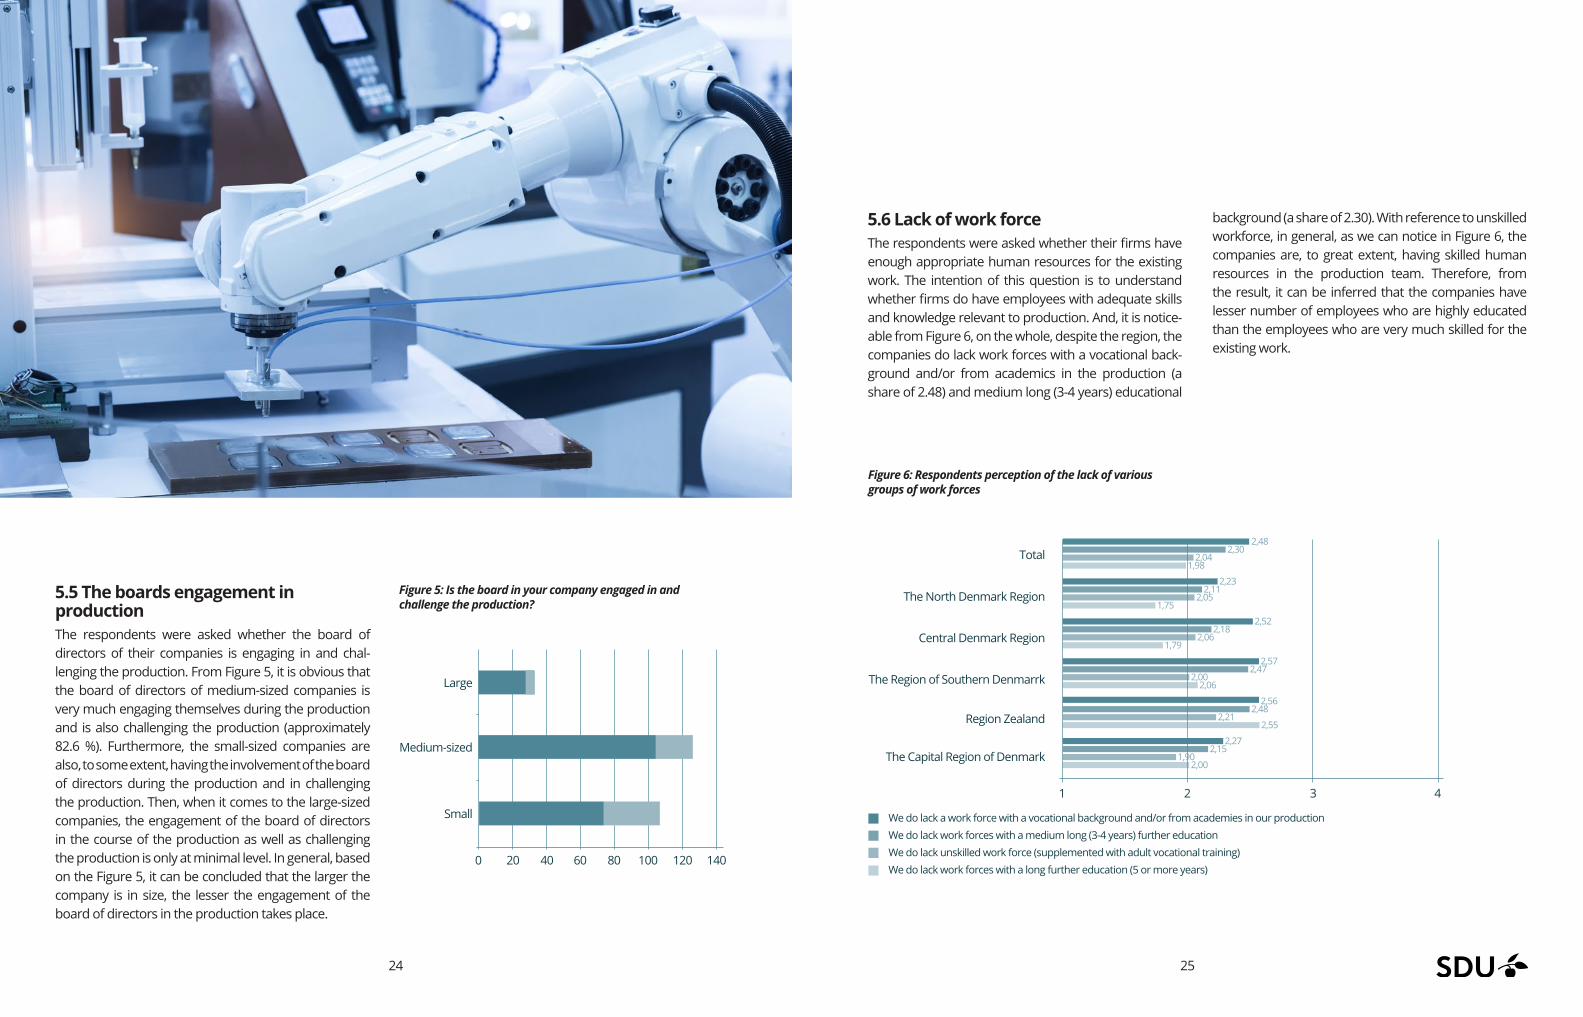
5.5 The boards engagement in productionThe respondents were asked whether the board of directors of their companies is engaging in and chal-lenging the production. From Figure 5, it is obvious that the board of directors of medium-sized companies is very much engaging themselves during the production and is also challenging the production (approximately 82.6 %). Furthermore, the small-sized companies are also, to some extent, having the involvement of the board of directors during the production and in challenging the production. Then, when it comes to the large-sized companies, the engagement of the board of directors in the course of the production as well as challenging the production is only at minimal level. In general, based on the Figure 5, it can be concluded that the larger the company is in size, the lesser the engagement of the board of directors in the production takes place.
5.6 Lack of work forceThe respondents were asked whether their firms have enough appropriate human resources for the existing work. The intention of this question is to understand whether firms do have employees with adequate skills and knowledge relevant to production. And, it is notice-able from Figure 6, on the whole, despite the region, the companies do lack work forces with a vocational back-ground and/or from academics in the production (a share of 2.48) and medium long (3-4 years) educational
background (a share of 2.30). With reference to unskilled workforce, in general, as we can notice in Figure 6, the companies are, to great extent, having skilled human resources in the production team. Therefore, from the result, it can be inferred that the companies have lesser number of employees who are highly educated than the employees who are very much skilled for the existing work.
Figure 5: Is the board in your company engaged in and challenge the production?
Figure 6: Respondents perception of the lack of various groups of work forces
Large
Medium-sized
Small
0
1
Total
The North Denmark Region
Central Denmark Region
The Region of Southern Denmarrk
Region Zealand
The Capital Region of Denmark
2 3 4
20 40 60 80 100 120 140
We do lack a work force with a vocational background and/or from academies in our production We do lack work forces with a medium long (3-4 years) further education We do lack unskilled work force (supplemented with adult vocational training) We do lack work forces with a long further education (5 or more years)
2,48 2,30 2,04 1,98 2,23 2,11 2,05 1,75
2,52 2,18 2,06 1,79
2,57 2,47 2,00 2,06
2,56 2,48 2,21 2,55
2,27 2,15 1,90 2,00
26 27
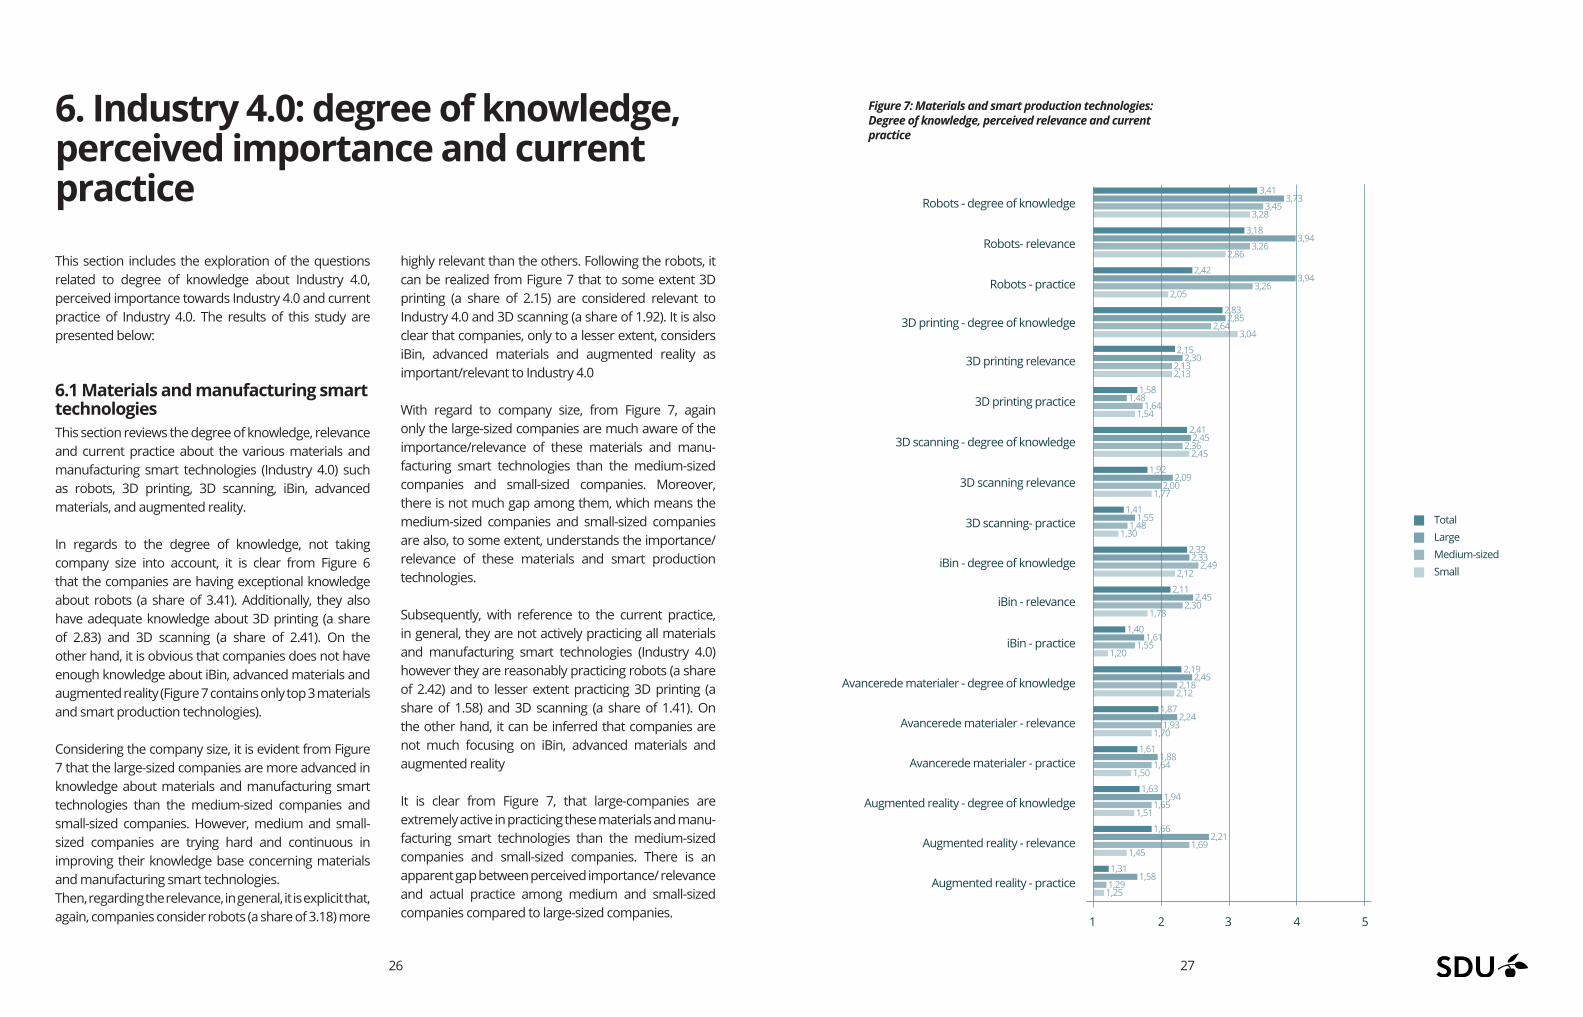
This section includes the exploration of the questions related to degree of knowledge about Industry 4.0, perceived importance towards Industry 4.0 and current practice of Industry 4.0. The results of this study are presented below:
6.1 Materials and manufacturing smart technologiesThis section reviews the degree of knowledge, relevance and current practice about the various materials and manufacturing smart technologies (Industry 4.0) such as robots, 3D printing, 3D scanning, iBin, advanced materials, and augmented reality.
In regards to the degree of knowledge, not taking company size into account, it is clear from Figure 6 that the companies are having exceptional knowledge about robots (a share of 3.41). Additionally, they also have adequate knowledge about 3D printing (a share of 2.83) and 3D scanning (a share of 2.41). On the other hand, it is obvious that companies does not have enough knowledge about iBin, advanced materials and augmented reality (Figure 7 contains only top 3 materials and smart production technologies).
Considering the company size, it is evident from Figure 7 that the large-sized companies are more advanced in knowledge about materials and manufacturing smart technologies than the medium-sized companies and small-sized companies. However, medium and small-sized companies are trying hard and continuous in improving their knowledge base concerning materials and manufacturing smart technologies.Then, regarding the relevance, in general, it is explicit that, again, companies consider robots (a share of 3.18) more
highly relevant than the others. Following the robots, it can be realized from Figure 7 that to some extent 3D printing (a share of 2.15) are considered relevant to Industry 4.0 and 3D scanning (a share of 1.92). It is also clear that companies, only to a lesser extent, considers iBin, advanced materials and augmented reality as important/relevant to Industry 4.0
With regard to company size, from Figure 7, again only the large-sized companies are much aware of the importance/relevance of these materials and manu-facturing smart technologies than the medium-sized companies and small-sized companies. Moreover, there is not much gap among them, which means the medium-sized companies and small-sized companies are also, to some extent, understands the importance/relevance of these materials and smart production technologies.
Subsequently, with reference to the current practice, in general, they are not actively practicing all materials and manufacturing smart technologies (Industry 4.0) however they are reasonably practicing robots (a share of 2.42) and to lesser extent practicing 3D printing (a share of 1.58) and 3D scanning (a share of 1.41). On the other hand, it can be inferred that companies are not much focusing on iBin, advanced materials and augmented reality
It is clear from Figure 7, that large-companies are extremely active in practicing these materials and manu-facturing smart technologies than the medium-sized companies and small-sized companies. There is an apparent gap between perceived importance/ relevance and actual practice among medium and small-sized companies compared to large-sized companies.
6. Industry 4.0: degree of knowledge, perceived importance and current practice
Figure 7: Materials and smart production technologies: Degree of knowledge, perceived relevance and current practice
3,41 3,73 3,45 3,28 3,18 3,94 3,26 2,86
2,42 3,94 3,26 2,05
2,83 2,85 2,64 3,04
2,15 2,30 2,13 2,13
1,58 1,48 1,64 1,54
2,41 2,45 2,36 2,45
1,92 2,09 2,00 1,77
1,41 1,55 1,48 1,30
2,32 2,33 2,49 2,12
2,11 2,45 2,30 1,78 1,40 1,61 1,55 1,20
2,19 2,45 2,18 2,12 1,87 2,24 1,93 1,70
1,61 1,88 1,64 1,50
1,63 1,94 1,65 1,51
1,66 2,21 1,69 1,45
1,31 1,58 1,29 1,25
1 2 3 4 5
Total Large Medium-sized Small
Robots - degree of knowledge
Robots- relevance
Robots - practice
3D printing - degree of knowledge
3D printing relevance
3D printing practice
3D scanning - degree of knowledge
3D scanning relevance
3D scanning- practice
iBin - degree of knowledge
iBin - relevance
iBin - practice
Avancerede materialer - degree of knowledge
Avancerede materialer - relevance
Avancerede materialer - practice
Augmented reality - degree of knowledge
Augmented reality - relevance
Augmented reality - practice
28 29
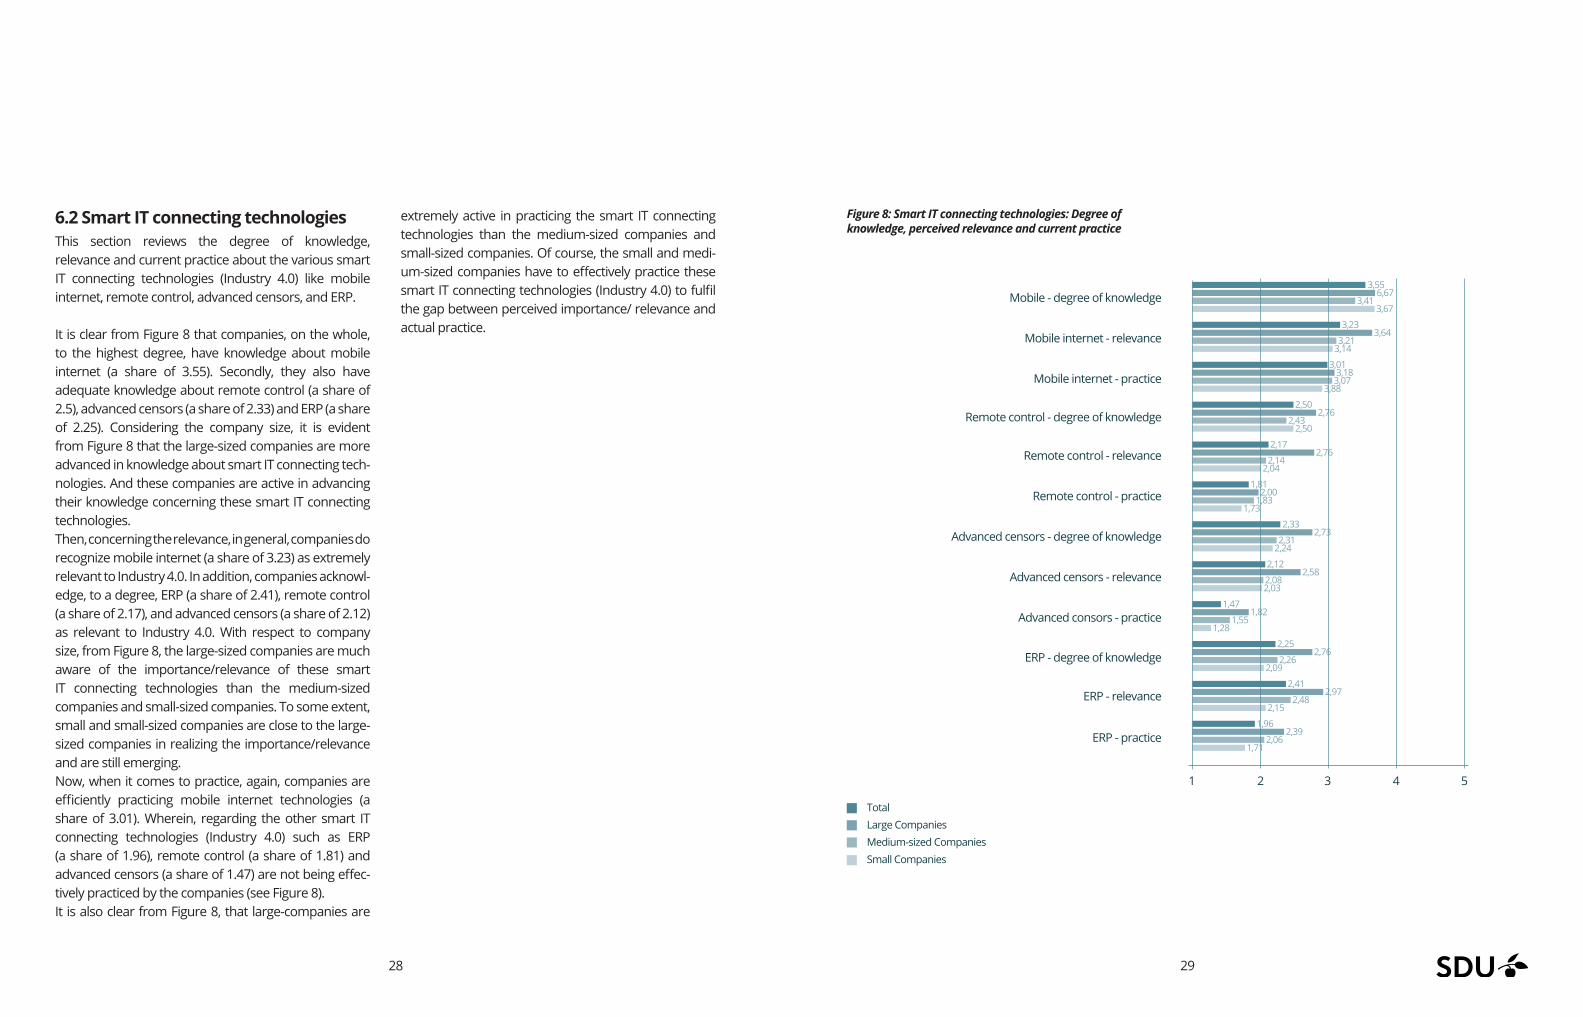
6.2 Smart IT connecting technologiesThis section reviews the degree of knowledge, relevance and current practice about the various smart IT connecting technologies (Industry 4.0) like mobile internet, remote control, advanced censors, and ERP.
It is clear from Figure 8 that companies, on the whole, to the highest degree, have knowledge about mobile internet (a share of 3.55). Secondly, they also have adequate knowledge about remote control (a share of 2.5), advanced censors (a share of 2.33) and ERP (a share of 2.25). Considering the company size, it is evident from Figure 8 that the large-sized companies are more advanced in knowledge about smart IT connecting tech-nologies. And these companies are active in advancing their knowledge concerning these smart IT connecting technologies.Then, concerning the relevance, in general, companies do recognize mobile internet (a share of 3.23) as extremely relevant to Industry 4.0. In addition, companies acknowl-edge, to a degree, ERP (a share of 2.41), remote control (a share of 2.17), and advanced censors (a share of 2.12) as relevant to Industry 4.0. With respect to company size, from Figure 8, the large-sized companies are much aware of the importance/relevance of these smart IT connecting technologies than the medium-sized companies and small-sized companies. To some extent, small and small-sized companies are close to the large-sized companies in realizing the importance/relevance and are still emerging.Now, when it comes to practice, again, companies are efficiently practicing mobile internet technologies (a share of 3.01). Wherein, regarding the other smart IT connecting technologies (Industry 4.0) such as ERP (a share of 1.96), remote control (a share of 1.81) and advanced censors (a share of 1.47) are not being effec-tively practiced by the companies (see Figure 8). It is also clear from Figure 8, that large-companies are
extremely active in practicing the smart IT connecting technologies than the medium-sized companies and small-sized companies. Of course, the small and medi-um-sized companies have to effectively practice these smart IT connecting technologies (Industry 4.0) to fulfil the gap between perceived importance/ relevance and actual practice.
Figure 8: Smart IT connecting technologies: Degree of knowledge, perceived relevance and current practice
3,55 6,67 3,41 3,67 3,23 3,64 3,21 3,14
3,01 3,18 3,07 3,88
2,50 2,76 2,43 2,50
2,17 2,76 2,14 2,04
1,81 2,00 1,83 1,73
2,33 2,73 2,31 2,24
2,12 2,58 2,08 2,03
1,47 1,82 1,55 1,28
2,25 2,76 2,26 2,09
2,41 2,97 2,48 2,15 1,96 2,39 2,06 1,71
1 2 3 4 5
Total Large Companies Medium-sized Companies Small Companies
Mobile - degree of knowledge
Mobile internet - relevance
Mobile internet - practice
Remote control - degree of knowledge
Remote control - relevance
Remote control - practice
Advanced censors - degree of knowledge
Advanced censors - relevance
Advanced consors - practice
ERP - degree of knowledge
ERP - relevance
ERP - practice
30 31
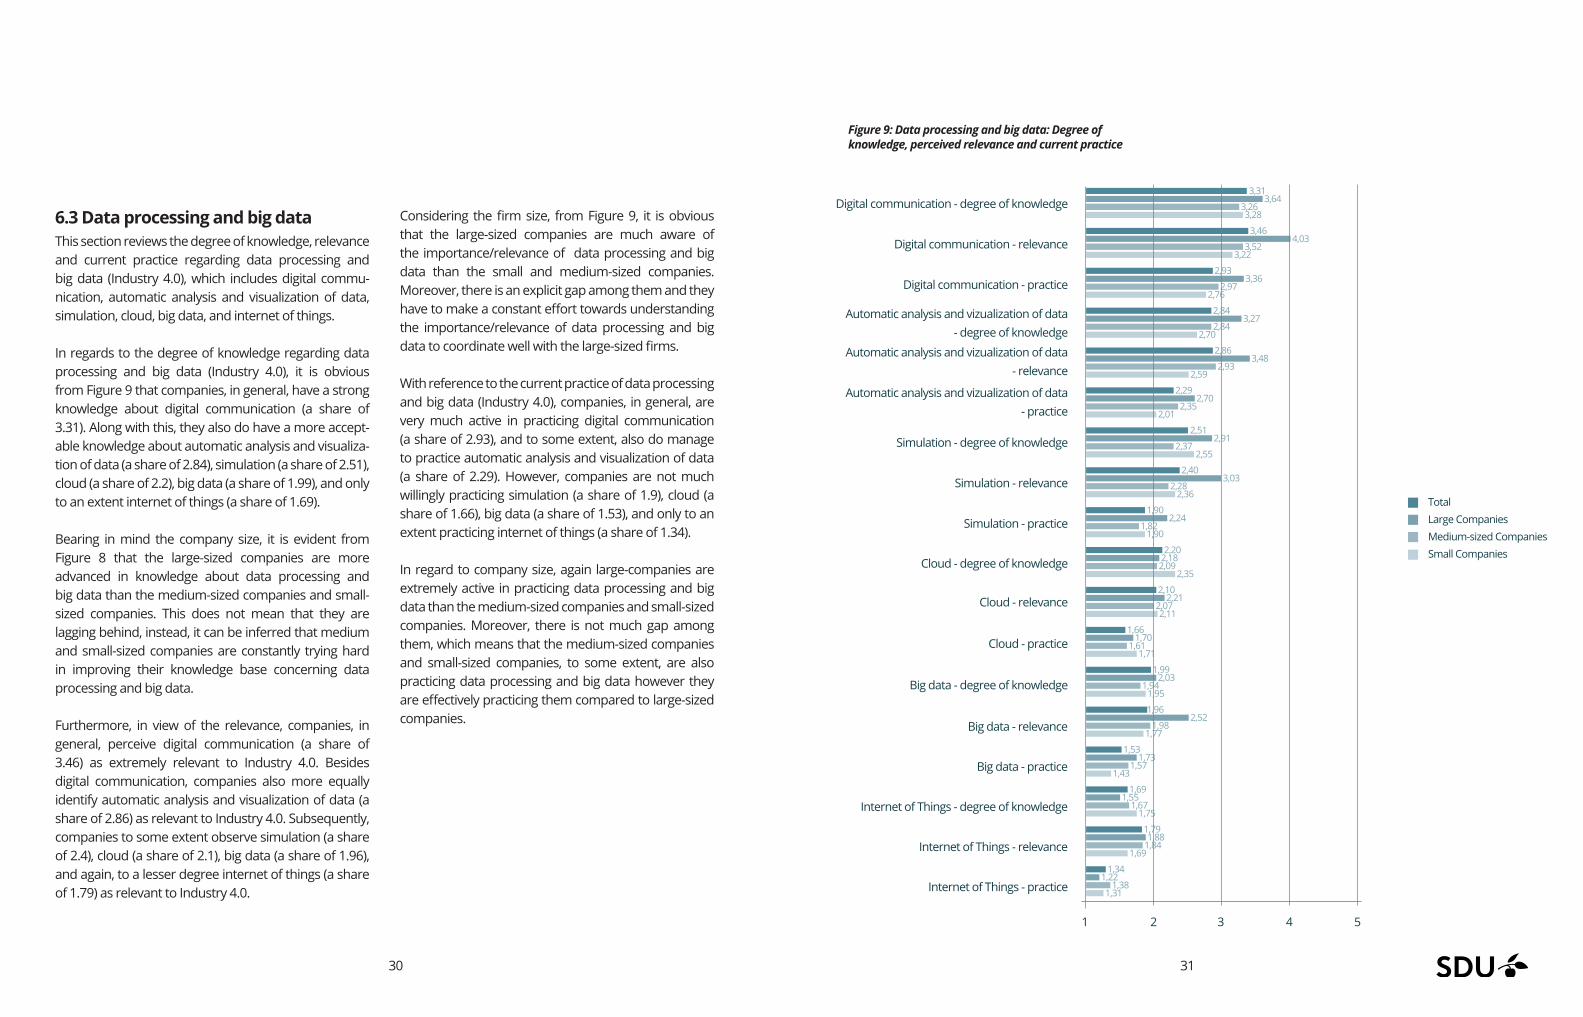
6.3 Data processing and big dataThis section reviews the degree of knowledge, relevance and current practice regarding data processing and big data (Industry 4.0), which includes digital commu-nication, automatic analysis and visualization of data, simulation, cloud, big data, and internet of things.
In regards to the degree of knowledge regarding data processing and big data (Industry 4.0), it is obvious from Figure 9 that companies, in general, have a strong knowledge about digital communication (a share of 3.31). Along with this, they also do have a more accept-able knowledge about automatic analysis and visualiza-tion of data (a share of 2.84), simulation (a share of 2.51), cloud (a share of 2.2), big data (a share of 1.99), and only to an extent internet of things (a share of 1.69).
Bearing in mind the company size, it is evident from Figure 8 that the large-sized companies are more advanced in knowledge about data processing and big data than the medium-sized companies and small-sized companies. This does not mean that they are lagging behind, instead, it can be inferred that medium and small-sized companies are constantly trying hard in improving their knowledge base concerning data processing and big data.
Furthermore, in view of the relevance, companies, in general, perceive digital communication (a share of 3.46) as extremely relevant to Industry 4.0. Besides digital communication, companies also more equally identify automatic analysis and visualization of data (a share of 2.86) as relevant to Industry 4.0. Subsequently, companies to some extent observe simulation (a share of 2.4), cloud (a share of 2.1), big data (a share of 1.96), and again, to a lesser degree internet of things (a share of 1.79) as relevant to Industry 4.0.
Considering the firm size, from Figure 9, it is obvious that the large-sized companies are much aware of the importance/relevance of data processing and big data than the small and medium-sized companies. Moreover, there is an explicit gap among them and they have to make a constant effort towards understanding the importance/relevance of data processing and big data to coordinate well with the large-sized firms.
With reference to the current practice of data processing and big data (Industry 4.0), companies, in general, are very much active in practicing digital communication (a share of 2.93), and to some extent, also do manage to practice automatic analysis and visualization of data (a share of 2.29). However, companies are not much willingly practicing simulation (a share of 1.9), cloud (a share of 1.66), big data (a share of 1.53), and only to an extent practicing internet of things (a share of 1.34).
In regard to company size, again large-companies are extremely active in practicing data processing and big data than the medium-sized companies and small-sized companies. Moreover, there is not much gap among them, which means that the medium-sized companies and small-sized companies, to some extent, are also practicing data processing and big data however they are effectively practicing them compared to large-sized companies.
Figure 9: Data processing and big data: Degree of knowledge, perceived relevance and current practice
3,31 3,64 3,26 3,28 3,46 4,03 3,52 3,22
2,93 3,36 2,97 2,76
2,84 3,27 2,84 2,70
2,86 3,48 2,93 2,59
2,29 2,70 2,35 2,01
2,51 2,91 2,37 2,55
2,40 3,03 2,28 2,36
1,90 2,24 1,82 1,90
2,20 2,18 2,09 2,35
2,10 2,21 2,07 2,11 1,66 1,70 1,61 1,71
1,99 2,03 1,94 1,95
1,96 2,52 1,98 1,77
1,53 1,73 1,57 1,43 1,69 1,55 1,67 1,75
1,79 1,88 1,84 1,69 1,34 1,22 1,38 1,31
1 2 3 4 5
Total Large Companies Medium-sized Companies Small Companies
Digital communication - degree of knowledge
Digital communication - relevance
Digital communication - practice
Automatic analysis and vizualization of data - degree of knowledge
Automatic analysis and vizualization of data - relevance
Automatic analysis and vizualization of data - practice
Simulation - degree of knowledge
Simulation - relevance
Simulation - practice
Cloud - degree of knowledge
Cloud - relevance
Cloud - practice
Big data - degree of knowledge
Big data - relevance
Big data - practice
Internet of Things - degree of knowledge
Internet of Things - relevance
Internet of Things - practice
32 33
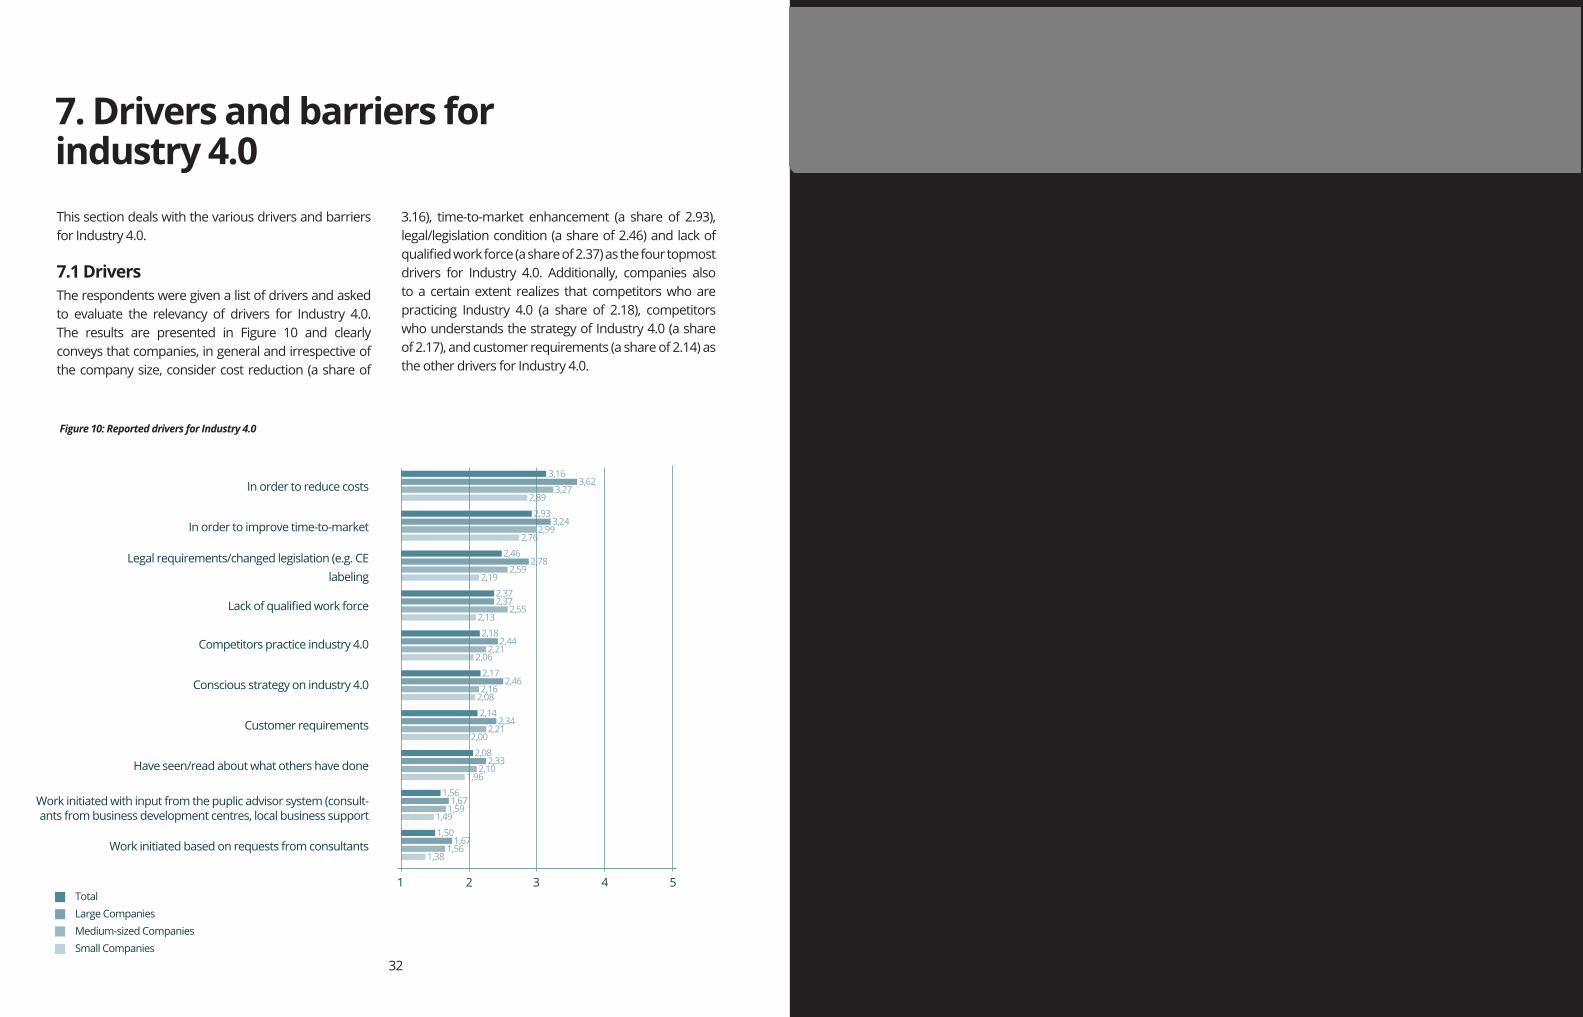
This section deals with the various drivers and barriers for Industry 4.0.
7.1 DriversThe respondents were given a list of drivers and asked to evaluate the relevancy of drivers for Industry 4.0. The results are presented in Figure 10 and clearly conveys that companies, in general and irrespective of the company size, consider cost reduction (a share of
3.16), time-to-market enhancement (a share of 2.93), legal/legislation condition (a share of 2.46) and lack of qualified work force (a share of 2.37) as the four topmost drivers for Industry 4.0. Additionally, companies also to a certain extent realizes that competitors who are practicing Industry 4.0 (a share of 2.18), competitors who understands the strategy of Industry 4.0 (a share of 2.17), and customer requirements (a share of 2.14) as the other drivers for Industry 4.0.
7. Drivers and barriers for industry 4.0
Figure 10: Reported drivers for Industry 4.0
3,16 3,62 3,27 2,89 2,93 3,24 2,99 2,76
2,46 2,78 2,59 2,19
2,37 2,37 2,55 2,13
2,18 2,44 2,21 2,06
2,17 2,46 2,16 2,08
2,14 2,34 2,21 2,00
2,08 2,33 2,10 1,96
1,56 1,67 1,59 1,49
1,50 1,67 1,56 1,38
In order to reduce costs
In order to improve time-to-market
Legal requirements/changed legislation (e.g. CE labeling
Lack of qualified work force
Competitors practice industry 4.0
Conscious strategy on industry 4.0
Customer requirements
Have seen/read about what others have done
Work initiated with input from the puplic advisor system (consult-ants from business development centres, local business support
Work initiated based on requests from consultants
1 2 3 4 5Total Large Companies Medium-sized Companies Small Companies
Relevant billede indsættes. Input til billedevalg kommer fra kunden.
34 35
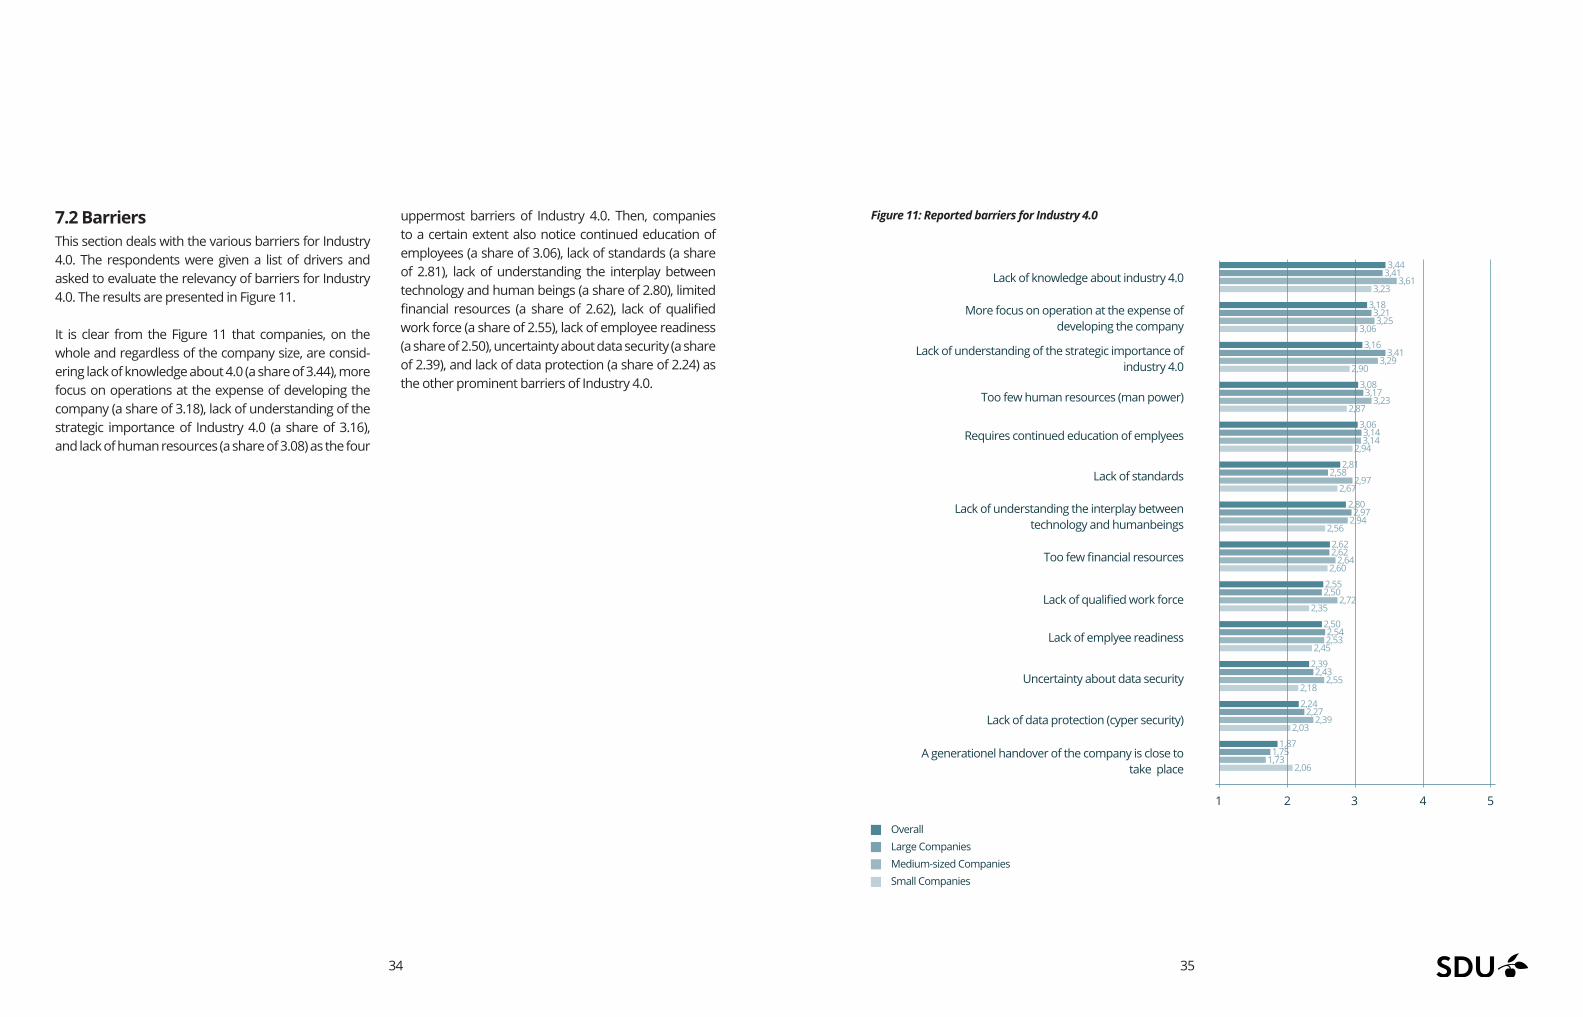
7.2 BarriersThis section deals with the various barriers for Industry 4.0. The respondents were given a list of drivers and asked to evaluate the relevancy of barriers for Industry 4.0. The results are presented in Figure 11.
It is clear from the Figure 11 that companies, on the whole and regardless of the company size, are consid-ering lack of knowledge about 4.0 (a share of 3.44), more focus on operations at the expense of developing the company (a share of 3.18), lack of understanding of the strategic importance of Industry 4.0 (a share of 3.16), and lack of human resources (a share of 3.08) as the four
uppermost barriers of Industry 4.0. Then, companies to a certain extent also notice continued education of employees (a share of 3.06), lack of standards (a share of 2.81), lack of understanding the interplay between technology and human beings (a share of 2.80), limited financial resources (a share of 2.62), lack of qualified work force (a share of 2.55), lack of employee readiness (a share of 2.50), uncertainty about data security (a share of 2.39), and lack of data protection (a share of 2.24) as the other prominent barriers of Industry 4.0.
Figure 11: Reported barriers for Industry 4.0
3,44 3,41 3,61 3,23
3,18 3,21 3,25 3,06
3,16 3,41 3,29 2,90
3,08 3,17 3,23 2,87
3,06 3,14 3,14 2,94
2,81 2,58 2,97 2,67
2,80 2,97 2,94 2,56
2,62 2,62 2,64 2,60
2,55 2,50 2,72 2,35
2,50 2,54 2,53 2,45
2,39 2,43 2,55 2,18
2,24 2,27 2,39 2,03
1,87 1,75 1,73 2,06
Lack of knowledge about industry 4.0
More focus on operation at the expense of developing the company
Lack of understanding of the strategic importance of industry 4.0
Too few human resources (man power)
Requires continued education of emplyees
Lack of standards
Lack of understanding the interplay between technology and humanbeings
Too few financial resources
Lack of qualified work force
Lack of emplyee readiness
Uncertainty about data security
Lack of data protection (cyper security)
A generationel handover of the company is close to take place
1 2 3 4 5
Overall Large Companies Medium-sized Companies Small Companies
36 37
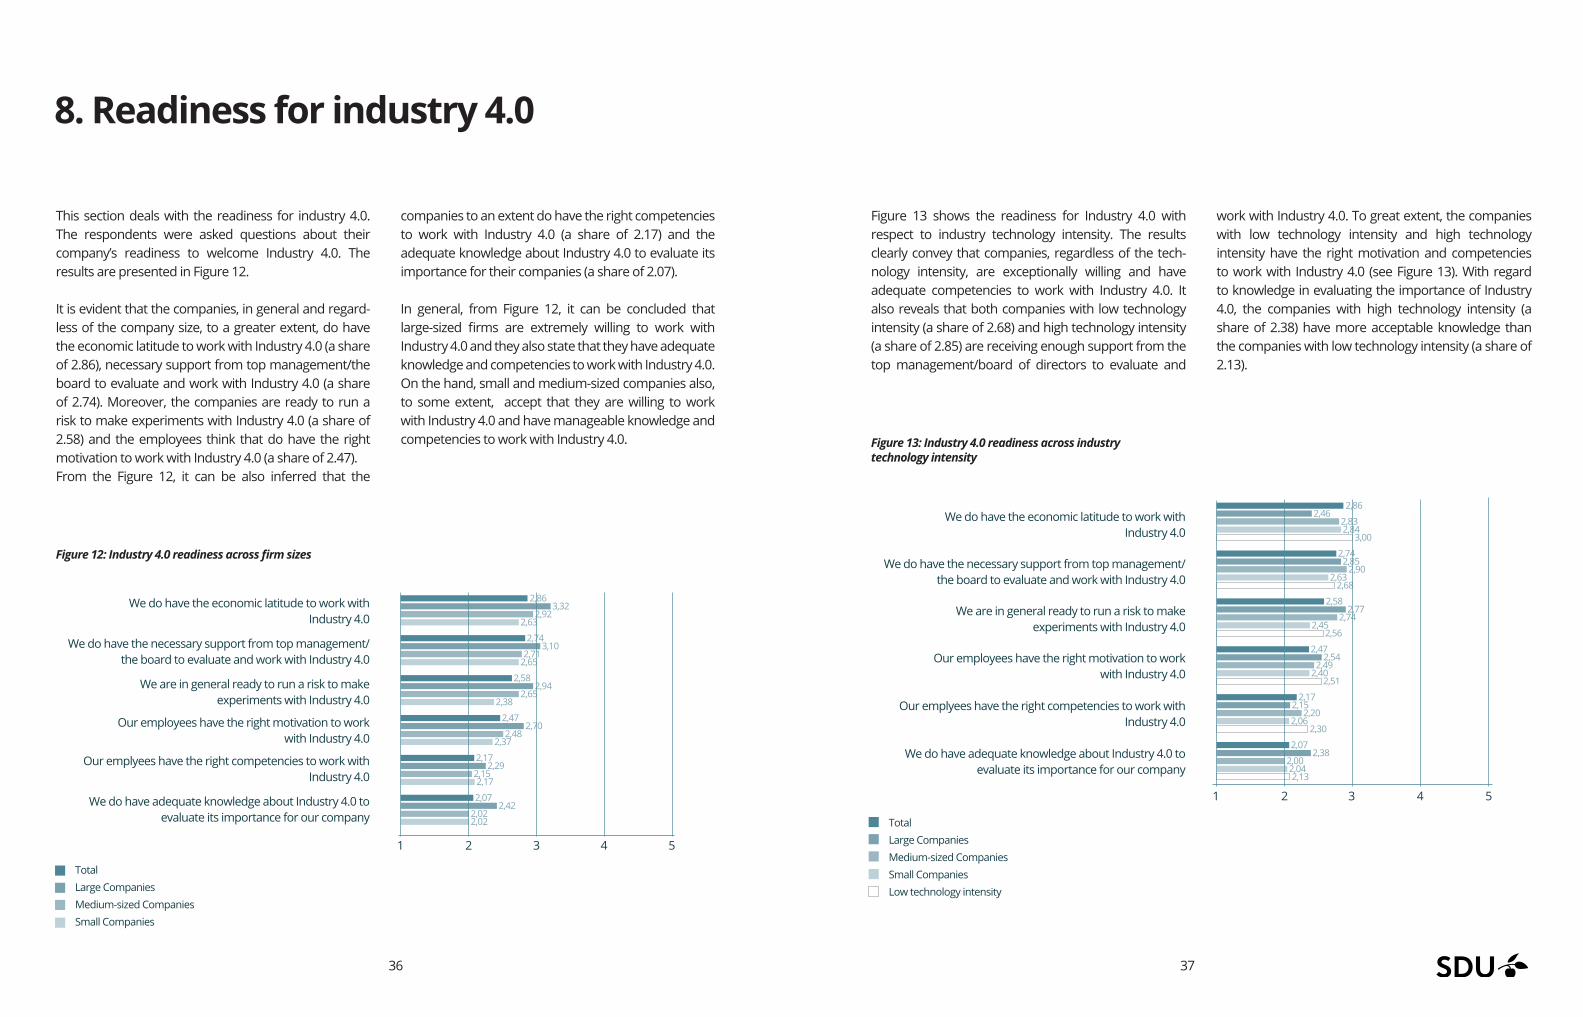
This section deals with the readiness for industry 4.0. The respondents were asked questions about their company’s readiness to welcome Industry 4.0. The results are presented in Figure 12.
It is evident that the companies, in general and regard-less of the company size, to a greater extent, do have the economic latitude to work with Industry 4.0 (a share of 2.86), necessary support from top management/the board to evaluate and work with Industry 4.0 (a share of 2.74). Moreover, the companies are ready to run a risk to make experiments with Industry 4.0 (a share of 2.58) and the employees think that do have the right motivation to work with Industry 4.0 (a share of 2.47).From the Figure 12, it can be also inferred that the
companies to an extent do have the right competencies to work with Industry 4.0 (a share of 2.17) and the adequate knowledge about Industry 4.0 to evaluate its importance for their companies (a share of 2.07).
In general, from Figure 12, it can be concluded that large-sized firms are extremely willing to work with Industry 4.0 and they also state that they have adequate knowledge and competencies to work with Industry 4.0. On the hand, small and medium-sized companies also, to some extent, accept that they are willing to work with Industry 4.0 and have manageable knowledge and competencies to work with Industry 4.0.
8. Readiness for industry 4.0
Figure 12: Industry 4.0 readiness across firm sizes
2,86 3,32 2,92 2,63
2,74 3,10 2,71 2,65
2,58 2,94 2,65 2,38
2,47 2,70 2,48 2,37
2,17 2,29 2,15 2,17
2,07 2,42 2,02 2,02
We do have the economic latitude to work with Industry 4.0
We do have the necessary support from top management/the board to evaluate and work with Industry 4.0
We are in general ready to run a risk to make experiments with Industry 4.0
Our employees have the right motivation to work with Industry 4.0
Our emplyees have the right competencies to work with Industry 4.0
We do have adequate knowledge about Industry 4.0 to evaluate its importance for our company
1 2 3 4 5
Total Large Companies Medium-sized Companies Small Companies
Figure 13 shows the readiness for Industry 4.0 with respect to industry technology intensity. The results clearly convey that companies, regardless of the tech-nology intensity, are exceptionally willing and have adequate competencies to work with Industry 4.0. It also reveals that both companies with low technology intensity (a share of 2.68) and high technology intensity (a share of 2.85) are receiving enough support from the top management/board of directors to evaluate and
work with Industry 4.0. To great extent, the companies with low technology intensity and high technology intensity have the right motivation and competencies to work with Industry 4.0 (see Figure 13). With regard to knowledge in evaluating the importance of Industry 4.0, the companies with high technology intensity (a share of 2.38) have more acceptable knowledge than the companies with low technology intensity (a share of 2.13).
Figure 13: Industry 4.0 readiness across industry technology intensity
2,86 2,46 2,83 2,84 3,00
2,74 2,85 2,90 2,63 2,68
2,58 2,77 2,74 2,45 2,56
2,47 2,54 2,49 2,40 2,51
2,17 2,15 2,20 2,06 2,30
2,07 2,38 2,00 2,04 2,13
We do have the economic latitude to work with Industry 4.0
We do have the necessary support from top management/the board to evaluate and work with Industry 4.0
We are in general ready to run a risk to make experiments with Industry 4.0
Our employees have the right motivation to work with Industry 4.0
Our emplyees have the right competencies to work with Industry 4.0
We do have adequate knowledge about Industry 4.0 to evaluate its importance for our company
1 2 3 4 5
Total Large Companies Medium-sized Companies Small Companies Low technology intensity
38 39
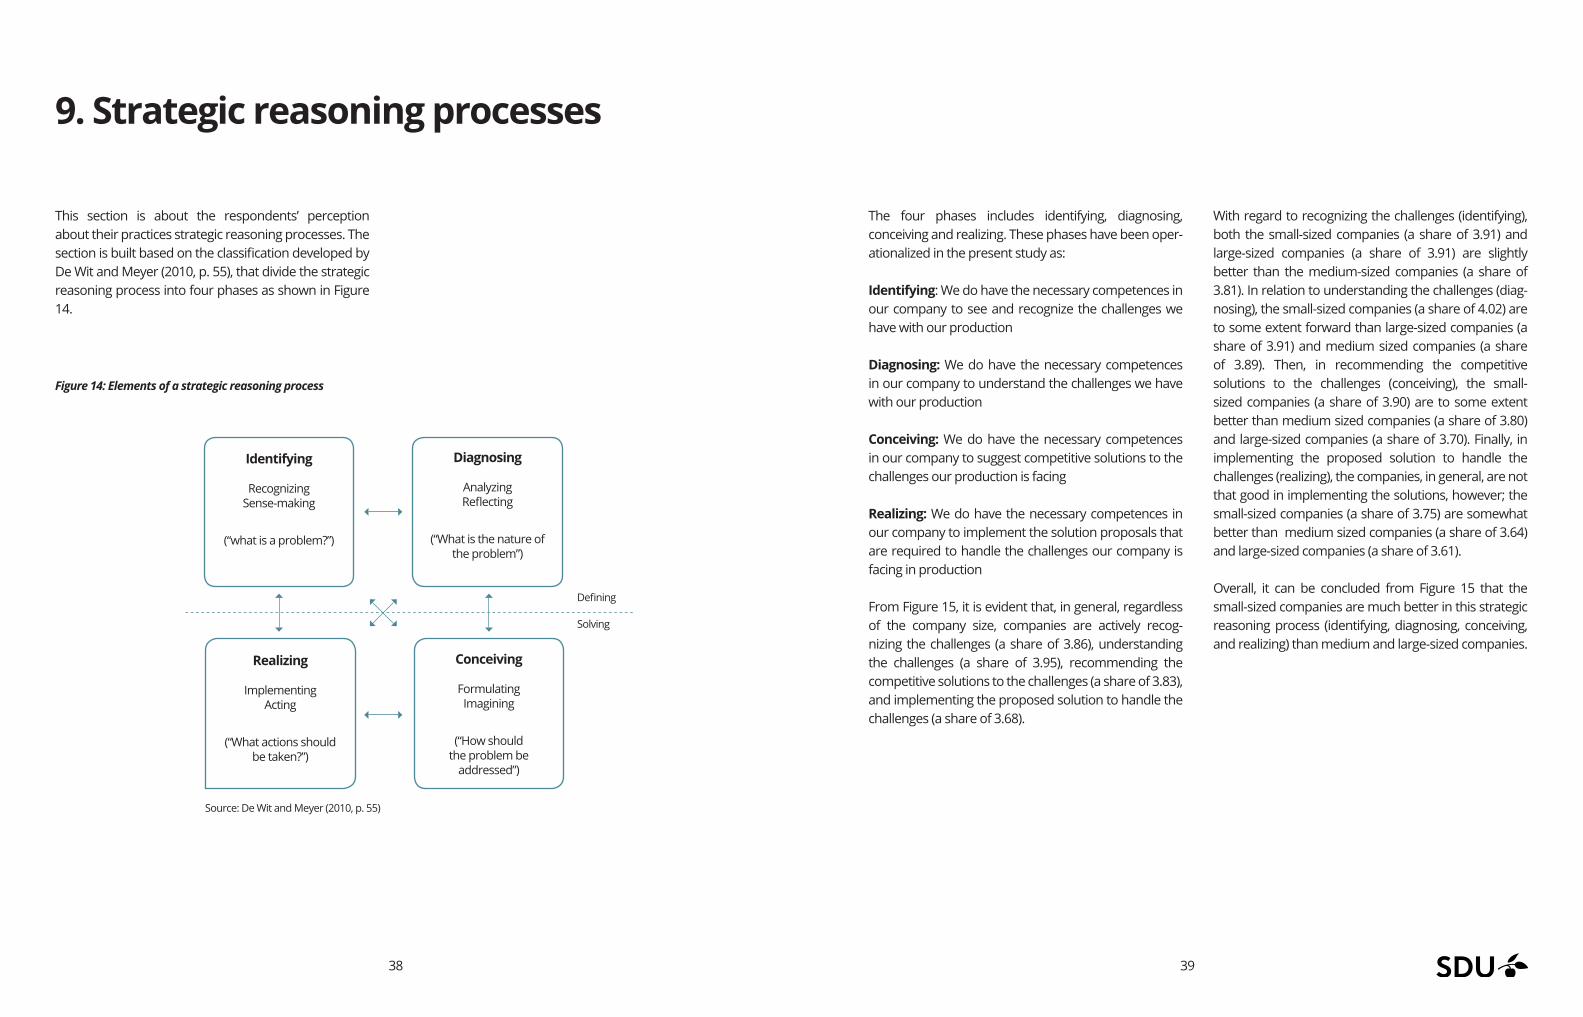
The four phases includes identifying, diagnosing, conceiving and realizing. These phases have been oper-ationalized in the present study as:
Identifying: We do have the necessary competences in our company to see and recognize the challenges we have with our production
Diagnosing: We do have the necessary competences in our company to understand the challenges we have with our production
Conceiving: We do have the necessary competences in our company to suggest competitive solutions to the challenges our production is facing
Realizing: We do have the necessary competences in our company to implement the solution proposals that are required to handle the challenges our company is facing in production
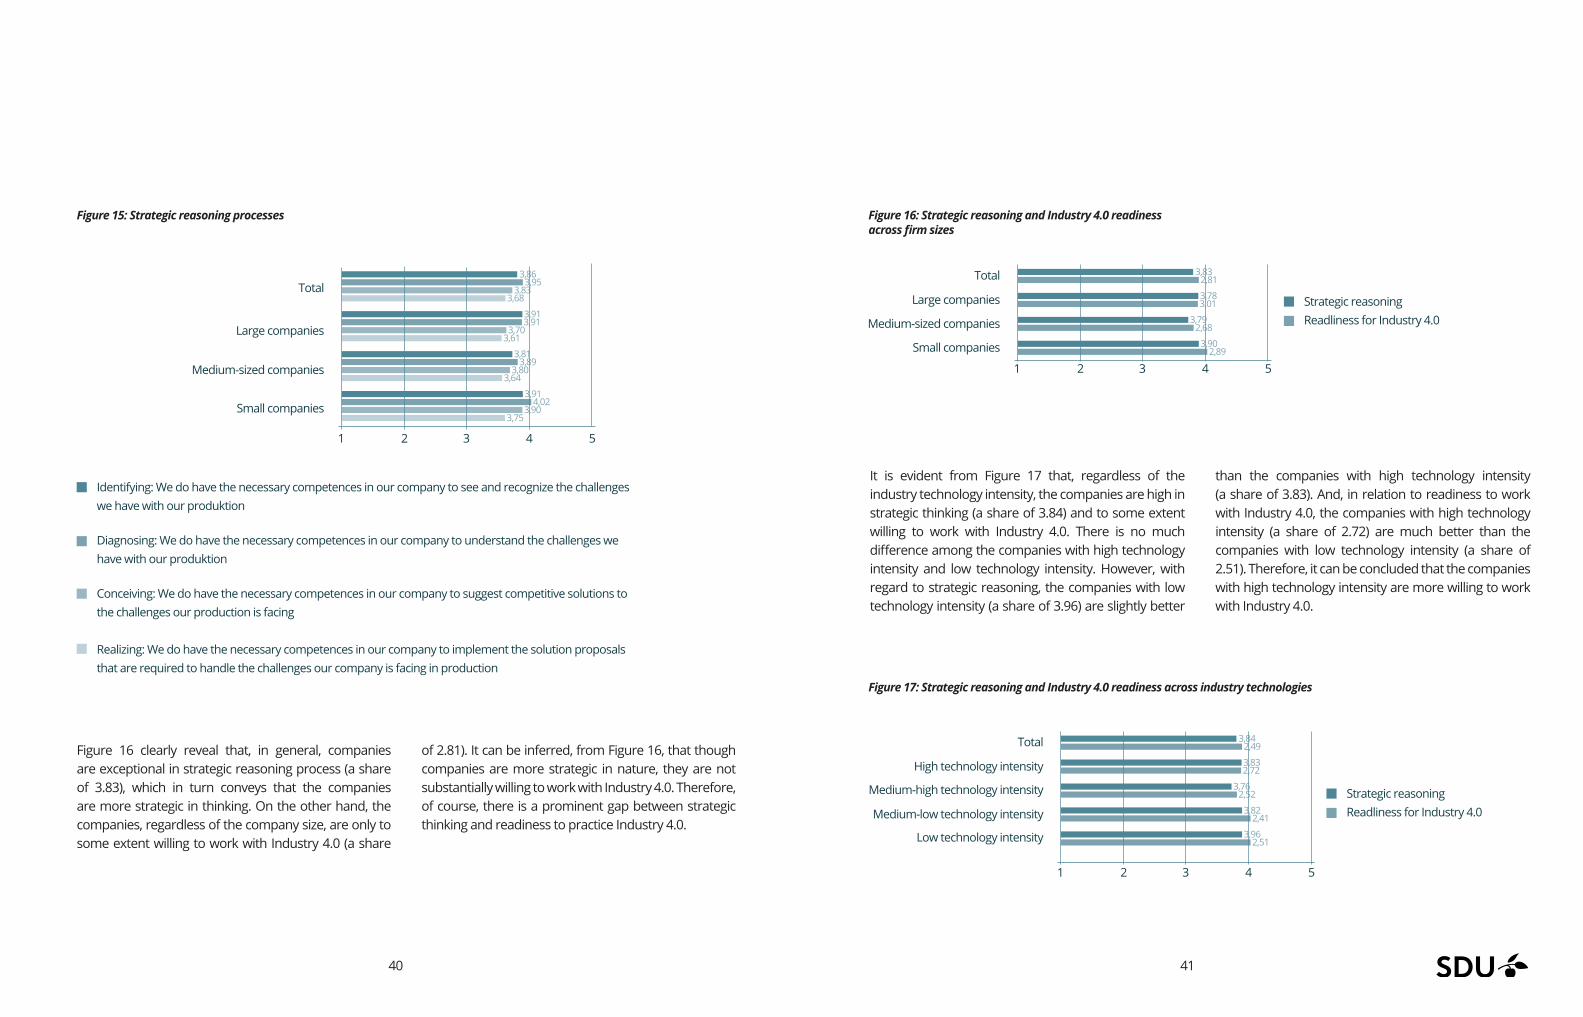
From Figure 15, it is evident that, in general, regardless of the company size, companies are actively recog-nizing the challenges (a share of 3.86), understanding the challenges (a share of 3.95), recommending the competitive solutions to the challenges (a share of 3.83), and implementing the proposed solution to handle the challenges (a share of 3.68).
With regard to recognizing the challenges (identifying), both the small-sized companies (a share of 3.91) and large-sized companies (a share of 3.91) are slightly better than the medium-sized companies (a share of 3.81). In relation to understanding the challenges (diag-nosing), the small-sized companies (a share of 4.02) are to some extent forward than large-sized companies (a share of 3.91) and medium sized companies (a share of 3.89). Then, in recommending the competitive solutions to the challenges (conceiving), the small-sized companies (a share of 3.90) are to some extent better than medium sized companies (a share of 3.80) and large-sized companies (a share of 3.70). Finally, in implementing the proposed solution to handle the challenges (realizing), the companies, in general, are not that good in implementing the solutions, however; the small-sized companies (a share of 3.75) are somewhat better than medium sized companies (a share of 3.64) and large-sized companies (a share of 3.61).
Overall, it can be concluded from Figure 15 that the small-sized companies are much better in this strategic reasoning process (identifying, diagnosing, conceiving, and realizing) than medium and large-sized companies.
9. Strategic reasoning processes
Figure 14: Elements of a strategic reasoning process
Source: De Wit and Meyer (2010, p. 55)
Identifying
Recognizing Sense-making
(“what is a problem?”)
Realizing
Implementing Acting
(“What actions should be taken?”)
Diagnosing
Analyzing Reflecting
(“What is the nature of the problem”)
Defining
Solving
Conceiving
Formulating Imagining
(“How should the problem be
addressed”)
This section is about the respondents’ perception about their practices strategic reasoning processes. The section is built based on the classification developed by De Wit and Meyer (2010, p. 55), that divide the strategic reasoning process into four phases as shown in Figure 14.
40 41
Figure 16 clearly reveal that, in general, companies are exceptional in strategic reasoning process (a share of 3.83), which in turn conveys that the companies are more strategic in thinking. On the other hand, the companies, regardless of the company size, are only to some extent willing to work with Industry 4.0 (a share
of 2.81). It can be inferred, from Figure 16, that though companies are more strategic in nature, they are not substantially willing to work with Industry 4.0. Therefore, of course, there is a prominent gap between strategic thinking and readiness to practice Industry 4.0.
Figure 15: Strategic reasoning processes Figure 16: Strategic reasoning and Industry 4.0 readiness across firm sizes
1
1
Total
Total
Large companies
High technology intensity
Medium-sized companies
Medium-high technology intensity
Small companies
Medium-low technology intensity
Low technology intensity
3
3
2
2
5
5
4
4
Identifying: We do have the necessary competences in our company to see and recognize the challenges we have with our produktion
Diagnosing: We do have the necessary competences in our company to understand the challenges we have with our produktion
Conceiving: We do have the necessary competences in our company to suggest competitive solutions to the challenges our production is facing Realizing: We do have the necessary competences in our company to implement the solution proposals that are required to handle the challenges our company is facing in production
Strategic reasoningReadliness for Industry 4.0
Strategic reasoningReadliness for Industry 4.0
3,83 2,81 3,78 3,01 3,79 2,68 3,90 2,89
3,84 2,49 3,83 2,72 3,76 2,52 3,82 2,41
3,96 2,51
1
Total
Large companies
Medium-sized companies
Small companies
32 54
3,86 3,95 3,83 3,68
3,91 3,91 3,70 3,61
3,81 3,89 3,80 3,64
3,91 4,02 3,90 3,75
It is evident from Figure 17 that, regardless of the industry technology intensity, the companies are high in strategic thinking (a share of 3.84) and to some extent willing to work with Industry 4.0. There is no much difference among the companies with high technology intensity and low technology intensity. However, with regard to strategic reasoning, the companies with low technology intensity (a share of 3.96) are slightly better
than the companies with high technology intensity (a share of 3.83). And, in relation to readiness to work with Industry 4.0, the companies with high technology intensity (a share of 2.72) are much better than the companies with low technology intensity (a share of 2.51). Therefore, it can be concluded that the companies with high technology intensity are more willing to work with Industry 4.0.
Figure 17: Strategic reasoning and Industry 4.0 readiness across industry technologies
42 43
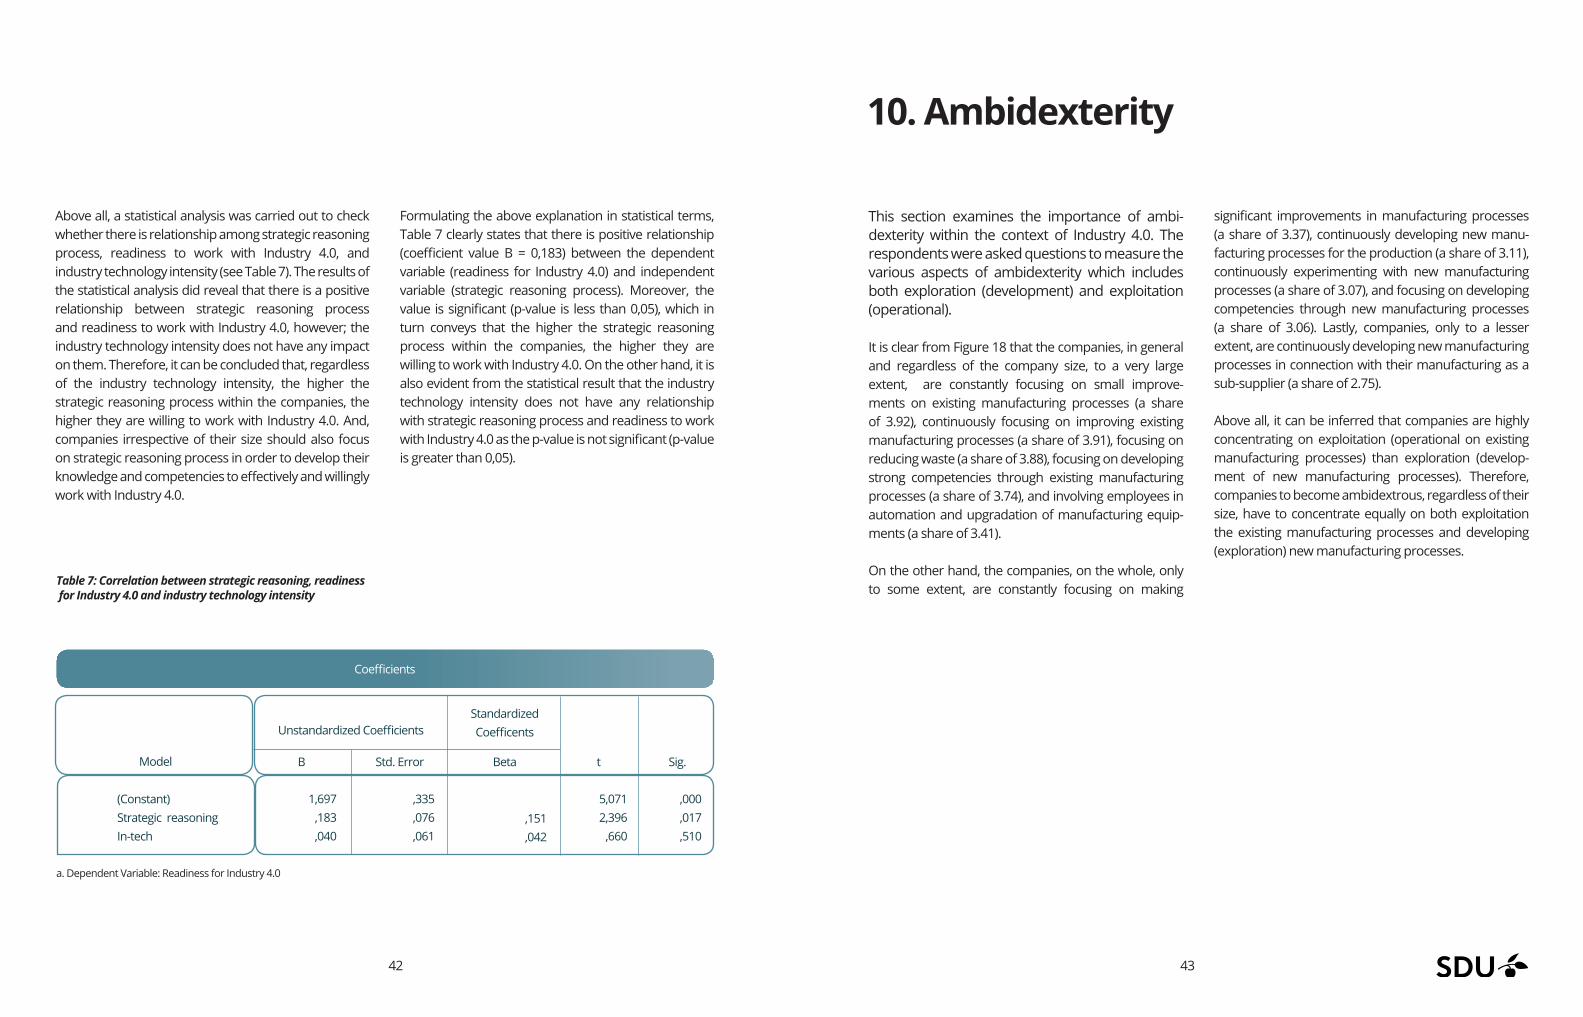
Above all, a statistical analysis was carried out to check whether there is relationship among strategic reasoning process, readiness to work with Industry 4.0, and industry technology intensity (see Table 7). The results of the statistical analysis did reveal that there is a positive relationship between strategic reasoning process and readiness to work with Industry 4.0, however; the industry technology intensity does not have any impact on them. Therefore, it can be concluded that, regardless of the industry technology intensity, the higher the strategic reasoning process within the companies, the higher they are willing to work with Industry 4.0. And, companies irrespective of their size should also focus on strategic reasoning process in order to develop their knowledge and competencies to effectively and willingly work with Industry 4.0.
Formulating the above explanation in statistical terms, Table 7 clearly states that there is positive relationship (coefficient value B = 0,183) between the dependent variable (readiness for Industry 4.0) and independent variable (strategic reasoning process). Moreover, the value is significant (p-value is less than 0,05), which in turn conveys that the higher the strategic reasoning process within the companies, the higher they are willing to work with Industry 4.0. On the other hand, it is also evident from the statistical result that the industry technology intensity does not have any relationship with strategic reasoning process and readiness to work with Industry 4.0 as the p-value is not significant (p-value is greater than 0,05).
Table 7: Correlation between strategic reasoning, readiness for Industry 4.0 and industry technology intensity
This section examines the importance of ambi-dexterity within the context of Industry 4.0. The respondents were asked questions to measure the various aspects of ambidexterity which includes both exploration (development) and exploitation (operational).
It is clear from Figure 18 that the companies, in general and regardless of the company size, to a very large extent, are constantly focusing on small improve-ments on existing manufacturing processes (a share of 3.92), continuously focusing on improving existing manufacturing processes (a share of 3.91), focusing on reducing waste (a share of 3.88), focusing on developing strong competencies through existing manufacturing processes (a share of 3.74), and involving employees in automation and upgradation of manufacturing equip-ments (a share of 3.41).
On the other hand, the companies, on the whole, only to some extent, are constantly focusing on making
significant improvements in manufacturing processes (a share of 3.37), continuously developing new manu-facturing processes for the production (a share of 3.11), continuously experimenting with new manufacturing processes (a share of 3.07), and focusing on developing competencies through new manufacturing processes (a share of 3.06). Lastly, companies, only to a lesser extent, are continuously developing new manufacturing processes in connection with their manufacturing as a sub-supplier (a share of 2.75).
Above all, it can be inferred that companies are highly concentrating on exploitation (operational on existing manufacturing processes) than exploration (develop-ment of new manufacturing processes). Therefore, companies to become ambidextrous, regardless of their size, have to concentrate equally on both exploitation the existing manufacturing processes and developing (exploration) new manufacturing processes.
10. Ambidexterity
1,697,183,040
,335,076,061
5,0712,396
,660
,000 ,017,510
,151,042
(Constant)Strategic reasoningIn-tech
B Std. Error Beta t Sig.
Unstandardized Coefficients
Model
Standardized Coefficents
a. Dependent Variable: Readiness for Industry 4.0
Coefficients
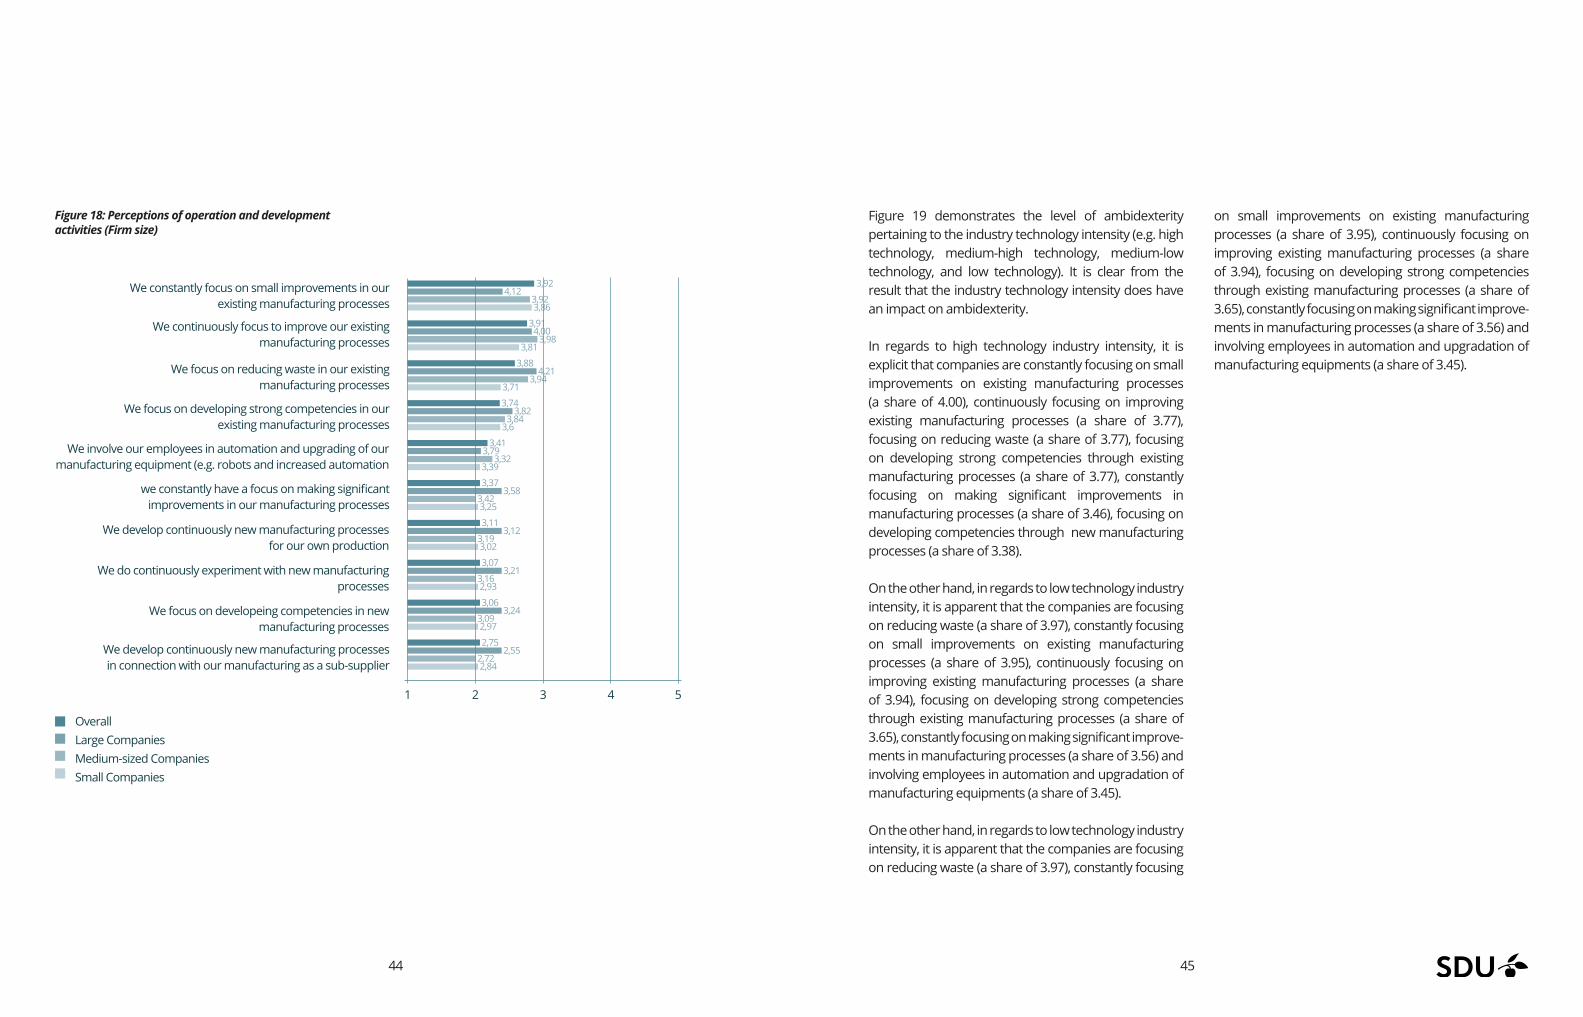
44 45
Figure 18: Perceptions of operation and development activities (Firm size)
3,92 4,12 3,92 3,86
3,91 4,00 3,98 3,81
3,88 4,21 3,94 3,71
3,74 3,82 3,84 3,6
3,41 3,79 3,32 3,39
3,37 3,58 3,42 3,25
3,11 3,12 3,19 3,02
3,07 3,21 3,16 2,93
3,06 3,24 3,09 2,97
2,75 2,55 2,72 2,84
We constantly focus on small improvements in our existing manufacturing processes
We continuously focus to improve our existing manufacturing processes
We focus on reducing waste in our existing manufacturing processes
We focus on developing strong competencies in our existing manufacturing processes
We involve our employees in automation and upgrading of our manufacturing equipment (e.g. robots and increased automation
we constantly have a focus on making significant improvements in our manufacturing processes
We develop continuously new manufacturing processes for our own production
We do continuously experiment with new manufacturing processes
We focus on developeing competencies in new manufacturing processes
We develop continuously new manufacturing processes in connection with our manufacturing as a sub-supplier
1 2 3 4 5
Overall Large Companies Medium-sized Companies Small Companies
Figure 19 demonstrates the level of ambidexterity pertaining to the industry technology intensity (e.g. high technology, medium-high technology, medium-low technology, and low technology). It is clear from the result that the industry technology intensity does have an impact on ambidexterity.
In regards to high technology industry intensity, it is explicit that companies are constantly focusing on small improvements on existing manufacturing processes (a share of 4.00), continuously focusing on improving existing manufacturing processes (a share of 3.77), focusing on reducing waste (a share of 3.77), focusing on developing strong competencies through existing manufacturing processes (a share of 3.77), constantly focusing on making significant improvements in manufacturing processes (a share of 3.46), focusing on developing competencies through new manufacturing processes (a share of 3.38).
On the other hand, in regards to low technology industry intensity, it is apparent that the companies are focusing on reducing waste (a share of 3.97), constantly focusing on small improvements on existing manufacturing processes (a share of 3.95), continuously focusing on improving existing manufacturing processes (a share of 3.94), focusing on developing strong competencies through existing manufacturing processes (a share of 3.65), constantly focusing on making significant improve-ments in manufacturing processes (a share of 3.56) and involving employees in automation and upgradation of manufacturing equipments (a share of 3.45).
On the other hand, in regards to low technology industry intensity, it is apparent that the companies are focusing on reducing waste (a share of 3.97), constantly focusing
on small improvements on existing manufacturing processes (a share of 3.95), continuously focusing on improving existing manufacturing processes (a share of 3.94), focusing on developing strong competencies through existing manufacturing processes (a share of 3.65), constantly focusing on making significant improve-ments in manufacturing processes (a share of 3.56) and involving employees in automation and upgradation of manufacturing equipments (a share of 3.45).
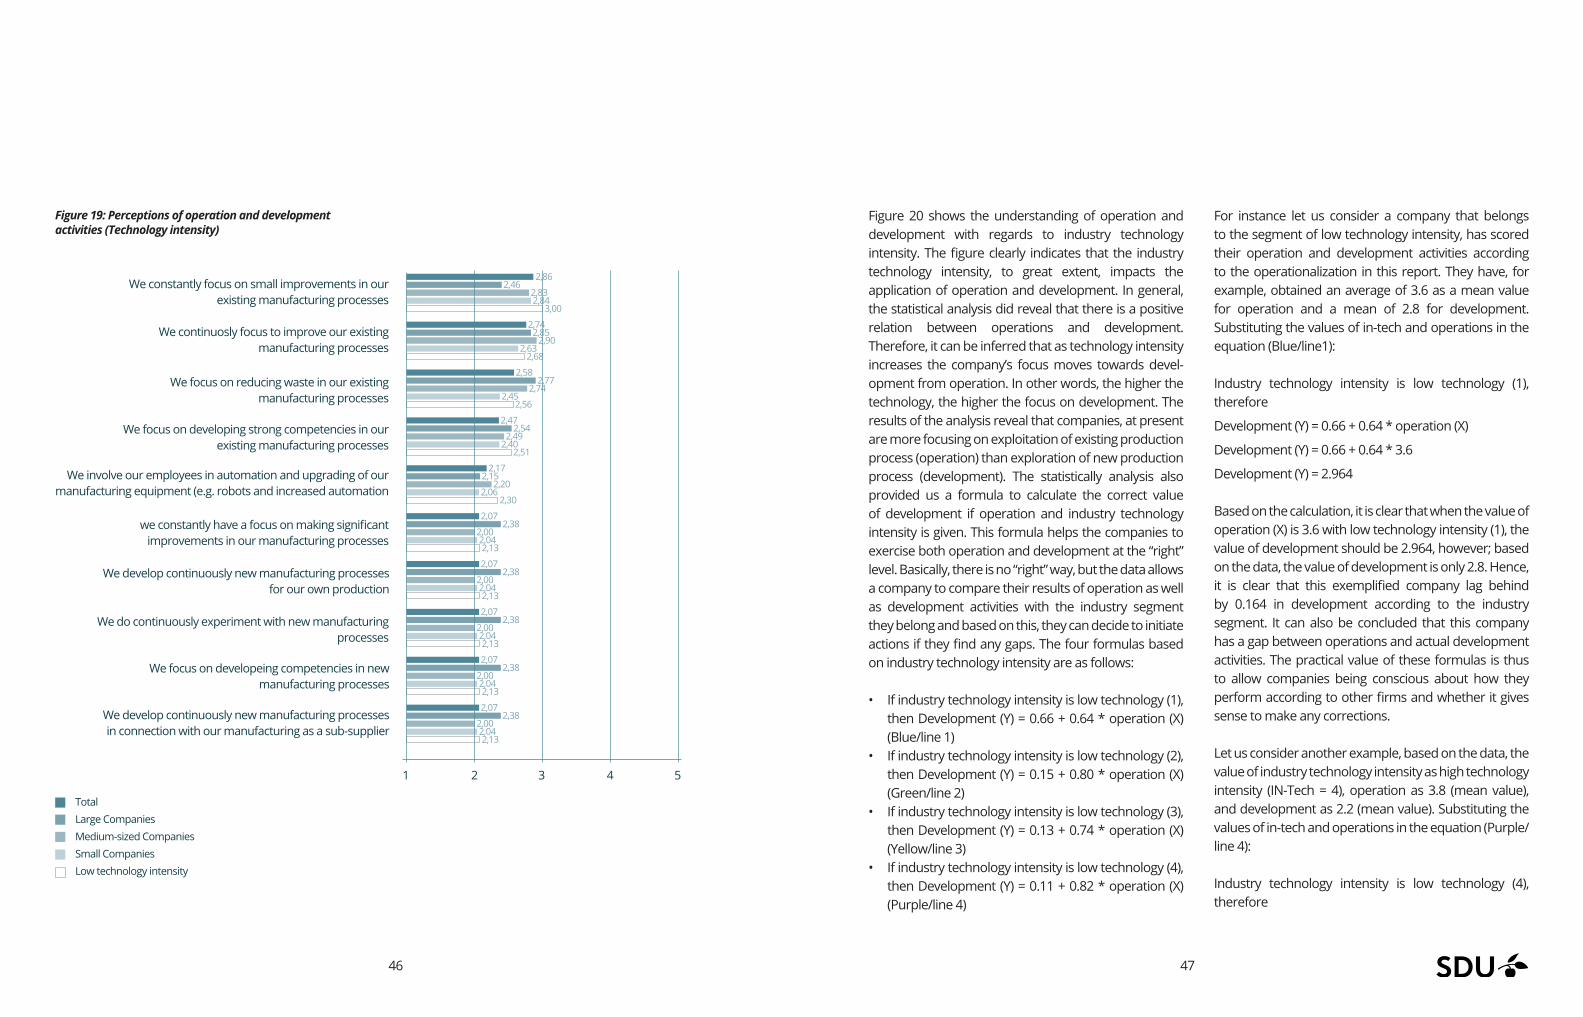
46 47
Figure 19: Perceptions of operation and development activities (Technology intensity)
We develop continuously new manufacturing processes for our own production
We do continuously experiment with new manufacturing processes
We focus on developeing competencies in new manufacturing processes
We develop continuously new manufacturing processes in connection with our manufacturing as a sub-supplier
2,86 2,46 2,83 2,84 3,00
2,74 2,85 2,90 2,63 2,68
2,58 2,77 2,74 2,45 2,56
2,47 2,54 2,49 2,40 2,51
2,17 2,15 2,20 2,06 2,30
2,07 2,38 2,00 2,04 2,13
2,07 2,38 2,00 2,04 2,13
2,07 2,38 2,00 2,04 2,13
2,07 2,38 2,00 2,04 2,13
2,07 2,38 2,00 2,04 2,13
We constantly focus on small improvements in our existing manufacturing processes
We continuosly focus to improve our existing manufacturing processes
We focus on reducing waste in our existing manufacturing processes
We focus on developing strong competencies in our existing manufacturing processes
We involve our employees in automation and upgrading of our manufacturing equipment (e.g. robots and increased automation
we constantly have a focus on making significant improvements in our manufacturing processes
1 2 3 4 5
Total Large Companies Medium-sized Companies Small Companies Low technology intensity
Figure 20 shows the understanding of operation and development with regards to industry technology intensity. The figure clearly indicates that the industry technology intensity, to great extent, impacts the application of operation and development. In general, the statistical analysis did reveal that there is a positive relation between operations and development. Therefore, it can be inferred that as technology intensity increases the company’s focus moves towards devel-opment from operation. In other words, the higher the technology, the higher the focus on development. The results of the analysis reveal that companies, at present are more focusing on exploitation of existing production process (operation) than exploration of new production process (development). The statistically analysis also provided us a formula to calculate the correct value of development if operation and industry technology intensity is given. This formula helps the companies to exercise both operation and development at the “right” level. Basically, there is no “right” way, but the data allows a company to compare their results of operation as well as development activities with the industry segment they belong and based on this, they can decide to initiate actions if they find any gaps. The four formulas based on industry technology intensity are as follows:
• If industry technology intensity is low technology (1), then Development (Y) = 0.66 + 0.64 * operation (X) (Blue/line 1)
• If industry technology intensity is low technology (2), then Development (Y) = 0.15 + 0.80 * operation (X) (Green/line 2)
• If industry technology intensity is low technology (3), then Development (Y) = 0.13 + 0.74 * operation (X) (Yellow/line 3)
• If industry technology intensity is low technology (4), then Development (Y) = 0.11 + 0.82 * operation (X) (Purple/line 4)
For instance let us consider a company that belongs to the segment of low technology intensity, has scored their operation and development activities according to the operationalization in this report. They have, for example, obtained an average of 3.6 as a mean value for operation and a mean of 2.8 for development. Substituting the values of in-tech and operations in the equation (Blue/line1):
Industry technology intensity is low technology (1), therefore
Development (Y) = 0.66 + 0.64 * operation (X)
Development (Y) = 0.66 + 0.64 * 3.6
Development (Y) = 2.964
Based on the calculation, it is clear that when the value of operation (X) is 3.6 with low technology intensity (1), the value of development should be 2.964, however; based on the data, the value of development is only 2.8. Hence, it is clear that this exemplified company lag behind by 0.164 in development according to the industry segment. It can also be concluded that this company has a gap between operations and actual development activities. The practical value of these formulas is thus to allow companies being conscious about how they perform according to other firms and whether it gives sense to make any corrections.
Let us consider another example, based on the data, the value of industry technology intensity as high technology intensity (IN-Tech = 4), operation as 3.8 (mean value), and development as 2.2 (mean value). Substituting the values of in-tech and operations in the equation (Purple/line 4):
Industry technology intensity is low technology (4), therefore

48 49
Figure 20: Statistical analysis: Perceptions of operations and development activities (Technology intensity)
5,0
4,0
3,0
2,0
1,0
1,0
1,02,03,04,01,02,03,04,0
1,0: R2 Linear = 0,3062,0: R2 Linear = 0,3523,0: R2 Linear = 0,4224,0: R2 Linear = 0,592
IN-TECH
2,0 3,0
Operations
Dev
elop
men
t
4,0 5,0
Development (Y) = 0.11 + 0.82 * operation (X)
Development (Y) = 0.11 + 0.82 * 3.8
Development (Y) = 3.226
Based on the calculation, it is clear that when the value of operation (X) is 3.8 with high technology intensity (4), the value of development should be 3.226, however; based on the data, the value of development is only 2.2. Hence, it is clear that this exemplified company
lag behind by 1.026 in development according to the industry segment.
Accordingly, it can be inferred that, irrespective of the industry technology intensity, companies at present are more focusing on exploitation (operation of existing production process) than exploration (development of new production process).
This report evidently displays the degree of knowledge, perceived importance/relevance, and the current practice of Industry 4.0. Companies, of course, regardless of the company size, do have adequate knowledge about Industry 4.0 and companies, to great extent, understands the importance/relevance of Industry 4.0. However, companies, including small, medium, and large-sized companies are not actively practicing Industry 4.0. Therefore, companies do need to realize the benefits of Industry 4.0 and encourage themselves towards working with Industry 4.0. It is obvious from this report that the companies, regardless of the size, are more strategic in thinking/reasoning; however they are not much willing to work with 4.0. In general, companies, including small, medium, and large-sized, are not ready for working with Industry 4.0. Now, as they are more strategic in nature, it is an opportunity for the companies to utilize their strategical thinking and organize themselves to accept the change and work with Industry 4.0. Moreover, the companies with low technology intensity and high tech-nology intensity are not willing to work with Industry 4.0, which means, the industry technology intensity does not have any impact on readiness to work with Industry 4.0.
The report also presents the various drivers and barriers for Industry 4.0. The companies regardless of the size considers cost reduction, improvisation of time-to-market, and legal/legislation condition as the most important drivers for Industry 4.0 and lack of knowledge, more focus on operation than that of development, and lack of understanding of the strategic importance as the most important barriers for Industry 4.0.
With reference to ambidexterity, it is evident that the companies, regardless of the size, are more focused on operation (exploitation) than development (exploration). A known fact, an ambidextrous company should be able to equally implement both operation and development. Companies need to realize this fact and start focusing on
both operation and development in the same way. On the other hand, it is clear that if the technology intensity moves from low to high then companies’ focus will shift towards development as well and this will in turn shape them towards being ambidextrous. A general critique in the literature about ambidexterity is that it lacks oper-ationalization and measures for being ambidextrous. The present report provides a novel contribution in this respect since it both make an operationalization and provide four different measures for being ambidextrous based on industry technology intensity.
This report also discloses that though the companies have manufacturing strategy, they still remain their manufacturing domestic (i.e. neither moved it out nor moved it back during the last three years). Then, the strat-egies for new equipment/technology, it is surprising that there are still some companies with no strategies for new equipment/technology in this digital world. Therefore, this report provides awareness and insists companies to formulate active strategies for new equipment/tech-nology. Furthermore, it is evident from the report that the larger the company in size, the lesser they remain their manufacturing domestic and the higher industry technology intensity, the more they remain their manu-facturing domestic. On the other hand, it is obvious that the larger the company in size and the higher industry technology intensity, the more offshoring of manufac-turing take place. In general, it can be concluded that company size and industry technology intensity does affect the globalization strategies.To conclude, this report recommends the companies to continuously increase their current knowledge base regarding Industry 4.0, actively work with Industry 4.0, sustain their readiness to work with Industry 4.0, and practice both exploitation of existing production process and exploration of new production process at the “right” level.
11. Conclusion
50 51
Arlbjørn, J.S. and Mikkelsen, O.S. (2014), “Backshoring manufacturing: notes on an important but under-researched theme”, Journal of Purchasing & Supply Management, Vol. 20 No. 1, pp. 60-62.
Arlbjørn, J.S., Lüthje, T., Mikkelsen, O.S., Schlichter, J. and Thoms, L. (2013), Danske producenters udflytning og hjemtagning af produktion, Kraks Fond Byforskning, København K.
Arlbjørn, J.S. and Lüthje, T. (2012), “Global operations and their inter-action with supply chain performance”, Industrial Management & Data Systems, Vol. 112 No. 7, pp. 1044-1064.
Arlbjørn, J.S., Damgaard, T. and Haug, A. (2009), “Key success factors for ICT-system implementation in SMEs”, in van Liere, D.W. and Zheng, L. (Eds), The Network Experience: New Value from Smart Business Networks, Springer-Verlag, Heidelberg, pp. 249-266.
Barbieri, P. and Stentoft, J. (2016), “Guest editorial: OMR special issue on reshoring: a supply chain innovation perspective”, Operations Management Research, Vol. 9 No 3-4, pp. 49-52.
Brennan, L., Ferdows, K., Godsell, J., Golini, R., Keegan, R., Kinkel, S., Srai, J.S. and Taylor, M. (2015), “Manufacturing in the world: where next?”, International Journal of Operations & Production Management, Vol. 35 No. 9, pp. 1253-1274.
Broedner, P., Kinkel, S. and Lay, G. (2009), “Productivity effects of outsourcing”, International Journal of Operations & Production Manage-ment, Vol. 29 No. 2, pp. 127-150.
Buonanno, G., Faverio, P., Ravarini, A., Sciuto, D. and Tagliavini, M. (2005), “Factors affecting ERP system adoption: a comparative analysis between SMEs and large companies”, Journal of Enterprise Information Management, Vol. 18 No. 4, pp. 384-426.
Chen, H., Chiang, R.H.L. and Storey, V.C. (2012), “Business intelligence and analytics: From big data to big impact”, MIS Quarterly, Vol. 36 No. 4, pp. 1165–1188.
Colotla, I., Fæste, A., Heidemann, A., Winther, A., Andersen, P.H., Duvold, T. and Hansen, M. (2016), Winning the Industry 4.0 Race: How Ready are Danish Manufacturers?, Boston Consulting Group, Boston, USA.
De Wit, B. and Meyer, R. (2010), Strategy: Process, Content, Context, South-Western Centage Learning, Hampshire.
Deloitte (2015), Industry 4.0: An introduction, Deloitte The Netherlands.
Dujin, A., Geissler, C. and Horstkötter, D. (2014), Think Act: Industry 4.0, Ronald Berger Strategy Consultants, Munich, Germany.
Foerstl, K., Kirchoff, J.F. and Bals, L. (2016), “Reshoring and insourcing: drivers and future research directions”, International Journal of Physical
Distribution & Logistics Management, Vol. 46 No. 5 pp. 492-515.
Forsman, H. (2008), “Business development success in SMEs: a case study approach”, Journal of Small Business and Enterprise Development, Vol. 15 No. 3, pp. 606-622.
Fosso Wamba, S., Akter, S., Edwards, A., Chopin, G. and Gnanzou, D. (2015), “How ‘big data’ can make big impact: Findings from a system-atic review and a longitudinal case study”, International Journal of Production Economics, Vol. 165, pp. 234–246.
Fratocchi, L., Alessandro, A., Barbieri, P., Di Mauro, C., Nassimbeni, G., Vignoli, M.S.M. and Zanoni, A. (2016), “Motivations of manufacturing reshoring: an interpretative framework”, International Journal of Physical Distribution & Logistics Management, Vol. 46 No. 2, pp. 98-127.
Haug, A., Pedersen, S.G. and Arlbjørn, J.S. (2011), “IT readiness in small and medium-sized enterprises”, Industrial Management & Data Systems, Vol. 111 No. 4, pp. 490-508.
Hermann, M., Pentek, T. and Otto, B. (2015), Design Principles for Industrie 4.0 Scenarios: A Literature Review, Working Paper No. 01 / 2015, Technische Universität Dortmund, Fakultät Maschinenbau-
Holmström, J., Holweg, M., Khajavi, S.H. and Partanen, J. (2016), “The direct digital manufacturing (r)evolution: definition of a research agenda”, Operations Management Research, Vol. 9 No. 1-2, pp. 1-10.
IEC (2015), Factory of the Future, International Electrotechnical Commis-sion, Geneva, Switzerland.
Kagermann, H., Wahlster, W. and Helbig, J. (2013), Recommendations for Implementing the Strategic Initiative INDUSTRIE 4.0, Linda Treugut, M.A. and acatech – National Academy of Science and Engineering.
Jørgensen, E., Knudsen, P.T. and Pietras, P. (2017), Ledelse i d-land – om ledelse på tærsklen til et digitalt samfund, Saxo Publish, e-book.
Kinkel, S. (2012), “Trends in production relocation and backshoring activities: changing patterns in the course of the global economic crisis”, International Journal of Operations & Production Management, Vol. 32 No. 6, pp. 696-720.
Lasi, H., Kemper, H.-G., Fettke, P., Feld., T. and Hoffmann, M. (2014), “Industry 4.0”, Business & Information Systems Engineering, Vol. 6 No. 4, pp. 239-242.
Lee, J. Bagheri, B. and Jin, C. (2016), Introduction to cyber manufac-turing, Manufacturing Letters, Vol. 8, pp. 11-15.
Liao, Y., Deschamps, F., Loures, E.d.R. and Ramos, L.F.P. (2017), “Past, present and future of Industry 4.0 - a systematic literature review and research agenda proposal, International Journal of Production Research, Vol. 55 No.12, pp. 3609-3629.
12. References
Lubatkin, M.H., Simsek, Z., Ling, Y. and Veiga, J.F. (2006), “Ambidexterity and performance in small-to medium-sized firms: the pivotal role of top management team behavioral integration”, Journal of Manage-ment, Vol. 32 No. 5, pp. 646–672.
McKinsey (2015), Industry 4.0: How to Navigate Digitization of the Manu-facturing Sector, McKinsey Digital.
NN Markedsdata (2016). Welcome to Navne & Numre® Erhverv. Available at: http://erhverv.nnmarkedsdata.dk/# (accessed in October, 2015)
OECD (2011), Isic rev. 3 Technology intensity definition, https://www.oecd.org/sti/ind/48350231.pdf, accessed April 27th, 2017.
Oesterreich, T.D. and Teuteberg, F. (2016), Understanding the impli-cations of digitisation and automation in the context of Industry 4.0: A triangulation approach and elements of a research agenda for the construction industry”, Computers in Industry, Vol. 83, pp. 121-139.
O’Reilly III, C.A. and Tushman, M.L. (2013), ”Organizational ambidex-terity: past, present, and future”, The Academy of Management Perspec-tives, Vol. 27 No. 4, pp. 324-338.
O’Reilly, C.A. and Tushman, M.L. (2004), “The ambidextrous organiza-tion”, Harvard Business Review, Vol. 82 No. 4, pp. 74–81.
Prinz, C., Morlock, F., Freith, S., Kreggenfeld, N., Kreimeier, D. and Kuhlenkӧtter, B. (2016), “Learning factory modules for smart factories in Industrie 4.0”, Procedia CIRP, Vol. 54, pp. 113–118.
Regeringen (2016), Redegørelse om Danmarks digitale vækst 2016, Erhvervs- og Vækstministeriet, København K.
Schlechtendahl, J., Keinert, M., Kretschmer, F., Lechler, A. and Verl, A. (2015), “Making existing production systems Industry 4.0-ready”, Production Engineering, Vol. 9 No. 1, pp. 143-148.
Sommer, L. (2015), “Industrial revolution—industry 4.0: are German manufacturing SMEs the first victims of this revolution?”, Journal of Industrial Engineering and Management, Vol. 8 No. 5, pp. 1512–1532.
Stentoft, J. (2016), ”Industri 4.0+ kommer ikke af sig selv” [Industry 4.0+ does not come on its own], Chronicle in Jydske Vestkysten, October 16, p. 13.
Stentoft, J., Thoms, L., Jensen, J.K. and Mikkelsen, O.S. (2016a), Udfly-tning og hjemtagning af produktion, Institut for Entreprenørskab og Relationsledelse, Syddansk Universitet, Kolding.
Stentoft, J., Olhager, J., Heikkilä, J. and Thoms, L. (2016b), “Manufacturing backshoring: a systematic literature review”, Operations Management Research, Vol. 9 No. 3-4, pp. 53-61.
Stentoft, J. Mikkelsen, O.S. and Jensen, J.K. (2016c), “Offshoring and backshoring manufacturing from a supply chain innovation perspec-tive”, Supply Chain Forum: An International Journal, Vol. 17 No. 4, pp. 190-204.
Stentoft, J., Scholte, E. and Breil-Hansen, P. (2016d), Den stærke værdikæde: Sådan skaber du konkurrencekraft, Libris, Valby.
Stentoft, J., Mikkelsen, O.S. and Brinch, M. (2016), ” Big data applica-tions in sourcing processes”, DILF Orientering, Vol. 53 No. 4, pp. 38-42.
Stentoft, J. and Mikkelsen, O.S. (2016), “Increased expectations of using disruptive technologies in supply chains”, DILF Orientering, Vol. 53 No. 1, pp. 36-41.
Stentoft, J., Mikkelsen, O.S. and Johnsen, T. (2015), ”Going local: a trend towards insourcing of production?”, Supply Chain Forum: An Interna-tional Journal, Vol. 16 No. 1, pp. 2-13.
Syddansk Vækstforum (2016) Kortlægning af Industri 4.0 i Region Syddanmark, Region Syddanmark and Syddansk Vækstforum.
Tate, W.L. (2014) “Offshoring and reshoring: US insights and research challenges”, Journal of Purchasing and Supply Management, Vol. 20 No. 1, pp. 66-68.
Tate, W.L. and Bals, L. (2017), “Outsourcing/offshoring insights: going beyond reshoring to rightshoring”, International Journal of Physical Distribution & Logistics Management, Vol. 47 No. 2/3, pp. 106-113.
Walendowski, J., Kroll, H. and Schnabl, E. (2016), Regional Innovation Monitor Plus 2016: Thematic Paper 3 - Industry 4.0, Advanced Materials (Nanotechnology), European Communities.
Wang, S., Wan, J., Zhang, D., Li, D. and Zhang, C. (2016), “Towards smart factory for industry 4.0: a self-organized multi-agent system with big data based feedback and coordination”, Computer Networks, Vol. 101, pp. 158-168.
Xu, X. (2012), “From cloud computing to cloud manufacturing”, Robotics and Computer-Integrated Manufacturing, Vol. 28 No. 1, pp. 75–86.
Yu, C., Xu, X. and Lu, Y. (2015), “Computer-integrated manufacturing, cyber-physical systems and cloud manufacturing – concepts and relationships”, Manufacturing Letters, Vol. 6, pp. 5-9.
Industry 4.0 in Danish IndustryJan StentoftChristopher RajkumarErik Skov Madsen
University of Southern Denmark