Embed Size (px)
Citation preview

Reprinted from LANGMUIR, 1992, 8. Copyright 0 1992 by the American Chemical Society and reprinted by permission of the copyright owner.
Synthesis and Characterization of Colloidal Dispersions of Fluorescent, Monodisperse Silica Spheres
A. van Blaaderen’ and A. Vrij
Van? Hoff Laboratory, University of Utrecht, Padualaan 8, 3584 CH Utrecht, The Netherlands
Received February 7, 1992. In Final Form: August 10, 1992
Stable dispersions of monodisperse colloidal silica spheres containing a dye or fluorophore have been synthesized according to a general procedure and dispersed in polar and apolar liquids. The procedure consists of the coupling of the dye to a silane coupling agent, (3++minopropyl)triethoxysilane, and the controllable incorporation of the reaction product into the silica sphere. The silica spheres are prepared from tetraethoxysilane in mixtures of ammonia, water, and ethanol. The composition of the silica spheres can be controlled in such a way that the organic groups can be placed on the surface, in a thin shell inside the particle or distributed through the volume of an inner core. Fluorescein isothiocyanate was used to make easily bleachable, fluorescent silica spheres. Hydrophilic charge stabilized and organophilic sterically stabilized 1-octadecanol-coated dyed silica systems were synthesized and dispersed in several solvents. All the particles were characterized after the several reaction steps by static and dynamic light scattering and transmission electron microscopy. The fluorescent spheres were further characterized by fluorescence spectroscopy and confocal scanning laser fluorescence microscopy. Great effort was taken to prepare monodisperse dispersions free of clusters of particles. Such model dispersions are required for (scattering) studies of interparticle interactions in (concentrated) systems. Therefore, the several steps of the synthesis and optical characterization are described in detail.
I. Introduction
In this paper we will describe a general synthetic procedure to incorporate dyes or fluorophores through covalent bonds into monodisperse, colloidal silica spheres. The incorporation of the organic molecules proceeds in a controlled way; that is, it is possible to determine where in the particle the silica is modified. The possibilities of the procedure are illustrated by the synthesis of several fluorescent silica spheres, where the fluorophore is present on the particle surface, in a thin shell in the particle interior or distributed through the volume of an inner core. Both the synthesis of charge stabilized, hydrophilic silica particles in polar solvents and sterically stabilized, l-oc- tadecanol coated, organophilic silica particles in apolar solvents will be described.
The procedure used to make the different colloidal systems consists of two steps. First, the dye is chemically bound to a silane coupling agent, and second, this coupling agent is used in the synthesis of colloidal silica by hydrolysis and condensation of tetraethoxysilane (TES) in mixtures of water, ammonia, and ethanol. As coupling agent (3- aminopropyl)triethoxysilane (APS) was used. In a pre- vious paper’ we described how silica spheres can be coated by APS and how it is possible to distribute the coupling agent through the particle interior. Because of the hybrid organic-inorganic nature of these colloids, we call these particles organosilica spheres. Furthermore, it was shown, that a layer of any desired thickness of silica can be deposited on the organosilica and coated-silica spheres. By chemically linking the APS molecules with a dye or fluorophore, the synthetic procedures developed in ref 1 can be used to prepare silica model particles marked for their specific properties of absorption, fluorescence, or photobleaching.
The synthesis of organosilica spheres is a modification of a method that was first systematically studied by Stiiber et al.2 In the years following the work of Stiiber et al.,
(1) Van Blaaderen, A.; Vrij, A. J. Colloid Interface Sci., in press. (2) Stiber, W.; Fink, A.; Bohn, E. J. Colloid Interface Sci. 1968,26 (l),
62-9.
0743-7463/92/2408-2921$03.00/O 0 1992 American Chemical Society
monodisperse silica spheres from tetraalkoxysilanes have been used as a model system in many studies. For physicochemical studies of the structure and dynamics of concentrated dispersions, the surface esterification of silica particles with 1-octadecanol, as described in detail by Van Helden et al.,3 has been of importance as well. Octade- canal-coated particles are sterically stabilized and can be dispersed in organic solvents. The refractive index of silica (~1.45) is close enough to that of organic solvents to make it possible to do light scattering measurements in con- centrated dispersions, without the problems of multiple scattering. Furthermore, it has been shown that in several solvents, in particular cyclohexane, the interparticle interactions can be conveniently described by those between “hard spheres”.4
With fluorophores or dyes inside the silica sphere the number of experimental techniques that can be used to study the properties of concentrated suspensions is significantly increased. Examples of these techniques are measurements on the dynamics with fluorescence recovery after photobleaching (FRAP), forced Rayleigh scattering (FRS), fluorescence correlation spectroscopy, and fluo- rescence cross correlation and imaging of separate particles inside the bulk of a dispersion using confocal scanning laser microscopy (CSLM). Because dye molecules inside a sphere do not influence the particle interactions, such spheres can be used as tracers in mixtures with nondyed spheres. Particles as described in this paper have already been used by us in FRAP, FRS, and CSLM studies. These techniques dictated several particle properties like size and specific dye functions. Therefore, the following sections briefly describe FRAP, FRS, and CSLM.
For the FRAP technique a “bleachable” fluorophore is required. The fluorescence of the fluorophore fluorescein isothiocyanate (FITC) is easily irreversibly destroyed, or (photo)bleached, by high intensities of light. This bleach-
(3) Van Helden, A. K.; Jensen, J. W.; Vrij, A. J. Colloid Interface Sci. 1981,81 (2), 354-68.
(4) De Kruif, C. G.; Jensen, J. W.; Vrij, A. In Physics of Complex and Supermolecular Fluids; S&an, S. A., Clerk, N. A., Eds.; John Wiley & Sons: New York, 1987.
2922 Langmuir, Vol. 8, No. 12, 1992
ability, which is for most applications an undesirable property, is used in an elegant technique to measure long- time self-diffusion coefficients (see references in ref 5). Closely related to the FRAP technique is forced Rayleigh scattering.6 This technique requires a dye which changes its refractive index upon excitation with light. Photoex- citation with an argon ion laser brings a dye like 4-(di- methylamino)azobenzene 4-isothiocyanate in a state in which the absorption for red laser light (He/Ne) is increased. The periodic pattern vanishes by the diffusion of the excited particles and the intensity of the Bragg peak decays accordingly.
Large fluorescent silica spheres labeled with FITC can be imaged as separate particles with confocal scanning laser microscopy (CSLM). In this technique only one picture point is imaged at a time. The illumination of the sample by the image of a point source focused inside the sample and the imaging of the (con)focused fluorescent light on a point photodetector provide for an exceptionally short depth of field combined with an increased resolu- tion.lv8
The rest of the paper is organized as follows: In the next theoretical sections we first briefly discuss static and dynamic light scattering and the consequences of poly- dispersity in the particle size and absorption and fluo- rescence on the measurements. (Theoretical aspects of the mechanism of incorporation of the coupling agent APS into the silica spheres were treated in ref 1.) In section III the general procedure to prepare the dyed silica spheres is given together with details on several examples and a brief description of the characterization techniques used. In section IV some important steps in the preparation of the particles and several particle properties are presented and discussed. Some of the colloidal systems showed unexpected interparticle interactions and phase behavior; these observations are qualitatively described and dis- cussed as well. Finally, a summary is given in section V.
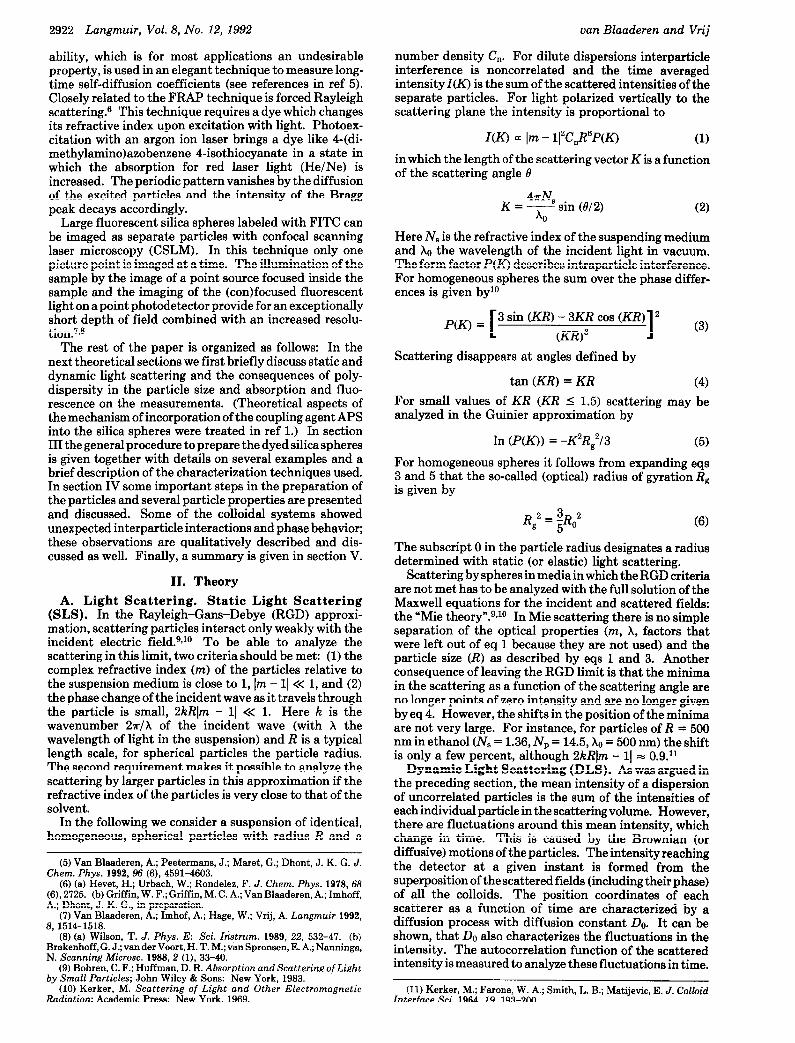
II. Theory A. Light Scattering. Static Light Scattering
(SLS). In the Rayleigh-Gans-Debye (RGD) approxi- mation, scattering particles interact only weakly with the incident electric field.gJO To be able to analyze the scattering in this limit, two criteria should be met: (1) the complex refractive index (m) of the particles relative to the suspension medium is close to 1, Im - II<< 1, and (2) the phase change of the incident wave as it travels through the particle is small, PkRlm - 11 << 1. Here k is the wavenumber 2x/X of the incident wave (with X the wavelength of light in the suspension) and R is a typical length scale, for spherical particles the particle radius. The second requirement makes it possible to analyze the scattering by larger particles in this approximation if the refractive index of the particles is very close to that of the solvent.
In the following we consider a suspension of identical, homogeneous, spherical particles with radius R and a
van Blaaderen and Vrij
number density C,. For dilute dispersions interparticle interference is noncorrelated and the time averaged intensity I(K) is the sum of the scattered intensities of the separate particles. For light polarized vertically to the scattering plane the intensity is proportional to
I(K) a Im - 112C,R6P(K) (1)
in which the length of the scattering vector K is a function of the scattering angle B
(5) Van Blaaderen, A.; Peetermans, J.; Maret, G.; Dhont, J. K. G. J. Chem. Phys. 1992,96 (6), 4591-4603.
(6) (a) Hevet, H.; Urbach, W.; Rondelez, F. J. Chem. Phys. 1978, 68 (6), 2725. (b) Griffin, W. F.; Griffin, M. C. A.; Van Blaaderen, A.; Imhoff, A.; Dhont, J. K. G., in preparation.
(7) Van Blaaderen, A.; Imhof, A.; Hage, W.; Vrij, A. Langmuir 1992, 8, 1514-1518.
(8) (a) Wilson, T. J. Phys. E: Sci. Z&rum. 1989, 22, 532-47. (b) Brakenhoff, G. J.; van der Voort, H. T. M.; van Spronsen, E. A.; Nanninga, N. Scanning Microsc. 1988,2 (l), 33-40.
(9) Bohren, C. F.; Hoffman, D. R. Absorption and Scattering ofLight by Small Particles; John Wiley & Sons: New York, 1983.
(10) Kerker, M. Scattering of Light and Other Electromagnetic Radiation; Academic Press: New York, 1969.
4?rN K= x ----! sin (e/2)
0
Here N, is the refractive index of the suspending medium and b the wavelength of the incident light in vacuum. The form factor P(K) describes intraparticle interference. For homogeneous spheres the sum over the phase differ- ences is given bylo
p(K) _ 4
3 sin (KR) - 3KR cos (KR) 2
(KR13 1 (3)
Scattering disappears at angles defined by
tan (KR) = KR (4) For small values of KR (KR 5 1.5) scattering may be analyzed in the Guinier approximation by
In (P(K)) = -K2Rg2/3 (5)
For homogeneous spheres it follows from expanding eqs 3 and 5 that the so-called (optical) radius of gyration R, is given by
Rg2 = go2
The subscript 0 in the particle radius designates a radius determined with static (or elastic) light scattering.
Scattering by spheres in media in which the RGD criteria are not met has to be analyzed with the full solution of the Maxwell equations for the incident and scattered fields: the “Mie theory”.gJO In Mie scattering there is no simple separation of the optical properties (m, X, factors that were left out of eq 1 because they are not used) and the particle size (RI as described by eqs 1 and 3. Another consequence of leaving the RGD limit is that the minima in the scattering as a function of the scattering angle are no longer points of zero intensity and are no longer given by eq 4. However, the shifts in the position of the minima are not very large. For instance, for particles of R = 500 nm in ethanol (N, = 1.36, Np = 14.5, x0 = 500 nm) the shift is only a few percent, although 2kRJm - 11 = 0.9.11
Dynamic Light Scattering (DLS). As was argued in the preceding section, the mean intensity of a dispersion of uncorrelated particles is the sum of the intensities of each individual particle in the scattering volume. However, there are fluctuations around this mean intensity, which change in time. This is caused by the Brownian (or diffusive) motions of the particles. The intensity reaching the detector at a given instant is formed from the superposition of the scattered fields (including their phase) of all the colloids. The position coordinates of each scatterer as a function of time are characterized by a diffusion process with diffusion constant DO. It can be shown, that DO also characterizes the fluctuations in the intensity. The autocorrelation function of the scattered intensity is measured to analyze these fluctuations in time.
(11) Kerker, M.; Farone, W. A.; Smith, L. B.; Matijevic, E. J. Colloid Interface Sci. 1964, 19, 193-200.
Monodisperse Colloidal Silica Spheres
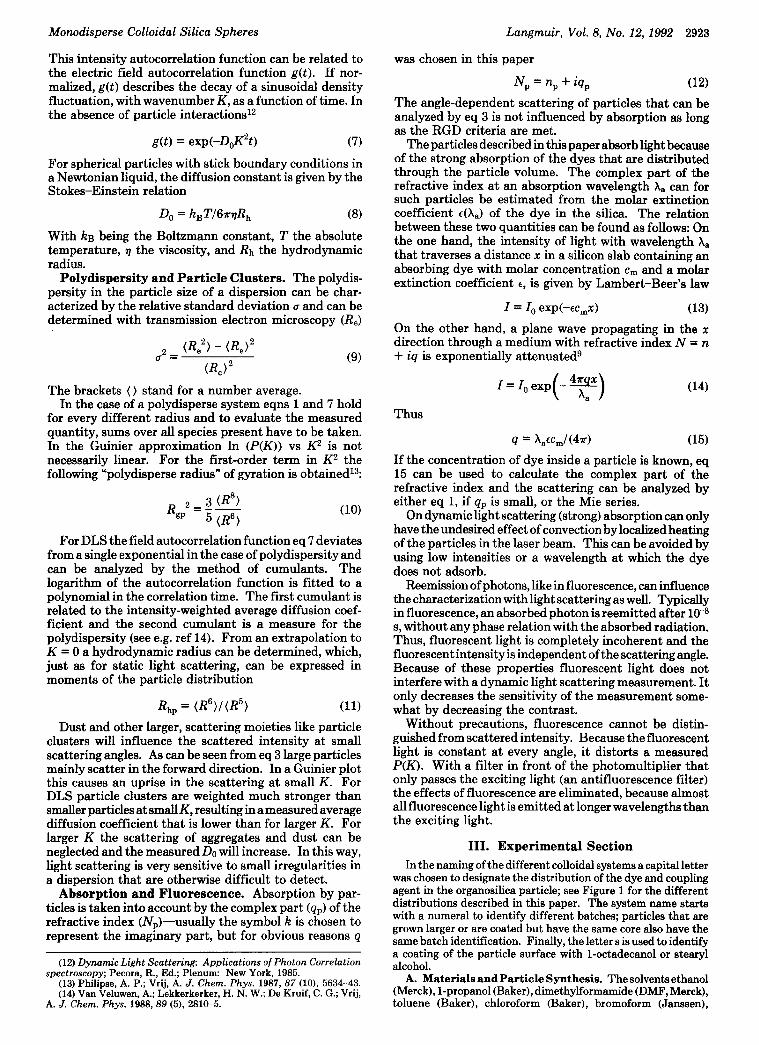
This intensity autocorrelation function can be related to the electric field autocorrelation function g(t). If nor- malized, g(t) describes the decay of a sinusoidal density fluctuation, with wavenumber K, as a function of time. In the absence of particle interactions12
g(t) = exp(-DsK2t) (7)
For spherical particles with stick boundary conditions in a Newtonian liquid, the diffusion constant is given by the Stokes-Einstein relation
D, = kBTJ6?rqRh (8)
With kg being the Boltzmann constant, T the absolute temperature, q the viscosity, and Rh the hydrodynamic radius.
Polydispersity and Particle Clusters. The polydis- persity in the particle size of a dispersion can be char- acterized by the relative standard deviation u and can be determined with transmission electron microscopy (R,)
2 _ (R,2) - W2 U-
(Rd2 (9)
The brackets ( ) stand for a number average. In the case of a polydisperse system eqns 1 and 7 hold
for every different radius and to evaluate the measured quantity, sums over all species present have to be taken. In the Guinier approximation In (P(K)) vs K2 is not necessarily linear. For the first-order term in K2 the following “polydisperse radius” of gyration is obtained13:
Langmuir, Vol. 8, No. 12, 1992 2923
R 2-3 tR*) --- SP 5 tR6)
GO)
For DLS the field autocorrelation function eq 7 deviates from a single exponential in the case of polydispersity and can be analyzed by the method of cumulants. The logarithm of the autocorrelation function is fitted to a polynomial in the correlation time. The first cumulant is related to the intensity-weighted average diffusion coef- ficient and the second cumulant is a measure for the polydispersity (see e.g. ref 14). From an extrapolation to K = 0 a hydrodynamic radius can be determined, which, just as for static light scattering, can be expressed in moments of the particle distribution
Rhp = (R6MR5) (11) Dust and other larger, scattering moieties like particle
clusters will influence the scattered intensity at small scattering angles. As can be seen from eq 3 large particles mainly scatter in the forward direction. In a Guinier plot this causes an uprise in the scattering at small K. For DLS particle clusters are weighted much stronger than smaller particles at small K, resulting in a measured average diffusion coefficient that is lower than for larger K. For larger K the scattering of aggregates and dust can be neglected and the measured DO will increase. In this way, light scattering is very sensitive to small irregularities in a dispersion that are otherwise difficult to detect.
Absorption and Fluorescence. Absorption by par- ticles is taken into account by the complex part (Q*) of the refractive index (N,)-usually the symbol k is chosen to represent the imaginary part, but for obvious reasons q
(12) Dynamic Light Scattering: Applications of Photon Correlation spectroscopy; Pecora, R., Ed.; Plenum: New York, 1985.
(13) Philipse, A. P.; Vrij, A. J. Chem. Phys. 1987, 87 (lo), 5634-43. (14) Van Veluwen, A.; Lekkerkerker, H. N. W.; De Kruif, C. G.; Vrij,
A. J. &em. Phys. 1988,89 (5). 2810-5.
was chosen in this paper
N, = nP + iq,
The angle-dependent scattering of particles that can be analyzed by eq 3 is not influenced by absorption as long as the RGD criteria are met.
The particles described in this paper absorb light because of the strong absorption of the dyes that are distributed through the particle volume. The complex part of the refractive index at an absorption wavelength X, can for such particles be estimated from the molar extinction coefficient E(X.) of the dye in the silica. The relation between these two quantities can be found as follows: On the one hand, the intensity of light with wavelength X, that traverses a distance x in a silicon slab containing an absorbing dye with molar concentration cm and a molar extinction coefficient E, is given by Lambert-Beer’s law
I = I, exp(-rc,x) (13) On the other hand, a plane wave propagating in the x direction through a medium with refractive index N = n + iq is exponentially attenuated9
I=I,exp -F ( ) a
Thus
If the concentration of dye inside a particle is known, eq 15 can be used to calculate the complex part of the refractive index and the scattering can be analyzed by either eq 1, if qP is small, or the Mie series.
On dynamic light scattering (strong) absorption can only have the undesired effect of convection by localized heating of the particles in the laser beam. This can be avoided by using low intensities or a wavelength at which the dye does not adsorb.
Reemission of photons, like in fluorescence, can influence the characterization with light scattering as well. Typically in fluorescence, an absorbed photon is reemitted after lo-* s, without any phase relation with the absorbed radiation. Thus, fluorescent light is completely incoherent and the fluorescent intensity is independent of the scattering angle. Because of these properties fluorescent light does not interfere with a dynamic light scattering measurement. It only decreases the sensitivity of the measurement some- what by decreasing the contrast.
Without precautions, fluorescence cannot be distin- guished from scattered intensity. Because the fluorescent light is constant at every angle, it distorts a measured P(K). With a filter in front of the photomultiplier that only passes the exciting light (an antifluorescence filter) the effects of fluorescence are eliminated, because almost all fluorescence light is emitted at longer wavelengths than the exciting light.
III. Experimental Section In the naming of the different colloidal systems a capital letter
was chosen to designate the distribution of the dye and coupling agent in the organosilica particle; see Figure 1 for the different distributions described in this paper. The system name starts with a numeral to identify different batches; particles that are grown larger or are coated but have the same core also have the same batch identification. Finallv. the letters is used to identifv a coating of the particle surface-with 1-octadecanol or stearyl alcohol.
A. Materials and Particle Synthesis. The solvents ethanol (Merck), 1-propanol (Baker), dimethylformamide (DMF, Merck), toluene (Baker), chloroform (Baker), bromoform (Janssen),

2924 Langmuir, Vol. 8, No. 12, 1992
0 A
cl 0 D
0 C
{@Ii9
F Figure 1. Schematic representation of the different ways the dye and coupling agent are distributed through the organosilica particles (A-F). The dark region stands for organosilica with dye groups and white means “ordinary” silica. The particles may be coated with 1-octadecanol (designated by an s in the name).
COOH
Figure 2. Schematic representation of the FITC-APS coated particle surface of 1B.
2-bromoethanol (Janssen) and cyclohexane (Baker) were of analytical reagent quality. As solvent for the particle synthesis absolute technical grade ethanol (Nedalco) was used, otherwise absolute ethanol from Baker (analytical grade) was used. Ethanol, tetraethoxysilane (TES, Fluka, purum grade), and (3-amino- propyl)triethoxysilane (APS, Janssen) were freshly distilled before each synthesis. Ammonium hydroxide (Merck, 25%, subsequently referred to as “ammonia”) was of analytical reagent oualitv and contained 14.0 M NH2 as indicated bv titration. The reagent stearyl alcohol (1-octadecanol, Merck, zu; Synthese) and the dyes fluorescein isothiocyanate (FITC, isomer I, Sigma) were used as received.
Centrifugations were done using a Beckmann type L5-50B and a table centrifuge (Hettich Rotofix II) at speeds that never exceeded 200g.
In the next sections the general procedure to make (l- octadecanol-coated) dyed silica is described first; this is followed by details that were different for each batch. The naming of particle colors that were seen during the synthesis is subjective and the observed colors are a complicated mixture of scattering (particle size and concentration), absorption, and fluorescence. Nevertheless, the colors are reported to give an idea of the color changes that are possible. The fluorescence colors that are reported were seen by illuminating the dispersion with an UV lamp.
The dye FITC was covalently attached to the coupling agent APS by an addition reaction of the amine group with the thioisocyanate group (see Figure 2). The reaction was allowed to proceed for at least 12 h by slowly stirring a solc:ion containing the dye and an excess of APS in anhydrous ethanol. Water was excluded to prevent hydrolysis and condensation of the APS molecules. Typically 1 or 2 mL of ethanol was used per 0.1 g of APS.
Adsorption of FITC to silica was determined by adding free dye, without AI-S, to an alcosol and subsequent centrifugation of the particles. FITC did not adsorb to silica particles in the reaction medium in which they were made, an alcosol.
The storage and synthesis with FITC were performed in the dark to avoid bleaching.
van Blaaderen and Vrij
Silica particles containing 3aminopropyl groups distributed through the particle volume were prepared as described in ref 1. Glass reaction vessels were cleaned with HF solutions (8%) to remove possible nucleation sites from the glass; HF was removed by subsequently rinsing with deionized water and distilled (that is dust free) ethanol. The reaction product of APS and the dye were added to a thoroughly mixed and thermostated (25.0 “C! unless stated otherwise) solution of ammoniain distilled ethanol. Immediately after homogenization, distilled TES was added with a funnel that was nlaced in the reaction mixture under vigorous stirring. A concentration of TES close to 0.17 M was always chosen for the synthesis of the core particles. A few minutes after the addition of TES the reaction mixture was stirred slowly for at least 6 h before the next step in the synthesis was taken (centrifugation, surface coating or a next growth step).
Silica particles were coated by esterification of the surface silanol groups with 1-octadecanol as described by Van Helden et al3
The “pure” silica core particles, lA, were made from 100 mL of TES (449 mmol) in 2.5 L of ethanol containine 212 mL of ammonia. To the aicosol the intense yellow and green fluorescing reaction product of 2.37 mg of FITC (6.09 pmol) and 0.4296 g of APS (1.940 mmol) was added together with a small amount of TES (1.7508 g, 8.404 mmol). The reaction was allowed to continue for 48 hand the resulting particle was 1B. Dispersed in ammonia/ ethanol the particles were colored yellow/orange withgreemyellow fluorescence; dispersed in DMF in color wae more orange and the fluorescence more yellow (see also the section on fluorescence spectra for more quantitative results on these color shifts).
The silica core particles of batch 2 (2A) were made from 120 mL of TES (539 mmol) in 3.00 L of ethanol containing 240 mL of ammonia. To 3.00 L of alcosol the reaction product of 0.69 g of APS(3.1 mmol) and 5.25 mg of FITC (13.5 rmol) was added and allowed to react for 24 h under slow stirring (2B). The fluorescence of the yellow/orange particles was yellow/green.
Without centrifugation 1.00 L of alcosol containing 2B was coated with stearyl alcohol to obtain 2B-s. These particles were orange/red and displayed a yellow fluorescence. In the super- natant cyclohexane containing stearyl alcohol, a very slight green fluorescence of (a small amount of) unreacted dye could be observed.
Another part of the alcosol containing the 2B particles (2.00 L) was used to incorporate dye inside the particles with a second growth step. To this end 15.21 g of TES (73.01 mmol) was added to the alcosol. The resulting 2C particles were also coated with octadecanol. The 2C-s particles had the same colors as 2B-s.
The silica core particles, 3A, were made at a temperature of 10 OC from 60.0 mL of TES (0.269 mol) in 1.50 L of ethanol containing 260 mL of ammonia. To 1.30 L of alcosol the reaction product of 154.2 mg of APS (697 Mmol) and 0.962 mg of FITC (2.47 rmol) was added together with0.10 mL of TES (0.45 mmol). The resulting yellow particles, 3B, were fluorescing green. After 30 h 5.0 mL of TES (22 mmol) was added, 3C. Again a fluorescent layer was deposited by addition of 0.10 mL of TES (0.45 mmol) and the reaction product of 137.2 mg of APS (620 rmol) and 2.22 mg of FITC (5.69 pmol), 3B2. To 600 mL of the resulting dispersion 2.5 mL of TES (11 mmol) was added. After 2 days the resulting 3D particles started to show signs of instability by starting to stick to the glass wall, some flocculation was observed as well. The stability of the sol was increased by addition of 100 mL of deionized water and the floes were removed by sedimen- tation. The resulting dispersion was coated with stearyl alcohol (3D-s). These particles were colored pink and their fluorescence was yellow.
Organosilica core particles, 4A, were made from 3.30 mL of TES (14.8 mmol) and the reaction product of 11.5 mg of APS (51.9 amol) and 10.6 me of FITC (27.2 amol) in 75 mL of ethanol con&ring 8.5 mL of ammonia. To remove the unreacted APS and dye, the 4A particles were centrifuged and redispersed twice in 40 mL of ethanol containing 4 mL of ammonia. Because the onset of a slow coagulation was observed, particle aggregates were removed by very slow centrifugation and the dispersion was diluted to 1.20 L (ethanol/ammonia (1O:l)). By addition of 28.0 mL of TES (126 mmol) the yellow particles slowly changed color to pink (4F). Fluorescence was still green. Because the
Monodisperse Colloidal Silica Spheres Langmuir, Vol. 8, No. 12,1992 2925
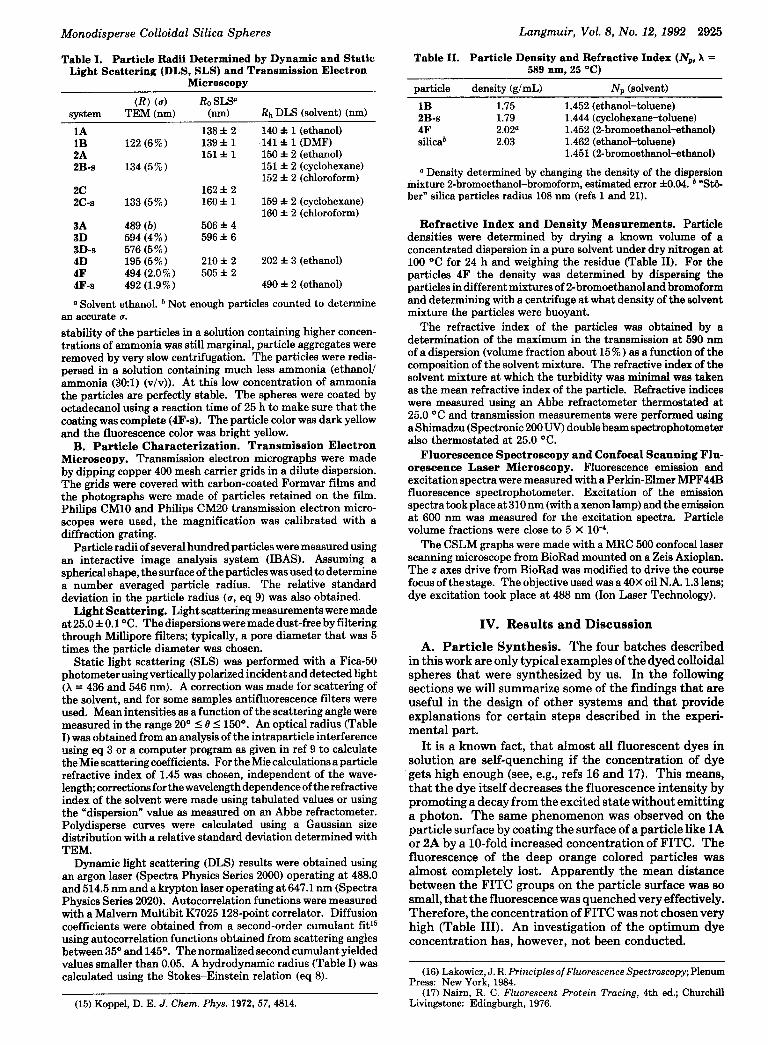
Table I. Particle Radii Determined by Dynamic and Static Light Scattering (DLS, SLS) and Transmission Electron
Microscopy
Table II. Particle Density and Refractive Index (Nr, X = 589 nm. 25 “C)
svstem (R) (4
TEM (nm) Ro SLS”
(nm) Rh DLS (solvent) (nm)
particle density (g/mL) Np (solvent)
LB 1.75 1.452 (ethanol-toluene) 2B-s 1.79 1.444 (cyclohexsne-toluene) 4F 2.020 1.452 (2-bromoethanol-ethanol) silicab 2.03 1.462 (ethanol-toluene)
1.451 (2-bromoethanol-ethanol)
(1 Density determined by changing the density of the dispersion mixture 2-bromoethanol-bromoform, estimated error hO.04. b ‘St& ber” silica particles radius 108 nm (refs 1 and 21).
1A 138 f 2 140 f 1 (ethanol) 1B 122 (6%) 139 f 1 141 f 1 (DMF) 2A 151* 1 150 f 2 (ethanol) 2B-s 134 (5%) 151 f 2 (cyclohexsne)
152 * 2 (chloroform) 2c 162 f 2 26-s 133 (5%) 160f 1 159 f 2 (cyclohexane)
160 f 2 (chloroform) 3A 489 (b) 506*4 3D 594 (4%) 596 f 6 3D-s 576 (5%) 4D 195 (5%) 210 * 2 202 * 3 (ethanol) 4F 494 (2.0%) 505 l 2 4F-s 492 (1.9%) 490 i 2 (ethanol)
D Solvent ethanol. b Not enough particles counted to determine an accurate W. stability of the particles in a solution containing higher concen- trations of ammonia was still marginal, particle aggregates were removed by very slow centrifugation. The particles were redis- persed in a solution containing much less ammonia (ethanol/ ammonia (3&l) (v/v)). At this low concentration of ammonia the particles are perfectly stable. The spheres were coated by octadecanol using a reaction time of 25 h to make sure that the coating was complete (4F-s). The particle color was dark yellow and the fluorescence color was bright yellow.
B. Particle Characterization. Transmission Electron Microscopy. Transmission electron micrographs were made by dipping copper 400 mesh carrier grids in a dilute dispersion. The grids were covered with carbon-coated Formvar films and the photographs were made of particles retained on the film. Philips CM10 and Philips CM20 transmission electron micro- scopes were used, the magnification was calibrated with a diffraction grating.
Particle radii of several hundred particles were measured using an interactive image analysis system (IBAS). Assuming a spherical shape, the surface of the particles was used to determine a number averaged particle radius. The relative standard deviation in the particle radius (a, eq 9) was also obtained.
Light Scattering. Light scattering measurements were made at 25.0 f 0.1 “C. The dispersions were made dust-free by filtering through Millipore filters; typically, a pore diameter that was 5 times the particle diameter was chosen.
Static light scattering (SLS) was performed with a Fica-50 photometer using vertically polarized incident and detected light (A = 436 and 546 nm). A correction was made for scattering of the solvent, and for some samples antifluorescence filters were used. Mean intensities as a function of the scattering angle were measured in the range 20° I 0 5 150”. An optical radius (Table I) was obtained from an analysis of the intraparticle interference using eq 3 or a computer program as given in ref 9 to calculate the Mie scattering coefficients. For the Mie calculations a particle refractive index of 1.45 was chosen, independent of the wave- length; corrections for the wavelength dependence of the refractive index of the solvent were made using tabulated values or using the “dispersion” value as measured on an Abbe refractometer. Polydisperse curves were calculated using a Gaussian size distribution with a relative standard deviation determined with TEM.
Dynamic light scattering (DLS) results were obtained using an argon laser (Spectra Physics Series 2000) operating at 488.0 and 514.5 nm and a krypton laser operating at 647.1 nm (Spectra Physics Series 2020). Autocorrelation functions were measured with a MaIvern Multibit K7025 128-point correlator. Diffusion coefficients were obtained from a second-order cumulant fit15 using autocorrelation functions obtained from scattering angles between 35” and 145’. The normalized second cumulant yielded values smaller than 0.05. A hydrodynamic radius (Table I) was calculated using the Stokes-Einstein relation (eq 8).
(15) Koppel, D. E. J. Chem. Phys. 1972,57,4814.
Refractive Index and Density Measurements. Particle densities were determined by drying a known volume of a concentrated dispersion in a pure solvent under dry nitrogen at 100 “C for 24 h and weighing the residue (Table II). For the particles 4F the density was determined by dispersing the particles in different mixtures of 2-bromoethanol and bromoform and determining with a centrifuge at what density of the solvent mixture the particles were buoyant.
The refractive index of the particles was obtained by a determination of the maximum in the transmission at 596 nm of a dispersion (volume fraction about 15%) as a function of the composition of the solvent mixture. The refractive index of the solvent mixture at which the turbidity was minimal was taken as the mean refractive index of the particle. Refractive indices were measured using an Abbe refractometer thermostated at 25.0 “C and transmission measurements were performed using a Sbimadxu (Spectronic 200 UV) double beam spectrophotometer also thermostated at 25.0 ‘C.
Fluorescence Spectroscopy and Confocal Scanning Flu- orescence Laser Microscopy. Fluorescence emission and excitation spectra were measured with a Perkin-Elmer MPF44B fluorescence spectrophotometer. Excitation of the emission spectra took place at 310 nm (with a xenon lamp) and the emission at 600 nm was measured for the excitation spectra. Particle volume fractions were close to 5 X 10d.
The CSLM graphs were made with a MRC 500 confocal laser scanning microscope from BioRad mounted on a Zeis Axioplan. The z axes drive from BioRad was modified to drive the course focus of the stage. The objective used was a 40x oil N.A. 1.3 lens; dye excitation took place at 488 nm (Ion Laser Technology).
IV. Results and Discussion
A. Particle Synthesis. The four batches described in this work are only typical examples of the dyed colloidal spheres that were synthesized by us. In the following sections we will summarize some of the findings that are useful in the design of other systems and that provide explanations for certain steps described in the experi- mental part.
It is a known fact, that almost all fluorescent dyes in solution are self-quenching if the concentration of dye gets high enough (see, e.g., refs 16 and 17). This means, that the dye itself decreases the fluorescence intensity by promoting a decay from the excited state without emitting a photon. The same phenomenon was observed on the particle surface by coating the surface of a particle like 1A or 2A by a lo-fold increased concentration of FITC. The fluorescence of the deep orange colored particles was almost completely lost. Apparently the mean distance between the FITC groups on the particle surface was so small, that the fluorescence was quenched very effectively. Therefore, the concentration of FITC was not chosen very high (Table III). An investigation of the optimum dye concentration has, however, not been conducted.
(16) Lakowicz, J. R. Principles ofFluorescence Spectroscopy; Plenum Press: New York, 1984.
(17) Nairn, R. C. Fluorescent Protein Tracing, 4th ed.; Churchill Living&me: Edingburgh, 1976.
2926 Langmuir, Vol. 8, No. 12, 1992 van Blaaderen and Vrij
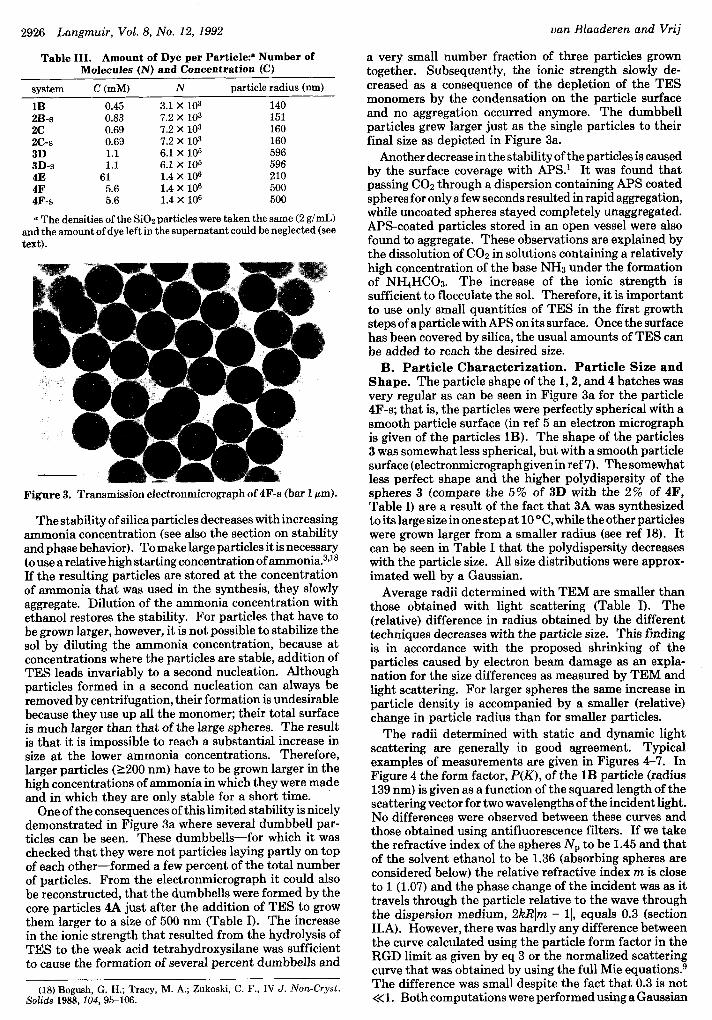
Table III. Amount of Dye per Particle? Number of Molecules (N) and Concentration (C)
system C (mM) N particle radius (nm)
1B 0.45 3.1 x 10³ 140 2B-s 0.83 7.2 X lo3 151 2c 0.69 1.2 x 10³ 160 2c-s 0.69 7.2 X lo3 160 3D 1.1 6.1 X lo5 596 3D-s 1.1 6.1 X lo6 596 4E 61 1.4 x 10⁶ 210 4F 5.6 1.4 x 10⁶ 500 4F-s 5.6 1.4 x 10⁶ 500
a The densities of the SiOz particles were taken the same (2 g/mL) and the amount of dye left in the supernatant could be neglected (see text).
Figure 3. Transmission electronmicrograph of 4F-s (bar 1 pm).
The stability of silica particles decreases with increasing ammonia concentration (see also the section on stability and phase behavior). To make large particles it is necessary touse a relative high starting concentration of ammonia.3J8 If the resulting particles are stored at the concentration of ammonia that was used in the synthesis, they slowly aggregate. Dilution of the ammonia concentration with ethanol restores the stability. For particles that have to be grown larger, however, it is not possible to stabilize the sol by diluting the ammonia concentration, because at concentrations where the particles are stable, addition of TES leads invariably to a second nucleation. Although particles formed in a second nucleation can always be removed by centrifugation, their formation is undesirable because they use up all the monomer; their total surface is much larger than that of the large spheres. The result is that it is impossible to reach a substantial increase in size at the lower ammonia concentrations. Therefore, larger particles (~200 nm) have to be grown larger in the high concentrations of ammonia in which they were made and in which they are only stable for a short time.
One of the consequences of this limited stability is nicely demonstrated in Figure 3a where several dumbbell par- ticles can be seen. These dumbbells-for which it was checked that they were not particles laying partly on top of each other-formed a few percent of the total number of particles. From the electronmicrograph it could also be reconstructed, that the dumbbells were formed by the core particles 4A just after the addition of TES to grow them larger to a size of 500 nm (Table I). The increase in the ionic strength that resulted from the hydrolysis of TES to the weak acid tetrahydroxysilane was sufficient to cause the formation of several percent dumbbells and
(18) Bogush, G. H.; Tracy, M. A.; Zukoski, C. F., IV J. Non-Cryst. Solids 1988,104,95-106.
a very small number fraction of three particles grown together. Subsequently, the ionic strength slowly de- creased as a consequence of the depletion of the TES monomers by the condensation on the particle surface and no aggregation occurred anymore. The dumbbell particles grew larger just as the single particles to their final size as depicted in Figure 3a.
Another decrease in the stability of the particles is caused by the surface coverage with APS.’ It was found that passing COz through a dispersion containing APS coated spheres for only a few seconds resulted in rapid aggregation, while uncoated spheres stayed completely unaggregated. APS-coated particles stored in an open vessel were also found to aggregate. These observations are explained by the dissolution of CO2 in solutions containing a relatively high concentration of the base NH3 under the formation of NHdHCOs. The increase of the ionic strength is sufficient to flocculate the sol. Therefore, it is important to use only small quantities of TES in the first growth steps of a particle with APS on its surface. Once the surface has been covered by silica, the usual amounts of TES can be added to reach the desired size.
B. Particle Characterization. Particle Size and Shape. The particle shape of the 1,2, and 4 batches was very regular as can be seen in Figure 3a for the particle 4F-s; that is, the particles were perfectly spherical with a smooth particle surface (in ref 5 an electron micrograph is given of the particles 1B). The shape of the particles 3 was somewhat less spherical, but with a smooth particle surface (electronmicrograph given in ref 7). The somewhat less perfect shape and the higher polydispersity of the spheres 3 (compare the 5% of 3D with the 2% of 4F, Table I) are a result of the fact that 3A was synthesized to its large size in one step at 10 “C, while the other particles were grown larger from a smaller radius (see ref 18). It can be seen in Table I that the polydispersity decreases with the particle size. All size distributions were approx- imated well by a Gaussian.
Average radii determined with TEM are smaller than those obtained with light scattering (Table I). The (relative) difference in radius obtained by the different techniques decreases with the particle size. This finding is in accordance with the proposed shrinking of the particles caused by electron beam damage as an expla- nation for the size differences as measured by TEM and light scattering. For larger spheres the same increase in particle density is accompanied by a smaller (relative) change in particle radius than for smaller particles.
The radii determined with static and dynamic light scattering are generally in good agreement. Typical examples of measurements are given in Figures 4-7. In Figure 4 the form factor, P(K), of the 1B particle (radius 139 nm) is given as a function of the squared length of the scattering vector for two wavelengths of the incident light. No differences were observed between these curves and those obtained using antifluorescence filters. If we take the refractive index of the spheres Np to be 1.45 and that of the solvent ethanol to be 1.36 (absorbing spheres are considered below) the relative refractive index m is close to 1 (1.07) and the phase change of the incident was as it travels through the particle relative to the wave through the dispersion medium, 2kRJm - 11, equals 0.3 (section 1I.A). However, there was hardly any difference between the curve calculated using the particle form factor in the RGD limit as given by eq 3 or the normalized scattering curve that was obtained by using the full Mie equations.g The difference was small despite the fact that 0.3 is not <<l. Both computations were performed using a Gaussian
_ -’ 2928 Langmuir, Vol. 8, No. 12,1992 (Ii;_ ti:, ,(i‘
FITC: E = 8.8 X lo6 M&1.17,1g Inserting the concentration as given in Table III (see the section on fluorescence) and the value of c in eq 15 gives qp = 0.024. The curve calculated with this value and the same polydispersity as before is given in Figure 5b. There was no difference with the calculated curve as given in Figure 5a. Higher concen- trations of dye, however, can effect the scattering as is demonstrated by the curve calculated using qp = 0.24. Such a lo-fold increase in the complex part of the refractive index is not unrealistic because particles with this amount of dye inside have been synthesized by us (but were not used because the fluorescence was greatly reduced).
Thus, the decrease in the experimental minimum was not caused by absorption, but probably by fluorescence as is demonstrated in Figure 6 for the 4F particles. The minima in the curve measured with an antifluorescence filter are somewhat deeper than for the curve measured without the filter. This difference was observed despite the less than optimal excitation wavelength (see Figure 9) and the absence of effects of fluorescence for the 1B particles. Apparently this is caused by the increased concentration of dye per particle (Table III). However, the calculated minima presented in Figure 6 are still clearly deeper than those measured. The differences are not caused by a wrong value for the polydispersity, because the higher minima are filled up first as a result of polydispersity and the opposite is observed experimentally. Multiple scattering could be excluded by diluting the dispersion several times. No differences were observed. It is possible that the few percent of the dumbbells are responsible for the increased intensity in the minima.
In the RGD approximation the minima of the form factor of a sphere (eq 4) are located at the same scattering angles as those for a dumbbell; this is, however, no longer true for particle scattering outside the RGD limit. Further- more, the form of the dumbbell particles depicted in Figure 3a is not that of two spherical particles stuck together, but resulted from the growth of several hundred nanometers of “real” dumbbells consisting of particles with a radius of 210 nm.
Another reason for the discrepancy might be the angular resolution of the photomultiplier. Certainly at small scattering angles the measured values are averaged over a certain K range. It is however difficult to quantify the above mentioned assumptions.
Dynamic light scattering results of 4E and 4F-s are given in Figure 7. The hydrodynamic radii are in reasonable to good agreement with the optical radii. DLS measurements for spheres are large as 1 pm in diameter are, however, difficult to perform because the intensity drops very rapidly as a function of the scattering angle and the concentration of the spheres cannot be chosen too high in order to avoid multiple scattering. Furthermore, close to the minima, the diffusion coefficient starts to oscillate, because particles of different sizes reach their minimum scattering at different angles.20
Particle Refractive Index and Density. Densities and refractive indices of several particles are presented in Table II. In the table data are also given for silica spheres without APS and dye. 21 The density of the 4F particles, determined by changing the density of the solvent, is in good agreement with that of the particles without dye and APS. This result is reasonable, because the total number of silicon atoms from APS is very small compared to the
(19) Munkholm, C.; Parkinson, Don R.; Walt, D. R.J. Am. Chem. Sot. 1990,112,2608-12.
(20) Pusey, P. N.; van Megen, W. J. Chem. Phys. 1984,S’O (8), 3513-20. (21) Van Blaaderen, A.; Kentgens, A. P. M. J. Non-Cryst. Solids. in
press.
van Blaaderen and Vrij
total number of silica atoms per particle. The influence of preferent adsorption for larger particles is relatively small, because a layer of solvent of 1 nm represents only a small fraction of the particle volume. Therefore, the (mean) refractive index of the 4F particles is close to the value obtained for “Stiiber” silica as well.
Just as for the 2C-s particles (Table II), it has been reported before that octadecanol-coated particles possess a lower density and mean refractive index.ip3 The low density found for the 1B spheres cannot be explained by an octadecanol coating or the thin APS layer. It is not clear why the density is so low for the 1B particles.
Particle Fluorescence. To give an indication of the dye content of the particles, the number of dye molecules per particle, N, was calculated (Table III). The molar concentration inside the particles was calculated by dividing N by Avogadro’s number and dividing by the particle volume. Of course this molar concentration is only a true reflection of the local dye concentration inside a hybrid core particle. To calculate these values the density of the particles was taken to be 2 g/mL (see Table II), and it was assumed that all TES is converted into pure SiOz. The dye left in the supernatant was always less than 1% and was neglected. The homogeneous distribution of the coupling agent inside the particles is discussed in ref 1.
With confocal scanning laser microscopy it is possible to make optical sections deep inside a concentrated dispersion.7 The increased resolution of the confocal imaging technique can be used to image the distribution of fluorescent molecules inside a large particle. The x-y resolution of a voxel in the imaging plane is, however, still about 200 X 200 nm.s Two particles that are in contact and contain fluorescent molecules close to the particle surface are, therefore, difficult to distinguish as separate particles. For this reason the 3D-s particles, with two thin fluorescent layers close to the particle surface, were mixed with nonfluorescent stearyl silica spheres of the same size (Figure 8a). Although the distribution of dye as in 3D-s is not well suited to study the structure in concentrated dispersions, Figure 8a nicely demonstrates the distribution inside a particle. The micrograph consists of an optical section about 650 nm thick. A fluorescent ring is the result of the projection in the imaging plane of a sphere with a thin fluorescent spherical layer (diameter 1 pm) close to the surface of a particle that lies with its center exactly in the middle of the optical section. If the particle center lies above or below the section, the projection results in a ring that is smaller than 1 pm. These smaller rings can also be seen in Figure 8a.
Individual particles in a concentrated dispersion of 4F-s spheres are easily distinguished in the micrograph shown in Figure 8b. Here the fluorescent molecules are distrib- uted in a core of radius 210 nm within a thick nonfluo- rescent outer layer of silica (Table I). Therefore, the closest distance between the spheres in the micrograph is 1 pm, then the two spheres are in physical contact.
The bleachability of the FITC molecules, necessary for the FRAP measurements but a nuisance for many other techniques, can be demonstrated convincingly with CSLM (see refs 5 and 7). This fading of the fluorescence does not make the imaging of the particles more difficult, because the fluorescence of FITC is very intense and hundreds of images of the same optical section can be made before the particles cannot be detected anymore. However, if the fluorescence intensity has to be used to quantify the number of colloidal particles, bleaching is a problem.

2930 Langmuir, Vol. 8, No. 12, 1992
determined by electrophoresis.5 These particles not only form colloidal crystals upon sedimentation as described above but also were seen to crystallize homogeneously in a few minutes at volume fractions close to 20%. This particle volume fraction is close to the concentration at which the long-time self-diffusion coefficient became very small.5 Contrary to heterogeneous crystallization where crystals form for instance at a top or bottom layer, homogeneous crystallization is characterized by the for- mation of crystallites throughout the whole volume of the dispersion. Crystallites formed by homogeneous crystal- lization are not oriented by gravity.
As expected, the stability and phase behavior of 2C-s were the same as has been described for other octadecanol- coated silica particles. 3~23 In cyclohexane these particles can be described as a suspension of hard spheres.4,5 Upon sedimentation in cyclohexane again oriented crystals were formed, this time the whole volume of the sediment consisted of crystals. By use of the same octadecanol- coated silica spheres this process has been studied in detail by Russel et al.24 In a range of volume fractions (53-59 % ) homogeneous crystallization was observed as has been described by Pusey et al. for another hard-sphere-like model system.25 The crystallization rate, that is the time it took to observe for the first crystallites by eye, was on the order of hours, as opposed to days for the crystallites formed upon sedimentation. The maximum crystalliza- tion rate was observed at concentrations around 56 % . To our knowledge, this is the first homogeneous crystallization reported for octadecanol-coated particles. Perhaps, this is due to the low polydispersity of 2C-s.
A very intriguing behavior was displayed by 2B-s. This sterically stabilized system phase separated in cyclohexane into a concentrated, liquid-like phase and a dilute phase (-Cl% volume fraction). After both phases were redis- persed (total volume fraction around lo%), the concen- trated phase (final volume fraction around 30-40%) sedimentedlphase separated with a sharp boundary in about 30 min. After this time the volume of the still flowing phase stayed constant. On a much longer time scale (days) there was also the “ordinary” sedimentation of both phases under gravity. After a few weeks this resulted for the concentrated phase in an amorphous, not flowing sediment with on top of it a crystal layer that was formed by the sedimentation of the dilute phase. Samples taken from the concentrated and dilute phase and diluted to con- centrations below 1% did not show any sign of clustering and there were no signs of a phase separation in both dispersions. Both formed a colloidal crystal phase on the bottom of the container after sedimentation with no amorphous phase.
The origin of the attractions between the 2B-s particles could be caused by hydrogen bond formation between amine groups from different particles. These amine groups could still be reached from the solvent, as was shown by a color reaction of the amine group with salicylaldehyde.’ However, octadecanol and APS-coated silica particles described in ref 1 were not stable in cyclohexane. It is difficult to explain how the small number of FITC groups on the particle surface could make a difference in this very apolar solvent (dielectric constant 2.0). In the slightly more polar solvent chloroform (dielectric constant 4.3) the 2B-s particles probably were charged. No phase separation was observed, but the sediment stayed liquid-
(23) Jansen, J. W.; De Kruif, C. G.; Vrij, A. J. Colloid Interface Sci. 1986, 114 (2), 481-91.
(24) Davis, K. E.; Russel, W. B.; Glantschnig, W. J. J. Chem. Sm., Faraday Trans, 1 1991,87 (3), 411-24.
(25) Pusey, P. N.; Van Megen, W. Nature 1986, 320, 34C-2.
van Blaaderen and Vrij
like even after months, with a crystal layer on top. The crystals could be destroyed by slightly shaking, while the crystal phase consisting of the 2C-s particles in cyclohexane could only be destroyed after 10 min of ultrasonic vibration.
The larger octadecanol-coated particles (3D-s and 4F- s) were not stable in cyclohexane and toluene. A possible explanation for these instabilities is easier to find. The monomolecular layer of octadecanol is at most 2 nm thick. For particles with radii close to 500 nm, it is conceviable, that even a Hamaker constant that is slightly different from that of the solvent is sufficient to destabilize the dispersion. It is almost impossible to verify the origin of the attraction by computing the van der Waals attractions, because estimations of the Hamaker constants for the octadecanol layer and silica cores cannot be made ex- tremely accurate.
In chloroform the larger particles 3S-CF-SO and 4F-s were stable and even formed colloidal crystal phases after centrifugation. As described in ref 7 the interparticle distance in the crystals is so large, that only a charge on the particles can explain this increased repulsion.
The interesting behavior that was described qualitatively above for several particles certainly warrants further research. Already one can conclude that the interparticle potential between octadecanol-coated silica spheres is influenced by small changes on the silica surface and that large (1200 nm radius) octadecanol-coated particles can acquire a surface charge in apolar liquids and are no longer described anymore by a hard sphere potential in cyclo- hexane.
V. Conclusions
It has been shown, that dyes can be incorporated inside monodisperse, colloidal silica spheres through a simple synthetic procedure that allows control over where in the particle the dye is build in. Furthermore, it has been shown that these particles can be coated with octadecanol to make them dispersable in organic solvents. These dyed silica spheres can be used as model particles in studies at the properties of concentrated dispersions using techniques like fluorescence recovery after photobleaching, forced Rayleigh scattering, fluorescence correlation spectrosco- py,26 fluorescence cross correlation spectroscopy,27 and confocal scanning laser microscopy.
The synthetic procedure is sufficiently general that it can be easily modified: The photobleachable fluorophore FITC can be replaced by other dyes that are reactive toward the amine groups. For instance a dye like rhodamine isothiocyanate is known to be less bleach- able16J7 and will therefore be somewhat better suited to CSLM studies. Recently we managed to synthesize dyed silica particles with the photoexcitable dye 4-(dimethyl- amino)azobenzene 4-isothiocyanate; these spheres were used for FRS measurements.6b Or the coupling agent APS through which the dyes are covalently attached to the silica structure can be replaced by another coupling agent (see ref 1).
Recently, independently from us, Giesche and Matijevic also used APS to prepare dyed silica particles.% However, they used acid dyes in the acid chloride form in order to physically attach the dye to the coupling agent.
The interest in the incorporation of (laser) dyes in inorganic matrices is growing rapidly (see e.g. refs 29-31).
(26) Ricka, J.; Binkert, T. Phys. Rev. A 1989, 39 (5), 2646-56. (27) Drewel, M.; Pusey, P. N. Opt. Acta 1983, 30 (lo), 1483-500. (28) Giesche, H.; Matijevic, E. Dyes Pigm. 1992, 17, 323-340. (29) McKierman, J. M.; Yamanaka, S. A.; Dunn, B.; Zink, J. I. J. Phys.
C%m. 1990,94, 5652-4.
Monodisperse Colloidal Silica Spheres
This interest results from a possible use of such materials in, e.g., optical waveguides, dye lasers, solar energy converters, and optical switches. The procedures used so far consist mainly of adding a dye to a solution in which a silica gel is being formed. Certainly, the controlled incorporation of dye through covalent bonds as described in our paper will be of interest to the materials science as well.
(30) Gvishi, R.; Reisfeld, R. J. Non-Cryst. Solids 1991, 1.28, 69-76. (31) Blonski, S. Chem. Whys. Lett. 1991, 18 (1,2,3), 22S34.
Langmuir, Vol. 8, No. 12,1992 2931
Acknowledgment. We thank W. Hage (Netherlands Institute for Developmental Biology, Utrecht) for the making of the CSLM graphs, M. F. Hazenkamp (Depart- ment of Solid State Chemistry, University of Utrecht) for his help with the measurements of the luminescence spectra, and A. Imhof and 0. Roelands for their work in the synthesis and characterization. This work was sup- ported by the Netherlands Foundation for Chemical Research (SON) with financial aid from the Netherlands Organization for Scientific Research (NWO).
Registry No. ,502, 7631-86-9.