Embed Size (px)
Citation preview
Synthesis of Low Viscosity, Fast UV Curing Solder Resist Based onEpoxy Resin for Ink-Jet Printing
Chao Yang, Zhen-Guo YangDepartment of Materials Science, Fudan University, Shanghai 200433, ChinaCorrespondence to: Z.-G. Yang (E-mail: [email protected])
ABSTRACT: A novel photosensitive low viscosity epoxy resin was synthesized by polyethylene glycol (PEG)-modified bisphenol-A ep-
oxy resin (E51). The resin was modified by ethylene glycol, diethylene glycol, and different molecule weights (200,300,400) PEGs to
optimize the minimum viscosity. FTIR was used to determine molecule structure. Cationic photoinitiator (UVI-6976) mixed with
modified resin (10 wt %), was utilized to boost the resin curing under UV light. The curing degree was beyond 90% within 40 s and
the whole process was monitored by photo-DSC. The modified resin diluted with ethylene glycol diglycidyl ether, was screen printed
onto polyimide and polyethylene terephthalate substrate, and the properties of solder mask were up to China printed circuit associa-
tion standard. The solder resist also meet all requirements under ink-jet printing technology as the viscosity is under 60 mPa�s andthe curing duration is <1 min. VC 2012 Wiley Periodicals, Inc. J. Appl. Polym. Sci. 129: 187–192, 2013
KEYWORDS: resins; applications; differential scanning calorimetry
Received 14 August 2012; accepted 13 October 2012; published online 4 November 2012DOI: 10.1002/app.38738
INTRODUCTION
Traditional solder resist or solder mask is the usually green lac-
quer-like coating that covers the major part of most modern
circuit boards. The solder resist consists of various kinds of
polymers depending upon the demands of application and it
plays a very significant role in the printed circuit board (PCB)
manufacture such as preventing solder from bridging, protecting
copper traces of PCB, adjusting the amount of solder attach-
ment, reducing the contamination of weld, saving solder,
increasing the degree of insulation, adjusting the high density of
wiring, avoiding cold solder, and improving the inspection effi-
ciency.1–5 With PCB industry growing, ink-jet printing technol-
ogy emerged and attracted global attention on this new manu-
facture technology. According to research of association
connecting electronics industries (IPC) in 2011, the market of
printed and potentially printed electronics is beyond $2.2 Bil-
lion. On the basis of IDTechEx Company’s research, the new
report ‘‘Brand Enhancement by Electronics in Packaging 2012–
2022’’ forecasts that the global demand for electronic smart
packaging devices is currently at a tipping point and will grow
rapidly from $0.03 billion in 2012 to $1.7 billion in 2022.With
the development of ink-jet printing technology, traditional sol-
der resist ink cannot meet the requirements of the new technol-
ogy, especially on viscosity and curing condition. In the mean-
time, traditional techniques not only waste large amount of raw
materials but also pollute our environment due to substractive
process and inevitable organic solvents.
Traditional solder mask can be divided into four types based on
the manufacture procedure, dry film solder mask, thermosetting
solder mask, UV curing solder mask, and photoimageable solder
mask. The most widely used solder resist is epoxy liquid that is
silkscreened through the pattern onto the PCB. Photoimageable
solder masks both liquid ink and dry film, are also the main
raw materials to fabricate PCB recently. The liquid solder mask
can be silkscreened or sprayed on the PCB, exposed to the pat-
tern and developed to provide openings in the pattern for parts
to be soldered to the copper pads, while the dry film solder
mask is vacuum laminated on the PCB then exposed and devel-
oped. The organic solvents mainly ethers and halohydrocarbon
are used to reduce the viscosity of epoxy resin as well as achieve
much more smooth coating film. However, these organic sol-
vents can be harmful to workers’ lung and also damage ozone
layer as the halogen atoms decomposed from halohydrocarbon.
All three processes go through a thermal cure of some type after
the pattern is defined and lots of materials are wasted duo to
substractive process. Besides, the screen printing technology as
well as the photoimageable technology can only reach 100-lmlinewidth, which anchored the development of high density of
PCB. To cope with this problem and achieve higher density
interconnector, scientists began to study a brand new technique
VC 2012 Wiley Periodicals, Inc.
WWW.MATERIALSVIEWS.COM WILEYONLINELIBRARY.COM/APP J. APPL. POLYM. SCI. 2013, DOI: 10.1002/APP.38738 187
named printed electronics technology in2003.6,7 Organic Elec-
tronics Association (OEA) held an organic electronics confer-
ence while IDTechEx Company conducted printed electronics
conference at the same time in 2003, which stimulated PCB
industry giants’ interest. Hence, more and more resources and
fundings were invested in scientific research institutions and
potential market was extremely promising as the international
authorities predicted. Figure 1 shows the Printed Electronics’
market forecast conducted by IDTechEx Company.
While Printed Electronics’ manufactures are totally different
from traditional procedures, more requirements on raw materi-
als came out. To ensure the ink can be jetted continually and
nonclogging, the viscosity of the ink must be <80 mPa�s and
for the sake of controlling the smallest linewidth, the curing of
solder mask must be cured before the ink spread on the sub-
strate, so the duration of curing should be <60 s.8 Besides,
excellent flexibility, adhesivity, and chemical resistance are also
obliged.
In this article, we used different molecule weight polyethylene
glycol (PEG), such as ethylene glycol, diethylene glycol, PEG200,
PEG300, PEG400 to modify the universal epoxy resin E51 to
achieve low-viscosity epoxy resin. FT-IR was employed to ensure
the modified resin’s structure. Various amounts of active dilute
were also tested to make sure the viscosity of the solder resist
reach the ink-jet printing standard. To reduce shrinkage rate,
traditional epoxy acrylate system was aborted and cationic pho-
toinitiator was utilized to activate the curing process. The whole
curing process was monitored by photo-DSC so as to determine
the curing duration.
EXPERIMENTAL
Materials
E51 epoxy resin was obtained from Shanghai Xinhua Resin
Manufacturing. Diglycol, and different molecule weigh (mw)
PEG (mw: 200, 300, 400) were purchased by Sinopharm Chemi-
cal Reagent Beijing. Ethylene glycol diglycidyl ether (EGDGE),
neopentyl glycol diglycidyl ether (NGDGE), and 1,4-butanediol
diglycidyl ether (BGDGE) were provided by Changshu Jiafa
Chem, while cationic photoinitiator (UVI-6976) was received by
Dow Chemistry. Catalyst boron trifluoride etherate and triethyl-
amine were obtained from Aladdin Reagent (Shanghai, China).
Synthesis
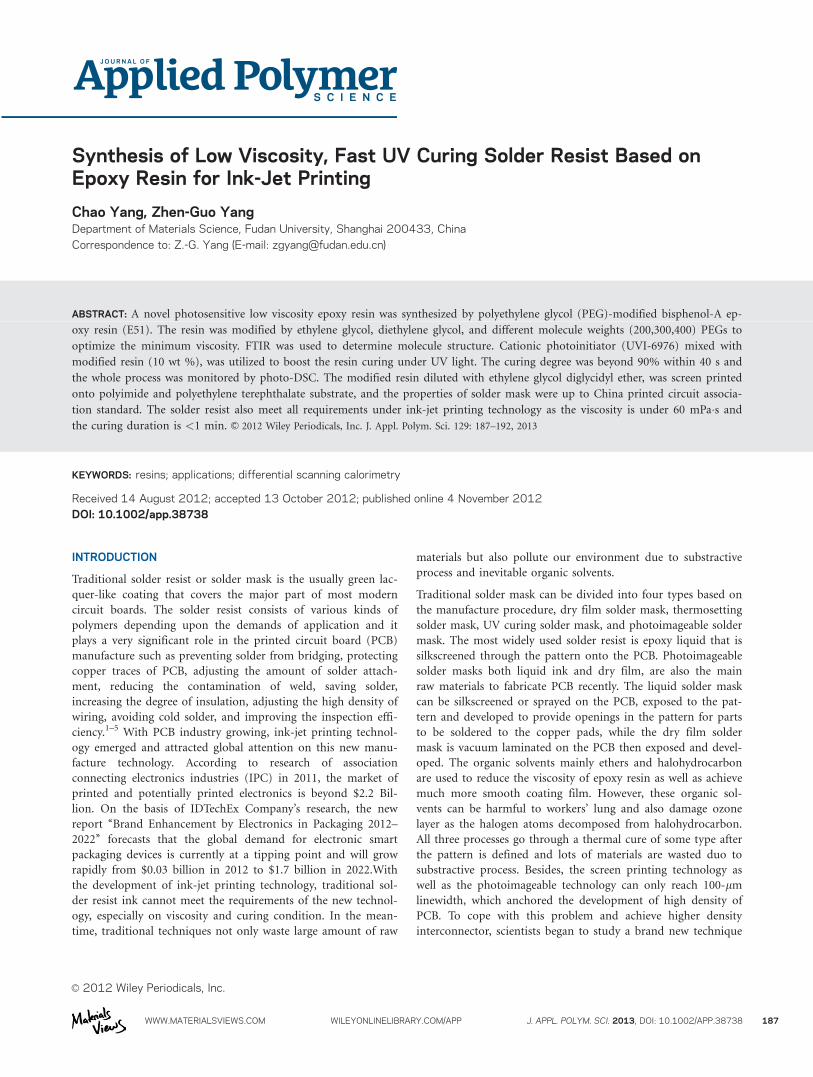
The synthesis scheme of the low viscosity epoxy resin is shown in
Figure 2, respectively. First, the E51 epoxy resin and PEG were
prepared by vacuum drying for 12 h.9 The epoxy resin and PEG
were mixed in a four-necked reaction flask equipped with a me-
chanical stirrer, a cooler, a nitrogen inlet, and a thermometer.
Catalyst boron trifluoride etherate was added dropwise into the
flask and the amount of catalyst was 1% of the PEG weight. The
four-necked flask was put into an oil bath at 80�C. The product
was colorless, transparent and good flowability liquid.
In the first experiment, different molecules of PEG (200, 300,
and 400) were used to optimize the viscosity. Besides, we also
tested ethylene glycol and diethylene glycol to compare the char-
acteristics with the PEG. The epoxy group: hydroxyl group was
2 : 1.
In the second experiment, we tried different molar ratio of E51
: PEG200, measured by epoxy group : hydroxyl group, to
achieve not only lower viscosity but also faster curing speed
under UV. The molar ratio of epoxy group : hydroxyl group
were shown in Table I.
Characterization
The modified resin was dropped onto a potassium bromide tab-
let and its FTIR was carried out using a Thermo Scientific Nico-
let iS10 spectrometer. The NDJ-5s rotational viscometer made
by Shanghai Sendi Scientific Instruments was employed to com-
pare viscosities of different modified resin. Because the resins
were non-Newtonian fluid, the values of the viscosity varied
under different measure conditions, especially at different rotate
speed.10 The parameters of the viscometer must be set exactly
the same so we can still prove the variation trend of viscosity
Figure 1. Printed Electronics’ market Forecast 2011–2021 from IDTechEx.
[Color figure can be viewed in the online issue, which is available at
wileyonlinelibrary.com.]
Figure 2. The synthesis scheme of the low viscosity epoxy resin.
ARTICLE
188 J. APPL. POLYM. SCI. 2013, DOI: 10.1002/APP.38738 WILEYONLINELIBRARY.COM/APP
while different modify agents were used during synthesis. No. 2
rotor, whose rotate speed was set as 12 r min�1 was chosen,
and all the experiments were conducted at constant room tem-
perature 25�C. The curing process was monitored by Photo-
DSC 204 F1 made by NETZSCH-Ger€atebau GmbH. The cati-
onic photoinitiator (UVI-6976) was added to the modified resin
as the weight ratio of 10%, and then the mixture was dropped
into an alumina crucible. The illuminance of the UV optical
source was 1 w cm�2 and the wavelength was 350 nm. The cru-
cible was exposed under UV light every 3 min at steady temper-
ature 35�C and exposure duration was 10 s. The solder mask
was screen printed on the PI and PET films to test its perform-
ance under CPCA standard (CPCA/JPCA 4306-2011).
RESULTS AND DISCUSSION
FT-IR Spectrums of E51 and Modified Resin
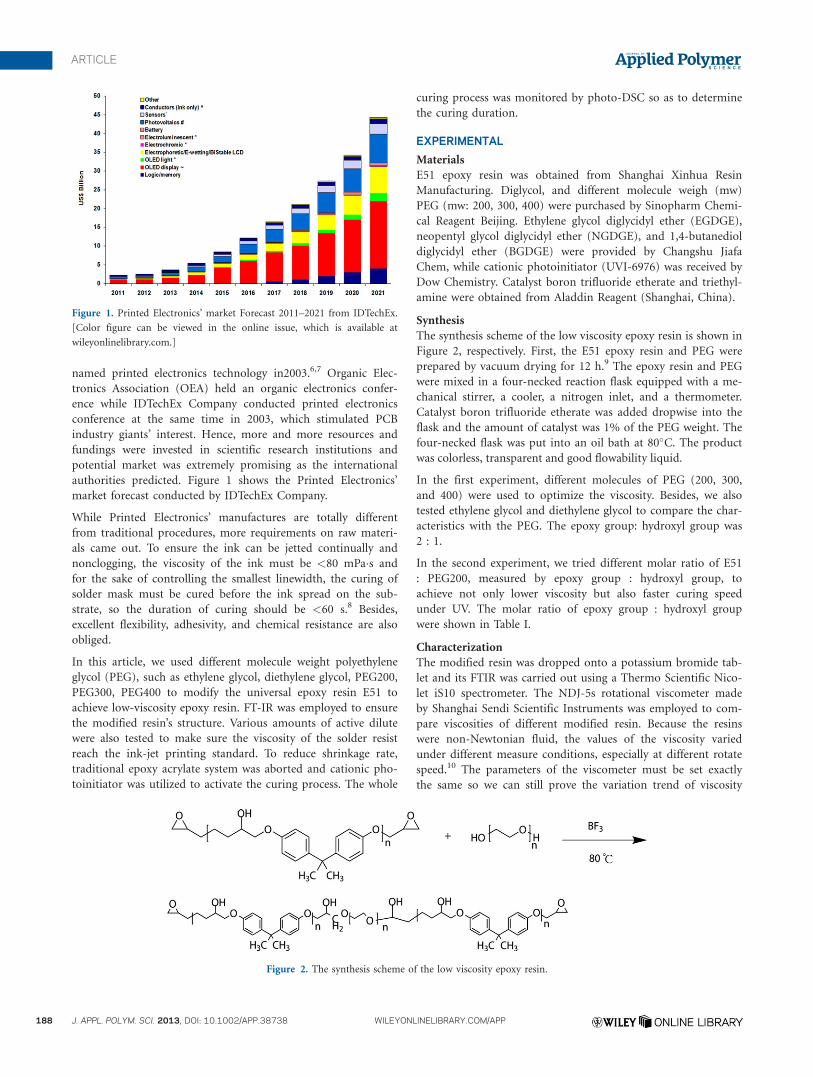
The FT-IR spectrums of E51 epoxy resin and PEG200 modified
E51 resin (epoxy group : hydroxyl group ¼ 2 : 1) were shown in
Figure 3. The absorption peak at 1100 cm�1 indicates that the
PEG was successfully grafted on epoxy resin while the absorption
peak at 910 cm�1 still remains strong, which indicates that the
epoxy group still maintains a relatively high concentration level.11
In fact, hydrochloric acid–acetone method was carried out to
determine the epoxy value of modified resin. The epoxy value
can still be beyond 0.35, while the epoxy group : hydroxyl group
was 2 : 1. The density of epoxy group essentially determined the
curing speed and the mask quality, which will be discussed in the
later section. The epoxy values of different molar ratios of epoxy
group : hydroxyl group was shown in Table II.
The Viscosity Trends with Different Modifying Agents and
Various Amount of Dilute
The viscosity of original E51 epoxy resin is more than 10,000
mPa�s. We tried different molecule of PEG as well as ethylene
Table I. The Molar Ratio of Epoxy Group : Hydroxyl Group
Sample name Epoxy group : hydroxyl group
1 5 : 1
2 4 : 1
3 3 : 1
4 2 : 1
5 1 : 1
6 4 : 5
7 3 : 5
Figure 3. FT-IR spectrums of E51 (red) and PEG modified resin (blue).
[Color figure can be viewed in the online issue, which is available at
wileyonlinelibrary.com.]
Table II. The Epoxy Values of Different Molar Ratio of Epoxy Group :
Hydroxyl Group
Samplename
Epoxy group :hydroxyl group
Epoxyvalue/mol/100 g
1 5 : 1 0.42
2 4 : 1 0.39
3 3 : 1 0.37
4 2 : 1 0.35
5 1 : 1 0.21
6 4 : 5 0.16
7 3 : 5 0.14
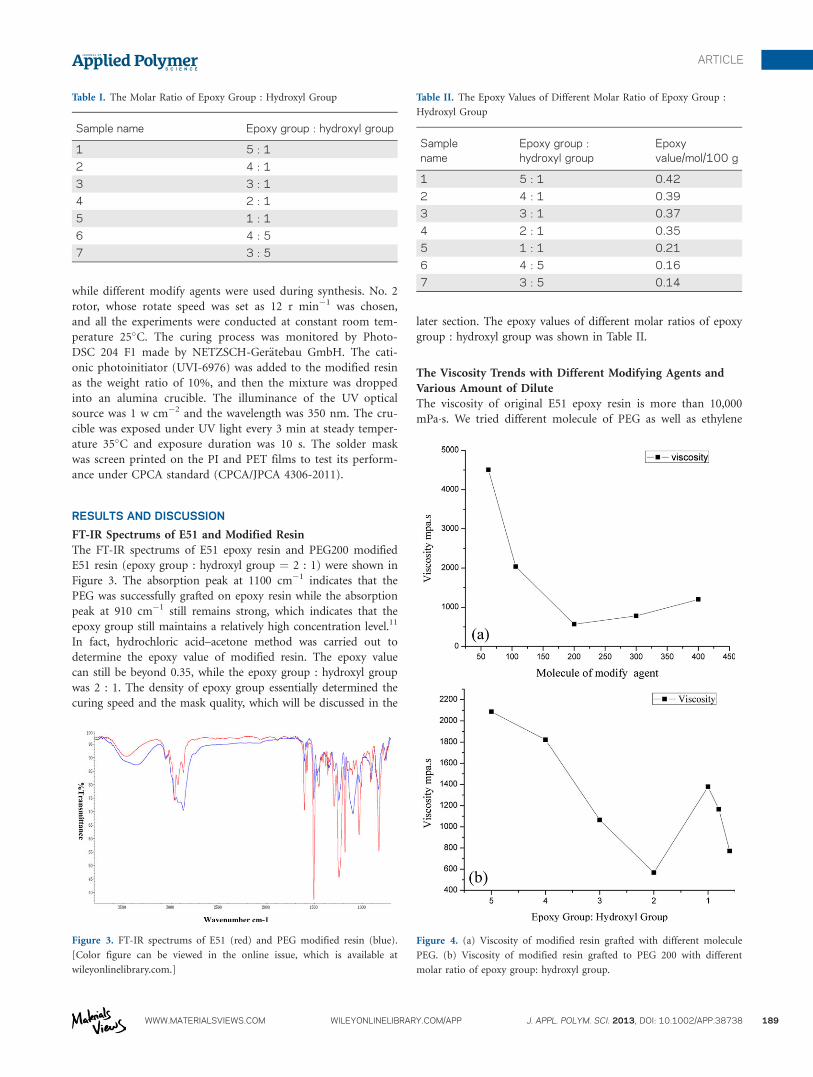
Figure 4. (a) Viscosity of modified resin grafted with different molecule
PEG. (b) Viscosity of modified resin grafted to PEG 200 with different
molar ratio of epoxy group: hydroxyl group.
ARTICLE
WWW.MATERIALSVIEWS.COM WILEYONLINELIBRARY.COM/APP J. APPL. POLYM. SCI. 2013, DOI: 10.1002/APP.38738 189
glycol and diethylene glycol, to optimize the viscosity. Figure
4(a) shows viscosity trend of modified resin grafted with differ-
ent molecule PEG and all the reactions were conducted with the
molar ratio of epoxy group : hydroxyl group as 2 : 1. Theoreti-
cally, the viscosity of modified resin decreased due to the
increasing percentage of flexible chain and the main chain of
PEG was flexible aliphatic chain that consisted of numerous
CAO and CAC structures. Hence, the viscosity of ethylene gly-
col, diethylene glycol, and PEG200 modified resin decline
because of increasing percentage of flexible chain, while PEG300
and PEG 400 modified resin increased owing to the molecules
of resins increase, which will cause chain entanglement. Obvi-
ously the lowest viscosity we achieve was the resin grafted with
PEG200 from Figure 4(a). Various amounts of reagents meas-
ured by molar ratio of epoxy group : hydroxyl group were
reacted and another trend of viscosity variation was shown in
Figure 4(b) and Table III. With the amount of PEG200 increas-
ing, the percentage of flexible chain increased, which caused the
remarkable decline of resin’s viscosity from thousands to 560
mPa�s. However, the increasing percentage of flexible chain will
increase the molecule of the modified resin and it would cause
chain entanglement. Therefore, the viscosity rose reversely as
the epoxy group : hydroxyl group reached 1 : 1 (Sample 5). As
the flexible chain increased, the major part of the modified resin
were PEG not the epoxy resin, whose epoxy group : hydroxyl
group was between 3 : 5 and 4 : 5. The viscosity began to
decline as the ratio of flexible chain increased, while the mole-
cule weight became a minor factor.12,13 Although the viscosity
of Samples 6 and 7 decreased, the end of polymer chain was
mainly hydroxyl group and it cannot be completely cured under
UV light no matter how much photoinitiator was mixed while
other modified resin’s curing performance will be discussed in
Table III. The Viscosity of Different Molar Ratio of Epoxy Group :
Hydroxyl Group Using PEG-200
Sample nameEpoxy group :hydroxyl group
Viscosity/mPa�s
1 5 : 1 2087
2 4 : 1 1822
3 3 : 1 1065
4 2 : 1 568
5 1 : 1 1378
6 4 : 5 1166
7 3 : 5 771
Table IV. The Viscosity of Different Weight Ratio of Dilute with Sample-4
Weight ratio of dilute Viscosity/mPa�s
0% 568
10% 230
20% 135
25% 80
30% 60
35% 56
40% 54
50% 52
60% 50
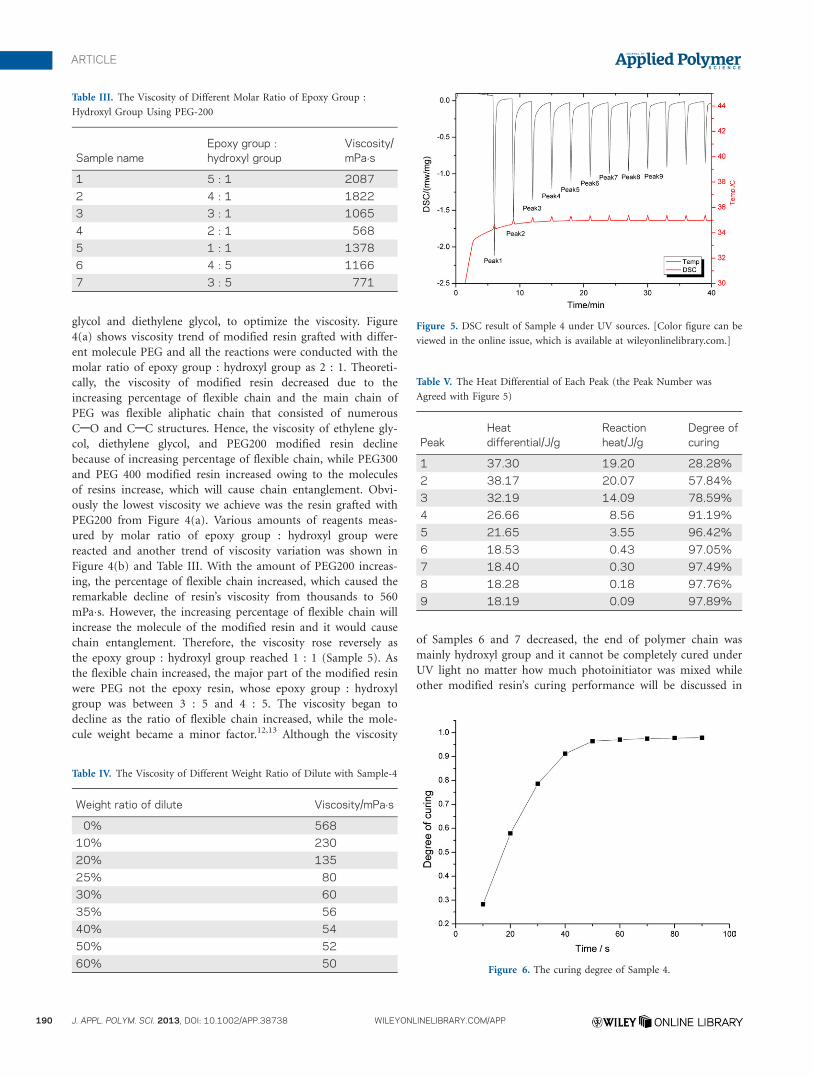
Figure 5. DSC result of Sample 4 under UV sources. [Color figure can be
viewed in the online issue, which is available at wileyonlinelibrary.com.]
Table V. The Heat Differential of Each Peak (the Peak Number was
Agreed with Figure 5)
PeakHeatdifferential/J/g
Reactionheat/J/g
Degree ofcuring
1 37.30 19.20 28.28%
2 38.17 20.07 57.84%
3 32.19 14.09 78.59%
4 26.66 8.56 91.19%
5 21.65 3.55 96.42%
6 18.53 0.43 97.05%
7 18.40 0.30 97.49%
8 18.28 0.18 97.76%
9 18.19 0.09 97.89%
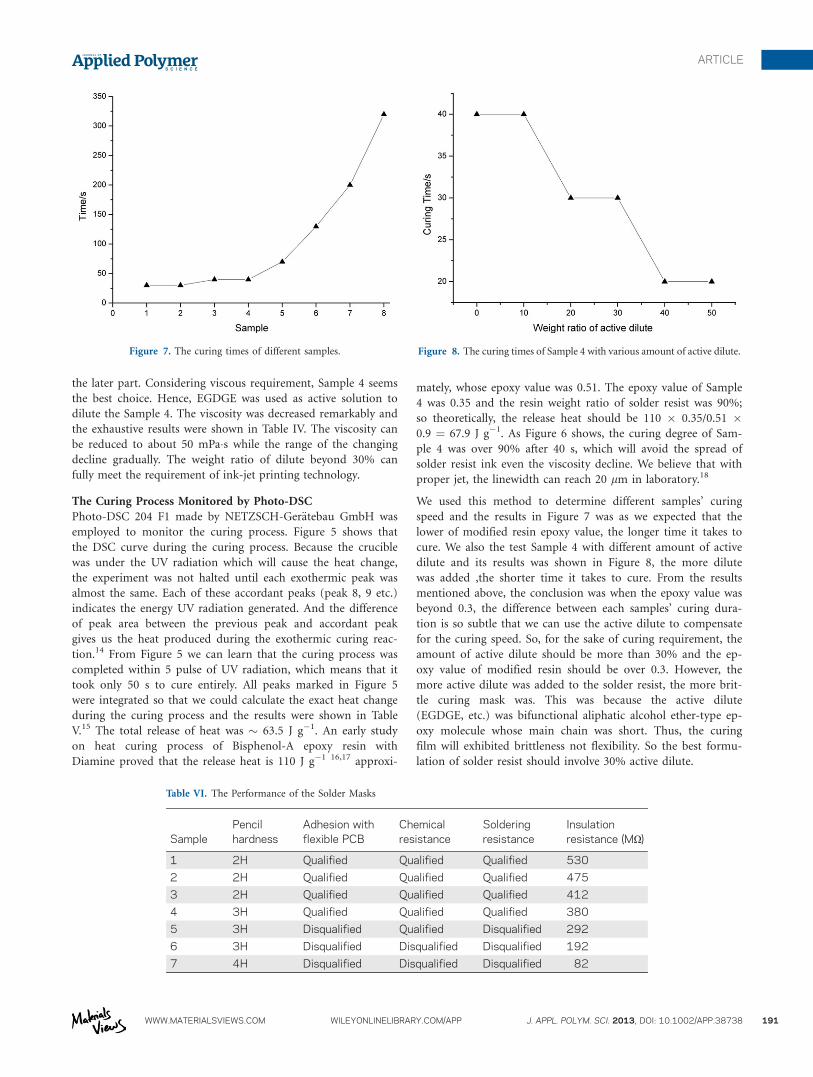
Figure 6. The curing degree of Sample 4.
ARTICLE
190 J. APPL. POLYM. SCI. 2013, DOI: 10.1002/APP.38738 WILEYONLINELIBRARY.COM/APP
the later part. Considering viscous requirement, Sample 4 seems
the best choice. Hence, EGDGE was used as active solution to
dilute the Sample 4. The viscosity was decreased remarkably and
the exhaustive results were shown in Table IV. The viscosity can
be reduced to about 50 mPa�s while the range of the changing
decline gradually. The weight ratio of dilute beyond 30% can
fully meet the requirement of ink-jet printing technology.
The Curing Process Monitored by Photo-DSC
Photo-DSC 204 F1 made by NETZSCH-Ger€atebau GmbH was
employed to monitor the curing process. Figure 5 shows that
the DSC curve during the curing process. Because the crucible
was under the UV radiation which will cause the heat change,
the experiment was not halted until each exothermic peak was
almost the same. Each of these accordant peaks (peak 8, 9 etc.)
indicates the energy UV radiation generated. And the difference
of peak area between the previous peak and accordant peak
gives us the heat produced during the exothermic curing reac-
tion.14 From Figure 5 we can learn that the curing process was
completed within 5 pulse of UV radiation, which means that it
took only 50 s to cure entirely. All peaks marked in Figure 5
were integrated so that we could calculate the exact heat change
during the curing process and the results were shown in Table
V.15 The total release of heat was � 63.5 J g�1. An early study
on heat curing process of Bisphenol-A epoxy resin with
Diamine proved that the release heat is 110 J g�1 16,17 approxi-
mately, whose epoxy value was 0.51. The epoxy value of Sample
4 was 0.35 and the resin weight ratio of solder resist was 90%;
so theoretically, the release heat should be 110 � 0.35/0.51 �0.9 ¼ 67.9 J g�1. As Figure 6 shows, the curing degree of Sam-
ple 4 was over 90% after 40 s, which will avoid the spread of
solder resist ink even the viscosity decline. We believe that with
proper jet, the linewidth can reach 20 lm in laboratory.18
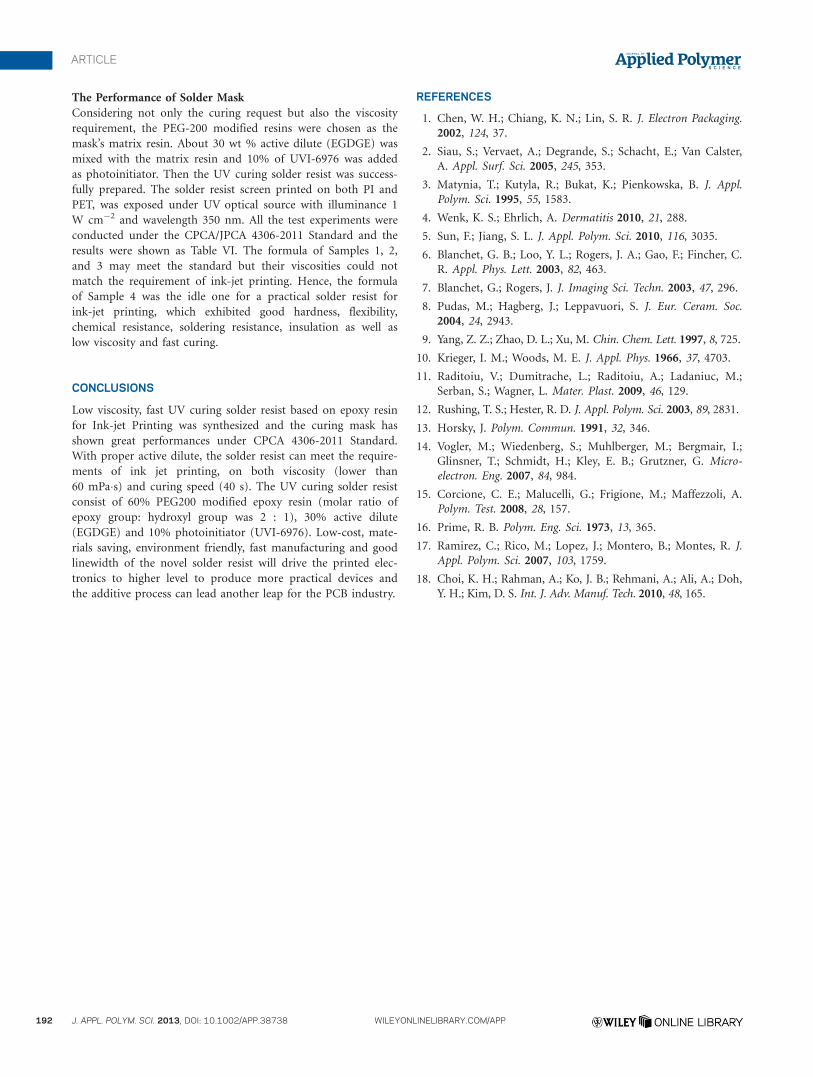
We used this method to determine different samples’ curing
speed and the results in Figure 7 was as we expected that the
lower of modified resin epoxy value, the longer time it takes to
cure. We also the test Sample 4 with different amount of active
dilute and its results was shown in Figure 8, the more dilute
was added ,the shorter time it takes to cure. From the results
mentioned above, the conclusion was when the epoxy value was
beyond 0.3, the difference between each samples’ curing dura-
tion is so subtle that we can use the active dilute to compensate
for the curing speed. So, for the sake of curing requirement, the
amount of active dilute should be more than 30% and the ep-
oxy value of modified resin should be over 0.3. However, the
more active dilute was added to the solder resist, the more brit-
tle curing mask was. This was because the active dilute
(EGDGE, etc.) was bifunctional aliphatic alcohol ether-type ep-
oxy molecule whose main chain was short. Thus, the curing
film will exhibited brittleness not flexibility. So the best formu-
lation of solder resist should involve 30% active dilute.
Figure 7. The curing times of different samples. Figure 8. The curing times of Sample 4 with various amount of active dilute.
Table VI. The Performance of the Solder Masks
SamplePencilhardness
Adhesion withflexible PCB
Chemicalresistance
Solderingresistance
Insulationresistance (MX)
1 2H Qualified Qualified Qualified 530
2 2H Qualified Qualified Qualified 475
3 2H Qualified Qualified Qualified 412
4 3H Qualified Qualified Qualified 380
5 3H Disqualified Qualified Disqualified 292
6 3H Disqualified Disqualified Disqualified 192
7 4H Disqualified Disqualified Disqualified 82
ARTICLE
WWW.MATERIALSVIEWS.COM WILEYONLINELIBRARY.COM/APP J. APPL. POLYM. SCI. 2013, DOI: 10.1002/APP.38738 191
The Performance of Solder Mask
Considering not only the curing request but also the viscosity
requirement, the PEG-200 modified resins were chosen as the
mask’s matrix resin. About 30 wt % active dilute (EGDGE) was
mixed with the matrix resin and 10% of UVI-6976 was added
as photoinitiator. Then the UV curing solder resist was success-
fully prepared. The solder resist screen printed on both PI and
PET, was exposed under UV optical source with illuminance 1
W cm�2 and wavelength 350 nm. All the test experiments were
conducted under the CPCA/JPCA 4306-2011 Standard and the
results were shown as Table VI. The formula of Samples 1, 2,
and 3 may meet the standard but their viscosities could not
match the requirement of ink-jet printing. Hence, the formula
of Sample 4 was the idle one for a practical solder resist for
ink-jet printing, which exhibited good hardness, flexibility,
chemical resistance, soldering resistance, insulation as well as
low viscosity and fast curing.
CONCLUSIONS
Low viscosity, fast UV curing solder resist based on epoxy resin
for Ink-jet Printing was synthesized and the curing mask has
shown great performances under CPCA 4306-2011 Standard.
With proper active dilute, the solder resist can meet the require-
ments of ink jet printing, on both viscosity (lower than
60 mPa�s) and curing speed (40 s). The UV curing solder resist
consist of 60% PEG200 modified epoxy resin (molar ratio of
epoxy group: hydroxyl group was 2 : 1), 30% active dilute
(EGDGE) and 10% photoinitiator (UVI-6976). Low-cost, mate-
rials saving, environment friendly, fast manufacturing and good
linewidth of the novel solder resist will drive the printed elec-
tronics to higher level to produce more practical devices and
the additive process can lead another leap for the PCB industry.
REFERENCES
1. Chen, W. H.; Chiang, K. N.; Lin, S. R. J. Electron Packaging.
2002, 124, 37.
2. Siau, S.; Vervaet, A.; Degrande, S.; Schacht, E.; Van Calster,
A. Appl. Surf. Sci. 2005, 245, 353.
3. Matynia, T.; Kutyla, R.; Bukat, K.; Pienkowska, B. J. Appl.
Polym. Sci. 1995, 55, 1583.
4. Wenk, K. S.; Ehrlich, A. Dermatitis 2010, 21, 288.
5. Sun, F.; Jiang, S. L. J. Appl. Polym. Sci. 2010, 116, 3035.
6. Blanchet, G. B.; Loo, Y. L.; Rogers, J. A.; Gao, F.; Fincher, C.
R. Appl. Phys. Lett. 2003, 82, 463.
7. Blanchet, G.; Rogers, J. J. Imaging Sci. Techn. 2003, 47, 296.
8. Pudas, M.; Hagberg, J.; Leppavuori, S. J. Eur. Ceram. Soc.
2004, 24, 2943.
9. Yang, Z. Z.; Zhao, D. L.; Xu, M. Chin. Chem. Lett. 1997, 8, 725.
10. Krieger, I. M.; Woods, M. E. J. Appl. Phys. 1966, 37, 4703.
11. Raditoiu, V.; Dumitrache, L.; Raditoiu, A.; Ladaniuc, M.;
Serban, S.; Wagner, L. Mater. Plast. 2009, 46, 129.
12. Rushing, T. S.; Hester, R. D. J. Appl. Polym. Sci. 2003, 89, 2831.
13. Horsky, J. Polym. Commun. 1991, 32, 346.
14. Vogler, M.; Wiedenberg, S.; Muhlberger, M.; Bergmair, I.;
Glinsner, T.; Schmidt, H.; Kley, E. B.; Grutzner, G. Micro-
electron. Eng. 2007, 84, 984.
15. Corcione, C. E.; Malucelli, G.; Frigione, M.; Maffezzoli, A.
Polym. Test. 2008, 28, 157.
16. Prime, R. B. Polym. Eng. Sci. 1973, 13, 365.
17. Ramirez, C.; Rico, M.; Lopez, J.; Montero, B.; Montes, R. J.
Appl. Polym. Sci. 2007, 103, 1759.
18. Choi, K. H.; Rahman, A.; Ko, J. B.; Rehmani, A.; Ali, A.; Doh,
Y. H.; Kim, D. S. Int. J. Adv. Manuf. Tech. 2010, 48, 165.
ARTICLE
192 J. APPL. POLYM. SCI. 2013, DOI: 10.1002/APP.38738 WILEYONLINELIBRARY.COM/APP