Embed Size (px)
Citation preview
JAPAN INTERNATIONAL COOPERATION AGENCY (JICA) NATIONAL ECONOMIC AND DEVELOPMENT AUTHORITY (NEDA)
ROADMAP FOR TRANSPORT INFRASTRUCTURE DEVELOPMENT FOR METRO MANILA AND ITS SURROUNDING AREAS
(REGION III & REGION IV-A)
FINAL REPORT
TECHNICAL REPORT NO. 1
ENVIRONMENT AND HAZARD RISK REDUCTION ANALYSIS
March 2014
ALMEC CORPORATION

i
TABLE OF CONTENTS
1 BACKGROUND
1.1 Objectives ...................................................................................................................... 1-1 1.2 Current Environmental Situation of Metro Manila .......................................................... 1-1
2 ENVIRONMENTAL CONCERNS IN METRO MANILA
2.1 Air Pollution .................................................................................................................... 2-1 2.2 Climate Change Mitigation ............................................................................................2-11 2.3 Contribution to Emission Reduction of GHG and Air Pollutants under the Roadmap. 2-17 2.4 National Plan and Strategies Towards Low Carbon Transport .................................... 2-32 2.5 Towards Inclusive Transport ........................................................................................ 2-36 2.6 Water Pollution ............................................................................................................. 2-39
3 DISASTER ANALYSIS BASED ON HAZARD MAPPING
3.1 Objectives ...................................................................................................................... 3-1 3.2 Target Disasters and Data Source ................................................................................. 3-1 3.3 Earthquake Scenario and Vulnerability of Metro Manila to Earthquake (Review of MMEIRS) ..................................................................................................... 3-3 3.4 Tsunami .......................................................................................................................... 3-8 3.5 Flood .............................................................................................................................. 3-9 3.6 Multi-Hazard Risk Map................................................................................................. 3-13 3.7 Socio-economic Impact of Hazards ............................................................................. 3-20 3.8 Required Measures ...................................................................................................... 3-23
4 ENVIRONMENTAL AND SOCIAL IMPACT ASSESSMENT OF THE SHORT-TERM
PROGRAM (2014–2016)
4.1 Environmental Impact Assessment and Strategic Environmental Assessment ............ 4-1 4.2 Current Status of EIA Implementation in the Proposed Short-term Program ................ 4-2
ii
LIST OF TABLES
Table 2.1.1 Air Pollution Status of Major Cities in Asia .................................................................... 2-1 Table 2.1.2 National Emissions Inventory in 2006 .......................................................................... 2-2 Table 2.1.3 Motor Vehicle Emissions by Vehicle Type in Metro Manila in 2008 and 2010 (tons/year) ..................................................................................................................... 2-3 Table 2.1.4 National Ambient Air Quality Guideline Values (NAAQGV) vs. WHO Guidelines (ug/NcM) ..................................................................................................... 2-4 Table 2.1.5 Annual TSP Trend by Monitoring Stations, 2004–2012 ................................................ 2-4 Table 2.1.6 PM10 Monitoring Results in Metro Manila in 2011 and 2012 ....................................... 2-5 Table 2.1.7 Summary of the Parameters Monitored in the Philippines (2008) ................................ 2-7 Table 2.1.8 Incidence of Outdoor Air Pollution (OAP)-Related Illnesses by Age Group, 2003 ..... 2-10 Table 2.1.9 Annual Cost of Morbidity from Outdoor Air Pollution (2007 prices) ............................ 2-10 Table 2.2.1 Energy Consumption by Sector (2007) ...................................................................... 2-12 Table 2.2.2 Philippines GHG Emissions by Sector, 1990, 2000 and 2004 ................................... 2-13 Table 2.2.3 Population, GDP, and GHG Emissions for 50 Largest Cities and Urban Areas in the World (excerpt) ................................................................................................. 2-14 Table 2.2.4 Combined Energy and Waste Sectors GHG Emissions for Metro Manila .................. 2-14 Table 2.2.5 Status in the Philippines of Major Measures or Technologies to Potentially Reduce Pollution and GHG in the Transport Sector ................................................... 2-16 Table 2.3.1 Summary of Top-Down Approach and Bottom-Up Approach ..................................... 2-17 Table 2.3.2 Vehicle Emission Factors in Metro Manila .................................................................. 2-19 Table 2.3.3 Vehicle Emission Factors in Metro Manila (1992) ...................................................... 2-19 Table 2.3.4 Vehicle Emission Factors in Metro Manila (2001) ...................................................... 2-20 Table 2.3.5 Fuel Consumption for Vehicles and NOx Emission Factors in Metro Manila (2011) .. 2-20 Table 2.3.6 Reference Emission Factors in Metro Manila ............................................................. 2-20 Table 2.3.7 Summary of Result of Emission Reductions Based on Traffic Demand Assignment . 2-22 Table 2.3.8 Comparison of CO2 Emissions from Transport Sector in Manila between Top-down Approach and Bottom-up Approach ............................................ 2-23 Table 2.3.9 Representative Chassis Dynamometer In Major ASEAN Countries .......................... 2-27 Table 2.3.10 Parameter Setting for LRT1 Project ........................................................................... 2-28 Table 2.3.11 Emission Reductions with LRT1 Project ..................................................................... 2-29 Table 2.3.12 Parameter Setting for LRT2 Project ........................................................................... 2-29 Table 2.3.13 Emission Reductions with LRT2 Project ..................................................................... 2-29 Table 2.3.14 Parameter Setting for MRT3 Project........................................................................... 2-29 Table 2.3.15 Emission Reductions with MRT3 Project .................................................................... 2-30 Table 2.3.16 Emission Reductions with NLEX-SLEX Connector Project ........................................ 2-30 Table 2.3.17 Daily CO2 Emissions at the Proposed Provincial Bus Terminal Sites in the “Without Project” and “With Project” Scenarios for Year 2016.......................... 2-30 Table 2.4.1 Integrated EST Strategy ............................................................................................. 2-32 Table 3.3.1 Scenario Earthquakes .................................................................................................. 3-3 Table 3.3.2 Summary of Estimated Damages (MMEIRS, Model 08) .............................................. 3-6 Table 3.3.3 Highly Vulnerable Areas by Type .................................................................................. 3-7 Table 3.3.4 Possible Regional Separation....................................................................................... 3-7 Table 3.5.1 Priority Structural Measures for Sustainable Flood Risk Management ........................ 3-9 Table 3.6.1 Hazard Evaluation Criteria .......................................................................................... 3-14 Table 3.6.2 High Hazard Areas ...................................................................................................... 3-15 Table 3.8.1 Measures Required Against Possible Impacts of Multi-Hazards ................................ 3-23 Table 4.2.1 Environmental Impact Assessment and Resettlement Status of Projects Included in the Short-term Program ............................................................................. 4-4
iii
LIST OF FIGURES
Figure 1.2.1 Environmental Issues of Metro Manila ......................................................................... 1-1 Figure 2.1.1 National Emission Inventory of the Philippines, 2008 .................................................. 2-2 Figure 2.1.2 National PM10 Monitoring Results in 2012 .................................................................. 2-5 Figure 2.1.3 Ambient Air Quality Monitoring Stations in Metro Manila .............................................. 2-6 Figure 2.1.4 Calculated Particulate Concentrations in μg/NcM for the 2005 Baseline (left), 2015 Business-as-Usual (middle), and 2015 Combination of Policies (right) .............. 2-9 Figure 2.1.5 Components of Morbidity Costs (Php million, 2007 prices) ........................................ 2-10 Figure 2.2.1 Projected GHG Emission from the Transport Sector, 2010–2030 .............................. 2-15 Figure 2.3.1 Bottom-up Approach Methodology ............................................................................. 2-18 Figure 2.3.2 Result of Emission Reductions Based on Traffic Demand Assignment ..................... 2-22 Figure 2.3.3 Flowchart to Calculate the Amount of Emission from Vehicles .................................. 2-24 Figure 2.3.4 Passenger Car’s Driving Cycles of Jakarta (above) and Bangkok (below) ................ 2-25 Figure 2.4.1 Relationship among Different Programs Related to NIP in the Philippines ................ 2-33 Figure 2.4.2 Current Implementation of the UVVRP ....................................................................... 2-34 Figure 3.2.1 Distribution of Faults and Trenches Around the Study Area ......................................... 3-2 Figure 3.2.2 Transport System & Distribution of Faults & Trenches Around the Study Area ............ 3-2 Figure 3.3.1 Possible Earthquake Intensity and Liquefaction Potential ............................................ 3-4 Figure 3.3.2 Methodology of Urban Vulnerability Evaluation for Earthquake Scenario in Metro Manila ............................................................................................................. 3-4 Figure 3.3.3 Estimated Damages by Scenario Earthquake .............................................................. 3-5 Figure 3.3.4 Regional Vulnerability by Estimated Damages of Scenario Earthquake ...................... 3-6 Figure 3.4.1 Estimated Tsunami Hazard ........................................................................................... 3-8 Figure 3.5.1 Flood Hazard .............................................................................................................. 3-10 Figure 3.5.2 Water System ............................................................................................................. 3-10 Figure 3.5.3 Flood Depth Simulation of Typhoon Ondoy ................................................................ 3-11 Figure 3.5.4 Flood Duration Simulation of Typhoon Ondoy ............................................................ 3-12 Figure 3.6.1 Work Flow of Multi-Hazard Risk Mapping .................................................................. 3-14 Figure 3.6.2 Earthquake Hazard Map ............................................................................................. 3-16 Figure 3.6.3 Tsunami Hazard Map .................................................................................................. 3-17 Figure 3.6.4 Flood Hazard Map ...................................................................................................... 3-18 Figure 3.6.5 Multi-Hazard Risk Map ............................................................................................... 3-19 Figure 3.6.6 Multi-Hazard Risk Map and Vulnerable Areas to Each Hazard .................................. 3-19 Figure 3.7.1 Earthquake Hazard Map and Socio-economic Infrastructure ..................................... 3-21 Figure 3.7.2 Distribution of Population Density (2010) ................................................................... 3-22 Figure 3.7.3 Distribution of Population Density and Multi-Hazard Risk Map .................................. 3-22
iv
ABBREVIATIONS
ADB Asian Development Bank AFCS automated fare collection system ASBU Anti-Smoke Belching Units ATI Asian Terminals Inc. BCDA Bases Conversion and Development Authority BMDS bus management and dispatch facilities BOT build–operate–transfer BPO business process outsourcing BRT bus rapid transit BURs biennial update reports CALA Cavite Laguna CALABARZON Cavite, Laguna, Batangas, Rizal and Quezon CAMANAVA Caloocan, Malabon, Navotas and Valenzuela CBD central business district CBU completely built unit CCW center/cluster-corridor-wedge CIAC Clark International Airport CLUP comprehensive land use plans CME coconut methyl ester CNG compressed natural gas COP Conference of Parties DBM Department of Budget and Management DBP Development Bank of the Philippines DMIA Diosdado Macapagal International Airport DOF Department of Finance DOST Department of Science and Technology DOTC Department of Transportation and Communications RTPD Road Transport Planning Division DPWH Department of Public Works and Highways ECC environmental compliance certificate EDSA Epifanio de los Santos Avenue ESSO Environmental and Social Services Office FTI Food Terminal, Inc. GCR Greater Capital Region GDP gross domestic product GRDP gross regional domestic product HCPTI Harbour Centre Port Terminal Inc. HLURB Housing and Land Use Regulatory Board HUDCC Housing and Urban Development Coordinating Council ICTSI International Container Terminal Service, Inc. Infracom Infrastructure Committee IRR internal rate of return ISSMFE International Society of Soil Mechanics and Foundation
Engineering ITS integrated transport system JBIC Japan Bank for International Cooperation JICA Japan International Cooperation Agency LGU local government unit LRT Light Rail Transit LRTA Light Rail Transit Authority LTFRB Land Transportation Franchising & Regulatory Board
v
LDV Low Duty Vehicle METI Ministry of Economy, Trade and Industry
MIAA Manila International Airport Authority MICT Manila International Container Terminal MMDA Metro Manila Development Authority MMEIRS Earthquake Impact Reduction Study for Metro Manila MMPTS Mega Manila Public Transport Study MMUTIS Metro Manila Urban Transportation Integration Study MNL Manila North Line MNTC Manila North Tollways Corporation MNHPI Manila North Harbour Port Inc. MPDTC Metro Pacific Tollways Development Corp. MPPA million passengers per annum MRO maintenance, repair and overhaul MRT Metro Rail Transit MRV measurable, reportable and verifiable MSL Manila South Line MTDP medium-term development plan MVIS Motor Vehicle Inspection System NAAQGV National Ambient Air Quality Guideline Values NAIA Ninoy Aquino International Airport NFSCC National Framework Strategy on Climate Change NCR National Capital Region NGVPPT Natural Gas Vehicle Program for Public transport NEDA National Economic and Development Authority ICC Investment Coordination Committee NCTS National Center for Transportation Studies NLEX North Luzon Expressway NSCB National Statistical Coordination Board NSO National Statistics Office OAP outdoor air pollution O&M operation and maintenance ODA official development assistance OTCA Overseas Technical Cooperation Agency PDP Philippine Development Plan PEZA Philippine Economic Zone Authority PHIVOLCS Philippine Institute of Volcanology and Seismology PIBAS provincial integrated bus axis system PMO project management office PNCC Philippine National Construction Corporation PNR Philippine National Railways PNRI Philippine Nuclear Research Institute PPA Philippine Port Authority PPP public-private-partnership PUB public utility bus PUJ public utility jeepney Php Philippine peso R&D research and development RDA regional development agenda RET rapid exit taxiways ROW right of way SBF Subic Bay Freeport Zone SBPDP Subic Bay Port Development Project
vi
SCMB Subic-Clark-Manila- Batangas SCTEX Subic-Clark-Tarlac Expressway SLEX South Luzon Expressway SLTC South Luzon Tollway Corporation SOE state-owned enterprise STAR Southern Tagalog Arterial Road TDM Transportation Demand Management TEAM traffic engineering and management TEU twenty-foot equivalent units UP VRTL University of the Philippines Vehicle Research and
Testing Laboratory USAID United States Agency for International Development USD US dollar UV utility vehicle UVVRP Unified Vehicular Volume Reduction Program VFR visual flight rules VECP Report on Vehicular Emission Control Planning WB World Bank WHO World Health Organization
Roadmap for Transport Infrastructure Development for Metro Manila and Its Surrounding Areas (Region III & Region IV-A) FINAL REPORT
Technical Report No. 1 Environment and Hazard Risk Reduction Analysis
1-1
1 BACKGROUND
1.1 Objectives
1.1 The Transport Sector Roadmap for the sustainable development of the Greater Capital Region addresses urban development issues, vision, and spatial development direction, as well as highlights pivotal transport issues for further discussion towards implementation. The objective of this section is to discuss key environmental policy challenges and disaster concerns to substantiate the roadmap towards sustainable transport strategy in the study area and to identify specific implementation plans.
1.2 Current Environmental Situation of Metro Manila
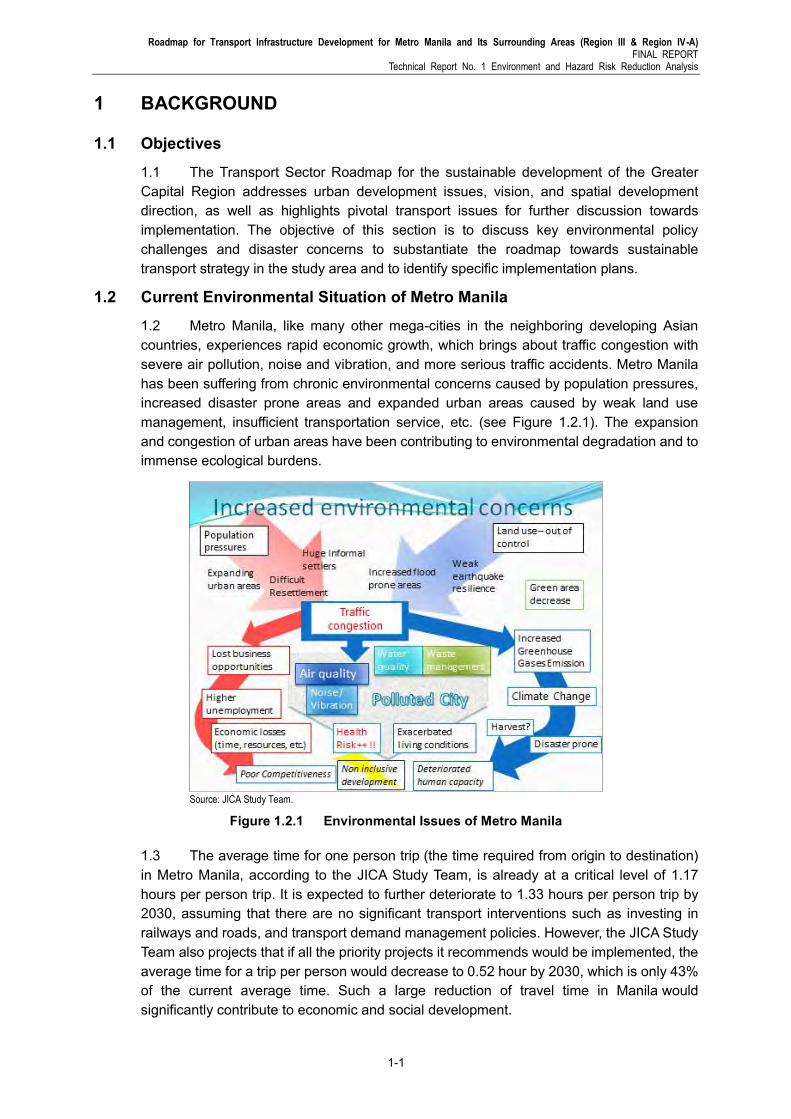
1.2 Metro Manila, like many other mega-cities in the neighboring developing Asian countries, experiences rapid economic growth, which brings about traffic congestion with severe air pollution, noise and vibration, and more serious traffic accidents. Metro Manila has been suffering from chronic environmental concerns caused by population pressures, increased disaster prone areas and expanded urban areas caused by weak land use management, insufficient transportation service, etc. (see Figure 1.2.1). The expansion and congestion of urban areas have been contributing to environmental degradation and to immense ecological burdens.
Source: JICA Study Team.
Figure 1.2.1 Environmental Issues of Metro Manila
1.3 The average time for one person trip (the time required from origin to destination) in Metro Manila, according to the JICA Study Team, is already at a critical level of 1.17 hours per person trip. It is expected to further deteriorate to 1.33 hours per person trip by 2030, assuming that there are no significant transport interventions such as investing in railways and roads, and transport demand management policies. However, the JICA Study Team also projects that if all the priority projects it recommends would be implemented, the average time for a trip per person would decrease to 0.52 hour by 2030, which is only 43% of the current average time. Such a large reduction of travel time in Manila would significantly contribute to economic and social development.
Roadmap for Transport Infrastructure Development for Metro Manila and Its Surrounding Areas (Region III & Region IV-A) FINAL REPORT Technical Report No. 1 Environment and Hazard Risk Reduction Analysis
1-2
1.4 Efficient and reliable transport is essential for social and economic activities. On the other hand, it has become one of the major causes of environmental problems such as air pollution, noise, vibration, and emission of greenhouse gases (GHG). Residents perceive traffic congestion as their number one problem, followed by air pollution, flood control and the need for security. Congestion and air pollution are serious problems caused by the transport sector.
1.5 However, a mega city such as Metro Manila can also be a model of environmental efficiency, since increased density and better management reduce the cost of service delivery, promote innovation, and enable prosperity through economic development. Sustainable cities are the best option to provide a quality of life while reducing net pollution such as GHG emissions. At the political level, cities are credible laboratories of social change with sufficient scale to bring about meaningful actions. The problems of traffic congestion, air pollution, contaminated surface water, and increasing waste, etc. are not only prevalent in Metro Manila but in many other regional centers in the Philippines. The outcomes of Metro Manila’s efforts to improve the environment will be able to expand in the adjacent regions as well as other major cities which share the same challenges.
Roadmap for Transport Infrastructure Development for Metro Manila and Its Surrounding Areas (Region III & Region IV-A) FINAL REPORT
Technical Report No. 1 Environment and Hazard Risk Reduction Analysis
2-1
2 ENVIRONMENTAL CONCERNS IN METRO MANILA
2.1 Air Pollution
1) Prime Significance of Pollution in Metro Manila
(1) Comparison with Other Asian Cities
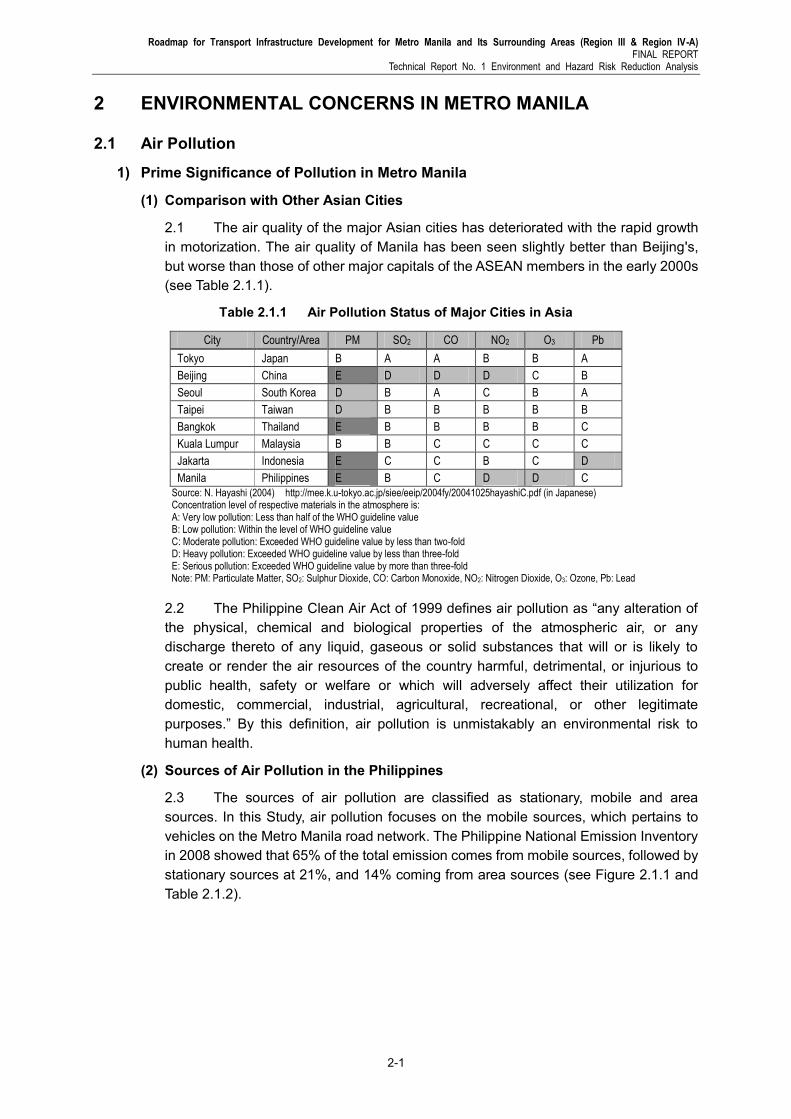
2.1 The air quality of the major Asian cities has deteriorated with the rapid growth in motorization. The air quality of Manila has been seen slightly better than Beijing's, but worse than those of other major capitals of the ASEAN members in the early 2000s (see Table 2.1.1).
Table 2.1.1 Air Pollution Status of Major Cities in Asia
City Country/Area PM SO2 CO NO2 O3 Pb
Tokyo Japan B A A B B A
Beijing China E D D D C B
Seoul South Korea D B A C B A
Taipei Taiwan D B B B B B
Bangkok Thailand E B B B B C
Kuala Lumpur Malaysia B B C C C C
Jakarta Indonesia E C C B C D
Manila Philippines E B C D D C
Source: N. Hayashi (2004) http://mee.k.u-tokyo.ac.jp/siee/eeip/2004fy/20041025hayashiC.pdf (in Japanese) Concentration level of respective materials in the atmosphere is: A: Very low pollution: Less than half of the WHO guideline value B: Low pollution: Within the level of WHO guideline value C: Moderate pollution: Exceeded WHO guideline value by less than two-fold D: Heavy pollution: Exceeded WHO guideline value by less than three-fold E: Serious pollution: Exceeded WHO guideline value by more than three-fold Note: PM: Particulate Matter, SO2: Sulphur Dioxide, CO: Carbon Monoxide, NO2: Nitrogen Dioxide, O3: Ozone, Pb: Lead
2.2 The Philippine Clean Air Act of 1999 defines air pollution as “any alteration of the physical, chemical and biological properties of the atmospheric air, or any discharge thereto of any liquid, gaseous or solid substances that will or is likely to create or render the air resources of the country harmful, detrimental, or injurious to public health, safety or welfare or which will adversely affect their utilization for domestic, commercial, industrial, agricultural, recreational, or other legitimate purposes.” By this definition, air pollution is unmistakably an environmental risk to human health.
(2) Sources of Air Pollution in the Philippines
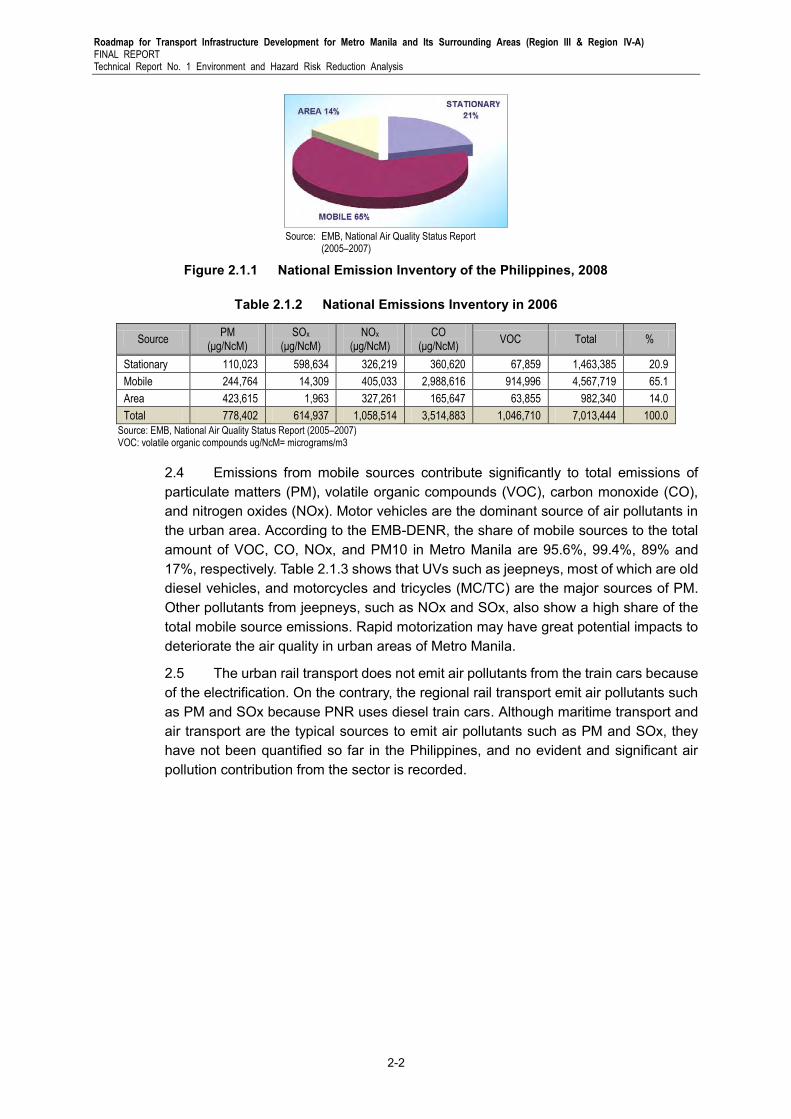
2.3 The sources of air pollution are classified as stationary, mobile and area sources. In this Study, air pollution focuses on the mobile sources, which pertains to vehicles on the Metro Manila road network. The Philippine National Emission Inventory in 2008 showed that 65% of the total emission comes from mobile sources, followed by stationary sources at 21%, and 14% coming from area sources (see Figure 2.1.1 and Table 2.1.2).
Roadmap for Transport Infrastructure Development for Metro Manila and Its Surrounding Areas (Region III & Region IV-A) FINAL REPORT Technical Report No. 1 Environment and Hazard Risk Reduction Analysis
2-2
Source: EMB, National Air Quality Status Report
(2005–2007)
Figure 2.1.1 National Emission Inventory of the Philippines, 2008
Table 2.1.2 National Emissions Inventory in 2006
Source PM
(μg/NcM) SOx
(μg/NcM) NOx
(μg/NcM) CO
(μg/NcM) VOC Total %
Stationary 110,023 598,634 326,219 360,620 67,859 1,463,385 20.9
Mobile 244,764 14,309 405,033 2,988,616 914,996 4,567,719 65.1
Area 423,615 1,963 327,261 165,647 63,855 982,340 14.0
Total 778,402 614,937 1,058,514 3,514,883 1,046,710 7,013,444 100.0
Source: EMB, National Air Quality Status Report (2005–2007) VOC: volatile organic compounds ug/NcM= micrograms/m3
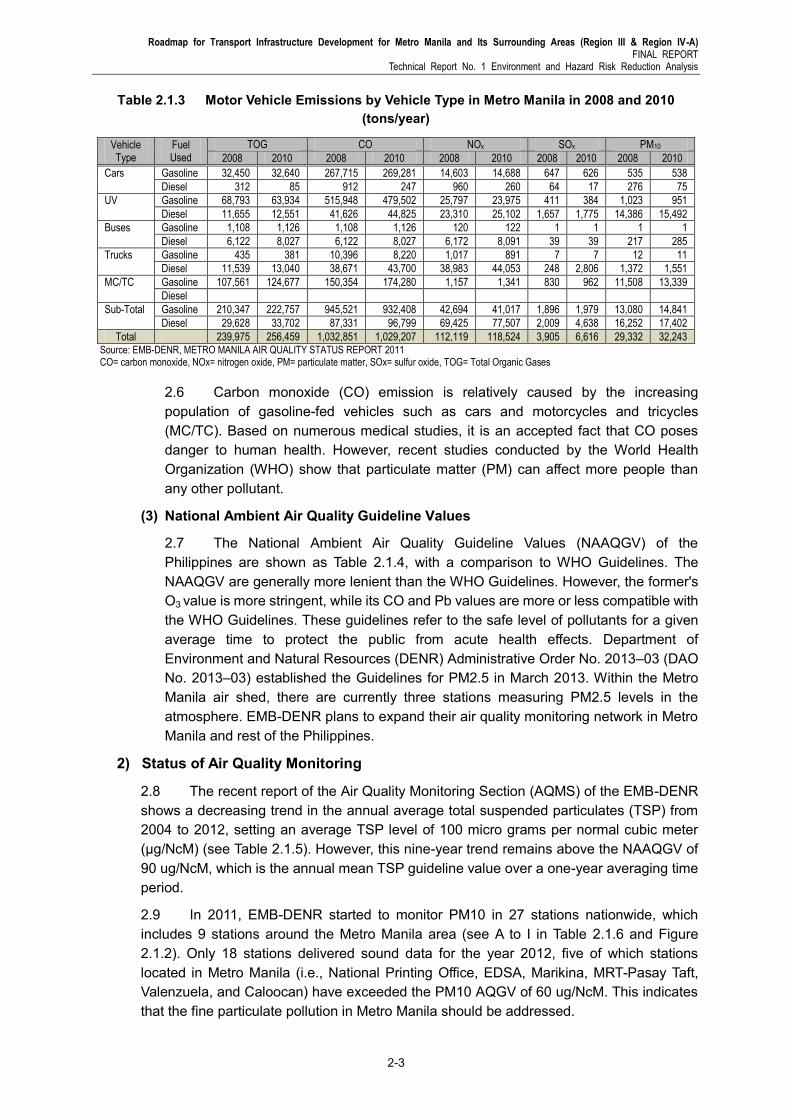
2.4 Emissions from mobile sources contribute significantly to total emissions of particulate matters (PM), volatile organic compounds (VOC), carbon monoxide (CO), and nitrogen oxides (NOx). Motor vehicles are the dominant source of air pollutants in the urban area. According to the EMB-DENR, the share of mobile sources to the total amount of VOC, CO, NOx, and PM10 in Metro Manila are 95.6%, 99.4%, 89% and 17%, respectively. Table 2.1.3 shows that UVs such as jeepneys, most of which are old diesel vehicles, and motorcycles and tricycles (MC/TC) are the major sources of PM. Other pollutants from jeepneys, such as NOx and SOx, also show a high share of the total mobile source emissions. Rapid motorization may have great potential impacts to deteriorate the air quality in urban areas of Metro Manila.
2.5 The urban rail transport does not emit air pollutants from the train cars because of the electrification. On the contrary, the regional rail transport emit air pollutants such as PM and SOx because PNR uses diesel train cars. Although maritime transport and air transport are the typical sources to emit air pollutants such as PM and SOx, they have not been quantified so far in the Philippines, and no evident and significant air pollution contribution from the sector is recorded.
Roadmap for Transport Infrastructure Development for Metro Manila and Its Surrounding Areas (Region III & Region IV-A) FINAL REPORT
Technical Report No. 1 Environment and Hazard Risk Reduction Analysis
2-3
Table 2.1.3 Motor Vehicle Emissions by Vehicle Type in Metro Manila in 2008 and 2010 (tons/year)
Vehicle Type
Fuel Used
TOG CO NOx SOx PM10
2008 2010 2008 2010 2008 2010 2008 2010 2008 2010
Cars Gasoline 32,450 32,640 267,715 269,281 14,603 14,688 647 626 535 538
Diesel 312 85 912 247 960 260 64 17 276 75
UV Gasoline 68,793 63,934 515,948 479,502 25,797 23,975 411 384 1,023 951
Diesel 11,655 12,551 41,626 44,825 23,310 25,102 1,657 1,775 14,386 15,492
Buses Gasoline 1,108 1,126 1,108 1,126 120 122 1 1 1 1
Diesel 6,122 8,027 6,122 8,027 6,172 8,091 39 39 217 285
Trucks Gasoline 435 381 10,396 8,220 1,017 891 7 7 12 11
Diesel 11,539 13,040 38,671 43,700 38,983 44,053 248 2,806 1,372 1,551
MC/TC Gasoline 107,561 124,677 150,354 174,280 1,157 1,341 830 962 11,508 13,339
Diesel
Sub-Total Gasoline 210,347 222,757 945,521 932,408 42,694 41,017 1,896 1,979 13,080 14,841
Diesel 29,628 33,702 87,331 96,799 69,425 77,507 2,009 4,638 16,252 17,402
Total 239,975 256,459 1,032,851 1,029,207 112,119 118,524 3,905 6,616 29,332 32,243 Source: EMB-DENR, METRO MANILA AIR QUALITY STATUS REPORT 2011 CO= carbon monoxide, NOx= nitrogen oxide, PM= particulate matter, SOx= sulfur oxide, TOG= Total Organic Gases
2.6 Carbon monoxide (CO) emission is relatively caused by the increasing population of gasoline-fed vehicles such as cars and motorcycles and tricycles (MC/TC). Based on numerous medical studies, it is an accepted fact that CO poses danger to human health. However, recent studies conducted by the World Health Organization (WHO) show that particulate matter (PM) can affect more people than any other pollutant.
(3) National Ambient Air Quality Guideline Values
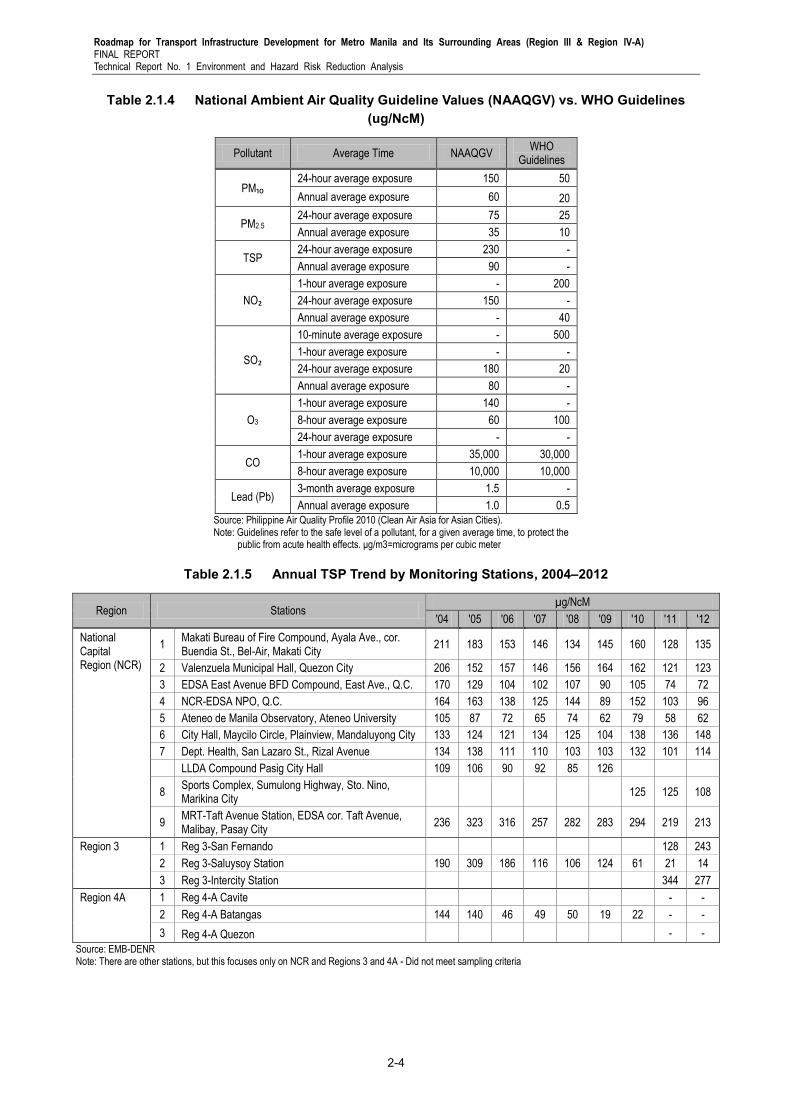
2.7 The National Ambient Air Quality Guideline Values (NAAQGV) of the Philippines are shown as Table 2.1.4, with a comparison to WHO Guidelines. The NAAQGV are generally more lenient than the WHO Guidelines. However, the former's O3 value is more stringent, while its CO and Pb values are more or less compatible with the WHO Guidelines. These guidelines refer to the safe level of pollutants for a given average time to protect the public from acute health effects. Department of Environment and Natural Resources (DENR) Administrative Order No. 2013–03 (DAO No. 2013–03) established the Guidelines for PM2.5 in March 2013. Within the Metro Manila air shed, there are currently three stations measuring PM2.5 levels in the atmosphere. EMB-DENR plans to expand their air quality monitoring network in Metro Manila and rest of the Philippines.
2) Status of Air Quality Monitoring
2.8 The recent report of the Air Quality Monitoring Section (AQMS) of the EMB-DENR shows a decreasing trend in the annual average total suspended particulates (TSP) from 2004 to 2012, setting an average TSP level of 100 micro grams per normal cubic meter (μg/NcM) (see Table 2.1.5). However, this nine-year trend remains above the NAAQGV of 90 ug/NcM, which is the annual mean TSP guideline value over a one-year averaging time period.
2.9 In 2011, EMB-DENR started to monitor PM10 in 27 stations nationwide, which includes 9 stations around the Metro Manila area (see A to I in Table 2.1.6 and Figure 2.1.2). Only 18 stations delivered sound data for the year 2012, five of which stations located in Metro Manila (i.e., National Printing Office, EDSA, Marikina, MRT-Pasay Taft, Valenzuela, and Caloocan) have exceeded the PM10 AQGV of 60 ug/NcM. This indicates that the fine particulate pollution in Metro Manila should be addressed.
Roadmap for Transport Infrastructure Development for Metro Manila and Its Surrounding Areas (Region III & Region IV-A) FINAL REPORT Technical Report No. 1 Environment and Hazard Risk Reduction Analysis
2-4
Table 2.1.4 National Ambient Air Quality Guideline Values (NAAQGV) vs. WHO Guidelines (ug/NcM)
Pollutant Average Time NAAQGV WHO
Guidelines
PM₁₀ 24-hour average exposure 150 50
Annual average exposure 60 20
PM2.5 24-hour average exposure 75 25
Annual average exposure 35 10
TSP 24-hour average exposure 230 -
Annual average exposure 90 -
NO₂
1-hour average exposure - 200
24-hour average exposure 150 -
Annual average exposure - 40
SO₂
10-minute average exposure - 500
1-hour average exposure - -
24-hour average exposure 180 20
Annual average exposure 80 -
O3
1-hour average exposure 140 -
8-hour average exposure 60 100
24-hour average exposure - -
CO 1-hour average exposure 35,000 30,000
8-hour average exposure 10,000 10,000
Lead (Pb) 3-month average exposure 1.5 -
Annual average exposure 1.0 0.5
Source: Philippine Air Quality Profile 2010 (Clean Air Asia for Asian Cities). Note: Guidelines refer to the safe level of a pollutant, for a given average time, to protect the
public from acute health effects. μg/m3=micrograms per cubic meter
Table 2.1.5 Annual TSP Trend by Monitoring Stations, 2004–2012
Region Stations µg/NcM
'04 '05 '06 '07 '08 '09 '10 '11 '12
National Capital Region (NCR)
1 Makati Bureau of Fire Compound, Ayala Ave., cor. Buendia St., Bel-Air, Makati City
211 183 153 146 134 145 160 128 135
2 Valenzuela Municipal Hall, Quezon City 206 152 157 146 156 164 162 121 123
3 EDSA East Avenue BFD Compound, East Ave., Q.C. 170 129 104 102 107 90 105 74 72
4 NCR-EDSA NPO, Q.C. 164 163 138 125 144 89 152 103 96
5 Ateneo de Manila Observatory, Ateneo University 105 87 72 65 74 62 79 58 62
6 City Hall, Maycilo Circle, Plainview, Mandaluyong City 133 124 121 134 125 104 138 136 148
7 Dept. Health, San Lazaro St., Rizal Avenue 134 138 111 110 103 103 132 101 114
LLDA Compound Pasig City Hall 109 106 90 92 85 126
8 Sports Complex, Sumulong Highway, Sto. Nino, Marikina City
125 125 108
9 MRT-Taft Avenue Station, EDSA cor. Taft Avenue, Malibay, Pasay City
236 323 316 257 282 283 294 219 213
Region 3 1 Reg 3-San Fernando 128 243
2 Reg 3-Saluysoy Station 190 309 186 116 106 124 61 21 14
3 Reg 3-Intercity Station 344 277
Region 4A 1 Reg 4-A Cavite - -
2 Reg 4-A Batangas 144 140 46 49 50 19 22 - -
3 Reg 4-A Quezon - -
Source: EMB-DENR Note: There are other stations, but this focuses only on NCR and Regions 3 and 4A - Did not meet sampling criteria
Roadmap for Transport Infrastructure Development for Metro Manila and Its Surrounding Areas (Region III & Region IV-A) FINAL REPORT
Technical Report No. 1 Environment and Hazard Risk Reduction Analysis
2-5
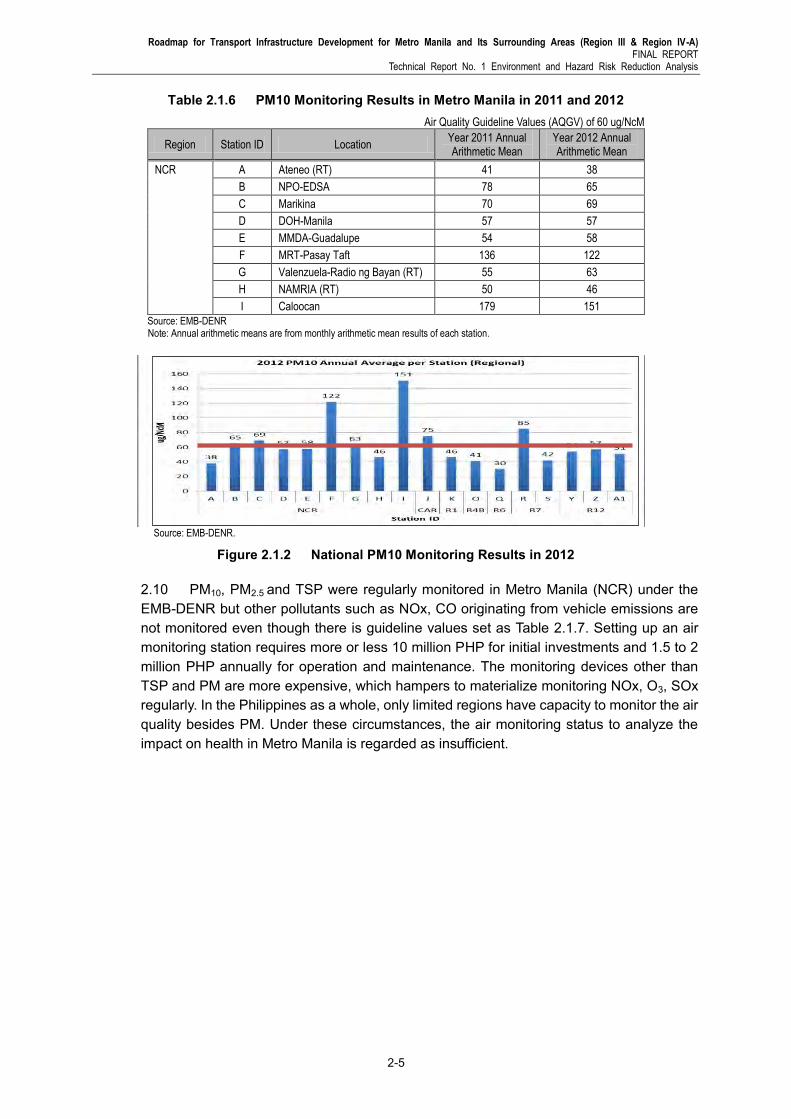
Table 2.1.6 PM10 Monitoring Results in Metro Manila in 2011 and 2012 Air Quality Guideline Values (AQGV) of 60 ug/NcM
Region Station ID Location Year 2011 Annual Arithmetic Mean
Year 2012 Annual Arithmetic Mean
NCR A Ateneo (RT) 41 38
B NPO-EDSA 78 65
C Marikina 70 69
D DOH-Manila 57 57
E MMDA-Guadalupe 54 58
F MRT-Pasay Taft 136 122
G Valenzuela-Radio ng Bayan (RT) 55 63
H NAMRIA (RT) 50 46
I Caloocan 179 151
Source: EMB-DENR Note: Annual arithmetic means are from monthly arithmetic mean results of each station.
Source: EMB-DENR.
Figure 2.1.2 National PM10 Monitoring Results in 2012
2.10 PM10, PM2.5 and TSP were regularly monitored in Metro Manila (NCR) under the EMB-DENR but other pollutants such as NOx, CO originating from vehicle emissions are not monitored even though there is guideline values set as Table 2.1.7. Setting up an air monitoring station requires more or less 10 million PHP for initial investments and 1.5 to 2 million PHP annually for operation and maintenance. The monitoring devices other than TSP and PM are more expensive, which hampers to materialize monitoring NOx, O3, SOx regularly. In the Philippines as a whole, only limited regions have capacity to monitor the air quality besides PM. Under these circumstances, the air monitoring status to analyze the impact on health in Metro Manila is regarded as insufficient.
Roadmap for Transport Infrastructure Development for Metro Manila and Its Surrounding Areas (Region III & Region IV-A) FINAL REPORT Technical Report No. 1 Environment and Hazard Risk Reduction Analysis
2-6
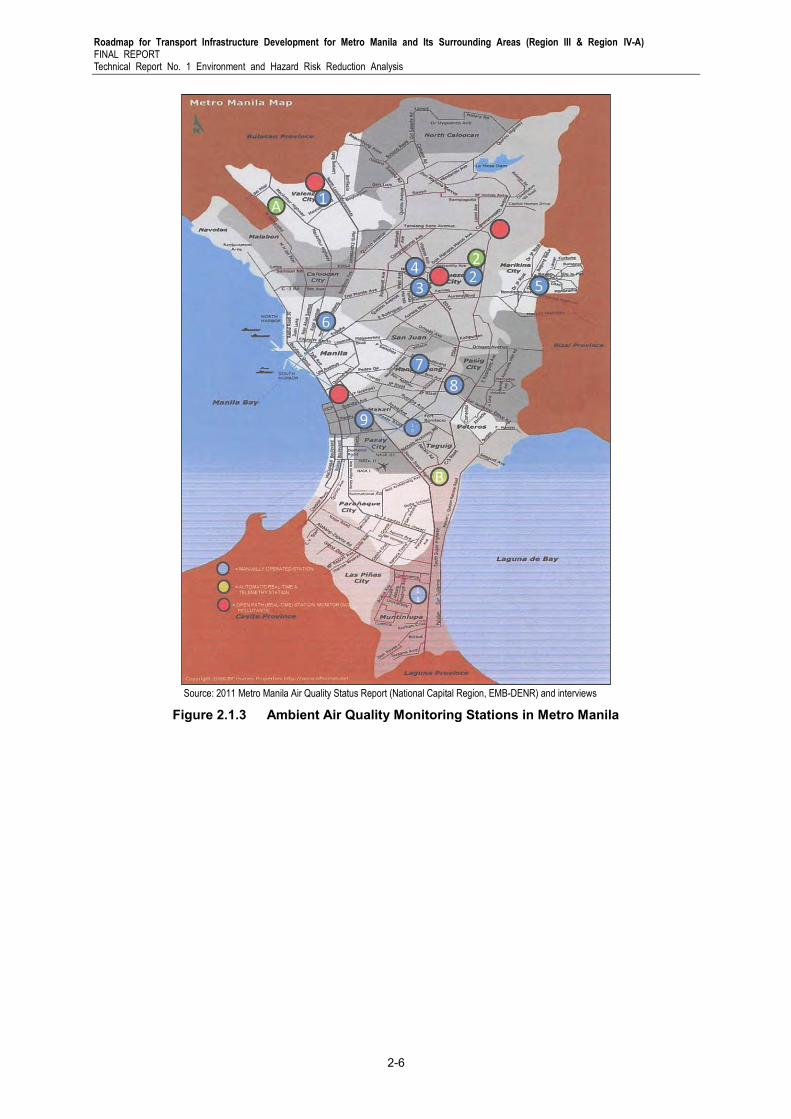
Source: 2011 Metro Manila Air Quality Status Report (National Capital Region, EMB-DENR) and interviews
Figure 2.1.3 Ambient Air Quality Monitoring Stations in Metro Manila
Roadmap for Transport Infrastructure Development for Metro Manila and Its Surrounding Areas (Region III & Region IV-A) FINAL REPORT
Technical Report No. 1 Environment and Hazard Risk Reduction Analysis
2-7
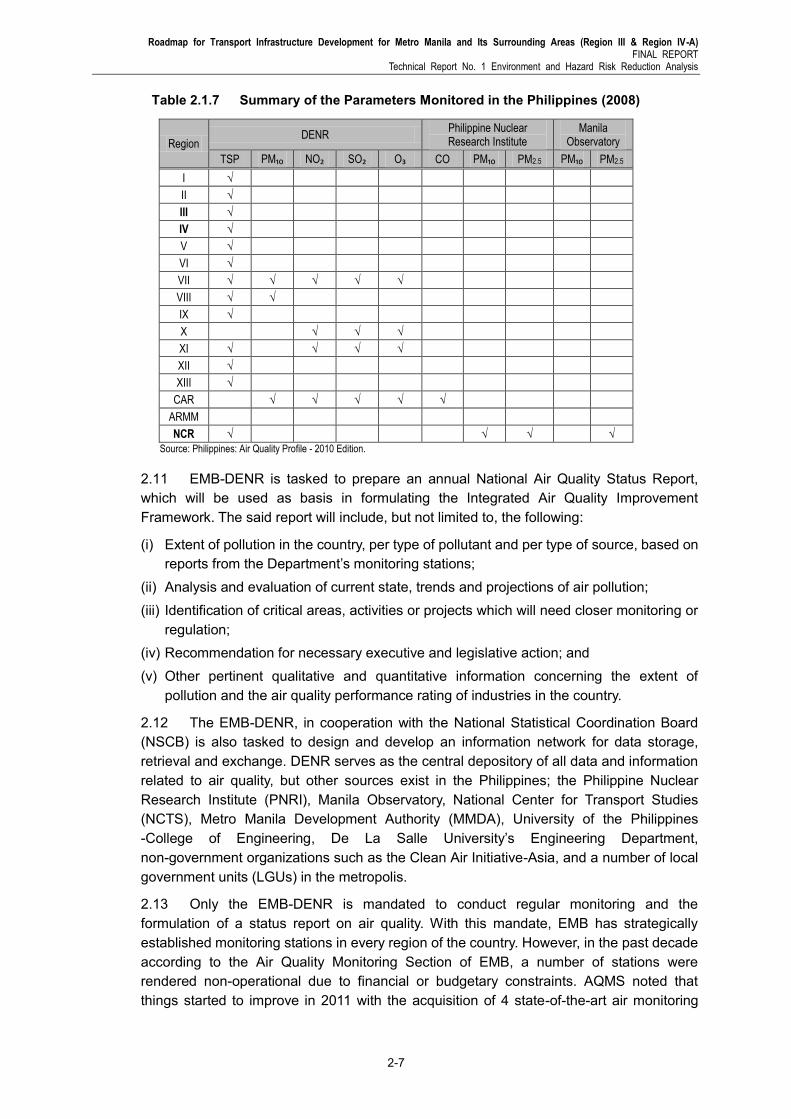
Table 2.1.7 Summary of the Parameters Monitored in the Philippines (2008)
Region DENR
Philippine Nuclear Research Institute
Manila Observatory
TSP PM₁₀ NO₂ SO₂ O₃ CO PM₁₀ PM2.5 PM₁₀ PM2.5
I √
II √
III √
IV √
V √
VI √
VII √ √ √ √ √
VIII √ √
IX √
X √ √ √
XI √ √ √ √
XII √
XIII √
CAR √ √ √ √ √
ARMM
NCR √ √ √ √
Source: Philippines: Air Quality Profile - 2010 Edition.
2.11 EMB-DENR is tasked to prepare an annual National Air Quality Status Report, which will be used as basis in formulating the Integrated Air Quality Improvement Framework. The said report will include, but not limited to, the following:
(i) Extent of pollution in the country, per type of pollutant and per type of source, based on reports from the Department’s monitoring stations;
(ii) Analysis and evaluation of current state, trends and projections of air pollution; (iii) Identification of critical areas, activities or projects which will need closer monitoring or
regulation; (iv) Recommendation for necessary executive and legislative action; and (v) Other pertinent qualitative and quantitative information concerning the extent of
pollution and the air quality performance rating of industries in the country.
2.12 The EMB-DENR, in cooperation with the National Statistical Coordination Board (NSCB) is also tasked to design and develop an information network for data storage, retrieval and exchange. DENR serves as the central depository of all data and information related to air quality, but other sources exist in the Philippines; the Philippine Nuclear Research Institute (PNRI), Manila Observatory, National Center for Transport Studies (NCTS), Metro Manila Development Authority (MMDA), University of the Philippines -College of Engineering, De La Salle University’s Engineering Department, non-government organizations such as the Clean Air Initiative-Asia, and a number of local government units (LGUs) in the metropolis.
2.13 Only the EMB-DENR is mandated to conduct regular monitoring and the formulation of a status report on air quality. With this mandate, EMB has strategically established monitoring stations in every region of the country. However, in the past decade according to the Air Quality Monitoring Section of EMB, a number of stations were rendered non-operational due to financial or budgetary constraints. AQMS noted that things started to improve in 2011 with the acquisition of 4 state-of-the-art air monitoring
Roadmap for Transport Infrastructure Development for Metro Manila and Its Surrounding Areas (Region III & Region IV-A) FINAL REPORT Technical Report No. 1 Environment and Hazard Risk Reduction Analysis
2-8
equipment with open-pot technology which can provide run-time data on air parameters including PM10 and PM2.5. These equipments are currently stationed and operational in 4 locations in Metro Manila as previously explained. The air monitoring office will be installing 27 more units of the said equipment at the rest of their monitoring stations which may be completed within 2013. Currently the air pollution prediction system is under preparation and will be operated in 2014. With these efforts, air monitoring system is expected to be improved, but not sufficiently able to address the danger of air quality.
3) Air Quality in a Planning Perspective
2.14 The Integrated Environmental Strategies-Philippines by the Manila Observatory forecasted traffic demand levels for 2005, 2010 and 2010 utilizing the comprehensive MMUTIS study (1999) in relation with air pollution (PM and CO2) reduction policies aimed to bring the state of air pollution to 2002 level. These policies:
(i) Transportation Demand Management through license plate scheme (TDM); (ii) Construction of Railway-based Mass Transit System; (iii) Construction of Bikeways; (iv) Implementation of the Motor Vehicle Inspection System (MVIS); (v) Implementation of the Compressed Natural Gas for buses (CNG); (vi) Introduction of Coco diesel for diesel-fuelled vehicles particularly jeepneys (CME); (vii) Two-stroke tricycles switching to four-stroke engines; (viii) Improvement of vehicles by the use of Diesel Traps;
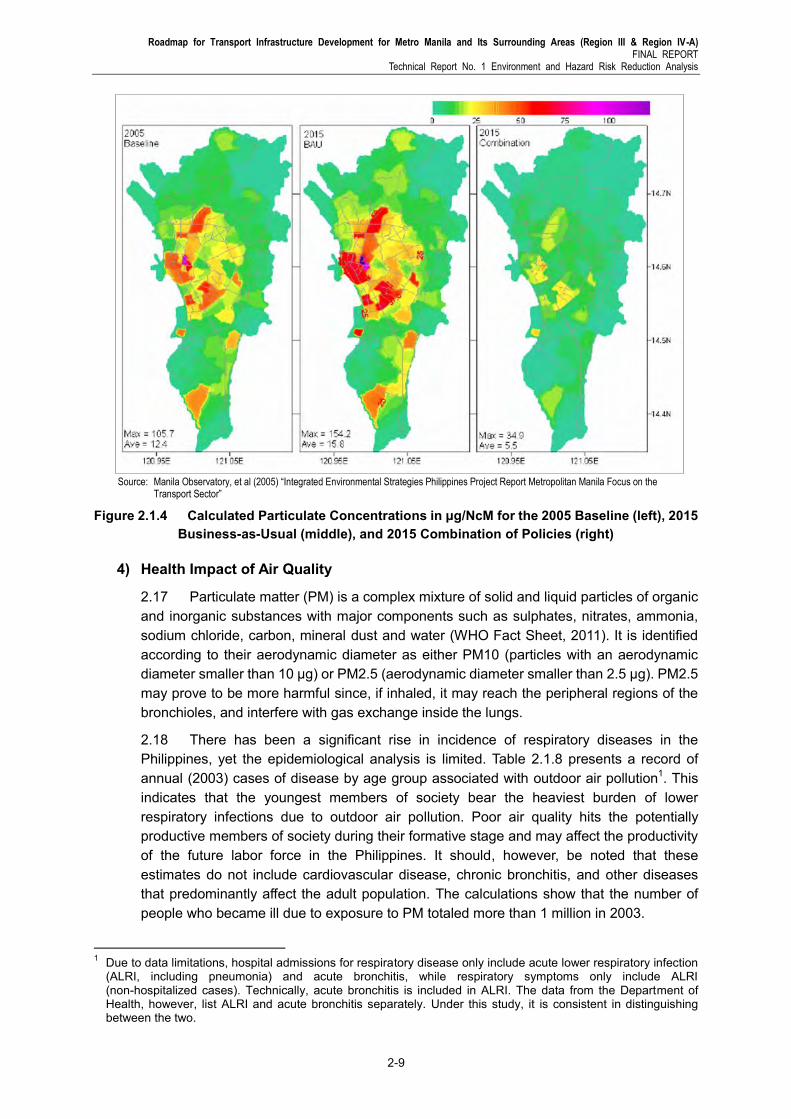
2.15 Traffic in 98 zones in the study area was projected for 2005, 2010 and 2015 in consideration of the period of implementation of policies mentioned above. The total emission from vehicular traffic during these periods was estimated using emission factors assumed from the business-as-usual scenario (BAU). Air quality simulations using isopleth maps show a BAU (worst-case) scenario having a PM range of above 125 ug/NcM in the main business center in the metropolis when no policies would be implemented to reduce air pollution. On the other hand, a 2015 best-case scenario where all policies are assumed to be implemented shows that the level of pollution in Metro Manila would be better than that of the 2005 baseline (see Figure 2.1.4). All exceedances might be able to disappear. While this modeling conducted by the Manila Observatory is not correlated with the traffic demand projection under the JICA study, it is obvious that the adaptation of several strategic policies can result in a dramatic improvement in Metro Manila’s air quality.
2.16 As far as the present level of air pollution is concerned, government should establish a present baseline in relation to policies already in place. The exercise would confirm and assess the traffic forecast and emission factors used and work to formulate sustainable air quality control action plan for the next generation. The policies already taking place are actually related to the climate change mitigation policies, and are further elaborated in Section 2.2 on Climate Change Mitigation.
Roadmap for Transport Infrastructure Development for Metro Manila and Its Surrounding Areas (Region III & Region IV-A) FINAL REPORT
Technical Report No. 1 Environment and Hazard Risk Reduction Analysis
2-9
Source: Manila Observatory, et al (2005) “Integrated Environmental Strategies Philippines Project Report Metropolitan Manila Focus on the
Transport Sector”
Figure 2.1.4 Calculated Particulate Concentrations in μg/NcM for the 2005 Baseline (left), 2015 Business-as-Usual (middle), and 2015 Combination of Policies (right)
4) Health Impact of Air Quality
2.17 Particulate matter (PM) is a complex mixture of solid and liquid particles of organic and inorganic substances with major components such as sulphates, nitrates, ammonia, sodium chloride, carbon, mineral dust and water (WHO Fact Sheet, 2011). It is identified according to their aerodynamic diameter as either PM10 (particles with an aerodynamic diameter smaller than 10 μg) or PM2.5 (aerodynamic diameter smaller than 2.5 μg). PM2.5 may prove to be more harmful since, if inhaled, it may reach the peripheral regions of the bronchioles, and interfere with gas exchange inside the lungs.
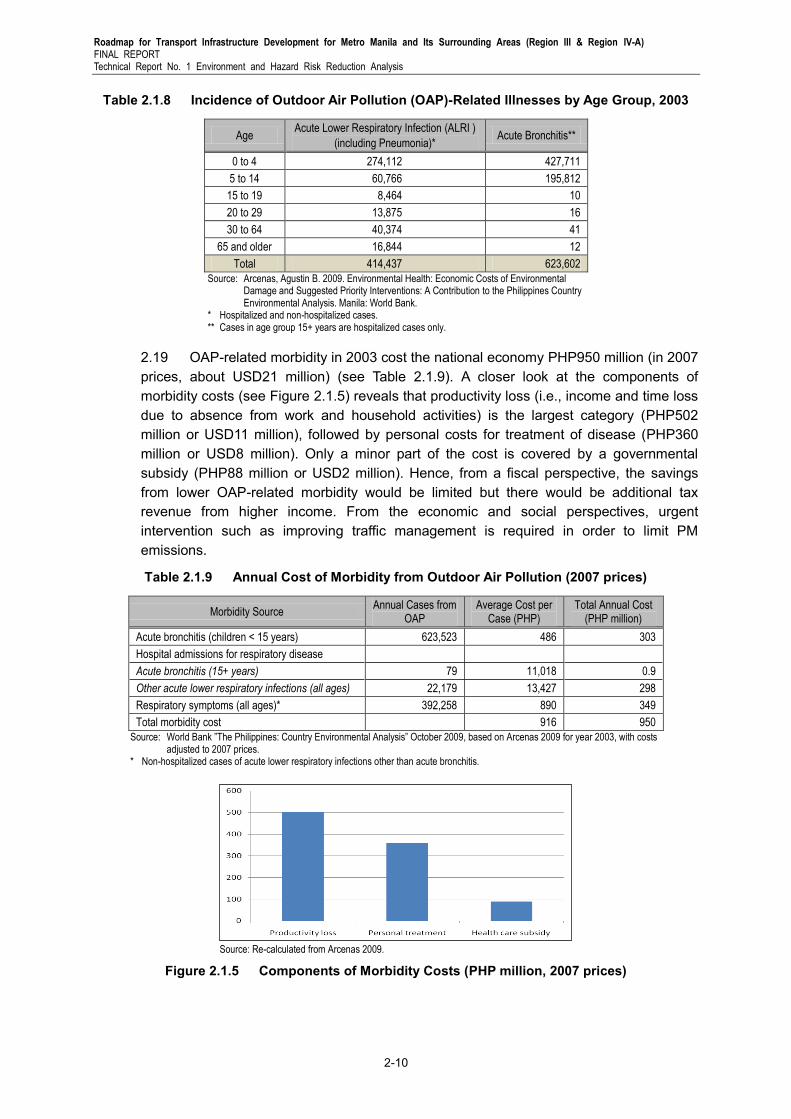
2.18 There has been a significant rise in incidence of respiratory diseases in the Philippines, yet the epidemiological analysis is limited. Table 2.1.8 presents a record of annual (2003) cases of disease by age group associated with outdoor air pollution1. This indicates that the youngest members of society bear the heaviest burden of lower respiratory infections due to outdoor air pollution. Poor air quality hits the potentially productive members of society during their formative stage and may affect the productivity of the future labor force in the Philippines. It should, however, be noted that these estimates do not include cardiovascular disease, chronic bronchitis, and other diseases that predominantly affect the adult population. The calculations show that the number of people who became ill due to exposure to PM totaled more than 1 million in 2003.
1 Due to data limitations, hospital admissions for respiratory disease only include acute lower respiratory infection
(ALRI, including pneumonia) and acute bronchitis, while respiratory symptoms only include ALRI (non-hospitalized cases). Technically, acute bronchitis is included in ALRI. The data from the Department of Health, however, list ALRI and acute bronchitis separately. Under this study, it is consistent in distinguishing between the two.
Roadmap for Transport Infrastructure Development for Metro Manila and Its Surrounding Areas (Region III & Region IV-A) FINAL REPORT Technical Report No. 1 Environment and Hazard Risk Reduction Analysis
2-10
Table 2.1.8 Incidence of Outdoor Air Pollution (OAP)-Related Illnesses by Age Group, 2003
Age Acute Lower Respiratory Infection (ALRI )
(including Pneumonia)* Acute Bronchitis**
0 to 4 274,112 427,711
5 to 14 60,766 195,812
15 to 19 8,464 10
20 to 29 13,875 16
30 to 64 40,374 41
65 and older 16,844 12
Total 414,437 623,602
Source: Arcenas, Agustin B. 2009. Environmental Health: Economic Costs of Environmental Damage and Suggested Priority Interventions: A Contribution to the Philippines Country Environmental Analysis. Manila: World Bank.
* Hospitalized and non-hospitalized cases. ** Cases in age group 15+ years are hospitalized cases only.
2.19 OAP-related morbidity in 2003 cost the national economy PHP950 million (in 2007 prices, about USD21 million) (see Table 2.1.9). A closer look at the components of morbidity costs (see Figure 2.1.5) reveals that productivity loss (i.e., income and time loss due to absence from work and household activities) is the largest category (PHP502 million or USD11 million), followed by personal costs for treatment of disease (PHP360 million or USD8 million). Only a minor part of the cost is covered by a governmental subsidy (PHP88 million or USD2 million). Hence, from a fiscal perspective, the savings from lower OAP-related morbidity would be limited but there would be additional tax revenue from higher income. From the economic and social perspectives, urgent intervention such as improving traffic management is required in order to limit PM emissions.
Table 2.1.9 Annual Cost of Morbidity from Outdoor Air Pollution (2007 prices)
Morbidity Source Annual Cases from
OAP Average Cost per
Case (PHP) Total Annual Cost
(PHP million)
Acute bronchitis (children < 15 years) 623,523 486 303
Hospital admissions for respiratory disease
Acute bronchitis (15+ years) 79 11,018 0.9
Other acute lower respiratory infections (all ages) 22,179 13,427 298
Respiratory symptoms (all ages)* 392,258 890 349
Total morbidity cost 916 950
Source: World Bank ”The Philippines: Country Environmental Analysis” October 2009, based on Arcenas 2009 for year 2003, with costs adjusted to 2007 prices.
* Non-hospitalized cases of acute lower respiratory infections other than acute bronchitis.
Source: Re-calculated from Arcenas 2009.
Figure 2.1.5 Components of Morbidity Costs (PHP million, 2007 prices)
Roadmap for Transport Infrastructure Development for Metro Manila and Its Surrounding Areas (Region III & Region IV-A) FINAL REPORT
Technical Report No. 1 Environment and Hazard Risk Reduction Analysis
2-11
2.2 Climate Change Mitigation
1) Climate Change Policies in the Philippines and its Obligations
2.20 In response to future projection of climate change, which has essentially become a global crisis, the government has enacted the Climate Change Act (Republic Act 9729) that provides the policy framework with which to systematically address the growing threats on community life and its impact on the environment. The Climate Change Commission (CCC) is the lead policy making government body. Recently, the National Framework Strategy on Climate Change and the Philippine Strategy on Climate Change Adaptation (both in 2010), and the National Climate Change Action Plan (2011–2028) were formulated as the bases of policies on climate change.
2.21 Climate change mitigation policies, compared to adaptation policies, in the Philippines are still regarded as passive. The measurable, reportable and verifiable (MRV) GHG mitigation actions and commitments are not yet actively discussed. According to the CCC, the many concerned line departments are in the stage of capacity building on how to bridge the data gaps in reporting GHG emissions comprehensively. Through Nationally Appropriate Mitigation Actions (NAMAs) the Philippines, like many developing countries, can also demonstrate and receive international recognition for their mitigation actions. The Philippines is still preparing the roadmap for the NAMAs but not yet according to the national preferences and priorities, specifically purse projects.
2.22 Meanwhile, the Conference of the Parties (COP), at its 17th Session, decided that non-Annex I Parties, consistent with their capabilities and the level of support provided for reporting, should submit their first biennial update reports (BURs) by December 2014. Therefore, the Philippines needs to prepare the BUR which should cover the following information related to NAMAs and their effects:
(i) Name and description of the mitigation action; (ii) Information on methodologies and assumptions; (iii) Objectives of the action and steps taken or envisaged to achieve that action; (iv) Information on the progress of implementation; (v) Information on international market mechanisms; and (vi) A description of domestic measurement, reporting and verification arrangements.
2.23 The proposed programs under the Roadmap will certainly contribute to the specific mitigation actions required for the BURs.
2) Growth in Energy Use
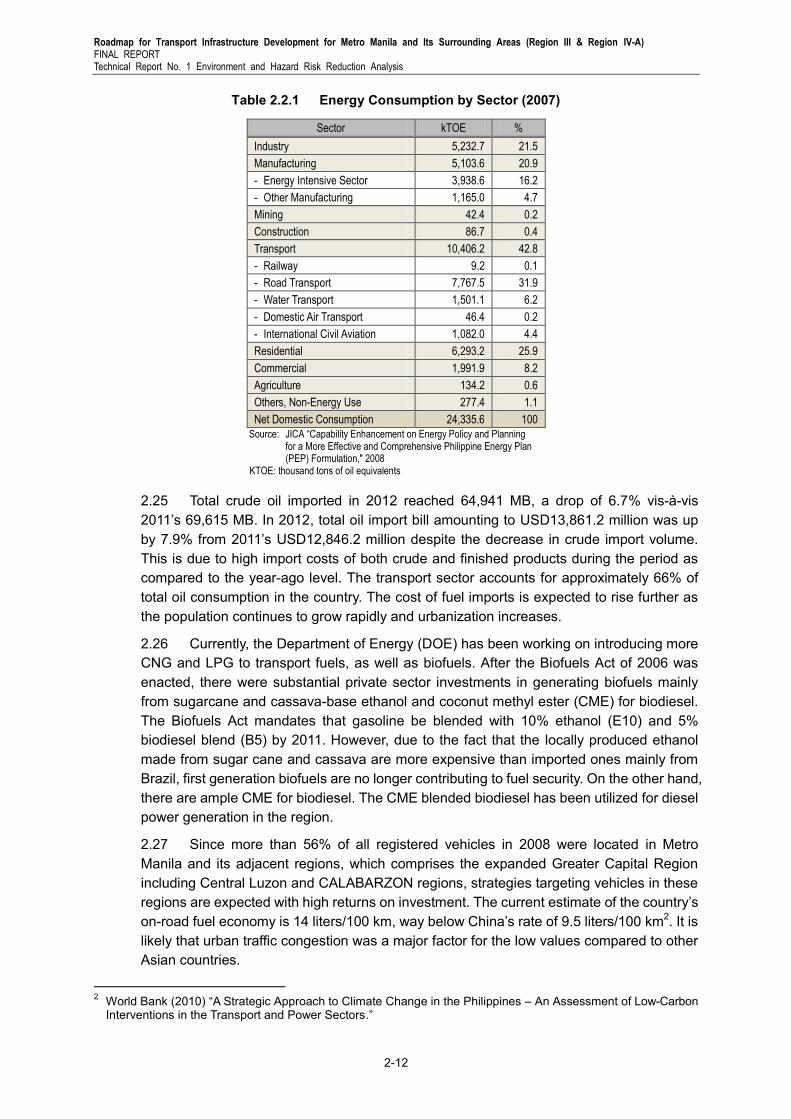
2.24 Growth in energy use and the associated GHG have accompanied economic expansion. About 56 % of the Philippines energy demand is met by indigenous resources including coal, natural gas, hydropower and traditional biomass energy. Starting in 2002, there has been increasing use of natural gas for power generation with the commercial operation of the Malampaya gas fields. Under the whole energy balance of the Philippines, as shown in Table 2.2.1, the share of the transport sector of the total energy consumption in 2007 was 42.8%, followed by residential sector at 25.9%, and manufacturing sector at 21.0%. Energy efficiency, especially in the road transport sector, implies substantial reduction of energy consumption in the country.
Roadmap for Transport Infrastructure Development for Metro Manila and Its Surrounding Areas (Region III & Region IV-A) FINAL REPORT Technical Report No. 1 Environment and Hazard Risk Reduction Analysis
2-12
Table 2.2.1 Energy Consumption by Sector (2007)
Sector kTOE %
Industry 5,232.7 21.5
Manufacturing 5,103.6 20.9
- Energy Intensive Sector 3,938.6 16.2
- Other Manufacturing 1,165.0 4.7
Mining 42.4 0.2
Construction 86.7 0.4
Transport 10,406.2 42.8
- Railway 9.2 0.1
- Road Transport 7,767.5 31.9
- Water Transport 1,501.1 6.2
- Domestic Air Transport 46.4 0.2
- International Civil Aviation 1,082.0 4.4
Residential 6,293.2 25.9
Commercial 1,991.9 8.2
Agriculture 134.2 0.6
Others, Non-Energy Use 277.4 1.1
Net Domestic Consumption 24,335.6 100
Source: JICA “Capability Enhancement on Energy Policy and Planning for a More Effective and Comprehensive Philippine Energy Plan (PEP) Formulation," 2008
KTOE: thousand tons of oil equivalents
2.25 Total crude oil imported in 2012 reached 64,941 MB, a drop of 6.7% vis-à-vis 2011’s 69,615 MB. In 2012, total oil import bill amounting to USD13,861.2 million was up by 7.9% from 2011’s USD12,846.2 million despite the decrease in crude import volume. This is due to high import costs of both crude and finished products during the period as compared to the year-ago level. The transport sector accounts for approximately 66% of total oil consumption in the country. The cost of fuel imports is expected to rise further as the population continues to grow rapidly and urbanization increases.
2.26 Currently, the Department of Energy (DOE) has been working on introducing more CNG and LPG to transport fuels, as well as biofuels. After the Biofuels Act of 2006 was enacted, there were substantial private sector investments in generating biofuels mainly from sugarcane and cassava-base ethanol and coconut methyl ester (CME) for biodiesel. The Biofuels Act mandates that gasoline be blended with 10% ethanol (E10) and 5% biodiesel blend (B5) by 2011. However, due to the fact that the locally produced ethanol made from sugar cane and cassava are more expensive than imported ones mainly from Brazil, first generation biofuels are no longer contributing to fuel security. On the other hand, there are ample CME for biodiesel. The CME blended biodiesel has been utilized for diesel power generation in the region.
2.27 Since more than 56% of all registered vehicles in 2008 were located in Metro Manila and its adjacent regions, which comprises the expanded Greater Capital Region including Central Luzon and CALABARZON regions, strategies targeting vehicles in these regions are expected with high returns on investment. The current estimate of the country’s on-road fuel economy is 14 liters/100 km, way below China’s rate of 9.5 liters/100 km2. It is likely that urban traffic congestion was a major factor for the low values compared to other Asian countries.
2 World Bank (2010) “A Strategic Approach to Climate Change in the Philippines – An Assessment of Low-Carbon
Interventions in the Transport and Power Sectors.”
Roadmap for Transport Infrastructure Development for Metro Manila and Its Surrounding Areas (Region III & Region IV-A) FINAL REPORT
Technical Report No. 1 Environment and Hazard Risk Reduction Analysis
2-13
3) GHG Emissions
(1) National GHG Inventory
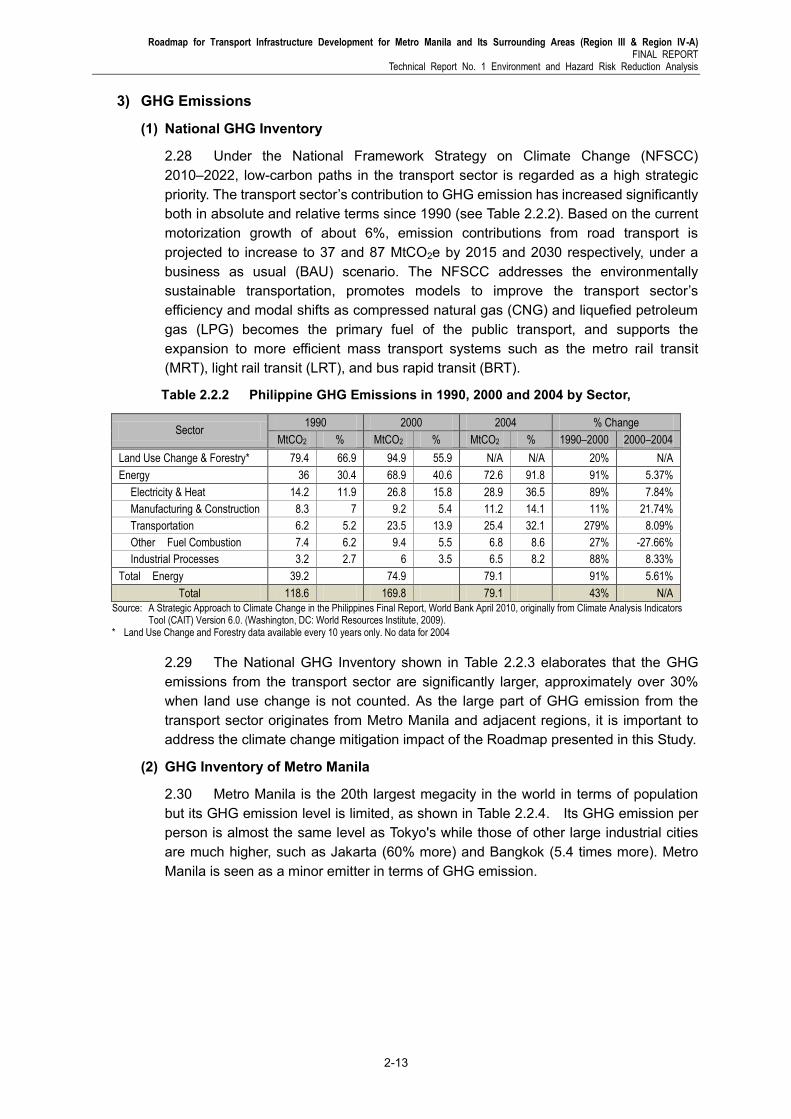
2.28 Under the National Framework Strategy on Climate Change (NFSCC) 2010–2022, low-carbon paths in the transport sector is regarded as a high strategic priority. The transport sector’s contribution to GHG emission has increased significantly both in absolute and relative terms since 1990 (see Table 2.2.2). Based on the current motorization growth of about 6%, emission contributions from road transport is projected to increase to 37 and 87 MtCO2e by 2015 and 2030 respectively, under a business as usual (BAU) scenario. The NFSCC addresses the environmentally sustainable transportation, promotes models to improve the transport sector’s efficiency and modal shifts as compressed natural gas (CNG) and liquefied petroleum gas (LPG) becomes the primary fuel of the public transport, and supports the expansion to more efficient mass transport systems such as the metro rail transit (MRT), light rail transit (LRT), and bus rapid transit (BRT).
Table 2.2.2 Philippine GHG Emissions in 1990, 2000 and 2004 by Sector,
Sector 1990 2000 2004 % Change
MtCO2 % MtCO2 % MtCO2 % 1990–2000 2000–2004
Land Use Change & Forestry* 79.4 66.9 94.9 55.9 N/A N/A 20% N/A
Energy 36 30.4 68.9 40.6 72.6 91.8 91% 5.37%
Electricity & Heat 14.2 11.9 26.8 15.8 28.9 36.5 89% 7.84%
Manufacturing & Construction 8.3 7 9.2 5.4 11.2 14.1 11% 21.74%
Transportation 6.2 5.2 23.5 13.9 25.4 32.1 279% 8.09%
Other Fuel Combustion 7.4 6.2 9.4 5.5 6.8 8.6 27% -27.66%
Industrial Processes 3.2 2.7 6 3.5 6.5 8.2 88% 8.33%
Total Energy 39.2 74.9 79.1 91% 5.61%
Total 118.6 169.8 79.1 43% N/A
Source: A Strategic Approach to Climate Change in the Philippines Final Report, World Bank April 2010, originally from Climate Analysis Indicators Tool (CAIT) Version 6.0. (Washington, DC: World Resources Institute, 2009).
* Land Use Change and Forestry data available every 10 years only. No data for 2004
2.29 The National GHG Inventory shown in Table 2.2.3 elaborates that the GHG emissions from the transport sector are significantly larger, approximately over 30% when land use change is not counted. As the large part of GHG emission from the transport sector originates from Metro Manila and adjacent regions, it is important to address the climate change mitigation impact of the Roadmap presented in this Study.
(2) GHG Inventory of Metro Manila
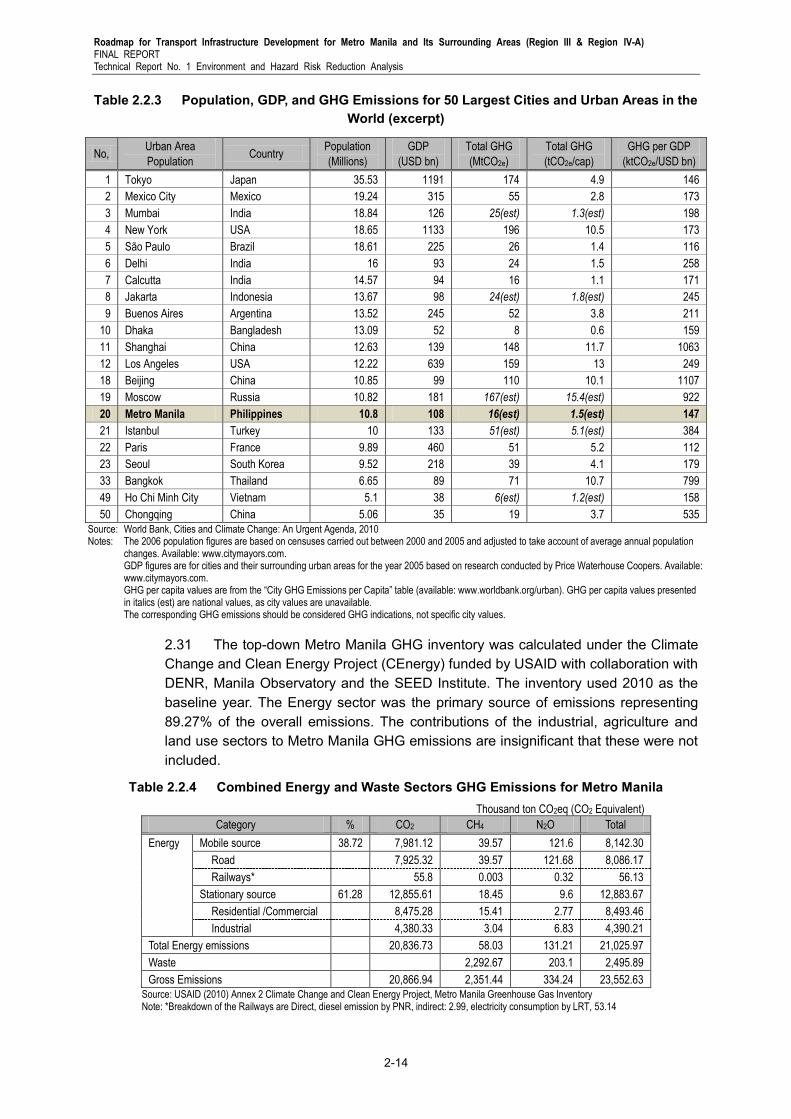
2.30 Metro Manila is the 20th largest megacity in the world in terms of population but its GHG emission level is limited, as shown in Table 2.2.4. Its GHG emission per person is almost the same level as Tokyo's while those of other large industrial cities are much higher, such as Jakarta (60% more) and Bangkok (5.4 times more). Metro Manila is seen as a minor emitter in terms of GHG emission.
Roadmap for Transport Infrastructure Development for Metro Manila and Its Surrounding Areas (Region III & Region IV-A) FINAL REPORT Technical Report No. 1 Environment and Hazard Risk Reduction Analysis
2-14
Table 2.2.3 Population, GDP, and GHG Emissions for 50 Largest Cities and Urban Areas in the World (excerpt)
No, Urban Area
Population Country
Population
(Millions)
GDP
(USD bn)
Total GHG
(MtCO2e)
Total GHG
(tCO2e/cap)
GHG per GDP
(ktCO2e/USD bn)
1 Tokyo Japan 35.53 1191 174 4.9 146
2 Mexico City Mexico 19.24 315 55 2.8 173
3 Mumbai India 18.84 126 25(est) 1.3(est) 198
4 New York USA 18.65 1133 196 10.5 173
5 São Paulo Brazil 18.61 225 26 1.4 116
6 Delhi India 16 93 24 1.5 258
7 Calcutta India 14.57 94 16 1.1 171
8 Jakarta Indonesia 13.67 98 24(est) 1.8(est) 245
9 Buenos Aires Argentina 13.52 245 52 3.8 211
10 Dhaka Bangladesh 13.09 52 8 0.6 159
11 Shanghai China 12.63 139 148 11.7 1063
12 Los Angeles USA 12.22 639 159 13 249
18 Beijing China 10.85 99 110 10.1 1107
19 Moscow Russia 10.82 181 167(est) 15.4(est) 922
20 Metro Manila Philippines 10.8 108 16(est) 1.5(est) 147
21 Istanbul Turkey 10 133 51(est) 5.1(est) 384
22 Paris France 9.89 460 51 5.2 112
23 Seoul South Korea 9.52 218 39 4.1 179
33 Bangkok Thailand 6.65 89 71 10.7 799
49 Ho Chi Minh City Vietnam 5.1 38 6(est) 1.2(est) 158
50 Chongqing China 5.06 35 19 3.7 535
Source: World Bank, Cities and Climate Change: An Urgent Agenda, 2010 Notes: The 2006 population figures are based on censuses carried out between 2000 and 2005 and adjusted to take account of average annual population
changes. Available: www.citymayors.com. GDP figures are for cities and their surrounding urban areas for the year 2005 based on research conducted by Price Waterhouse Coopers. Available: www.citymayors.com. GHG per capita values are from the “City GHG Emissions per Capita” table (available: www.worldbank.org/urban). GHG per capita values presented in italics (est) are national values, as city values are unavailable. The corresponding GHG emissions should be considered GHG indications, not specific city values.
2.31 The top-down Metro Manila GHG inventory was calculated under the Climate Change and Clean Energy Project (CEnergy) funded by USAID with collaboration with DENR, Manila Observatory and the SEED Institute. The inventory used 2010 as the baseline year. The Energy sector was the primary source of emissions representing 89.27% of the overall emissions. The contributions of the industrial, agriculture and land use sectors to Metro Manila GHG emissions are insignificant that these were not included.
Table 2.2.4 Combined Energy and Waste Sectors GHG Emissions for Metro Manila Thousand ton CO2eq (CO2 Equivalent)
Category % CO2 CH4 N2O Total
Energy Mobile source 38.72 7,981.12 39.57 121.6 8,142.30
Road 7,925.32 39.57 121.68 8,086.17
Railways* 55.8 0.003 0.32 56.13
Stationary source 61.28 12,855.61 18.45 9.6 12,883.67
Residential /Commercial 8,475.28 15.41 2.77 8,493.46
Industrial 4,380.33 3.04 6.83 4,390.21
Total Energy emissions 20,836.73 58.03 131.21 21,025.97
Waste 2,292.67 203.1 2,495.89
Gross Emissions 20,866.94 2,351.44 334.24 23,552.63
Source: USAID (2010) Annex 2 Climate Change and Clean Energy Project, Metro Manila Greenhouse Gas Inventory Note: *Breakdown of the Railways are Direct, diesel emission by PNR, indirect: 2.99, electricity consumption by LRT, 53.14
Roadmap for Transport Infrastructure Development for Metro Manila and Its Surrounding Areas (Region III & Region IV-A) FINAL REPORT
Technical Report No. 1 Environment and Hazard Risk Reduction Analysis
2-15
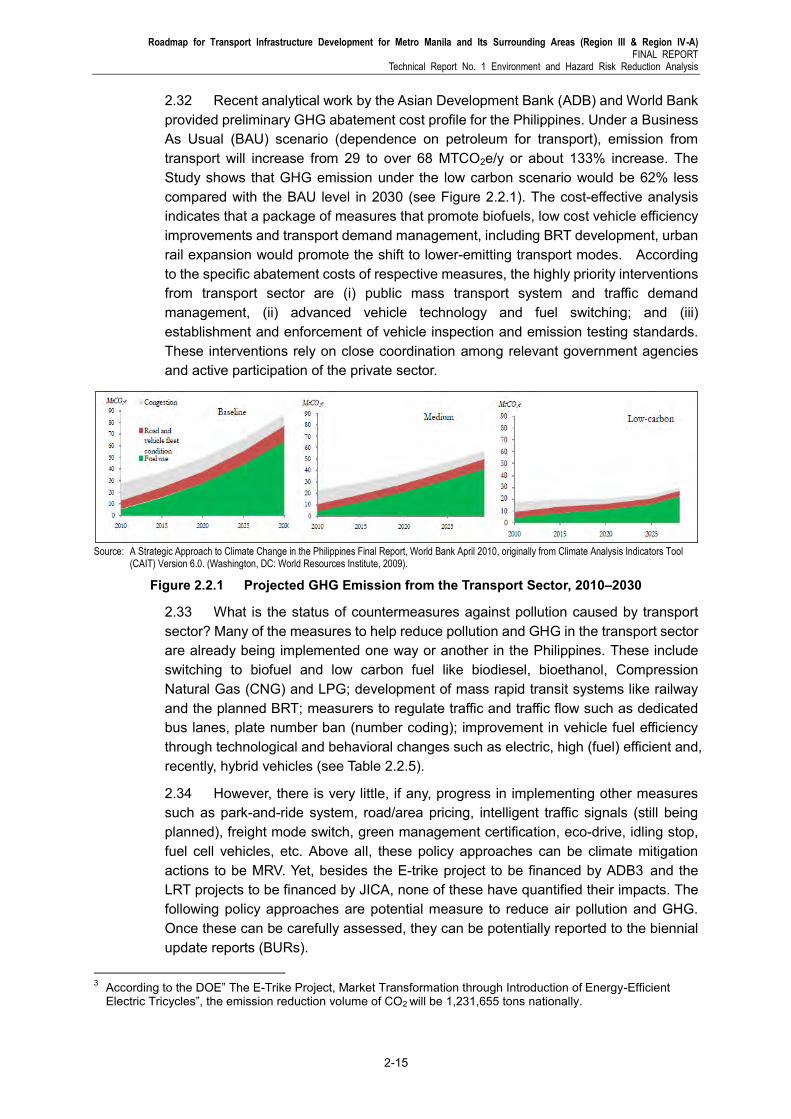
2.32 Recent analytical work by the Asian Development Bank (ADB) and World Bank provided preliminary GHG abatement cost profile for the Philippines. Under a Business As Usual (BAU) scenario (dependence on petroleum for transport), emission from transport will increase from 29 to over 68 MTCO2e/y or about 133% increase. The Study shows that GHG emission under the low carbon scenario would be 62% less compared with the BAU level in 2030 (see Figure 2.2.1). The cost-effective analysis indicates that a package of measures that promote biofuels, low cost vehicle efficiency improvements and transport demand management, including BRT development, urban rail expansion would promote the shift to lower-emitting transport modes. According to the specific abatement costs of respective measures, the highly priority interventions from transport sector are (i) public mass transport system and traffic demand management, (ii) advanced vehicle technology and fuel switching; and (iii) establishment and enforcement of vehicle inspection and emission testing standards. These interventions rely on close coordination among relevant government agencies and active participation of the private sector.
Source: A Strategic Approach to Climate Change in the Philippines Final Report, World Bank April 2010, originally from Climate Analysis Indicators Tool
(CAIT) Version 6.0. (Washington, DC: World Resources Institute, 2009).
Figure 2.2.1 Projected GHG Emission from the Transport Sector, 2010–2030
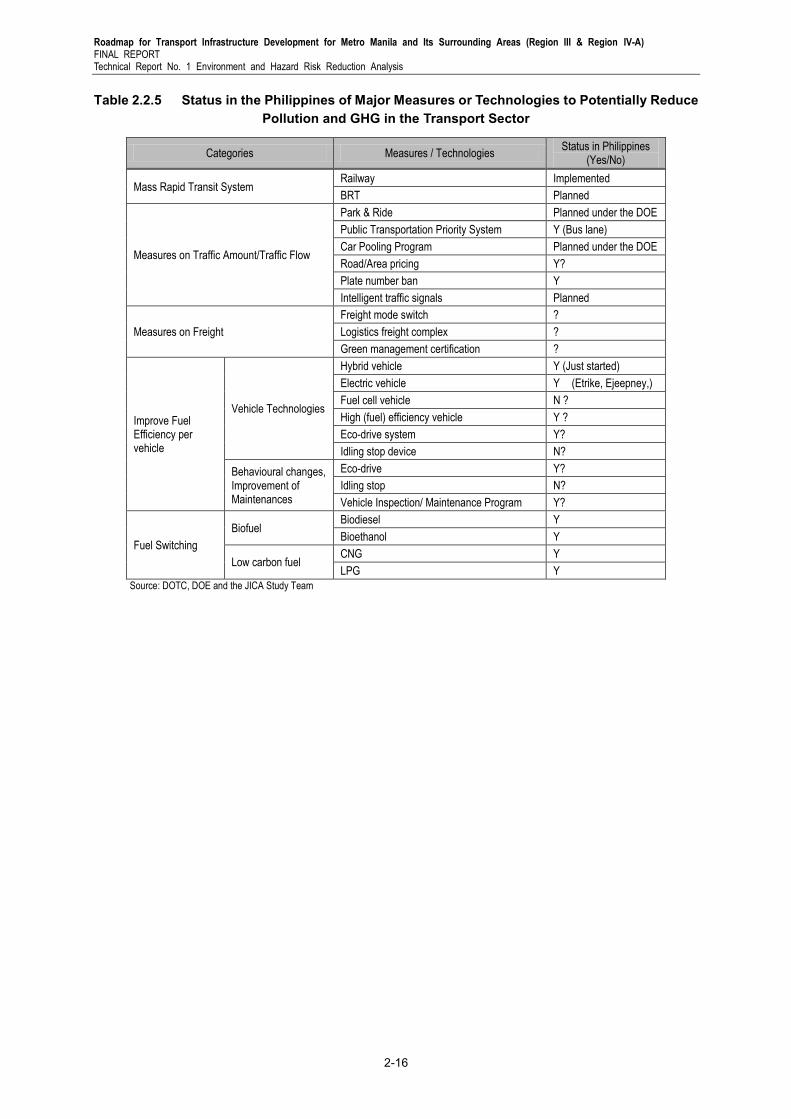
2.33 What is the status of countermeasures against pollution caused by transport sector? Many of the measures to help reduce pollution and GHG in the transport sector are already being implemented one way or another in the Philippines. These include switching to biofuel and low carbon fuel like biodiesel, bioethanol, Compression Natural Gas (CNG) and LPG; development of mass rapid transit systems like railway and the planned BRT; measurers to regulate traffic and traffic flow such as dedicated bus lanes, plate number ban (number coding); improvement in vehicle fuel efficiency through technological and behavioral changes such as electric, high (fuel) efficient and, recently, hybrid vehicles (see Table 2.2.5).
2.34 However, there is very little, if any, progress in implementing other measures such as park-and-ride system, road/area pricing, intelligent traffic signals (still being planned), freight mode switch, green management certification, eco-drive, idling stop, fuel cell vehicles, etc. Above all, these policy approaches can be climate mitigation actions to be MRV. Yet, besides the E-trike project to be financed by ADB3 and the LRT projects to be financed by JICA, none of these have quantified their impacts. The following policy approaches are potential measure to reduce air pollution and GHG. Once these can be carefully assessed, they can be potentially reported to the biennial update reports (BURs).
3 According to the DOE” The E-Trike Project, Market Transformation through Introduction of Energy-Efficient
Electric Tricycles”, the emission reduction volume of CO2 will be 1,231,655 tons nationally.
Roadmap for Transport Infrastructure Development for Metro Manila and Its Surrounding Areas (Region III & Region IV-A) FINAL REPORT Technical Report No. 1 Environment and Hazard Risk Reduction Analysis
2-16
Table 2.2.5 Status in the Philippines of Major Measures or Technologies to Potentially Reduce Pollution and GHG in the Transport Sector
Categories Measures / Technologies Status in Philippines
(Yes/No)
Mass Rapid Transit System Railway Implemented
BRT Planned
Measures on Traffic Amount/Traffic Flow
Park & Ride Planned under the DOE
Public Transportation Priority System Y (Bus lane)
Car Pooling Program Planned under the DOE
Road/Area pricing Y?
Plate number ban Y
Intelligent traffic signals Planned
Measures on Freight
Freight mode switch ?
Logistics freight complex ?
Green management certification ?
Improve Fuel Efficiency per vehicle
Vehicle Technologies
Hybrid vehicle Y (Just started)
Electric vehicle Y (Etrike, Ejeepney,)
Fuel cell vehicle N ?
High (fuel) efficiency vehicle Y ?
Eco-drive system Y?
Idling stop device N?
Behavioural changes, Improvement of Maintenances
Eco-drive Y?
Idling stop N?
Vehicle Inspection/ Maintenance Program Y?
Fuel Switching
Biofuel Biodiesel Y
Bioethanol Y
Low carbon fuel CNG Y
LPG Y
Source: DOTC, DOE and the JICA Study Team
Roadmap for Transport Infrastructure Development for Metro Manila and Its Surrounding Areas (Region III & Region IV-A) FINAL REPORT
Technical Report No. 1 Environment and Hazard Risk Reduction Analysis
2-17
2.3 Contribution to Emission Reduction of GHG and Air Pollutants under the Roadmap
1) Methodology
2.35 The impacts of the overall transport roadmap programs on air quality improvement and climate change mitigation are estimated through the following methodology. There are two approaches for estimating vehicle emission, namely top-down and bottom-up approaches. The top-down approach is a method based on fuel consumption in a target city or region, while the bottom-up approach is a method based on cumulating all the vehicle emission in a target city or region.
2.36 When a program targets specific vehicles such as a fuel switch project, fuel consumption by the vehicle can be identified. Fuel consumption data will be collected as a reliable data. In this case, the top-down approach should be applied.
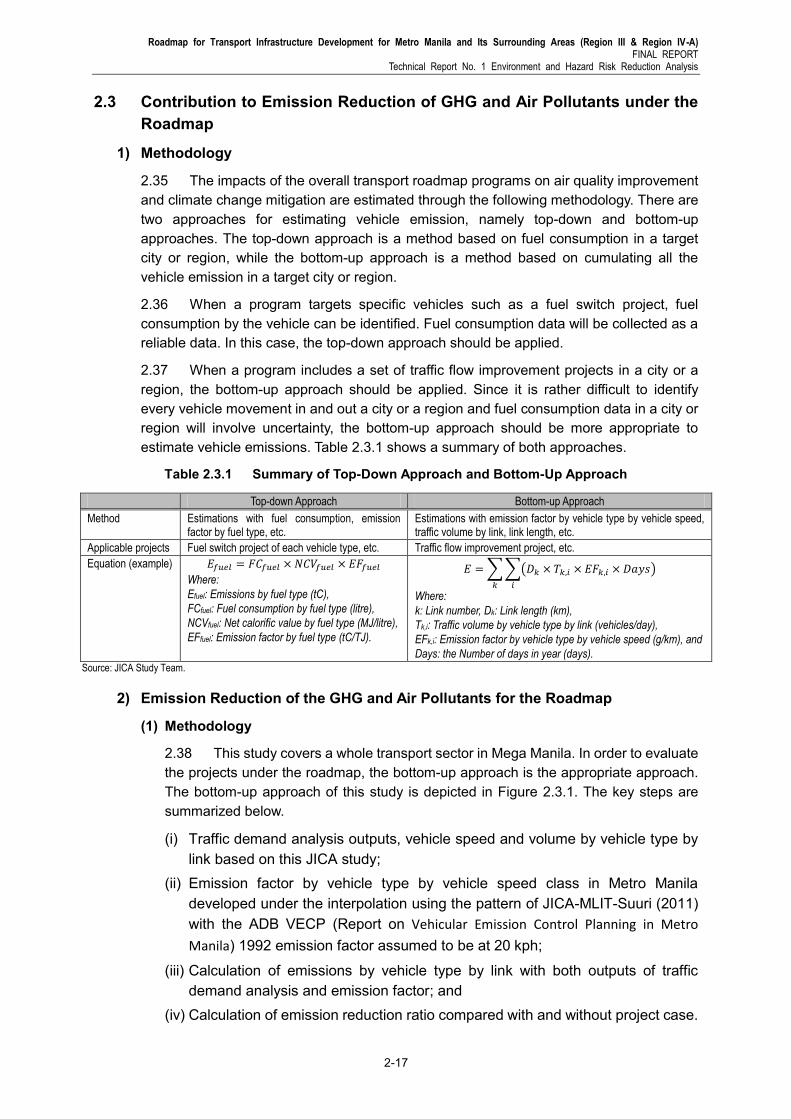
2.37 When a program includes a set of traffic flow improvement projects in a city or a region, the bottom-up approach should be applied. Since it is rather difficult to identify every vehicle movement in and out a city or a region and fuel consumption data in a city or region will involve uncertainty, the bottom-up approach should be more appropriate to estimate vehicle emissions. Table 2.3.1 shows a summary of both approaches.
Table 2.3.1 Summary of Top-Down Approach and Bottom-Up Approach
Top-down Approach Bottom-up Approach
Method Estimations with fuel consumption, emission factor by fuel type, etc.
Estimations with emission factor by vehicle type by vehicle speed, traffic volume by link, link length, etc.
Applicable projects Fuel switch project of each vehicle type, etc. Traffic flow improvement project, etc.
Equation (example)
Where:
Efuel: Emissions by fuel type (tC),
FCfuel: Fuel consumption by fuel type (litre),
NCVfuel: Net calorific value by fuel type (MJ/litre),
EFfuel: Emission factor by fuel type (tC/TJ).
∑∑( )
Where:
k: Link number, Dk: Link length (km),
Tk,i: Traffic volume by vehicle type by link (vehicles/day),
EFk,i: Emission factor by vehicle type by vehicle speed (g/km), and
Days: the Number of days in year (days). Source: JICA Study Team.
2) Emission Reduction of the GHG and Air Pollutants for the Roadmap
(1) Methodology
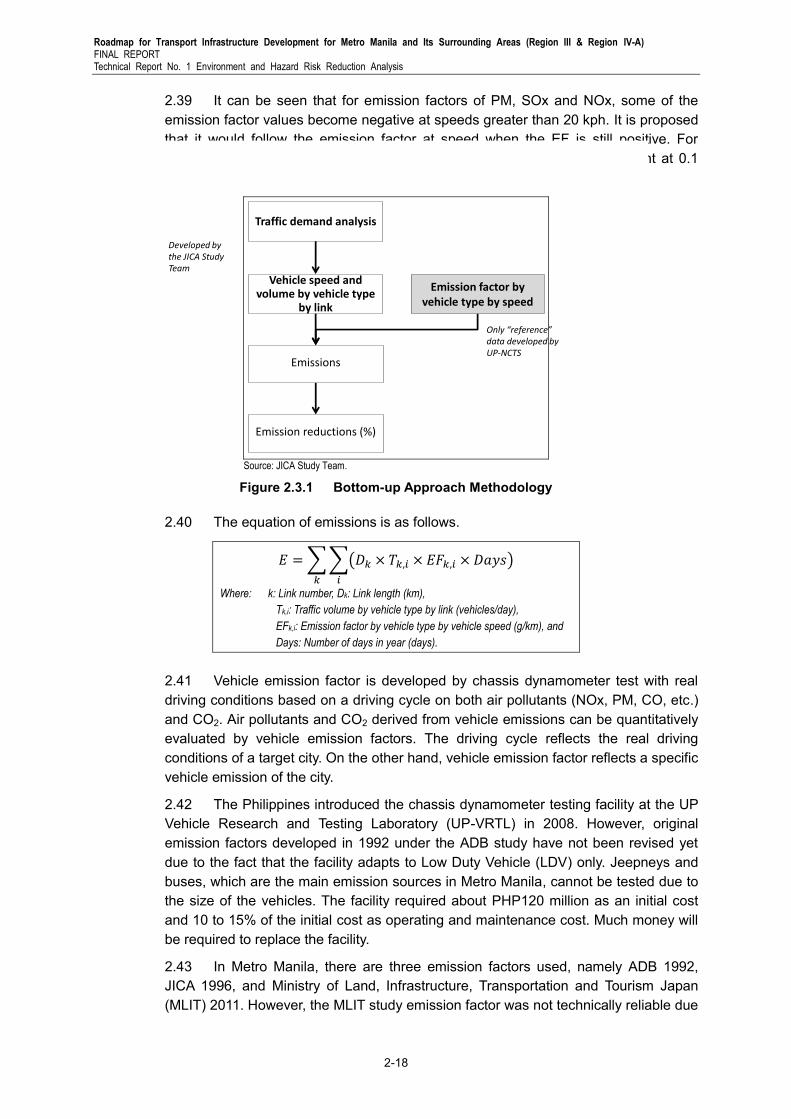
2.38 This study covers a whole transport sector in Mega Manila. In order to evaluate the projects under the roadmap, the bottom-up approach is the appropriate approach. The bottom-up approach of this study is depicted in Figure 2.3.1. The key steps are summarized below.
(i) Traffic demand analysis outputs, vehicle speed and volume by vehicle type by link based on this JICA study;
(ii) Emission factor by vehicle type by vehicle speed class in Metro Manila developed under the interpolation using the pattern of JICA-MLIT-Suuri (2011) with the ADB VECP (Report on Vehicular Emission Control Planning in Metro
Manila) 1992 emission factor assumed to be at 20 kph;
(iii) Calculation of emissions by vehicle type by link with both outputs of traffic demand analysis and emission factor; and
(iv) Calculation of emission reduction ratio compared with and without project case.
Roadmap for Transport Infrastructure Development for Metro Manila and Its Surrounding Areas (Region III & Region IV-A) FINAL REPORT Technical Report No. 1 Environment and Hazard Risk Reduction Analysis
2-18
2.39 It can be seen that for emission factors of PM, SOx and NOx, some of the emission factor values become negative at speeds greater than 20 kph. It is proposed that it would follow the emission factor at speed when the EF is still positive. For example, the PM emission factors of gas car and gas UV becomes constant at 0.1 g/km and 0.12 g/km, respectively, at speeds greater than 20 kph.
Emission reductions (%)
Traffic demand analysis
Vehicle speed and volume by vehicle type
by link
Emission factor by vehicle type by speed
Emissions
Developed by the JICA Study Team
Only “reference” data developed by UP-NCTS
Source: JICA Study Team.
Figure 2.3.1 Bottom-up Approach Methodology
2.40 The equation of emissions is as follows.
∑∑( )
Where: k: Link number, Dk: Link length (km),
Tk,i: Traffic volume by vehicle type by link (vehicles/day),
EFk,i: Emission factor by vehicle type by vehicle speed (g/km), and
Days: Number of days in year (days).
2.41 Vehicle emission factor is developed by chassis dynamometer test with real driving conditions based on a driving cycle on both air pollutants (NOx, PM, CO, etc.) and CO2. Air pollutants and CO2 derived from vehicle emissions can be quantitatively evaluated by vehicle emission factors. The driving cycle reflects the real driving conditions of a target city. On the other hand, vehicle emission factor reflects a specific vehicle emission of the city.
2.42 The Philippines introduced the chassis dynamometer testing facility at the UP Vehicle Research and Testing Laboratory (UP-VRTL) in 2008. However, original emission factors developed in 1992 under the ADB study have not been revised yet due to the fact that the facility adapts to Low Duty Vehicle (LDV) only. Jeepneys and buses, which are the main emission sources in Metro Manila, cannot be tested due to the size of the vehicles. The facility required about PHP120 million as an initial cost and 10 to 15% of the initial cost as operating and maintenance cost. Much money will be required to replace the facility.
2.43 In Metro Manila, there are three emission factors used, namely ADB 1992, JICA 1996, and Ministry of Land, Infrastructure, Transportation and Tourism Japan (MLIT) 2011. However, the MLIT study emission factor was not technically reliable due

Roadmap for Transport Infrastructure Development for Metro Manila and Its Surrounding Areas (Region III & Region IV-A) FINAL REPORT
Technical Report No. 1 Environment and Hazard Risk Reduction Analysis
2-19
to very limited number of vehicles tested. The estimate for the Philippine emission factors is based on the interpolation using the pattern of JICA-MLIT-Suuri (2011) with the ADB VECP 1992 emission factor assumed to be at 20 kph.
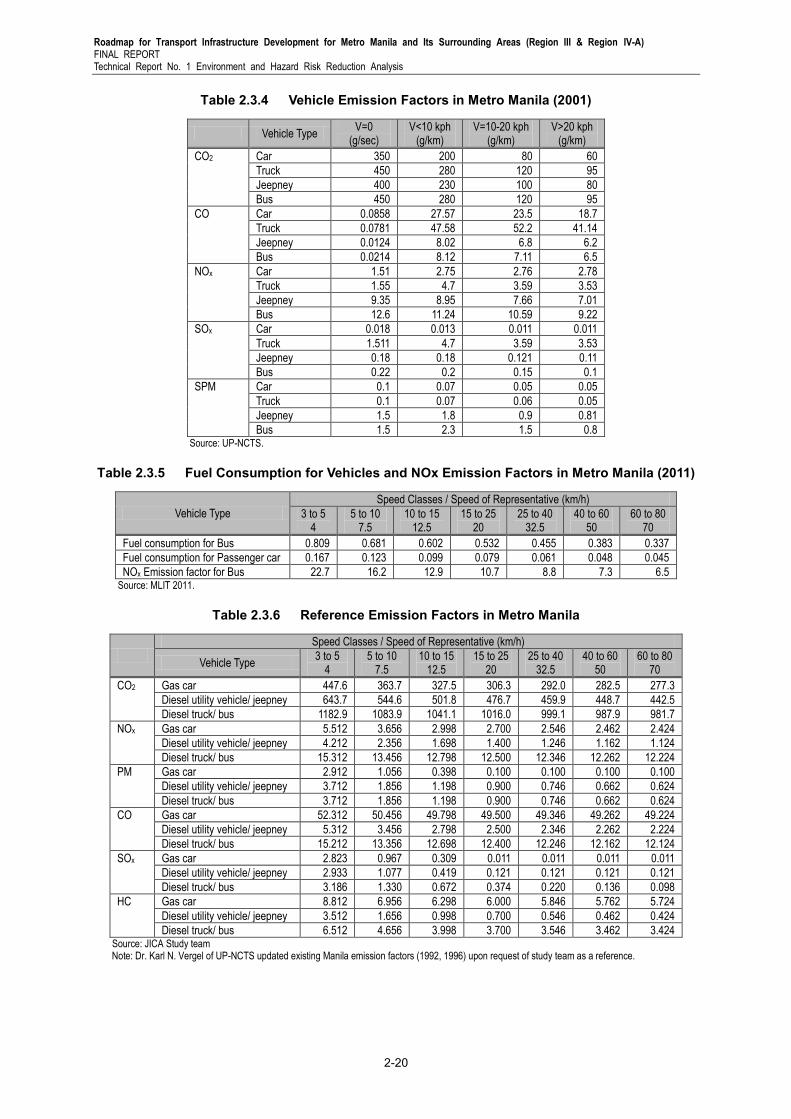
2.44 As shown in Table 2.3.2, emission reduction is determined by traffic volume and emission factor. Under the roadmap study, the ratio of reduction of emission was preliminary calculated for 2016 and 2030 using the same emission factors. The emission factors 1992 utilized for Metro Manila were not differentiated by speed as shown in the Table 2.3.3 and in the same manner, the emission factors 2001 (see Table 2.3.4) could differentiate only three classes of speed. Fuel consumption for vehicles and NOx emission factor were developed for two types of cars by the study supported by MLIT, but the scope is limited (see Table 2.3.5). The Study team, therefore, decided to utilize the “Reference Emission Factors” developed by the UP-NCTS shown in Table 2.3.6. This set of emission factors has sufficient speed classes, which can more accurately calculate the impact of traffic volume reduction. However, these emission factors also have limitations as they were not based on a reliable chassis dynamometer test. These are, therefore, recognized only as a reference. Technical explanations on emission factors are elaborated in Box 2.2.1.
Table 2.3.2 Vehicle Emission Factors in Metro Manila
Project Donor Year Explanation
VECP Project ADB 1992 Emission factors were developed for 6 vehicle types and 6 air pollutant gases. Vehicle speed and vehicle age were not considered and fuel consumption was not included. The first emission factor in Metro Manila was developed with a chassis dynamometer which was set up at the Motor Vehicle Testing Office at the forest park of Quezon City.
MMUTIS JICA 1999 JICA revised ADB emission factors in the MMUTIS study. The factors were by vehicle type, by fuel type, and by running speed excluding vehicle age. Running speed was classified in 3 classes: less than 10kph, 10 to 20kph, and greater than 20kph.
SUURI MLIT Japan
2011 One PC (model year: 2004) and one bus (model year: 2009) are monitored by on-board measurement system. Running speed is classified in 7 speed classes. Target is limited to NOx which is bus only, fuel consumption of both vehicle types. Though test vehicles were very limited, new vehicles were tested in Metro Manila.
Source: JICA Study Team.
Table 2.3.3 Vehicle Emission Factors in Metro Manila (1992)
Vehicle Type g/km
CO HC NOx SOx Pb PM
Gasoline
Cars 49.5 6.00 2.7 0.011 0.073 0.10
UV 60.0 8.00 3.0 0.014 0.092 0.12
MC 26.0 18.60 0.2 0.004 0.028 2.00
Diesel
Taxi 1.9 0.65 2.0 0.081 0.000 0.60
Jeepney 2.5 0.70 1.4 0.121 0.000 0.90
UV 2.5 0.70 1.4 0.115 0.000 0.90
Bus/Truck 12.4 3.70 12.5 0.374 0.000 1.50 Source: VECP 1992. HC: hydrocarbon.
Roadmap for Transport Infrastructure Development for Metro Manila and Its Surrounding Areas (Region III & Region IV-A) FINAL REPORT Technical Report No. 1 Environment and Hazard Risk Reduction Analysis
2-20
Table 2.3.4 Vehicle Emission Factors in Metro Manila (2001)
Vehicle Type V=0
(g/sec) V<10 kph
(g/km) V=10-20 kph
(g/km) V>20 kph
(g/km)
CO2 Car 350 200 80 60
Truck 450 280 120 95
Jeepney 400 230 100 80
Bus 450 280 120 95
CO Car 0.0858 27.57 23.5 18.7
Truck 0.0781 47.58 52.2 41.14
Jeepney 0.0124 8.02 6.8 6.2
Bus 0.0214 8.12 7.11 6.5
NOx Car 1.51 2.75 2.76 2.78
Truck 1.55 4.7 3.59 3.53
Jeepney 9.35 8.95 7.66 7.01
Bus 12.6 11.24 10.59 9.22
SOx Car 0.018 0.013 0.011 0.011
Truck 1.511 4.7 3.59 3.53
Jeepney 0.18 0.18 0.121 0.11
Bus 0.22 0.2 0.15 0.1
SPM Car 0.1 0.07 0.05 0.05
Truck 0.1 0.07 0.06 0.05
Jeepney 1.5 1.8 0.9 0.81
Bus 1.5 2.3 1.5 0.8 Source: UP-NCTS.
Table 2.3.5 Fuel Consumption for Vehicles and NOx Emission Factors in Metro Manila (2011)
Vehicle Type
Speed Classes / Speed of Representative (km/h)
3 to 5 4
5 to 10 7.5
10 to 15 12.5
15 to 25 20
25 to 40 32.5
40 to 60 50
60 to 80 70
Fuel consumption for Bus 0.809 0.681 0.602 0.532 0.455 0.383 0.337
Fuel consumption for Passenger car 0.167 0.123 0.099 0.079 0.061 0.048 0.045
NOx Emission factor for Bus 22.7 16.2 12.9 10.7 8.8 7.3 6.5 Source: MLIT 2011.
Table 2.3.6 Reference Emission Factors in Metro Manila
Speed Classes / Speed of Representative (km/h)
Vehicle Type 3 to 5
4 5 to 10
7.5 10 to 15
12.5 15 to 25
20 25 to 40
32.5 40 to 60
50 60 to 80
70
CO2 Gas car 447.6 363.7 327.5 306.3 292.0 282.5 277.3
Diesel utility vehicle/ jeepney 643.7 544.6 501.8 476.7 459.9 448.7 442.5
Diesel truck/ bus 1182.9 1083.9 1041.1 1016.0 999.1 987.9 981.7
NOx Gas car 5.512 3.656 2.998 2.700 2.546 2.462 2.424
Diesel utility vehicle/ jeepney 4.212 2.356 1.698 1.400 1.246 1.162 1.124
Diesel truck/ bus 15.312 13.456 12.798 12.500 12.346 12.262 12.224
PM Gas car 2.912 1.056 0.398 0.100 0.100 0.100 0.100
Diesel utility vehicle/ jeepney 3.712 1.856 1.198 0.900 0.746 0.662 0.624
Diesel truck/ bus 3.712 1.856 1.198 0.900 0.746 0.662 0.624
CO Gas car 52.312 50.456 49.798 49.500 49.346 49.262 49.224
Diesel utility vehicle/ jeepney 5.312 3.456 2.798 2.500 2.346 2.262 2.224
Diesel truck/ bus 15.212 13.356 12.698 12.400 12.246 12.162 12.124
SOx Gas car 2.823 0.967 0.309 0.011 0.011 0.011 0.011
Diesel utility vehicle/ jeepney 2.933 1.077 0.419 0.121 0.121 0.121 0.121
Diesel truck/ bus 3.186 1.330 0.672 0.374 0.220 0.136 0.098
HC Gas car 8.812 6.956 6.298 6.000 5.846 5.762 5.724
Diesel utility vehicle/ jeepney 3.512 1.656 0.998 0.700 0.546 0.462 0.424
Diesel truck/ bus 6.512 4.656 3.998 3.700 3.546 3.462 3.424 Source: JICA Study team Note: Dr. Karl N. Vergel of UP-NCTS updated existing Manila emission factors (1992, 1996) upon request of study team as a reference.
Roadmap for Transport Infrastructure Development for Metro Manila and Its Surrounding Areas (Region III & Region IV-A) FINAL REPORT
Technical Report No. 1 Environment and Hazard Risk Reduction Analysis
2-21
(2) Outcomes of the Calculation
2.45 Vehicle emissions are estimated by both traffic assignment results and revised vehicle emission factors. The results for 2016 and 2030 are summarized in Figure 2.3.2 and Table 2.3.7.
2.46 The amount of emission reductions depends on vehicle emission factors. According to the traffic demand assignment, vehicle speed will increase due to less congestion expected after implementing a set of proposed projects. Since a slope of the emission factor in a low-speed area is steep, the emission reduction ratio will become relatively large. Meanwhile, a modal shift from road transport to rail transport will eventually be realized due to the development of new rail network. The number of both jeepneys and buses will decrease drastically under the “with project” case or the dream plan in 2030 as described in Appendix 4.
2.47 As shown in Figure 2.3.2 in the 2016 case, SOx and PM already show about -30% of emission reduction in comparison to the without-project scenario. Likewise, CO2, NOx, and HC show about -8%. CO is the smallest reduction ratio. In the 2030 case, similar to 2016, SOx and PM show the largest reduction ratio which is about -80% of emission reduction in comparison to the without-project scenario; CO2, NOx, and HC show about -30%, while CO is the smallest reduction ratio.
2.48 The status of air quality of Metro Manila given in Table 2.1.1 shows both PM pollution (Rank E) and NOx pollution (Rank D) are more serious than other neighboring cities. Specific countermeasures should be implemented in order to reduce these air pollutants. Future emissions of these pollutants in Metro Manila and the adjacent provinces of Bulacan, Rizal, Laguna and Cavite (BRLC) based on the traffic demand assignment of this study are summarized in Table 2.3.7. The base year is 2012 and the target year for the long term program is 2030. With regard to “without project” case of 2030, PM emissions will increase 30% and both GHG and NOx will increase approximately 20% compared to the emission of the base year in Metro Manila. In BRLC, PM emissions will increase 88% and both GHG and NOx will increase by about 40% for the same period.
2.49 On the other hand, under the “with project” case or the dream plan, PM emissions will decrease 66% and both GHG and NOx will decrease approximately 20% compared to 2012 in Metro Manila. Similarly, PM emissions will decrease 48% and GHG and NOx will decrease by about 2% in BRLC for the same period. The proposed investment program will significantly improve the status of air pollution in the study area as well as contributed to decreasing GHG emission.
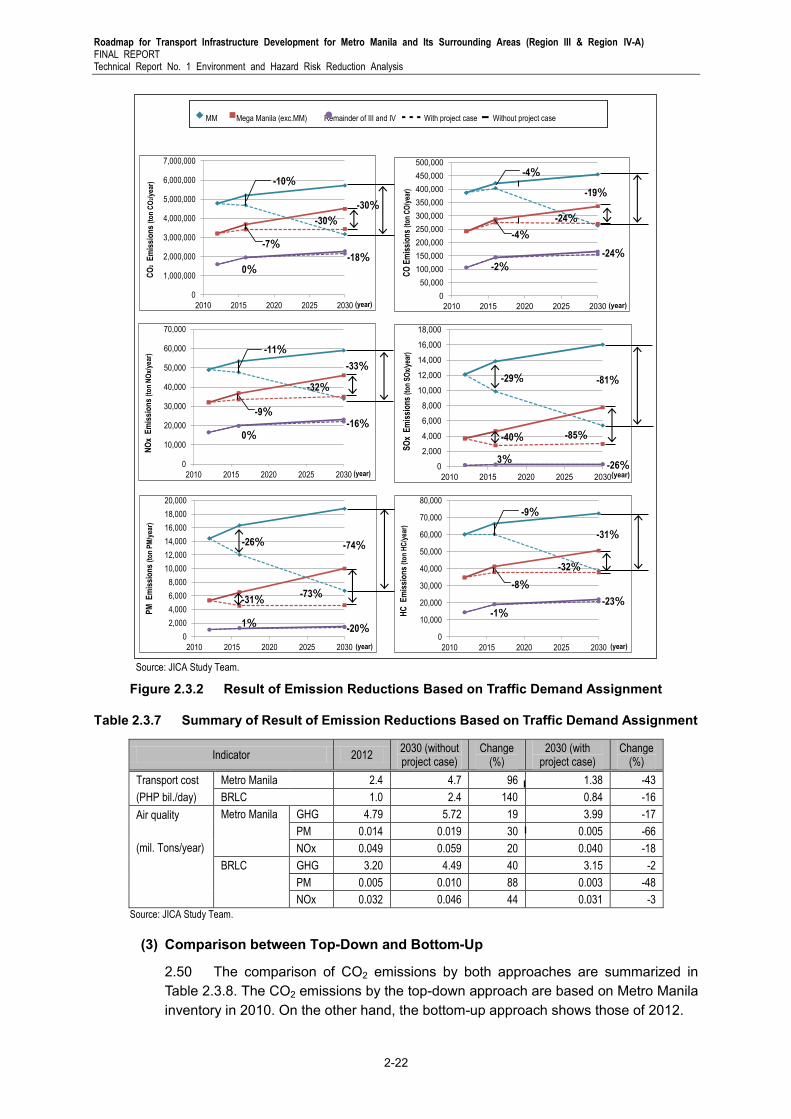
Roadmap for Transport Infrastructure Development for Metro Manila and Its Surrounding Areas (Region III & Region IV-A) FINAL REPORT Technical Report No. 1 Environment and Hazard Risk Reduction Analysis
2-22
Source: JICA Study Team.
Figure 2.3.2 Result of Emission Reductions Based on Traffic Demand Assignment
Table 2.3.7 Summary of Result of Emission Reductions Based on Traffic Demand Assignment
Indicator 2012 2030 (without project case)
Change (%)
2030 (with project case)
Change (%)
Transport cost Metro Manila 2.4 4.7 96 1.38 -43
(PHP bil./day) BRLC 1.0 2.4 140 0.84 -16
Air quality Metro Manila GHG 4.79 5.72 19 3.99 -17
PM 0.014 0.019 30 0.005 -66
(mil. Tons/year) NOx 0.049 0.059 20 0.040 -18
BRLC GHG 3.20 4.49 40 3.15 -2
PM 0.005 0.010 88 0.003 -48
NOx 0.032 0.046 44 0.031 -3
Source: JICA Study Team.
(3) Comparison between Top-Down and Bottom-Up
2.50 The comparison of CO2 emissions by both approaches are summarized in Table 2.3.8. The CO2 emissions by the top-down approach are based on Metro Manila inventory in 2010. On the other hand, the bottom-up approach shows those of 2012.
0
10,000
20,000
30,000
40,000
50,000
60,000
70,000
80,000
2010 2015 2020 2025 2030
HC
Em
issi
on
s (t
on
HC
/yea
r)
(year)
-31%
-32%
-9%
-8%
-1% -23%
0
2,000
4,000
6,000
8,000
10,000
12,000
14,000
16,000
18,000
20,000
2010 2015 2020 2025 2030
PM
Em
issi
on
s (t
on
PM
/yea
r)
(year)
-74%
-73%
-26%
-31%
1% -20%
0
1,000,000
2,000,000
3,000,000
4,000,000
5,000,000
6,000,000
7,000,000
2010 2015 2020 2025 2030
CO
2E
mis
sio
ns
(to
n C
O2/
year
)
(year)
-30%
-30%
-10%
-7%
0% -18%
0
50,000
100,000
150,000
200,000
250,000
300,000
350,000
400,000
450,000
500,000
2010 2015 2020 2025 2030
CO
Em
issi
ons
(ton
CO
/yea
r)
(year)
-19%
-24%
-4%
-4%
-2%
-24%
0
2,000
4,000
6,000
8,000
10,000
12,000
14,000
16,000
18,000
2010 2015 2020 2025 2030
SO
x E
mis
sion
s (t
on S
Ox/
year
)
(year)
-81% -29%
-40% -85%
-26% 3%
MM Mega Manila (exc.MM) Remainder of III and IV - - - With project case - Without project case
0
10,000
20,000
30,000
40,000
50,000
60,000
70,000
2010 2015 2020 2025 2030
NO
x E
mis
sio
ns
(to
n N
Ox/
year
)
(year)
-33%
-32%
-16%
-11%
-9%
0%
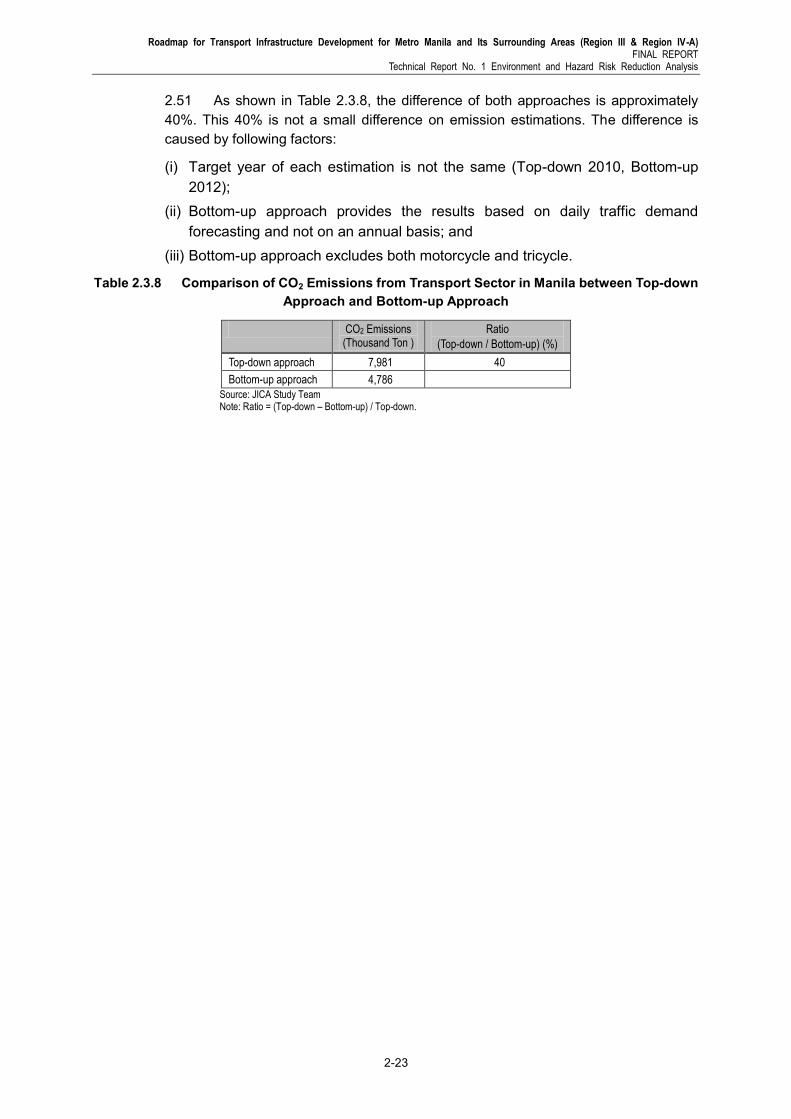
Roadmap for Transport Infrastructure Development for Metro Manila and Its Surrounding Areas (Region III & Region IV-A) FINAL REPORT
Technical Report No. 1 Environment and Hazard Risk Reduction Analysis
2-23
2.51 As shown in Table 2.3.8, the difference of both approaches is approximately 40%. This 40% is not a small difference on emission estimations. The difference is caused by following factors:
(i) Target year of each estimation is not the same (Top-down 2010, Bottom-up 2012);
(ii) Bottom-up approach provides the results based on daily traffic demand forecasting and not on an annual basis; and
(iii) Bottom-up approach excludes both motorcycle and tricycle.
Table 2.3.8 Comparison of CO2 Emissions from Transport Sector in Manila between Top-down Approach and Bottom-up Approach
CO2 Emissions (Thousand Ton )
Ratio
(Top-down / Bottom-up) (%)
Top-down approach 7,981 40
Bottom-up approach 4,786
Source: JICA Study Team Note: Ratio = (Top-down – Bottom-up) / Top-down.
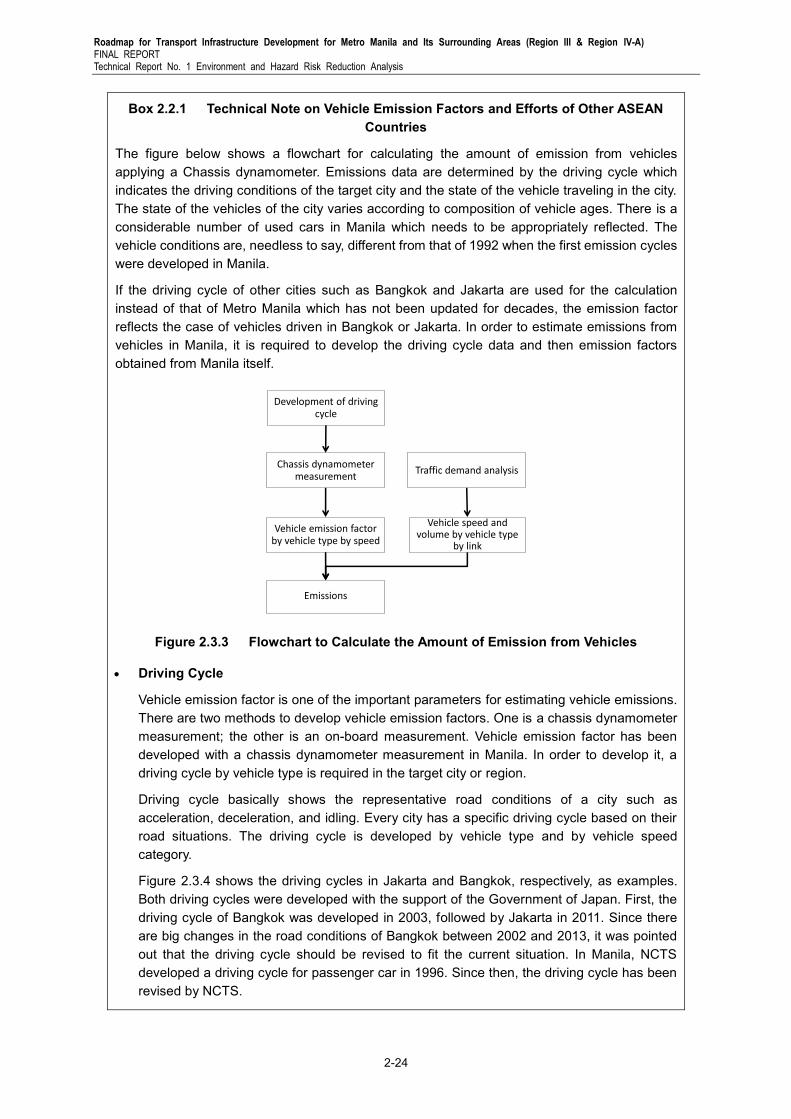
Roadmap for Transport Infrastructure Development for Metro Manila and Its Surrounding Areas (Region III & Region IV-A) FINAL REPORT Technical Report No. 1 Environment and Hazard Risk Reduction Analysis
2-24
Box 2.2.1 Technical Note on Vehicle Emission Factors and Efforts of Other ASEAN Countries
The figure below shows a flowchart for calculating the amount of emission from vehicles applying a Chassis dynamometer. Emissions data are determined by the driving cycle which indicates the driving conditions of the target city and the state of the vehicle traveling in the city. The state of the vehicles of the city varies according to composition of vehicle ages. There is a considerable number of used cars in Manila which needs to be appropriately reflected. The vehicle conditions are, needless to say, different from that of 1992 when the first emission cycles were developed in Manila.
If the driving cycle of other cities such as Bangkok and Jakarta are used for the calculation instead of that of Metro Manila which has not been updated for decades, the emission factor reflects the case of vehicles driven in Bangkok or Jakarta. In order to estimate emissions from vehicles in Manila, it is required to develop the driving cycle data and then emission factors obtained from Manila itself.
Chassis dynamometer measurement
Vehicle emission factor by vehicle type by speed
Vehicle speed and volume by vehicle type
by link
Emissions
Traffic demand analysis
Development of driving cycle
Figure 2.3.3 Flowchart to Calculate the Amount of Emission from Vehicles
Driving Cycle
Vehicle emission factor is one of the important parameters for estimating vehicle emissions. There are two methods to develop vehicle emission factors. One is a chassis dynamometer measurement; the other is an on-board measurement. Vehicle emission factor has been developed with a chassis dynamometer measurement in Manila. In order to develop it, a driving cycle by vehicle type is required in the target city or region.
Driving cycle basically shows the representative road conditions of a city such as acceleration, deceleration, and idling. Every city has a specific driving cycle based on their road situations. The driving cycle is developed by vehicle type and by vehicle speed category.
Figure 2.3.4 shows the driving cycles in Jakarta and Bangkok, respectively, as examples. Both driving cycles were developed with the support of the Government of Japan. First, the driving cycle of Bangkok was developed in 2003, followed by Jakarta in 2011. Since there are big changes in the road conditions of Bangkok between 2002 and 2013, it was pointed out that the driving cycle should be revised to fit the current situation. In Manila, NCTS developed a driving cycle for passenger car in 1996. Since then, the driving cycle has been revised by NCTS.
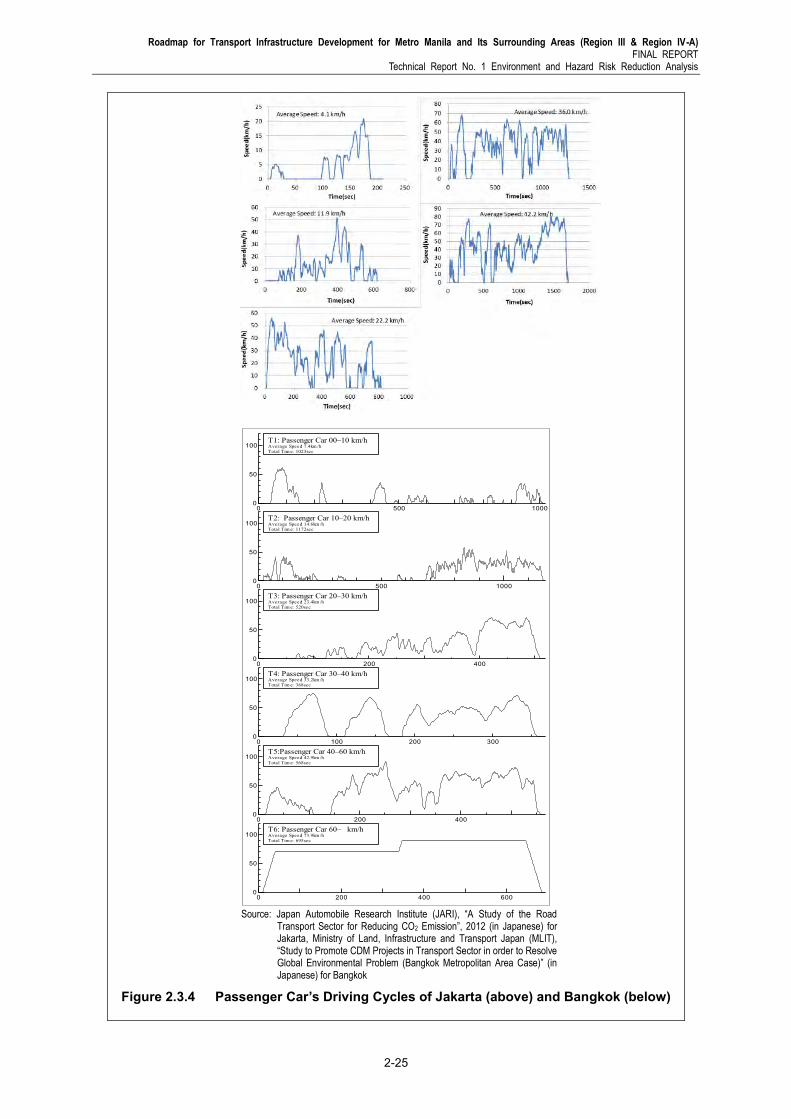
Roadmap for Transport Infrastructure Development for Metro Manila and Its Surrounding Areas (Region III & Region IV-A) FINAL REPORT
Technical Report No. 1 Environment and Hazard Risk Reduction Analysis
2-25
Source: Japan Automobile Research Institute (JARI), “A Study of the Road
Transport Sector for Reducing CO2 Emission”, 2012 (in Japanese) for Jakarta, Ministry of Land, Infrastructure and Transport Japan (MLIT), “Study to Promote CDM Projects in Transport Sector in order to Resolve Global Environmental Problem (Bangkok Metropolitan Area Case)” (in Japanese) for Bangkok
Figure 2.3.4 Passenger Car’s Driving Cycles of Jakarta (above) and Bangkok (below)
0 500 10000
50
100
0 500 10000
50
100
0 200 4000
50
100
0 100 200 3000
50
100
0 200 4000
50
100
0 200 400 6000
50
100
T1: Passenger Car 00–10 km/hAverage Speed:7.4km /hTotal Tim e:1023sec
T2: Passenger Car 10–20 km/hAverage Speed:14.6km /hTotal Tim e:1172sec
T3: Passenger Car 20–30 km/hAverage Speed:23.4km /hTotal Tim e:520sec
T4: Passenger Car 30–40 km/hAverage Speed:33.2km /hTotal Tim e:368sec
T5:Passenger Car 40–60 km/hAverage Speed:42.9km /hTotal Tim e:568sec
T6: Passenger Car 60– km/hAverage Speed:73.9km /hTotal Tim e:695sec
Roadmap for Transport Infrastructure Development for Metro Manila and Its Surrounding Areas (Region III & Region IV-A) FINAL REPORT Technical Report No. 1 Environment and Hazard Risk Reduction Analysis
2-26
Chassis Dynamometer Measurement
In recent years, ASEAN countries started to introduce Euro standards for vehicle emission and fuel standard. The Philippines introduced the Euro 2 standard for vehicle emission a new passenger car since 2007 and will be expected to adopt Euro 4 for both a vehicle emission standard and a fuel standard from 2016. When new vehicles, which conform to a new standard, are distributed in the city, vehicle emission situations by vehicle type would be improved. Therefore, in case of the introduction of a new vehicle emission standard, vehicle emission factors should be revised properly so that total vehicle emissions could be assessed with more accuracy.
The situations of chassis dynamometer facilities in some ASEAN countries are summarized in Table 2.3.9. These countries are trying to develop their own vehicle emission factors by their chassis dynamometer. They depended on international support for their development.
Thailand introduced the chassis dynamometer system of its Pollution Control Department (PCD) under the budget of the Ministry of Natural Resource and Environment (MONRE) in 1995. However, the operation of the facility was not appropriately managed due to a lack of maintenance experience. In addition, vehicle emission factors could not be developed reflecting the Bangkok driving cycle. In 2002, the MLIT of Japan dispatched vehicle technical and science specialists to support the development of vehicle emission factors. As a result, Bangkok driving cycle and vehicle emission factors were developed. JICA has been supporting the PCD for VOCs emission factors and Pollutant Release and Transfer Register (PRTR) database development. The driving cycle should be revised due to the changes of the traffic situation in Bangkok.
Indonesia established a small-sized chassis dynamometer with their own budget in 2005. The main target was biofuel and alternative fuel emission test. The development of the Jakarta driving cycle required international support due to a lack of experience. In 2010, the Jakarta driving cycle was developed with support of the Ministry of Economy, Trade and Industry (METI) of Japan. Further, vehicle emission factors were developed based on the driving cycle with the chassis dynamometer test with METI technical and investment support in 2011.
Viet Nam has a specific traffic condition of having over 4 million motorcycles in Hanoi. In such a situation, the driving cycle of Hanoi was required to reflect their specific traffic conditions and developed with their own budget in 2008. However, the development of a chassis dynamometer system was difficult due to a lack of financial resources. In 2011, the Austrian government supported the development of a small-sized chassis dynamometer facility for motorcycle and Low Duty Vehicle (LDV). As a result, emission factors of Hanoi were developed in 2011.
Malaysia is also trying to develop its own vehicle emission factors.
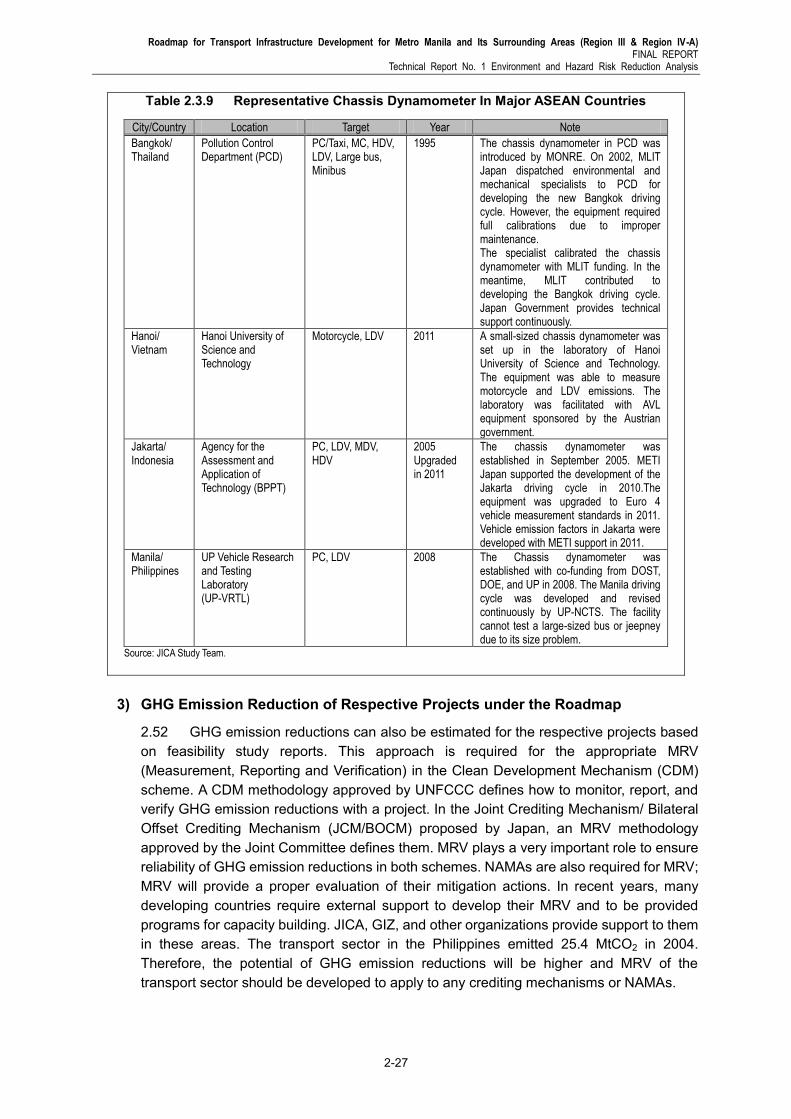
Roadmap for Transport Infrastructure Development for Metro Manila and Its Surrounding Areas (Region III & Region IV-A) FINAL REPORT
Technical Report No. 1 Environment and Hazard Risk Reduction Analysis
2-27
Table 2.3.9 Representative Chassis Dynamometer In Major ASEAN Countries
City/Country Location Target Year Note
Bangkok/ Thailand
Pollution Control Department (PCD)
PC/Taxi, MC, HDV, LDV, Large bus, Minibus
1995 The chassis dynamometer in PCD was introduced by MONRE. On 2002, MLIT Japan dispatched environmental and mechanical specialists to PCD for developing the new Bangkok driving cycle. However, the equipment required full calibrations due to improper maintenance. The specialist calibrated the chassis dynamometer with MLIT funding. In the meantime, MLIT contributed to developing the Bangkok driving cycle. Japan Government provides technical support continuously.
Hanoi/ Vietnam
Hanoi University of Science and Technology
Motorcycle, LDV 2011 A small-sized chassis dynamometer was set up in the laboratory of Hanoi University of Science and Technology. The equipment was able to measure motorcycle and LDV emissions. The laboratory was facilitated with AVL equipment sponsored by the Austrian government.
Jakarta/ Indonesia
Agency for the Assessment and Application of Technology (BPPT)
PC, LDV, MDV, HDV
2005 Upgraded in 2011
The chassis dynamometer was established in September 2005. METI Japan supported the development of the Jakarta driving cycle in 2010.The equipment was upgraded to Euro 4 vehicle measurement standards in 2011. Vehicle emission factors in Jakarta were developed with METI support in 2011.
Manila/ Philippines
UP Vehicle Research and Testing Laboratory (UP-VRTL)
PC, LDV 2008 The Chassis dynamometer was established with co-funding from DOST, DOE, and UP in 2008. The Manila driving cycle was developed and revised continuously by UP-NCTS. The facility cannot test a large-sized bus or jeepney due to its size problem.
Source: JICA Study Team.
3) GHG Emission Reduction of Respective Projects under the Roadmap
2.52 GHG emission reductions can also be estimated for the respective projects based on feasibility study reports. This approach is required for the appropriate MRV (Measurement, Reporting and Verification) in the Clean Development Mechanism (CDM) scheme. A CDM methodology approved by UNFCCC defines how to monitor, report, and verify GHG emission reductions with a project. In the Joint Crediting Mechanism/ Bilateral Offset Crediting Mechanism (JCM/BOCM) proposed by Japan, an MRV methodology approved by the Joint Committee defines them. MRV plays a very important role to ensure reliability of GHG emission reductions in both schemes. NAMAs are also required for MRV; MRV will provide a proper evaluation of their mitigation actions. In recent years, many developing countries require external support to develop their MRV and to be provided programs for capacity building. JICA, GIZ, and other organizations provide support to them in these areas. The transport sector in the Philippines emitted 25.4 MtCO2 in 2004. Therefore, the potential of GHG emission reductions will be higher and MRV of the transport sector should be developed to apply to any crediting mechanisms or NAMAs.
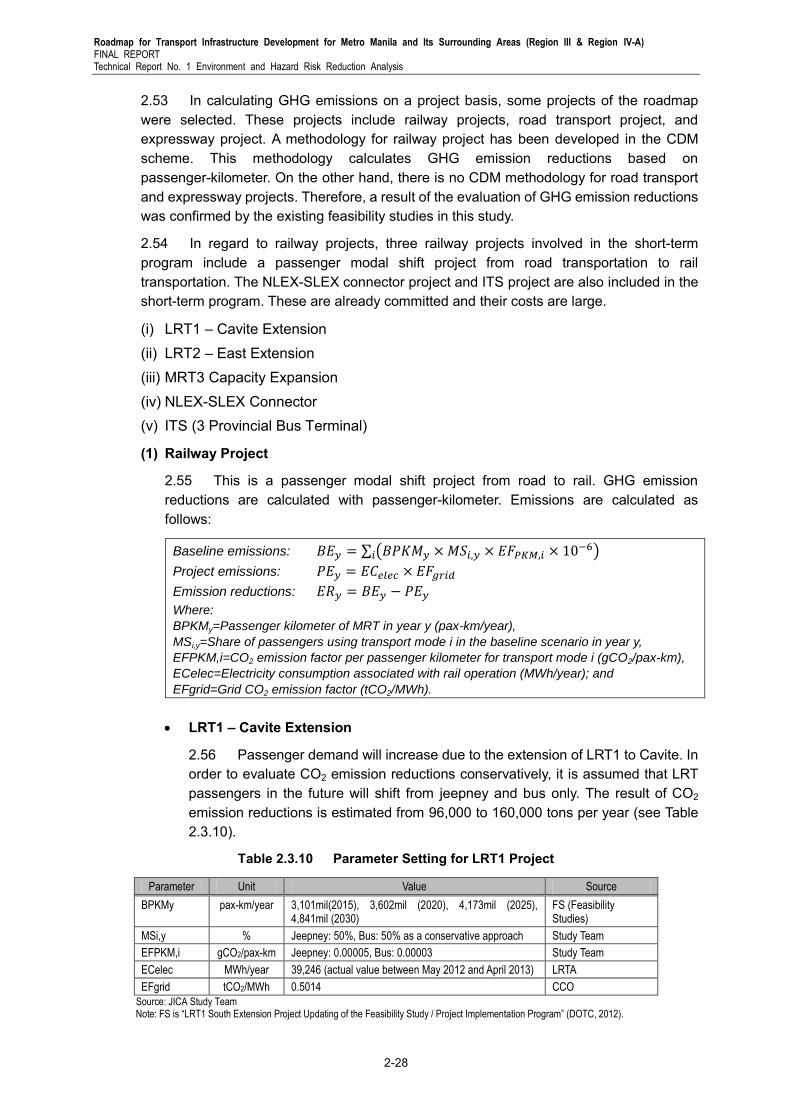
Roadmap for Transport Infrastructure Development for Metro Manila and Its Surrounding Areas (Region III & Region IV-A) FINAL REPORT Technical Report No. 1 Environment and Hazard Risk Reduction Analysis
2-28
2.53 In calculating GHG emissions on a project basis, some projects of the roadmap were selected. These projects include railway projects, road transport project, and expressway project. A methodology for railway project has been developed in the CDM scheme. This methodology calculates GHG emission reductions based on passenger-kilometer. On the other hand, there is no CDM methodology for road transport and expressway projects. Therefore, a result of the evaluation of GHG emission reductions was confirmed by the existing feasibility studies in this study.
2.54 In regard to railway projects, three railway projects involved in the short-term program include a passenger modal shift project from road transportation to rail transportation. The NLEX-SLEX connector project and ITS project are also included in the short-term program. These are already committed and their costs are large.
(i) LRT1 – Cavite Extension (ii) LRT2 – East Extension (iii) MRT3 Capacity Expansion (iv) NLEX-SLEX Connector (v) ITS (3 Provincial Bus Terminal)
(1) Railway Project
2.55 This is a passenger modal shift project from road to rail. GHG emission reductions are calculated with passenger-kilometer. Emissions are calculated as follows:
Baseline emissions: ∑ ( )
Project emissions:
Emission reductions:
Where:
BPKMy=Passenger kilometer of MRT in year y (pax-km/year),
MSi,y=Share of passengers using transport mode i in the baseline scenario in year y,
EFPKM,i=CO2 emission factor per passenger kilometer for transport mode i (gCO2/pax-km),
ECelec=Electricity consumption associated with rail operation (MWh/year); and
EFgrid=Grid CO2 emission factor (tCO2/MWh).
LRT1 – Cavite Extension
2.56 Passenger demand will increase due to the extension of LRT1 to Cavite. In order to evaluate CO2 emission reductions conservatively, it is assumed that LRT passengers in the future will shift from jeepney and bus only. The result of CO2 emission reductions is estimated from 96,000 to 160,000 tons per year (see Table 2.3.10).
Table 2.3.10 Parameter Setting for LRT1 Project
Parameter Unit Value Source
BPKMy pax-km/year 3,101mil(2015), 3,602mil (2020), 4,173mil (2025), 4,841mil (2030)
FS (Feasibility Studies)
MSi,y % Jeepney: 50%, Bus: 50% as a conservative approach Study Team
EFPKM,i gCO2/pax-km Jeepney: 0.00005, Bus: 0.00003 Study Team
ECelec MWh/year 39,246 (actual value between May 2012 and April 2013) LRTA
EFgrid tCO2/MWh 0.5014 CCO
Source: JICA Study Team Note: FS is “LRT1 South Extension Project Updating of the Feasibility Study / Project Implementation Program” (DOTC, 2012).
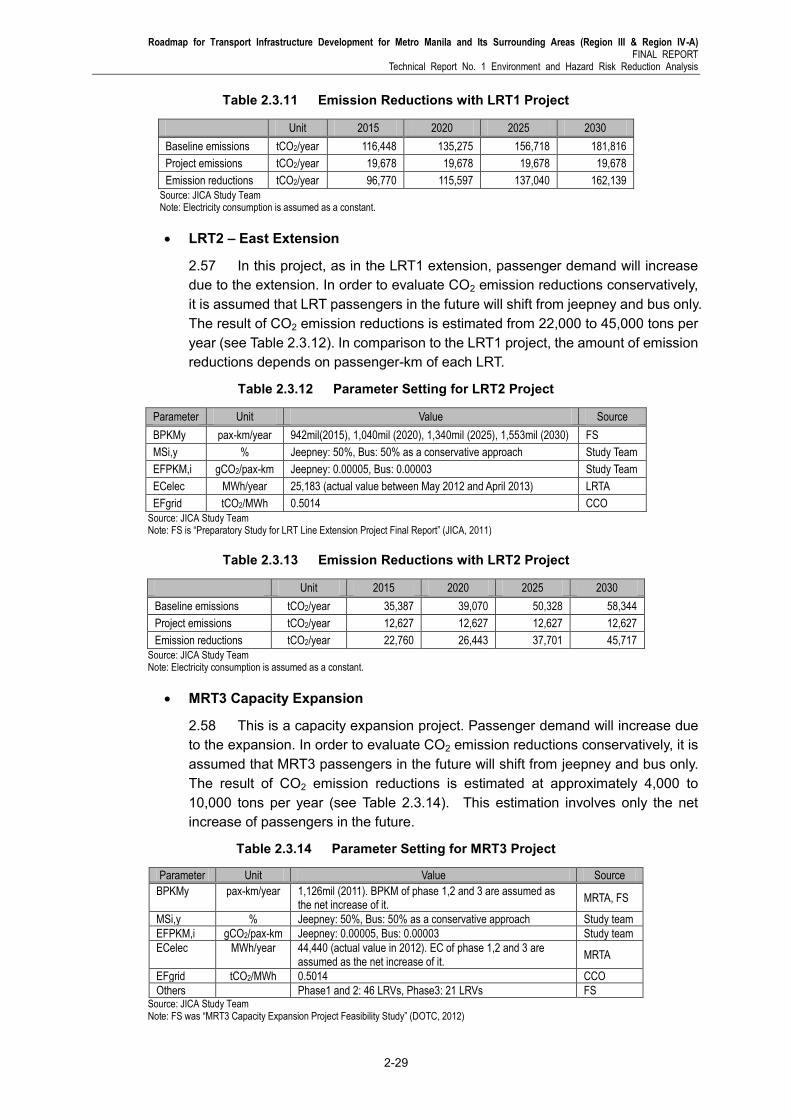
Roadmap for Transport Infrastructure Development for Metro Manila and Its Surrounding Areas (Region III & Region IV-A) FINAL REPORT
Technical Report No. 1 Environment and Hazard Risk Reduction Analysis
2-29
Table 2.3.11 Emission Reductions with LRT1 Project
(a) Unit 2015 2020 2025 2030
Baseline emissions tCO2/year 116,448 135,275 156,718 181,816
Project emissions tCO2/year 19,678 19,678 19,678 19,678
Emission reductions tCO2/year 96,770 115,597 137,040 162,139
Source: JICA Study Team Note: Electricity consumption is assumed as a constant.
LRT2 – East Extension
2.57 In this project, as in the LRT1 extension, passenger demand will increase due to the extension. In order to evaluate CO2 emission reductions conservatively, it is assumed that LRT passengers in the future will shift from jeepney and bus only. The result of CO2 emission reductions is estimated from 22,000 to 45,000 tons per year (see Table 2.3.12). In comparison to the LRT1 project, the amount of emission reductions depends on passenger-km of each LRT.
Table 2.3.12 Parameter Setting for LRT2 Project
Parameter Unit Value Source
BPKMy pax-km/year 942mil(2015), 1,040mil (2020), 1,340mil (2025), 1,553mil (2030) FS
MSi,y % Jeepney: 50%, Bus: 50% as a conservative approach Study Team
EFPKM,i gCO2/pax-km Jeepney: 0.00005, Bus: 0.00003 Study Team
ECelec MWh/year 25,183 (actual value between May 2012 and April 2013) LRTA
EFgrid tCO2/MWh 0.5014 CCO
Source: JICA Study Team Note: FS is “Preparatory Study for LRT Line Extension Project Final Report” (JICA, 2011)
Table 2.3.13 Emission Reductions with LRT2 Project
Unit 2015 2020 2025 2030
Baseline emissions tCO2/year 35,387 39,070 50,328 58,344
Project emissions tCO2/year 12,627 12,627 12,627 12,627
Emission reductions tCO2/year 22,760 26,443 37,701 45,717
Source: JICA Study Team Note: Electricity consumption is assumed as a constant.
MRT3 Capacity Expansion
2.58 This is a capacity expansion project. Passenger demand will increase due to the expansion. In order to evaluate CO2 emission reductions conservatively, it is assumed that MRT3 passengers in the future will shift from jeepney and bus only. The result of CO2 emission reductions is estimated at approximately 4,000 to 10,000 tons per year (see Table 2.3.14). This estimation involves only the net increase of passengers in the future.
Table 2.3.14 Parameter Setting for MRT3 Project
Parameter Unit Value Source
BPKMy pax-km/year 1,126mil (2011). BPKM of phase 1,2 and 3 are assumed as the net increase of it.
MRTA, FS
MSi,y % Jeepney: 50%, Bus: 50% as a conservative approach Study team
EFPKM,i gCO2/pax-km Jeepney: 0.00005, Bus: 0.00003 Study team
ECelec MWh/year 44,440 (actual value in 2012). EC of phase 1,2 and 3 are assumed as the net increase of it.
MRTA
EFgrid tCO2/MWh 0.5014 CCO
Others Phase1 and 2: 46 LRVs, Phase3: 21 LRVs FS Source: JICA Study Team Note: FS was “MRT3 Capacity Expansion Project Feasibility Study” (DOTC, 2012)
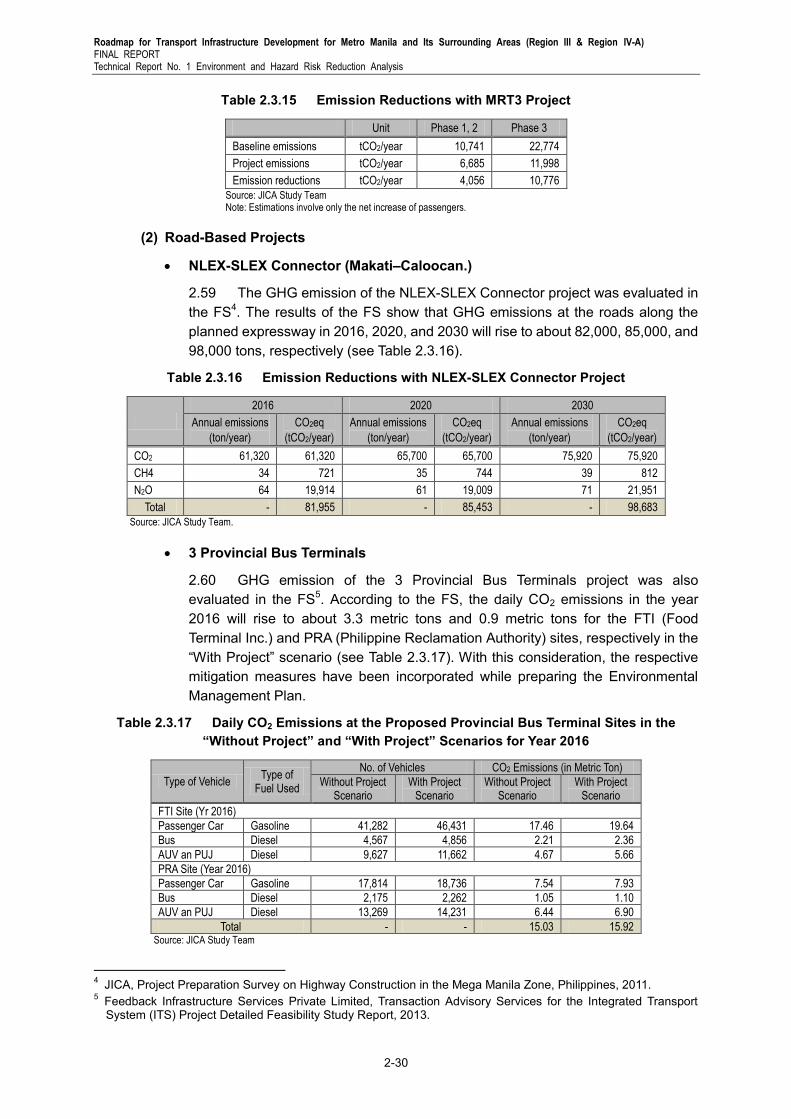
Roadmap for Transport Infrastructure Development for Metro Manila and Its Surrounding Areas (Region III & Region IV-A) FINAL REPORT Technical Report No. 1 Environment and Hazard Risk Reduction Analysis
2-30
Table 2.3.15 Emission Reductions with MRT3 Project
(b) Unit Phase 1, 2 Phase 3
Baseline emissions tCO2/year 10,741 22,774
Project emissions tCO2/year 6,685 11,998
Emission reductions tCO2/year 4,056 10,776
Source: JICA Study Team Note: Estimations involve only the net increase of passengers.
(2) Road-Based Projects
NLEX-SLEX Connector (Makati–Caloocan.)
2.59 The GHG emission of the NLEX-SLEX Connector project was evaluated in the FS4. The results of the FS show that GHG emissions at the roads along the planned expressway in 2016, 2020, and 2030 will rise to about 82,000, 85,000, and 98,000 tons, respectively (see Table 2.3.16).
Table 2.3.16 Emission Reductions with NLEX-SLEX Connector Project
2016 2020 2030
Annual emissions
(ton/year)
CO2eq
(tCO2/year)
Annual emissions
(ton/year)
CO2eq
(tCO2/year)
Annual emissions
(ton/year)
CO2eq
(tCO2/year)
CO2 61,320 61,320 65,700 65,700 75,920 75,920
CH4 34 721 35 744 39 812
N2O 64 19,914 61 19,009 71 21,951
Total - 81,955 - 85,453 - 98,683
Source: JICA Study Team.
3 Provincial Bus Terminals
2.60 GHG emission of the 3 Provincial Bus Terminals project was also evaluated in the FS5. According to the FS, the daily CO2 emissions in the year 2016 will rise to about 3.3 metric tons and 0.9 metric tons for the FTI (Food Terminal Inc.) and PRA (Philippine Reclamation Authority) sites, respectively in the “With Project” scenario (see Table 2.3.17). With this consideration, the respective mitigation measures have been incorporated while preparing the Environmental Management Plan.
Table 2.3.17 Daily CO2 Emissions at the Proposed Provincial Bus Terminal Sites in the “Without Project” and “With Project” Scenarios for Year 2016
Type of Vehicle Type of
Fuel Used
No. of Vehicles CO2 Emissions (in Metric Ton)
Without Project Scenario
With Project Scenario
Without Project Scenario
With Project Scenario
FTI Site (Yr 2016)
Passenger Car Gasoline 41,282 46,431 17.46 19.64
Bus Diesel 4,567 4,856 2.21 2.36
AUV an PUJ Diesel 9,627 11,662 4.67 5.66
PRA Site (Year 2016)
Passenger Car Gasoline 17,814 18,736 7.54 7.93
Bus Diesel 2,175 2,262 1.05 1.10
AUV an PUJ Diesel 13,269 14,231 6.44 6.90
Total - - 15.03 15.92 Source: JICA Study Team
4 JICA, Project Preparation Survey on Highway Construction in the Mega Manila Zone, Philippines, 2011. 5 Feedback Infrastructure Services Private Limited, Transaction Advisory Services for the Integrated Transport
System (ITS) Project Detailed Feasibility Study Report, 2013.
Roadmap for Transport Infrastructure Development for Metro Manila and Its Surrounding Areas (Region III & Region IV-A) FINAL REPORT
Technical Report No. 1 Environment and Hazard Risk Reduction Analysis
2-31
(3) Summary of the Project-based Approach
2.61 Emission reduction of the railway projects are significantly larger compare to other type of projects. The emission data are normally calculated at the project feasibility study (FS) stage in the Project-Based Approach. Specific parameters in the FS are utilized for calculation. Once the target projects are implemented, the parameters utilized for calculating emission reduction data should be regularly monitored and verified to come up with more accurate reduction data. This approach is required to estimate the impact of the GHG emission reduction data. Emission reduction data acquired through this approach can be reported in the biennial update reports (BURs) and NAMAs for international recognition.
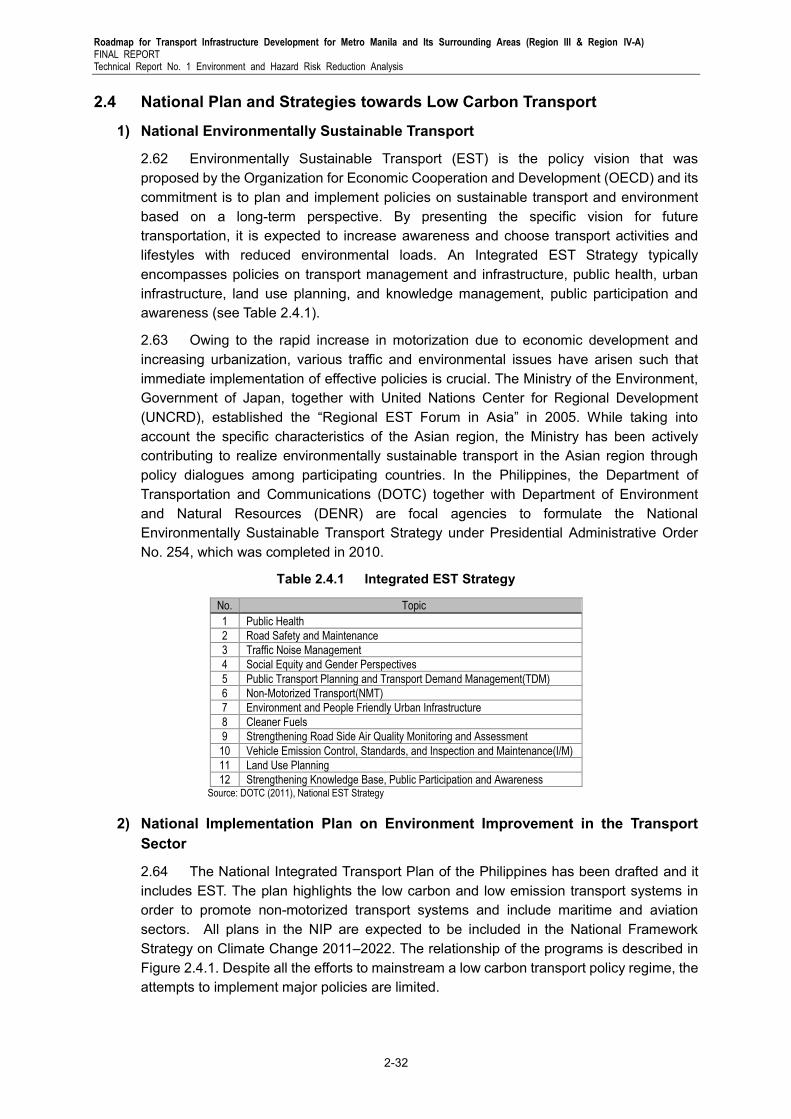
Roadmap for Transport Infrastructure Development for Metro Manila and Its Surrounding Areas (Region III & Region IV-A) FINAL REPORT Technical Report No. 1 Environment and Hazard Risk Reduction Analysis
2-32
2.4 National Plan and Strategies towards Low Carbon Transport
1) National Environmentally Sustainable Transport
2.62 Environmentally Sustainable Transport (EST) is the policy vision that was proposed by the Organization for Economic Cooperation and Development (OECD) and its commitment is to plan and implement policies on sustainable transport and environment based on a long-term perspective. By presenting the specific vision for future transportation, it is expected to increase awareness and choose transport activities and lifestyles with reduced environmental loads. An Integrated EST Strategy typically encompasses policies on transport management and infrastructure, public health, urban infrastructure, land use planning, and knowledge management, public participation and awareness (see Table 2.4.1).
2.63 Owing to the rapid increase in motorization due to economic development and increasing urbanization, various traffic and environmental issues have arisen such that immediate implementation of effective policies is crucial. The Ministry of the Environment, Government of Japan, together with United Nations Center for Regional Development (UNCRD), established the “Regional EST Forum in Asia” in 2005. While taking into account the specific characteristics of the Asian region, the Ministry has been actively contributing to realize environmentally sustainable transport in the Asian region through policy dialogues among participating countries. In the Philippines, the Department of Transportation and Communications (DOTC) together with Department of Environment and Natural Resources (DENR) are focal agencies to formulate the National Environmentally Sustainable Transport Strategy under Presidential Administrative Order No. 254, which was completed in 2010.
Table 2.4.1 Integrated EST Strategy
No. Topic
1 Public Health
2 Road Safety and Maintenance
3 Traffic Noise Management
4 Social Equity and Gender Perspectives
5 Public Transport Planning and Transport Demand Management(TDM)
6 Non-Motorized Transport(NMT)
7 Environment and People Friendly Urban Infrastructure
8 Cleaner Fuels
9 Strengthening Road Side Air Quality Monitoring and Assessment
10 Vehicle Emission Control, Standards, and Inspection and Maintenance(I/M)
11 Land Use Planning
12 Strengthening Knowledge Base, Public Participation and Awareness Source: DOTC (2011), National EST Strategy
2) National Implementation Plan on Environment Improvement in the Transport Sector
2.64 The National Integrated Transport Plan of the Philippines has been drafted and it includes EST. The plan highlights the low carbon and low emission transport systems in order to promote non-motorized transport systems and include maritime and aviation sectors. All plans in the NIP are expected to be included in the National Framework Strategy on Climate Change 2011–2022. The relationship of the programs is described in Figure 2.4.1. Despite all the efforts to mainstream a low carbon transport policy regime, the attempts to implement major policies are limited.
Roadmap for Transport Infrastructure Development for Metro Manila and Its Surrounding Areas (Region III & Region IV-A) FINAL REPORT
Technical Report No. 1 Environment and Hazard Risk Reduction Analysis
2-33
Source: DOTC
Figure 2.4.1 Relationship among Different Programs Related to NIP in the Philippines
2.65 There are no specific description of climate change mitigation measures in the MMDA prioritized projects in the transport sector as well as in national level policies and plans.
3) Mass Transit and Modal Shifts
2.66 The development of railway network is one of the most important and urgent priorities in Metro Manila where the vehicle population and traffic demand continue to increase. There is significant potential to reduce GHG by shifting passengers from private vehicles or taxis to the railway. The detailed description of existing railway lines, lines under construction, and lines which are planned to start construction are explained chapter 3 of the report (table on Railway Projects in the Last Decade).
2.67 Regarding a plan for a rail-based mass transit system (subway, elevated railway, etc.), in Metro Manila and advanced regions, the DOTC had not developed a longer term master plan on mass rapid transit systems which have specific time lines, although there have been substantial technical support to formulate plans. The schedule of the implementation of past transit systems have been considerably behind schedule.
2.68 BRT has a role to complement the network of railways and it is effective in areas where it is difficult to develop railways. There is potential to reduce in traffic through shifting passengers from passenger vehicles or taxis to BRT. If buses in the BRT system run on LPG, there will be additional positive impact on air quality.
4) Cleaner Fuels
2.69 Combining the strategy to reduce the country’s dependence on imported oil, alternative fuels for transport are expected to provide a viable solution to cushion the impact of highly volatile petroleum prices on the economy with resource diversification as well as to promote clean and environment-friendly energies. Future supply potential of alternative fuels for transport use such as biofuels (bioethanol and biodiesel), CNG6, and auto LPG are introduced in Metro Manila.
2.70 The Government of the Philippines promotes the use of CNG, not only for power generation but also for automobile fuel in recent years. The utilization of natural gas can reduce oil dependency and increase energy security. As for natural gas vehicles (NGV),
6 Natural Gas Vehicle Program for Public transport (NGVPPT) is initiated by DOE and initially sixty buses are
currently operating between Batangas and Metro Manila. There are limitations of expanding the program due to the limited number of CNG stations.
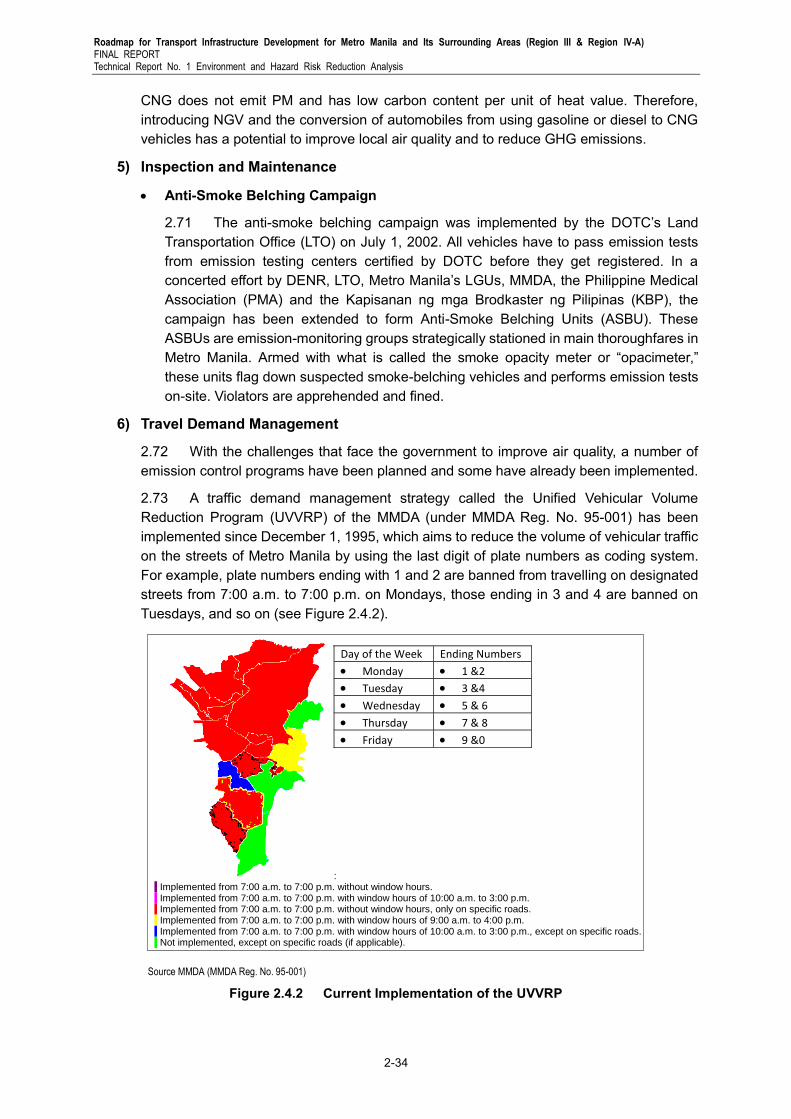
Roadmap for Transport Infrastructure Development for Metro Manila and Its Surrounding Areas (Region III & Region IV-A) FINAL REPORT Technical Report No. 1 Environment and Hazard Risk Reduction Analysis
2-34
CNG does not emit PM and has low carbon content per unit of heat value. Therefore, introducing NGV and the conversion of automobiles from using gasoline or diesel to CNG vehicles has a potential to improve local air quality and to reduce GHG emissions.
5) Inspection and Maintenance
Anti-Smoke Belching Campaign
2.71 The anti-smoke belching campaign was implemented by the DOTC’s Land Transportation Office (LTO) on July 1, 2002. All vehicles have to pass emission tests from emission testing centers certified by DOTC before they get registered. In a concerted effort by DENR, LTO, Metro Manila’s LGUs, MMDA, the Philippine Medical Association (PMA) and the Kapisanan ng mga Brodkaster ng Pilipinas (KBP), the campaign has been extended to form Anti-Smoke Belching Units (ASBU). These ASBUs are emission-monitoring groups strategically stationed in main thoroughfares in Metro Manila. Armed with what is called the smoke opacity meter or “opacimeter,” these units flag down suspected smoke-belching vehicles and performs emission tests on-site. Violators are apprehended and fined.
6) Travel Demand Management
2.72 With the challenges that face the government to improve air quality, a number of emission control programs have been planned and some have already been implemented.
2.73 A traffic demand management strategy called the Unified Vehicular Volume Reduction Program (UVVRP) of the MMDA (under MMDA Reg. No. 95-001) has been implemented since December 1, 1995, which aims to reduce the volume of vehicular traffic on the streets of Metro Manila by using the last digit of plate numbers as coding system. For example, plate numbers ending with 1 and 2 are banned from travelling on designated streets from 7:00 a.m. to 7:00 p.m. on Mondays, those ending in 3 and 4 are banned on Tuesdays, and so on (see Figure 2.4.2).
Source MMDA (MMDA Reg. No. 95-001)
Figure 2.4.2 Current Implementation of the UVVRP
: Implemented from 7:00 a.m. to 7:00 p.m. without window hours. Implemented from 7:00 a.m. to 7:00 p.m. with window hours of 10:00 a.m. to 3:00 p.m. Implemented from 7:00 a.m. to 7:00 p.m. without window hours, only on specific roads. Implemented from 7:00 a.m. to 7:00 p.m. with window hours of 9:00 a.m. to 4:00 p.m. Implemented from 7:00 a.m. to 7:00 p.m. with window hours of 10:00 a.m. to 3:00 p.m., except on specific roads. Not implemented, except on specific roads (if applicable).
Day of the Week Ending Numbers
Monday 1 &2
Tuesday 3 &4
Wednesday 5 & 6
Thursday 7 & 8
Friday 9 &0
Roadmap for Transport Infrastructure Development for Metro Manila and Its Surrounding Areas (Region III & Region IV-A) FINAL REPORT
Technical Report No. 1 Environment and Hazard Risk Reduction Analysis
2-35
2.74 The LTO's Motor Vehicle Inspection System (MVIS) is envisioned to contribute to emission reduction by implementing a comprehensive vehicle inspection and evaluation scheme to determine the roadworthiness (including safety) of vehicles in the country. However, this scheme is yet to be implemented awaiting the procurement of needed equipment.
2.75 Another emission reduction scheme is the conversion of 2-stroke motorcycles to 4-stroke. Based on the study of Shah and Harshadeep (2001), the PM10 emission factor of 4-stroke motorcycles is approximately 1/5 of the emission factor of 2-stroke motorcycles. The shift may have contributed a lot in the decreasing trend in the annual average TSP, especially in Metro Manila. This result was also projected in the MMUTIS study.
Roadmap for Transport Infrastructure Development for Metro Manila and Its Surrounding Areas (Region III & Region IV-A) FINAL REPORT Technical Report No. 1 Environment and Hazard Risk Reduction Analysis
2-36
2.5 Towards Inclusive Transport
2.76 The above measures have been implemented one way or another in terms of pilot models or with substantial investment. The challenge of Metro Manila with regard to environment is the current status of quantifiable data regarding air quality and GHG. Residents are exposed to polluted air without recognizing the serious impact on their health, especially on children. Once more GHG reduction volumes are quantified in an appropriate manner, it will benefit the country by gaining the international recognition through NAMAs. There have been a number of strategies and measures undertaken by the Philippine Government, but the analytical data which shows positive effect on air quality and GHG reduction are still limited. An implementation plan without stringent assessment has materialized partially and behind the original time schedule.
2.77 Stakeholders of the transport sector have not fully addressed the concern over environmental issues and GHG reduction. One of the major reasons is that countermeasures definitely require coordination beyond the transport sector, namely, urban planning and land use planning, energy, health and social protection issues. Specifically, air pollution is not only the matter of emission, but more so of its impact on health based on a sound monitoring system. Close coordination is required to work with DENR, DOH, DOE, and their bureaus.
2.78 Considering the lack of coordinating bodies and a master plan on these critical matters attributed to the transport sector, the institutional set-up towards “Eco-cities” with sound low carbon transport is urgently required in line with the Manila Green Print currently supported by the World Bank and AusAID.
2.79 The prioritized projects in the roadmap would contribute to reduce air pollutants and GHG significantly as previously discussed. However there are some concerns over the implementation stage and evaluation stage. In order to solve the issues and to improve environment in Mega Manila, the following actions are proposed.
1) Air Pollution Control and Monitoring Systems
2.80 In the short term, a spatial and visual-based system of the air pollution control is recommended to be developed. Under the system of the Metro Manila emission inventory and a simplified air quality model, the air quality improvement with projects can be easily provided to policy makers. Policy makers will understand in which area and how much air pollutants will be decreased at the pre-project implementation stage. As a result, the system will assist to prioritize the most appropriate actions with regard to economic and social benefits of the citizens.
2.81 In the long term, an on-line air pollutant monitoring system utilizing the internet can be installed, like the flood alert system of the Philippine Atmospheric, Geophysical and Astronomical Services Administration (PAG-ASA). This web-based system involves a daily forecasting system for air pollution with both meteorological data by PAGASA and air pollutants monitoring data by EMB. Once the system will be opened to public, it will be utilized for public awareness on air pollution in Metro Manila. As a result, this will scientifically measure the effectiveness of air pollution improvement by transport infrastructure development.
Roadmap for Transport Infrastructure Development for Metro Manila and Its Surrounding Areas (Region III & Region IV-A) FINAL REPORT
Technical Report No. 1 Environment and Hazard Risk Reduction Analysis
2-37
2) Development of MRV for GHG Reduction
2.82 The most important issue for sound monitoring of GHG is the development of MRV. The MRV is required for the adaptation of international schemes such as NAMAs, CDM, JCM/BOCM, etc. In order to develop MRV appropriately, the MRV scheme is required for the clarification of the responsibility of the relevant organizations. Meanwhile, capacity building programs should be required such as seminars, workshops, training courses, etc. The current Metro Manila Greenhouse Gas Inventory shows about 40% of total GHG emissions in Metro Manila from the transport sector. Many developing countries seek international support for the establishment of the post-evaluation system with MRV. Moreover, a reliable MRV will facilitate connection to crediting mechanisms.
3) Evaluation of Air Pollution Improvement
2.83 The reduction of air pollution impact on health in Metro Manila has a high priority in the government policy. EMB is trying to establish a new forecasting system for air pollution in Metro Manila, which will be launched in 2014. While daily forecasting is important, pre-evaluation of various actions is also important to create the proper effectiveness of the actions in the transport sector. In this study, air pollutants were estimated by the bottom-up approach based on traffic assignment. On one hand, spatial distributions of air pollutants would provide useful information for pre-evaluation of future actions. This method was applied in the USAID study7 in Metro Manila. JBIC8 also studied in Bangkok using both air quality model and traffic demand model. This approach would contribute to reduce health impact effectively.
4) Revision of Emission Factors
2.84 As mentioned in the Technical Note, other ASEAN countries have been trying to develop their emission factors in order to properly evaluate the effects of their transport activities. In Metro Manila, vehicle emission factors were developed in 1992, the first among ASEAN countries, with support from ADB. Since then, however, no emission factors have been revised except the ones under the MMUTIS. The old emission factors developed in the 1990s are repeatedly used in the emission estimation as formal national data. However, these are deemed to be inappropriate as the road and vehicle conditions have drastically changed since then. In the Philippines, the Euro 2 emission standard for new passenger car was applied since 2007. In addition, the Euro 4 emission standard for new passenger car and the Euro 4 fuel standard will be applied in 2016. After passenger cars adapted to a new standard will be distributed in the city, vehicle emissions will be improved.
2.85 After applying a new fuel standard, vehicle emissions will also improve. The old emission factors should be definitely revised to adapt to current vehicle situations. Moreover, there is an issue that the chassis dynamometer of UP-NCTS cannot be applied to large-sized jeepneys and buses. Their contribution to air quality deterioration in Metro Manila should be evaluated quantifiably by the chassis dynamometer test. The facility, therefore, should be replaced with a larger sized facility to accommodate jeepneys and buses. Once replaced, the accuracy of the emission factors will improve to the standard
7 Manila Observatory, Integrated Environmental Strategies Philippines Project Report Metropolitan Manila – Focus
on the Transport Sector, 2005. 8 Japan Transport Cooperation Association, Japan Weather Association and Transport System Lab. of Nihon
University: Study for development of atmospheric environmental impact assessment methodologies on the extension of the subway blue line in Bangkok, Japan Bank for International Cooperation(JBIC), 2006
Roadmap for Transport Infrastructure Development for Metro Manila and Its Surrounding Areas (Region III & Region IV-A) FINAL REPORT Technical Report No. 1 Environment and Hazard Risk Reduction Analysis
2-38
where international funding support might be considered like in other countries. Nationally Appropriate Mitigation Actions (NAMAs) consist of concrete projects, policies, and/or programs that shift a technology or sector in a country into a low-carbon development trajectory. Reviewing past efforts to formulate NAMAs, policies and programs which can seek for credits and international funding will be identified.
2.86 Within the international climate negotiations under the United Nations Framework Convention on Climate Change (UNFCCC), parties agreed that reporting should be enhanced to include BURs from developing countries. The new reporting requirements adopted present a considerable challenge for many developing countries—many of which struggle to produce regular national communications to the convention—both in terms of report quality, as well as in terms of institutional arrangements, processes and regulations that must be in place to ensure continuous high-quality reporting into the future. The efforts to improve overall emission data will also contribute to strengthen capacities to generate solid reporting systems of the BURs, in addition to contributing to the improvement of air quality and traffic management.
2.87 Specific activities recommended are as follows:
(i) Environmental monitoring systems are enhanced in order to verify the air pollution contamination level in order to contribute to specific policy formulation.
Conduct capacity assessment on data analysis and environmental monitoring systems in public, private and academic sectors.
Capacity building programs are conducted with domestic and international resources.
(ii) Environmental, social and economic assessment on current and future policy measures are conducted in line with Measurement, Reporting and Verification (MRV). Scenario analysis is required for various policy measures.
Urban planning as well as transport sector's issues is jointly assessed in order to integrate the implementation plans.
Significant items such as air pollution concentration, fatal accidents which directly impact on residents are monitored, assessed and information disseminated comprehensively in Metro Manila and adjacent urban centers. Capability assessment under the current institutional set-ups is required.
Cost comparison with alternative measures is conducted considering the social costs such as resettlement and health impacts.
The best scenario towards Eco-cities are identified based on the studies and continuing discussions and integrated into the master plan which all concerned agencies will follow including national level agencies as well as MMDA and LGUs.
2.88 Transport infrastructure investment will contribute to decreased air pollution as well as to GHG reduction. By strengthening the monitoring capacity of stakeholders in the country, widespread benefits in terms of social, economic, environmental gains are shared among the citizens. Further, it will contribute to compliance with international obligation to monitor GHG emission and actions to mitigate it. The above recommendation should be implemented in a concrete manner, with specific action plans shared among the relevant government agencies and other stakeholders.
Roadmap for Transport Infrastructure Development for Metro Manila and Its Surrounding Areas (Region III & Region IV-A) FINAL REPORT
Technical Report No. 1 Environment and Hazard Risk Reduction Analysis
2-39
2.6 Water Pollution
2.89 Provision of potable water to households in Metro manila is carried out by two concessionaires (Manila Waters Company and Maynilad Water Services) under contract with the Manila Waterworks an Sewerage System (MWSS). Some 95% of the population of the metropolis has access to potable water service. In terms of sewerage and sanitation, however, only about 15% is connected to sewer systems. Wastewater from toilets, sinks, and waterways has only two places to go: poorly-maintained residential septic tanks, or Metro Manila’s rivers and sea. Metro Manila is currently experiencing a rising demand for potable water due to increase in population and urbanization which create serious concerns for water resource management. There are serious relevant diseases attributed to poor water quality, starting from diarrhea that induces malnutrition and mortality among young children of the poor families.
2.90 Manila Bay serves as a natural harbor and tourism spot, and has historical cultural and archaeological sites. However, the natural environment around the Manila Bay area is facing various threats from different factors: overpopulation, pollution discharges from land-based and sea-based sources, over-fishing, uncontrolled coastal development and habitat degradation. Their adverse effects on the ecosystem and on human health have resulted in increasing infrastructure and rehabilitation costs as well as health and social services expenditures.

Roadmap for Transport Infrastructure Development for Metro Manila and Its Surrounding Areas (Region III & Region IV-A) FINAL REPORT
Technical Report No. 1 Environment and Hazard Risk Reduction Analysis
3-1
3 DISASTER ANALYSIS BASED ON HAZARD MAPPING
3.1 Objectives
3.1 This section analyzes the hazards of various natural disasters in the study area, clarifies the distribution of risks, and identifies the high risk areas for natural disasters. The analyses utilize the database developed in the Study for Earthquake Impact Reduction for Metropolitan Manila in the Republic of the Philippines (MMEIRS) which was conducted by JICA from August 2002 to March 2004 with counterparts from MMDA and the Philippine Institute of Volcanology and Seismology (PHIVOLCS). Based on the database, hazards of several natural disasters such as earthquake, tsunami, flood, etc. will be investigated separately by hazard levels and expected damages and finally, a multi-hazard risk map will be prepared using these hazard maps. In addition, a socio-economic analysis with population distribution will be done to clarify the vulnerable areas to natural disasters and consequent damages. These can be utilized to identify the areas suitable and unsuitable for development.
3.2 The study area covers the GCR; however, the analyses are limited by the availability of necessary data and information. Therefore, Metro Manila has a first priority to be analyzed.
3.2 Target Disasters and Data Source
3.3 The target natural disasters focus on the three disasters which are expected to occur and bring heavy damages in Metro Manila, namely earthquake, tsunami and flood. The data for analyses must be updated by relevant agencies. However, if it is difficult, the existing data from previous reports are utilized. The data sources are shown below.
1) Earthquake
3.4 Metro Manila and GCR are in Luzon Island where numerous earthquake sources are located in and around it (see Figure 3.2.1). Among these faults, the Valley Fault System, which transects the study area, is considered to potentially cause the largest impact on the Metro Manila area should it generate a large earthquake. Many research studies indicate that active phases of the Valley Fault are approaching and the estimated magnitude will be around 7 or more on the Richter scale. Figure 3.2.2 shows the distribution of potential earthquake sources vis-a-vis the existing transport system. It shows that a fault is crossing the west side of Metro Manila and many roads are lying on the fault. It means that the roads have a risk of damage by earthquake hits.
3.5 To update the earthquake scenario, the Study Team contacted PHIVOLCS. However, they are still conducting an AusAID project entitled “The Risk Analysis Project for Greater Metro Manila Area (GMMA-RAP)” which analyzes flood, tropical typhoon, strong wind and earthquake and aims to update earthquake scenario and its potential damages. The results will be compiled in the final report in the middle of this year, therefore, they cannot provide any intermediate information. Thus, this Study utilizes the data of MMEIRS without any updates regarding the earthquake scenario and its damages and tsunami.
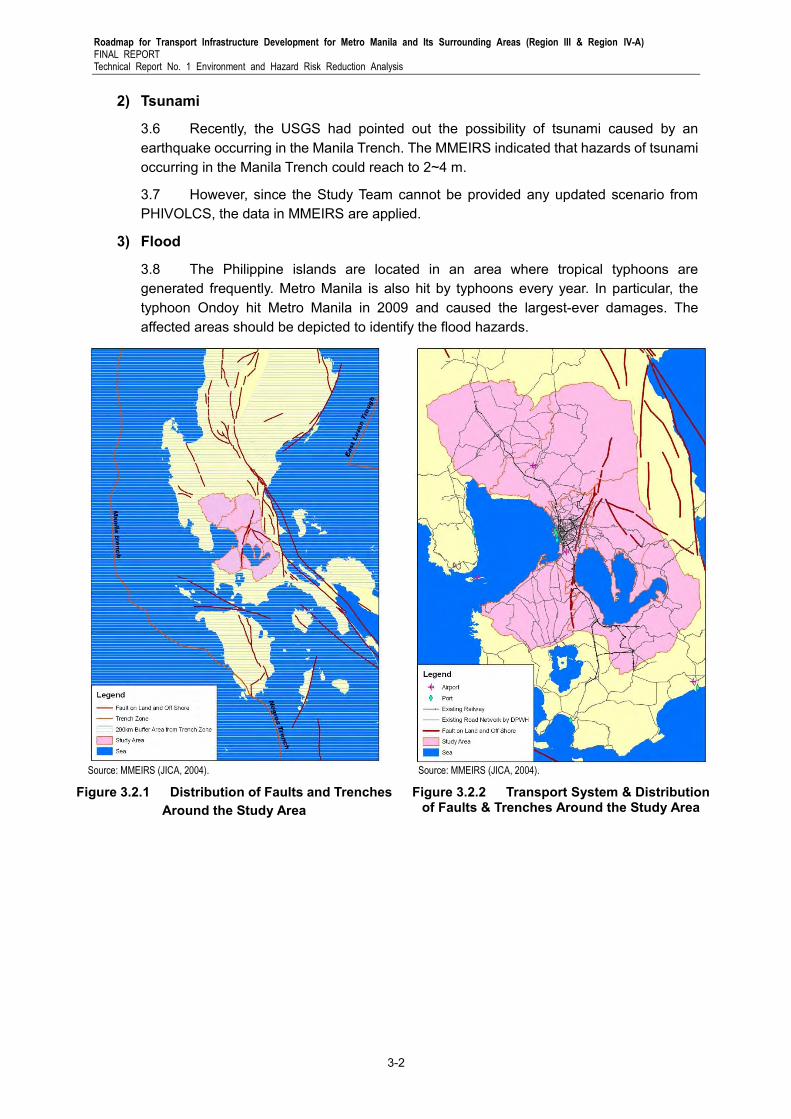
Roadmap for Transport Infrastructure Development for Metro Manila and Its Surrounding Areas (Region III & Region IV-A) FINAL REPORT Technical Report No. 1 Environment and Hazard Risk Reduction Analysis
3-2
2) Tsunami
3.6 Recently, the USGS had pointed out the possibility of tsunami caused by an earthquake occurring in the Manila Trench. The MMEIRS indicated that hazards of tsunami occurring in the Manila Trench could reach to 2~4 m.
3.7 However, since the Study Team cannot be provided any updated scenario from PHIVOLCS, the data in MMEIRS are applied.
3) Flood
3.8 The Philippine islands are located in an area where tropical typhoons are generated frequently. Metro Manila is also hit by typhoons every year. In particular, the typhoon Ondoy hit Metro Manila in 2009 and caused the largest-ever damages. The affected areas should be depicted to identify the flood hazards.
Source: MMEIRS (JICA, 2004).
Figure 3.2.1 Distribution of Faults and Trenches Around the Study Area
Source: MMEIRS (JICA, 2004).
Figure 3.2.2 Transport System & Distribution of Faults & Trenches Around the Study Area
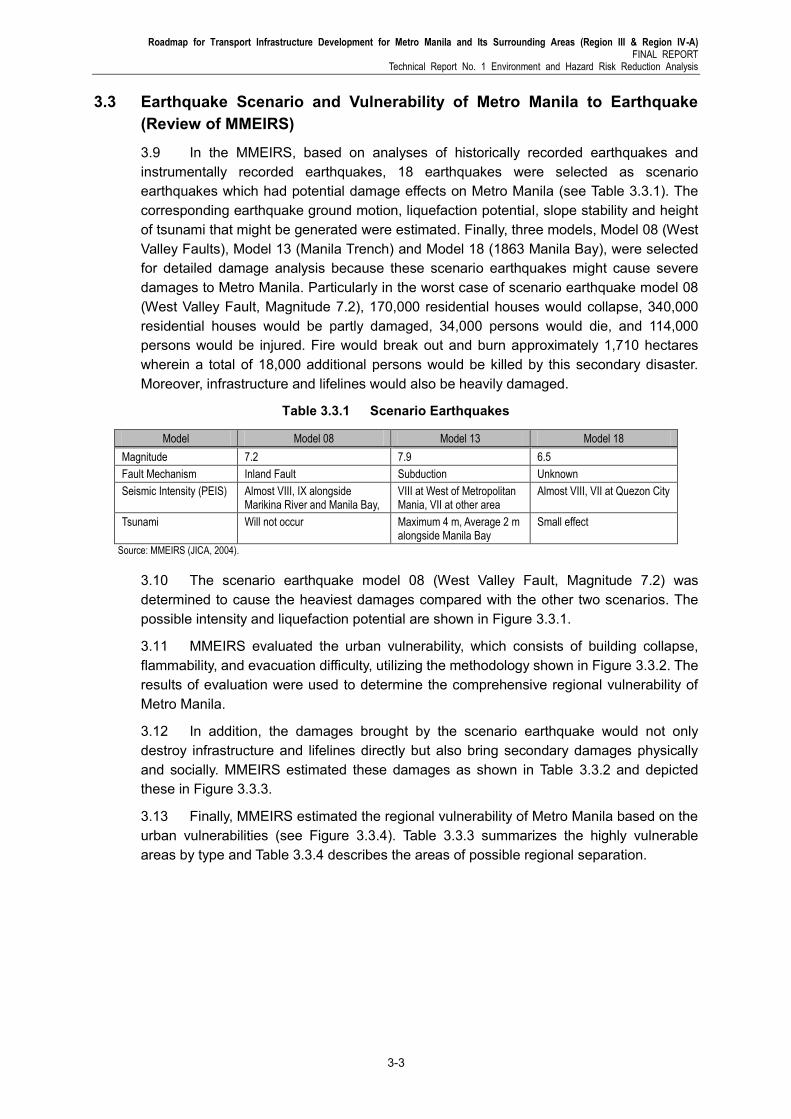
Roadmap for Transport Infrastructure Development for Metro Manila and Its Surrounding Areas (Region III & Region IV-A) FINAL REPORT
Technical Report No. 1 Environment and Hazard Risk Reduction Analysis
3-3
3.3 Earthquake Scenario and Vulnerability of Metro Manila to Earthquake (Review of MMEIRS)
3.9 In the MMEIRS, based on analyses of historically recorded earthquakes and instrumentally recorded earthquakes, 18 earthquakes were selected as scenario earthquakes which had potential damage effects on Metro Manila (see Table 3.3.1). The corresponding earthquake ground motion, liquefaction potential, slope stability and height of tsunami that might be generated were estimated. Finally, three models, Model 08 (West Valley Faults), Model 13 (Manila Trench) and Model 18 (1863 Manila Bay), were selected for detailed damage analysis because these scenario earthquakes might cause severe damages to Metro Manila. Particularly in the worst case of scenario earthquake model 08 (West Valley Fault, Magnitude 7.2), 170,000 residential houses would collapse, 340,000 residential houses would be partly damaged, 34,000 persons would die, and 114,000 persons would be injured. Fire would break out and burn approximately 1,710 hectares wherein a total of 18,000 additional persons would be killed by this secondary disaster. Moreover, infrastructure and lifelines would also be heavily damaged.
Table 3.3.1 Scenario Earthquakes
Model Model 08 Model 13 Model 18
Magnitude 7.2 7.9 6.5
Fault Mechanism Inland Fault Subduction Unknown
Seismic Intensity (PEIS) Almost VIII, IX alongside Marikina River and Manila Bay,
VIII at West of Metropolitan Mania, VII at other area
Almost VIII, VII at Quezon City
Tsunami Will not occur Maximum 4 m, Average 2 m alongside Manila Bay
Small effect
Source: MMEIRS (JICA, 2004).
3.10 The scenario earthquake model 08 (West Valley Fault, Magnitude 7.2) was determined to cause the heaviest damages compared with the other two scenarios. The possible intensity and liquefaction potential are shown in Figure 3.3.1.
3.11 MMEIRS evaluated the urban vulnerability, which consists of building collapse, flammability, and evacuation difficulty, utilizing the methodology shown in Figure 3.3.2. The results of evaluation were used to determine the comprehensive regional vulnerability of Metro Manila.
3.12 In addition, the damages brought by the scenario earthquake would not only destroy infrastructure and lifelines directly but also bring secondary damages physically and socially. MMEIRS estimated these damages as shown in Table 3.3.2 and depicted these in Figure 3.3.3.
3.13 Finally, MMEIRS estimated the regional vulnerability of Metro Manila based on the urban vulnerabilities (see Figure 3.3.4). Table 3.3.3 summarizes the highly vulnerable areas by type and Table 3.3.4 describes the areas of possible regional separation.
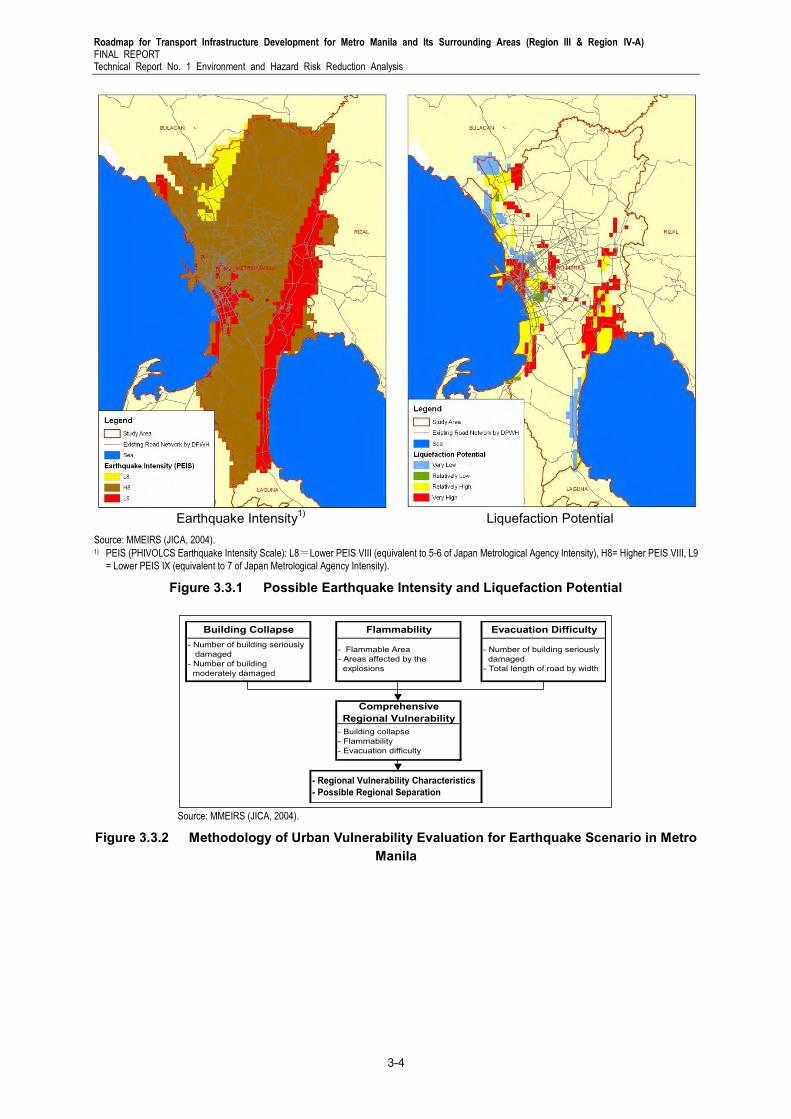
Roadmap for Transport Infrastructure Development for Metro Manila and Its Surrounding Areas (Region III & Region IV-A) FINAL REPORT Technical Report No. 1 Environment and Hazard Risk Reduction Analysis
3-4
Earthquake Intensity1)
Liquefaction Potential
Source: MMEIRS (JICA, 2004). 1) PEIS (PHIVOLCS Earthquake Intensity Scale): L8=Lower PEIS VIII (equivalent to 5-6 of Japan Metrological Agency Intensity), H8= Higher PEIS VIII, L9
= Lower PEIS IX (equivalent to 7 of Japan Metrological Agency Intensity).
Figure 3.3.1 Possible Earthquake Intensity and Liquefaction Potential
Source: MMEIRS (JICA, 2004).
Figure 3.3.2 Methodology of Urban Vulnerability Evaluation for Earthquake Scenario in Metro Manila
- Regional Vulnerability Characteristics
- Possible Regional Separation
Building Collapse- Number of building seriously damaged- Number of building moderately damaged
Flammability
- Flammable Area- Areas affected by the explosions
ComprehensiveRegional Vulnerability
- Building collapse- Flammability- Evacuation difficulty
Evacuation Difficulty
- Number of building seriously damaged- Total length of road by width
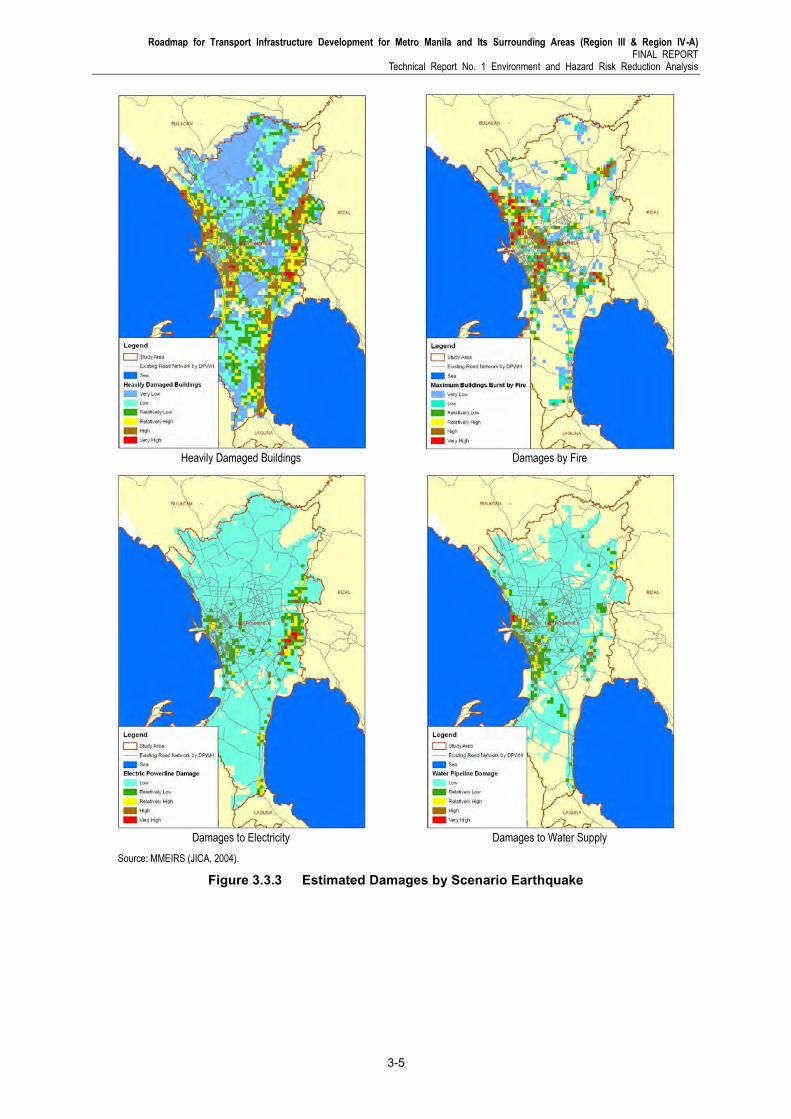
Roadmap for Transport Infrastructure Development for Metro Manila and Its Surrounding Areas (Region III & Region IV-A) FINAL REPORT
Technical Report No. 1 Environment and Hazard Risk Reduction Analysis
3-5
Heavily Damaged Buildings
Damages by Fire
Damages to Electricity
Damages to Water Supply
Source: MMEIRS (JICA, 2004).
Figure 3.3.3 Estimated Damages by Scenario Earthquake
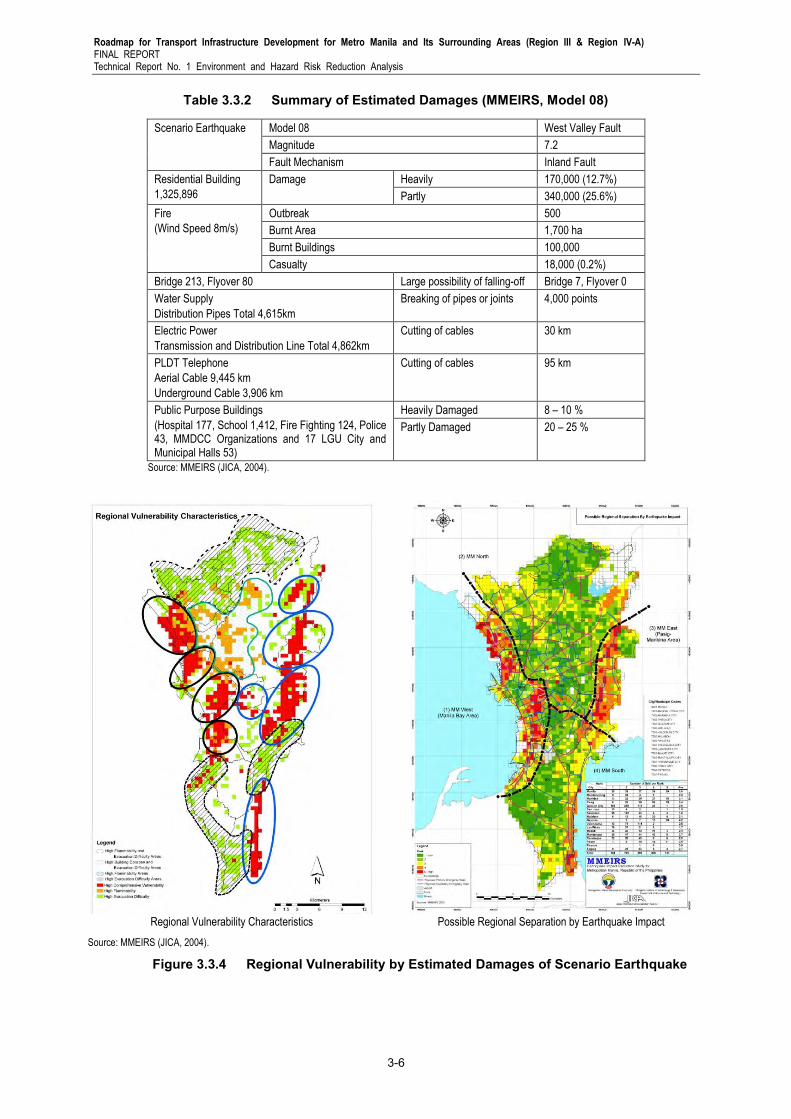
Roadmap for Transport Infrastructure Development for Metro Manila and Its Surrounding Areas (Region III & Region IV-A) FINAL REPORT Technical Report No. 1 Environment and Hazard Risk Reduction Analysis
3-6
Table 3.3.2 Summary of Estimated Damages (MMEIRS, Model 08)
Scenario Earthquake Model 08 West Valley Fault
Magnitude 7.2
Fault Mechanism Inland Fault
Residential Building
1,325,896
Damage Heavily 170,000 (12.7%)
Partly 340,000 (25.6%)
Fire
(Wind Speed 8m/s)
Outbreak 500
Burnt Area 1,700 ha
Burnt Buildings 100,000
Casualty 18,000 (0.2%)
Bridge 213, Flyover 80 Large possibility of falling-off Bridge 7, Flyover 0
Water Supply
Distribution Pipes Total 4,615km
Breaking of pipes or joints 4,000 points
Electric Power
Transmission and Distribution Line Total 4,862km
Cutting of cables 30 km
PLDT Telephone
Aerial Cable 9,445 km
Underground Cable 3,906 km
Cutting of cables 95 km
Public Purpose Buildings
(Hospital 177, School 1,412, Fire Fighting 124, Police 43, MMDCC Organizations and 17 LGU City and Municipal Halls 53)
Heavily Damaged 8 – 10 %
Partly Damaged 20 – 25 %
Source: MMEIRS (JICA, 2004).
Regional Vulnerability Characteristics
Possible Regional Separation by Earthquake Impact
Source: MMEIRS (JICA, 2004).
Figure 3.3.4 Regional Vulnerability by Estimated Damages of Scenario Earthquake
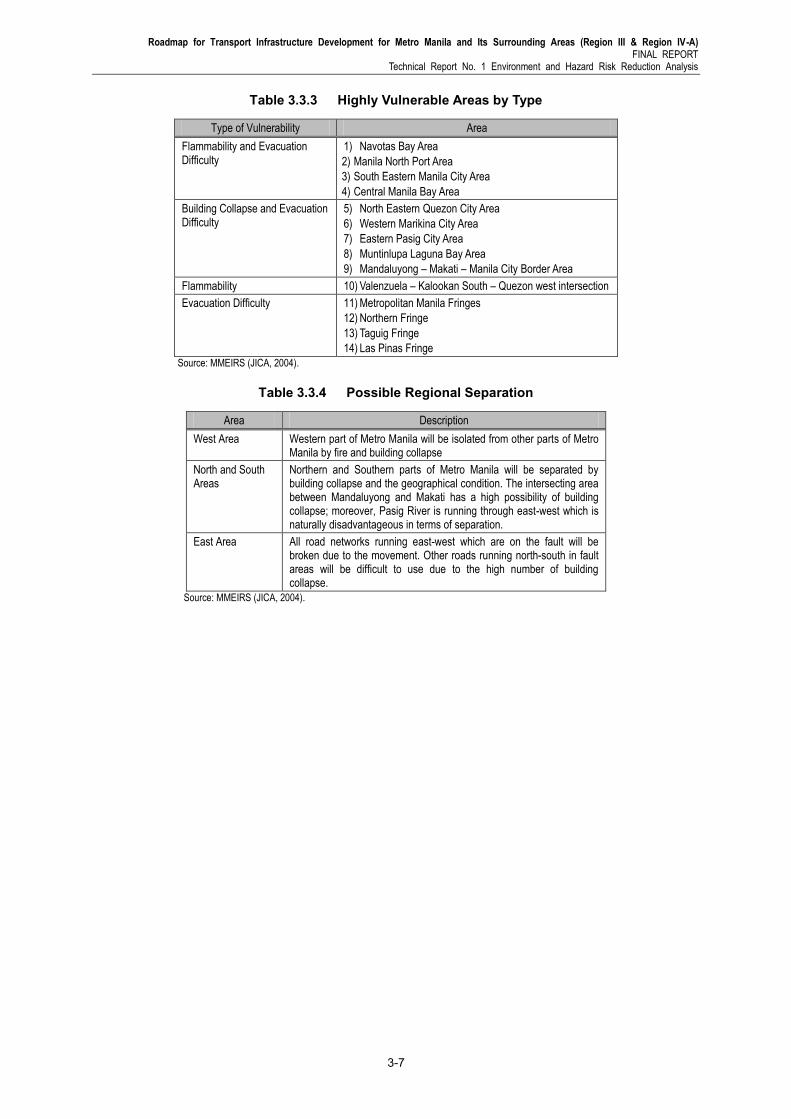
Roadmap for Transport Infrastructure Development for Metro Manila and Its Surrounding Areas (Region III & Region IV-A) FINAL REPORT
Technical Report No. 1 Environment and Hazard Risk Reduction Analysis
3-7
Table 3.3.3 Highly Vulnerable Areas by Type
Type of Vulnerability Area
Flammability and Evacuation Difficulty
1) Navotas Bay Area
2) Manila North Port Area
3) South Eastern Manila City Area
4) Central Manila Bay Area
Building Collapse and Evacuation Difficulty
5) North Eastern Quezon City Area
6) Western Marikina City Area
7) Eastern Pasig City Area
8) Muntinlupa Laguna Bay Area
9) Mandaluyong – Makati – Manila City Border Area
Flammability 10) Valenzuela – Kalookan South – Quezon west intersection
Evacuation Difficulty 11) Metropolitan Manila Fringes
12) Northern Fringe
13) Taguig Fringe
14) Las Pinas Fringe
Source: MMEIRS (JICA, 2004).
Table 3.3.4 Possible Regional Separation
Area Description
West Area Western part of Metro Manila will be isolated from other parts of Metro Manila by fire and building collapse
North and South Areas
Northern and Southern parts of Metro Manila will be separated by building collapse and the geographical condition. The intersecting area between Mandaluyong and Makati has a high possibility of building collapse; moreover, Pasig River is running through east-west which is naturally disadvantageous in terms of separation.
East Area All road networks running east-west which are on the fault will be broken due to the movement. Other roads running north-south in fault areas will be difficult to use due to the high number of building collapse.
Source: MMEIRS (JICA, 2004).
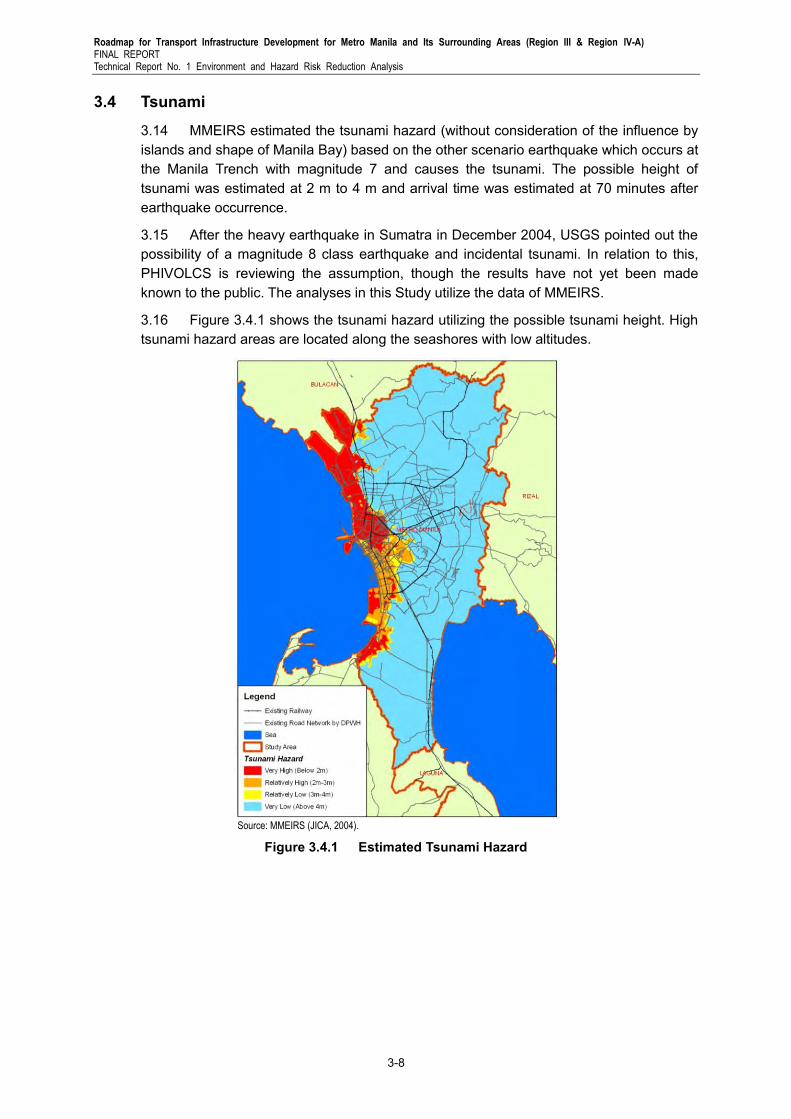
Roadmap for Transport Infrastructure Development for Metro Manila and Its Surrounding Areas (Region III & Region IV-A) FINAL REPORT Technical Report No. 1 Environment and Hazard Risk Reduction Analysis
3-8
3.4 Tsunami
3.14 MMEIRS estimated the tsunami hazard (without consideration of the influence by islands and shape of Manila Bay) based on the other scenario earthquake which occurs at the Manila Trench with magnitude 7 and causes the tsunami. The possible height of tsunami was estimated at 2 m to 4 m and arrival time was estimated at 70 minutes after earthquake occurrence.
3.15 After the heavy earthquake in Sumatra in December 2004, USGS pointed out the possibility of a magnitude 8 class earthquake and incidental tsunami. In relation to this, PHIVOLCS is reviewing the assumption, though the results have not yet been made known to the public. The analyses in this Study utilize the data of MMEIRS.
3.16 Figure 3.4.1 shows the tsunami hazard utilizing the possible tsunami height. High tsunami hazard areas are located along the seashores with low altitudes.
Source: MMEIRS (JICA, 2004).
Figure 3.4.1 Estimated Tsunami Hazard
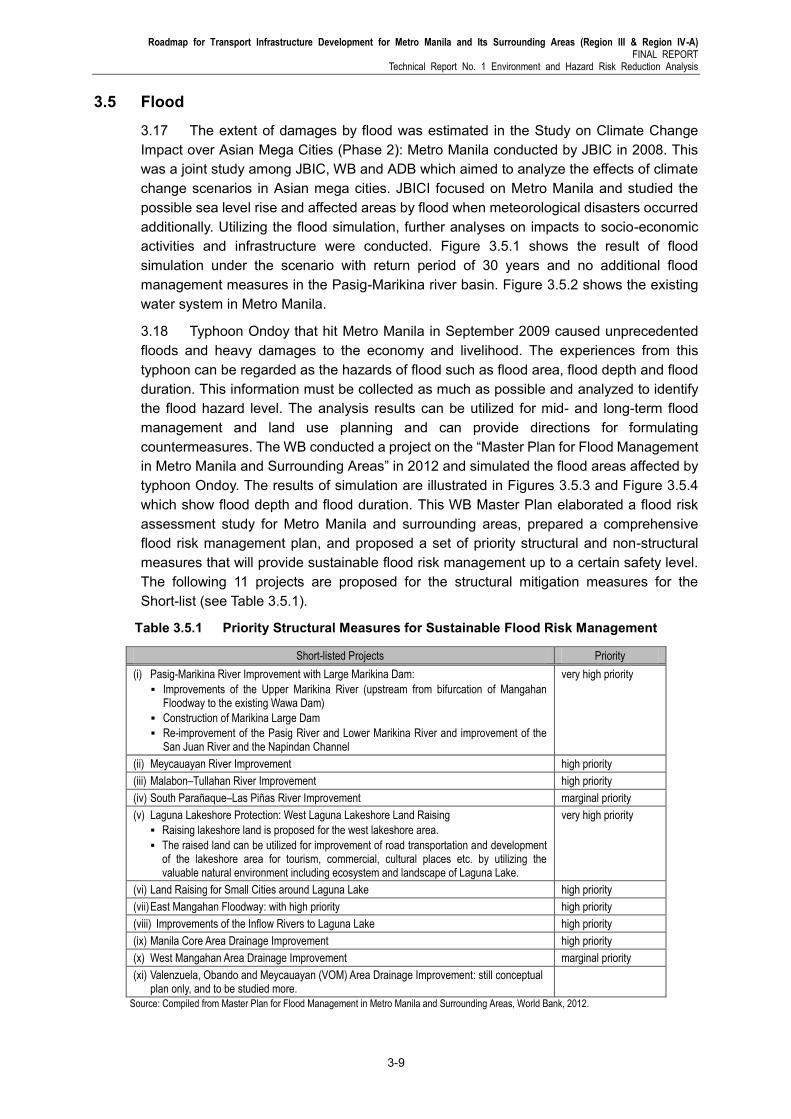
Roadmap for Transport Infrastructure Development for Metro Manila and Its Surrounding Areas (Region III & Region IV-A) FINAL REPORT
Technical Report No. 1 Environment and Hazard Risk Reduction Analysis
3-9
3.5 Flood
3.17 The extent of damages by flood was estimated in the Study on Climate Change Impact over Asian Mega Cities (Phase 2): Metro Manila conducted by JBIC in 2008. This was a joint study among JBIC, WB and ADB which aimed to analyze the effects of climate change scenarios in Asian mega cities. JBICI focused on Metro Manila and studied the possible sea level rise and affected areas by flood when meteorological disasters occurred additionally. Utilizing the flood simulation, further analyses on impacts to socio-economic activities and infrastructure were conducted. Figure 3.5.1 shows the result of flood simulation under the scenario with return period of 30 years and no additional flood management measures in the Pasig-Marikina river basin. Figure 3.5.2 shows the existing water system in Metro Manila.
3.18 Typhoon Ondoy that hit Metro Manila in September 2009 caused unprecedented floods and heavy damages to the economy and livelihood. The experiences from this typhoon can be regarded as the hazards of flood such as flood area, flood depth and flood duration. This information must be collected as much as possible and analyzed to identify the flood hazard level. The analysis results can be utilized for mid- and long-term flood management and land use planning and can provide directions for formulating countermeasures. The WB conducted a project on the “Master Plan for Flood Management in Metro Manila and Surrounding Areas” in 2012 and simulated the flood areas affected by typhoon Ondoy. The results of simulation are illustrated in Figures 3.5.3 and Figure 3.5.4 which show flood depth and flood duration. This WB Master Plan elaborated a flood risk assessment study for Metro Manila and surrounding areas, prepared a comprehensive flood risk management plan, and proposed a set of priority structural and non-structural measures that will provide sustainable flood risk management up to a certain safety level. The following 11 projects are proposed for the structural mitigation measures for the Short-list (see Table 3.5.1).
Table 3.5.1 Priority Structural Measures for Sustainable Flood Risk Management
Short-listed Projects Priority
(i) Pasig-Marikina River Improvement with Large Marikina Dam:
Improvements of the Upper Marikina River (upstream from bifurcation of Mangahan Floodway to the existing Wawa Dam)
Construction of Marikina Large Dam
Re-improvement of the Pasig River and Lower Marikina River and improvement of the San Juan River and the Napindan Channel
very high priority
(ii) Meycauayan River Improvement high priority
(iii) Malabon–Tullahan River Improvement high priority
(iv) South Parañaque–Las Piñas River Improvement marginal priority
(v) Laguna Lakeshore Protection: West Laguna Lakeshore Land Raising
Raising lakeshore land is proposed for the west lakeshore area.
The raised land can be utilized for improvement of road transportation and development of the lakeshore area for tourism, commercial, cultural places etc. by utilizing the valuable natural environment including ecosystem and landscape of Laguna Lake.
very high priority
(vi) Land Raising for Small Cities around Laguna Lake high priority
(vii) East Mangahan Floodway: with high priority high priority
(viii) Improvements of the Inflow Rivers to Laguna Lake high priority
(ix) Manila Core Area Drainage Improvement high priority
(x) West Mangahan Area Drainage Improvement marginal priority
(xi) Valenzuela, Obando and Meycauayan (VOM) Area Drainage Improvement: still conceptual plan only, and to be studied more.
Source: Compiled from Master Plan for Flood Management in Metro Manila and Surrounding Areas, World Bank, 2012.
Roadmap for Transport Infrastructure Development for Metro Manila and Its Surrounding Areas (Region III & Region IV-A) FINAL REPORT Technical Report No. 1 Environment and Hazard Risk Reduction Analysis
3-10
Source: The Study on Climate Change Impact over Asian Mega Cities (Phase 2): Metro Manila (JBIC, 2008).
Figure 3.5.1 Flood Hazard (Pasig-Marikina River Basin)
Source: MMEIRS (JICA, 2004).
Figure 3.5.2 Water System
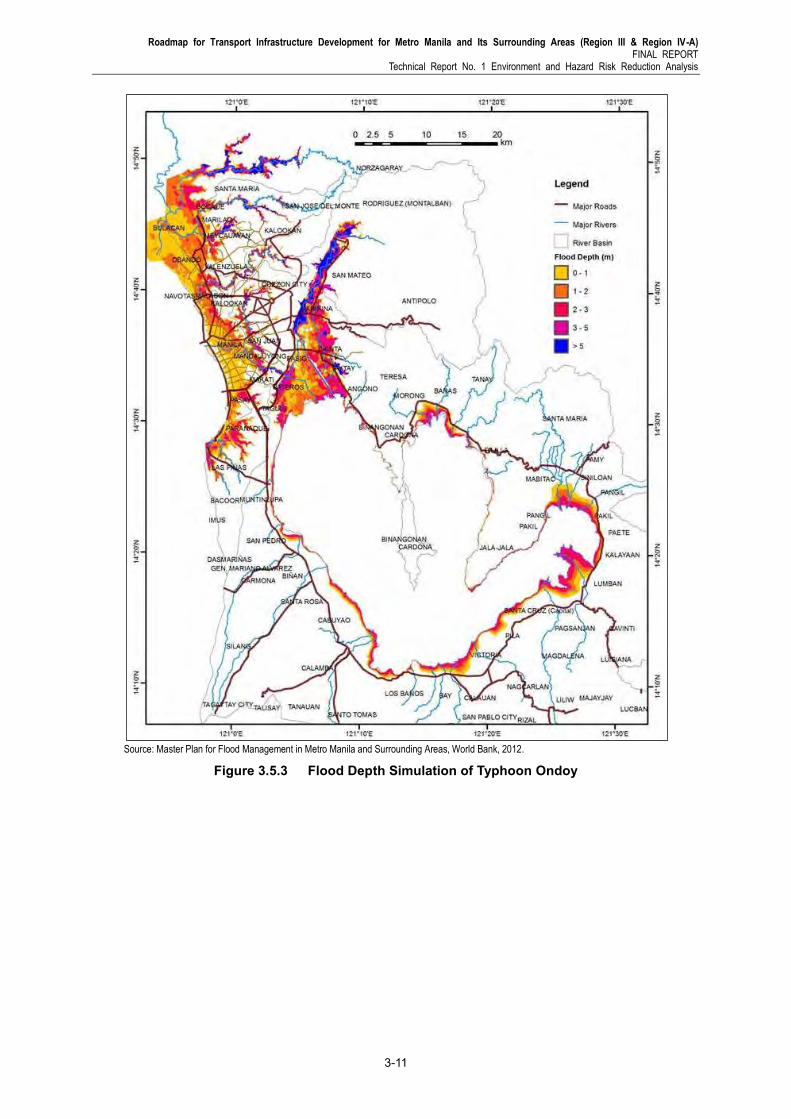
Roadmap for Transport Infrastructure Development for Metro Manila and Its Surrounding Areas (Region III & Region IV-A) FINAL REPORT
Technical Report No. 1 Environment and Hazard Risk Reduction Analysis
3-11
Source: Master Plan for Flood Management in Metro Manila and Surrounding Areas, World Bank, 2012.
Figure 3.5.3 Flood Depth Simulation of Typhoon Ondoy
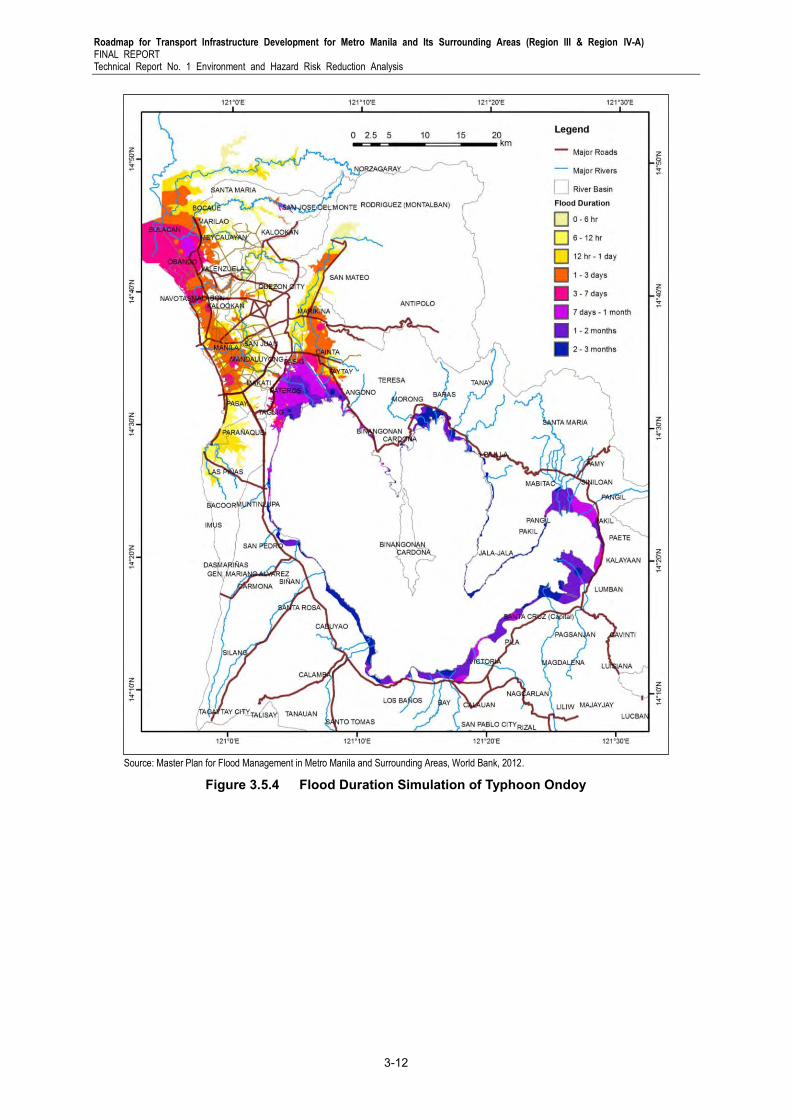
Roadmap for Transport Infrastructure Development for Metro Manila and Its Surrounding Areas (Region III & Region IV-A) FINAL REPORT Technical Report No. 1 Environment and Hazard Risk Reduction Analysis
3-12
Source: Master Plan for Flood Management in Metro Manila and Surrounding Areas, World Bank, 2012.
Figure 3.5.4 Flood Duration Simulation of Typhoon Ondoy
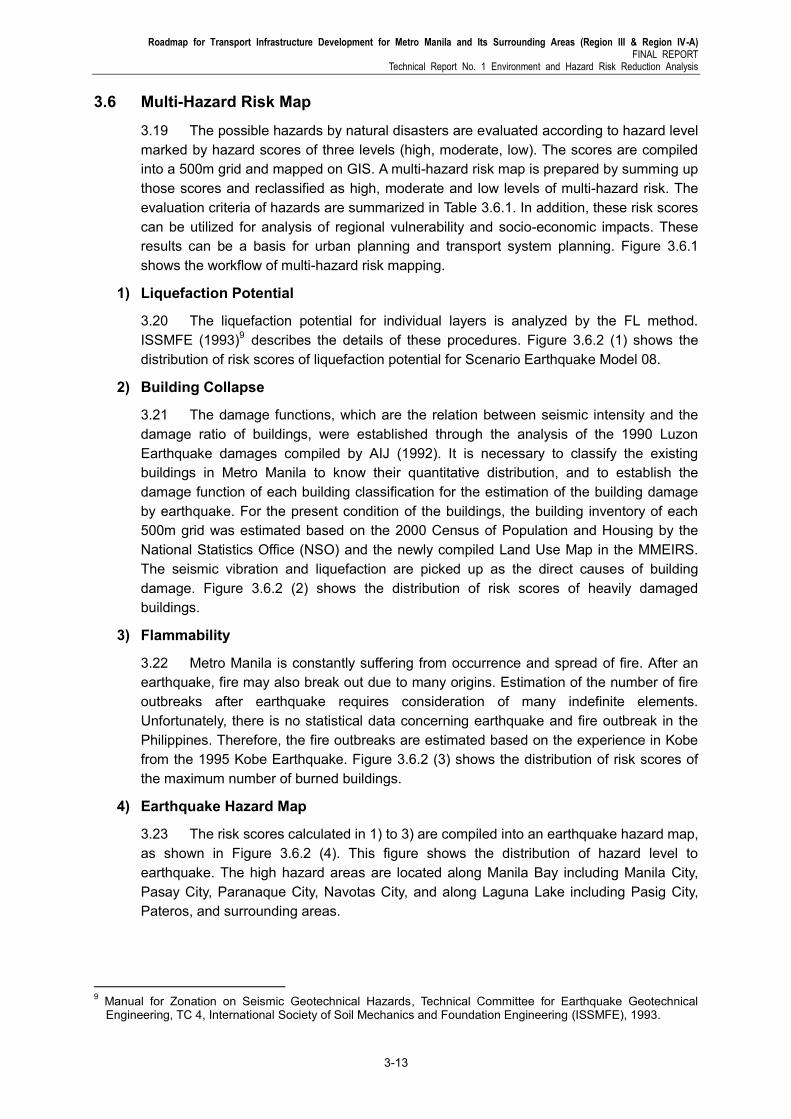
Roadmap for Transport Infrastructure Development for Metro Manila and Its Surrounding Areas (Region III & Region IV-A) FINAL REPORT
Technical Report No. 1 Environment and Hazard Risk Reduction Analysis
3-13
3.6 Multi-Hazard Risk Map
3.19 The possible hazards by natural disasters are evaluated according to hazard level marked by hazard scores of three levels (high, moderate, low). The scores are compiled into a 500m grid and mapped on GIS. A multi-hazard risk map is prepared by summing up those scores and reclassified as high, moderate and low levels of multi-hazard risk. The evaluation criteria of hazards are summarized in Table 3.6.1. In addition, these risk scores can be utilized for analysis of regional vulnerability and socio-economic impacts. These results can be a basis for urban planning and transport system planning. Figure 3.6.1 shows the workflow of multi-hazard risk mapping.
1) Liquefaction Potential
3.20 The liquefaction potential for individual layers is analyzed by the FL method. ISSMFE (1993)9 describes the details of these procedures. Figure 3.6.2 (1) shows the distribution of risk scores of liquefaction potential for Scenario Earthquake Model 08.
2) Building Collapse
3.21 The damage functions, which are the relation between seismic intensity and the damage ratio of buildings, were established through the analysis of the 1990 Luzon Earthquake damages compiled by AIJ (1992). It is necessary to classify the existing buildings in Metro Manila to know their quantitative distribution, and to establish the damage function of each building classification for the estimation of the building damage by earthquake. For the present condition of the buildings, the building inventory of each 500m grid was estimated based on the 2000 Census of Population and Housing by the National Statistics Office (NSO) and the newly compiled Land Use Map in the MMEIRS. The seismic vibration and liquefaction are picked up as the direct causes of building damage. Figure 3.6.2 (2) shows the distribution of risk scores of heavily damaged buildings.
3) Flammability
3.22 Metro Manila is constantly suffering from occurrence and spread of fire. After an earthquake, fire may also break out due to many origins. Estimation of the number of fire outbreaks after earthquake requires consideration of many indefinite elements. Unfortunately, there is no statistical data concerning earthquake and fire outbreak in the Philippines. Therefore, the fire outbreaks are estimated based on the experience in Kobe from the 1995 Kobe Earthquake. Figure 3.6.2 (3) shows the distribution of risk scores of the maximum number of burned buildings.
4) Earthquake Hazard Map
3.23 The risk scores calculated in 1) to 3) are compiled into an earthquake hazard map, as shown in Figure 3.6.2 (4). This figure shows the distribution of hazard level to earthquake. The high hazard areas are located along Manila Bay including Manila City, Pasay City, Paranaque City, Navotas City, and along Laguna Lake including Pasig City, Pateros, and surrounding areas.
9 Manual for Zonation on Seismic Geotechnical Hazards, Technical Committee for Earthquake Geotechnical
Engineering, TC 4, International Society of Soil Mechanics and Foundation Engineering (ISSMFE), 1993.
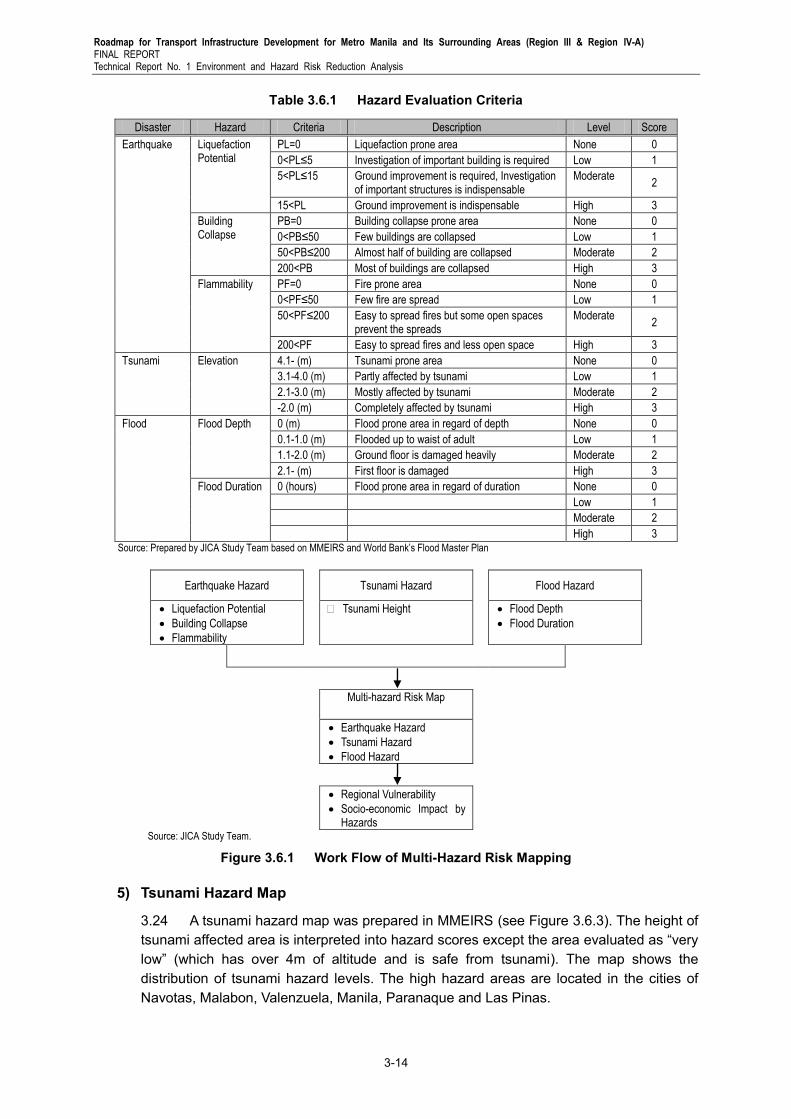
Roadmap for Transport Infrastructure Development for Metro Manila and Its Surrounding Areas (Region III & Region IV-A) FINAL REPORT Technical Report No. 1 Environment and Hazard Risk Reduction Analysis
3-14
Table 3.6.1 Hazard Evaluation Criteria
Disaster Hazard Criteria Description Level Score
Earthquake Liquefaction Potential
PL=0 Liquefaction prone area None 0
0<PL≤5 Investigation of important building is required Low 1
5<PL≤15 Ground improvement is required, Investigation of important structures is indispensable
Moderate 2
15<PL Ground improvement is indispensable High 3
Building Collapse
PB=0 Building collapse prone area None 0
0<PB≤50 Few buildings are collapsed Low 1
50<PB≤200 Almost half of building are collapsed Moderate 2
200<PB Most of buildings are collapsed High 3
Flammability PF=0 Fire prone area None 0
0<PF≤50 Few fire are spread Low 1
50<PF≤200 Easy to spread fires but some open spaces prevent the spreads
Moderate 2
200<PF Easy to spread fires and less open space High 3
Tsunami Elevation 4.1- (m) Tsunami prone area None 0
3.1-4.0 (m) Partly affected by tsunami Low 1
2.1-3.0 (m) Mostly affected by tsunami Moderate 2
-2.0 (m) Completely affected by tsunami High 3
Flood Flood Depth 0 (m) Flood prone area in regard of depth None 0
0.1-1.0 (m) Flooded up to waist of adult Low 1
1.1-2.0 (m) Ground floor is damaged heavily Moderate 2
2.1- (m) First floor is damaged High 3
Flood Duration 0 (hours) Flood prone area in regard of duration None 0
Low 1
Moderate 2
High 3 Source: Prepared by JICA Study Team based on MMEIRS and World Bank’s Flood Master Plan
Earthquake Hazard Tsunami Hazard Flood Hazard
Liquefaction Potential
Building Collapse
Flammability
Tsunami Height Flood Depth
Flood Duration
Multi-hazard Risk Map
Earthquake Hazard
Tsunami Hazard
Flood Hazard
Regional Vulnerability
Socio-economic Impact by Hazards
Source: JICA Study Team.
Figure 3.6.1 Work Flow of Multi-Hazard Risk Mapping
5) Tsunami Hazard Map
3.24 A tsunami hazard map was prepared in MMEIRS (see Figure 3.6.3). The height of tsunami affected area is interpreted into hazard scores except the area evaluated as “very low” (which has over 4m of altitude and is safe from tsunami). The map shows the distribution of tsunami hazard levels. The high hazard areas are located in the cities of Navotas, Malabon, Valenzuela, Manila, Paranaque and Las Pinas.
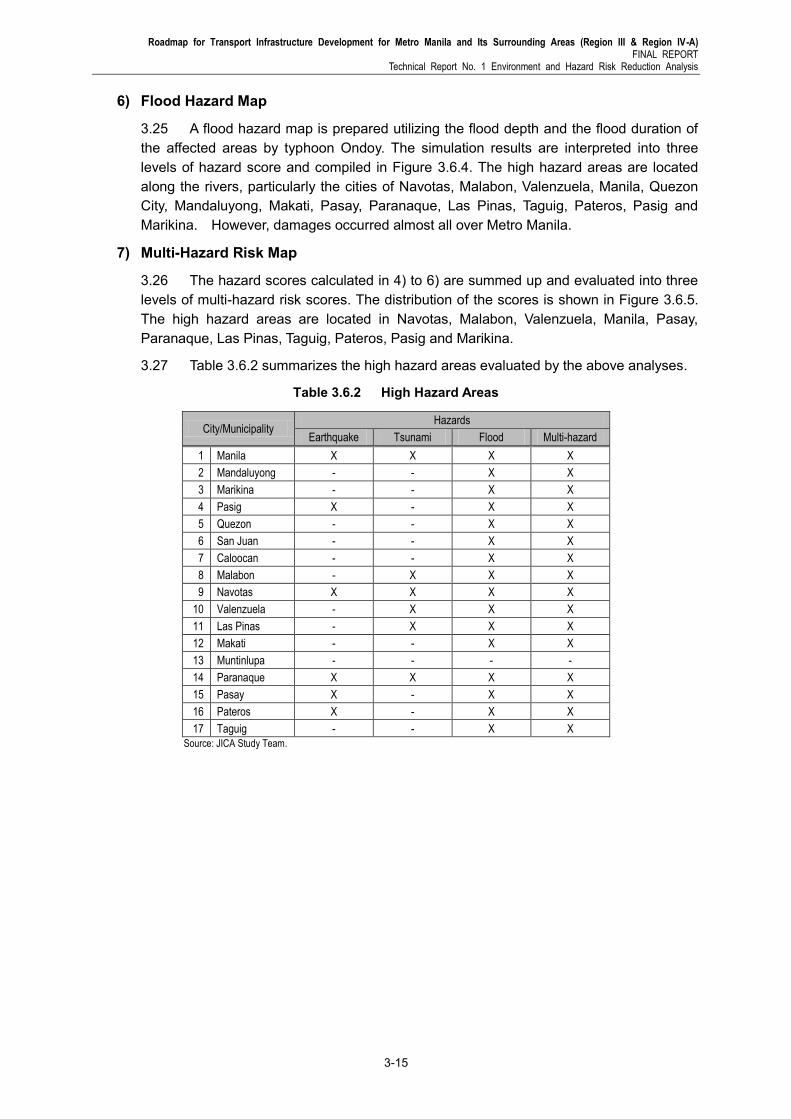
Roadmap for Transport Infrastructure Development for Metro Manila and Its Surrounding Areas (Region III & Region IV-A) FINAL REPORT
Technical Report No. 1 Environment and Hazard Risk Reduction Analysis
3-15
6) Flood Hazard Map
3.25 A flood hazard map is prepared utilizing the flood depth and the flood duration of the affected areas by typhoon Ondoy. The simulation results are interpreted into three levels of hazard score and compiled in Figure 3.6.4. The high hazard areas are located along the rivers, particularly the cities of Navotas, Malabon, Valenzuela, Manila, Quezon City, Mandaluyong, Makati, Pasay, Paranaque, Las Pinas, Taguig, Pateros, Pasig and Marikina. However, damages occurred almost all over Metro Manila.
7) Multi-Hazard Risk Map
3.26 The hazard scores calculated in 4) to 6) are summed up and evaluated into three levels of multi-hazard risk scores. The distribution of the scores is shown in Figure 3.6.5. The high hazard areas are located in Navotas, Malabon, Valenzuela, Manila, Pasay, Paranaque, Las Pinas, Taguig, Pateros, Pasig and Marikina.
3.27 Table 3.6.2 summarizes the high hazard areas evaluated by the above analyses.
Table 3.6.2 High Hazard Areas
City/Municipality Hazards
Earthquake Tsunami Flood Multi-hazard
1 Manila X X X X
2 Mandaluyong - - X X
3 Marikina - - X X
4 Pasig X - X X
5 Quezon - - X X
6 San Juan - - X X
7 Caloocan - - X X
8 Malabon - X X X
9 Navotas X X X X
10 Valenzuela - X X X
11 Las Pinas - X X X
12 Makati - - X X
13 Muntinlupa - - - -
14 Paranaque X X X X
15 Pasay X - X X
16 Pateros X - X X
17 Taguig - - X X
Source: JICA Study Team.
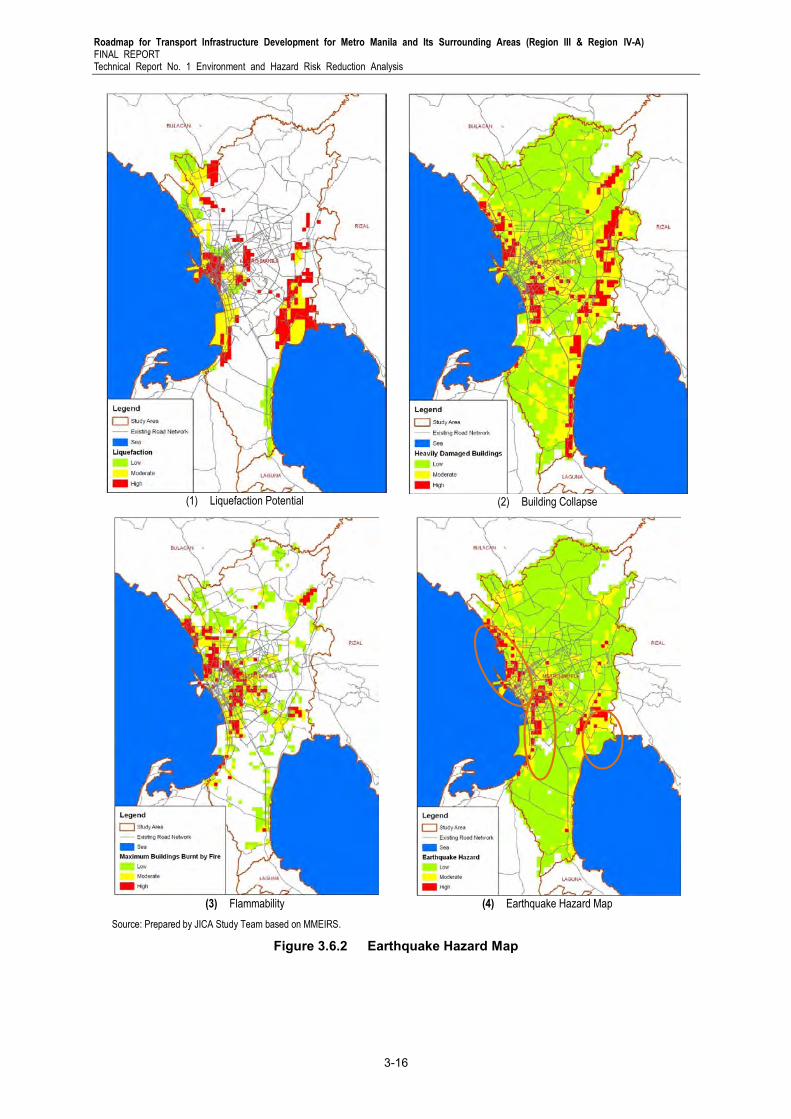
Roadmap for Transport Infrastructure Development for Metro Manila and Its Surrounding Areas (Region III & Region IV-A) FINAL REPORT Technical Report No. 1 Environment and Hazard Risk Reduction Analysis
3-16
(1) Liquefaction Potential
(2) Building Collapse
(3) Flammability
(4) Earthquake Hazard Map
Source: Prepared by JICA Study Team based on MMEIRS.
Figure 3.6.2 Earthquake Hazard Map
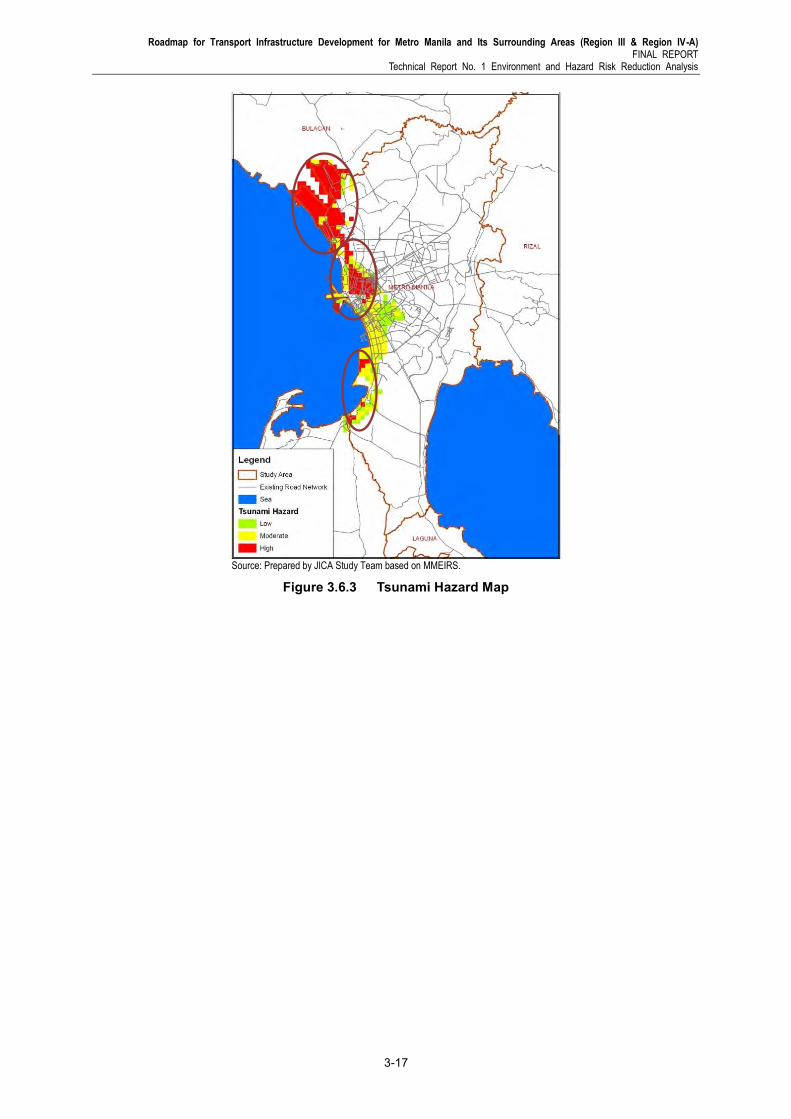
Roadmap for Transport Infrastructure Development for Metro Manila and Its Surrounding Areas (Region III & Region IV-A) FINAL REPORT
Technical Report No. 1 Environment and Hazard Risk Reduction Analysis
3-17
Source: Prepared by JICA Study Team based on MMEIRS.
Figure 3.6.3 Tsunami Hazard Map
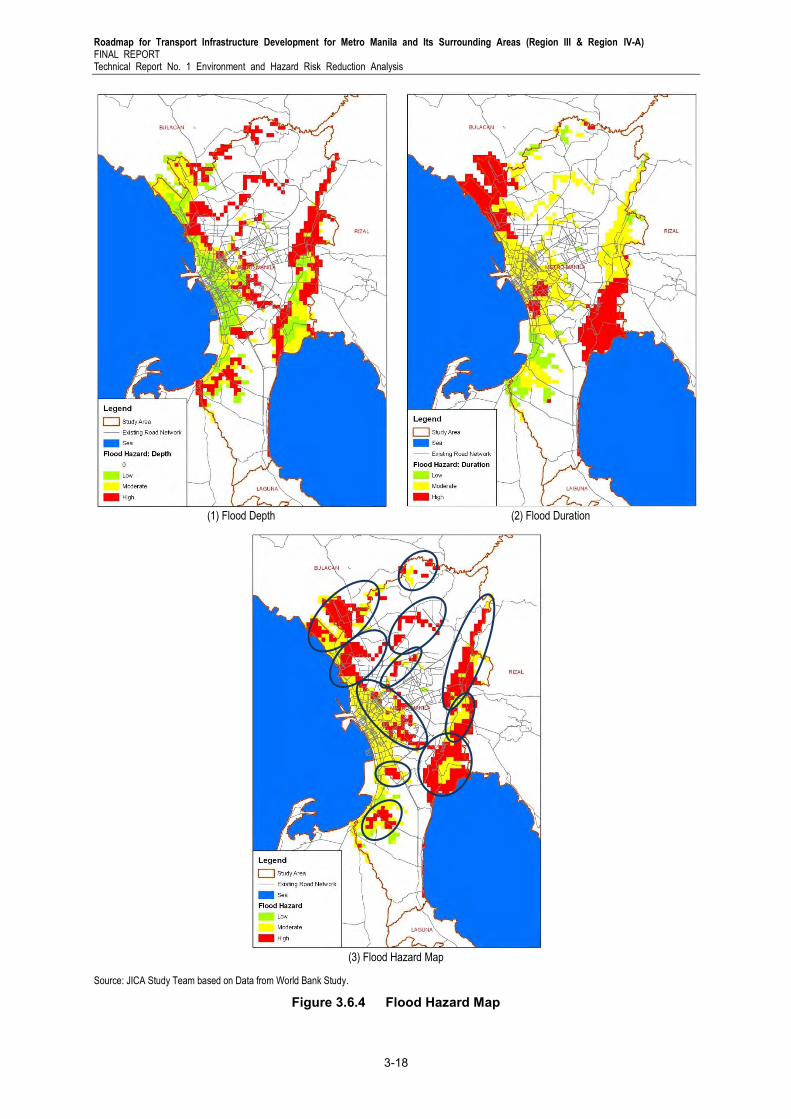
Roadmap for Transport Infrastructure Development for Metro Manila and Its Surrounding Areas (Region III & Region IV-A) FINAL REPORT Technical Report No. 1 Environment and Hazard Risk Reduction Analysis
3-18
(1) Flood Depth
(2) Flood Duration
(3) Flood Hazard Map
Source: JICA Study Team based on Data from World Bank Study.
Figure 3.6.4 Flood Hazard Map
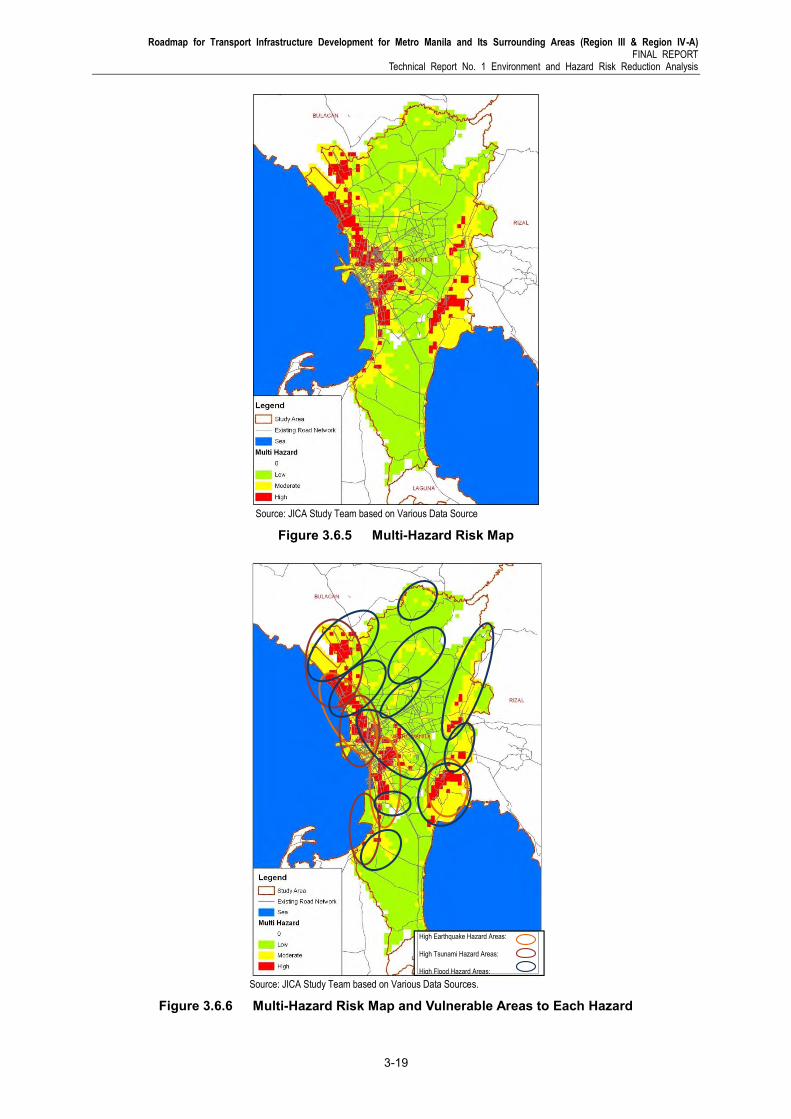
Roadmap for Transport Infrastructure Development for Metro Manila and Its Surrounding Areas (Region III & Region IV-A) FINAL REPORT
Technical Report No. 1 Environment and Hazard Risk Reduction Analysis
3-19
Source: JICA Study Team based on Various Data Source
Figure 3.6.5 Multi-Hazard Risk Map
Source: JICA Study Team based on Various Data Sources.
Figure 3.6.6 Multi-Hazard Risk Map and Vulnerable Areas to Each Hazard
High Earthquake Hazard Areas:
High Tsunami Hazard Areas:
High Flood Hazard Areas:
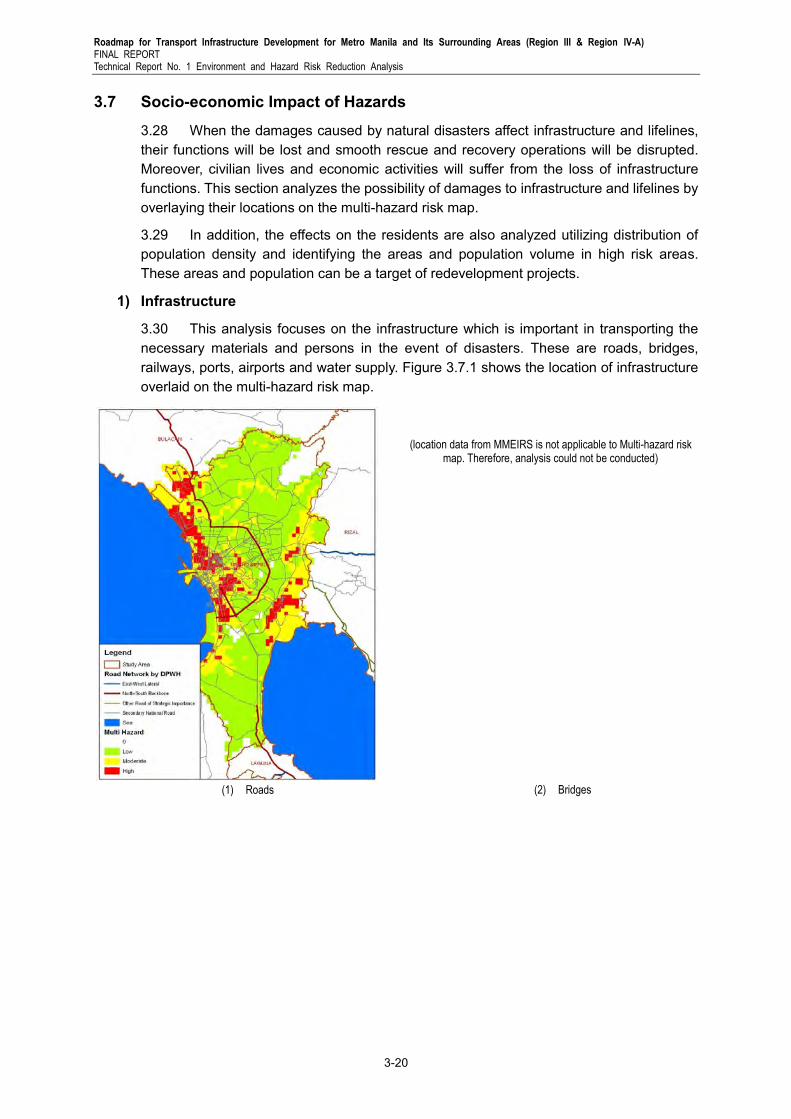
Roadmap for Transport Infrastructure Development for Metro Manila and Its Surrounding Areas (Region III & Region IV-A) FINAL REPORT Technical Report No. 1 Environment and Hazard Risk Reduction Analysis
3-20
3.7 Socio-economic Impact of Hazards
3.28 When the damages caused by natural disasters affect infrastructure and lifelines, their functions will be lost and smooth rescue and recovery operations will be disrupted. Moreover, civilian lives and economic activities will suffer from the loss of infrastructure functions. This section analyzes the possibility of damages to infrastructure and lifelines by overlaying their locations on the multi-hazard risk map.
3.29 In addition, the effects on the residents are also analyzed utilizing distribution of population density and identifying the areas and population volume in high risk areas. These areas and population can be a target of redevelopment projects.
1) Infrastructure
3.30 This analysis focuses on the infrastructure which is important in transporting the necessary materials and persons in the event of disasters. These are roads, bridges, railways, ports, airports and water supply. Figure 3.7.1 shows the location of infrastructure overlaid on the multi-hazard risk map.
(1) Roads
(location data from MMEIRS is not applicable to Multi-hazard risk map. Therefore, analysis could not be conducted)
(2) Bridges
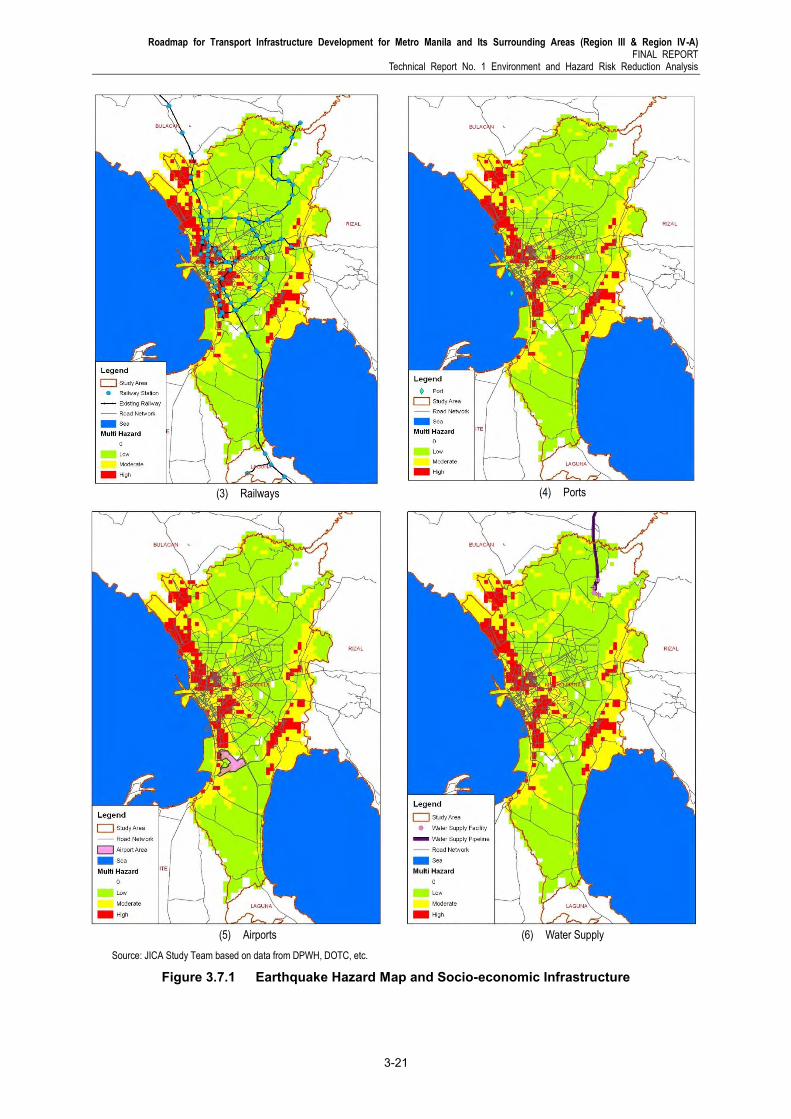
Roadmap for Transport Infrastructure Development for Metro Manila and Its Surrounding Areas (Region III & Region IV-A) FINAL REPORT
Technical Report No. 1 Environment and Hazard Risk Reduction Analysis
3-21
(3) Railways
(4) Ports
(5) Airports
(6) Water Supply
Source: JICA Study Team based on data from DPWH, DOTC, etc.
Figure 3.7.1 Earthquake Hazard Map and Socio-economic Infrastructure
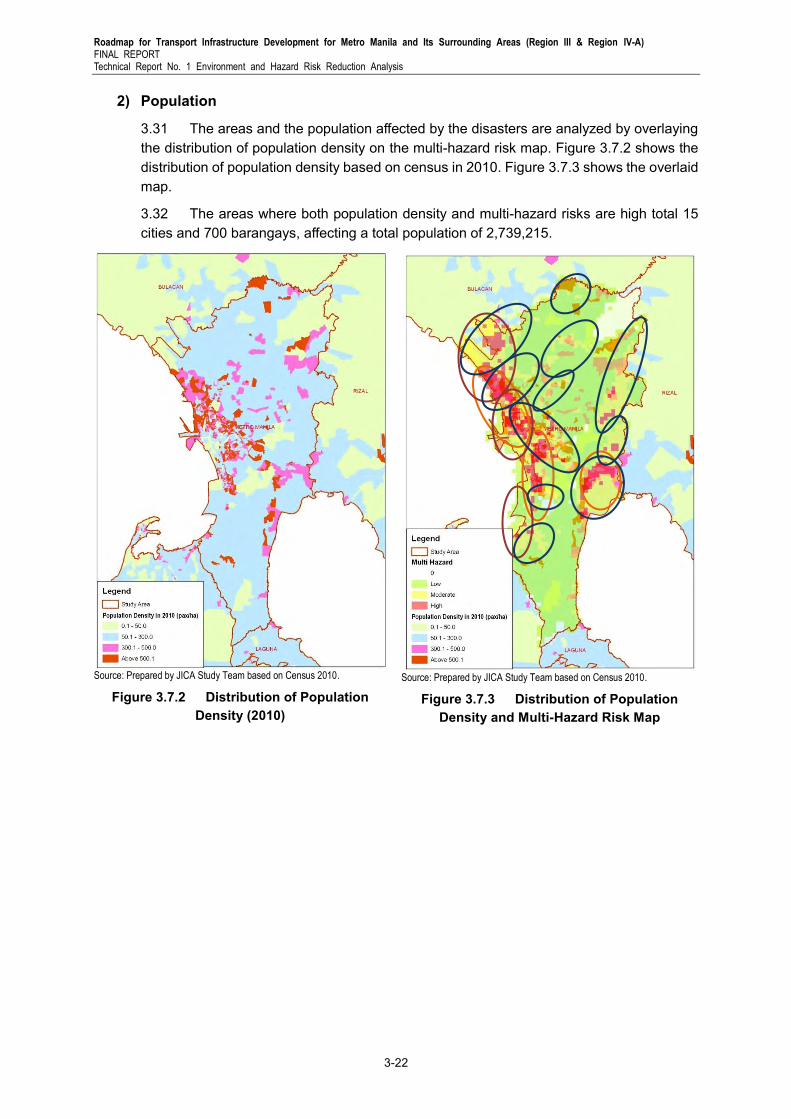
Roadmap for Transport Infrastructure Development for Metro Manila and Its Surrounding Areas (Region III & Region IV-A) FINAL REPORT Technical Report No. 1 Environment and Hazard Risk Reduction Analysis
3-22
2) Population
3.31 The areas and the population affected by the disasters are analyzed by overlaying the distribution of population density on the multi-hazard risk map. Figure 3.7.2 shows the distribution of population density based on census in 2010. Figure 3.7.3 shows the overlaid map.
3.32 The areas where both population density and multi-hazard risks are high total 15 cities and 700 barangays, affecting a total population of 2,739,215.
Source: Prepared by JICA Study Team based on Census 2010.
Figure 3.7.2 Distribution of Population Density (2010)
Source: Prepared by JICA Study Team based on Census 2010.
Figure 3.7.3 Distribution of Population Density and Multi-Hazard Risk Map
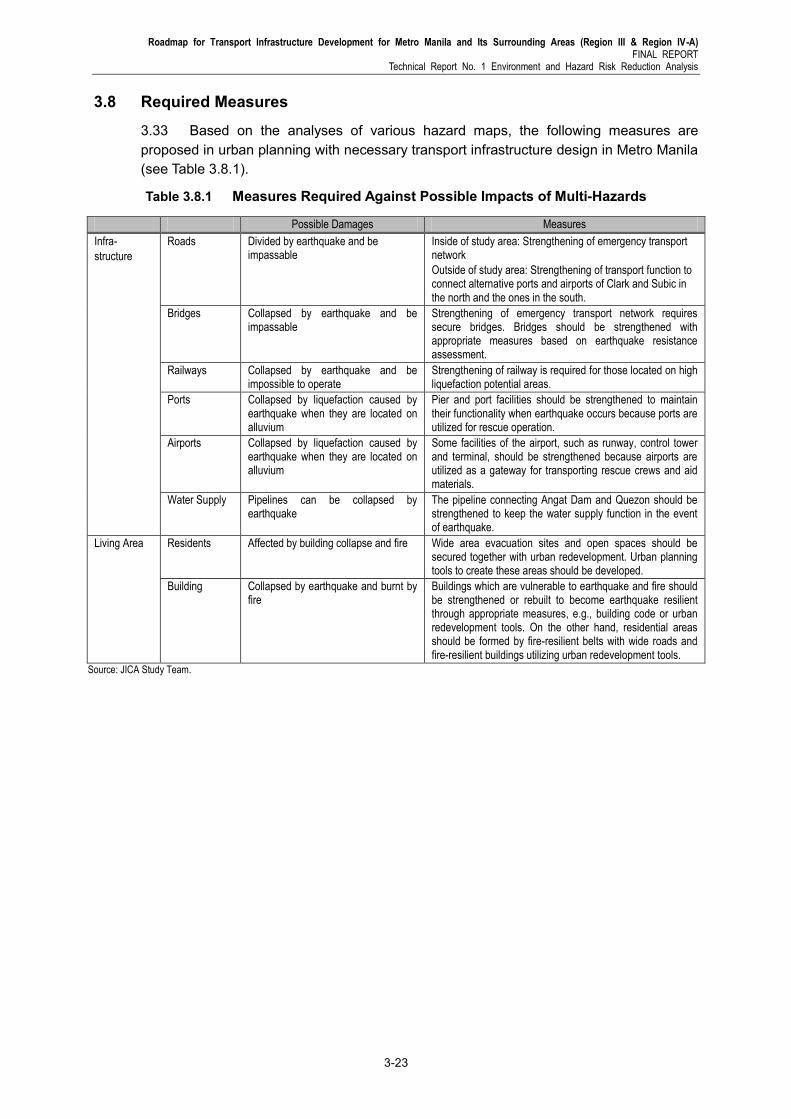
Roadmap for Transport Infrastructure Development for Metro Manila and Its Surrounding Areas (Region III & Region IV-A) FINAL REPORT
Technical Report No. 1 Environment and Hazard Risk Reduction Analysis
3-23
3.8 Required Measures
3.33 Based on the analyses of various hazard maps, the following measures are proposed in urban planning with necessary transport infrastructure design in Metro Manila (see Table 3.8.1).
Table 3.8.1 Measures Required Against Possible Impacts of Multi-Hazards
Possible Damages Measures
Infra-
structure
Roads Divided by earthquake and be impassable
Inside of study area: Strengthening of emergency transport network
Outside of study area: Strengthening of transport function to connect alternative ports and airports of Clark and Subic in the north and the ones in the south.
Bridges Collapsed by earthquake and be impassable
Strengthening of emergency transport network requires secure bridges. Bridges should be strengthened with appropriate measures based on earthquake resistance assessment.
Railways Collapsed by earthquake and be impossible to operate
Strengthening of railway is required for those located on high liquefaction potential areas.
Ports Collapsed by liquefaction caused by earthquake when they are located on alluvium
Pier and port facilities should be strengthened to maintain their functionality when earthquake occurs because ports are utilized for rescue operation.
Airports Collapsed by liquefaction caused by earthquake when they are located on alluvium
Some facilities of the airport, such as runway, control tower and terminal, should be strengthened because airports are utilized as a gateway for transporting rescue crews and aid materials.
Water Supply Pipelines can be collapsed by earthquake
The pipeline connecting Angat Dam and Quezon should be strengthened to keep the water supply function in the event of earthquake.
Living Area Residents Affected by building collapse and fire Wide area evacuation sites and open spaces should be secured together with urban redevelopment. Urban planning tools to create these areas should be developed.
Building Collapsed by earthquake and burnt by fire
Buildings which are vulnerable to earthquake and fire should be strengthened or rebuilt to become earthquake resilient through appropriate measures, e.g., building code or urban redevelopment tools. On the other hand, residential areas should be formed by fire-resilient belts with wide roads and fire-resilient buildings utilizing urban redevelopment tools.
Source: JICA Study Team.

Roadmap for Transport Infrastructure Development for Metro Manila and Its Surrounding Areas (Region III & Region IV-A) FINAL REPORT
Technical Report No. 1 Environment and Hazard Risk Reduction Analysis
4-1
4 ENVIRONMENTAL AND SOCIAL IMPACT ASSESSMENT OF THE SHORT-TERM PROGRAM (2014–2016)
4.1 Environmental Impact Assessment and Strategic Environmental Assessment 4.1 The environmental impact assessment (EIA) system is the process of predicting the likely environmental consequences of implementing a project and designing appropriate mitigating and enhancement measures as an input to decision making. The EIA is conducted by a project proponent or an expert group commissioned by the proponent. In the Philippines, the results of the EIA are documented and submitted to the DENR’s EMB for review as the major basis for decisions on Environmental Compliance Certificate (ECC) applications. The contents of the ECC are: (i) Scope and limitations of approved activities/components; (ii) Conditions to ensure compliance with Environmental Management Plans (EMPs); and (iii) Recommendations to other agencies. If it is a denial letter, it specifies the basis for the decision. ECCs of projects not implemented within five years from its date of issuance are deemed expired.
4.2 The Philippine EIA System is regarded as well-established including a mandate, administration, procedure and guidelines.10 “DAO No. 30 of 2003 Implementing Rules and Regulations (IRR) for the Philippine Environmental Impact Statement (EIS) System” was issued in 2003, then the “Revised Procedural Manual for DAO 30/2003” was issued in 2007. Mainstreaming of environment and social issues in the development project level started under these mandates and manual in early the 2000s.
4.3 There are, however, a number of weaknesses that prevent the effective implementation of the EIA. For one, the EIS system is viewed by many stakeholders as too
stringent and obstructive to investment. Moreover, the lack of qualified staff, equipment, and accredited laboratories to analyze the samples is always an issue when preparing the EIA. Underfunded environmental management programs lacked baseline environmental data, which is also a great barrier for proponents when there’s a need to prepare a sound EIA based on reliable data and analysis. This situation exacerbates the costs of commissioning EIAs for large infrastructure projects and has become one of the reasons of implementation delays.
4.4 The limited scope and function of the EIA system and technical weaknesses have resulted in difficulties in meeting new challenges. There are many issues that can only be addressed at the policy and strategic levels. This study, the transport sector roadmap for the sustainable development of the Greater Capital Region, is a framework for the integrated development of the transport system in Metro Manila, Regions III and IV-A, and it has adopted an analytical approach for mainstreaming economic, environmental, and social issues in decision making and implementation processes at the strategic level.
4.5 Taking the current concerns of environmental and social issues into consideration, this section elaborates the cumulative and indirectly induced environmental effects of the planned roadmap into the proposed Short-term Program (2014-2016)11.
10 Environmental Impact Assessment Regulations and Strategic Environmental Assessment Requirements, The
World Bank, April 2006. 11 Refer to Chapters 3 and 4 of this study’s Main Report for details of the Short-term Program (2014-2016).
Roadmap for Transport Infrastructure Development for Metro Manila and Its Surrounding Areas (Region III & Region IV-A) FINAL REPORT Technical Report No. 1 Environment and Hazard Risk Reduction Analysis
4-2
4.2 Current Status of EIA Implementation in the Proposed Short-Term Program
4.6 In recognition of the possible impacts of infrastructure projects to the environment, the DPWH through Memorandum Order dated 16 January 1996 organized a specialized EIA group as part of the program on strengthening the EIA capability of the department’s Planning Service staff. A total of 20 individuals from the Planning Division and other project management offices (PMOs) of the DPWH were organized and detailed at the department’s Environmental Impact Assessment Project Office (EIAPO).
4.7 In 1999, Department Order 220 entitled “Strengthening of EIAPO,” was issued in order to give the EIA team adequate capability to ensure that all DPWH projects are screened according to the DENR requirements and that necessary environmental assessment, mitigation measures, and compensation are carried out and monitored. The EIAPO as the environmental arm of the department projects environmental and social support for foreign and locally funded projects being implemented by project proponents of the department (i.e., bureaus, PMOs, and regional/district offices). In particular, the EIAPO is responsible for overseeing EIA preparation, and once approved, the application of the DPWH environment policy. The role of the EIAPO covers project planning, preparation, design, implementation, monitoring, and post implementation evaluation.
4.8 The functions of the EIAPO are as follows:
(i) Assess environmental and social impact, and land acquisition; (ii) Prepare relevant reports such as Initial Environmental Examinations (IEEs),
Environmental Impact Statements (EISs), Environmental Management Plans (EMPs), Resettlement Action Plans (RAPs), and other necessary documents;
(iii) Facilitate consultation and information dissemination to project-affected people and other relevant stakeholders;
(iv) Conduct environmental monitoring, monitor RAP implementation, and conduct post implementation evaluation;
(v) Provide guidance to regional and district level DPWH staff and local authorities in carrying out the above studies, preparation of documents, and RAP implementation;
(vi) Provide training at regional, district, and local level for consultation/participation, RAP implementation, environmental management planning, environmental monitoring, EIA tools and other new techniques;
(vii) Maintain and update the existing data bank and geographical information system (GIS); and
(viii) Coordinate environmental concerns with other DPWH offices, government agencies, local government units, and non-governmental organizations.
4.9 In 2004, Department Order 58 was issued to rename the EIAPO to the Environmental and Social Services Office (ESSO).
4.10 In the past decade or so, ESSO has been the recipient of continuous capacity development support from the World Bank, ADB, and JICA. These programs have made significant contributions in the preparation of the “Social and Environmental Management System Operation Manual 2003”.
4.11 To date, ESSO has 11 staff and with the DPWH rationalization plan, ESSO will become organic to the department with 25 permanent personnel to undertake the EIA and
Roadmap for Transport Infrastructure Development for Metro Manila and Its Surrounding Areas (Region III & Region IV-A) FINAL REPORT
Technical Report No. 1 Environment and Hazard Risk Reduction Analysis
4-3
RAP; promote gender and development (GAD) and climate change adaptation; and implement the National Sewerage and Septage Management Program (NSSMP).
4.12 It is apparent that ESSO specializes in RAPs and covers the right-of-way and social aspects of a project. However, the lack of tools to conduct air and water quality sampling, as well as noise and vibration measurements, together with a shortage of trained personnel to do the job, makes ESSO incapable of assessing these physical environment components. As a provider of vital transport infrastructure (i.e., roads and bridges), it would be a constructive option for the DPWH to consider procuring tools and enhancing the expertise at ESSO to enable them to measure levels of pollution as by-products of road construction and operation.
4.13 ESSO also conducts capacity development for PMO engineers of various projects to familiarize them with environmental and social impact assessment. ESSO has capacity to prepare environment reports at the IEE level using secondary data/information from other government agencies.
4.14 Most of the FS reports were made by consigned consultants and ESSO has no access to these reports. These consultants do not furnish ESSO with copies of EIA reports for the latter’s review because ESSO is not the approving body and to have ESSO review the reports will only cause further delay in the processing of ECCs. Accessing these reports remains a prerogative of the consultants and or the agencies/proponents of projects until reports are finalized or the ECCs have been issued. The Project Management Office for Feasibility Study (PMO-FS) has trained regional offices and other PMOs under the DPWH in formulating FS reports. At present, the PMO-FS reviews reports produced by regional offices and assists or advises on traffic surveys, traffic analysis, economic evaluation, etc. upon request.
4.15 The general tendency of DPWH offices (regional and PMOs) is to consign consultants to prepare comprehensive environmental assessment reports (EIS, programmatic IEEs or EIS) depending on the categories required in the EIS system. There is no efficient databank of all EIA reports their respective offices have generated. Therefore, it is hard to track down a project status in one office.
4.16 Meanwhile, the DOTC does not have internal offices to provide environmental and social services. All procedures are done by project proponents who usually outsource the EIAs and RAPs and submit necessary documents to the EMB. Ports and airports are financed by the private entities and there are no requirements for NEDA Board approval of such reports.
4.17 Projects under this study’s Short-Term Program (2014-2016) are already committed for implementation and are in various stages of preparing EIAs, submitting EIAs, or awaiting ECC accreditation. The respective statuses of these projects are summarized in Table 4.2.1. However, the EIA and RAP status of some projects was not tracked down because of the conditions explained above. The overall Short-Term Program should, ideally, be collectively assessed to establish the overall degree or magnitude of the individual and collective impact of projects to the environment under the Philippine EIA system.
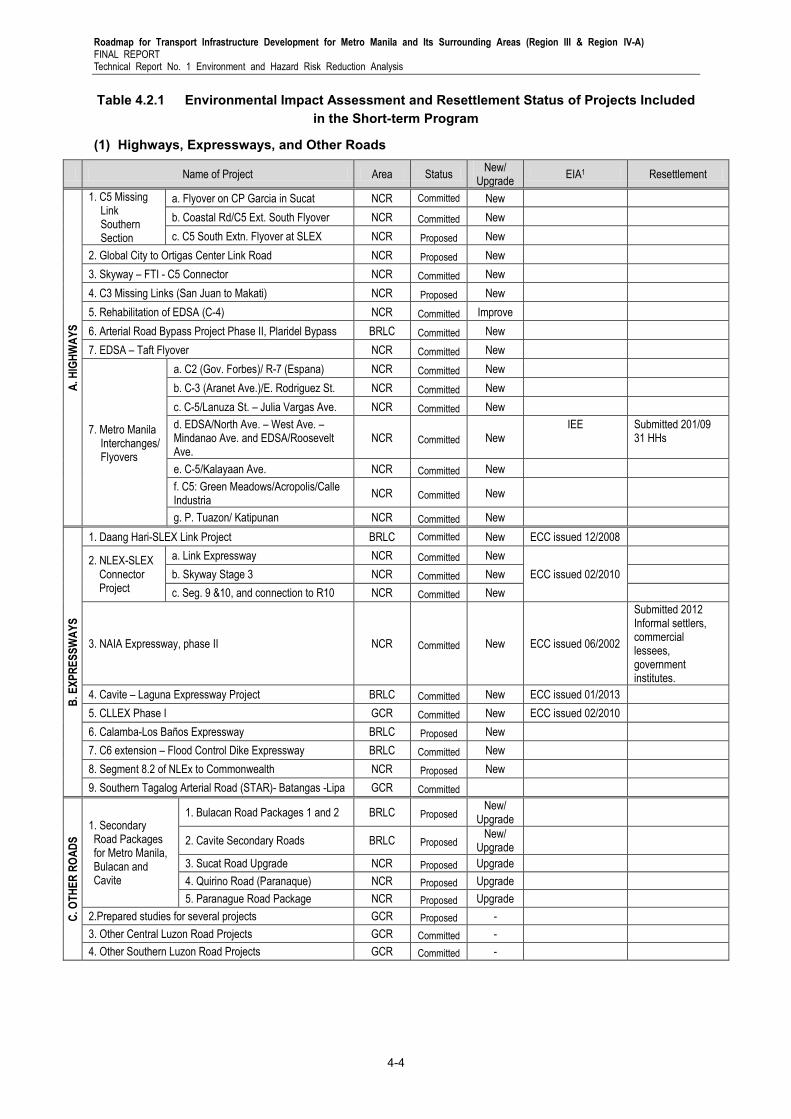
Roadmap for Transport Infrastructure Development for Metro Manila and Its Surrounding Areas (Region III & Region IV-A) FINAL REPORT Technical Report No. 1 Environment and Hazard Risk Reduction Analysis
4-4
Table 4.2.1 Environmental Impact Assessment and Resettlement Status of Projects Included in the Short-term Program
(1) Highways, Expressways, and Other Roads
Name of Project Area Status New/
Upgrade EIA1 Resettlement
A. H
IGH
WA
YS
1. C5 Missing Link Southern Section
a. Flyover on CP Garcia in Sucat NCR Committed New
b. Coastal Rd/C5 Ext. South Flyover NCR Committed New
c. C5 South Extn. Flyover at SLEX NCR Proposed New
2. Global City to Ortigas Center Link Road NCR Proposed New
3. Skyway – FTI - C5 Connector NCR Committed New
4. C3 Missing Links (San Juan to Makati) NCR Proposed New
5. Rehabilitation of EDSA (C-4) NCR Committed Improve
6. Arterial Road Bypass Project Phase II, Plaridel Bypass BRLC Committed New
7. EDSA – Taft Flyover NCR Committed New
7. Metro Manila Interchanges/ Flyovers
a. C2 (Gov. Forbes)/ R-7 (Espana) NCR Committed New
b. C-3 (Aranet Ave.)/E. Rodriguez St. NCR Committed New
c. C-5/Lanuza St. – Julia Vargas Ave. NCR Committed New
d. EDSA/North Ave. – West Ave. – Mindanao Ave. and EDSA/Roosevelt Ave.
NCR Committed New IEE Submitted 201/09
31 HHs
e. C-5/Kalayaan Ave. NCR Committed New
f. C5: Green Meadows/Acropolis/Calle Industria
NCR Committed New
g. P. Tuazon/ Katipunan NCR Committed New
B. E
XP
RE
SS
WA
YS
1. Daang Hari-SLEX Link Project BRLC Committed New ECC issued 12/2008
2. NLEX-SLEX Connector Project
a. Link Expressway NCR Committed New
ECC issued 02/2010
b. Skyway Stage 3 NCR Committed New
c. Seg. 9 &10, and connection to R10 NCR Committed New
3. NAIA Expressway, phase II NCR Committed New ECC issued 06/2002
Submitted 2012 Informal settlers, commercial lessees, government institutes.
4. Cavite – Laguna Expressway Project BRLC Committed New ECC issued 01/2013
5. CLLEX Phase I GCR Committed New ECC issued 02/2010
6. Calamba-Los Baños Expressway BRLC Proposed New
7. C6 extension – Flood Control Dike Expressway BRLC Committed New
8. Segment 8.2 of NLEx to Commonwealth NCR Proposed New
9. Southern Tagalog Arterial Road (STAR)- Batangas -Lipa GCR Committed
C. O
TH
ER
RO
AD
S
1. Secondary Road Packages for Metro Manila, Bulacan and Cavite
1. Bulacan Road Packages 1 and 2 BRLC Proposed New/
Upgrade
2. Cavite Secondary Roads BRLC Proposed New/
Upgrade
3. Sucat Road Upgrade NCR Proposed Upgrade
4. Quirino Road (Paranaque) NCR Proposed Upgrade
5. Paranague Road Package NCR Proposed Upgrade
2.Prepared studies for several projects GCR Proposed -
3. Other Central Luzon Road Projects GCR Committed -
4. Other Southern Luzon Road Projects GCR Committed -
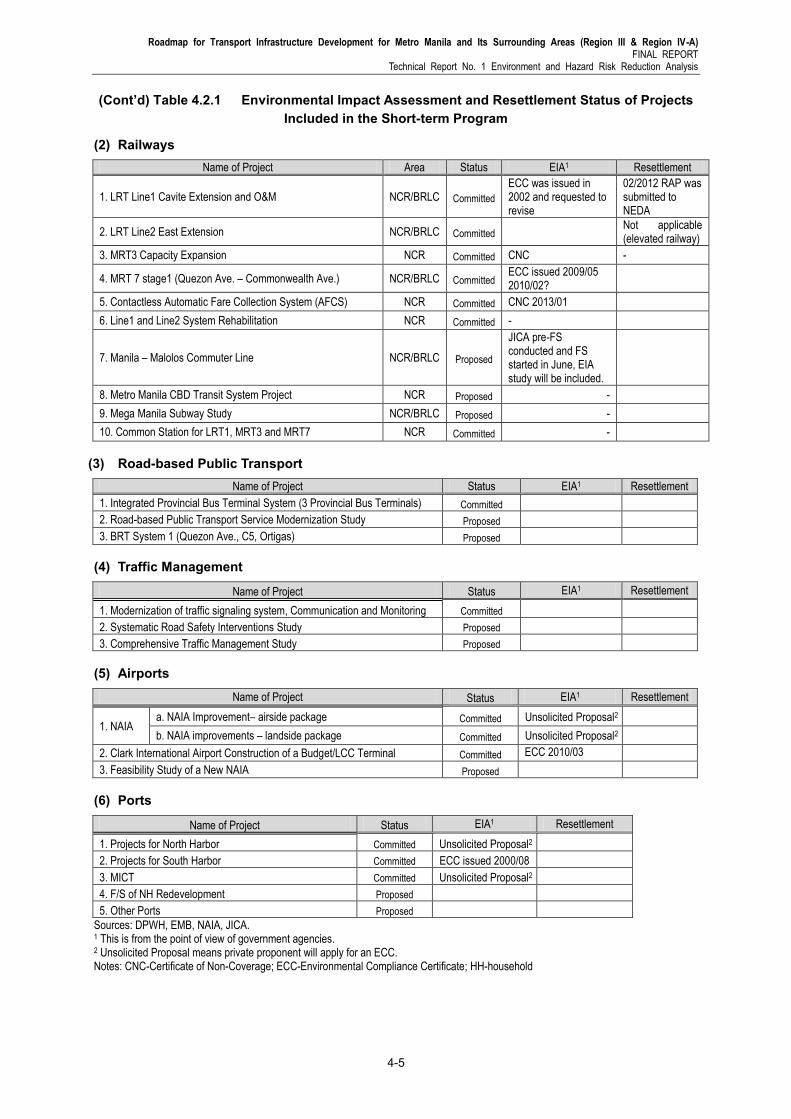
Roadmap for Transport Infrastructure Development for Metro Manila and Its Surrounding Areas (Region III & Region IV-A) FINAL REPORT
Technical Report No. 1 Environment and Hazard Risk Reduction Analysis
4-5
(Cont’d) Table 4.2.1 Environmental Impact Assessment and Resettlement Status of Projects Included in the Short-term Program
(2) Railways Name of Project Area Status EIA1 Resettlement
1. LRT Line1 Cavite Extension and O&M NCR/BRLC Committed
ECC was issued in 2002 and requested to revise
02/2012 RAP was submitted to NEDA
2. LRT Line2 East Extension NCR/BRLC Committed Not applicable (elevated railway)
3. MRT3 Capacity Expansion NCR Committed CNC -
4. MRT 7 stage1 (Quezon Ave. – Commonwealth Ave.) NCR/BRLC Committed ECC issued 2009/05 2010/02?
5. Contactless Automatic Fare Collection System (AFCS) NCR Committed CNC 2013/01
6. Line1 and Line2 System Rehabilitation NCR Committed -
7. Manila – Malolos Commuter Line NCR/BRLC Proposed
JICA pre-FS conducted and FS started in June, EIA study will be included.
8. Metro Manila CBD Transit System Project NCR Proposed -
9. Mega Manila Subway Study NCR/BRLC Proposed -
10. Common Station for LRT1, MRT3 and MRT7 NCR Committed -
(3) Road-based Public Transport Name of Project Status EIA1 Resettlement
1. Integrated Provincial Bus Terminal System (3 Provincial Bus Terminals) Committed
2. Road-based Public Transport Service Modernization Study Proposed
3. BRT System 1 (Quezon Ave., C5, Ortigas) Proposed
(4) Traffic Management
Name of Project Status EIA1 Resettlement
1. Modernization of traffic signaling system, Communication and Monitoring Committed
2. Systematic Road Safety Interventions Study Proposed
3. Comprehensive Traffic Management Study Proposed
(5) Airports
Name of Project Status EIA1 Resettlement
1. NAIA a. NAIA Improvement– airside package Committed Unsolicited Proposal2
b. NAIA improvements – landside package Committed Unsolicited Proposal2
2. Clark International Airport Construction of a Budget/LCC Terminal Committed ECC 2010/03
3. Feasibility Study of a New NAIA Proposed
(6) Ports
Name of Project Status EIA1 Resettlement
1. Projects for North Harbor Committed Unsolicited Proposal2
2. Projects for South Harbor Committed ECC issued 2000/08
3. MICT Committed Unsolicited Proposal2
4. F/S of NH Redevelopment Proposed
5. Other Ports Proposed
Sources: DPWH, EMB, NAIA, JICA. 1 This is from the point of view of government agencies. 2 Unsolicited Proposal means private proponent will apply for an ECC. Notes: CNC-Certificate of Non-Coverage; ECC-Environmental Compliance Certificate; HH-household