Embed Size (px)
Citation preview

Tableau Your Data!

Tableau Your Data!Fast and Easy Visual Analysis
with Tableau Software®
Second Edition
Daniel G. Murray
Tableau Your Data! Fast and Easy Visual Analysis with Tableau Software®
Published by
John Wiley & Sons, Inc.10475 Crosspoint BoulevardIndianapolis, IN 46256www.wiley.com
Copyright © 2016 by John Wiley & Sons, Inc., Indianapolis, Indiana
Published simultaneously in Canada
ISBN: 978-1-119-00119-5ISBN: 978-1-119-00121-8 (ebk)ISBN: 978-1-119-00120-1 (ebk)
Manufactured in the United States of America
10 9 8 7 6 5 4 3 2 1
No part of this publication may be reproduced, stored in a retrieval system or transmitted in any form or by any means, electronic, mechanical, photocopying, recording, scanning or otherwise, except as permitted under Sections 107 or 108 of the 1976 United States Copyright Act, without either the prior written permission of the Publisher, or authorization through payment of the appropriate per-copy fee to the Copyright Clearance Center, 222 Rosewood Drive, Danvers, MA 01923, (978) 750-8400, fax (978) 646-8600. Requests to the Publisher for permission should be addressed to the Permissions Department, John Wiley & Sons, Inc., 111 River Street, Hoboken, NJ 07030, (201) 748-6011, fax (201) 748-6008, or online at http://www.wiley.com/go/permissions.
Limit of Liability/Disclaimer of Warranty: The publisher and the author make no representations or warranties with respect to the accuracy or completeness of the contents of this work and specifically disclaim all warranties, including without limitation warranties of fitness for a particular purpose. No warranty may be created or extended by sales or promotional materials. The advice and strategies contained herein may not be suitable for every situation. This work is sold with the understanding that the publisher is not engaged in rendering legal, accounting, or other professional services. If professional assistance is required, the services of a competent professional person should be sought. Neither the publisher nor the author shall be liable for damages arising herefrom. The fact that an organization or Web site is referred to in this work as a citation and/or a potential source of further information does not mean that the author or the publisher endorses the information the organiza-tion or website may provide or recommendations it may make. Further, readers should be aware that Internet websites listed in this work may have changed or disappeared between when this work was written and when it is read.
For general information on our other products and services please contact our Customer Care Department within the United States at (877) 762-2974, outside the United States at (317) 572-3993 or fax (317) 572-4002.
Wiley publishes in a variety of print and electronic formats and by print-on-demand. Some material included with standard print versions of this book may not be included in e-books or in print-on-demand. If this book refers to media such as a CD or DVD that is not included in the version you purchased, you may download this material at http://booksupport.wiley.com. For more information about Wiley products, visit www.wiley.com.
Library of Congress Control Number: 2015952725
Trademarks: Wiley and the Wiley logo are trademarks or registered trademarks of John Wiley & Sons, Inc. and/or its affiliates, in the United States and other countries, and may not be used without written permission. Tableau Software is a registered trademark of Tableau Software, Inc. All other trademarks are the property of their respective owners. John Wiley & Sons, Inc. is not associated with any product or vendor mentioned in this book.
About the Author
Daniel G. Murray has over 30 years of professional experience. Dan has seen firsthand the technical revolution in data that led to the creation of Tableau Software. Prior to starting the InterWorks Tableau/BI practice in 2008, he held a variety of increasingly responsible roles in finance, accounting, sales, and operations for a mid-sized global manufacturing company serving the heavy industry and construction markets. During the late 1990s, his employer acquired over 50 companies. Dan’s role in 2006 as the CFO/CIO led to an assignment to integrate and create a global reporting environment. Uninspired by the high cost and complicated products available from traditional vendors, Dan discovered Tableau Software through data visualization expert Stephen Few. Less than one month after downloading a trial license of Tableau Software, Dan and his team were able to successfully create a reporting platform for less than 15 percent of the cost and one-tenth the time that traditional vendors had quoted. At this point, it was apparent that everyone needed Tableau—they just didn’t know it yet.
Within months after speaking at Tableau’s first customer conference, Dan went to friend and founder of InterWorks, Inc., Behfar Jahanshahi, to convince him to allow Dan to form a boutique consulting team focusing on providing the best practices of data visualization and reporting using Tableau Software and any emerging or popular database. Since the publication of the first edition of Tableau Your Data! Dan has visited 50 cities across North America and Europe presenting over 70 speeches on data and data visualization.
InterWorks, Inc. is now the premier Gold Professional Consulting Partner for Tableau Software with clients all over the world and over 35 Tableau consultants providing data visualization, database, and hardware expertise to many of the most significant organizations—spanning business, education, and government.
Dan is a 1982 graduate of Purdue University’s Krannert School of Business. He and his family live in the metro Atlanta area.

About the Technical Editor
Dick Holm is a successful, longtime entrepreneur with expertise in data analysis, statistics, and product positioning and presentation. Dick has been interested in the graphical presentation of information since the age of four when he learned to write his name in the Minnesota snow. He founded his own busi-ness based on presenting visual process information to machine operators. It eventually became a $10 million company. He now spends several hours a day with Tableau Desktop on his screen and a smile on his face.

Credits
Project EditorAdaobi Obi Tulton
Technical EditorDick Holm
Production EditorRebecca Anderson
Copy EditorNancy Rapoport
Manager of Content Development and AssemblyMary Beth Wakefield
Marketing DirectorDavid Mayhew
Marketing ManagerCarrie Sherrill
Professional Technology & Strategy DirectorBarry Pruett
Business ManagerAmy Knies
Associate PublisherJim Minatel
Project Coordinator, CoverPatrick Redmond
CompositorMaureen Forys, Happenstance Type-O-Rama
ProofreaderKim Wimpsett
IndexerJohnna VanHoose Dinse
Cover DesignerWiley
Cover ImageCourtesy of Daniel G. Murray

Acknowledgments
When I first approached this edition, I mistakenly thought that writing an updated edition would be easier than writing the original book. I’ve discov-ered that writing a guidebook for Tableau is never going to be easy. Tableau’s product evolution has been consistently aggressive. During the last two years, Tableau added a slew of new features to Desktop and Server. Consequently, nearly every figure in this book has been updated, and there are over 200 pages of totally new content.
During the last two years, I received lots of feedback from readers of the first edition. That feedback was universally positive and helpful. One individual went out of his way to document improvement ideas by sending me multiple pages of detailed feedback. Dick Holm’s feedback was so good I asked him if he would be willing to provide technical editing on this edition. Dick agreed, and his feedback informed every chapter of Part I. I don’t want to fail to men-tion Molly Monsey of Tableau Software. Molly’s contribution to the first edition of the book was extensive and invaluable.
This challenging project would have been impossible without the help and support of the InterWorks team. James Wright provided an excellent first draft of Chapter 9, “Designing for Mobile.” Kate Treadwell drafted the new Chapter 10 on Story Points. Our resident server wizard, Brad Fair, updated the initial draft for Chapter 11, “Installing Tableau Server.” Mat Hughes updated the initial draft of Chapter 12, “Managing Tableau Server.” Eric Shairla, Javod Khalaj, and Greg Nelms provided the first draft of Chapter 13, “Automating Tableau Server,” which included new code samples for illustrating some of the new capabilities of Tableau’s expanding API toolsets.
InterWorks has many wonderful clients, but I would specifically like to thank Donna Costello of Cigna Healthcare for inviting me to speak at one of her Tableau User Group meetings and providing a case study from Cigna’s inter-nal user group. As Tableau’s first successful partner, we’ve learned a lot about how to effectively deploy Tableau. InterWorks East Coast Team Leader James Wright recaps key success factors in his case study that shares lessons learned.
After writing the first edition of this book I had the honor of speaking at over 50 Tableau User Groups all over North America and Europe—meeting hundreds of Tableau users. Their enthusiasm reminds me of how I felt about Tableau Software when I first discovered it in 2007. One of the best things about
xii AcknowleDGMents
Tableau Software is the community of people who use the product. Your Tableau Public posts and generosity inspire me. The Tableau Zen Masters are a great example of this sharing. I want to thank all of them for the insights they have shared with the community.
This book wouldn’t have been possible without the faith and support of InterWorks CEO Behfar Jahanshahi. Behfar believed in a big idea with a little following in 2007. His strategic and tactical leadership continues to shape our success. His wisdom, insight, and kindness continue to inspire me.
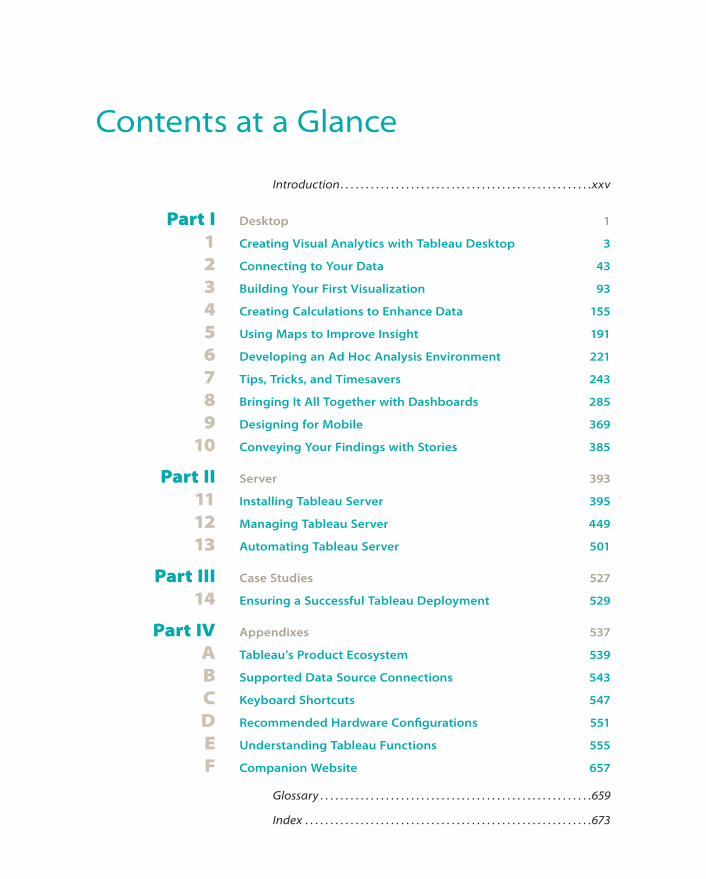
Contents at a Glance
Introduction . . . . . . . . . . . . . . . . . . . . . . . . . . . . . . . . . . . . . . . . . . . . . . . . . .xxv
Part I Desktop 1
1 creating Visual Analytics with tableau Desktop 3
2 connecting to Your Data 43
3 Building Your First Visualization 93
4 creating calculations to enhance Data 155
5 Using Maps to Improve Insight 191
6 Developing an Ad Hoc Analysis environment 221
7 tips, tricks, and timesavers 243
8 Bringing It All together with Dashboards 285
9 Designing for Mobile 369
10 conveying Your Findings with stories 385
Part II server 393
11 Installing tableau server 395
12 Managing tableau server 449
13 Automating tableau server 501
Part III case studies 527
14 ensuring a successful tableau Deployment 529
Part IV Appendixes 537
A tableau’s Product ecosystem 539
B supported Data source connections 543
C keyboard shortcuts 547
D Recommended Hardware configurations 551
E Understanding tableau Functions 555
F companion website 657
Glossary . . . . . . . . . . . . . . . . . . . . . . . . . . . . . . . . . . . . . . . . . . . . . . . . . . . . . .659
Index . . . . . . . . . . . . . . . . . . . . . . . . . . . . . . . . . . . . . . . . . . . . . . . . . . . . . . . . .673


![Data first with Tableau [FutureStack16]](https://img.pdfslide.net/doc/110x75/58819dc41a28ab1a398b48e1/data-first-with-tableau-futurestack16.jpg)