Embed Size (px)
Citation preview
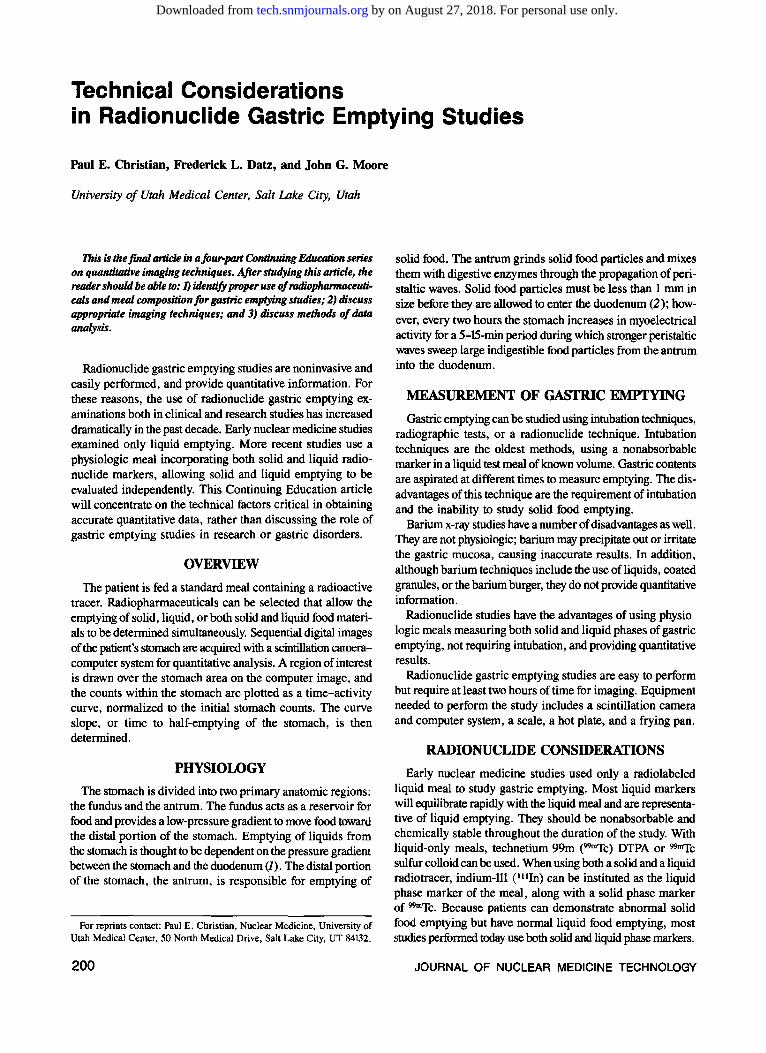
Technical Considerations in Radionuclide Gastric Emptying Studies
Paul E. Christian, Frederick L. Datz, and John G. Moore
University of Utah Medical Center, Salt Lake City, Utah
This is the final article in a four-part Continuing Educotion serU!s on quantitative imaging techniques. After studying this article, the reader should be able to: 1) identify proper use of radiophamuu:euticals and meal composition for gastric emptying studies; 2) discuss appropriate imaging techniques; and 3) discuss methods of data analysis.
Radionuclide gastric emptying studies are noninvasive and easily performed, and provide quantitative information. For these reasons, the use of radionuclide gastric emptying examinations both in clinical and research studies has increased dramatically in the past decade. Early nuclear medicine studies examined only liquid emptying. More recent studies use a physiologic meal incorporating both solid and liquid radionuclide markers, allowing solid and liquid emptying to be evaluated independently. This Continuing Education article will concentrate on the technical factors critical in obtaining accurate quantitative data, rather than discussing the role of gastric emptying studies in research or gastric disorders.
OVERVIEW
The patient is fed a standard meal containing a radioactive tracer. Radiopharmaceuticals can be selected that allow the emptying of solid, liquid, or both solid and liquid food materials to be determined simultaneously. Sequential digital images of the patient's stomach are acquired with a scintillation cameracomputer system for quantitative analysis. A region of interest is drawn over the stomach area on the computer image, and the counts within the stomach are plotted as a time-activity curve, normalized to the initial stomach counts. The curve slope, or time to half-emptying of the stomach, is then determined.
PHYSIOWGY
The stomach is divided into two primary anatomic regions: the fundus and the antrum. The fundus acts as a reservoir for food and provides a low-pressure gradient to move food toward the distal portion of the stomach. Emptying of liquids from the stomach is thought to be dependent on the pressure gradient between the stomach and the duodenum (J). The distal portion of the stomach, the antrum, is responsible for emptying of
For reprints contact: Paul E. Christian, Nuclear Medicine, University of Utah Medical Center, 50 North Medical Drive, Salt Lake City, UT 84132.
200
solid food. The antrum grinds solid food particles and mixes them with digestive enzymes through the propagation of peristaltic waves. Solid food particles must be less than 1 mm in size before they are allowed to enter the duodenum (2); however, every two hours the stomach increases in myoelectrical activity for a 5-15-min period during which stronger peristaltic waves sweep large indigestible food particles from the antrum into the duodenum.
MEASUREMENT OF GASTRIC EMPTYING
Gastric emptying can be studied using intubation techniques, radiographic tests, or a radionuclide technique. Intubation techniques are the oldest methods, using a nonabsorbable marker in a liquid test meal of known volume. Gastric contents are aspirated at different times to measure emptying. The disadvantages of this technique are the requirement of intubation and the inability to study solid food emptying.
Barium x-ray studies have a number of disadvantages as well. They are not physiologic; barium may precipitate out or irritate the gastric mucosa, causing inaccurate results. In addition, although barium techniques include the use ofliquids, coated granules, or the barium burger, they do not provide quantitative information.
Radionuclide studies have the advantages of using physiologic meals measuring both solid and liquid phases of gastric emptying, not requiring intubation, and providing quantitative results.
Radionuclide gastric emptying studies are easy to perform but require at least two hours of time for imaging. Equipment needed to perform the study includes a scintillation camera and computer system, a scale, a hot plate, and a frying pan.
RADIONUCLIDE CONSIDERATIONS
Early nuclear medicine studies used only a radiolabeled liquid meal to study gastric emptying. Most liquid markers will equilibrate rapidly with the liquid meal and are representative of liquid emptying. They should be nonabsorbable and chemically stable throughout the duration of the study. With liquid-only meals, technetium-99m (99rnTc) DTPA or 99rnTc sulfur colloid can be used. When using both a solid and a liquid radiotracer, indium-111 (11 1Jn) can be instituted as the liquid phase marker of the meal, along with a solid phase marker of 99rnTc. Because patients can demonstrate abnormal solid food emptying but have normal liquid food emptying, most studies performed today use both solid and liquid phase markers.
JOURNAL OF NUCLEAR MEDICINE TECHNOLOGY
by on August 27, 2018. For personal use only. tech.snmjournals.org Downloaded from
A wide variety of radionuclide markers have been used to follow solid phase gastric emptying (3). Solid phase radionuclide markers must have a high labeling efficiency, and the radiolabel must not elute from the food material during the procedure. The particle size of labeled solid food material should be greater than 1 mm, and it should remain stable for a long period; therefore, the radiopharmaceutical must be incorporated within the solid food. In vitro tests for physical and chemical breakdown should be done in gastric juice if radiotracers other than those described in the literature are used. The most ideal solid phase labeling technique uses intracellularly labeled chicken liver (4), obtained by the intravenous injection of 99mTc sulfur colloid into live chickens. This technique, which requires handling and injecting live chickens, is inconvenient. Fortunately, liver also can be labeled by in vitro techniques (5).
One method of preparing in vitro labeled liver is through the use of pureed meat (6). Five millicuries of 99mTc sulfur colloid is injected into approximately 50 g of canned liver pate (Sells). This mixture is placed in a hot frying pan and stirred occasionally while frying for 10-15 min. This preparation forms 2-5-mm particles which are then dried on an absorbent towel. Six hundred microcuries of the mixture (approximately 5 g), are then taken for mixing with the solid food of the meal.
The most popular solid phase marker is labeled eggs (7). Two raw eggs are gently broken into a container and the yolks are injected with approximately 500 p.Ci of 99mTc sulfur colloid. The eggs are allowed to incubate 5 min; then they are scrambled and fried in a pan until firm.
The radiation burden from gastrointestinal radionuclide studies is summarized in a paper by Siegel et al. (8). The total body radiation dose from 500 p.Ci of 99mTc-labeled egg or chicken liver is 9 mrad. The target organ dose is the upper large intestine, which receives 230 mrad, while the stomach and small intestine receive 120 mrad. One hundred microcuries 11 1Jn DTPA delivers a total body burden of 24 mrad, with the largest radiation dose being 800 mrad to the lower large intestine.
MEAL SIZE AND COMPOSITION
The stomach responds to the volume, content, and nutrient density of the meal. A large variety of meal sizes and foods have been used for radionuclide studies. By weight, the meal should consist of about half solid food and half liquid food. The liquid part of the meal should be a nutrient-dense liquid. Water or saline are emptied more rapidly from the stomach than is a liquid such as apple or orange juice. Milk can contain a large amount of fat which is emptied more slowly by the stomach, so it is not a good choice. Indium-111 DTPA (100 p.Ci) can be mixed easily with orange or apple juice.
Measurement of liquid emptying is optional if the solid phase marker of 99mTc is being used with the meal. Certainly it is not mandatory to routinely perform diagnostic studies with both solid and liquid markers, but occasionally it adds valuable information if the patient has delayed solid phase emptying with normal liquid emptying.
Clinical gastric emptying studies require that the patient
VOLUME 15, NUMBER 4, DECEMBER 1987
receive a meal standardized in both weight and caloric content. Studies have demonstrated that higher density meals empty more slowly from the stomach than lower density meals (9,10); therefore, caloric content determines the rate of gastric emptying. It is difficult to compare patient studies when meals differ in volume, composition, or content. Comparison of your gastric emptying data with values reported in the literature can be done only if meals of identical caloric density and volume have been employed in addition to similar data analysis techniques.
The stomach needs a working volume of food to demonstrate normal emptying processes. Small meals may not be representative of how the stomach usually functions when digesting a normal-size meal. Studies should be performed using a total meal weight of not less than 300 g. Since many patients referred for gastric emptying studies complain of food intolerance, they cannot be expected to consume large volume meals.
The most frequently used meal for 99mTc sulfur colloid labeled egg radiotracer is a scrambled egg sandwich. The two eggs that have been incubated with 99mTc sulfur colloid and then fried are placed between two slices oftoasted white bread. This meal is ingested along with a liquid.
Technetium-99m sulfur colloid labeled egg or pate may be mixed into 150 g of warmed canned beef stew. This meal provides a variety of foods including meat, potatoes, vegetables, etc., which provide a nice mixture of food materials in a standard volume. Orange juice (150 g) containing 100 p.Ci of 111ln DTPA is ingested as the liquid food in this standardized meal.
Other foods may be selected for a standard meal; however, it is important not to use semi-solid foods such as oatmeal, cereal with milk, etc. All meals should contain both solid and liquid foods.
IMAGING CONSIDERATIONS
The measurement of both solid and liquid phases can be done using a solid phase labeled with 99mTc and a liquid marked with 11 1Jn DTPA. These two radionuclides can be used in the same study by imaging the 140 keY photopeak of 99mTc and then the 247 keY photopeak of 11 1Jn. There is a negligible ( < 5%) downscatter of 111ln counts into the 140 keY window if the ratio of 99mTc to 111ln radioactivity is 6:1. It is therefore recommended that a dose of 600 p.Ci 99mTc and 100 p.Ci 111ln be used for measuring both solid and liquid emptying in the same study.
Some variation in gastric emptying rates has been shown between studies performed standing, sitting, or supine (3). Gastric emptying is affected by posture and gravity, and having the patient recumbent slows emptying from the stomach. Images are taken for 40-60 sec for each view at each imaging time. Imaging patients at intermittent intervals (every 15-30 min) is convenient and allows the patient to be seated in the imaging or waiting room between studies. Intermittent imaging can be done only ifthe patient can be reliably returned to the same position for each set of images. Patient motion during image acquisition can adversely affect data processing (11). To allow accurate repositioning, the stomach region can be
201
by on August 27, 2018. For personal use only. tech.snmjournals.org Downloaded from
temporarily marked with a wax pencil on the scintillation camera persistence oscilloscope and the patient can be returned with the stomach activity positioned in this same region for each set of images.
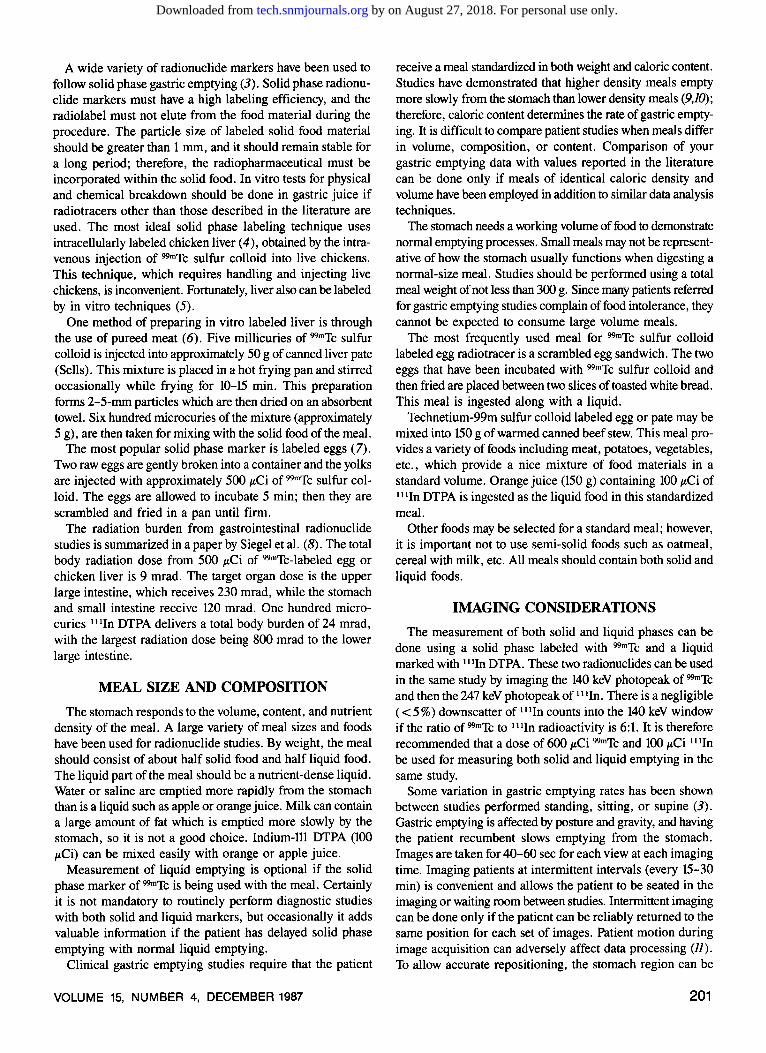
A better method is to place a small point-source marker of cobalt-57 (57Co) or 99mTc on the patient's skin during the study. Markers may be taped onto the skin, or a 99mTc marker may be made by placing a small source of activity in a plastic cover and taping this to the right costal margin of the ribs (Fig. 1). The point-source marker can be visualized easily and its location can be marked on the persistence oscilloscope, which allows accurate horizontal and vertical repositioning of the patient for each set of images. If both anterior and posterior imaging are performed, it may be necessary to place another point-source marker on the patient's back for accurate posterior repositioning. Upon computer processing, the point source's location also documents patient positioning and identifies patient motion. The markers are removed when the study is finished.
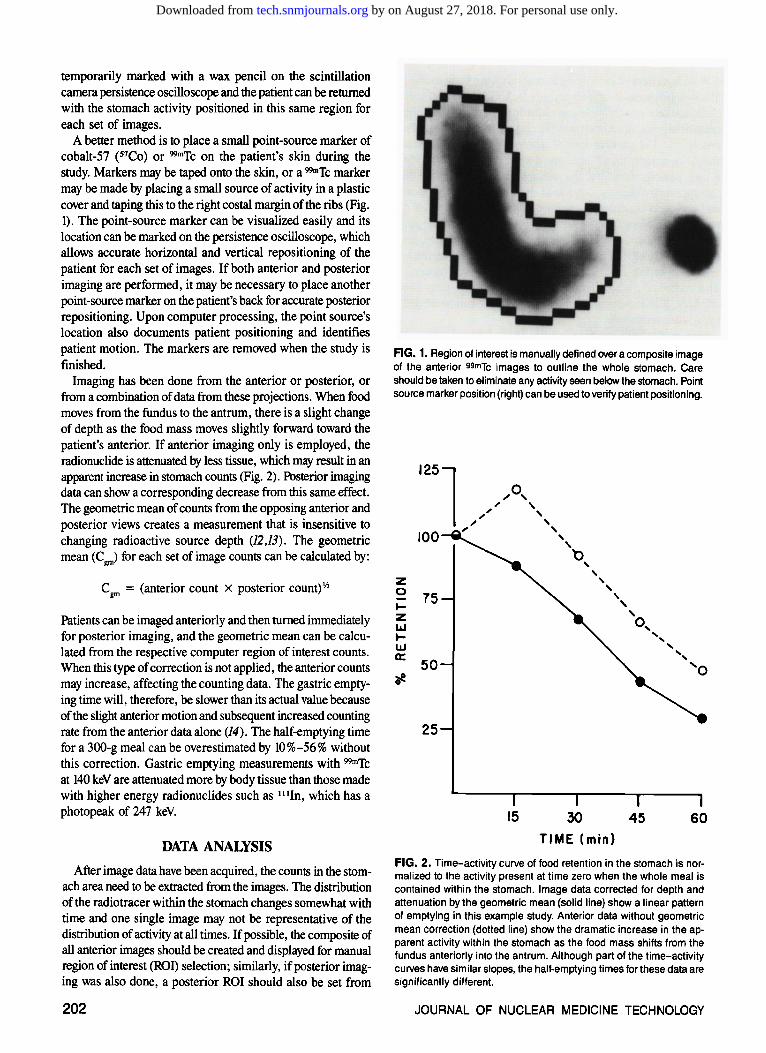
Imaging has been done from the anterior or posterior, or from a combination of data from these projections. When food moves from the fundus to the antrum, there is a slight change of depth as the food mass moves slightly forward toward the patient's anterior. If anterior imaging only is employed, the radionuclide is attenuated by less tissue, which may result in an apparent increase in stomach counts (Fig. 2). Posterior imaging data can show a corresponding decrease from this same effect. The geometric mean of counts from the opposing anterior and posterior views creates a measurement that is insensitive to changing radioactive source depth (12,13). The geometric mean (Cgm) for each set of image counts can be calculated by:
C8m = (anterior count X posterior count)'"'
Patients can be imaged anteriorly and then turned immediately for posterior imaging, and the geometric mean can be calculated from the respective computer region of interest counts. When this type of correction is not applied, the anterior counts may increase, affecting the counting data. The gastric emptying time will, therefore, be slower than its actual value because of the slight anterior motion and subsequent increased counting rate from the anterior data alone (14). The half-emptying time for a 300-g meal can be overestimated by 10%-56% without this correction. Gastric emptying measurements with 99mTc at 140 keV are attenuated more by body tissue than those made with higher energy radionuclides such as 111In, which has a photopeak of 247 keY.
DATA ANALYSIS
After image data have been acquired, the counts in the stomach area need to be extracted from the images. The distribution of the radio tracer within the stomach changes somewhat with time and one single image may not be representative of the distribution of activity at all times. If possible, the composite of all anterior images should be created and displayed for manual region of interest (ROI) selection; similarly, if posterior imaging was also done, a posterior ROI should also be set from
202
FIG. 1. Region of interest is manually defined over a composite image of the anterior 99mTc images to outline the whole stomach. Care should be taken to eliminate any activity seen below the stomach. Point source marker position (right) can be used to verify patient positioning.
125l ,o, '
100
z 0 75 .... z IAJ .... LLJ 0::
50 oe
25
15
' ' ' ' ' b ' ' ' ' '
30 TIME (min)
' ' o, ' ' ' ' ' 'o
45 60
FIG. 2. Time-activity curve of food retention in the stomach is normalized to the activity present at time zero when the whole meal is contained within the stomach. Image data corrected for depth and attenuation by the geometric mean (solid line) show a linear pattern of emptying in this example study. Anterior data without geometric mean correction (dotted line) show the dramatic increase in the apparent activity within the stomach as the food mass shifts from the fundus anteriorly into the antrum. Although part of the time-activity curves have similar slopes, the half-emptying times for these data are significantly different.
JOURNAL OF NUCLEAR MEDICINE TECHNOLOGY
by on August 27, 2018. For personal use only. tech.snmjournals.org Downloaded from
a posterior composite image. Care should be taken when drawing the inferior portion of the ROI not to include any region of activity within the bowel (Fig. 1).
The data extracted from gastric emptying studies are represented by counts within the ROI of the stomach at various times at which imaging was performed. Data should be corrected for the geometric mean of the anterior and posterior counts, and since this study is performed over a somewhat long time, the data acquired from 99mTc should be corrected for radioactive decay. Once these corrections have been made, the timeactivity data must still be put into an interpretable form. It is advantageous to form a time-activity curve with the counts in the stomach immediately after meal ingestion (time zero) as the point of 100% meal retention within the stomach. All subsequent measurements should be given as a fractional percentage of this time zero count.
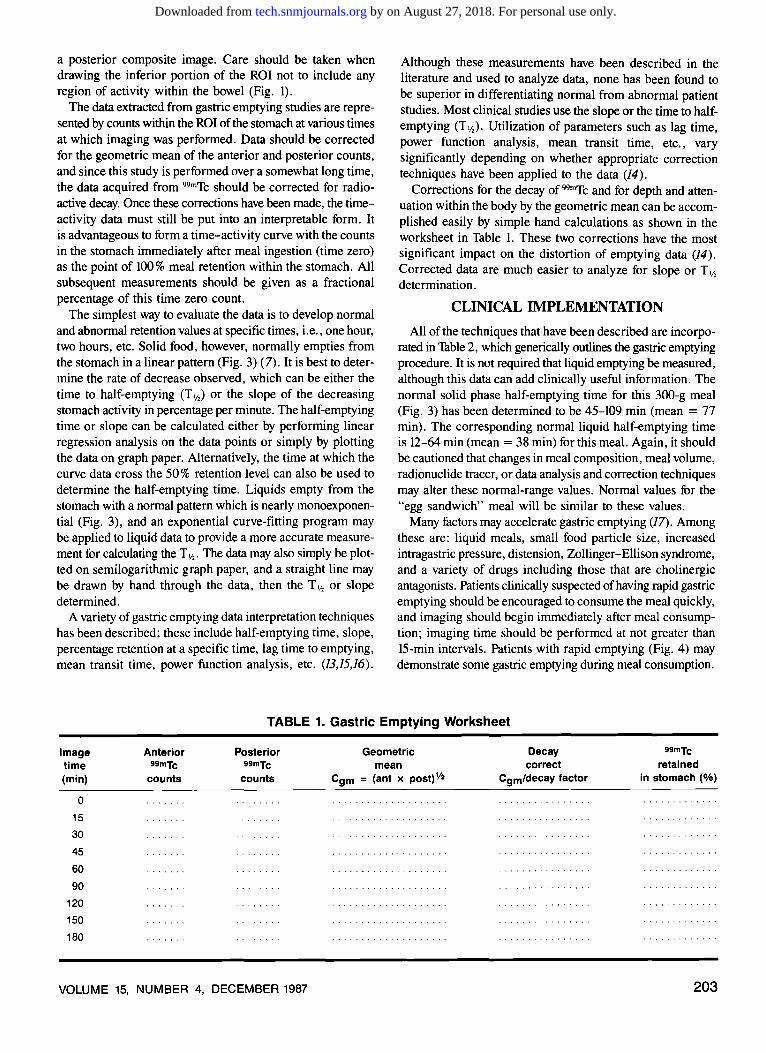
The simplest way to evaluate the data is to develop normal and abnormal retention values at specific times, i.e., one hour, two hours, etc. Solid food, however, normally empties from the stomach in a linear pattern (Fig. 3) (7). It is best to determine the rate of decrease observed, which can be either the time to half-emptying (T y,) or the slope of the decreasing stomach activity in percentage per minute. The half-emptying time or slope can be calculated either by performing linear regression analysis on the data points or simply by plotting the data on graph paper. Alternatively, the time at which the curve data cross the 50% retention level can also be used to determine the half-emptying time. Liquids empty from the stomach with a normal pattern which is nearly monoexponential (Fig. 3), and an exponential curve-fitting program may be applied to liquid data to provide a more accurate measurement for calculating the T,12 • The data may also simply be plotted on semilogarithmic graph paper, and a straight line may be drawn by hand through the data, then the T 'h or slope determined.
A variety of gastric emptying data interpretation techniques has been described; these include half-emptying time, slope, percentage retention at a specific time, lag time to emptying, mean transit time, power function analysis, etc. (13,15,16).
Although these measurements have been described in the literature and used to analyze data, none has been found to be superior in differentiating normal from abnormal patient studies. Most clinical studies use the slope or the time to halfemptying (Tv,). Utilization of parameters such as lag time, power function analysis, mean transit time, etc., vary significantly depending on whether appropriate correction techniques have been applied to the data (14).
Corrections for the decay of 99mTc and for depth and attenuation within the body by the geometric mean can be accomplished easily by simple hand calculations as shown in the worksheet in Table 1. These two corrections have the most significant impact on the distortion of emptying data (14). Corrected data are much easier to analyze for slope or T ,12 determination.
CLINICAL IMPLEMENTATION
All of the techniques that have been described are incorporated in Table 2, which generically outlines the gastric emptying procedure. It is not required that liquid emptying be measured, although this data can add clinically useful information. The normal solid phase half-emptying time for this 300-g meal (Fig. 3) has been determined to be 45-109 min (mean = 77 min). The corresponding normal liquid half-emptying time is 12-64 min (mean = 38 min) for this meal. Again, it should be cautioned that changes in meal composition, meal volume, radionuclide tracer, or data analysis and correction techniques may alter these normal-range values. Normal values for the "egg sandwich" meal will be similar to these values.
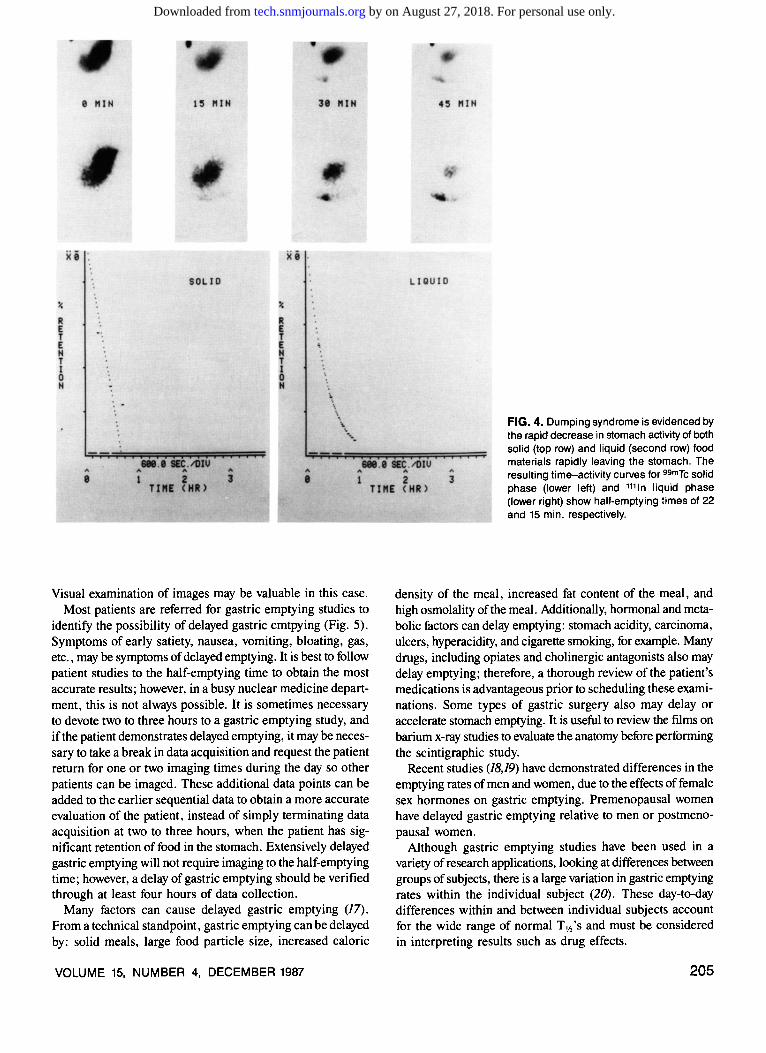
Many factors may accelerate gastric emptying (17). Among these are: liquid meals, small food particle size, increased intragastric pressure, distension, Zollinger-Ellison syndrome, and a variety of drugs including those that are cholinergic antagonists. Patients clinically suspected of having rapid gastric emptying should be encouraged to consume the meal quickly, and imaging should begin immediately after meal consumption; imaging time should be performed at not greater than 15-min intervals. Patients with rapid emptying (Fig. 4) may demonstrate some gastric emptying during meal consumption.
TABLE 1. Gastric Emptying Worksheet
Image time (min)
0
15
30
45
60
90
120
150
180
Anterior 99mTc
counts
Posterior 99mTc
counts
VOLUME 15, NUMBER 4, DECEMBER 1987
Geometric mean
Cgm = (ant x post) Y2
Decay correct
Cgmldecay factor
99mTc
retained in stomach (%)
203
by on August 27, 2018. For personal use only. tech.snmjournals.org Downloaded from
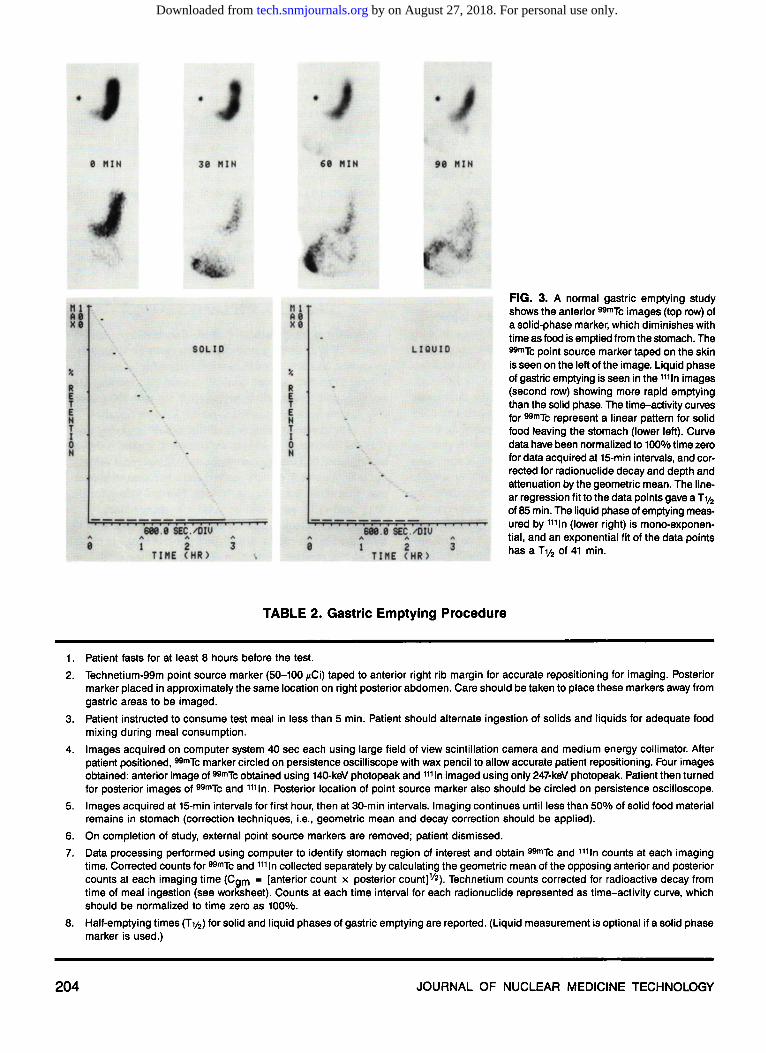
TABLE 2. Gastric Emptying Procedure
1. Patient fasts for at least 8 hours before the test.
FIG. 3. A normal gastric emptying study shows the anterior 99mTc images (top row) of a solid-phase marker, which diminishes with time as food is emptied from the stomach. The 99mTc point source marker taped on the skin is seen on the left of the image. Liquid phase of gastric emptying is seen in the 1111n images (second row) showing more rapid emptying than the solid phase. The time-activity curves for 99mTc represent a linear pattern for solid food leaving the stomach (lower left). Curve data have been normalized to 100% time zero for data acquired at 15-min intervals, and corrected for radionuclide decay and depth and attenuation by the geometric mean. The linear regression fit to the data points gave aT y2 of 85 min. The liquid phase of emptying measured by 1111n (lower right) is mono-exponential, and an exponential fit of the data points has a T112 of 41 min.
2. Technetium-99m point source marker (50-100 ~-tCi) taped to anterior right rib margin for accurate repositioning for imaging. Posterior marker placed in approximately the same location on right posterior abdomen. Care should be taken to place these markers away from gastric areas to be imaged.
3. Patient instructed to consume test meal in less than 5 min. Patient should alternate ingestion of solids and liquids for adequate food mixing during meal consumption.
4. Images acquired on computer system 40 sec each using large field of view scintillation camera and medium energy collimator. After patient positioned, 99mTc marker circled on persistence oscilliscope with wax pencil to allow accurate patient repositioning. Four images obtained: anterior image of 99mTc obtained using 140-keV photopeak and 1111n imaged using only 247-keV photopeak. Patient then turned for posterior images of 99mTc and ,,,ln. Posterior location of point source marker also should be circled on persistence oscilloscope.
5. Images acquired at 15-min intervals for first hour, then at 30-min intervals. Imaging continues until less than 50% of solid food material remains in stomach (correction techniques, i.e., geometric mean and decay correction should be applied).
6. On completion of study, external point source markers are removed; patient dismissed.
7. Data processing performed using computer to identify stomach region of interest and obtain 99mTc and 1111n counts at each imaging time. Corrected counts for 99mTc and 1111n collected separately by calculating the geometric mean of the opposing anterior and posterior counts at each imaging time (Cgm = [anterior count x posterior count)Y2). Technetium counts corrected for radioactive decay from time of meal ingestion (see worksheet). Counts at each time interval for each radionuclide represented as time-activity curve, which should be normalized to time zero as 100%.
8. Half-emptying times (T112) for solid and liquid phases of gastric emptying are reported. (Liquid measurement is optional if a solid phase marker is used.)
204 JOURNAL OF NUCLEAR MEDICINE TECHNOLOGY
by on August 27, 2018. For personal use only. tech.snmjournals.org Downloaded from
Visual examination of images may be valuable in this case. Most patients are referred for gastric emptying studies to
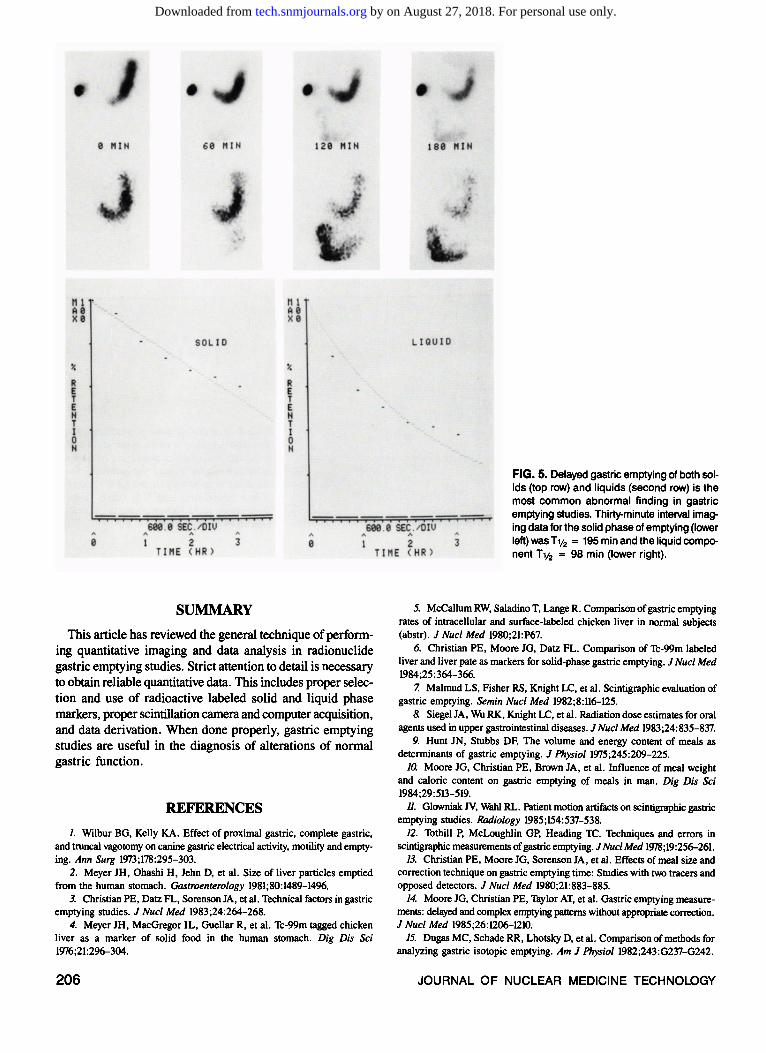
identify the possibility of delayed gastric emtpying (Fig. 5). Symptoms of early satiety, nausea, vomiting, bloating, gas, etc., may be symptoms of delayed emptying. It is best to follow patient studies to the half-emptying time to obtain the most accurate results; however, in a busy nuclear medicine department, this is not always possible. It is sometimes necessary to devote two to three hours to a gastric emptying study, and ifthe patient demonstrates delayed emptying, it may be necessary to take a break in data acquisition and request the patient return for one or two imaging times during the day so other patients can be imaged. These additional data points can be added to the earlier sequential data to obtain a more accurate evaluation of the patient, instead of simply terminating data acquisition at two to three hours, when the patient has significant retention of food in the stomach. Extensively delayed gastric emptying will not require imaging to the half-emptying time; however, a delay of gastric emptying should be verified through at least four hours of data collection.
Many factors can cause delayed gastric emptying (17). From a technical standpoint, gastric emptying can be delayed by: solid meals, large food particle size, increased caloric
VOLUME 15, NUMBER 4, DECEMBER 1987
FIG. 4. Dumping syndrome is evidenced by the rapid decrease in stomach activity of both solid (top row) and liquid (second row) food materials rapidly leaving the stomach. The resulting time-activity curves for 99mTc solid phase (lower left) and 1111n liquid phase (lower right) show half-emptying times of 22 and 15 min, respectively.
density of the meal, increased fat content of the meal, and high osmolality of the meal. Additionally, hormonal and metabolic factors can delay emptying: stomach acidity, carcinoma, ulcers, hyperacidity, and cigarette smoking, for example. Many drugs, including opiates and cholinergic antagonists also may delay emptying; therefore, a thorough review of the patient's medications is advantageous prior to scheduling these examinations. Some types of gastric surgery also may delay or accelerate stomach emptying. It is useful to review the ftlms on barium x-ray studies to evaluate the anatomy before performing the scintigraphic study.
Recent studies (18,19) have demonstrated differences in the emptying rates of men and women, due to the effects of female sex hormones on gastric emptying. Premenopausal women have delayed gastric emptying relative to men or postmenopausal women.
Although gastric emptying studies have been used in a variety of research applications, looking at differences between groups of subjects, there is a large variation in gastric emptying rates within the individual subject (20). These day-to-day differences within and between individual subjects account for the wide range of normal T 'h 's and must be considered in interpreting results such as drug effects.
205
by on August 27, 2018. For personal use only. tech.snmjournals.org Downloaded from
SUMMARY
This article has reviewed the general technique of performing quantitative imaging and data analysis in radionuclide gastric emptying studies. Strict attention to detail is necessary to obtain reliable quantitative data. This includes proper selection and use of radioactive labeled solid and liquid phase markers, proper scintillation camera and computer acquisition, and data derivation. When done properly, gastric emptying studies are useful in the diagnosis of alterations of normal gastric function.
REFERENCES
1. Wilbur BG, Kelly KA. Effect of proximal gastric, complete gastric, and truncal vagotomy on canine gastric electrical activity, motility and emptying. Ann Surg 1973;178:295-303.
2. Meyer JH, Ohashi H, Jehn D, et al. Size of liver particles emptied from the human stomach. Gastroenterology 1981;80:1489-1496.
3. Christian PE, Datz FL, Sorenson JA, et al. Technical factors in gastric emptying studies. J Nucl Med 1983;24:264-268.
4. Meyer JH, MacGregor IL, Guellar R, et al. Tc-99m tagged chicken liver as a marker of solid food in the human stomach. Dig Dis Sci 1976;21:296-304.
206
FIG. 5. Delayed gastric emptying of both solids (top row) and liquids (second row) is the most common abnormal finding in gastric emptying studies. Thirty-minute interval imaging data for the solid phase of emptying (lower left) wasT 112 = 195 min and the liquid component Tv2 = 98 min (lower right).
5. McCallum RW, Saladino T, LangeR. Comparison of gastric emptying rates of intracellular and surface-labeled chicken liver in normal subjects (abstr). J Nucl Med 1980;21:P67.
6. Christian PE, Moore JG, Datz FL. Comparison of Tc-99m labeled liver and liver pate as markers for solid-phase gastric emptying. J Nucl Med 1984;25:364-366.
7. Malmud LS, Fisher RS, Knight LC, et al. Scintigraphic evaluation of gastric emptying. Semin Nucl Med 1982;8:116-125.
8. Siegel JA, Wu RK, Knight LC, et al. Radiation dose estimates for oral agents used in upper gastrointestinal diseases. J Nucl Med 1983;24:835-837.
9. Hunt IN, Stubbs DF. The volume and energy content of meals as determinants of gastric emptying. J Physio/1975;245:209-225.
10. Moore JG, Christian PE, Brown JA, et al. Influence of meal weight and caloric content on gastric emptying of meals in man. Dig Dis Sci 1984;29:513-519.
11. Glowniak N, Wahl RL. Patient motion artifacts on scintigraphic gastric emptying studies. Radiology 1985;154:537-538.
12. Tothill P, McLoughlin GP, Heading TC. Techniques and errors in scintigraphic measurements of gastric emptying. J Nucl Med 1978;19:256-261.
13. Christian PE, Moore JG, Sorenson JA, et al. Effects of meal size and correction technique on gastric emptying time: Studies with two tracers and opposed detectors. J Nucl Med 1980;21:883-885.
14. Moore JG, Christian PE, Taylor AT, et al. Gastric emptying measurements: delayed and complex emptying patterns without appropriate correction. J Nucl Med 1985;26:1206-1210.
15. Dugas MC, Schade RR, Lhotsky D, et al. Comparison of methods for analyzing gastric isotopic emptying. Am J Physiol 1982;243:G237-G242.
JOURNAL OF NUCLEAR MEDICINE TECHNOLOGY
by on August 27, 2018. For personal use only. tech.snmjournals.org Downloaded from
16. Elashoff JD, Reedy TJ, Meyer JH. Analysis of gastric emptying data. Gastroenterology 1982;83:1306-1312.
17. Minami H, McCallum RW. The physiology and pathophysiology of gastric emptying in humans. Gastroenterology 1984;86:1592-1610.
18. Datz FL, Christain PE, Moore JG. Gender-related differences in gastric emptying. J Nucl Med 1987;28:1204-l2<J7.
VOLUME 15, NUMBER 4, DECEMBER 1987
19. Datz FL, Christian PE, Moore JG. Differences in gastric emptying rates between menstruating and postmenopausal women (abstr). J Nucl Med 1987;28:604-605.
20. Brophy CM, Moore JG, Christian PE, et a!. Variability of gastric emptying measurements in man employing standardized radiolabeled meals. Dig Dis Sci 1986;31:799-806.
207
by on August 27, 2018. For personal use only. tech.snmjournals.org Downloaded from
1987;15:200-207.J. Nucl. Med. Technol. Paul E. Christian, Frederick L. Datz and John G. Moore Technical Considerations in Radionuclide Gastric Emptying Studies
http://tech.snmjournals.org/content/15/4/200This article and updated information are available at:
http://tech.snmjournals.org/site/subscriptions/online.xhtml
Information about subscriptions to JNMT can be found at:
http://tech.snmjournals.org/site/misc/permission.xhtmlInformation about reproducing figures, tables, or other portions of this article can be found online at:
(Print ISSN: 0091-4916, Online ISSN: 1535-5675)1850 Samuel Morse Drive, Reston, VA 20190.SNMMI | Society of Nuclear Medicine and Molecular Imaging
is published quarterly.Journal of Nuclear Medicine Technology
© Copyright 1987 SNMMI; all rights reserved.
by on August 27, 2018. For personal use only. tech.snmjournals.org Downloaded from