Embed Size (px)
Citation preview

T E C H N I C A L M E M O R A N D U M
1
Coosa‐North Georgia Water Planning Region Water and Wastewater Forecasting Technical Memorandum PREPARED FOR: Coosa North Georgia Water Council/Georgia Environmental Protection
Division
PREPARED BY: CH2M
DATE: March 30, 2017
Contents
Coosa‐North Georgia Water Planning Region ‐Water and Wastewater Forecasting Technical Memorandum ......................................................................................................................... 1
1.0 Introduction ........................................................................................................... 3 2.0 Population Forecast ............................................................................................... 3 2.1 Employment Forecast ............................................................................................ 6 3.0 Municipal Water Needs Forecast .......................................................................... 6 3.1 Adjustment of the 2011 Plan per Capita Water Demand for the 2017 Plan
Forecasts ................................................................................................................ 7 3.2 Plumbing Code Water Efficiency Adjustment ........................................................ 8 3.3 Municipal Water Demand Forecast Results .......................................................... 9 3.4 Water Sources and Geographic Distribution of Projected Demands .................. 10 3.5 Forecast Aggregation ........................................................................................... 11 3.6 Additional Considerations .................................................................................... 14 4.0 Municipal Wastewater Flow Forecast ................................................................. 14 4.1 Municipal Wastewater Flow Forecast Results ..................................................... 15 5.0 Industrial Water and Wastewater Forecast ......................................................... 17 5.1 Industrial Water and Wastewater Forecast Results ............................................ 18 6.0 Agriculture Water Demand Forecast ................................................................... 20 6.1 Agricultural Projection Methodology .................................................................. 22 6.2 Non Permitted Water Use Operations ................................................................ 22 7.0 Energy Forecast.................................................................................................... 23 7.1 Energy Forecast Results ....................................................................................... 24 8.0 Regional Water Demand Projection Summary .................................................... 24 9.0 Regional Wastewater Flow Projection Summary ................................................ 26 10.0 References ........................................................................................................... 27
COOSA‐NORTH GEORGIA WATER PLANNING REGION WATER AND WASTEWATER FORECASTING TECHNICAL MEMORANDUM
2
Tables
Table 2‐1. CNG Region Population Projections per County
Table 3‐1. 2011 Plan and 2017 Plan Per Capita Water Demand and Per Capita Adjustment for the CNG Region
Table 3‐2. Plumbing Code per Capita Adjustment for Each County for the CNG Region
Table 3‐3. Average Annual Municipal Water Demand Forecast by County (MGD)
Table 4‐1. Average Annual Municipal Wastewater Flow Forecast by County (MGD)
Table 5‐1. Industrial Water Demand Forecast per Industry for the CNG (MGD)
Table 5‐2. Industrial Wastewater Flow Forecast per Industry in the CNG (MGD)
Table 6‐1. Total Agricultural Water Demand for 2015 and 2050 (MGD) for the 75th Percentile Scenario
Table 7‐1. Energy Water Withdrawals and Consumption in MGD for the CNG Region
Figures
Figure 2‐1. Georgia’s Historic Population and Growth Projections
Figure 2‐2. CNG Region Population Projections
Figure 3‐1. Forecasted Municipal Water Demand for Coosa North Georgia Council
Figure 3‐2. Self‐Supply versus Public‐Supply of Municipal Water Demand
Figure 3‐3. Delineation of Water Planning Regions (bold lines) and watershed boundaries (colors)
Figure 3‐4. Water Planning Regions with Aquifers
Figure 3‐5. River Basin Map with Nodes for the State of Georgia
Figure 3‐6. Water Demand per Surface and Groundwater Source
Figure 4‐1. Total Wastewater Flow Forecast by Discharge Type
Figure 4‐2. Wastewater Flow Distribution by Discharge Type for 2015
Figure 5‐1. Surface Water and Groundwater Split for the Industrial Sector in the CNG
Figure 5‐2. Industrial Wastewater Flow Forecast by Discharge Type in the CNG
Figure 8‐1. Water Demand Projections by Basin and Aquifer for the CNG
Figure 8‐2. Water Demand Projections by Sector for the CNG
Figure 9‐1. Wastewater Flow Forecast by Basin for the CNG
Figure 9‐2. Wastewater Flow Forecast by Discharge Type for the CNG

COOSA‐NORTH GEORGIA WATER PLANNING REGION WATER AND WASTEWATER FORECASTING
TECHNICAL MEMORANDUM
3
1.0 Introduction Municipal and industrial water and wastewater forecasts originally were developed for the Coosa North Georgia (CNG) Water Planning Region as part of the Georgia Comprehensive Statewide Water Management Plan, which was adopted in 2011. The Georgia Comprehensive Statewide Water Management Plan requires a 5‐year review and revision of the State Water Plan, which includes updating the original forecasts. Throughout this report, the prior Regional Planning process that occurred in 2009 – 2010 is referred to as the 2011 Plan and the current (2017) update is referred to as the 2017 Plan.
The basic approach to updating the forecasts follows the similar methodology used in developing the
2011 Plan forecasts, as it is described in the Technical Memorandums (TMs) for municipal, industrial,
agriculture and energy sectors. These TMs were included as supplemental documents to the 2011 CNG
Regional Water Development and Conservation Plan. This TM highlights the updates to the original
forecasts to account for changes that have occurred since the original forecasts were generated.
Forecasting water demand each sector entails using a 'driver' multiplied by the ‘rate of use.’ The
planning process examines and forecasts water demand for four major sectors:
Municipal – includes domestic, commercial, and light‐water use industries served by municipal water providers
Industrial – includes separately permitted industries and high‐water use industries served by municipal water providers
Agricultural – includes major crops such as cotton, corn, peanuts, soybean, pecans, specialty crops, and nursery and horticulture; a snapshot of major livestock water use and golf course water use
Energy – includes thermoelectric power generation
2.0 Population Forecast The Governor’s Office of Planning and Budget (OPB) is responsible for preparing official demographic data for the state, and has engaged the Carl Vinson Institute of Government (CVIOG) at the University of Georgia to produce a definitive and consistent set of population projections for use by all agencies of state government. Population projections were developed for all the counties within the state and were released in 2015 with projections through 2050. Population projections are used as inputs to prepare water demand and wastewater flow forecasts for the municipal, industrial, and energy sectors during planning effort. In addition, population projections are the foundation for other planning and budgeting activities in which the state is involved.
The 2010 projections used to develop the 2011 Plans were based on the 2000 U.S. Census and then‐current information on natural increase (number of births minus number of deaths) and net migration in Georgia. The latest (2015) update to the statewide population projections also takes into account the 2010 U.S. Census and current information on natural increase and net migration. The updated population projections provide the total resident population of Georgia’s counties from 2013 projected through 2050.
The 2011 Plan forecast showed the State’s population growth at an annual rate of 1.69 percent while the new forecasted growth has annual rate of 1.05 percent as shown on Figure 2‐1.

COOSA‐NORTH GEORGIA WATER PLANNING REGION WATER AND WASTEWATER FORECASTING TECHNICAL MEMORANDUM
4
Figure 2‐1. Georgia’s Historic Population and Growth Projections
Even though the statewide trend showed lower population for 2010 than the populations projected during the 2011 Plan planning exercise, each county had its own individual trend. For the CNG region as a whole the population in 2010 was actually 1.2 percent lower than previously projected. In addition, lower growth rates moving forward are anticipated that will lead to a projected population in 2050 that is almost 74 percent less than the previous projections as shown on Figure 2‐2. The new population projections by county are shown in Table 2‐1.
Historic Population
2011 Plan Population
2017 Plan Population

COOSA‐NORTH GEORGIA WATER PLANNING REGION WATER AND WASTEWATER FORECASTING
TECHNICAL MEMORANDUM
5
2010 2015 2020 2025 2030 2035 2040 2045 2050
2011 Plan 755,255 832,083 915,136 1,007,283 1,105,305 1,207,198 1,315,445 1,427,926 1,551,894
2017 Plan 746,264 759,880 786,034 808,188 830,343 846,300 862,256 877,231 892,207
Figure 2‐2. CNG Region Population Projections
Table 2‐1. CNG Region Population Projections per County
County 2015 2020 2025 2030 2035 2040 2045 2050
Catoosa 66,522 69,484 72,181 74,878 77,064 79,250 81,230 83,210
Chattooga 25,171 25,224 25,075 24,926 24,471 24,017 23,479 22,941
Dade 16,542 16,575 16,464 16,353 16,122 15,892 15,642 15,393
Dawson 23,551 25,736 27,993 30,251 32,592 34,934 37,469 40,003
Fannin 23,926 24,272 24,310 24,349 24,002 23,656 23,304 22,952
Floyd 96,639 98,546 100,027 101,509 102,361 103,214 103,803 104,392
Gilmer 28,925 29,754 30,424 31,094 31,633 32,172 32,960 33,749
Gordon 56,865 59,527 61,746 63,966 65,506 67,045 68,168 69,290
Habersham 44,193 46,535 49,216 51,898 54,868 57,837 61,349 64,860
Lumpkin 31,701 33,655 35,461 37,267 38,922 40,577 42,389 44,201
0
200,000
400,000
600,000
800,000
1,000,000
1,200,000
1,400,000
1,600,000
1,800,000
2010 2015 2020 2025 2030 2035 2040 2045 2050
Coosa North Geo
rgia Population Projection
Round 1 Round 2

COOSA‐NORTH GEORGIA WATER PLANNING REGION WATER AND WASTEWATER FORECASTING TECHNICAL MEMORANDUM
6
Table 2‐1. CNG Region Population Projections per County
County 2015 2020 2025 2030 2035 2040 2045 2050
Murray 39,554 40,152 40,252 40,353 39,686 39,019 37,879 36,739
Pickens 30,218 31,781 33,196 34,610 35,860 37,109 38,569 40,028
Polk 41,781 43,176 44,171 45,166 45,651 46,136 46,358 46,579
Towns 10,968 11,496 12,214 12,931 13,924 14,917 16,332 17,747
Union 21,854 22,575 23,150 23,724 24,042 24,361 24,869 25,377
Walker 68,730 69,933 70,567 71,200 70,989 70,777 70,170 69,562
White 28,246 29,390 30,491 31,593 32,554 33,515 34,677 35,839
Whitfield 104,496 108,222 111,250 114,277 116,052 117,828 118,586 119,343
TOTAL 759,882 786,034 808,188 830,343 846,300 862,256 877,231 892,207
2.1 Employment Forecast
The 2011 Plan included industrial water and wastewater transfer forecasts based on employment projections produced by CVIOG. Because updated employment projections are not yet available, the industrial water demands and wastewater discharges remained unchanged and they will be summarized in this TM.
3.0 Municipal Water Needs Forecast Municipal water demand includes residential, commercial, and light industrial customers who are served by a public provider. Publicly supplied water users obtain their water from centralized municipal or large private suppliers, such as county or city water treatment plants; self‐supplied users obtain their water from private wells. Demands for major water using industries were projected separately and the methodology for this forecast is discussed below. To calculate the overall countywide municipal water demand, per capita water demand rates were developed for both self‐supplied and publicly supplied users and multiplied by population projections. A plumbing code adjustment also was applied to account for water conservation legislation that was adopted in 2010 as well as existing plumbing codes. The publicly‐supplied and self‐supplied water demand was calculated separately for each Water Planning Region.
The original per capita number for the 2011 Plan were based on data published in the 2005 USGS publication and then adjusted to account for wholesale and large industrial sales. The references and assumptions used to develop the 2011 Plan per capita projections for each county are summarized in the Municipal and Industrial Water and Wastewater Forecasting TM (July 1, 2010). The 2011 Plan per capita numbers were used as the basis for the 2017 Plan forecasting efforts. The Georgia Environmental Protection Division (GAEPD) developed an adjustment to be applied to the 2011 Plan per capita numbers before the forecasting was performed. A description of the adjustments made to the per capita water demand for the current projections is included below.
Each county’s demand was forecasted separately and distributed regionally based on source watershed and aquifer location. Representatives of municipal and private water suppliers were given the opportunity to refine any forecasts if the data was not representative of their demographics or growth.

COOSA‐NORTH GEORGIA WATER PLANNING REGION WATER AND WASTEWATER FORECASTING
TECHNICAL MEMORANDUM
7
3.1 Adjustment of the 2011 Plan per Capita Water Demand for the 2017 Plan Forecasts
To obtain the per capita water demand by county for the updated 2017 Plan forecasts, GAEPD reviewed actual withdrawal data and calculated adjustment factors for each county’s per capita water demand as follows:
1. A per capita value for each year, 2010 through 2014, was developed using actual withdrawal data and estimated population‐served data.
2. The percent rate of change was calculated for each year interval (2011 to 2011, 2011 to 2012, 2012 to 2013, 2013 to 2014), and the average of those four values was calculated as the per capita water demand adjustment factor. Table 3.1 shows the 2017 Plan adjustment factors for the CNG region. The results are an average 0.6 percent decline in per capita values for the CNG region.
3. The adjustment factor for each county was then applied to the 2011 Plan per capita water demand value calculated in the 2011 Plan of the forecasting efforts. This updated per capita value was used to obtain water demand forecasts through 2050. Table 3‐1 shows the 2011 Plan and the 2017 Plan per capita values after the adjustment factor was applied.
4. The ratio of public‐supplied to self‐supplied water use in each county for the 2011 Plan as well as the self‐supplied value of 75 gallons per capita per day (gpcd) were maintained for the 2017 Plan.
Table 3‐1. 2011 Plan and 2017 Plan Per Capita Water Demand and Per Capita Adjustment for the CNG Region
County 2011 Plan Adjusted Per Capita
(gpcd) Average Per Capita Delta
2017 Plan Per Capita (gpcd)
Catoosa 121 ‐5.1% 114
Chattooga 164 1.0% 165
Dade 134 ‐7.8% 124
Dawson 160 ‐1.9% 157
Fannin 150 0.1% 150
Floyd 133 0.5% 134
Gilmer 141 1.1% 142
Gordon 159 ‐0.7% 158
Habersham 170 2.7% 174
Lumpkin 166 1.1% 167
Murray 145 ‐7.9% 134
Pickens 133 8.5% 144
Polk 167 1.3% 170
Towns 141 ‐1.2% 139
Union 149 ‐5.3% 141
Walker 145 0.3% 145
White 150 0.1% 150

COOSA‐NORTH GEORGIA WATER PLANNING REGION WATER AND WASTEWATER FORECASTING TECHNICAL MEMORANDUM
8
Whitfield 224 2.6% 230
3.2 Plumbing Code Water Efficiency Adjustment
Since 1994, the national plumbing codes have mandated lower maximum flush rates for toilets available in the US, which has resulted in significant reductions in water demand in Georgia and nationwide, and will continue to do so over the planning period through 2050 for this forecasting. Also, in 2010, the Georgia Water Stewardship Act further increased the efficiency of plumbing fixtures in Georgia. Therefore, per capita water demand rates were adjusted for plumbing efficiency savings. The adjustment was reset to zero in 2015 but then applied in all future planning years to reflect the replacement of existing toilets with more efficient toilets over time. This updated per capita value with plumbing code savings was used to obtain water demand forecasts through 2050. Table 3‐2 shows the adjusted per capita values by county for the CNG.
Table 3‐2. Plumbing Code per Capita Adjustment for Each County for the CNG Region (gpcd)
County 2015* 2020 2030 2040 2050
Catoosa 0 1.1 3.3 5.5 7.8
Chattooga 0 1.4 4.2 7.0 9.9
Dade 0 1.2 3.7 6.1 8.6
Dawson 0 0.7 2.1 3.6 5.1
Fannin 0 0.8 2.6 4.3 6.0
Floyd 0 1.3 4.1 6.8 9.5
Gilmer 0 0.8 2.4 4.0 5.6
Gordon 0 1.0 3.1 5.3 7.4
Habersham 0 1.0 3.1 5.3 7.4
Lumpkin 0 0.8 2.5 4.2 5.9
Murray 0 1.0 3.1 5.2 7.3
Pickens 0 0.8 2.6 4.3 6.1
Polk 0 1.3 3.9 6.5 9.1
Towns 0 0.9 2.7 4.6 6.4
Union 0 0.8 2.5 4.1 5.8
Walker 0 1.3 4.0 6.7 9.4
White 0 0.8 2.6 4.3 6.1
Whitfield 0 1.2 3.6 6.0 8.4
NOTES:
* The municipal water demands estimated for 2015 were based on actual withdrawals; therefore, it is assumed the plumbing code adjustment is already included in the data.
COOSA‐NORTH GEORGIA WATER PLANNING REGION WATER AND WASTEWATER FORECASTING
TECHNICAL MEMORANDUM
9
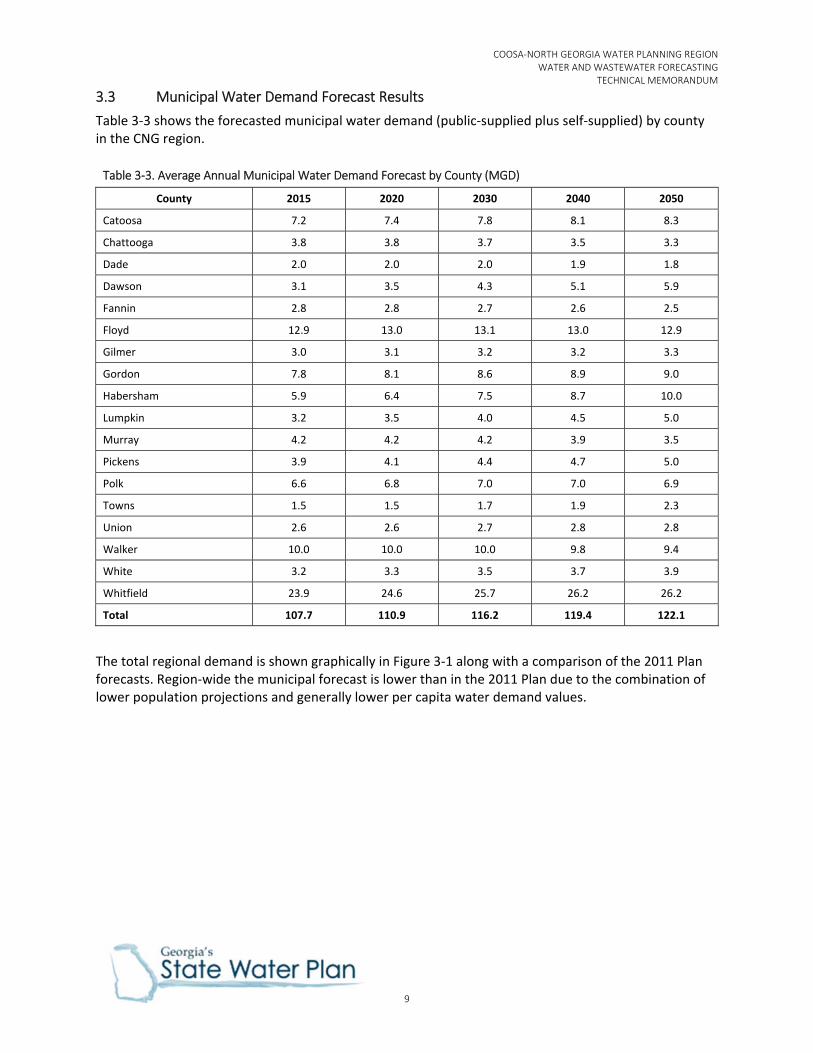
3.3 Municipal Water Demand Forecast Results
Table 3‐3 shows the forecasted municipal water demand (public‐supplied plus self‐supplied) by county in the CNG region.
Table 3‐3. Average Annual Municipal Water Demand Forecast by County (MGD)
County 2015 2020 2030 2040 2050
Catoosa 7.2 7.4 7.8 8.1 8.3
Chattooga 3.8 3.8 3.7 3.5 3.3
Dade 2.0 2.0 2.0 1.9 1.8
Dawson 3.1 3.5 4.3 5.1 5.9
Fannin 2.8 2.8 2.7 2.6 2.5
Floyd 12.9 13.0 13.1 13.0 12.9
Gilmer 3.0 3.1 3.2 3.2 3.3
Gordon 7.8 8.1 8.6 8.9 9.0
Habersham 5.9 6.4 7.5 8.7 10.0
Lumpkin 3.2 3.5 4.0 4.5 5.0
Murray 4.2 4.2 4.2 3.9 3.5
Pickens 3.9 4.1 4.4 4.7 5.0
Polk 6.6 6.8 7.0 7.0 6.9
Towns 1.5 1.5 1.7 1.9 2.3
Union 2.6 2.6 2.7 2.8 2.8
Walker 10.0 10.0 10.0 9.8 9.4
White 3.2 3.3 3.5 3.7 3.9
Whitfield 23.9 24.6 25.7 26.2 26.2
Total 107.7 110.9 116.2 119.4 122.1
The total regional demand is shown graphically in Figure 3‐1 along with a comparison of the 2011 Plan forecasts. Region‐wide the municipal forecast is lower than in the 2011 Plan due to the combination of lower population projections and generally lower per capita water demand values.

COOSA‐NORTH GEORGIA WATER PLANNING REGION WATER AND WASTEWATER FORECASTING TECHNICAL MEMORANDUM
10
2015 2020 2030 2040 2050
2011 Plan 117 128 153 180 209
2017 Plan 108 111 116 119 122
Figure 3‐1. Forecasted Municipal Water Demand for Coosa North Georgia Council
3.4 Water Sources and Geographic Distribution of Projected Demands
Municipal water demands represent the summation of the public‐supplied and self‐supplied water
demand forecasts for each county. As mentioned above, the percent of county population that is public‐
supplied and self‐supplied remains the same from the 2011 Plan. This ratio was derived from the 2005
USGS estimates and the regional council and water providers evaluated them through the review
process. Figure 3‐2 shows split between self‐supply and public‐supply water demand for the region.
0
50
100
150
200
250
2010 2015 2020 2025 2030 2035 2040 2045 2050
Coosa North Geo
rgia W
ater Dem
and (MGD)
2011 Plan 2017 Plan

COOSA‐NORTH GEORGIA WATER PLANNING REGION WATER AND WASTEWATER FORECASTING
TECHNICAL MEMORANDUM
11
2015 2020 2030 2040 2050
Public‐Supply 95.9 99.3 104.8 108.4 111.5
Self‐Supply 11.8 11.7 11.4 11.0 10.6
Figure 3‐2. Self‐Supply versus Public‐Supply of Municipal Water Demand
For source distribution purposes, it was assumed that all self‐supplied municipal (i.e., domestic
residential) water use came from groundwater. The allocation of public‐supplied municipal water among
surface water and groundwater sources was determined using an updated GAEPD permit database that
included water use data, and input from water suppliers. The 2014 water withdrawal quantities and
locations were sorted and used to distribute proportionally the public‐supply water demand to their
assigned watersheds or groundwater sources. The percent of county public‐supply municipal water by
surface water and groundwater by county were retained from the 2011 Plan and used to distribute the
updated county municipal water demand by sources.
3.5 Forecast Aggregation
Forecasts for municipal water demand were aggregated per watershed unit within the planning region
as shown on Figure 3‐3. Aquifers were aggregated in accordance with Figure 3‐4. The Planning
Contractors also subdivided the planning regions into “Nodes” that are consistent with the River Basin
Planning Tool used for the Surface Water Availability Assessments as shown on Figure 3‐5. The
allocation of surface water by stream node (for the surface water models) and groundwater by aquifer
(for the groundwater models) remains the same proportions as in the 2011 Plan.
0
20
40
60
80
100
120
140
2015 2020 2030 2040 2050
Coosa North Geo
rgia W
ater Dem
and Forecast (MGD)
Public‐Supply Self‐Supply

COOSA‐NORTH GEORGIA WATER PLANNING REGION WATER AND WASTEWATER FORECASTING TECHNICAL MEMORANDUM
12
Figure 3‐3. Delineation of Water Planning Regions (bold lines) and watershed boundaries (colors)
Figure 3‐4. Water Planning Regions with Aquifers

COOSA‐NORTH GEORGIA WATER PLANNING REGION WATER AND WASTEWATER FORECASTING
TECHNICAL MEMORANDUM
13
Figure 3‐5. River Basin Map with Nodes for the State of Georgia

COOSA‐NORTH GEORGIA WATER PLANNING REGION WATER AND WASTEWATER FORECASTING TECHNICAL MEMORANDUM
14
The updated county municipal water demand forecasts were aggregated among surface water nodes and groundwater aquifers for analysis with other components of the state water plan update. For the CNG region, most of the municipal water comes from the Coosa Basin as shown in Figure 3‐6.
Figure 3‐6. Water Demand per Surface and Groundwater Source
3.6 Additional Considerations
It is recognized that in many parts of Georgia, transient populations due to universities, military installations, or seasonal tourism can have a significant effect on per capita water demand rates. These transient and seasonal demands are embedded within historical use data and/or accounted for by OPB projections used to prepare the forecasted demands. These adjustments were not changed in the 2017 Plan updates.
4.0 Municipal Wastewater Flow Forecast Estimates of municipal wastewater flows were determined for each county and watershed within a planning region. For the 2011 Plan, the municipal water demand served as the basis for estimating the municipal wastewater flows for each county with a portion of the water demand assumed to be indoor use that entered the wastewater system. While self‐supplied water demand was assumed to go to a septic system, public‐supplied water in each county had a portion going to septic and a portion to centralized treatment.
Inflow and infiltration (I&I) is a term used to describe the entrance of groundwater and stormwater into centralized sanitary sewer systems. Inflow is stormwater that enters the sanitary sewer systems at points of direct connection to the system while infiltration is groundwater that enters sanitary sewer systems through cracks and/or leaks in the sanitary sewer lines. During the 2011 Plan, a percentage
0
20
40
60
80
100
120
140
2015 2020 2030 2040 2050
Coosa North Geo
rgia W
ater Dem
and Forecast (MGD)
Chattahoochee Basin Coosa Basin Tennesee Basin Paleozoic‐rock Aquifers Crystalline‐rock Aquifers

COOSA‐NORTH GEORGIA WATER PLANNING REGION WATER AND WASTEWATER FORECASTING
TECHNICAL MEMORANDUM
15
based on literature review was added to the wastewater generation forecast. Finally, centralized flow estimate was allocated between point discharge (NPDES) and land applications (LAS).
For the 2017 Plan, GAEPD used currently permitted wastewater treatment plant flow data and reported discharge flow, as available, and OPB populations to estimate future wastewater generation, allocations and expansions. GAEPD utilized 2014 historic discharge data to forecast future wastewater flows by county. The percent population change between the 2017 Plan population projection base year (2015) and each planning year (2020, 2030, 2040, and 2050) was applied to the historical wastewater discharge totals for each county from 2014 to get estimated total county discharge flows for each planning year. In addition, the following approach was provided for the municipal wastewater forecast update:
1. The percent of county total wastewater flow that was septic during the 2011 Plan was retained. For some counties this percentage changes over time as more of the county joins the centralized sewer systems. The change over time was estimated and approved by the council members in the 2011 Plan.
2. For the 2017 Plan update, the percent change between the 2011 Plan and the 2017 Plan population projections for each planning year through 2050 were applied to the 2011 Plan septic flow forecasts to obtain an updated septic flow projection by county for the 2017 Plan.
3. Wastewater forecasts were proportionally allocated per facility for each county using the historical discharge data. Forecasts were then manually adjusted based on knowledge of new facilities and the decommissioning of old facilities. Facility type for centralized discharge was broken down into three categories: point discharge, Land Application System (LAS), and general subsurface permits.
4. It was assumed that there will be no expanded capacity LAS facilities during the planning period.
5. Because the 2017 Plan wastewater forecasts were generated using historical discharge information, it was assumed I&I was inherently accounted for in the projections.
6. Historical data was also used to allocate wastewater quantities by Local Drainage Area (LDA) so that quantity, disposal type, and LDA location could be forecasted. Forecasts for centralized wastewater discharge projections were aggregated based on 2014 flow percentages. Septic system flows were aggregated by node based on watershed/land area percentages within each county.
4.1 Municipal Wastewater Flow Forecast Results
Table 4‐1 shows the forecasted municipal wastewater flow per County in the CNG region. The total regional wastewater flow is shown on Figure 4‐1 broken down between septic treatment and centralized treatment that is discharged via a point source or land application. Figure 4‐2 gives a snapshot of how the wastewater is discharged per watershed for 2015.
Table 4‐1. Average Annual Municipal Wastewater Flow Forecast by County (MGD)
County 2015 2020 2030 2040 2050
Catoosa 5.9 6.1 6.4 6.6 6.8
Chattooga 7.8 7.8 7.7 7.4 7.0
Dade 1.9 1.9 1.8 1.7 1.6
Dawson 1.4 1.5 1.7 1.9 2.1
Fannin 2.2 2.2 2.2 2.1 2.1

COOSA‐NORTH GEORGIA WATER PLANNING REGION WATER AND WASTEWATER FORECASTING TECHNICAL MEMORANDUM
16
Table 4‐1. Average Annual Municipal Wastewater Flow Forecast by County (MGD)
County 2015 2020 2030 2040 2050
Floyd 15.2 15.5 15.9 16.1 16.2
Gilmer 4.1 4.2 4.4 4.5 4.7
Gordon 11.4 12.0 12.8 13.3 13.6
Habersham 7.4 8.0 9.3 10.6 12.1
Lumpkin 2.7 3.0 3.5 4.0 4.4
Murray 4.2 4.4 4.5 4.4 4.2
Pickens 2.6 2.7 3.0 3.2 3.4
Polk 6.0 6.2 6.4 6.5 6.5
Towns 1.2 1.3 1.4 1.7 1.9
Union 2.0 2.1 2.2 2.2 2.2
Walker 8.8 8.9 8.9 8.7 8.5
White 2.8 2.9 3.1 3.2 3.4
Whitfield 30.0 31.1 32.7 33.5 33.8
Total 117.7 121.7 127.8 131.6 134.6
0.0
20.0
40.0
60.0
80.0
100.0
120.0
140.0
160.0
2015 2020 2030 2040 2050Coosa North Geo
rgia W
astewater Flow Forecast (MGD)
Septic System Centralized Point Source Land Application System Subsurface System

COOSA‐NORTH GEORGIA WATER PLANNING REGION WATER AND WASTEWATER FORECASTING
TECHNICAL MEMORANDUM
17
Figure 4‐1. Total Wastewater Flow Forecast by Discharge Type
Figure 4‐2. Wastewater Flow Distribution by Discharge Type for 2015
5.0 Industrial Water and Wastewater Forecast Industrial water and wastewater forecasts were not updated for the 2017 Plan because new employment projections are not available. Therefore, the industrial water demand and wastewater flow forecasts were retained from the 2011 Plan planning effort.
During the 2011 Plan forecasting effort, GAEPD worked with a group of stakeholders to establish current and projected industrial water demands and wastewater needs on an industry specific basis. Industries require water for processes, sanitation, cooling, and other purposes, in addition to domestic (employee) water use. Some industries, such as poultry processors, operate under strict USDA (U.S. Department of Agriculture) guidelines that require water use to maintain sanitary conditions within the facilities. Water demand (i.e., the total water requirements of an industry, or the water withdrawals) is for the most part directly linked to production. The 2011 Plan methodology forecasted industrial water demand using employment projections per industry and the 2010 water demand multiplied by the expected employment growth rate into the future for that type of industry. For any industry with a projected decline in employment was retained at the level of water demand before the employment growth rate began to decline.
The industrial wastewater flow was estimated from a wastewater to water ratio developed for each industrial category. Unless direct permit data or external input became available, industrial wastewater volumes were assigned to the watershed in which the industrial water demand occurs. The proportion of water per wastewater treatment option was also kept as it was forecasted during the 2011 Plan.
0
20
40
60
80
100
120
Coosa Savannah Tennessee Chattahoochee Tallapoosa
Coosa North Geo
rgia W
astewater Flow Forecast (MGD)
Septic System Centralized Point Source Land Application System Subsurface System

COOSA‐NORTH GEORGIA WATER PLANNING REGION WATER AND WASTEWATER FORECASTING TECHNICAL MEMORANDUM
18
5.1 Industrial Water and Wastewater Forecast Results
Table 5‐1 shows the 2011 Plan industrial water demand broken down by industry in the CNG with the majority of water demand coming from textiles mills, followed by paper production. Figure 5‐1 shows that for the CNG region, most of the industrial water comes from surface water.
Table 5‐1. Industrial Water Demand Forecast per Industry for the CNG (MGD)
Industry 2015 2020 2030 2040 2050
Textile Mills 33.79 38.21 47.06 54.28 61.49
Paper 27.85 28.90 31.00 33.11 35.21
Mining 7.10 7.27 7.61 7.94 8.27
Textile Product Mills 5.80 6.56 8.08 9.32 10.56
Food 2.63 2.63 2.68 2.76 2.86
Chemical 2.18 2.24 2.35 2.45 2.55
Other Industrial 0.76 0.79 0.87 0.97 1.10
Plastic and Rubber 0.52 0.54 0.56 0.58 0.60
Automotive Equipment 0.43 0.52 0.75 1.09 1.59
Fabricated Metal Product 0.31 0.36 0.51 0.73 1.07
Primary Metal 0.01 0.01 0.01 0.02 0.02
TOTAL 81.39 88.05 101.48 113.23 125.32

COOSA‐NORTH GEORGIA WATER PLANNING REGION WATER AND WASTEWATER FORECASTING
TECHNICAL MEMORANDUM
19
Figure 5‐1. Surface Water and Groundwater Split for the Industrial Sector in the CNG
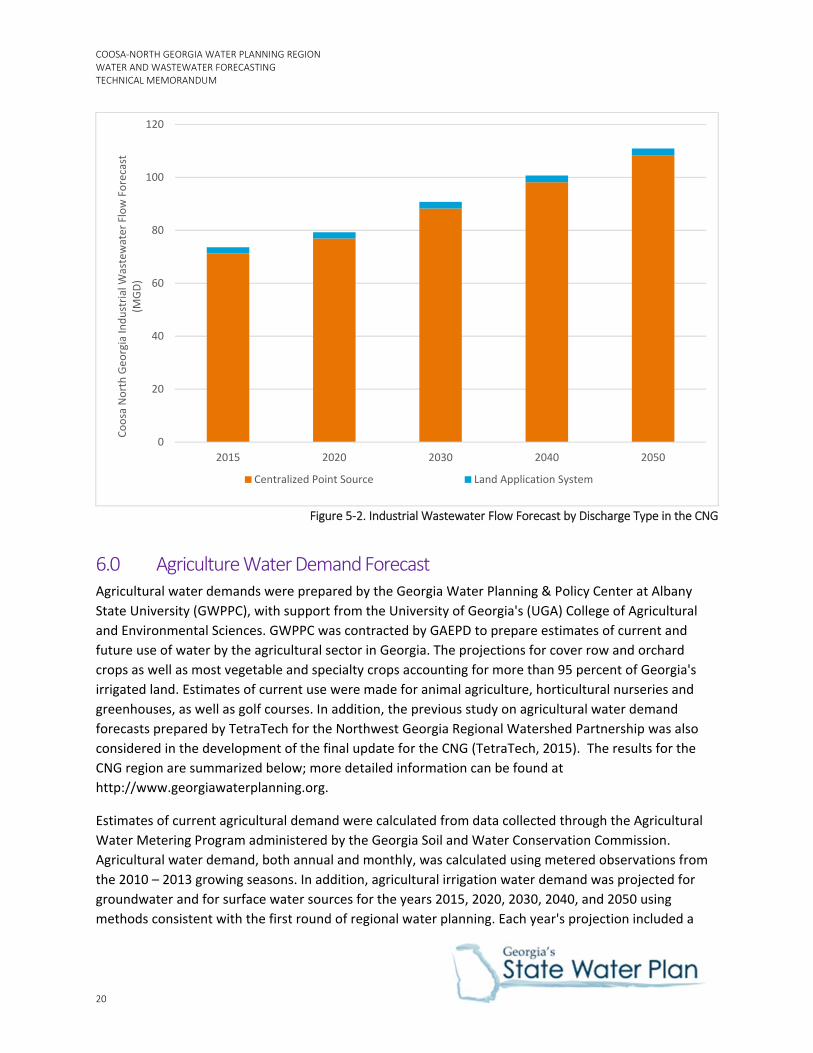
Table 5‐2 provides the forecast of industrial wastewater generated per Industry while Figure 5‐2 shows the wastewater demand by discharge method. The majority of industrial wastewater in the CNG region is discharged via a permitted centralized source for the industrial facility.
Table 5‐2. Industrial Wastewater Flow Forecast per Industry in the CNG (MGD)
Industry 2015 2020 2030 2040 2050
Textile Mills 27.71 31.34 38.59 44.51 50.43
Paper 26.45 27.45 29.45 31.45 33.45
Mining 9.16 9.38 9.81 10.24 10.67
Textile Product Mills 5.21 5.89 7.25 8.37 9.48
Food 2.37 2.37 2.41 2.48 2.57
Chemicals 1.64 1.69 1.77 1.84 1.92
Other Industrial 0.45 0.47 0.52 0.58 0.66
Automotive Equipment 0.26 0.31 0.45 0.65 0.96
Fabricated Metal Products 0.19 0.22 0.30 0.44 0.64
Plastic and Rubber 0.12 0.13 0.13 0.14 0.14
Primary Metals 0.01 0.01 0.01 0.01 0.01
Total 73.58 79.26 90.70 100.71 110.92
0
20
40
60
80
100
120
140
2010 2015 2020 2030 2040 2050Coosa North Geo
rgia Industrial W
ater Dem
and Forecast (MGD)
Surface Water Groundwater
COOSA‐NORTH GEORGIA WATER PLANNING REGION WATER AND WASTEWATER FORECASTING TECHNICAL MEMORANDUM
20
Figure 5‐2. Industrial Wastewater Flow Forecast by Discharge Type in the CNG
6.0 Agriculture Water Demand Forecast Agricultural water demands were prepared by the Georgia Water Planning & Policy Center at Albany
State University (GWPPC), with support from the University of Georgia's (UGA) College of Agricultural
and Environmental Sciences. GWPPC was contracted by GAEPD to prepare estimates of current and
future use of water by the agricultural sector in Georgia. The projections for cover row and orchard
crops as well as most vegetable and specialty crops accounting for more than 95 percent of Georgia's
irrigated land. Estimates of current use were made for animal agriculture, horticultural nurseries and
greenhouses, as well as golf courses. In addition, the previous study on agricultural water demand
forecasts prepared by TetraTech for the Northwest Georgia Regional Watershed Partnership was also
considered in the development of the final update for the CNG (TetraTech, 2015). The results for the
CNG region are summarized below; more detailed information can be found at
http://www.georgiawaterplanning.org.
Estimates of current agricultural demand were calculated from data collected through the Agricultural
Water Metering Program administered by the Georgia Soil and Water Conservation Commission.
Agricultural water demand, both annual and monthly, was calculated using metered observations from
the 2010 – 2013 growing seasons. In addition, agricultural irrigation water demand was projected for
groundwater and for surface water sources for the years 2015, 2020, 2030, 2040, and 2050 using
methods consistent with the first round of regional water planning. Each year's projection included a
0
20
40
60
80
100
120
2015 2020 2030 2040 2050
Coosa North Geo
rgia Industrial W
astewater Flow Forecast
(MGD)
Centralized Point Source Land Application System

COOSA‐NORTH GEORGIA WATER PLANNING REGION WATER AND WASTEWATER FORECASTING
TECHNICAL MEMORANDUM
21
wet year, a normal year, and a dry year to simulate a range of weather conditions. Irrigated areas for
each crop were projected from the baseline of year 2015 acres using economic models. Water
withdrawal quantities were computed as the product of the projected irrigated area for a crop (acres),
the predicted monthly irrigation application depth (inches), and the proportion of irrigation water
derived from a source (fraction). While fields irrigated by wells only were assigned as 100 percent
groundwater, the proportion of a county's water obtained from surface water sources was reduced to
70 percent of the estimated amount. This adjustment was applied in recognition of observed irrigation
patterns since they are often limited by water available in streams or rainfall that refills ponds. The final
monthly withdrawals (acre‐inches) by crop were summed for each county and/or drainage area. To be
consistent with other water planning efforts, the data was converted to million gallons per day (MGD).
To address the potential climate extremes in the forecasts, a range of agricultural irrigation demand
scenarios were considered, including the 10th, 25th, 50th, 75th, and 90th percentiles. The 50th
percentile value represents the average rainfall conditions and the median water demand, while the
75th percentile represents the dry year conditions when higher irrigation demands are expected. For
planning purposes, it was decided to use the 75th percentile values for each region since they represent
a more conservative scenario than the median value. The agricultural water demand forecast for the
CNG planning region is summarized in Table 8.
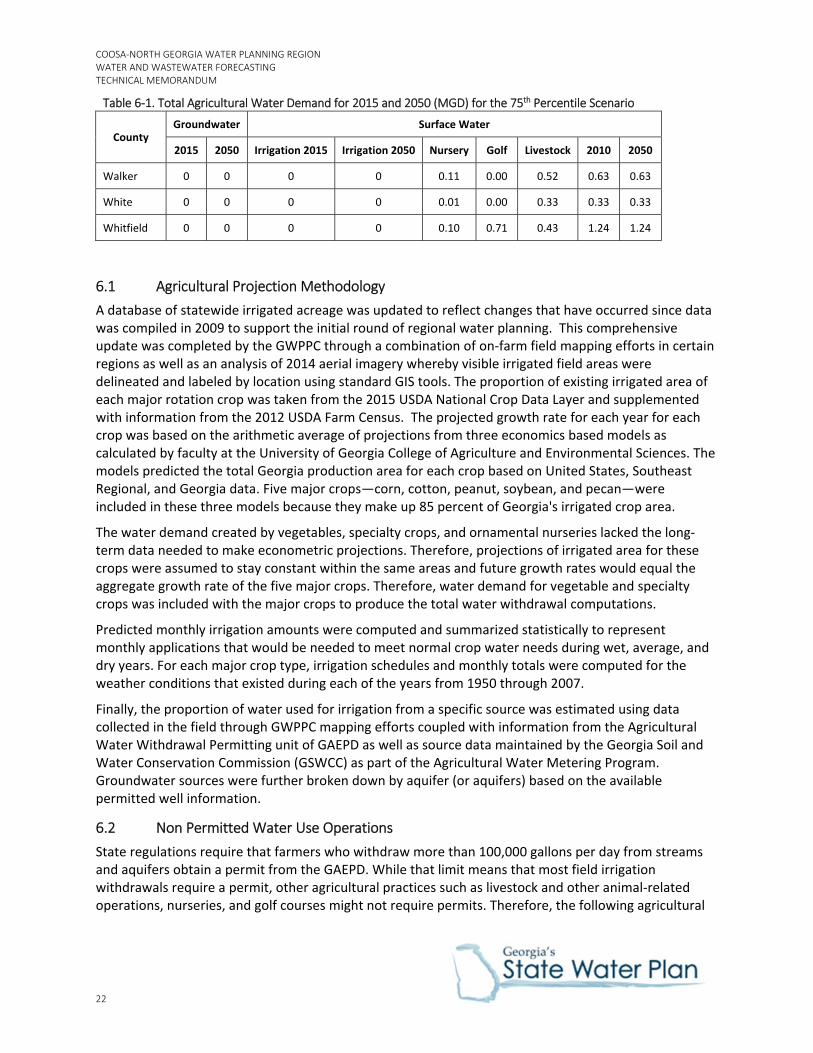
Table 6‐1. Total Agricultural Water Demand for 2015 and 2050 (MGD) for the 75th Percentile Scenario
County Groundwater Surface Water
2015 2050 Irrigation 2015 Irrigation 2050 Nursery Golf Livestock 2010 2050
Catoosa 0 0 0.156 0.180 0.126 0.558 0.187 1.028 1.051
Chattooga 0 0 0 0 0.06 0.00 0.24 0.30 0.30
Dade 0 0 0 0 0.03 0.00 0.16 0.19 0.19
Dawson 0 0 0.09 0.10 0.03 0.27 0.22 0.61 0.62
Fannin 0 0 0.15 0.19 0.03 0.00 0.09 0.27 0.31
Floyd 0 0 0.90 0.86 0.13 0.30 0.68 2.01 1.97
Gilmer 0 0 0 0 0.11 0.45 0.81 1.37 1.37
Gordon 0 0 1.26 1.28 0.06 0.20 0.99 2.50 2.52
Habersham 0 0 0.30 0.33 0.31 0.40 0.57 1.58 1.61
Lumpkin 0 0 0.08 0.10 0.13 0.00 0.15 0.37 0.38
Murray 0 0 0.13 0.12 0.32 0.00 0.32 0.77 0.76
Pickens 0 0 0 0 0.01 0.13 0.25 0.39 0.39
Polk 0 0 0 0 0.08 0.00 0.26 0.34 0.34
Towns 0 0 0 0 0.01 0.20 0.09 0.31 0.31
Union 0 0 0.03 0.03 0.23 0.41 0.06 0.74 0.74
COOSA‐NORTH GEORGIA WATER PLANNING REGION WATER AND WASTEWATER FORECASTING TECHNICAL MEMORANDUM
22
Table 6‐1. Total Agricultural Water Demand for 2015 and 2050 (MGD) for the 75th Percentile Scenario
County Groundwater Surface Water
2015 2050 Irrigation 2015 Irrigation 2050 Nursery Golf Livestock 2010 2050
Walker 0 0 0 0 0.11 0.00 0.52 0.63 0.63
White 0 0 0 0 0.01 0.00 0.33 0.33 0.33
Whitfield 0 0 0 0 0.10 0.71 0.43 1.24 1.24
6.1 Agricultural Projection Methodology
A database of statewide irrigated acreage was updated to reflect changes that have occurred since data was compiled in 2009 to support the initial round of regional water planning. This comprehensive update was completed by the GWPPC through a combination of on‐farm field mapping efforts in certain regions as well as an analysis of 2014 aerial imagery whereby visible irrigated field areas were delineated and labeled by location using standard GIS tools. The proportion of existing irrigated area of each major rotation crop was taken from the 2015 USDA National Crop Data Layer and supplemented with information from the 2012 USDA Farm Census. The projected growth rate for each year for each crop was based on the arithmetic average of projections from three economics based models as calculated by faculty at the University of Georgia College of Agriculture and Environmental Sciences. The models predicted the total Georgia production area for each crop based on United States, Southeast Regional, and Georgia data. Five major crops—corn, cotton, peanut, soybean, and pecan—were included in these three models because they make up 85 percent of Georgia's irrigated crop area.
The water demand created by vegetables, specialty crops, and ornamental nurseries lacked the long‐term data needed to make econometric projections. Therefore, projections of irrigated area for these crops were assumed to stay constant within the same areas and future growth rates would equal the aggregate growth rate of the five major crops. Therefore, water demand for vegetable and specialty crops was included with the major crops to produce the total water withdrawal computations.
Predicted monthly irrigation amounts were computed and summarized statistically to represent monthly applications that would be needed to meet normal crop water needs during wet, average, and dry years. For each major crop type, irrigation schedules and monthly totals were computed for the weather conditions that existed during each of the years from 1950 through 2007.
Finally, the proportion of water used for irrigation from a specific source was estimated using data collected in the field through GWPPC mapping efforts coupled with information from the Agricultural Water Withdrawal Permitting unit of GAEPD as well as source data maintained by the Georgia Soil and Water Conservation Commission (GSWCC) as part of the Agricultural Water Metering Program. Groundwater sources were further broken down by aquifer (or aquifers) based on the available permitted well information.
6.2 Non Permitted Water Use Operations
State regulations require that farmers who withdraw more than 100,000 gallons per day from streams and aquifers obtain a permit from the GAEPD. While that limit means that most field irrigation withdrawals require a permit, other agricultural practices such as livestock and other animal‐related operations, nurseries, and golf courses might not require permits. Therefore, the following agricultural

COOSA‐NORTH GEORGIA WATER PLANNING REGION WATER AND WASTEWATER FORECASTING
TECHNICAL MEMORANDUM
23
practices were considered during the forecasting period but forecasting numbers were not developed due to the lack of reliable data.
6.2.1 Livestock and Other Animal Operations
The GWPPC, with input from industry experts, estimated the aggregate water use in each livestock sector for each county and planning region. These estimates were not forecasted into the future. The data sources used for these estimates were the same as those used in the previous planning sector.
6.2.2 Nurseries and Greenhouses
The GWPPC prepared estimates of current water use by horticultural nurseries and greenhouses, but these estimates were not projected into the future. The data used to determine the extent of these operations was the same as that used in the previous planning cycle (Georgia Agricultural Statistics Service). While the horticultural sector is diverse, these estimates are focused on parts of the sector that are substantial but not captured in other water use estimates. For example, while landscape and lawn irrigation could be considered a part of this sector and accounts for a significant portion of the State's water use and much of its consumption, it was assumed to be accounted for within other sections of the state water demand analyses.
Water use in nurseries is difficult to quantify due to the ever changing inventory and the variable water needs of each plant depending on their type and size. Therefore, in the previous planning cycle, an ad hoc group including industry stakeholders and experts developed broad categories of water use in nurseries using studies conducted by the Agricultural Water Pumping and Plant Research Plots and surveys conducted by the Cooperative Extension Service Irrigation Surveys and the Green Industry. For in‐ground nurseries average annual use is estimated at 31 inches; for container nurseries, 87 inches; and for greenhouses, 121 inches. These rates were used to develop water use estimates for each county for each type of nursery operation. Greenhouse water use numbers are larger because the elevated temperatures increase water losses but water use is expected to vary very little from year to year of from dry to wet seasons because they are covered. Although not included in the industry survey, lower management nurseries, like Christmas tree farms, tend to use less water than higher production, in‐ground nurseries.
6.2.3 Golf Courses
In counties and state water planning regions with non‐municipality water supplied golf courses, their water needs were estimated with the support of the Georgia Golf Course Superintendents Association (GGCSA), GAEPD, and research on GGCSA Best Management Practices (BMPs). The data does not forecast golf course water use in the future but does provide water use estimates in an average rainfall year and in a dry year.
7.0 Energy Forecast For the 2017 Plan, statewide energy water demands and new projections of energy demand were estimated based on the new population projections and the relationship between population and energy demand. The 2008 population projections were developed prior to the recession. In addition, the 2010 U.S. Census showed actual populations to be lower than the projected populations in the 2008 projections. The updated 2015 population projections, developed after the recession, show a more modest future growth rate, and project almost 5 million less people in the state in 2050 than previously estimated.

COOSA‐NORTH GEORGIA WATER PLANNING REGION WATER AND WASTEWATER FORECASTING TECHNICAL MEMORANDUM
24
As in the 2011 Plan, a baseline and high demand scenario were estimated using the revised population projections. The same regression relationship between historic power generation and population was used to generate the updated estimates of power need. The energy forecast TM developed by CDM Smith (2016) describes in detail the energy generation for the entire state and the allocation by water planning district.
7.1 Energy Forecast Results
The CNG region has one coal plant with a cooling tower system listed through the planning horizon, Plant Bowen. The same water withdrawal and consumptive use factors by generating configuration were maintained from the 2011 Plan. Water withdrawals and consumption for the CNG region are shown in Table 7‐1. The water withdrawals are higher for the expected growth scenario because the generation configuration is different for each of those scenarios. Under the high growth scenario, a more water efficient power generation configuration is expected to be implemented.
Table 7‐1. Energy Water Withdrawals and Consumption in MGD for the CNG Region
County 2015 2020 2030 2040 2050
Expected Growth Scenario
Withdrawal 440 315 363 396 405
Consumption 0 0 0 0 0
High Growth Scenario
Withdrawal 429 288 292 313 353
Consumption 0 0 0 0 0
8.0 Regional Water Demand Projection Summary The total regional water demand for municipal, industrial, agricultural and energy sectors in the CNG region are summarized on Figure 8‐1, which shows the regional water demand per basin for surface water withdrawals and by aquifer for groundwater withdrawals. For the energy sector, the values under the expected scenario were used to totalize the water demands. Figure 8‐2 illustrates total water demand projections by sector.

COOSA‐NORTH GEORGIA WATER PLANNING REGION WATER AND WASTEWATER FORECASTING
TECHNICAL MEMORANDUM
25
Figure 8‐1. Water Demand Projections by Basin and Aquifer for the CNG
0
100
200
300
400
500
600
700
800
2015 2020 2030 2040 2050
Coosa North Geo
rgia W
ater Dem
and (MGD)
Chattahoochee Basin Coosa Basin Tennesee Basin Paleozoic‐rock Aquifers Crystalline‐rock Aquifers
0
100
200
300
400
500
600
700
800
2015 2020 2030 2040 2050
Cossa North Geo
rgia W
ater Dem
and (MGD)
Municipal Industrial Energy Agricultural

COOSA‐NORTH GEORGIA WATER PLANNING REGION WATER AND WASTEWATER FORECASTING TECHNICAL MEMORANDUM
26
Figure 8‐2. Water Demand Projections by Sector for the CNG
9.0 Regional Wastewater Flow Projection Summary The total regional wastewater forecasts including municipal, industrial, and energy discharges for the CNG region are summarized in the following figures. Figure 9‐1 shows the wastewater demand per basin while Figure 9‐2 shows the forecasted wastewater flows by disposal type.
Figure 9‐1. Wastewater Flow Forecast by Basin for the CNG
0
100
200
300
400
500
600
700
2015 2020 2030 2040 2050
Coosa North Geo
rgia W
astewater Flow Forecast (MGD)
Chattahoochee Basin Coosa Basin Savannah Basin Tallapoosa Basin Tennesee Basin

COOSA‐NORTH GEORGIA WATER PLANNING REGION WATER AND WASTEWATER FORECASTING
TECHNICAL MEMORANDUM
27
Figure 9‐2. Wastewater Flow Forecast by Discharge Type for the CNG
10.0 References CDM Smith. April 2016. Update of Georgia Energy needs and Generating Facilities. http://www.georgiawaterplanning.org/
CH2M HILL. March 2008. Georgia Water Use and Conservation Profiles.
CH2M HILL. August 2010. Municipal and Industrial Water and Wastewater Forecasting for the Coosa North Georgia Region. http://www.coosanorthgeorgia.org/pages/our_plan/Coosa_North_Georgia_Supplemental_Materials.php
Fanning, J.L. and V.P. Trent. 2009. Water Use by County for 2005; Water‐Use Trends, 1980‐2005. United States Geological Survey Publication.
Tetra Tech, 2015. North Georgia Agricultural Water Use Study. Prepared for the Northwest Georgia Regional Watershed Partnership. http://www.ngawater.org/blog/index.php/2015/12/29/north‐georgia‐agricultural‐water‐use‐study/
0
100
200
300
400
500
600
700
800
2015 2020 2030 2040 2050
Coosa North Geo
rgia W
astewater Flow Forecast (MGD)
Centralized Point Source Land Application System Septic System Subsurface System