Embed Size (px)
Citation preview

The University of Maine The University of Maine
DigitalCommons@UMaine DigitalCommons@UMaine
Honors College
Spring 2019
Techno-Economic Analysis of a Seaweed Extraction Process Techno-Economic Analysis of a Seaweed Extraction Process
Zachary Applebee University of Maine
Follow this and additional works at: https://digitalcommons.library.umaine.edu/honors
Part of the Chemical Engineering Commons
Recommended Citation Recommended Citation Applebee, Zachary, "Techno-Economic Analysis of a Seaweed Extraction Process" (2019). Honors College. 492. https://digitalcommons.library.umaine.edu/honors/492
This Honors Thesis is brought to you for free and open access by DigitalCommons@UMaine. It has been accepted for inclusion in Honors College by an authorized administrator of DigitalCommons@UMaine. For more information, please contact [email protected].

TECHNO-ECONOMIC ANALYSIS OF A SEAWEED EXTRACTION PROCESS
by
Zachary Applebee
A Thesis Submitted in Partial Fulfillment of the Requirements for a Degree with Honors
(Chemical Engineering)
The Honors College
University of Maine
May 2019
Advisory Committee: G. Peter van Walsum, Associate Professor of Chemical Engineering, Advisor William Gramlich, Associate Professor of Chemistry David Gross, Preceptor in the Honors College Sara Walton, Lecturer in Chemical Engineering M. Clayton Wheeler, Professor of Chemical Engineering

ABSTRACT
The goal of this thesis was to perform a techno-economic analysis of a seaweed
polysaccharide extraction process that could estimate how economically viable it would
be to harvest and process seaweed in Maine to produce algal polysaccharides. I pursued
two investigations to answer this question:
First, I continued the research I have been doing on an EPSCoR SEANET funded
undergraduate research team working on the extraction and fractionation of sugar kelp
(Saccharina latissima) to produce three different separated polysaccharides: alginate,
laminarin, and fucoidan. My contributions to this project were primarily to hydrolyze
whole pieces of seaweed and extracted samples and quantify their saccharide
composition by running the hydrolysates through HPLC. I also prepared samples for
elemental analysis by ICP-MS and contributed to tasks associated with the extraction and
fractionation work. The seaweed samples we used were harvested from various locations
along the Maine coast and collected at different harvest times. Each of these samples
were analyzed individually. In this way we could determine the relative amounts of each
type of polysaccharide in the different samples.
Second, I constructed a process model of our extraction process in the modeling
software program ASPEN Plus. A principle task in constructing the model was to
translate our multi step batch processes used in the laboratory into a continuous unit
operations-based model. I used this model to develop financial viability criteria for the
economics of extracting polysaccharides from Maine seaweeds. The desired output of the
model was to generate estimated values of the harvested seaweeds to a potential seaweed
harvester in Maine.
iii
TABLE OF CONTENTS INTRODUCTION……………………………………………………………………...…1
The Big Picture……………………………………………………………………1
In the Lab…………………………………….……………………………………3
MATERIALS AND METHODS………………………………………………………….6
Technoeconomic Modeling……………………………………………………….6
Assumptions………………………………………………………………………6
Design…………………………………………………………………………….8
RESULTS..………………………………………………………………………………12
Economic Analysis………………………………………………………………12
Base Case………………………………………………………………………...12
Alginate Only…………………………………………………………………….15
All Together……………………………………………………………………...16
Combined Approach……………………………………………………………..16
DISCUSSION……………………………………………………………………………20
REFERENCES…………………………………………………………………………..21
APPENDICES……..………….…………………………………………………………23
Appendix A: Figures...…………………………………………………………..24
Appendix B: Tables……………………………………………………………...31
AUTHOR BIOGRAPHY………………………………………………………………..35

iv
LIST OF FIGURES AND TABLES
Figures
Figure 1: Extraction Process Diagram………………………………………………….23
Figure 2: Extraction Flow Diagram…………………………………………………….24
Figure 3: Base Case Aspen Design……………………………………………………..25
Figure 4: General CSTR for Economic Calculations…………………………………..26
Figure 5: Calculations for Daily Cost of Seaweed and Daily Cost of Ethanol…………27
Figure 6: Calculations for Daily Cost of Calcium Chloride and Hydrochloric Acid………………………………………………………………………28
Figure 7: Calculations for Daily Cost of Sodium Carbonate and Total Raw Materials…………………………………………………………………….29
Figure 8: Calculations for Capital Costs and Utilities Costs using Values from Simulation…………………………………………………………..30
Figure 9: Calculations for Capital, Utility and Operating Costs and Amounts of Products……………………………………………………………….31
Figure 10: Individual Product Profit Calculations……………………………………...32
Figure 11: Alginate Only Profit Calculations…………………………………………..33
Figure 12: All Products Combined Profit Calculations………………………………...34
Figure 13: Combined Approach Profit Calculations……………………………………35

v
Tables
Table 1: Soils Lab Analysis of Seaweed Samples………………………………………..5
Table 2: Costs of Raw Materials………………………………………………………..13
Table 3: Equipment, Operating, Utilities and Capital Cost……………………………..13
Table 4: Base Case Summary…………………………………………………………..14
Table 5: Modified Cases Summary……………………………………………………..17
Table 6: 1/3 Capital Reduction………………………………………………………….18
Table 7: Additional Distillation of Ethanol……………………………………………..19

1
INTRODUCTION
The Big Picture
When one thinks of the seaweed industry, one would likely think of the vast
seaweed farms in China and other East Asian countries. Japan is recorded as the first
country to begin seaweed farming in 1670 (Borgese 1980). Today, China is the largest
reported farmer of seaweed pulling in 10 tons per hectare per year. For reference, the
U.S. produces 10 tons per hectare per year of corn (Seaweed Sustainability, 2015).
However, they may not be in the lead forever, as need for sustainable agriculture
increases, countries around the globe are beginning to try their hand at the task, including
the United States.
The seaweed industry is expanding, and even farmers in Maine have started to
grow their own seaweed. There aren’t many right now, as most aquaculturists are
focusing on those fish that have proven reliable and sustainable, such as oysters or
salmon. But the number of seaweed farmers in Maine is increasing each year. Maine Sea
Farms in Damariscotta, Maine opened in 2014 and has seen more and more business
annually since then (Maine Sea Farms, 2015).
As the industry spreads, additional uses for the seaweed continue to be found.
Seaweed has proven to be much more than a food source. There are many types of
seaweed, and they contain different polysaccharides, which can be useful for multiple
applications. As stated in the Advances in Food and Nutrition Research magazine in
2014, “seaweed polysaccharides, like agar, alginates, and carrageenans, are economically
the most important products from macroalgae or seaweeds”.
2
A polysaccharide is a long-linked chain carbohydrate molecule composed of
many smaller sugars. There are many different polysaccharides, but there are only a few
main ones that can be found in seaweed. Currently the most valuable polysaccharide is
carrageenan. Carrageenan is used by the food industry as a preservative and a thickener.
This particular polysaccharide comes from red seaweed, which is grown all over the
world. However, there are three polysaccharides found in brown seaweed that aren’t as
commonly extracted; laminarin, fucoidan and alginate. All three can be found in brown
algae. Laminarin is a polysaccharide of glucose and it is worth a lot of money, even in
small amounts, due to how difficult it currently is to extract from the seaweed. Laminarin
is being studied for its use as a pesticide to stimulate plant’s natural disease defense
mechanisms. (AGS, USDA).
Fucoidan is a polysaccharide of fucose and it is currently used as a dietary
supplement. The polysaccharide is being studied for its uses as a potential antioxidant,
and for its unique cognitive, anti-inflammatory, anti-angiogenic, anti-cancer, anti-viral,
and anti-hyperglycemic properties (Collins). Alginate is the most commonly found
polysaccharide of these three. It is used as an additive in dehydration and dehydrated
products and useful in the manufacture of paper and textiles. Alginate is also used as
sodium alginate to make impressions in the dentistry and other industries. Each of these
polysaccharides is important for its own reasons, and so scientists have been trying to
determine easier methods of extracting them.
The University of New England in Biddeford, Maine, is one of those communities
that have taken a recent interest in seaweed farming. UNE tasked the van Walsum Lab at
the University of Maine in Orono with determining if there were any problematic levels

3
of potentially toxic metals or arsenic present in the plant tissue, and thus if it were safe
for them to grow large quantities of seaweed in the estuary of the Saco River for use as a
food product or as a source for extracting these three polysaccharides. They gave us
multiple seaweed samples grown in different locations near the UNE campus where they
had transplanted individual algae from one cohort that had been grown in the UNE
seaweed nursery. We worked to accomplish this task by using elemental composition
analysis to look for potential toxins in the seaweed samples and we also extracted
polysaccharides to determine if location and harvest time affected polysaccharide
profiles.
In the Lab
The polysaccharide extraction process used by the van Walsum lab was created
based on several different published methods. The process involves the extensive use of
solvent extraction, repeated cycles of centrifugation, filtration, and freeze drying. This
fractionation procedure has been completed (or mostly completed) on two sets of
seaweed samples.
First, the seaweed samples are freeze dried to remove any moisture. Then 70%
EtOH is used to extract pigments from the samples. Next 2% CaCl2 is used to extract
Fraction A from the seaweed, leaving behind residual solid to be used in the next
extraction. Fraction A contains laminarin. 0.01 M HCl is used to extract Fraction B from
the residual seaweed. This fraction contains fucoidan with trace amounts of alginate.
Finally, 3% Na2CO3 is used to extract Fraction C, which comes out as sodium alginate.
Fraction B and C are fine to freeze dry as they are, but the laminarin and fucoidan in
Fraction A must be separated through the use of slurry packed column chromatography.
4
Much of my three years on the project was spent hydrolyzing the polysaccharide
extracts and analyzing the hydrolysate with HPLC to determine the amounts present. I
used an acid-based hydrolysis method adopted from standard methods used for terrestrial
biomass, such as lignocellulose. This method worked well for two of the polysaccharides,
but it turned out that alginate could not be easily hydrolyzed with acid. Instead of
breaking the polysaccharide into its monosaccharides, the viscosity of the sample
increased, and the color changed to black. It was determined that an enzymatic method
would have to be used instead. This method allows for hydrolysis of targeted
polysaccharides, instead of every polysaccharide. In this way, we were able to hydrolyze
specifically only alginate with the alginate lyase enzyme.
Once the samples were hydrolyzed, via acid or enzyme, they were analyzed via
use of an HPLC to determine the quantity of sugar extracted. This was done by
determining the relative size of the peaks of each of the sugars after they were separated
in the column. The HPLC column separates components such as the different
polysaccharides based on their elution times. The components travel through the column
at different speeds and either an infrared or an RI sensor shines a light on the sample and
measures the refraction.
Enzymes could also be used to determine the amount of sugar by using them to
hydrolyze a mass of sample, centrifuging the sample and then determining the change of
mass of the solid. The enzyme hydrolyzes all the polysaccharide it targets, so comparing
the mass of solid before and after and subtracting the mass of enzyme solution used will
give you how much polysaccharide was hydrolyzed. We had an alternative method via
the use with a YSI Enzymatic Analyzer, but after three months of work it proved
5
beyond repair. Glucose oxidase not hydrolysis of polymer. Automated assay, to
monitor polysaccharides.
One final analysis method we used to determine seaweed composition was
elemental analysis in the form of ICP MS. The work for this method was done by the
UMaine Soil Testing Lab. We requested the analysis of the carbon, nitrogen and
phosphorus contents of the seaweed to determine if any seaweed location contained more
nutrients of one kind or another. If a particular growth location did contain more
nutrients, it would have been a better choice. However, there was very little difference in
the C:N:P ratio of the different samples. This can be seen in Table 1 below where TC is
total carbon and TN is total nitrogen. We also had them test the levels of the toxins and
heavy metals in the seaweed, and as can be seen in the same figure, these levels were low
or below detection levels. It should be noted though that if high levels of these heavy
metals or arsenic were detected, that would not necessarily prove that these seaweed
samples were toxic, since the bioavailability of these elements was not assessed. These
numbers can also be seen in Table 1.
Table 1: Soils Lab Analysis of Seaweed Samples
Sample type: Seaweed
ID TC TN Ca K Mg P Al B Cu Fe Mn Zn total total + S O + H total+OH% % % % % % ppm ppm ppm ppm ppm ppm
1 32.2 1.60 2.56 5.65 0.576 0.303 99.2 144 0.873 119 8.08 15.8 42.9 44.0 48.315 91.22 33.1 3.80 6.74 2.46 0.451 0.364 138 102 4.38 254 21.3 31.9 47.0 49.695 96.73 26.9 1.83 1.10 10.2 0.580 0.356 91.8 142 1.83 86.9 5.86 15.2 41.0 40.41 81.44 29.0 4.17 6.44 3.70 0.560 0.364 163 93.8 2.43 301 21.5 28.9 44.3 43.515 87.85 32.6 1.76 2.82 4.00 0.541 0.274 51.8 117 1.58 137 9.05 15.8 42.0 48.84 90.86 34.4 1.52 1.70 4.52 0.511 0.269 84.3 132 1.57 180 10.0 24.8 43.0 51.66 94.77 33.4 1.22 1.50 5.23 0.488 0.198 47.3 126 2.45 149 7.36 20.4 42.0 50.04 92.18 32.2 1.93 2.59 5.80 0.524 0.314 43.8 121 2.35 109 6.53 19.1 43.4 48.27 91.69 32.1 1.71 2.52 5.19 0.522 0.292 42.8 126 2.18 75.7 4.98 14.2 42.3 48.105 90.4
Element Units Sample 1 Element Units Sample 9
Cd ppm < 2.0 As ppm < 0.01Cr ppm < 2.0 Hg ppm < 0.04Pb ppm < 2.0S ppm 10337

6
MATERIALS AND METHODS
Techno-economic Modeling
The purpose of techno-economic analysis is to determine the economic viability
or feasibility of a project or technology. In the case of my thesis, I worked to determine
the viability of our extraction process being utilized on an industrial scale. Since testing
the process on an industrial scale was not possible, Dr. van Walsum and I decided to
make use of a modeling software to determine if this process could be scaled up.
There were two choices of tool at my disposal; I could either use Aspen Plus, a
standard process modeling software, or I could use Excel spreadsheets to calculate
everything I needed. Both tools could be used to perform the calculations I required, but I
ultimately decided to use Aspen for one main reason: some of the calculations included in
my analysis required thermodynamic data and properties already present and accessible
in Aspen’s built in databases. If I were to use Excel, I would need to look up every
required property myself and there could prove to be a lot required. Also, if the modeling
exercise proved fruitful, it will be more easily expanded upon if more detailed insight or
design work was desired.
Assumptions
While designing this model some initial assumptions were made regarding the
process and the model. The first and likely most important assumption was that xylose,
dextrose and ascorbic acid could be substituted for laminarin, fucoidan and alginate
respectively in the model. This substitution was made because ASPEN does not have any
information in any of its databanks about the polysaccharides. As stated previously, when
initially generating the idea for the model, it was expected that some thermodynamic
7
calculations would be required, and so components chosen with similar chemical
compositions were chosen. I initially attempted to make custom components for the
polysaccharides, but ASPEN was stubborn and required more information about
thermodynamic and chemical properties than I could find.
The second assumption is that in our initial extraction process, we got good,
repeatable results. My model is based on the work we did in the Van Walsum lab over
several years, and the input and output values used are similar to the results of this work.
I chose to use the more recently generated results, since it is highly unlikely that we got
completely accurate results in our initial extraction; there was likely some sample lost
due to human error with this extraction being the first time we ever had done anything
like this.
The third assumption I made is that by the end of the process approximately 99%
of the polysaccharide is removed from the seaweed. It is currently not possible for us to
know the final compositions of the extracted polysaccharides because some of them have
yet to be freeze dried and thus still contain some mass fraction of water. Also, the method
followed was intended to yield quantitative composition information and was presumably
designed to err on the side of excess extraction steps to achieve high yield of the targeted
compounds. The primary goal of my personal work on the project was to determine how
much of each polysaccharide was in the samples via the use of HPLC, but this analysis
requires dry samples. Therefore, I had to base my model on the best-case scenario for the
extraction as a whole, while still keeping the values close to those in our experimental
data. Once more data are collected in the lab, more accurate extraction percentages can be
determined.

8
The fourth and final assumption I made was that the initial solid seaweed sample
could be treated in ASPEN as a solution of liquified components at the expected ratio of
components based on amassed literature data. ASPEN is not very good at dealing with
solids, and so I decided that trying to make a solid out of the components that weren’t
even the polysaccharides would not provide an accurate result. Thus, I decided to treat
everything as a liquid to remove this expected error.
Design
The goal at the outset of this thesis project was to design a model based on our
extraction process and procedure and based on the results of our first extraction to decide
if this extraction could be run on an industrial scale. The first step of this scaling up was
to decide how much seaweed the process could run per day. I decided that a factory
running this process could extract polysaccharides from 1000 kg of dry seaweed per day.
I chose this number because I assumed that if any factory would be built to perform this
extraction, it would not be a very large one at first due to this all being new to the
processing community in Maine.
The next thing that I had to decide was how to model the process; that is, what
unit operations I needed to include. First I tried using mixer and splitter blocks to
combine and separate the streams based on experimental values. This worked fine except
that this model didn’t really prove anything. I was just presenting the data we had already
collected in a visual form. ASPEN could not calculate any economic or thermodynamic
data from this version of the model. This is because mixer and splitter blocks in ASPEN
are not actual unit operations. These blocks manipulate flows as designed, but no
calculation other than simple algebra are performed.

9
After realizing that no useful data could be gathered from this, I decided to try a
different approach. To explain my next few design choices, I must note some of the
things that Aspen has the ability to do that I required. Aspen can do mass and ideal
energy balances by using mixer and splitter blocks, it can do non-ideal mixing
thermodynamic calculations with separator blocks and can also do economics
calculations, but as I’ll explain, the economic calculations from the separator blocks
didn’t make sense, so I had to use a CSTR as a vessel with a residence time, size and
pressure rating.
First I replaced each mixer and splitter combination with a separator block. This
simplified the process a lot, and I was able to get the inputs and outputs that I desired.
Once I got the overall inputs and outputs sorted, I decided to expand my model. In the
extraction process we run three extractions on the seaweed with each solvent to remove
all of each of the polysaccharides. Initially I designed my model such that all extractions
were done in one separator block but in order to make the model more accurate I split up
each of the extractions to be represented by individual separator blocks. In order to keep
99% of the polysaccharide extracted, I had to determine the percentage to be used for
each of the three extractions. I calculated that if 78% of the polysaccharide was removed
each time, after the third extraction we would have a total of 99% extracted. The
restructuring of the model based on separator blocks was useful in so far as I was now
able to determine the heat duty of each block. The heat lost in each separator was very
small, at approximately 0 kJ/hr. This makes sense because most of the process is run at
around room temperature.

10
There was still one major flaw in my model; I could not use Aspen to calculate
any capital costs for the equipment. I attempted to do so, but the programmed capital cost
calculations made it so that every separator was the same size and so cost the same
amount of money no matter how much I changed the flow rates. This made no sense as
the size should change based on mass flow changes. Thus, I had to find another way to
model these interactions that allowed me to use Aspen’s built in capital cost software. I
wanted to use the built-in software to minimize the error associated with using two
different programs to find the cost of the blocks. I was initially planning to use the
Capcost macro sheet in Excel to find these costs but decided to use Aspen’s built in
Process Economic Analyzer instead.
Since I couldn’t find the capital cost of the separator blocks, I had to find another
way to get any capital cost for equipment. There was no reaction in this extraction
process that I could easily model based on my previously made assumptions and design
simplifications. Thus, I needed a way to model the size of the theoretical separator blocks
using a different block. I decided that I wanted to use some sort of storage block to model
this block so I could calculate its size and the cost.
There was a serious problem with this plan because Aspen cannot easily model
storage tanks. The program is intended for continuous flow reactions and processes and
thus doesn’t include simple ways to represent batch processes. When we were taught
Aspen, we were instructed to use pipes to model storage tanks. However, I wanted to
include the cost and energy consumption of a mixing device in my separator, and so
found an alternative way to represent the tanks as a continuously stirred tank-reactor
(CSTR) . I used a CSTR to estimate the cost of the theoretical separator. There was
11
another problem though; in Aspen, in order to use a CSTR you need to include a reaction,
but our process didn’t include any reactions. I was able to circumvent this requirement by
including additional components with the same chemical composition as each of the
polysaccharides. This allowed me to program a reaction that turned one component into
the same component with a different name, therefore not actually reacting anything and
so not changing the model in any way.
Next, I decided not to manually replace each of my separator blocks with these
reaction-less CSTRs. Instead I took the inlet flow of the initial separators for each stage
of the extraction process and created a parallel model intended solely to generate
economic numbers. Thus, I duplicated these flows outside the main process and
connected them to CSTRs. Then I included the name-changing reaction of whichever
polysaccharide was being extracted. Once I ran the program again I was able to
determine the capital cost of the CSTRs for each extraction. I assumed that in an
industrial process these tanks would be bought in bulk, and the initial tank would be the
largest one, so in my overall cost calculations I multiplied the capital cost of each tank by
three to represent the three extractions.
I knew that the next step in determining the financial viability of the process was
to determine the raw materials costs for the process. None of the initial components
included in this process are highly expensive, but this process does require a lot of each
and so the price does seem to add up. This is especially true considering how little of
each polysaccharide is extracted once the extracts are dried. My economic calculations
and comparisons in the next section will show you if this process was viable or not.

12
RESULTS
Economic Analysis
Aspen can be used as a powerful economic tool, but it does have some limitations,
as I found out during my thesis work. Aspen has built in economic parameters that can’t
easily be changed and to find them one must explore deep in Aspen’s files. Thus, I didn’t
change them in any of my economic calculations using Aspen. Some other problems
arose from not being able to change these variables, the biggest one being that no matter
the size of a separator block, it always cost the same. This meant I could not use separator
blocks in my calculations, so I used CSTRs instead.
Economic Analysis – Base Case
The base case for this project is the closest to representing the extraction as
performed in the lab on an industrial scale. There have been no modifications to the
process, other than increasing the flow rates to scale up the model. I decided that a
reasonable estimate for the amount of seaweed a plant could process was one ton per day.
Based on lab data and research I decided to define my base case composition of seaweed
on a dry mass basis as 25% laminarin, 15% fucoidan, 30% alginate and 30% ash, protein
and pigments. The lab process uses a 7:1 mass ratio of solvent to seaweed for the pigment
extraction, a 9:1 mass ratio for the next two extractions and a 10:1 ratio for the last
extraction.
I simulated the base case in Aspen and got some economic results. I realized from
the capital cost results something was wrong. Aspen can mass separators, but it doesn’t
change the cost based on flow. All separators cost the same. This isn’t reasonable for my

13
model. So, I chose to separately model the CSTRs as tanks. Once I did this, my results
made more sense.
The price of dry seaweed in Maine is currently $25/lb. according to
maineseaweedfarms.com. In the simulation, 1 metric ton of seaweed is processed per day.
This means that the seaweed feed will cost $55,115/day. The process also uses solutions
of different chemicals for the extraction. These solutions include 28 tons of 70% ethanol
solution, 27 tons of 2% calcium chloride solution, 27 tons of 0.01 M hydrochloric acid
solution, and 30 tons of 3% sodium carbonate solution per day. Based on current market
prices from eMolecules.com, the use of these solvents would prove expensive. Costs can
be seen in Table 2 below.
Table 2: Costs of Raw Materials
The capital cost of the plant is also very high, as are the other associated costs of
running this plant. These costs can be seen in Table 3 below.
Table 3: Equipment, Operating, Utilities and Capital Cost
Process Component Daily Cost/RevenueSeaweed ($/day) 55,115$ Ethanol ($/day) 183,750$ CaCl2 ($/day) 31,126$ HCl ($/day) 157$ Na2CO3 ($/day) 5,886$ Total raw materials ($/day) 281,096$
Cost4 x EtOH Separator 50,627,200$ 3 x CaCL2 Separator 27,723,840$ 3 x HCl Separator 27,792,690$ 3 x Na2CO3 Separator 29,606,100$ Total Capital Cost 135,749,830$ Utilities Cost 5,437,722$ Operating Cost 27,316,120$

14
These costs all seem very high for a brand-new industrial process, but based on
current market price, the profit for the process has the potential to far outweigh its costs.
The best price I could find for pure laminarin was $34/100mg (Sigma Aldrich). The
process produces 148.5 kg of Fraction A per day. This means that the potential profit
from Fraction A sales, if it were possible to sell all this laminarin at this price, is
$50,490,000 per day. This number already shows that the process is profitable, but the
sale of the other fractions produces even more money. Fucoidan can currently be
purchased at a price of $208/500mg (Sigma Aldrich). 247.5 kg of fucoidan is produced
per day. So, the revenue from fucoidan should be around $102,960,000 per day, again if
all this material could be sold at the current chemical price. Alginate, unlike the other two
polymers, is currently being mass produced in the form of sodium alginate, and so will
make a smaller profit. Sodium alginate can be purchased for $137/kg (Sigma Aldrich).
The extraction process would produce 2,673 kg/day. Therefore, the process should make
$4,976 per day on alginate. A summary of this analysis can be seen in Table 4 below.
Table 4: Base Case Summary
Process Component Daily Cost/RevenueSeaweed ($/day) 55,115$ Ethanol ($/day) 183,750$ CaCl2 ($/day) 31,126$ HCl ($/day) 157$ Na2CO3 ($/day) 5,886$ Total raw materials ($/day) 281,096$ Capital cost ($) 135,749,830$ Utilities cost ($/year) 5,437,722$ Operating cost ($/year) 6,829,030$ Laminarin sales ($/day) 50,490,000$ Fucoidan sales ($/day) 102,960,000$ Alginate Sales ($/day) 40,689$ Total sales ($/day) 153,490,689$ Profit ($/day) 153,166,401$

15
These profits seem highly unreasonable, and they are. There aren’t many good
mass extraction processes for these polysaccharides. This is part of the reason why they
are so expensive. The other part is that there is a specialized market for them right now,
and so prices are artificially high to meet the demand with few buyers. Once these
polysaccharides can be mass produced, and once people recognize the uses for these
polymers that I discussed earlier in this paper, these numbers will go way down.
Economic Analysis – Alginate Only
It is not safe to assume that this process could sell any fucoidan or laminarin, and
so I had to determine how a profit could be made if only alginate could be sold. I
performed the calculations seen in Figure 9 to find the minimum sale price for the
alginate that would be required to break even if the other polymers were still extracted.
This sale price was approximately $1092/kg. This is very high price for alginate since it
can currently be purchased for $137/kg. Next I calculated how much alginate could be
sold for if only pigments and alginate were extracted. This allowed the required sale price
for alginate to go down a lot. The sale price was now $369/kg.
These calculations prove that this process could only be profitable if the minimum
prices that the alginate was sold for were way above the prices currently offered for the
polymer. The plant would be no competition at all and would never be able to make
money. However, I still wanted to find a way for this extraction to make money, so I
tried something else.

16
Economic Analysis – All Together
As proven earlier, this proposed production line would flood the market with
laminarin and fucoidan. As such, there is no way that these polysaccharides could be sold
for as much as they are currently listed for. It is also likely that there is little demand for
these two polymers because not much research has been done on how to extract them and
the general public doesn’t realize their uses. Therefore, I wanted to see if it would instead
be profitable if all the polysaccharides were sold together, in one package.
I treated the product as a combination of the three extracted polysaccharides. I
used the same feed concentrations as before, but I added all the products and their sale
prices together. This resulted in a sale price required to break even of $468/kg of polymer
blend. This is a much lower price than selling the alginate alone. It is also only around 19
times the price of the raw dry seaweed. The Aspen simulation predicts a 20% ROI, so it
would take 5 years to pay back the cost of building the plant. It turns out this wouldn’t be
a reasonable sale price either and the whole system is unprofitable in this way as well.
Economic Analysis – Combined Approach
I had the idea to use the calculations from this analysis to see how much laminarin
and fucoidan would need to be sold together to make a profit if all the alginate was sold
at its normal price of $7.6/lb. It turns out that at ten percent of the market prices for
fucoidan and alginate, only 4.03kg of those two polysaccharides would need to be sold
per day. It is unlikely that selling this relatively small an amount of the two
polysaccharides would flood the market, and there would be tons of produced

17
polysaccharide left over that could be stored. This also means that the process wouldn’t
have to be run every day, saving on operating and raw materials costs over time.
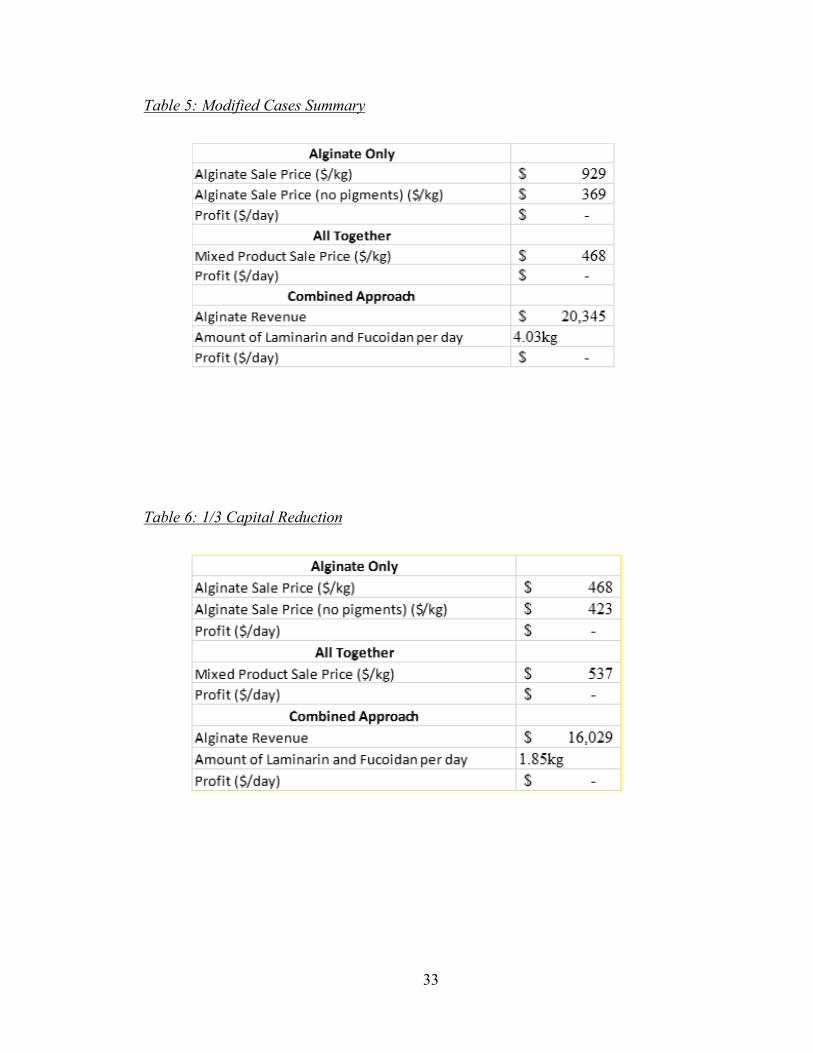
A summary of all the modified case results can be seen in Table 5 below.
Table 5: Modified Cases Summary
In order to drive down prices even more, I decided to see if it would be possible to
reduce the number of extractions down to one for each different solvent. This mean that
we would only extract around 78% of each product, but it would also reduce the capital
costs by around 2/3. Thus, I calculated these new capital costs and the new possible
revenue and used each of the modified cases once more to see if it was possible to make
the industrial process more feasible.

18
Table 6: 1/3 Capital Reduction
From Table 6 it can be seen that the required alginate sale price to break even is
reduced by a about ½. However, the minimum sale price for the mixed product increases
by $69. Finally, the amount of laminarin and fucoidan required to be sold per day is
reduced by around ½ as well. Therefore, it would not improve the process any to reduce
extractions in the mixed product method but it would appear that money could be saved
in the other modified methods.
One last method I wanted to try was to take the 1/3 capital reduction modified
methods and implement an ethanol recycle. I noticed that the daily cost of ethanol was
very high and the process itself wasted a majority of it. If a recycle stream for the ethanol
was added, a lot of money could be saved. The results from implementing this recycle
stream can be seen in Table 7 below. The method of recycle used was a distillation
column with 90% recovery of ethanol.

19
Table 7: Additional Distillation of Ethanol

20
DISCUSSION
From my analyses, it has become apparent that this process has the potential to be
economically viable on an industrial scale, but more must be researched about the current
markets for fucoidan and laminarin in order to reach a definite conclusion. In the initial
base case, it is easily possible to make a profit, but only theoretically. It is impossible for
all the product to be sold at one time because there is not nearly enough demand. The
capital costs are far too high and the required price to break even in both modified cases
is also very high. It might still be possible to make these versions of the process
economical, but my Aspen simulation is limited in its ability to determine what must be
done to do so. One modification to the process could be to reduce the number of
extractions to one for each of the polysaccharides. This would reduce the equipment costs
but would also reduce the product output and thus the possible profits. From the fourth
analytical case, it is clear that if even a just a fraction of the laminarin and fucoidan
produced could be sold at one tenth the current asking price, the process could make
money and pay back all initial costs quickly.
If someone wanted to continue my research and analysis there are a few things
they could look at. It would be possible to implement a counter current extraction method
in the third and fourth ethanol extraction steps due to the low concentrations of pigment.
In addition to the discussed ethanol recycle, this could save on ethanol costs.
Another component of the overall extraction discussed briefly previously that was
not implemented into my model is drying of the products. The products would not be sold
in liquid extract form; they would be sold as a powder. In the lab, we dry the extract via

21
freeze drying, but as discussed this method would not be viable on an industrial scale.
Thus, another method of drying the product, such as evaporation, would need to be
investigated and implemented into the final plant.
In terms of research it is likely the polysaccharide composition of the seaweed is
different to what has been reported, and if more fucoidan or laminarin could actually be
produced, that would benefit the process. It could also be that fucoidan and laminarin are
or can potentially be in high demand, and so making a large amount of these two
polymers would be beneficial in the short and the long term for the market.
I believe it is still possible to make this process economically viable on an
industrial scale, but my model lacks the ability to prove this definitively. Further research
done in the van Walsum lab should be done to confirm how much polysaccharide could
be produced on the small scale and economic research should be done in the market to
see how much demand there is for these polymers. For now, I have created an accurate
model of the process as it would be used on an industrial scale and shown that it could be
possible to make a profit.

22
REFERENCES
“Aquaculture Benefits - Maine Fresh Sea Farms.” Maine Sea Farms, 2015, maineseafarms.com/aquaculture-benefits.
Collins, Kenneth, et al. “Looking Beyond the Terrestrial: The Potential of Seaweed Derived Bioactives to Treat Non-Communicable Diseases.” Marine Drugs, vol. 14, no. 3, 2016, p. 60., doi:10.3390/md14030060.
“EMolecules®.” EMolecules, www.emolecules.com/.
“Fucoidan from Fucus Vesiculosus F8190” Sigma, Sigma-Aldrich www.sigmaaldrich.com/catalog/product/sigma/f8190?lang=en®ion=US.
Jallinoja, Piia, et al. “Marine Carbohydrates: Fundamentals and Applications, Part B.” Advances in Food and Nutrition Research, vol. 58, 3 Dec. 2014, doi:10.1016/c2013-0-12642-6.
Labarre, A., and R. Orieux. "Plant defenses stimulation: Laminarin, a natural compound
for the plant protection." Julius-Kühn-Archiv 428 (2010).
“Laminarin from Laminaria Digitata l9634.” Sigma, Sigma-Aldrich www.sigmaaldrich.com/catalog/product/sigma/l9634?lang=en®ion=US.
Mann-Borgese, Elisabeth, and Robert Glenn. Ketchum. Seafarm the Story of Aquaculture. H.N. Abrams, 1980.
Radulovich, Ricardo. “Chapter 3 - Farming of Seaweeds.” Seaweed Sustainability: Food and Non-Food Applications, by Brijesh K. Tiwari and D. J. Troy, Elsevier/AP, Academic Press Is an Imprint of Elsevier, 2015, pp. 27–59.
“Sodium Alginate W201502.” Sigma, Sigma-Aldrich, www.sigmaaldrich.com/catalog/product/aldrich/w201502?lang=en®ion=US.
“To Market, To Market.” Maine Seaweed Harvesters, maineseaweedharvesters.org/to-market/.

23
APPENDICES

24
APPENDIX A: FIGURES
Figure 1: Extraction Process Diagram

25
Figure 2: Extraction Flow Diagram
Figure 3: Base Case Aspen Design

26
Figure 4: General CSTR for Economic Calculations
Figure 5: Calculations for Daily Cost of Seaweed and Daily Cost of Ethanol

27
Figure 6: Calculations for Daily Cost of Calcium Chloride and Hydrochloric Acid
Figure 7: Calculations for Daily Cost of Sodium Carbonate and Total Raw Materials

28
Figure 8: Calculations for Capital Costs and Utilities Costs using Values from Simulation
Figure 9: Calculations for Capital, Utility and Operating Costs and Amounts of Products

29
Figure 10: Individual Product Profit Calculations
Figure 11: Alginate Only Profit Calculations

30
Figure 12: All Products Combined Profit Calculations
Figure 13: Combined Approach Profit Calculations

31
APPENDIX B: TABLES
Table 1: Soils Lab Analysis of Seaweed Samples
Table 2: Costs of Raw Materials
Sample type: Seaweed
ID TC TN Ca K Mg P Al B Cu Fe Mn Zn total total + S O + H total+OH% % % % % % ppm ppm ppm ppm ppm ppm
1 32.2 1.60 2.56 5.65 0.576 0.303 99.2 144 0.873 119 8.08 15.8 42.9 44.0 48.315 91.22 33.1 3.80 6.74 2.46 0.451 0.364 138 102 4.38 254 21.3 31.9 47.0 49.695 96.73 26.9 1.83 1.10 10.2 0.580 0.356 91.8 142 1.83 86.9 5.86 15.2 41.0 40.41 81.44 29.0 4.17 6.44 3.70 0.560 0.364 163 93.8 2.43 301 21.5 28.9 44.3 43.515 87.85 32.6 1.76 2.82 4.00 0.541 0.274 51.8 117 1.58 137 9.05 15.8 42.0 48.84 90.86 34.4 1.52 1.70 4.52 0.511 0.269 84.3 132 1.57 180 10.0 24.8 43.0 51.66 94.77 33.4 1.22 1.50 5.23 0.488 0.198 47.3 126 2.45 149 7.36 20.4 42.0 50.04 92.18 32.2 1.93 2.59 5.80 0.524 0.314 43.8 121 2.35 109 6.53 19.1 43.4 48.27 91.69 32.1 1.71 2.52 5.19 0.522 0.292 42.8 126 2.18 75.7 4.98 14.2 42.3 48.105 90.4
Element Units Sample 1 Element Units Sample 9
Cd ppm < 2.0 As ppm < 0.01Cr ppm < 2.0 Hg ppm < 0.04Pb ppm < 2.0S ppm 10337
Process Component Daily Cost/RevenueSeaweed ($/day) 55,115$ Ethanol ($/day) 183,750$ CaCl2 ($/day) 31,126$ HCl ($/day) 157$ Na2CO3 ($/day) 5,886$ Total raw materials ($/day) 281,096$

32
Table 3: Equipment, Operating, Utilities and Capital Cost
Table 4: Base Case Summary
Cost4 x EtOH Separator 50,627,200$ 3 x CaCL2 Separator 27,723,840$ 3 x HCl Separator 27,792,690$ 3 x Na2CO3 Separator 29,606,100$ Total Capital Cost 135,749,830$ Utilities Cost 5,437,722$ Operating Cost 27,316,120$
Process Component Daily Cost/RevenueSeaweed ($/day) 55,115$ Ethanol ($/day) 183,750$ CaCl2 ($/day) 31,126$ HCl ($/day) 157$ Na2CO3 ($/day) 5,886$ Total raw materials ($/day) 281,096$ Capital cost ($) 135,749,830$ Utilities cost ($/year) 5,437,722$ Operating cost ($/year) 6,829,030$ Laminarin sales ($/day) 50,490,000$ Fucoidan sales ($/day) 102,960,000$ Alginate Sales ($/day) 40,689$ Total sales ($/day) 153,490,689$ Profit ($/day) 153,166,401$
33
Table 5: Modified Cases Summary
Table 6: 1/3 Capital Reduction

34
Table 7: Additional Distillation of Ethanol

35
AUTHOR BIOGRAPHY
Zachary Applebee was born in Bangor, Maine on December 4th, 1996. He was
raised by his mother Allison Applebee and his Father Vinal Applebee. He has lived in
Orono, Maine his entire life. After graduating from Orono High School in 2015, he went
on to pursue a bachelor’s degree in Chemical Engineering at the University of Maine in
Orono.
He worked in several different labs on campus over the course of his High School
and University careers, but he spent the longest working under Dr. van Walsum where he
studied polysaccharides in seaweed. He worked in the van Walsum lab for four years and
his Honors Thesis is based on this work. After graduation he plans to find a job in the
Chemical Engineering field or in research. He can’t wait to leave his hometown and see
what experiences his time spent at UMaine will offer him.


![[Ruitenberg meat applications ] - Schwarz · Rudin®VegaCasing is a 100% vegetable paste based on alginate techno-logy. Made of seaweed extract, fibres and stabilisers, Rudin®VegaCasing](https://img.pdfslide.net/doc/110x75/5f033b147e708231d4082eee/ruitenberg-meat-applications-schwarz-rudinvegacasing-is-a-100-vegetable.jpg)