Embed Size (px)
Citation preview
Tees Valley
Quarterly Economic Review
June 2015
1
An up to date analysis of economic, business and labour market trends across the Tees Valley
Contents
Economy and business
- UK GDP (q)
- Productivity (a)
- New businesses (m)
- Regional trade in goods (q)
Labour market
- Headline labour market (m & q)
- Household Income (a)
- Apprenticeships (m & a)
Further information
Underlined blue text is hyperlinked
Notes: (a) = data released annually, (q) = data released quarterly, (m) = data released monthly
UK GDP
BACK TO CONTENTS PAGE
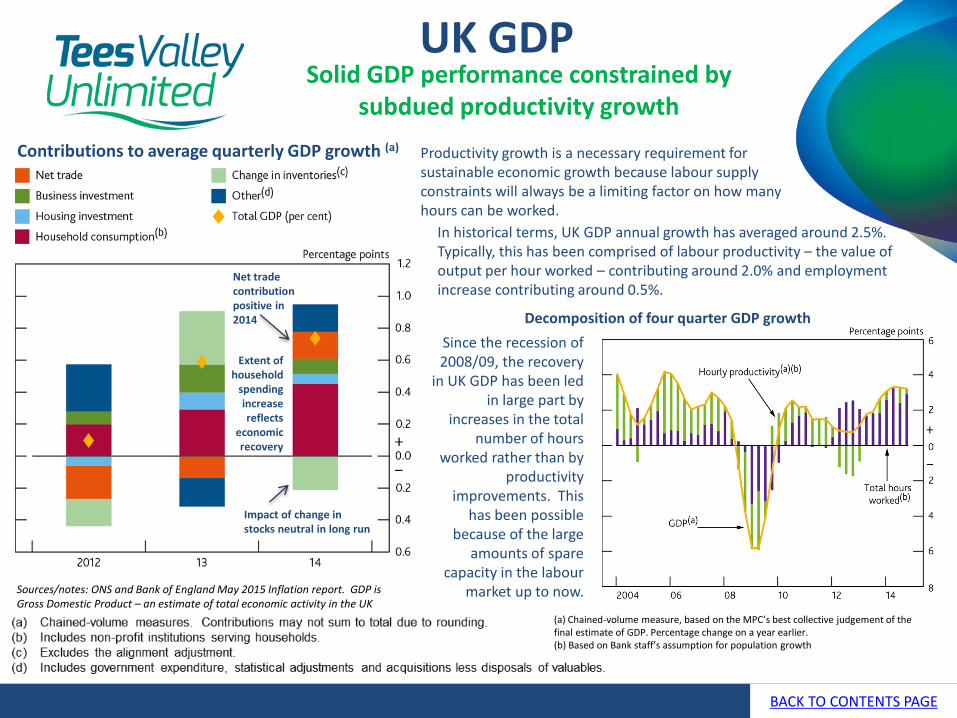
Solid GDP performance constrained by subdued productivity growth
Contributions to average quarterly GDP growth (a)
Since the recession of 2008/09, the recovery
in UK GDP has been led in large part by
increases in the total number of hours
worked rather than by productivity
improvements. This has been possible
because of the large amounts of spare
capacity in the labour market up to now.
Decomposition of four quarter GDP growth
(a) Chained-volume measure, based on the MPC’s best collective judgement of the final estimate of GDP. Percentage change on a year earlier. (b) Based on Bank staff’s assumption for population growth
In historical terms, UK GDP annual growth has averaged around 2.5%. Typically, this has been comprised of labour productivity – the value of output per hour worked – contributing around 2.0% and employment increase contributing around 0.5%.
Impact of change in stocks neutral in long run
Net trade contribution positive in 2014
Extent of household
spending increase reflects
economic recovery
Productivity growth is a necessary requirement for sustainable economic growth because labour supply constraints will always be a limiting factor on how many hours can be worked.
Sources/notes: ONS and Bank of England May 2015 Inflation report. GDP is Gross Domestic Product – an estimate of total economic activity in the UK
Productivity
BACK TO CONTENTS PAGE
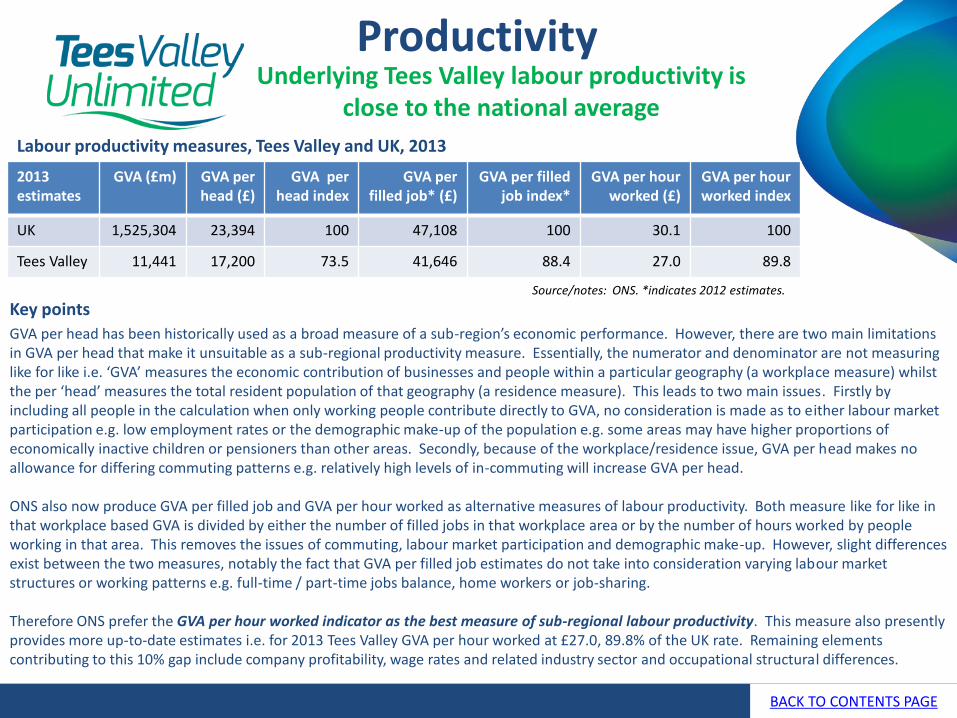
Underlying Tees Valley labour productivity is close to the national average
Labour productivity measures, Tees Valley and UK, 2013
Source/notes: ONS. *indicates 2012 estimates.
Key points
2013 estimates
GVA (£m) GVA per head (£)
GVA per head index
GVA per filled job* (£)
GVA per filled job index*
GVA per hour worked (£)
GVA per hour worked index
UK 1,525,304 23,394 100 47,108 100 30.1 100
Tees Valley 11,441 17,200 73.5 41,646 88.4 27.0 89.8
GVA per head has been historically used as a broad measure of a sub-region’s economic performance. However, there are two main limitations in GVA per head that make it unsuitable as a sub-regional productivity measure. Essentially, the numerator and denominator are not measuring like for like i.e. ‘GVA’ measures the economic contribution of businesses and people within a particular geography (a workplace measure) whilst the per ‘head’ measures the total resident population of that geography (a residence measure). This leads to two main issues. Firstly by including all people in the calculation when only working people contribute directly to GVA, no consideration is made as to either labour market participation e.g. low employment rates or the demographic make-up of the population e.g. some areas may have higher proportions of economically inactive children or pensioners than other areas. Secondly, because of the workplace/residence issue, GVA per head makes no allowance for differing commuting patterns e.g. relatively high levels of in-commuting will increase GVA per head. ONS also now produce GVA per filled job and GVA per hour worked as alternative measures of labour productivity. Both measure like for like in that workplace based GVA is divided by either the number of filled jobs in that workplace area or by the number of hours worked by people working in that area. This removes the issues of commuting, labour market participation and demographic make-up. However, slight differences exist between the two measures, notably the fact that GVA per filled job estimates do not take into consideration varying labour market structures or working patterns e.g. full-time / part-time jobs balance, home workers or job-sharing. Therefore ONS prefer the GVA per hour worked indicator as the best measure of sub-regional labour productivity. This measure also presently provides more up-to-date estimates i.e. for 2013 Tees Valley GVA per hour worked at £27.0, 89.8% of the UK rate. Remaining elements contributing to this 10% gap include company profitability, wage rates and related industry sector and occupational structural differences.
New businesses
BACK TO CONTENTS PAGE
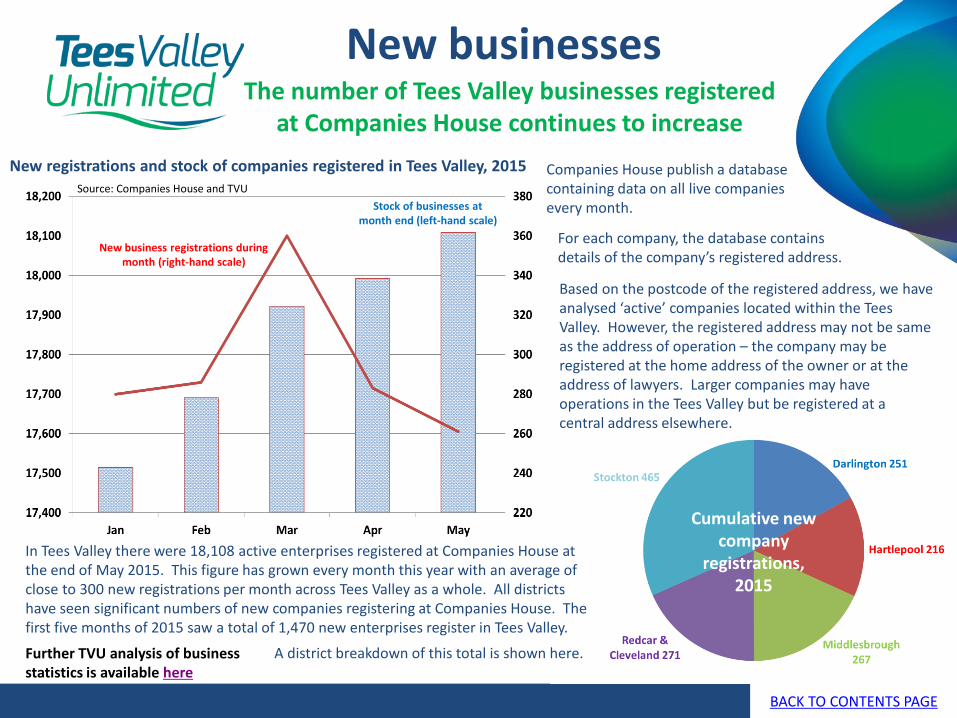
The number of Tees Valley businesses registered at Companies House continues to increase
Further TVU analysis of business statistics is available here
Stock of businesses at month end (left-hand scale)
New business registrations during month (right-hand scale)
Companies House publish a database containing data on all live companies every month.
New registrations and stock of companies registered in Tees Valley, 2015
For each company, the database contains details of the company’s registered address.
Source: Companies House and TVU
Cumulative new company
registrations, 2015
A district breakdown of this total is shown here.
In Tees Valley there were 18,108 active enterprises registered at Companies House at the end of May 2015. This figure has grown every month this year with an average of close to 300 new registrations per month across Tees Valley as a whole. All districts have seen significant numbers of new companies registering at Companies House. The first five months of 2015 saw a total of 1,470 new enterprises register in Tees Valley.
Based on the postcode of the registered address, we have analysed ‘active’ companies located within the Tees Valley. However, the registered address may not be same as the address of operation – the company may be registered at the home address of the owner or at the address of lawyers. Larger companies may have operations in the Tees Valley but be registered at a central address elsewhere.
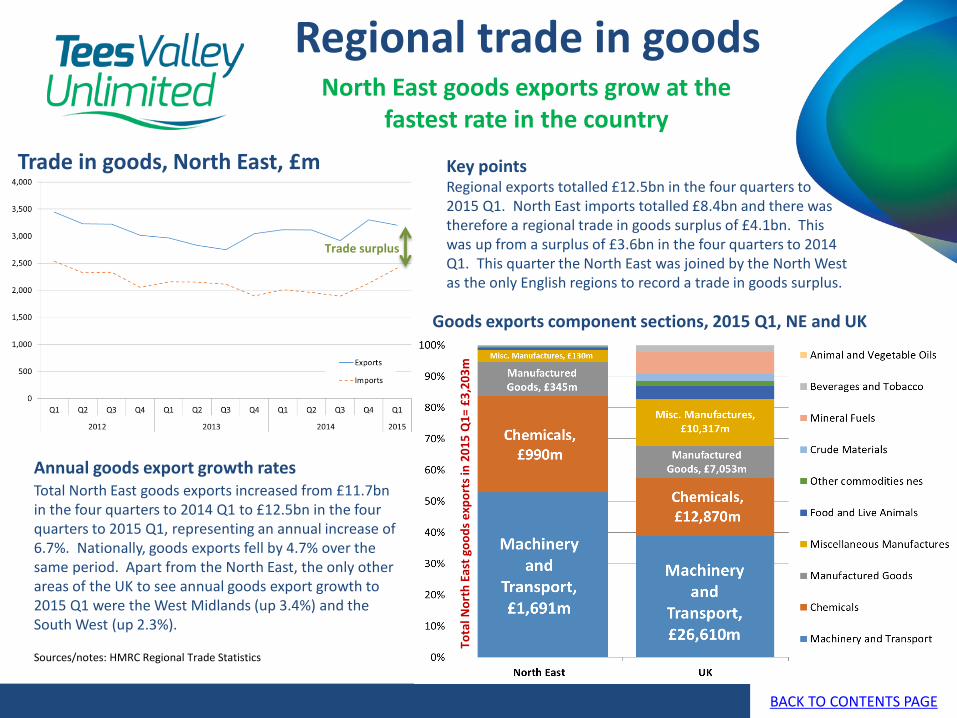
Trade in goods, North East, £m
Regional trade in goods
BACK TO CONTENTS PAGE
North East goods exports grow at the fastest rate in the country
Regional exports totalled £12.5bn in the four quarters to 2015 Q1. North East imports totalled £8.4bn and there was therefore a regional trade in goods surplus of £4.1bn. This was up from a surplus of £3.6bn in the four quarters to 2014 Q1. This quarter the North East was joined by the North West as the only English regions to record a trade in goods surplus.
Total North East goods exports increased from £11.7bn in the four quarters to 2014 Q1 to £12.5bn in the four quarters to 2015 Q1, representing an annual increase of 6.7%. Nationally, goods exports fell by 4.7% over the same period. Apart from the North East, the only other areas of the UK to see annual goods export growth to 2015 Q1 were the West Midlands (up 3.4%) and the South West (up 2.3%).
Sources/notes: HMRC Regional Trade Statistics
Key points
Trade surplus
Annual goods export growth rates
Goods exports component sections, 2015 Q1, NE and UK
Tota
l No
rth
Eas
t go
od
s e
xpo
rts
in 2
01
5 Q
1=
£3
,20
3m
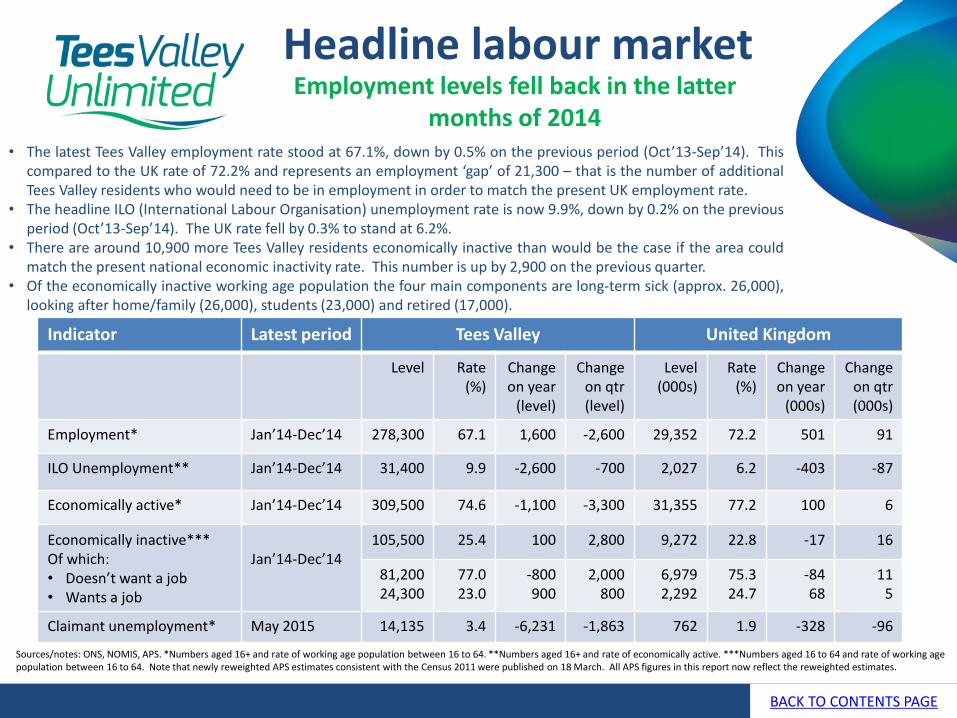
Indicator Latest period Tees Valley United Kingdom
Level Rate (%)
Change on year
(level)
Change on qtr (level)
Level (000s)
Rate (%)
Change on year
(000s)
Change on qtr (000s)
Employment* Jan’14-Dec’14 278,300 67.1 1,600 -2,600 29,352 72.2 501 91
ILO Unemployment** Jan’14-Dec’14 31,400 9.9 -2,600 -700 2,027 6.2 -403 -87
Economically active* Jan’14-Dec’14 309,500 74.6 -1,100 -3,300 31,355 77.2 100 6
Economically inactive*** Of which: • Doesn’t want a job • Wants a job
Jan’14-Dec’14
105,500 25.4 100 2,800 9,272 22.8 -17 16
81,200 24,300
77.0 23.0
-800 900
2,000 800
6,979 2,292
75.3 24.7
-84 68
11 5
Claimant unemployment* May 2015 14,135 3.4 -6,231 -1,863 762 1.9 -328 -96
BACK TO CONTENTS PAGE
Sources/notes: ONS, NOMIS, APS. *Numbers aged 16+ and rate of working age population between 16 to 64. **Numbers aged 16+ and rate of economically active. ***Numbers aged 16 to 64 and rate of working age population between 16 to 64. Note that newly reweighted APS estimates consistent with the Census 2011 were published on 18 March. All APS figures in this report now reflect the reweighted estimates.
Headline labour market Employment levels fell back in the latter
months of 2014 • The latest Tees Valley employment rate stood at 67.1%, down by 0.5% on the previous period (Oct’13-Sep’14). This
compared to the UK rate of 72.2% and represents an employment ‘gap’ of 21,300 – that is the number of additional Tees Valley residents who would need to be in employment in order to match the present UK employment rate.
• The headline ILO (International Labour Organisation) unemployment rate is now 9.9%, down by 0.2% on the previous period (Oct’13-Sep’14). The UK rate fell by 0.3% to stand at 6.2%.
• There are around 10,900 more Tees Valley residents economically inactive than would be the case if the area could match the present national economic inactivity rate. This number is up by 2,900 on the previous quarter.
• Of the economically inactive working age population the four main components are long-term sick (approx. 26,000), looking after home/family (26,000), students (23,000) and retired (17,000).
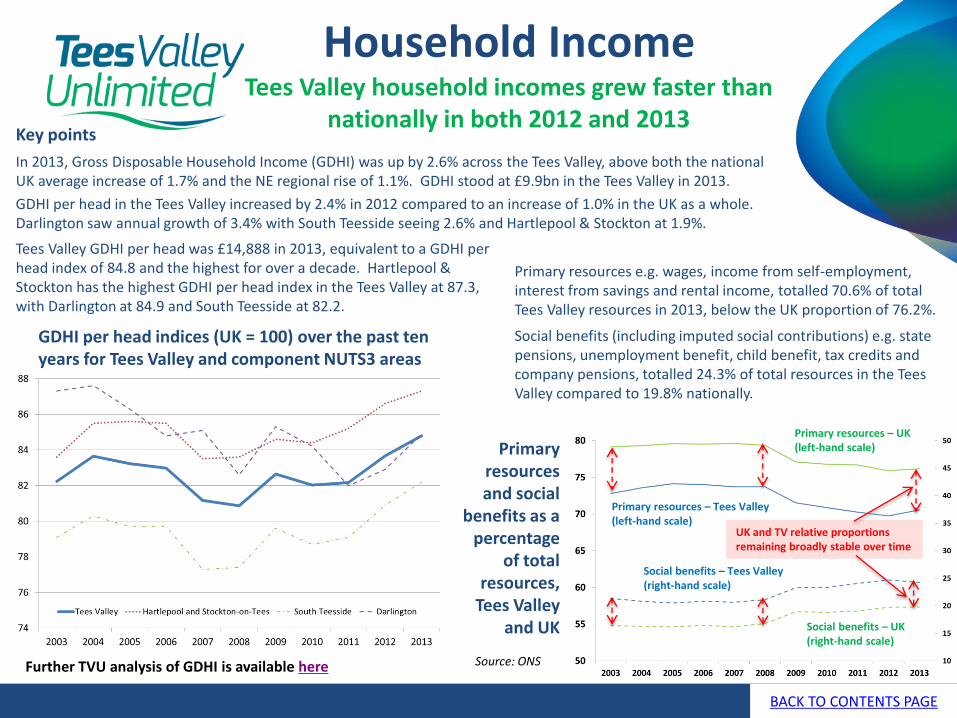
Household Income Tees Valley household incomes grew faster than
nationally in both 2012 and 2013
Source: ONS
BACK TO CONTENTS PAGE
GDHI per head indices (UK = 100) over the past ten years for Tees Valley and component NUTS3 areas
Primary resources and social
benefits as a percentage
of total resources,
Tees Valley and UK
Primary resources – UK (left-hand scale)
Primary resources – Tees Valley (left-hand scale)
Social benefits – UK (right-hand scale)
Social benefits – Tees Valley (right-hand scale)
In 2013, Gross Disposable Household Income (GDHI) was up by 2.6% across the Tees Valley, above both the national UK average increase of 1.7% and the NE regional rise of 1.1%. GDHI stood at £9.9bn in the Tees Valley in 2013.
Primary resources e.g. wages, income from self-employment, interest from savings and rental income, totalled 70.6% of total Tees Valley resources in 2013, below the UK proportion of 76.2%.
Social benefits (including imputed social contributions) e.g. state pensions, unemployment benefit, child benefit, tax credits and company pensions, totalled 24.3% of total resources in the Tees Valley compared to 19.8% nationally.
Tees Valley GDHI per head was £14,888 in 2013, equivalent to a GDHI per head index of 84.8 and the highest for over a decade. Hartlepool & Stockton has the highest GDHI per head index in the Tees Valley at 87.3, with Darlington at 84.9 and South Teesside at 82.2.
GDHI per head in the Tees Valley increased by 2.4% in 2012 compared to an increase of 1.0% in the UK as a whole. Darlington saw annual growth of 3.4% with South Teesside seeing 2.6% and Hartlepool & Stockton at 1.9%.
Key points
UK and TV relative proportions remaining broadly stable over time
Further TVU analysis of GDHI is available here
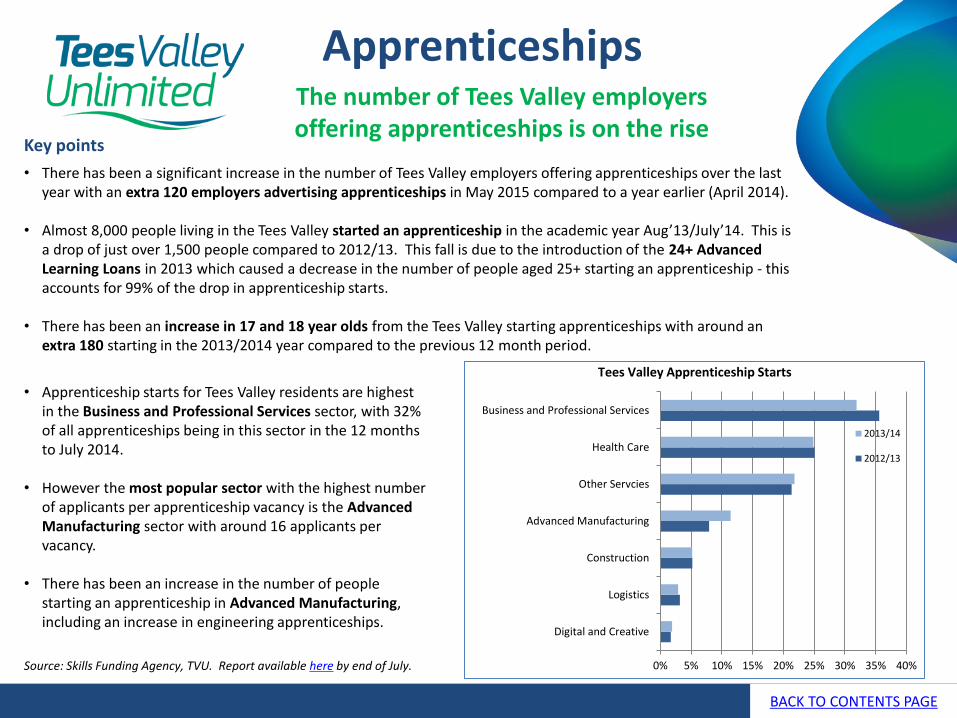
Apprenticeships The number of Tees Valley employers offering apprenticeships is on the rise
Key points
• There has been a significant increase in the number of Tees Valley employers offering apprenticeships over the last year with an extra 120 employers advertising apprenticeships in May 2015 compared to a year earlier (April 2014).
• Almost 8,000 people living in the Tees Valley started an apprenticeship in the academic year Aug’13/July’14. This is a drop of just over 1,500 people compared to 2012/13. This fall is due to the introduction of the 24+ Advanced Learning Loans in 2013 which caused a decrease in the number of people aged 25+ starting an apprenticeship - this accounts for 99% of the drop in apprenticeship starts.
• There has been an increase in 17 and 18 year olds from the Tees Valley starting apprenticeships with around an
extra 180 starting in the 2013/2014 year compared to the previous 12 month period.
BACK TO CONTENTS PAGE
Source: Skills Funding Agency, TVU. Report available here by end of July.
• Apprenticeship starts for Tees Valley residents are highest in the Business and Professional Services sector, with 32% of all apprenticeships being in this sector in the 12 months to July 2014.
• However the most popular sector with the highest number
of applicants per apprenticeship vacancy is the Advanced Manufacturing sector with around 16 applicants per vacancy.
• There has been an increase in the number of people
starting an apprenticeship in Advanced Manufacturing, including an increase in engineering apprenticeships.
0% 5% 10% 15% 20% 25% 30% 35% 40%
Digital and Creative
Logistics
Construction
Advanced Manufacturing
Other Servcies
Health Care
Business and Professional Services
Tees Valley Apprenticeship Starts
2013/14
2012/13
Web links and data sources
Tees Valley Unlimited – Tees Valley Statistics
• Provides detailed economic, labour market, skills and demographic reports, including upcoming and recently published:
– Analysis of Apprenticeship starts
– Monthly Apprenticeship vacancies
– Monthly Claimant Count unemployment
– Population projections to 2032
– Business statistics in the Tees Valley
– Household income estimates
– Job Vacancies
– Migration analysis
• Tees Valley Interactive Area Profile with detailed current and historic data on the economy and labour market by ward, output area and district (including 2011 Census data)
Bank of England Quarterly Inflation report
HMRC Regional Trade Statistics
Further information
BACK TO CONTENTS PAGE
ONS, NOMIS Labour Market Profiles
Tees Valley
Darlington
Hartlepool
Middlesbrough
Redcar & Cleveland
Stockton-on-Tees
Next edition: September 2015
For additional information please contact:
Will Haywood
Business & Economic Intelligence Officer
Tel: 01642 524414
Email: [email protected]