Embed Size (px)
Citation preview

Tees Valley Rural Community
Council RURAL EVIDENCE BASE
FINAL REPORT
Stillington, Stockton on Tees
JULY 2017
IntroductionGeographyPopulationDeprivation and Quality of LifeEnvironmentEmploymentParticipating in the WorkforceEnterpriseJob DensityTravel Patterns (Commuting)HomeworkingInternet UseUnemploymentOutline of the functioning of the rural Tees ValleySWOTAnalysisScenariosAppendix 1 - Deprivation Table
3567
1112141516172021222325262830
CONTENTS
IntroductionRose Regeneration was commissioned in late 2016 to produce a rural evidence base for Tees Valley Rural Community Council. The following brief was agreed for the study:
Establish a methodology that the RCC and its partners can use in the future to generate an on-going understanding of the changing nature of the socio-economic conditions of the area. This will involve overlaying the shape file for the current area, identifying the output, lower and middle super output areas which comprise it and developing a coding frame for extracting data to build the socio-economic profile of the area. This will be done in a way which enables the RCC itself to regularly update the key data sets and is RCC focused.
Use of national data such as the census and data held by local partners to establish a clear picture of the socio-economic conditions of the area. The focus of the study will be data relating to socio-economic measures such as employment, occupation and qualifications. This will involve a desk gathering of key documents and a series of brief engagements with a list of identified partners to establish any other key documents of relevance.
Identify distinct opportunities and challenges the RCC area faces in socio-economic terms and to identify trends within the data. The focus of this aspect of the work will involve comparing the key data from the RCC boundaries and its distinctive features with other key administrative and functioning economic geographies including adjoining counties and LEPs.
Provide data and information that is RCC focused rather than local authority or LEP focused to enable the RCC and its partners to develop programmes and attract resources. This will involve developing a narrative underpinning the extraction of data identified at 3 above.
Provide data and information that allow the socio-economic linkages between the RCC and the surrounding conurbations to be identified and understood. This will involve drilling down at the key settlement level, to model and map, in the light of available data key linkages and flows between the RCC area and other areas in terms of employees and businesses. It will also involve looking at the number of home workers and home based businesses, within the constraints of the available data.
Provide data and information that will allow the RCC and its partners to compare the area with wider regional and national geographies. This will involve developing a series of initial recommendations for how the RCC might engage with key audiences in the light of the evidence base and its distinctive features.
Provide data and information that can be disseminated to a range of non-technical audiences. This will include maps depicting the socio-economic conditions across the RCC area. We anticipate producing around 4 maps covering: the distribution of businesses in the area, the distribution of skills in the area, linkages and flows to
1
2
3
4
5
6
7
3
adjoining settlements, the urban/rural definition of the area, health and accessibility characteristics. This is an initial list which can be further refined as the project proceeds.
The report, which follows, combines the themes above to provide an integrated analysis and narrative of the rural character of the area, the challenges it faces and the opportunities available within it. It does so in the context of all those with a role to play in rural quality of life issues in the area but with a particular focus on the Rural Community Council.
4
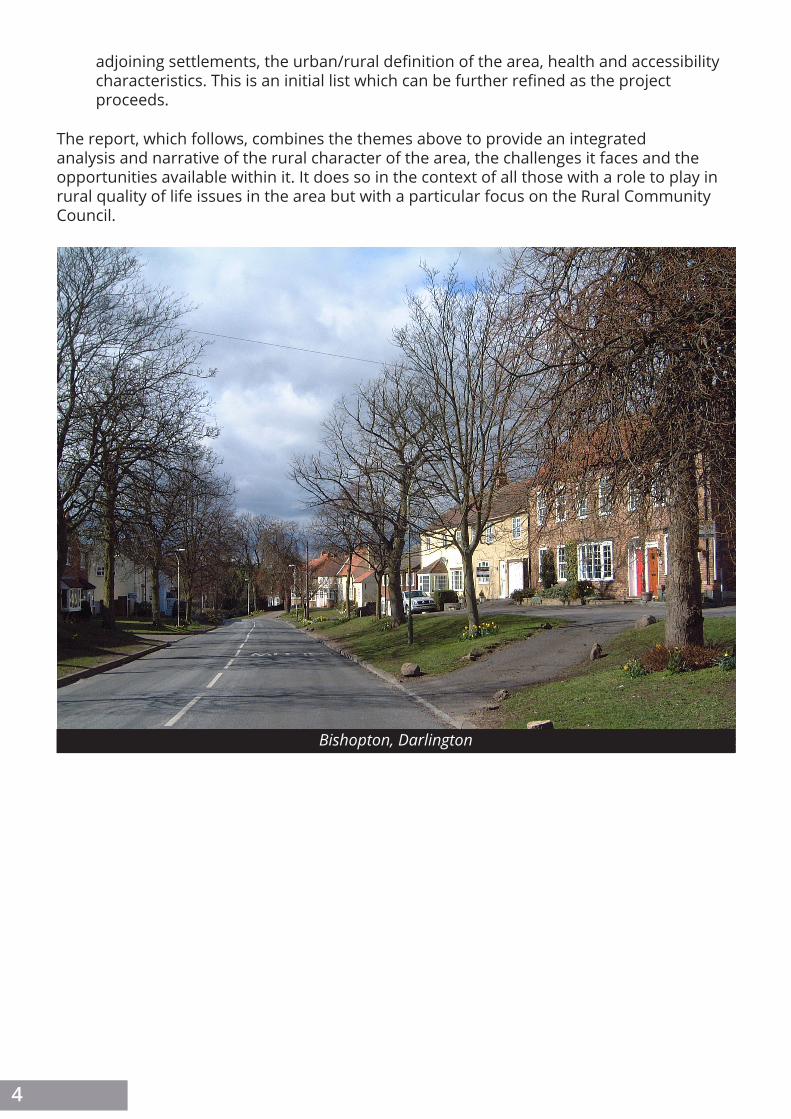
Bishopton, Darlington
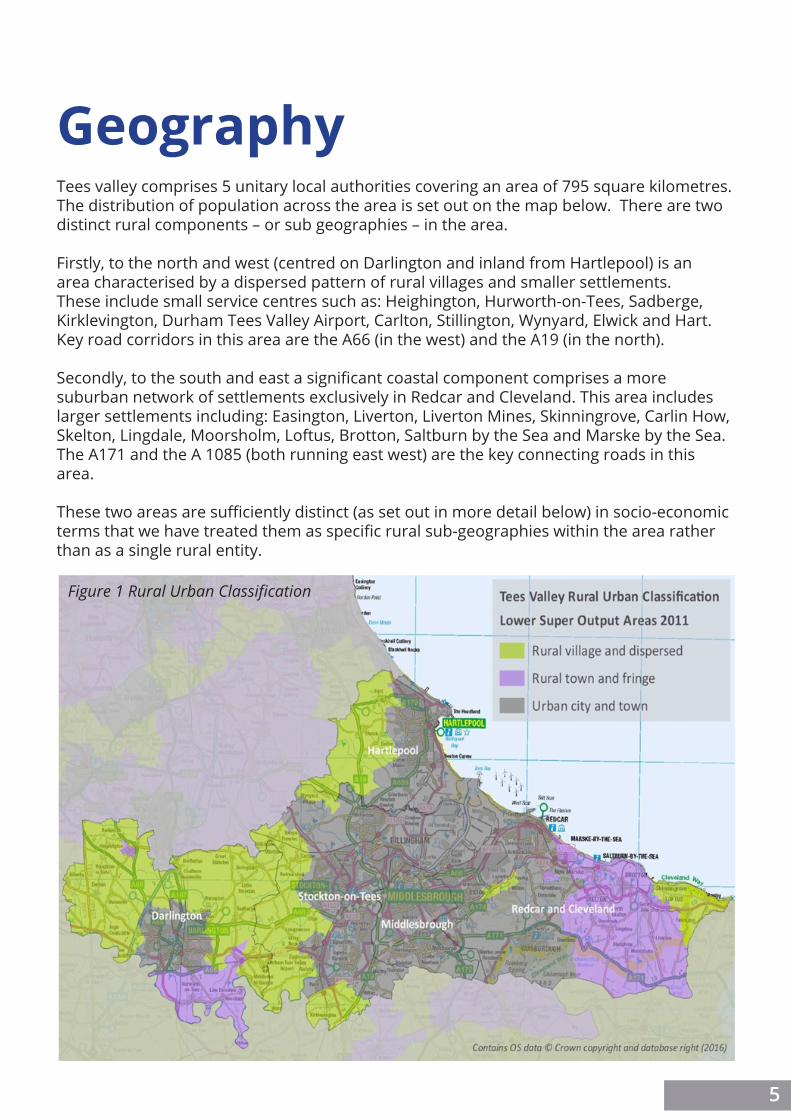
GeographyTees valley comprises 5 unitary local authorities covering an area of 795 square kilometres. The distribution of population across the area is set out on the map below. There are two distinct rural components – or sub geographies – in the area.
Firstly, to the north and west (centred on Darlington and inland from Hartlepool) is an area characterised by a dispersed pattern of rural villages and smaller settlements. These include small service centres such as: Heighington, Hurworth-on-Tees, Sadberge, Kirklevington, Durham Tees Valley Airport, Carlton, Stillington, Wynyard, Elwick and Hart. Key road corridors in this area are the A66 (in the west) and the A19 (in the north).
Secondly, to the south and east a significant coastal component comprises a more suburban network of settlements exclusively in Redcar and Cleveland. This area includes larger settlements including: Easington, Liverton, Liverton Mines, Skinningrove, Carlin How, Skelton, Lingdale, Moorsholm, Loftus, Brotton, Saltburn by the Sea and Marske by the Sea. The A171 and the A 1085 (both running east west) are the key connecting roads in this area.
These two areas are sufficiently distinct (as set out in more detail below) in socio-economic terms that we have treated them as specific rural sub-geographies within the area rather than as a single rural entity.
Figure 1 Rural Urban Classification
5

PopulationThe majority of the population of Tees Valley lives in urban settings. 90.1% compared to 73% for England as a whole. The distribution of rural and urban dwellers using categories within the Rural Urban Classification is set out in the table below:
The distinctive nature of the two rural sub-geographies identified above is very clear in relation to the distribution of population. Whilst the land mass covered by each area is similar, two-thirds of the rural population live in the eastern area of Tees Valley and one-third in western area which is far more sparsely populated.
In terms of demography both rural areas have a higher proportion of over 65s than the national or sub-regional average and this is most pronounced in the eastern area. The figures are: West – 18%, East – 21%, Tees Valley – 17%, England – 16%. In terms of under 16s the rural areas have a smaller proportion of the overall population than the national or regional figures – they are: West – 18%, East – 17%, Tees Valley – 19%, England – 19%.
Local Authority
TotalPopulation
(Census 2011)
Ruralvillage
anddispersed
%
NumberRural
town and fringe %
NumberUrban city and town
%
Total Urban
Total Rural
West AreaDarlington 105564 5.6 5911 7.8 8234 86.6 91419 14145Hartlepool 92028 2.2 2322 0 0 97.8 89706 2322Middlesborough 138412 0 0 0.07 957 99.3 137455 957Stockton-on-Tees 191610 3.7 7089 0 0 96.3 184521 7089
East AreaRecar and Cleveland 135177 2.1 2838 29.3 39606 68.6 92733 42444
Whole AreaTees Valley 662791 2.7 18162 7.2 48797 90.1 595832 66959
ONS 2011 Census
6
Deprivation &Quality of LifeThe English Indices of Deprivation provides a comprehensive overview of a number of quality of life factors. It ranks every neighbourhood in England according to its relative deprivation in terms of 7 themes. It then creates a composite measure of overall relative deprivation which can be compared with all other neighbourhoods in England. The Barriers to Housing and Services domain set out below provides a detailed comparator of transport and affordable housing challenges for rural dwellers.
The Income Deprivation Domain measures the proportion of the population experiencing deprivation relating to low income. The definition of low income used includes both those people that are out-of-work, and those that are in work but who have low earnings (and who satisfy the respective means tests).
The Employment Deprivation Domain measures the proportion of the working-age population in an area involuntarily excluded from the labour market. This includes people who would like to work but are unable to do so due to unemployment, sickness or disability, or caring responsibilities.
The Education, Skills and Training Deprivation Domain measures the lack of attainment and skills in the local population. The indicators fall into two sub-domains: one relating to children and young people and one relating to adult skills.
The Health Deprivation and Disability Domain measures the risk of premature death and the impairment of quality of life through poor physical or mental health. The domain measures morbidity, disability and premature mortality but not aspects of behaviour or environment that may be predictive of future health deprivation.
The Crime Domain measures the risk of personal and material victimisation at local level.
The Barriers to Housing and Services Domain measures the physical and financial accessibility of housing and local services. The indicators fall into two sub-domains: ‘geographical barriers’, which relate to the physical proximity of local services, and ‘wider barriers’ which includes issues relating to access to housing such as affordability.
The Living Environment Deprivation Domain measures the quality of the local environment. The indicators fall into two sub-domains. The ‘indoors’ living environment measures the quality of housing; while the ‘outdoors’ living environment contains measures of air quality and road traffic accidents.
We have created a mean score based on the deciles within which each relevant lower super output area falls in the indices to give an overall indication of relative deprivation in the two
7
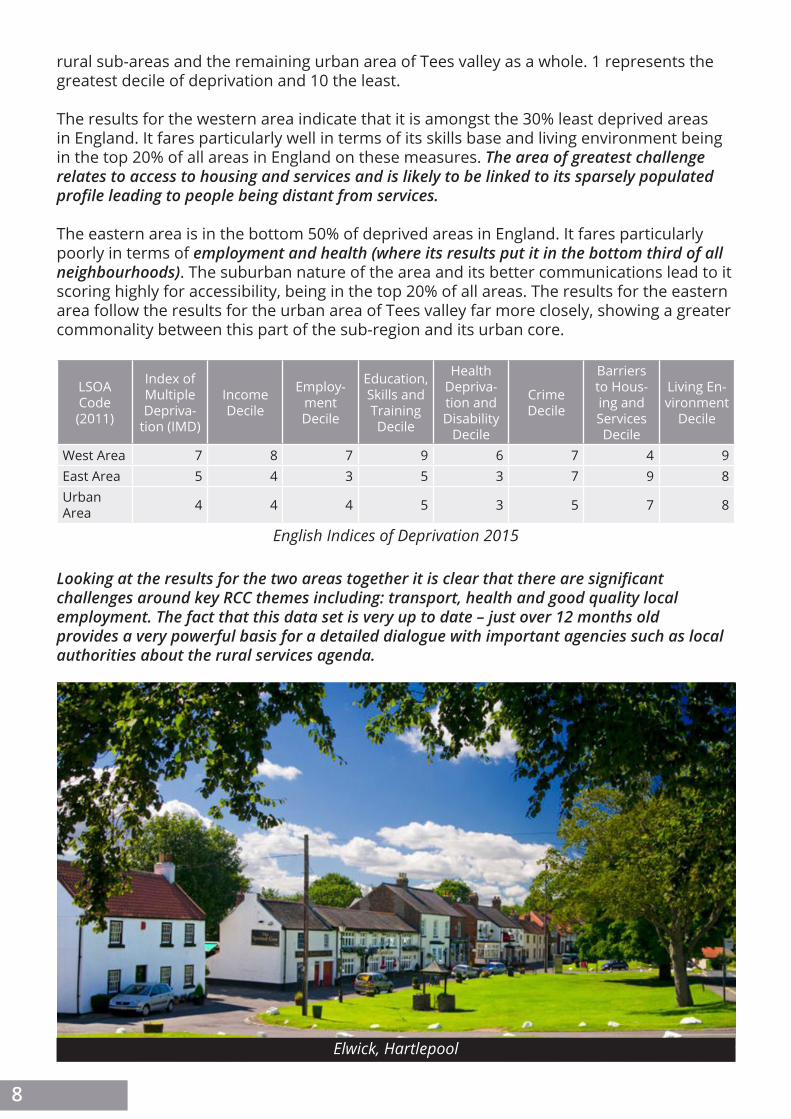
rural sub-areas and the remaining urban area of Tees valley as a whole. 1 represents the greatest decile of deprivation and 10 the least.
The results for the western area indicate that it is amongst the 30% least deprived areas in England. It fares particularly well in terms of its skills base and living environment being in the top 20% of all areas in England on these measures. The area of greatest challenge relates to access to housing and services and is likely to be linked to its sparsely populated profile leading to people being distant from services.
The eastern area is in the bottom 50% of deprived areas in England. It fares particularly poorly in terms of employment and health (where its results put it in the bottom third of all neighbourhoods). The suburban nature of the area and its better communications lead to it scoring highly for accessibility, being in the top 20% of all areas. The results for the eastern area follow the results for the urban area of Tees valley far more closely, showing a greater commonality between this part of the sub-region and its urban core.
Looking at the results for the two areas together it is clear that there are significant challenges around key RCC themes including: transport, health and good quality local employment. The fact that this data set is very up to date – just over 12 months old provides a very powerful basis for a detailed dialogue with important agencies such as local authorities about the rural services agenda.
LSOA Code (2011)
Index of Multiple Depriva-
tion (IMD)
Income Decile
Employ-ment Decile
Education, Skills and Training Decile
Health Depriva-tion and Disability
Decile
Crime Decile
Barriers to Hous-ing and Services Decile
Living En-vironment
Decile
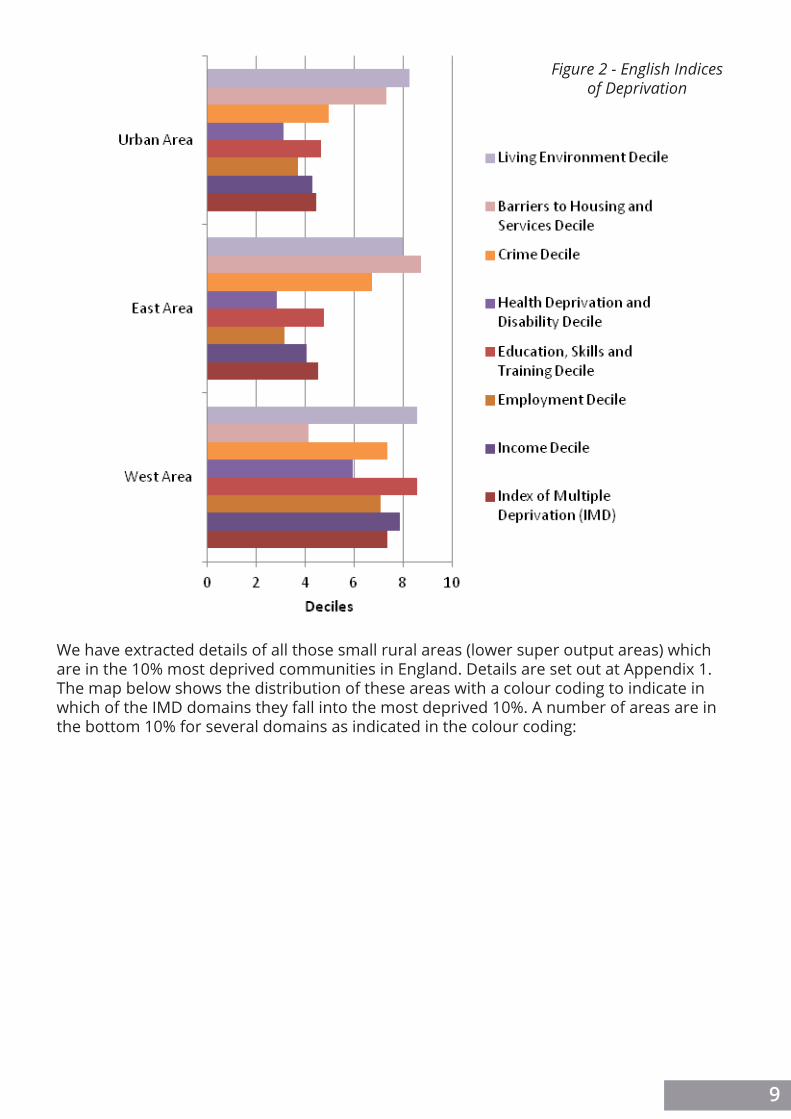
West Area 7 8 7 9 6 7 4 9East Area 5 4 3 5 3 7 9 8Urban Area 4 4 4 5 3 5 7 8
English Indices of Deprivation 2015
8
Elwick, Hartlepool
We have extracted details of all those small rural areas (lower super output areas) which are in the 10% most deprived communities in England. Details are set out at Appendix 1. The map below shows the distribution of these areas with a colour coding to indicate in which of the IMD domains they fall into the most deprived 10%. A number of areas are in the bottom 10% for several domains as indicated in the colour coding:
Figure 2 - English Indices of Deprivation
9
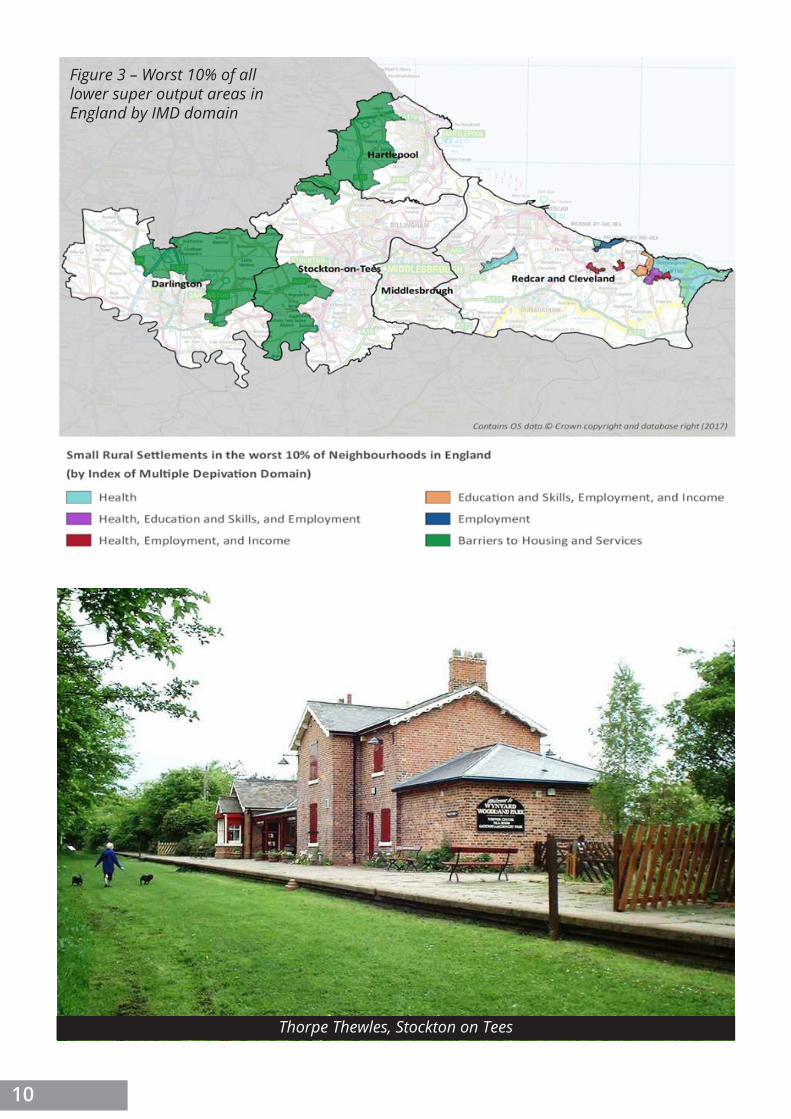
Figure 3 – Worst 10% of all lower super output areas in England by IMD domain
10
Thorpe Thewles, Stockton on Tees

EnvironmentThe rural components of the Tees Valley encompass two national landscape character areas. The western area falls into the Tees Lowland area, and part of the eastern area falls into the North York Moors and Cleveland Hills (NYMCH) area. While 5% of the land mass of the NYMCH (which covers 165,900 hectares overall) is in the Tees Valley, it does include the key settlements of Loftus, Saltburn by the Sea and Skelton.
The Tees Lowland area covers 102,000 hectares and is very different in character from NYMCH having a significant industrial landscape component in its central and eastern stretches. The western rural area is at the furthest northern and western extremities of the Tees Lowland NCA and is significantly different in character from its central core. The NCA document identifies the following areas of environmental opportunity:
Natural England National Character Area Profile Tees Lowlands pp4
“SEO 1: Protect and enhance the unique landscape of the Tees Estuary with its mosaic of internationally important intertidal, wetland and brownfield habitats.
SEO 2: Incorporate semi-natural habitats within the farmed environment, and use innovative farming techniques in order to improve the value of food provision alongside biodiversity, flood water storage capacity, and the ability of the landscape to adapt to the impacts of climate change.
SEO 3: Ensure that there is a well-connected network of high-quality green infrastructure throughout the Tees Lowlands which will enable people to understand and enjoy the natural environment, as well as providing a range of other benefits including biodiversity enhancement, food provision and flood risk mitigation.”
The farmed area of the Tees Valley (Agricultural Census Defra 2013) is 40,126 hectares – this represents 7% of all land farmed in the North East Region. 1,240 people are employed in agriculture representing 12% of those employed in the North East. 12% of all farm holdings are also based in the Tees Valley. There is no significant horticultural activity in Tees Valley and limited cereal growing. The majority of farming involves livestock and 39% of the pigs in the North East, 19% of the poultry and 18% of the dairy activity in the region is based in Tees Valley.
The vast majority of this activity takes place in the rural west area with far more limited activity in terms of both land use and employment in the east area.
11
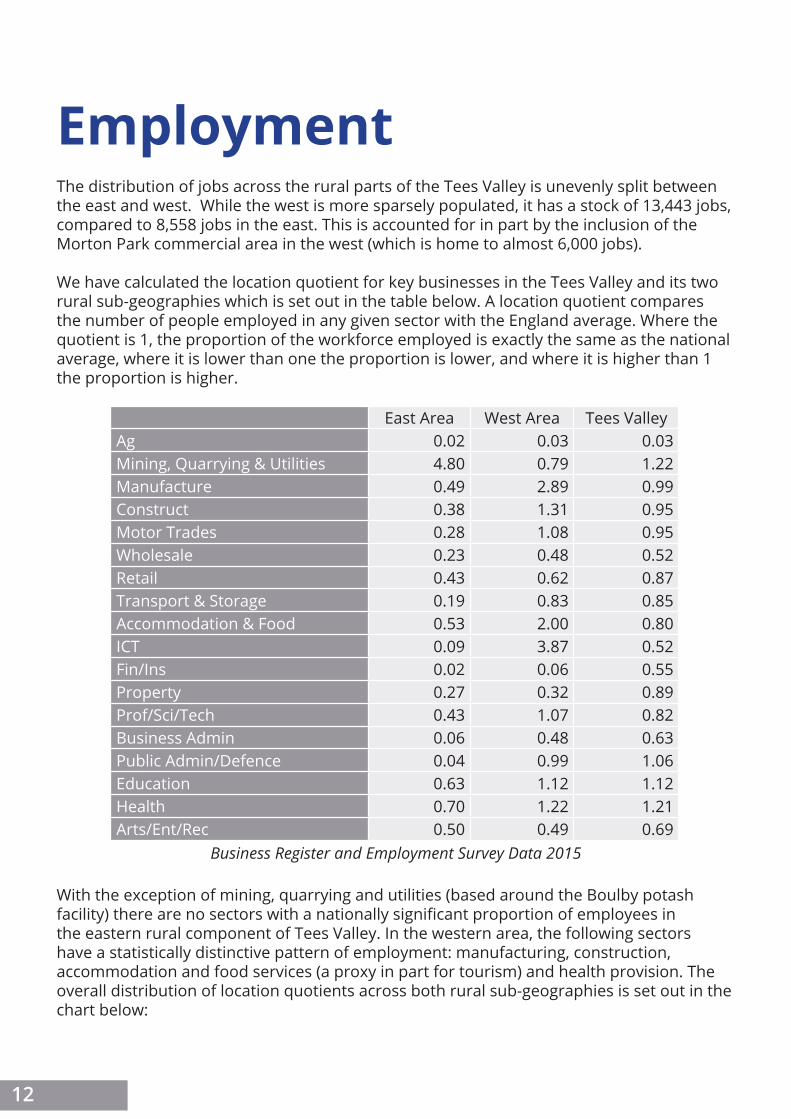
EmploymentThe distribution of jobs across the rural parts of the Tees Valley is unevenly split between the east and west. While the west is more sparsely populated, it has a stock of 13,443 jobs, compared to 8,558 jobs in the east. This is accounted for in part by the inclusion of the Morton Park commercial area in the west (which is home to almost 6,000 jobs).
We have calculated the location quotient for key businesses in the Tees Valley and its two rural sub-geographies which is set out in the table below. A location quotient compares the number of people employed in any given sector with the England average. Where the quotient is 1, the proportion of the workforce employed is exactly the same as the national average, where it is lower than one the proportion is lower, and where it is higher than 1 the proportion is higher.
With the exception of mining, quarrying and utilities (based around the Boulby potash facility) there are no sectors with a nationally significant proportion of employees in the eastern rural component of Tees Valley. In the western area, the following sectors have a statistically distinctive pattern of employment: manufacturing, construction, accommodation and food services (a proxy in part for tourism) and health provision. The overall distribution of location quotients across both rural sub-geographies is set out in the chart below:
East Area West Area Tees ValleyAg 0.02 0.03 0.03Mining, Quarrying & Utilities 4.80 0.79 1.22Manufacture 0.49 2.89 0.99Construct 0.38 1.31 0.95Motor Trades 0.28 1.08 0.95Wholesale 0.23 0.48 0.52Retail 0.43 0.62 0.87Transport & Storage 0.19 0.83 0.85Accommodation & Food 0.53 2.00 0.80ICT 0.09 3.87 0.52Fin/Ins 0.02 0.06 0.55Property 0.27 0.32 0.89Prof/Sci/Tech 0.43 1.07 0.82Business Admin 0.06 0.48 0.63Public Admin/Defence 0.04 0.99 1.06Education 0.63 1.12 1.12Health 0.70 1.22 1.21Arts/Ent/Rec 0.50 0.49 0.69
Business Register and Employment Survey Data 2015
12
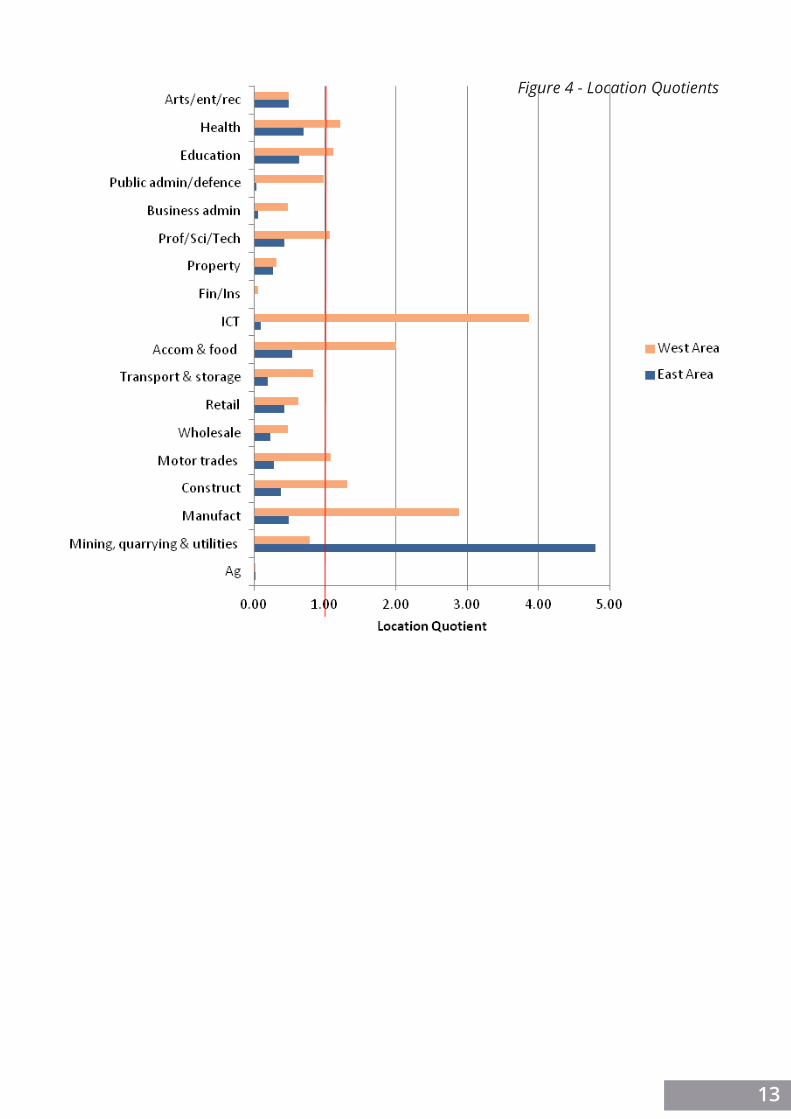
Figure 4 - Location Quotients
13
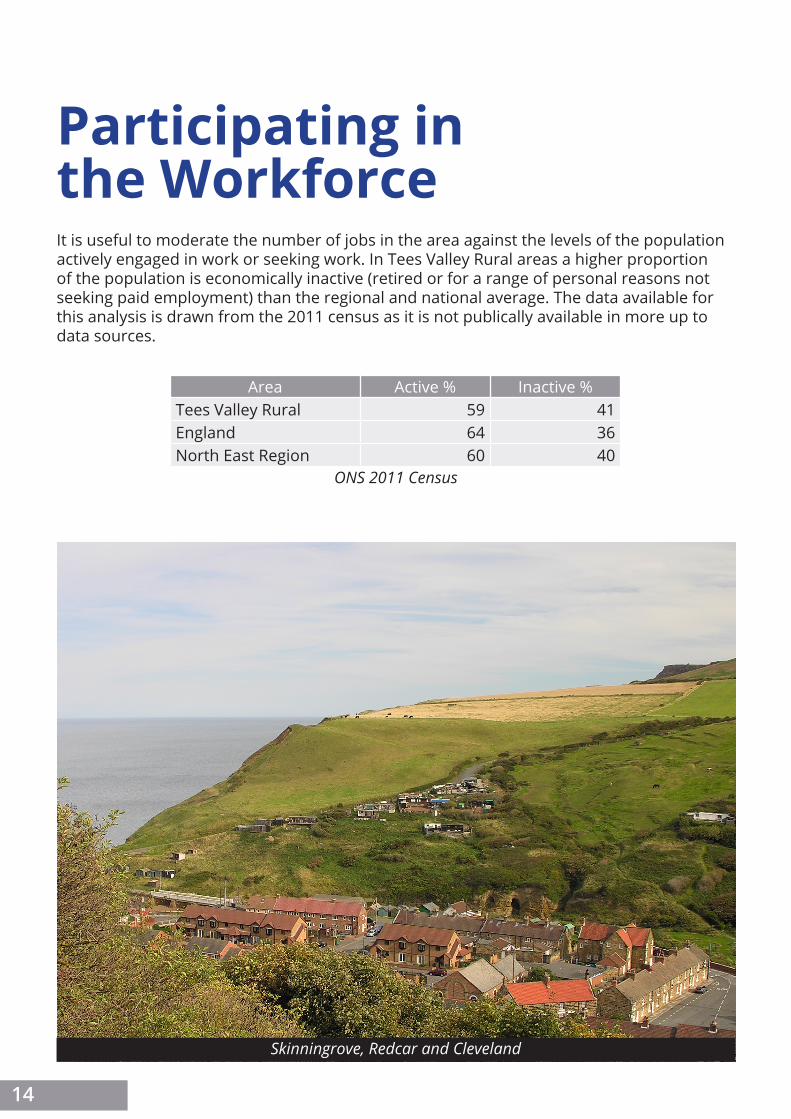
Participating inthe WorkforceIt is useful to moderate the number of jobs in the area against the levels of the population actively engaged in work or seeking work. In Tees Valley Rural areas a higher proportion of the population is economically inactive (retired or for a range of personal reasons not seeking paid employment) than the regional and national average. The data available for this analysis is drawn from the 2011 census as it is not publically available in more up to data sources.
Area Active % Inactive %Tees Valley Rural 59 41England 64 36North East Region 60 40
ONS 2011 Census
14
Skinningrove, Redcar and Cleveland

EnterpriseWhilst the difference in the distribution of businesses by number of employees is relatively modest across both rural sub-geographies, Tees Valley and England; the table below demonstrates how there are proportionately more micro-businesses in both rural sub-geographies and fewer businesses in each of the other three size categories in both areas. Large businesses have been omitted from the chart below as the percentages are so small.
Area Micro (0 to 9) Small(10 to 49)
Medium-Sized
(50 to 249)Large (250+)
West Area 86.7 10.3 2.4 0.4East Area 85.6 11.4 1.7 0Tees Valley 80.5 15.2 3.9 0.5England 84.4 12.6 2.6 0.4
Nomis 2015
Figure 5 - Scale of Enterprises
15

Job DensityJob density is the ratio of jobs in an area to the overall number of 16-64 year olds within the population. Because of its relatively small population but high number of jobs, the western rural sub-area has a nationally significant job density of almost 100%. This means the area contains almost enough jobs to employ every member of its potential workforce.
In comparison, the east area has a significantly smaller stock of jobs than the Tees Valley or England averages. The more densely populated and suburban nature of the east suggests it functions more as a residential than employment area. This is further borne out in relation to the statistics for the number of people working mainly from home and commuting patterns set out further on in this report.
Job Density %Tees Valley Rural 83England 70East Area 35.7West Area 99.4
Business Register and Employment Survey Data 2015
Figure 6 - Job Density
16
Travel PatternsOverall the area has a smaller proportion of people (reflecting its relative remoteness) without access to a car or van. More detail is set out below:
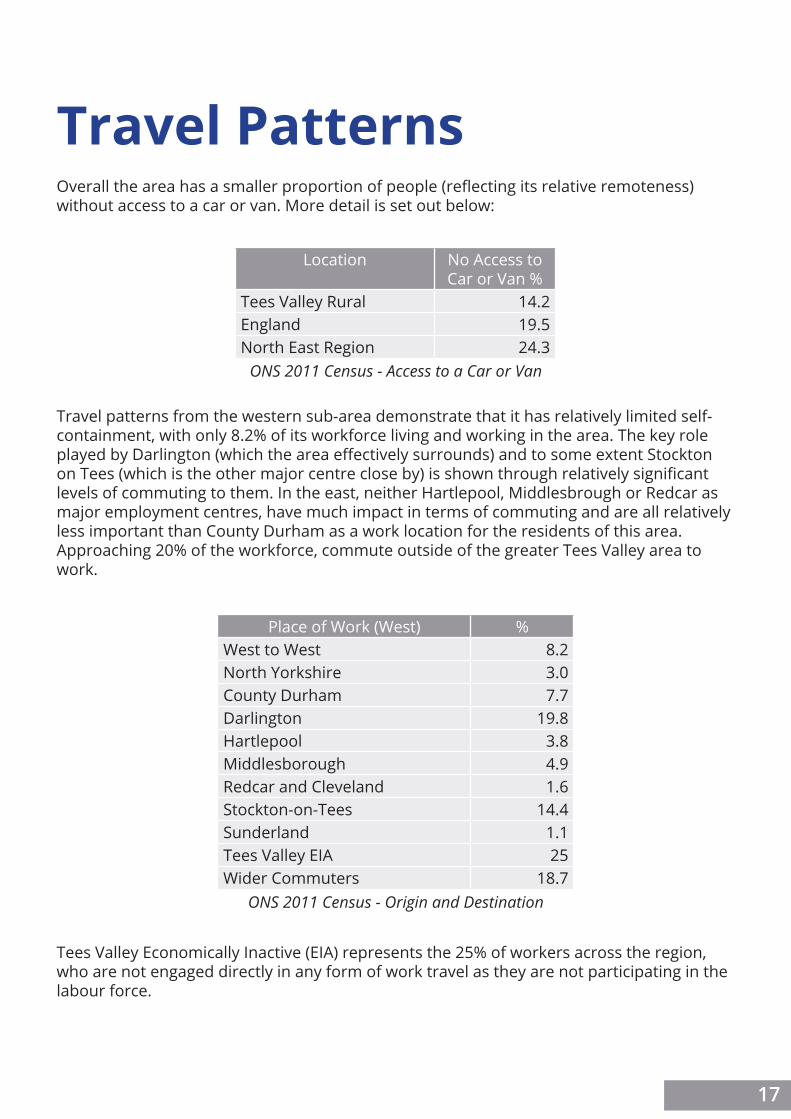
Travel patterns from the western sub-area demonstrate that it has relatively limited self-containment, with only 8.2% of its workforce living and working in the area. The key role played by Darlington (which the area effectively surrounds) and to some extent Stockton on Tees (which is the other major centre close by) is shown through relatively significant levels of commuting to them. In the east, neither Hartlepool, Middlesbrough or Redcar as major employment centres, have much impact in terms of commuting and are all relatively less important than County Durham as a work location for the residents of this area. Approaching 20% of the workforce, commute outside of the greater Tees Valley area to work.
Tees Valley Economically Inactive (EIA) represents the 25% of workers across the region, who are not engaged directly in any form of work travel as they are not participating in the labour force.
Location No Access toCar or Van %
Tees Valley Rural 14.2England 19.5North East Region 24.3
ONS 2011 Census - Access to a Car or Van
Place of Work (West) %West to West 8.2North Yorkshire 3.0County Durham 7.7Darlington 19.8Hartlepool 3.8Middlesborough 4.9Redcar and Cleveland 1.6Stockton-on-Tees 14.4Sunderland 1.1Tees Valley EIA 25Wider Commuters 18.7
ONS 2011 Census - Origin and Destination
17
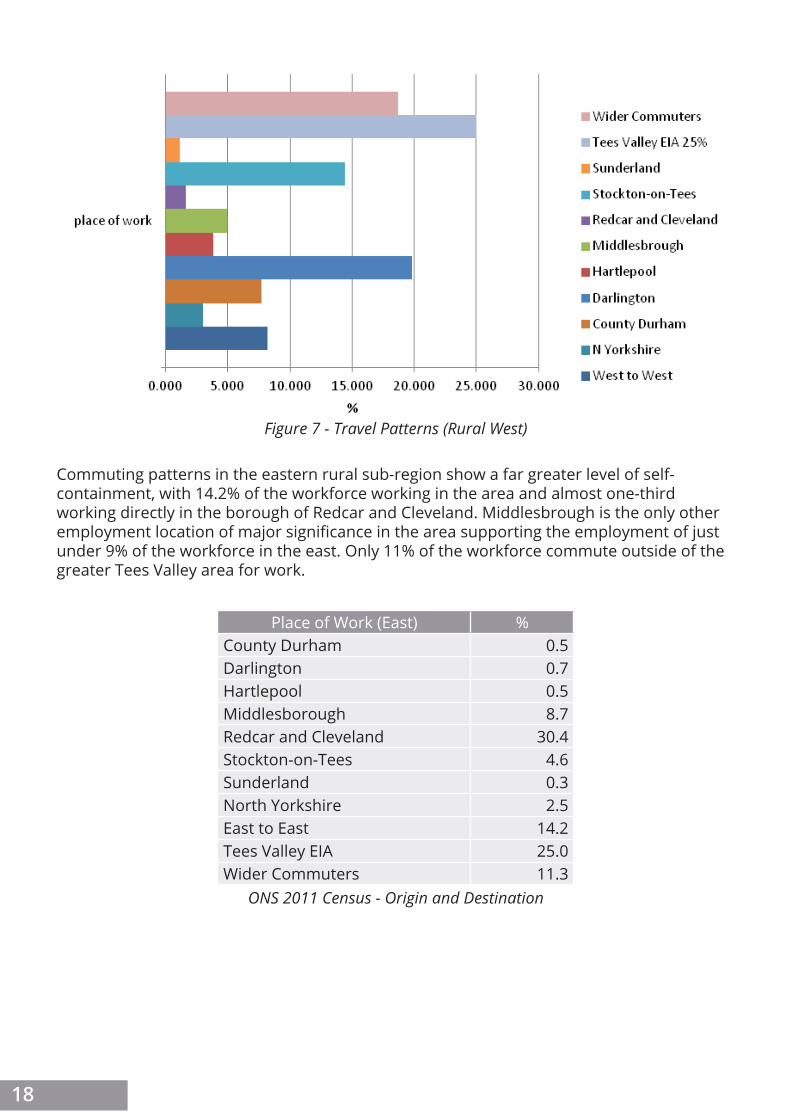
Figure 7 - Travel Patterns (Rural West)
Commuting patterns in the eastern rural sub-region show a far greater level of self-containment, with 14.2% of the workforce working in the area and almost one-third working directly in the borough of Redcar and Cleveland. Middlesbrough is the only other employment location of major significance in the area supporting the employment of just under 9% of the workforce in the east. Only 11% of the workforce commute outside of the greater Tees Valley area for work.
Place of Work (East) %County Durham 0.5Darlington 0.7Hartlepool 0.5Middlesborough 8.7Redcar and Cleveland 30.4Stockton-on-Tees 4.6Sunderland 0.3North Yorkshire 2.5East to East 14.2Tees Valley EIA 25.0Wider Commuters 11.3
ONS 2011 Census - Origin and Destination
18
Figure 8 - Travel Patterns (Rural East)
19
Heighington, Darlington
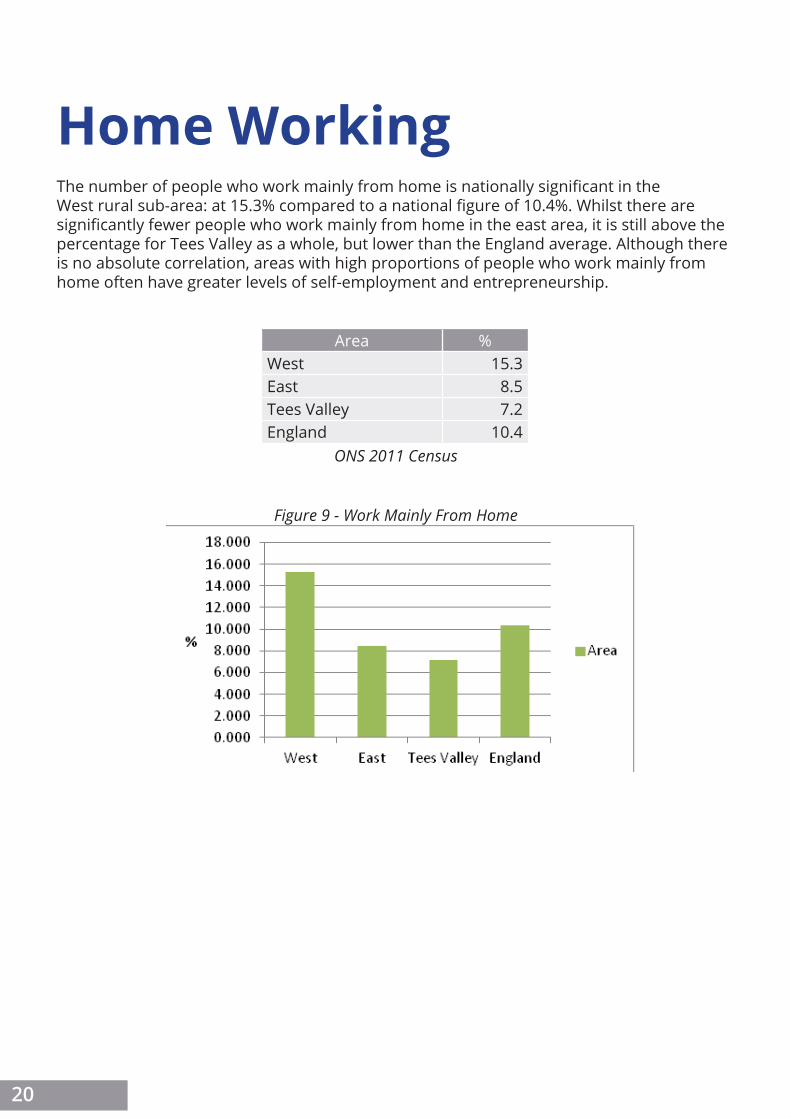
Home WorkingThe number of people who work mainly from home is nationally significant in the West rural sub-area: at 15.3% compared to a national figure of 10.4%. Whilst there are significantly fewer people who work mainly from home in the east area, it is still above the percentage for Tees Valley as a whole, but lower than the England average. Although there is no absolute correlation, areas with high proportions of people who work mainly from home often have greater levels of self-employment and entrepreneurship.
Area %West 15.3East 8.5Tees Valley 7.2England 10.4
ONS 2011 Census
Figure 9 - Work Mainly From Home
20

Internet UseData is not collected by reliable national sources in relation to internet access/usage at small area level. ONS does however publish larger area data and the latest results for the first quarter of 2015 are set out below. They show that in the most rural part of Tees Valley South Teeside which incorporates Redcar and Cleveland (the heart of our rural east area) the proportion of the population which have never used the internet is higher than the regional and national average.
Area % Never Used InternetHartlepool & Stockton-on-Tees 12.3South Teeside 17.1Darlington 13.1North East 16.5United Kingdom 13.5
ONS Internal Usage Data 2015
21
Sadberge, Darlington
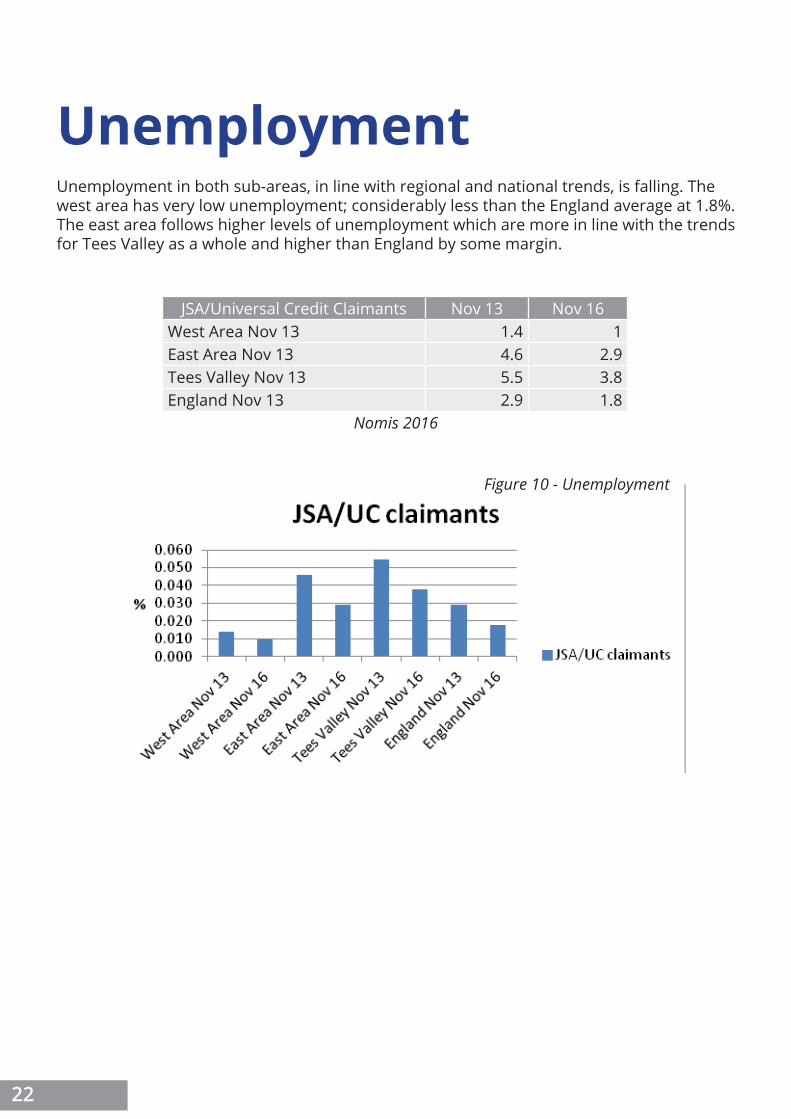
UnemploymentUnemployment in both sub-areas, in line with regional and national trends, is falling. The west area has very low unemployment; considerably less than the England average at 1.8%. The east area follows higher levels of unemployment which are more in line with the trends for Tees Valley as a whole and higher than England by some margin.
JSA/Universal Credit Claimants Nov 13 Nov 16West Area Nov 13 1.4 1East Area Nov 13 4.6 2.9Tees Valley Nov 13 5.5 3.8England Nov 13 2.9 1.8
Nomis 2016
Figure 10 - Unemployment
22
Outline of theFunctioning of therural Tees ValleyTees Valley is a significantly urban sub-region with almost 10% of the population living in rural areas. Notwithstanding that, this represents over 65,000 people – which in Redcar and Cleveland for example is around a third of the whole population. The rural area within the sub-region is in two distinct parts – a sparsely populated western and northern area (comprising one third of the rural population) and a more densely populated southern, eastern and coastal area (comprising two thirds of the population). For ease of reference we have called the former the western area and the latter the eastern area.
In terms of overall quality of life measures, the western area is amongst the least 30% deprived areas in England. It has relatively high levels of skills, income, low levels of crime and good health scores. It is challenged by its sparse pattern of settlements which impacts on residents access to services. In the eastern area the overall quality of life measures place it in the bottom 50% of deprived areas – where it faces particularly challenges in terms of employment and health. It does however score above the national average for access to services and living environment.
Both areas have a higher proportion of older people than the national average and this is particularly pronounced in the east.
Neither area has a strong tradition of internet usage and this may in part be driven by the limitations of the local broadband infrastructure.
The western area has a higher stock of jobs with real strengths in ICT, manufacturing and construction. The eastern area has a far smaller stock of jobs with one distinctive employment sector around potash mining. The western area has almost one job per head of its 16-64 year old population, whilst the eastern area has a far lower ratio of just over one job per three 16-64 year olds.
Both the western and eastern areas have a higher proportion of micro enterprises than the national and sub-regional averages. There are very few large employers (i.e., over 250 employees) in the eastern area.
Darlington operates as the economic hub for the western area, with 20% of its workforce deployed in the town. The western area has a relatively mobile workforce with approaching 20% of its labour commuting out of the greater Tees valley area to work. The eastern area has more self-containment with 30% of its workforce living and working in Redcar and Cleveland.
The western area has a nationally significant number of people who work mainly from home, whilst in the east the figure is below the national but above the sub-regional (Tees
23
Valley) average.
The western area has an unemployment level significantly below the national average. In comparison, for the east the figure is above the national average but below the sub-regional average. In line with national trends unemployment is falling in both areas.The more urban nature of the east means it has a less significant farming footprint (with around a third of all farm based employees) compared to the west area. However, the east does benefit from its proximity to the North York Moors National Park and it is an important livestock area in terms of pig and dairy production. The western area has an important agricultural sector, hosting the majority of farm based employees. The west also makes a significant contribution to the livestock economy of the North East region – particularly in relation to dairy and poultry.
Taken as a whole the area performs less well than the national average in relation to access to services, broadband usage, levels of economic activity and access to public transport, with necessity leading to the area having a higher proportion of cars and vans per head of population.
24
Dalton Piercy, Hartlepool

SWOTArising from the analysis set out in the sections above we worked with members of the Tees Valley RCC Board to produce the following SWOT setting out the Strengths, Weaknesses, Opportunities and Threats of the rural Tees Valley.
STRENGTHS
Tourism offer - coast and proximity to national park Small business base - higher than Tees Valley and national figures Homeworking - higher than Tees Valley on par with England Unemployment - lower than Tees Valley but higher than England Distinctive and important economic sectors: mining, manufacturing, construction, accommodation and food, ICT Low levels of crime compared to the national figures Good levels of skills across the area
WEAKNESSES
Some pockets of significant deprivation - esp in the East area Higher levels of economic inactivity than the national average Low job density in the East area Lower levels of internet use than the national average Poor access to housing and services in the West area Very high levels of frailty and ill health in the East area Lack of community transport provision
OPPORTUNITIES
Tourism development - building on current strengths Scope to build on the potential of a strong small business sector - particularly in the context of home workers Evolving relationships with local authorities - particularly in the context of the high proportion of the rural population in Redcar and Cleveland Reduction of isolation through work to enhance involvement with broadband/internet Work with CCGs and other health partners to look in detail at the rural health challenges in the East area Work to tackle the transport and wider access problems to services A higher proportion of older people than the Tees Valley and national average
THREATS
Lack of understanding amongst “urban focused” local authorities of their rural context/impact Worsening health outcomes and services particularly for those who are most vulnerable in the East area Social isolation and lack of key services arising from more of these things being provided online Decline of rural services centres and concentration of services in larger local towns The impact of climate change on the sustainability of coastal settlements and agriculture A higher proportion of older people than the Tees Valley and national average
25
AnalysisScale - The modest number of rural dwellers within Tees Valley means that the RCC needs to develop a strong, distinctive and compelling narrative about the rural context of the area to avoid rural issues and communities being overlooked.
Character - Tees Valley has two very distinct rural components, with different characteristics. This presents a need for differentiated thinking and action by the RCC.
Marketing/Tourism - The western rural area has a strong opportunity agenda. It provides a residential base for a significant number of people working in Darlington and Stockton on Tees, and it has high levels of wages and qualifications. This is a fertile area for discussion with the local authorities and other key players around marketing and tourism strategies for example.
Access to Housing and Services - One challenge in the west is access to services and housing and there is scope for a review and dialogue about the nature and distribution of affordable housing. This is pertinent as the high stock of jobs per resident (almost a 1:1 ratio) provides scope for retaining more residents in local employment settings. This theme also raises the importance of ongoing local transport solutions to those with significant service challenges in the more sparsely populated western area.
Deprivation and Services - The eastern area, whilst not significantly deprived, does have key needs (e.g. health and employment). The fact that this area is covered by one local authority (Redcar and Cleveland) - and represents a third of the population of that geography – provides a strong base for the development of a relatively intensive programme of engagement with the local authority in terms of service delivery. There are a number of national examples of effective RCC leadership of health services (Befriending, Village Agents etc) which could be enhanced/further developed in this part of the rural Tees Valley.
Wider Linkages - whilst there is a diffuse pattern of commuting in both areas, most of this takes place across Tees Valley. There is no strong justification therefore for seeking to build significant alliances outside of the sub-region. The limited role of Middlesbrough and Hartlepool (as two of the largest towns in the area in attracting workers from the rural components of Tees Valley) is unusual in an England wide context and merits further consideration and discussion. These areas, with relatively large populations, must provide markets for rural goods and services (e.g. local food and tourism).
Environment - the natural environment offer in the east is powerful and there is scope to strengthen and consolidate activities around the North York Moors brand.
Businesses and Sectors - In line with most rural areas in England, the whole rural component of Tees Valley has a higher stock of micro-businesses than the national average. This provides scope for a dialogue with the local authorities and LEP about ensuring these businesses are not excluded from funding opportunities because of their size or relative remoteness. There is scope for discussion with the LEP about the distinctive nature of agriculture, ICT, manufacturing, construction and mining and quarrying in the
26
rural areas and how the RCC can support activities with rural businesses in these sectors.
Farming - The east is a significant livestock rearing area and this is perhaps less well known and understood outside of the area itself. The west also has a regionally significant livestock component. Overall there is scope for greater engagement with, and promotion of, the agricultural sector. Some sectors of the farming community (particularly dairy) are economically challenges and understanding the impact that the decline in this sector is having on those rural neighbourhoods where it predominates is important.
27
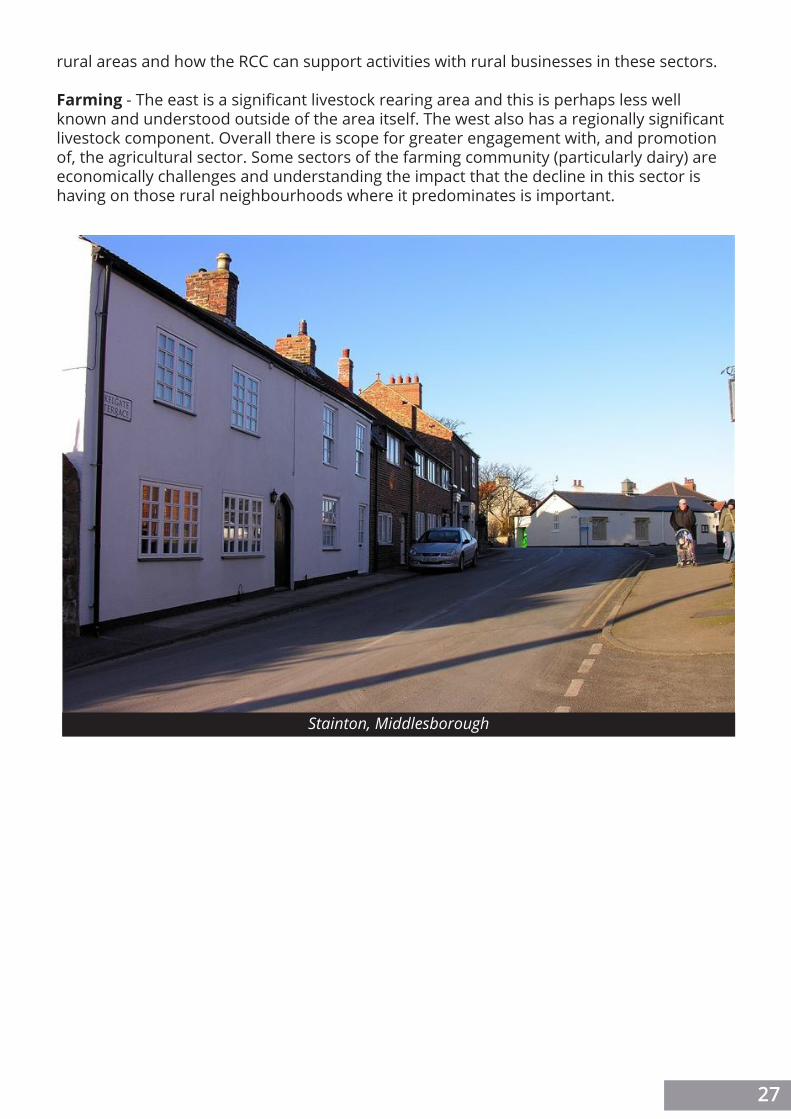
Stainton, Middlesborough
ScenariosIt is useful to think about how best to address these challenges by thinking about what Tees Valley Rural might look like without any form of action from the RCC and then some of the things which might be done to deliver a “Future Rural” agenda to make the rural settlements in Tees Valley more sustainable. We have set out both scenarios below – projecting forward 10 years.
Scenario 1 - Steady State
Tees Valley Rural is a place with:
an ageing population, dependent on declining economic sectors, relatively poor access to services, and out-commuting of its more skilled residents,
This will put pressure on the viability of its smaller service centres and make it increasingly dependent for key services on its urban surroundings.
Dispersed rural communities will find it increasingly important to deliver more services on their own account (town and parish councils could become more challenged/prominent) if they wish to retain a good range of choices for local people in terms of public transport, leisure, retail and social housing.
It will be increasingly difficult to retain small rural schools and libraries, GP surgeries and dentists. Rural isolation will become a more significant issue for the elderly and fuel poverty will continue to be a prominent challenge.
Young people will find it increasingly difficult find work and accommodation in the rural areas within the Tees Valley and communities will become less mixed and increasingly living places for the elderly and people who commute to work elsewhere.
Scenario 2 - Future Rural
Tees Valley Rural Community Council will work with others to deliver a sustainable future for its rural communities by:
Finding ways for people to both live and work in rural communities Broadening its sectoral distribution of jobs to provide a more robust series of local economies and a higher level of wages locally Focusing investment strategies on its service centres to offer people alternatives to a dependence for key services and leisure choices on external large towns
28
Rural communities will be supported in developing innovative solutions to underpin their sustainability – this will involve actions such as:
mutualizing domiciliary care services, dynamic technological approaches to community transport and tele-health, cooperative schemes delivering community energy and local employment opportunities, including self-employment, for all sectors of the community but particularly young people, local ownership and management of libraries and other village amenities including shops and pubs, supporting the ongoing viability of small local schools, overcoming residual challenges to broadband connectivity, and delivering community led housing
The approach to enabling this vision will involve locally relevant and focused approaches which bring communities together in the context of local history, traditions, art and culture.
29
Lazenby, Redcar and Cleveland
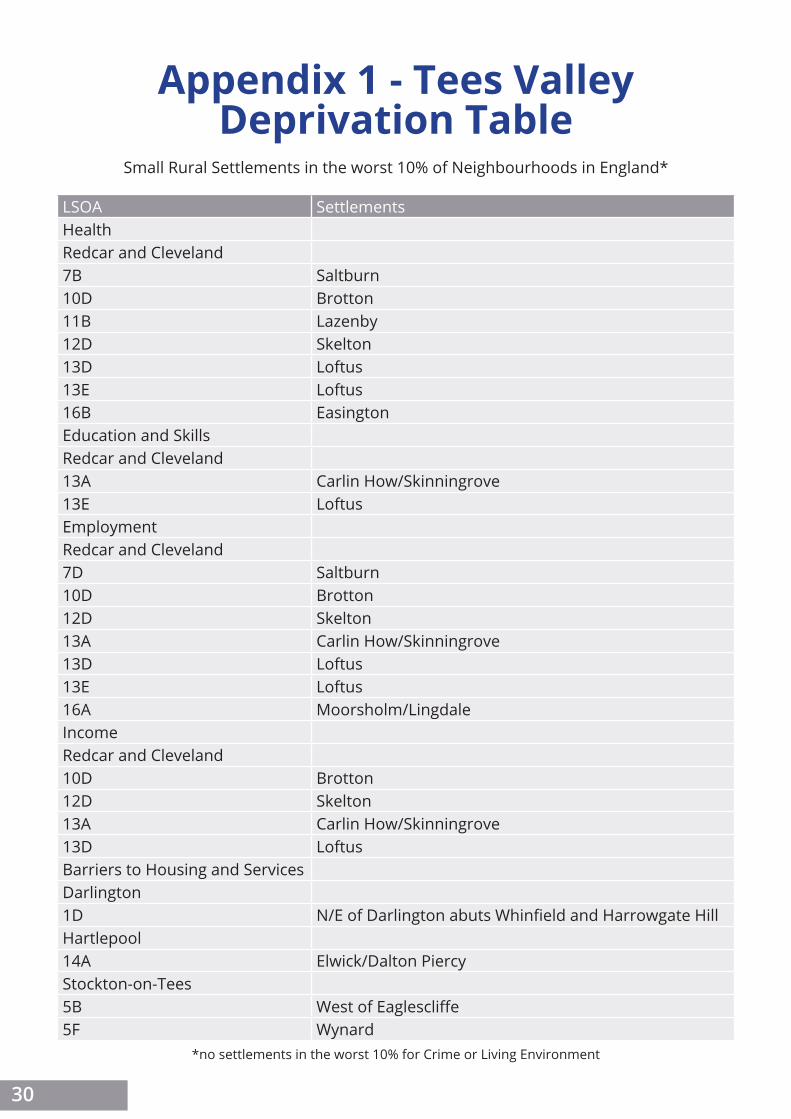
Appendix 1 - Tees ValleyDeprivation Table
Small Rural Settlements in the worst 10% of Neighbourhoods in England*
LSOA SettlementsHealthRedcar and Cleveland7B Saltburn10D Brotton11B Lazenby12D Skelton13D Loftus13E Loftus16B EasingtonEducation and SkillsRedcar and Cleveland13A Carlin How/Skinningrove13E LoftusEmploymentRedcar and Cleveland7D Saltburn10D Brotton12D Skelton13A Carlin How/Skinningrove13D Loftus13E Loftus16A Moorsholm/LingdaleIncomeRedcar and Cleveland10D Brotton12D Skelton13A Carlin How/Skinningrove13D LoftusBarriers to Housing and ServicesDarlington1D N/E of Darlington abuts Whinfield and Harrowgate HillHartlepool14A Elwick/Dalton PiercyStockton-on-Tees5B West of Eaglescliffe5F Wynard
*no settlements in the worst 10% for Crime or Living Environment
30

© This document has been prepared for Tees Valley Rural Community Council by Rose Regeneration and should not be copied without prior consent.
July 2017