Embed Size (px)
Citation preview

Telkom SA Limited
Group annual results
for the year ended March 31, 2005
(Registration number 1991/005476/06)
JSE and NYSE share symbol: TKG ISIN: ZAE000044897
-Group highlights
6.5% growth in operating revenue to R43,117 million
21.4% growth in operating profit to R11,222 million
40.6% group EBITDA margin
48.1% net debt decrease to R6,941 million, and debt to equity of
25.9%
Basic earnings per share increased by 52.9% to 1,24 1.8 cents per
share
Total dividend of 900 cents per share
Johannesburg, South Africa – June 6, 2005, Telkom S A Limited (JSE and
NYSE: TKG) announced group annual results, with str ong performance
across both business segments increasing both opera ting revenue and
profit for the year ended March 31, 2005.
The company declared an annual dividend of 400 cent s per share and a
special dividend of 500 cents per share payable on July 8, 2005.
Statement by Sizwe Nxasana, Chief Executive Officer :
“The Telkom Group has delivered strong performances in all spheres of
its business, again displaying the ability to compe te aggressively,
defend and grow its market leadership and extract f urther
efficiencies. Telkom has also invested significantl y in its people
and the sustainable development of its marketplace and despite a
number of complex challenges has succeeded in creat ing significant
value for all its stakeholders.”
“Telkom continued to build strength and flexibility into its
financial base. Strong operating cash flows adequat ely covered
capital expenditure requirements and allowed furthe r debt repayment,
resulting in a considerably strengthened balance sh eet. This enabled
the Group to repurchase shares and distribute a lar ge proportion of
controllable cash to shareholders.”
“Telkom’s net profit growth was derived from the ac celeration in the
uptake of data services, robust growth in Vodacom’s South African
customers, efficiency gains and reduced finance cha rges. Increases in
fixed-line prices contributed an estimated R224 mil lion or 10% of the
R2.2 billion growth in net profit.”
“Telkom is steadily becoming a world-class operator and continues to
deliver on its commitments as a leading driver of t ransformation and

progress in South Africa. This all-round achievemen t reflects a
business that I believe has found its balance.”

Operational Overview
Creating value
During the year ended March 31, 2005, the Group mad e good progress on
its strategy to create value. This strategy is base d on three key
imperatives – customer growth and retention, operat ional excellence
and sustaining marketplace development.
The fixed-line business posted modest growth in rev enue of 1.6% as a
result of low effective tariff increases and declin ing voice volumes.
This was offset by the increasing adoption of data services in
consumer and small and medium business markets. Sig nificant progress
was made in improving the competitiveness of the fi xed-line segment
through ongoing rationalisation, improving employee productivity and
building a culture of innovation.
Driven by continued customer growth in South Africa and other African
countries, the mobile business maintained its stron g performance.
Vodacom firmly remained the market leader in South Africa and
achieved in South Africa and other African countrie s a substantial
increase of 38.0% in customers and a high level of gross connections
of 7.8 million. During the year Vodacom successfull y launched its 3G
Vodafone Live! services and the GPRS Blackberry pro duct.
Driving greater adoption of data services across al l markets
Telkom grew fixed-line data revenue by 15.6% during the year ended
March 31, 2005. In the consumer and small business market, ADSL
adoption accelerated as a result of extensive marke ting campaigns,
new lower speed ADSL products and reduced tariffs. These include the
expansion of the TelkomInternet powered by ADSL-ser vice with two
reduced-cost, lower speed services, and the launch of a 4 Port
Ethernet interface router and a 24-month ADSL contr act bundled with a
free modem. ADSL customers increased 188.2% to 58,5 32 and Telkom
Internet subscribers grew 49.4% to 225,280, of whic h 10.2% are
broadband customers. As a result of the substantial increase in ADSL
customers, local fixed-line traffic decreased 6.0%. Excluding the
loss of minutes to ADSL, local fixed-line traffic m inutes increased
by an estimated 4.5%. Telkom has partnered with Int el in trialing
WiMAX to enable future broadband demand to be captu red, especially in
areas where ADSL deployment is not feasible.
Successful line retention
Telkom focused strongly on connecting and reconnect ing fixed-line
customers through discounted offers, targeted marke ting campaigns and
the prudent relaxing of selected credit management policies. These
actions led to a net line growth of 1.0% (excluding Telkom internal
lines). The 9.8% growth in ISDN channels was a majo r contributor to
this result. Telkom is focused on offering value-fo r-money and is
increasingly launching bundled minute packages and calling plans such
as XtraTime and Surf Anytime.
Preparing for increased competition
In line with Telkom’s strategy of delivering excell ent service to
customers at competitive prices, Telkom limited its overall tariff
increases for its regulated basket to 0.2% in 2005, well below
Government’s target inflation range of between 3% a nd 6%. From
January 1 2005, international calls decreased on av erage by 28% with
rates of R1.70 per minute (VAT inclusive) for major destinations like
the United States, United Kingdom and Australia. Pr ices for local
peak calls increased by 5.5% to 40 cents per minute (VAT inclusive)
and monthly subscriptions increased by 6.3%. From A ugust 1, 2005,
Telkom’s ADSL prices will have reduced by 40.4% for BusinessDSL 512,
29.9% for Home512 DSL and 20% for Home384 DSL since January 2005. Its
recently introduced HomeDSL 192 will also reduce by 17.9% to R270 per
month. Telkom has lowered its international private leased circuits
(IPLC) prices by 23% in the financial year. From Au gust 1, 2005 IPLC
prices will be lowered by a further 28%. There is s till a need to
rebalance certain tariffs to eliminate any cross su bsidisation and
allow for effective competition in all areas going forward.
Future fit technology
Investment in the evolution of Telkom’s network is a key imperative
to transform Telkom from its Time Division Multiple x network to an
Internet Protocol (IP)-based Next Generation Networ k. Telkom is
trialing a converged, softswitching capability to s upport VoIP
solutions which provide advanced call control, host ed IP telephony
and IP PBX solutions. In the PBX arena, Telkom alre ady has a
comprehensive IP offering aligned to customer requi rements. In
addition, Telkom has established new VoIP presence in various
international centres in an effort to attract globa l
telecommunication traffic.
Operational excellence
Telkom remains focused on improving customer servic e and customer
satisfaction levels. During the year the company em barked on a
country-wide drive to reposition and transform the company’s customer
service branches and TelkomDirect, into world-class retail outlets.
At the same time, Telkom continued with the process of closing down
non-viable outlets.
Despite some short-term service-related challenges in the fixed-line
business in the last quarter of the financial year, Telkom managed to

reduce the overall fault rate and improve repair ti mes and
installation rates. Bad weather conditions, with an extraordinary
high level of lightening incidence, resulted in inc reased fault rates
in the last 15 weeks of the financial year, which t emporarily
impacted on Telkom’s service levels. However, subse quent to year end,
the Company has taken corrective action to ensure i mproved service
levels.
The field force team, which delivers service to cus tomers, achieved
significant savings through an 11.7% reduction in t he vehicle fleet,
reduced dispatches driven by a reduction in overall repeat faults,
theft and breakage incidents. Telkom achieved furth er optimisation of
its property portfolio through the relocation of em ployees from
leased properties to owned properties, improvements in overall space
utilisation and energy management programmes and th e sale of several
non-core properties.
Meaningful investment in our workforce
Telkom has continued to invest substantially in bui lding its skills
base. During the period under review, R402 million (2004: R390m) was
spent on training and development of fixed-line emp loyees, totalling
224,662 training days. There has been a dedicated e ffort on
furthering technical skills training (100,658 days) and a continued
focus on advanced leadership development programmes as well as
specific programmes aimed at developing technical s kills among female
employees.
After conducting a comprehensive health profile in 2003 among its
employees, Telkom has launched an integrated wellne ss programme,
“Thuso“ (Sotho for “Help“). The programme includes voluntary
counselling, testing and treatment to combat HIV/Ai ds and to provide
care to employees and their families in all these h ealth-related
needs.
Maintaining leadership in the mobile market in Sout h Africa
Vodacom’s exceptional performance and customer grow th once again
exceeded expectations, further demonstrating the ro bust growth of the
cellular industry in South Africa and Vodacom’s abi lity to maintain
its leadership position in this market. Vodacom Sou th Africa added
gross connections of 6.2 million customers, the hig hest level ever
and increased market share to an estimated 56%. Vod acom continued to
focus on customer care and retention, which saw con tract customer
churn at 9.1%.
Vodacom grew data revenues by 28.8% to R1,340 milli on (Telkom’s 50%
share is R670m), largely as a result of the strong growth in SMSs
transmitted. The signing of the Vodafone Affiliate Partner agreement

announced in November 2004 allowed Vodacom to launc h the Vodafone
Live! offering, giving a distinct competitive advan tage in the mobile
phone arena.

Over 2.5 million customers outside of South Africa
Vodacom grew its customer base in other African cou ntries by 77.3% to
2.6 million (2004: 1.5m). Despite a fiercely compet itive environment,
Vodacom Tanzania grew its customer base by 75.6% to 1.2 million and
extended its market share to 59%, further entrenchi ng its leadership
position. Vodacom Congo maintained its market share at an estimated
47% and grew its customer base to 1 million. The in vestment in
Mozambique is slowly making inroads with 265,000 cu stomers.
The regulatory environment
In September 2004 the Minister of Communications, D r Matsepe-
Casaburri, made new policy announcements in terms o f further
deregulating the market. The Minister stated that t he rationale for
the acceleration of competition in certain segments is to stimulate
growth in the ICT sector and reduce the cost of tel ecommunications.
In summary the new policy announcements address 5 k ey areas:
• The self provision of facilities by the mobile op erators;
• The expansion of licensing for the provision of p ayphone services;
• The carrying of voice by value added network serv ice providers
(VANS);
• Telkom no longer being the sole provider of facil ities to VANS; and
• The resale of Private Telecommunication Network f acilities.
On January 31, 2005, the Minister clarified her int entions to state
that VANS operators are not permitted to self provi de
telecommunications facilities. On May 20, 2005 ICAS A published
regulations for VANS detailing the licence fees, em powerment
requirements, application process and fees. There a re currently
different views as to whether VANS operators will b e allowed to
provide Voice Over Internet Protocol, or VOIP, to t he general public
or only to their own customers to whom they provide d value added data
services. Regulations on interconnection and facili ties leasing are
still awaiting approval. While there are several ne twork access
issues to be resolved, we believe the Telecommunica tions Act does not
allow for unbundling of the local loop for at least 2 years from the
date the SNO is licensed. In September 2004, the Mi nister of
Communications granted a licence to a second nation al operator that
will be 30% owned by Transtel and Esitel which are beneficially owned
by the South African Government, 19% owned by Nexus connection, a
black economic empowerment consortium, 12.5% to eac h of Communitel
and Two Telecom and the remaining 25% by VSNL, a me mber of the TATA
Group. ICASA is in the process of issuing this lice nse.

In terms of the Telecommunications Act, Telkom was required to
present the results of its retail and wholesale act ivities to ICASA,
using a specific cost allocation methodology set ou t in a Chart of
Accounts and Cost Allocation Manual (COA/CAM). Telk om delivered its
audited regulatory financial statements to ICASA by the due date of
September 30, 2004.
On November 8, 2004 a Government Gazette was issued with the proposed
changes to the Telkom’s price control regulation an d inviting
comments on the proposal. A final regulation was su bmitted to the
Minister by ICASA in May 2005. If the Minister appr oves the
regulation by June 20, 2005, Telkom expects to file its tariffs in
accordance with the new regulation to be effective from August 1,
2005.
The Convergence Bill was tabled in Parliament in Fe bruary 2005. The
Portfolio Committee on Communications invited writt en comments in
April and will conduct public hearings from May 24 to June 24, 2005.
Telkom is scheduled to make an oral presentation to the Committee on
June 14, 2005.
The main stated objective of the legislation is to promote
convergence in the broadcasting, broadcasting signa l distribution and
telecommunications sectors, and to provide the lega l framework for
convergence of these sectors. The primary provision of the Bill is
the introduction of a new “horizontal“ licensing re gime, where a
number of separate licenses will be issued for netw ork
infrastructure, communications services and applica tion/content
services. Individual licenses will be granted for n etwork
infrastructure, broadcasting services and frequency spectrum. Class
Licences will be granted for communications and app lications service
using the communications infrastructure.
Telkom has several concerns with the proposed legli slation. Many of
the stakeholders that have made written submission also expressed
similar concerns in their submissions to the Portfo lio Committee.
Broadbased Black Economic Empowerment (BEE)
As a South African company, BEE is an important gro wth imperative for
Telkom. The Group recognises the need for the creat ion of a
sustainable marketplace by enlarging the domestic m arket to support
ongoing revenue and profit growth.
During the year ended March 31, 2005, Telkom direct ed R5.2 billion
(2004: R4.6b) to BEE suppliers, representing 61.9% of the Company’s
total procurement spend. The amount spent on black small, medium and
micro enterprises (SMMEs) to provide core and non-c ore services
totalled R901 million (2004: R719m).

For 2005, the second consecutive year, Telkom was r anked by Financial
Mail and Empowerdex as the most empowered company a mongst the top 185
companies on the JSE.
Telkom and Vodacom were actively involved in the de velopment of the
BEE Charter (Charter) for the ICT sector. A final d raft was sent to
the Minister of Communications in May 2005 and it i s in the process
for Cabinet approval. The Charter sets the equity o wnership target at
30% which excludes Government shareholding in the c alculation and a
20% free float exclusion for listed companies. The Charter further
states that if R7.5 billion of the equity is BEE ow ned, the company
will be fully compliant in the equity category. Bas ed on these
criteria, Telkom estimates that approximately 12% o f the company
should be BEE owned for it to be fully compliant.
Financial overview
Group operating revenue
Group operating revenue increased 6.5% to R43,117 m illion (2004:
R40,484m) for the year ended March 31, 2005. Fixed- line operating
revenue, after inter-segmental eliminations, increa sed 1.3% to
R30,844 million primarily due to solid growth in da ta services
revenue and increased subscription and connection r evenue. Mobile
operating revenue, after inter-segmental eliminatio ns, increased
22.2% to R12,273 million primarily due to customer growth.
Group operating expenses
Group operating expenses increased 2.2% to R32,175 million (2004:
R31,494m) for the year ended March 31, 2005 due to a 17.9% increase
in operating expenses in the mobile segment to R9,8 70 million (after
inter-segmental eliminations). This was partially o ffset by a 3.5%
decrease in the fixed-line operating expenses to R2 2,305 million
(after inter-segmental eliminations) primarily due to reduced
depreciation, amortisation, impairment and write-of fs, services
rendered, payments to other operators and operating leases, partially
offset by an increase in employee expenses, as a re sult of the R961
million (2004: R302m) workforce reduction expense.
Investment income
Investment income consists of interest received on short-term
investments and bank accounts. Investment income in creased 8.7% to
R350 million (2004: R322m) largely as a result of h igher interest
received due to higher average balances held in inv estment and bank
accounts. Investment income has been reclassified t o exclude interest
on trade and other receivables, which is now includ ed in “other
income“.

Finance charges
Finance charges include interest paid on local and foreign
borrowings, amortised discounts on bonds and commer cial paper bills,
fair value gains and losses on financial instrument s and foreign
exchange gains and losses. Finance charges decrease d 48.1% to R1,695
million (2004: R3,264m) due to a 32.2% decrease in interest expense
to R1,686 million (2004: R2,488m) resulting from lo wer balances on
local loans and a significant decrease in group net fair value and
exchange losses on financial instruments of R9 mill ion (2004: R776m)
as a result of a relatively stable currency.
Taxation
Consolidated tax expenses increased 79.4% to R3,070 million (2004:
R1,711m) for the year ended March 31, 2005. The con solidated
effective tax rate for the year ended March 31, 200 5 was 31.1% (2004:
27.2%).
Profit for the year
Profit for the year increased 48.2% to R6,807 milli on (2004: R4,592m)
in the year ended March 31, 2005.
Group basic earnings per share increased 52.9% to 1 ,241.8 cents
(2004: 812.0) and group headline earnings per share increased 47.5%
to 1,274.1 cents (2004: 863.6 cents).
Group balance sheet
Solid operating performance across the Group combin ed with strict
cost discipline and debt repayment has resulted in a strengthened
balance sheet. Net debt, after financial assets and liabilities,
decreased 48.0% to R6,941 million (2004: R13,362m).
The strenghtened balance sheet at March 31, 2005, r esulted in a net
debt to equity ratio of 25.9% from 59.8% at March 3 1, 2004. The Group
intends to maintain a net debt to equity targeted r ange of between
50% and 70% by increasing distributions to sharehol ders in the form
of dividends and share buy-backs while maintaining financial
flexibility for potential growth opportunities. Dur ing the year ended
March 2005, 20.4 million shares were repurchased fo r R1,574 million
and the annual and special dividend totalling R5,01 3 million will be
paid on July 8, 2005.
Interest bearing debt, including credit facilities utilised,
decreased 13.2% to R14,912 million (2004: R17,176m) for the year
ended March 31, 2005. The Group’s repayments for th e year ended March
31, 2005 included a repayment of R2,299 million of the Telkom TL08
local bond. In April 2005, the Euro 512 million loa n was settled and
refinanced in the local debt markets.

Telkom remains committed to maintaining its investm ent grade credit
ratings. In July 2004, Moody’s upgraded Telkom’s ra ting from Baa3 to
Baa1, with a stable outlook. S&P’s rating was also upgraded to BBB
from BBB-.
Group cash flow
Cash flows from operating activities increased 13.2 % to R15,711
million (2004: R13,884m) primarily due to increased operational
results and decreased finance charges paid, offset in part by the
increased taxation paid. Cash flows utilised in inv esting activities
increased 16.3% to R6,306 million (2004: R5,423m) p rimarily due to
increased capital expenditure in both the mobile an d fixed-line
segments and an increased contribution to the inves tment vehicle for
purposes of funding the post retirement medical aid liability. Cash
utilised in financing activities increased signific antly as a result
of the R1,710 million utilised for the repurchase o f shares and the
investment of R3,768 million in short-term repurcha se agreements in
the South African money and capital markets.
Group capital expenditure
Group capital expenditure increased 10.2% to R5,850 million (2004:
R5,307m) and represents 13.6% of group revenue (200 4: 13.1%) in line
with the Group’s announced guidance of maintaining capital
expenditure in the range of 12% to 15% of group rev enue.
Fixed-line capital expenditure increased 6.2% to R4 ,103 million
(March 31, 2004: R3,862m) and represents 13.1% of f ixed-line revenue
(2004: 12.5%).
Mobile capital expenditure (50% of Vodacom’s capita l expenditure)
increased 20.9% to R1,747 million (2004: R1,445m) a nd represents
12.8% of mobile revenue (2004: 12.6%) as a result o f increased
investment in South Africa for increased traffic an d investment in 3G
technologies.
Consolidated capital expenditures in property, plan t and equipment
for the 2006 financial year is budgeted to be R7,20 4 million, of
which R5,037 million is budgeted to be spent in the fixed-line
segment and R2,167 million in the mobile segment (5 0% of Vodacoms,
which is the group’s 50% share of Vodacom’s total b udgeted capital
expenditure of R4,333m).
Share repurchase, employee share ownership and divi dends
In the year ended March 31, 2005, the Company had r epurchased 20.4
million shares amounting to R1.6 billion (including costs) which are
currently being held as treasury shares and for pur poses of the
Telkom Conditional Share Plan (TCSP). In August 200 4, 3.0 million
shares were granted to employees through the TCSP.

The Telkom board of directors declared an annual di vidend of 400
cents per share and a special dividend of 500 cents per share on June
2, 2005, payable on July 8, 2005 for shareholders r egistered on July
1, 2005.
The Board aims to pay an increasing dividend annual ly. The level of
dividend will be based upon a number of factors, in cluding the
assessment of financial results, available growth o pportunities and
capital requirements, the group’s debt level, inter est coverage and
future expectations, including internal cash flows.
Audit report
The comprehensive annual financial statements, from which the
summarised results have been derived, have been aud ited by the
company’s auditors Ernst & Young. Their unqualified audit opinion on
the comprehensive annual financial statements is av ailable for
inspection at the Company’s registered office.
Strategic direction
Telkom’s turnaround is largely complete, and its op erations and
financial base have been stabilised. It has rewarde d its shareholders
for backing an ambitious vision to be a world-class operator, and
management’s ability to realise this vision. And to support long-term
profitable growth, Telkom has continued to play a c entral role in the
socio-economic transformation of South Africa.
The accelerated liberalisation of the market, in pa rticular the
implications of the Convergence Bill, in draft stag e at the time of
writing, is clearly material to Telkom’s strategic intentions. Telkom
believes that it is strongly positioned to compete in a liberalised
market. Greater choice for consumers will also supp ly a relevant and
credible basis for comparison, and Telkom believes that it will prove
to be competitive on this basis.
To ensure that Telkom can sustain the creation of v alue relative to
developments in its dynamic market environment, man agement have
determined certain shifts in strategic emphasis.
Telkom will focus on the following imperatives to s upport growth:
• By moving to a predominantly IP based network, Te lkom will have the
ability to offer converged services such as voice, data and video
services, thereby meeting the advancing needs of ex isting customers
and attracting new customers.
• Expanding our VAN/IT/ISP services to win a larger market share and
become the leading ISP and VAN provider in South Af rica.
• Becoming a wholesale provider of choice by provid ing access to our
high quality network at competitive prices.
• Continuing to benefit from our investment in Voda com to provide
robust mobile customer growth. Management believes that the mobile
market in South Africa will remain vibrant with goo d growth
prospects.
• Although it is clear that significant potential f or growth exists
in Africa, Telkom will evaluate any acquisitive opp ortunities as they
arise, using stringent criteria particularly in ter ms of their value
accretive prospects.
The realisation of Telkom’s strategic intentions ul timately lies in
the hands of Telkom’s people. Product, service and operational
innovation vests mostly in people. As such, Telkom has committed to
invest significantly in its people as the drivers o f innovation,
excellence and growth.
Telkom has a strong, capable and diverse management team with a clear
sense of direction, and it stands ready for a new a nd exciting phase
of development.
NE Mtshotshisa SE Nxasana
Non-executive Chairman Chief Executive Officer
June 2, 2005
Company registered office
Telkom SA Limited 1991/005476/06,
Telkom Towers North, 152 Proes Street
Pretoria, 0002, South Africa
Private Bag X881, Pretoria, 0001
Sponsor
UBS South Africa (Proprietary) Limited
Board of directors
Nomazizi Mtshotshisa (Chairman)
Sizwe Nxasana (CEO)
Thenjiwe Chikane
Brahm du Plessis
Tshepo Mahloele
Thabo Mosololi
Marius Mostert
Albertinah Ngwezi
Dumisani Tabata
Yekani Tenza
Lazarus Zim

This information is also available on Telkom’s inve stor relations
website http://www.telkom.co.za/ir
Summarised group financial statements
Audited consolidated income statement
Year ended March, 31
Restated
2003 2004 2005
Rm Rm Rm
Operating revenue 37,322 40,484 43,117
Other income 401 255 280
Operating expenses 31,043 31,494 32,175
Employee expenses 7,208 7,40 8 8,111
Payments to other operators 6,092 5,985 6,132
Selling, general and administrative
expenses 7,498 7,660 8,820
Services rendered 2,622 2,269 2,021
Operating leases 1,124 924 803
Depreciation,amortisation,
impairment and write-offs 6,499 7,248 6,288
Operating profit 6,680 9,245 11,222
Investment income 256 322 350
Finance charges 4,201 3,264 1,695
Interest 2,869 2,488 1,686
Foreign exchange and fair value
effect 1,332 776 9
Profit before tax 2,735 6,303 9,87 7
Taxation 1,035 1,711 3,070
Profit for the year 1,700 4,592 6,807
Attributable to:
Equity holders of Telkom SA Ltd 1,628 4,523 6,724
Minority interest 72 69 83
1,700
Basic earnings per share (cents) 292.3 812.0 1,241.8
Diluted earnings per share (cents) 812.0 1,239.4
Dividend per share (cents) – 90.0 110.0

Audited consolidated balance sheet
Years ended March, 31
Restated
2003 2004 2005
Rm Rm Rm
Assets 2003 2004 2005
Non-current assets 44,739 42,841 42,6 72
Property, plant and
equipment 41,046 39,024 39,073
Investment properties – 32 25
Intangible assets 356 564 533
Investments 1,161 1,567 2,277
Other financial assets 1,571 1,101 134
Deferred expenses 143 202 118
Deferred taxation 462 351 512
Current assets 8,647 10,322 14,910
Current portion of other
financial assets 342 140 4,940
Income tax receivable 276 – –
Short term investments 26 168 69
Current portion of deferred
expenses 272 430 214
Inventories 621 520 657
Trade and other receivables 5,993 5,846 5,820
Cash and cash equivalents 1,117 3,218 3,210
Total assets 53,386 53,163 57,582
Equity and liabilities
Equity attributable to
equity holders of Telkom SA
Ltd 18,670 22,372 26,853
Share capital and premium 8,293 8,293 8,293
Treasury shares – (238) (1,812)
Share-based compensation
reserve – – 68
Non-distributable reserves (15) 91 362
Retained earnings 10,392 14,226 19,942
Minority interest 194 200 220
Total equity 1 8,864 22,572 27,073
Non-current liabilities 20,663 16,420 13,546
Interest bearing debt 17,453 12,703 9,504
Other financial liabilities 143 153 83

Deferred taxation 222 773 1,239
Deferred revenue 305 353 260
Provisions 2,540 2,438 2,460
Current liabilities 13,859 14,171 16,963
Credit facilities utilised 280 422 909
Trade and other payables 5,229 6,007 6,785
Shareholders for dividend – 7 7
Current portion of interest
bearing debt 4,759 4,051 4,499
Current portion of deferred
revenue 1,023 1,404 1,394
Current portion of
provisions 1,825 1,329 1,429
Income tax payable 177 459 1,710
Current portion of other
financial liabilities 492 230
Total liabilities 34,522 30,591 30,509
Total equity and liabilities 53,386 53,163 57,582

Audited consolidated cash flow statement
Years ended March, 31
2003 2004 2005
Rm Rm Rm
Operating activities 9,748 13,884 15,711
Cash receipts from
customers 37,494 40,520 43,561
Cash paid to suppliers and
employees (25,431) (24,750) (25,402)
Cash generated from
operations 12,063 15,770 18,159
Interest received 384 479 477
Finance charges paid (2,776) (1,255) (809)
Taxation refunded/(paid) 102 (562) (1,487)
Cash generated from
operations before dividend
paid 9,773 14,432 16,340
Dividend paid (25) (548) (629)
Investing activities (5,731) (5,423) (6,306)
Proceeds on disposal of
property, plant and
equipment 21 52 37
Proceeds on disposal of
investment 172 29 267
Proceeds on disposal of
subsidiaries and joint
ventures 16 – –
Additions to property,
plant and equipment (5,671) (5,187) (5,880)
Intangible assets acquired – (61) –
Additions to other
investments (269) (331) (592)
Acquisition of
subsidiaries – 75 (138)
Financing activities (3,026) (6,481) (9,897)
Listing costs (154) – –
Purchase of treasury
shares – (102) (1,710)
Loans raised 9,117 1,732 1,157
Loans repaid (11,526) (7,428) (5,026)
Finance lease capital
raised 5 – –

Finance lease capital
repaid – (5) (14)
Increase in net financial
assets (468) (678) (4,304)
Net increase/(decrease) in
cash and cash equivalents 991 1,980 (492)
Net cash and cash
equivalents at beginning
of the year (98) 837 2,796
Effect of foreign exchange
rate differences (21) (3)
Net cash and cash
equivalents 837 2,796

Audited consolidated statement of changes in equity
Year ended March, 31
2003 2004 2005
Rm Rm Rm
Balance at April 1 16,965 18,864 22,572
– Attributable to equity holders 16,832 18,670 22,372
– Minority interests 133 194 200
Restatement of employee liabilities 330 – –
Change in accounting policies 14 – –
Restated balance at April 1 17,309 18,864 22,572
– Attributable to equity holders 17,176 18,670 22,372
– Minority interests 133 194 200
Net profit for the year 1,700 4,592 6,807
Dividend declared (25) (555) (673)
Foreign currency translation reserve (160) (100) 12
Fair value adjustment on investments (37) 9 (22)
Capital contribution 33 – –
Preliminary listing cost expensed 44 –
Purchase of treasury shares – (238) (1,574)
Purchase of subsidiary – – 5
Increase in share based compensation
reserve – – 68
Business combinations – – (122)
Balance at March 31 18,864 22,572 27,073
- Attributable to equity holders 18,670 22,372 26,853
- Minority interests 194 200 220
Notes to the summarised consolidated financial stat ements for the
year ended March 31, 2005
Significant accounting policies
Basis of preparation
The Group has prepared summarised consolidated fina ncial statements
in conformity with International Financial Reportin g Standards and in
compliance with IAS34 Interim Financial Reporting.
The summarised financial statements are prepared on the historical
cost basis, with the exception of certain financial instruments and
share-based compensation which are measured at fair value. The
Group's significant accounting policies are consist ent with those
applied in the previous financial year except for t he following:
Adoption of certain International Financial Reporti ng Standards
The following revised and new standards have been e arly adopted for
the year under review:

The Group early adopted IFRS2 in the current year. The effect of the
adoption of the standard in the current year is an increase of R68
million in employee expenses and R68 million in the share-based
compensation reserve. There was no impact on the pr ior years as no
grants were made prior to April 1, 2004.
The Group has also early adopted the following revi sed and new
standards during the year under review. This has no t impacted the
Group's cash flow information, but impacted on the results and
disclosure for the years ended March 31, 2005 and 2 004.
IAS1 Presentation of Financial Statements
IAS2 Inventories
IAS8 Accounting Policies, Changes in Accounting Est imates and
Errors
IAS10 Events after the Balance Sheet Date
IAS21 The Effects of Changes in Foreign Exchange Ra tes
IAS27 Consolidated and Separate Financial Statement s
IAS28 Investments in Associates
IAS31 Interests in Joint Ventures
IAS32 Financial Instruments: Disclosure and Present ation
IAS33 Earnings per Share
IAS39 Financial Instruments: Recognition and Measur ement
IFRS5 Non-current Assets Held for Sale and Disconti nued Operations
Reclassifications
Certain comparative figures have been reclassified in accordance with
current period classification and presentation. The se
reclassifications have no effect on the prior years ' profit. The
current period classification more closely resemble s the nature of
the transactions within the Group's operating struc ture. The
principal reclassifications were as follows:
Interest received from debtors from investment inco me to other
income;
Apportion Deferred revenue and Deferred expenses be tween current and
long-term portions;
Deferred expenses from Trade and other receivables to Deferred
expenses; and
Apportion Other financial assets and Other financia l liabilities
between current and long-term portions.
Change in accounting policies
The Group changed its accounting policies with resp ect to revenue
recognition of mobile activation revenue and costs; minority interest
(IAS27); goodwill translation (IAS21); and goodwill amortisation
(IFRS3).

Restatements
The Group has restated revenue relating to mobile e quipment sales,
deferred taxation and the sick leave liability as a result of
incorrect application of GAAP in the past.
2003 2004 2005
Rm Rm Rm
Operating revenue 37,322 40,484 43,117
Fixed-line 29,106 30,443 30,844
Mobile 8,216 10,041 12,273
Fixed-line 29,106 30,443 30,844
Subscriptions, connections and other
usage 4,595 5,024 5,316
Traffic 18,001 18,313 17,723
Domestic (local and long distance) 9,178 9,680 9,286
Fixed-to-mobile 7,539 7,321 7,302
International (outgoing) 1,284 1,312 1,135
Interconnection 1,587 1,441 1,319
Data 4,183 4,787 5,510
Directories and other 740 878 976
Change in comparatives
The Group restated its revenue relating to mobile e quipment sales for
the years ended March 31, 2004 with R311 million an d 2003 with R185
million.
2003 2004 2005
Rm Rm Rm
Workforce reduction expenses 244 302 961
Telkom has continued to incur costs as a result of a plan to reduce
the size of its workforce to a comparable level for international
telecommunication companies. The total number of em ployees who left
the company is 5,041 (2004: 1,633). These employees include
management and operating staff. For 2,745 of the em ployees, March 31,
2005 was their last working day.

2003 2004 2005
Rm Rm Rm
Depreciation, amortisation, impairment and
write-offs 6,499 7,248 6,288
Depreciation of property, plant and
equipment 6,146 6,763 5,826
Depreciation of investment properties – 2 2
Amortisation of intangible assets 148 133 116
Impairment of goodwill 16 – –
Impairment of intangible assets – – 49
Impairment of property, plant and equipment – 149 85
Write-offs of property, plant and equipment 189 201 210
In recognition of the changed usage patterns of cer tain items of
property, plant and equipment, the Group reviewed t heir remaining
useful lives in the current year. The assets affect ed were network
equipment and data processing equipment and softwar e. Accordingly,
the Group revised the estimated useful lives of the se assets from 5
to 7 years and 8 years respectively. As the prior p eriod effects are
not determinable, the estimated remaining useful li ves of these
assets were adjusted prospectively, which resulted in a decrease of
the current year depreciation charge of R542 millio n.
2003 2004 2005
Earnings per share
Basic earnings per share (cents) 292.3 812.0 1,241.8
The calculation of earnings per share is based on p rofit attributable
to equity holders of Telkom SA Ltd for the year of R6,724 million
(2004: R4,523m, 2003: R1,628m) and 541,498,547 (200 4: 556,994,962,
2003: 557,031,819) weighted average number of ordin ary shares in
issue.
2003 2004 2005
Diluted earnings per share (cents) 292.3 812.0 1,239.40
The calculation of diluted earnings per share is ba sed on earnings
for the year of R6,724 million (2004: R4,523m, 2003 : R1,628m) and
542,537,579 diluted weighted average number of ordi nary shares (2004:
556,994,962, 2003: 557,031,819). The adjustment in the weighted
average number of shares is as a result of the expe cted future
vesting of shares already allocated to employees un der the Telkom
Conditional Share Plan.
2003 2004 2005
Headline earnings per share (cents) 313.8 863.6 1,274.1

The calculation of headline earnings per share is b ased on headline
earnings of R6,899 million (2004: R4,809m, 2003: R1 ,748m) and
541,498,547 (2004: 556,994,962, 2003: 557,031,819) weighted average
number of ordinary shares in issue.
2003 2004 2005
Rm Rm Rm
Reconciliation between earnings and
headline earnings:
Earnings as reported 1,628 4,523 6,724
Adjustments:
Profit on disposal of investment (89) (25) (64)
Profit on disposal of property, plant and
equipment (15) (19) (30)
Impairment of assets – 149 134
Write-offs of property, plant and
equipment 189 201 210
Amortisation of goodwill 74 72 –
Impairment of goodwill 16 – –
Tax and minority interest effects (55) (92) (75)
Headline earnings 1,748 4,809 6,899
Diluted headline earnings per share
(cents) 313.8 863.6 1,271.6
The calculation of diluted headline earnings per sh are is based on
headline earnings of R6,899 million (2004: R4,809m, 2003: R1,748m)
and 542,537,579 (2004: 556,994,962, 2003: 557,031,8 19) diluted
weighted average number of ordinary shares in issue . The adjustment
in the weighted average number of shares is as a re sult of the
expected future vesting of shares already allocated to employees
under the Telkom Conditional Share Plan.
2003 2004 2005
Dividend per share (cents) – 90 110
The calculation of dividend per share is based on d ividends of R606
million (2004: R501m, 2003: RNil) declared on June 3, 2004 and
551,509,083 (2004: 557,031,819, 2003: 557,031,819) number of ordinary
shares issued. The reduction in the number of share s represents the
number of treasury shares held on date of payment.
2003 2004 2005
Net asset value per share (cents) 3,351,7 4,039,4 5,033,7
The calculation of net asset value per share is bas ed on net assets
of R26,853 (2004: R22,372m, 2003: R18,670m) and 533 ,465,571 issued
shares (2004: 553,846,083) (2003: 557,031,819).
2003 2004 2005
Rm Rm Rm
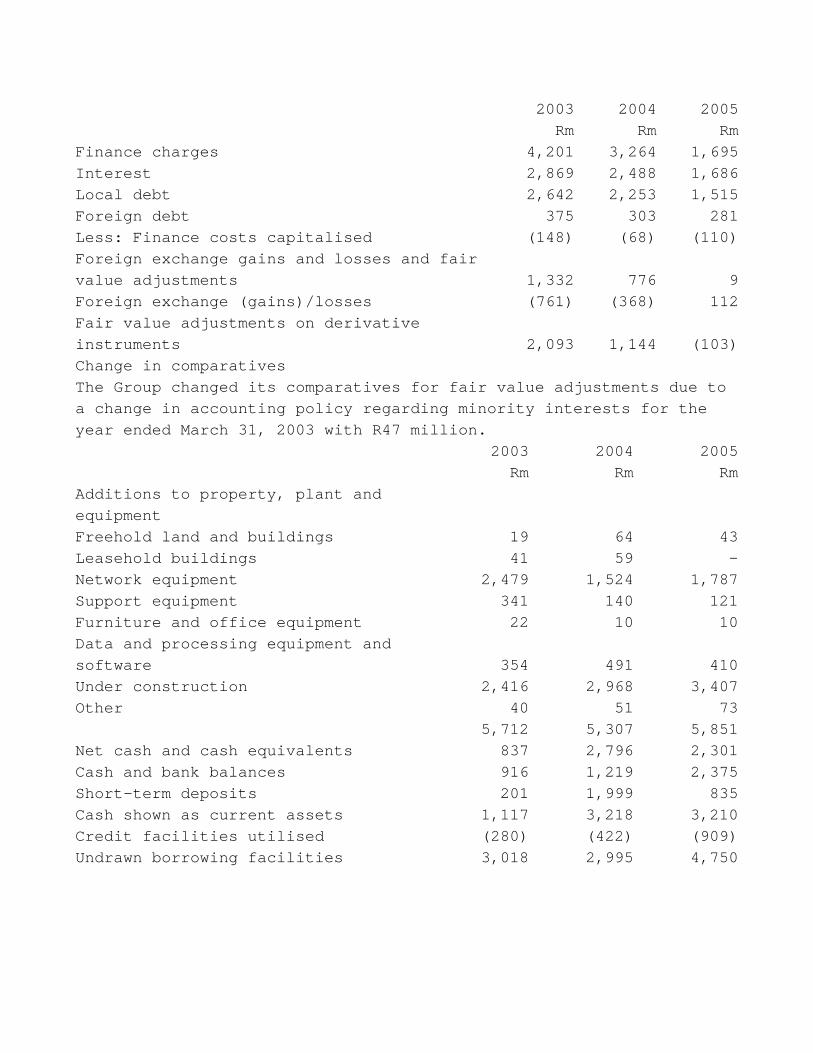
Finance charges 4,201 3,264 1,695
Interest 2,869 2,488 1,686
Local debt 2,642 2,253 1,515
Foreign debt 375 303 281
Less: Finance costs capitalised (148) (68) (110)
Foreign exchange gains and losses and fair
value adjustments 1,332 776 9
Foreign exchange (gains)/losses (761) (368) 112
Fair value adjustments on derivative
instruments 2,093 1,144 (103)
Change in comparatives
The Group changed its comparatives for fair value a djustments due to
a change in accounting policy regarding minority in terests for the
year ended March 31, 2003 with R47 million.
2003 2004 2005
Rm Rm Rm
Additions to property, plant and
equipment
Freehold land and buildings 19 64 43
Leasehold buildings 41 59 –
Network equipment 2,479 1,524 1,787
Support equipment 341 140 121
Furniture and office equipment 22 10 10
Data and processing equipment and
software 354 491 410
Under construction 2,416 2,968 3,407
Other 40 51 73
5,712 5,307 5,851
Net cash and cash equivalents 837 2,796 2,301
Cash and bank balances 916 1,219 2,375
Short-term deposits 201 1,999 835
Cash shown as current assets 1,117 3,218 3,210
Credit facilities utilised (280) (422) (909)
Undrawn borrowing facilities 3,018 2,995 4,750

Share capital
Authorised and issued share capital and share premi um are made up as
follows:
Issued and fully paid 8,293 8,293 8,293
557,031,817 ordinary shares of R10 each 5,570 5,570 5,570
1 Class A ordinary share of R10 – – –
1 Class B ordinary share of R10 – – –
Share premium 2,723 2,723 2,723
Treasury shares – (238) (1,812)
12,717,190 (2004: 3,185,736) and 10,849,058 (2004: Nil) ordinary
shares in Telkom, with a fair value of R1,366 milli on (2004: R251m)
and R1,166 million (2004: RNil) are currently held as treasury shares
by its subsidiaries Rossal No 65 (Proprietary) Limi ted and Acajou
Investments (Proprietary) Limited, respectively.
2003 2004 2005
Rm Rm Rm
Interest bearing debt
Long term interest bearing debt 17,453 12,703 9,504
Total interest bearing debt 22,212 16,754 14,003
Gross interest bearing debt 26,181 20,151 16,914
Discount on debt instruments issued (3,969) (3,397) (2,911)
Less: -Current portion of interest
bearing debt (4,759) (4,051) (4,499)
Local debt (4,527) (3,628) (264)
Locally registered Telkom debt
instruments (4,306) (2,286) –
Repurchase agreements (167) (27) 0
Commercial paper bills (54) (1,313) (262)
Short-term interest free loans – (2) (2)
Foreign debt (225) (408) (4,210)
Finance lease (7) (15) (25)
Commitments
Capital commitments authorised 6,974 7,151 7,970
Fixed-line 4,977 4,566 5,029
Mobile 1,997 2,585 2,941
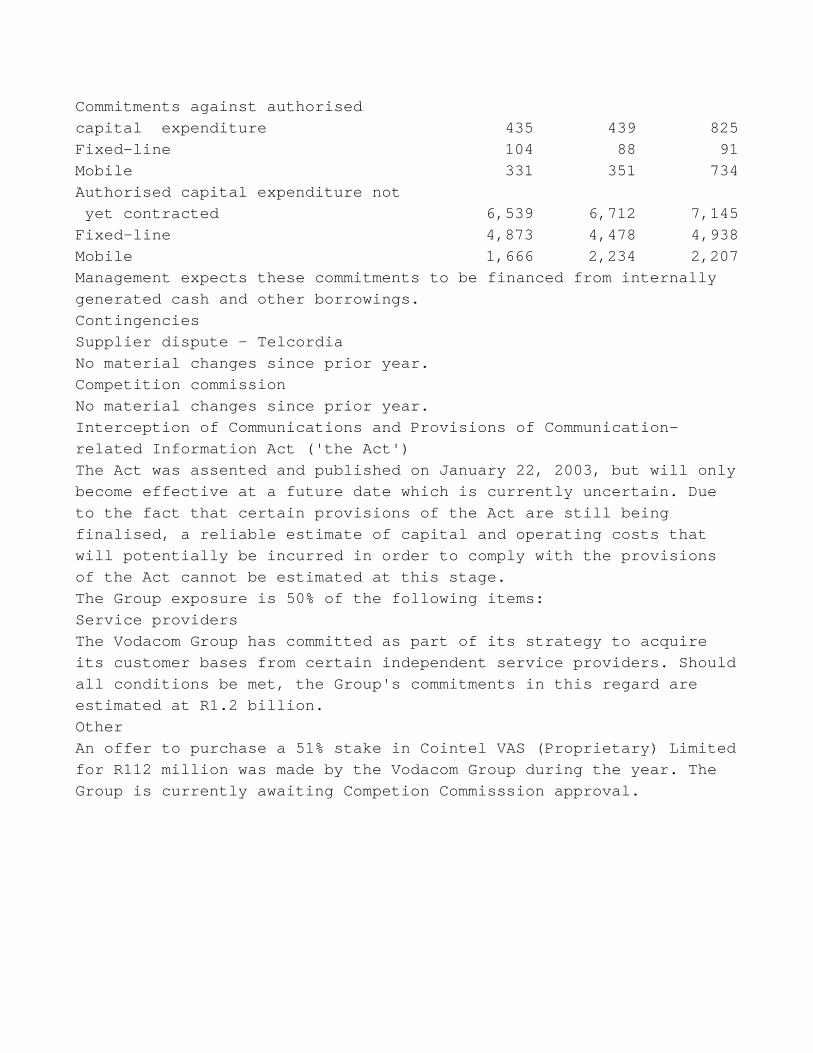
Commitments against authorised
capital expenditure 435 439 825
Fixed-line 104 88 91
Mobile 331 351 734
Authorised capital expenditure not
yet contracted 6,539 6,712 7,145
Fixed-line 4,873 4,478 4,938
Mobile 1,666 2,234 2,207
Management expects these commitments to be financed from internally
generated cash and other borrowings.
Contingencies
Supplier dispute – Telcordia
No material changes since prior year.
Competition commission
No material changes since prior year.
Interception of Communications and Provisions of Co mmunication-
related Information Act ('the Act')
The Act was assented and published on January 22, 2 003, but will only
become effective at a future date which is currentl y uncertain. Due
to the fact that certain provisions of the Act are still being
finalised, a reliable estimate of capital and opera ting costs that
will potentially be incurred in order to comply wit h the provisions
of the Act cannot be estimated at this stage.
The Group exposure is 50% of the following items:
Service providers
The Vodacom Group has committed as part of its stra tegy to acquire
its customer bases from certain independent service providers. Should
all conditions be met, the Group's commitments in t his regard are
estimated at R1.2 billion.
Other
An offer to purchase a 51% stake in Cointel VAS (Pr oprietary) Limited
for R112 million was made by the Vodacom Group duri ng the year. The
Group is currently awaiting Competion Commisssion a pproval.

2003 2004 2005
Rm Rm Rm
Segment information
The inter-company transactions are
reflected as net and are thus
eliminated against segment results:
Business Segment
Consolidated operating revenue 37,322 40,484 43,117
Fixed line 29,542 30,906 31,414
To external customers 29,106 30,443 30,844
Intercompany 436 463 570
Mobile 9,705 11,428 13,657
To external customers 8,216 10,041 12,273
Intercompany 1,489 1,387 1,384
Elimination (1,925) (1,850) (1,954)
Consolidated operating profit 6,680 9,245 11,222
Fixed line 4,516 6,626 7,979
Elimination 1,053 924 807
Mobile 2,164 2,619 3,243
Elimination (1,053) (924) (807)
Consolidated finance charges 4,201 3,264 1,695
Fixed line 3,758 2,991 1,647
Mobile 485 284 48
Elimination (42) (11) –
Profit for the year 1,628 4,523 6,724
Fixed line 823 4,054 6,493
Elimination 711 (137) (893)
Mobile 1,105 1,519 1,931
Elimination (1,011) (913) (807)
Related parties
Related party relationships exist within the Group. During the year
all transactions were concluded at arm's length.
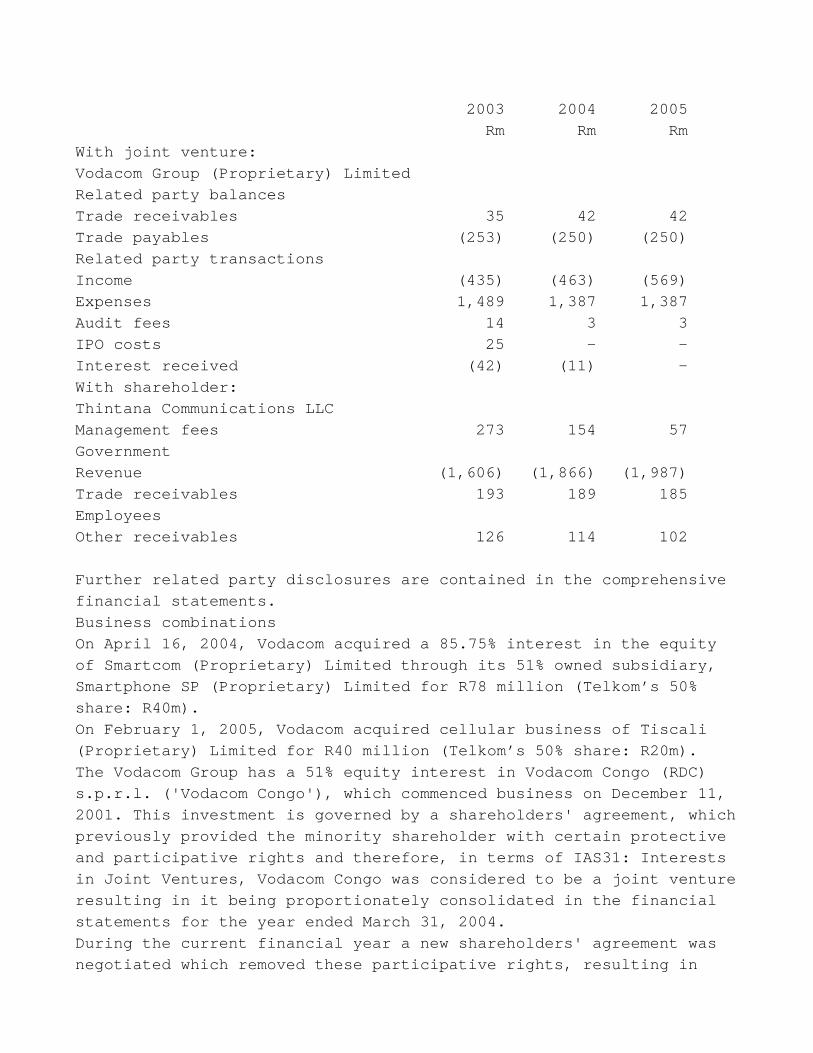
2003 2004 2005
Rm Rm Rm
With joint venture:
Vodacom Group (Proprietary) Limited
Related party balances
Trade receivables 35 42 42
Trade payables (253) (250) (250)
Related party transactions
Income (435) (463) (569)
Expenses 1,489 1,387 1,387
Audit fees 14 3 3
IPO costs 25 – –
Interest received (42) (11) –
With shareholder:
Thintana Communications LLC
Management fees 273 154 57
Government
Revenue (1,606) (1,866) (1,987)
Trade receivables 193 189 185
Employees
Other receivables 126 114 102
Further related party disclosures are contained in the comprehensive
financial statements.
Business combinations
On April 16, 2004, Vodacom acquired a 85.75% intere st in the equity
of Smartcom (Proprietary) Limited through its 51% o wned subsidiary,
Smartphone SP (Proprietary) Limited for R78 million (Telkom’s 50%
share: R40m).
On February 1, 2005, Vodacom acquired cellular busi ness of Tiscali
(Proprietary) Limited for R40 million (Telkom’s 50% share: R20m).
The Vodacom Group has a 51% equity interest in Voda com Congo (RDC)
s.p.r.l. ('Vodacom Congo'), which commenced busines s on December 11,
2001. This investment is governed by a shareholders ' agreement, which
previously provided the minority shareholder with c ertain protective
and participative rights and therefore, in terms of IAS31: Interests
in Joint Ventures, Vodacom Congo was considered to be a joint venture
resulting in it being proportionately consolidated in the financial
statements for the year ended March 31, 2004.
During the current financial year a new shareholder s' agreement was
negotiated which removed these participative rights , resulting in

Vodacom Congo now being controlled and considered t o be a 51% owned
subsidiary of Vodacom from April 1, 2004. Vodacom's interest in the
company is consolidated from this date in accordanc e with IAS27:
Consolidated and Separate Financial Statements.
Negative working capital
For the financial years ended March 31, 2005, 2004 and 2003 the
Group’s current liabilities are greater than curren t assets. Current
liabilities will be financed from operating cash fl ows, new
borrowings and existing credit facilities.
Subsequent events
Other than as disclosed elsewhere in this report th e directors are
not aware of any other matter or circumstance since the financial
year end and the date of this report, not otherwise dealt with in the
financial statements, which significantly affects t he financial
position of the Group and the results of its operat ions.
Special note regarding forward-looking statements
All statements contained herein, as well as oral st atements that may
be made by us or by officers, directors or employee s acting on behalf
of the Telkom Group, that are not statements of his torical fact
constitute “forward-looking statements“ within the meaning of the US
Private Securities Litigation Reform Act of 1995, s pecifically
Section 27A of the US Securities Act of 1933, as am ended, and Section
21E of the U.S. Securities Exchange Act of 1934, as amended. Such
forward-looking statements involve known and unknow n risks,
uncertainties and other factors that could cause ou r actual results
to be materially different from historical results or from any future
results expressed or implied by such forward-lookin g statements.
Among the factors that could cause our actual resul ts or outcomes to
differ materially from our expectations are those r isks identified
under the caption “Risk Factors“ contained in item 3 of Telkom’s most
recent annual report on Form 20-F filed with the U. S. Securities
Exchange Commission (SEC) and our other filings wit h the SEC,
available on Telkom’s website at www.telkom.co.za/i r. You should not
place undue reliance on these forward-looking state ments. All written
and oral forward-looking statements, attributable t o us, or persons
acting on our behalf, are qualified in their entire ty by these
cautionary statements. Moreover, unless we are requ ired by law to
update these statements, we will not necessarily up date any of these
statements after the date hereof either to conform them to actual
results or to changes in our expectations.
www.telkom.co.za