Embed Size (px)
Citation preview
1
CO-VIVA SOUTH AFRICA
Grade 8
Natural Science
Term 1
Resource booklet
Important notice: Formal school-based assessment (SBA)
Investigative or practical task 1
Term test 1
Date will be communicated in class and placed on the
school’s website or via WhatsApp
Date will be communicated in class and placed on the
school’s website or via WhatsApp
Mark: 20 Marks Mark: 60 Marks Work that needs to be
studied will be communicated
Work that needs to be studied will be communicated
2
Day 1 Scientific Method:
Let us read!
Scientific Method
When doing an experiment, you have to follow certain steps. These steps are known as the
scientific method. If a scientist does not follow these steps when doing an investigation, his results
will not be valid.
How do you make an experiment more reliable and improve validity? By repeating the experiment,
having more control groups, more randomization and improving measurement techniques.
You are expected to follow these steps:
• In the correct order
• Understand the reasoning behind each step.
• Follow the steps in both your planning and execution of the investigation.
Steps are as follow:
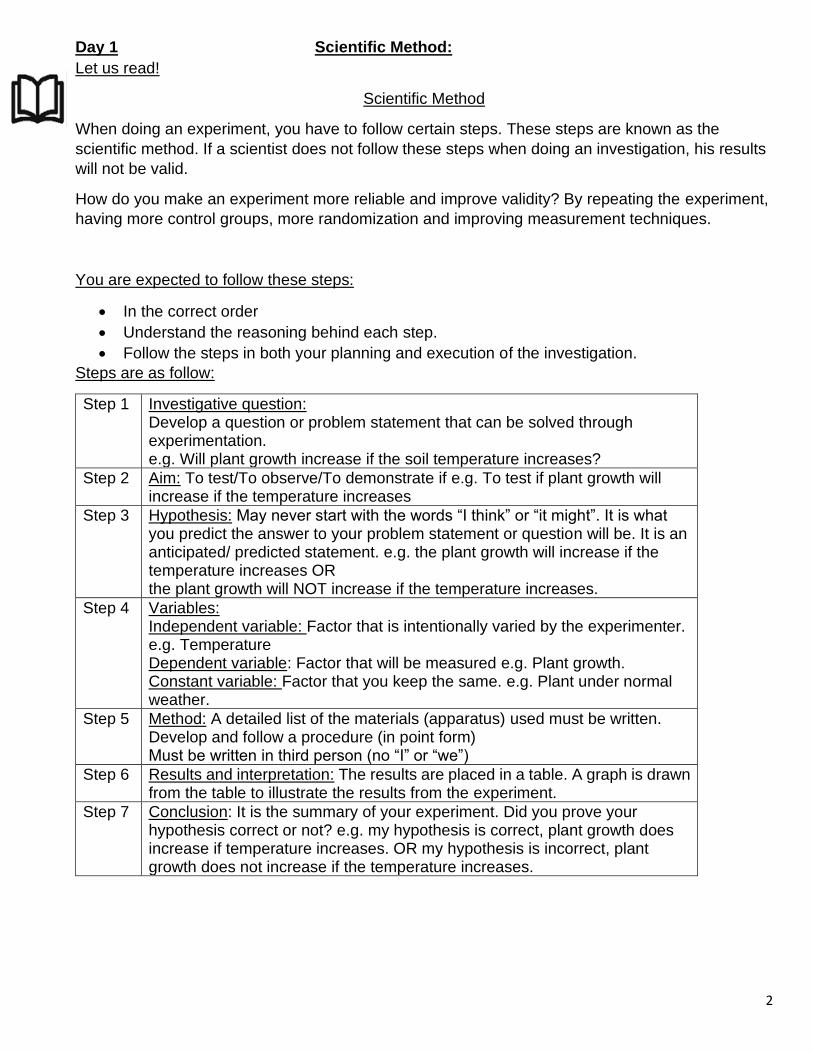
Step 1 Investigative question: Develop a question or problem statement that can be solved through experimentation. e.g. Will plant growth increase if the soil temperature increases?
Step 2 Aim: To test/To observe/To demonstrate if e.g. To test if plant growth will increase if the temperature increases
Step 3 Hypothesis: May never start with the words “I think” or “it might”. It is what you predict the answer to your problem statement or question will be. It is an anticipated/ predicted statement. e.g. the plant growth will increase if the temperature increases OR the plant growth will NOT increase if the temperature increases.
Step 4 Variables: Independent variable: Factor that is intentionally varied by the experimenter. e.g. Temperature Dependent variable: Factor that will be measured e.g. Plant growth. Constant variable: Factor that you keep the same. e.g. Plant under normal weather.
Step 5 Method: A detailed list of the materials (apparatus) used must be written. Develop and follow a procedure (in point form) Must be written in third person (no “I” or “we”)
Step 6 Results and interpretation: The results are placed in a table. A graph is drawn from the table to illustrate the results from the experiment.
Step 7 Conclusion: It is the summary of your experiment. Did you prove your hypothesis correct or not? e.g. my hypothesis is correct, plant growth does increase if temperature increases. OR my hypothesis is incorrect, plant growth does not increase if the temperature increases.
3
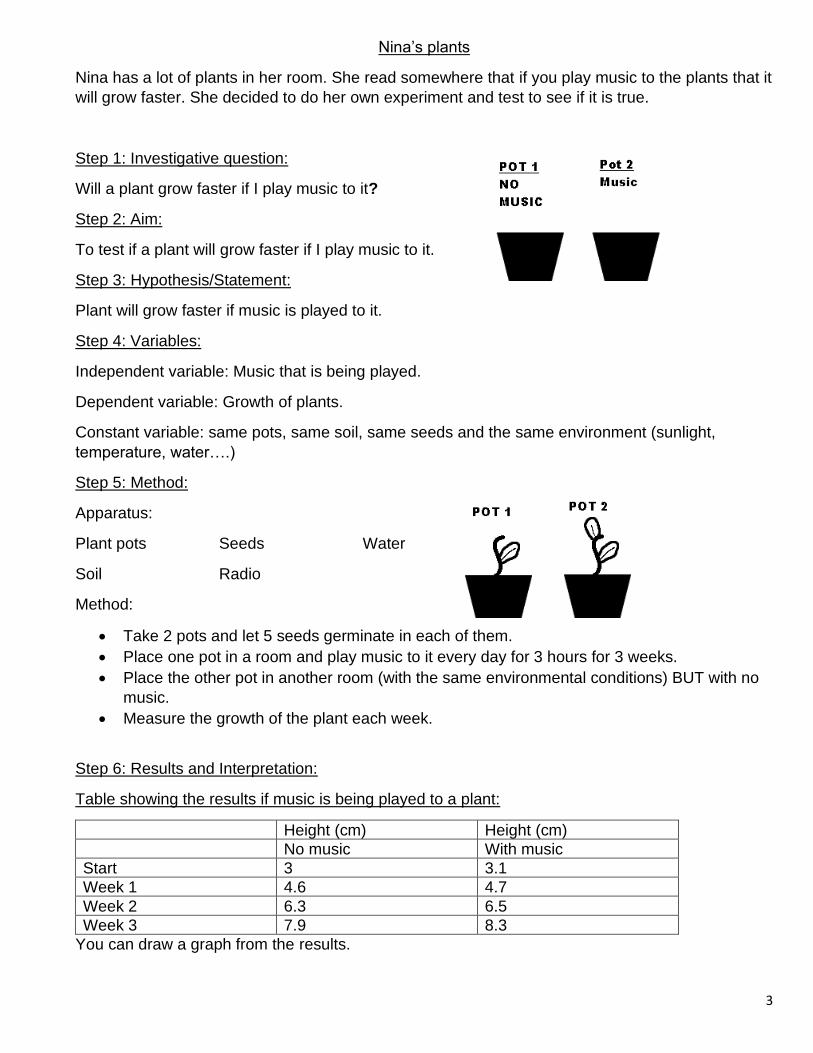
Nina’s plants
Nina has a lot of plants in her room. She read somewhere that if you play music to the plants that it
will grow faster. She decided to do her own experiment and test to see if it is true.
Step 1: Investigative question:
Will a plant grow faster if I play music to it?
Step 2: Aim:
To test if a plant will grow faster if I play music to it.
Step 3: Hypothesis/Statement:
Plant will grow faster if music is played to it.
Step 4: Variables:
Independent variable: Music that is being played.
Dependent variable: Growth of plants.
Constant variable: same pots, same soil, same seeds and the same environment (sunlight,
temperature, water….)
Step 5: Method:
Apparatus:
Plant pots Seeds Water
Soil Radio
Method:
• Take 2 pots and let 5 seeds germinate in each of them.
• Place one pot in a room and play music to it every day for 3 hours for 3 weeks.
• Place the other pot in another room (with the same environmental conditions) BUT with no
music.
• Measure the growth of the plant each week.
Step 6: Results and Interpretation:
Table showing the results if music is being played to a plant:
Height (cm) Height (cm)
No music With music
Start 3 3.1
Week 1 4.6 4.7
Week 2 6.3 6.5
Week 3 7.9 8.3
You can draw a graph from the results.
4
Step 7: Conclusion:
Hypothesis is correct. The plant that was played music to is 0,4cm higher in growth, therefore
music lets plants grow faster.
Let us sum it up!
• You use the Scientific Method when doing an experiment or investigation. All Scientists
follow these steps all over the world.
• The steps of the Scientific Method must be followed in a specific order.
• The results are usually in a table form which you can draw a graph from.
Tips from the teacher:
Remember to state whether your hypothesis is correct/incorrect at your conclusion when rewriting
your statement.
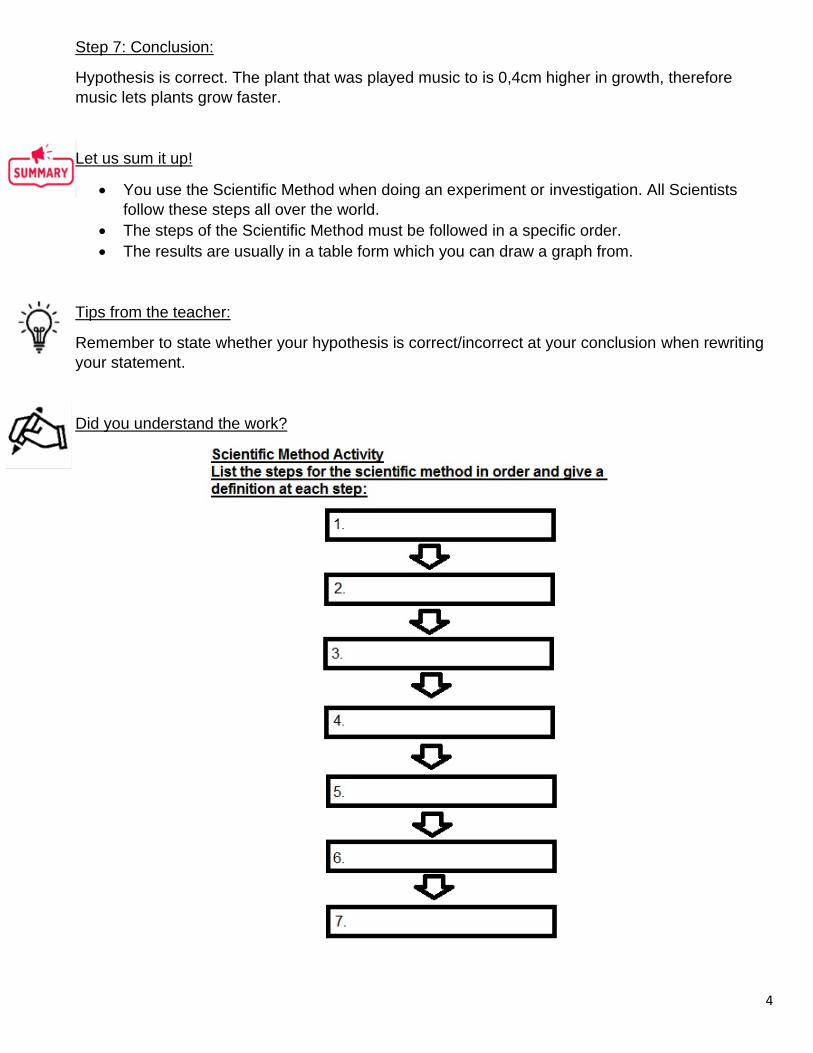
Did you understand the work?
5
Let us mark!
Marking will be done when you are at school. At a later stage a memo booklet will be available.
How do you feel about the work?
It is in your best interest to please go through the work if you do not understand it.
Well done!
Day 2 Graphs:
Let us learn Terminology!
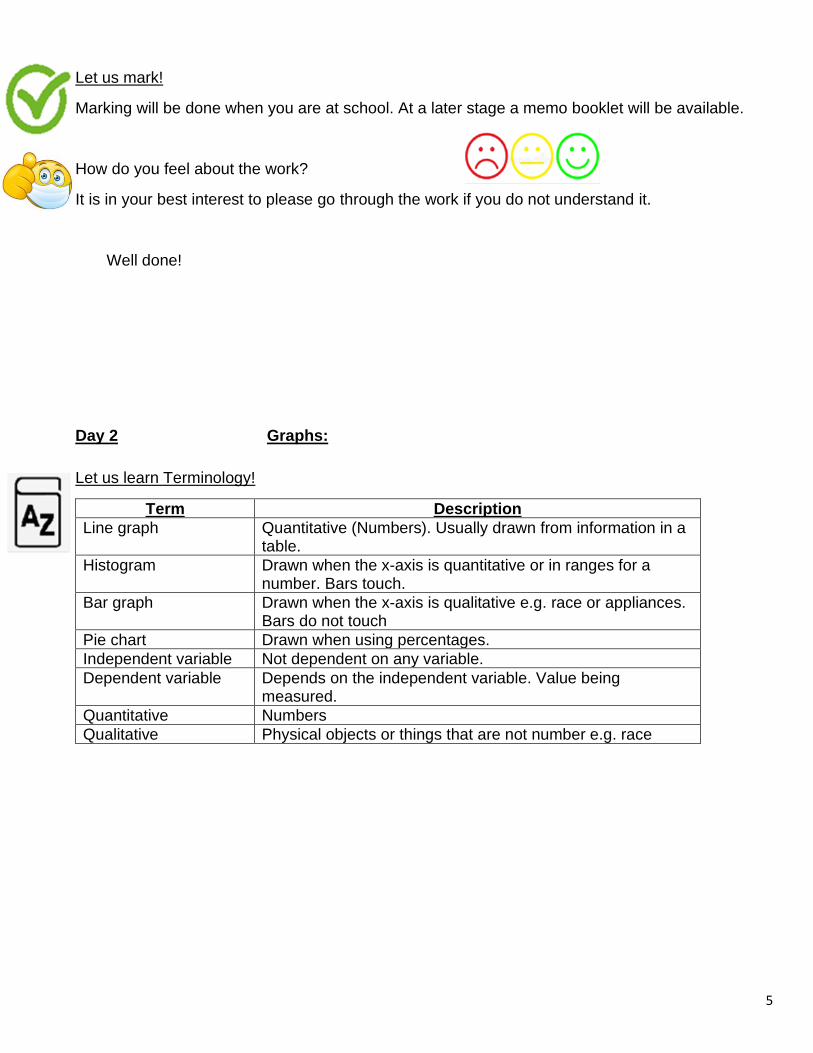
Term Description
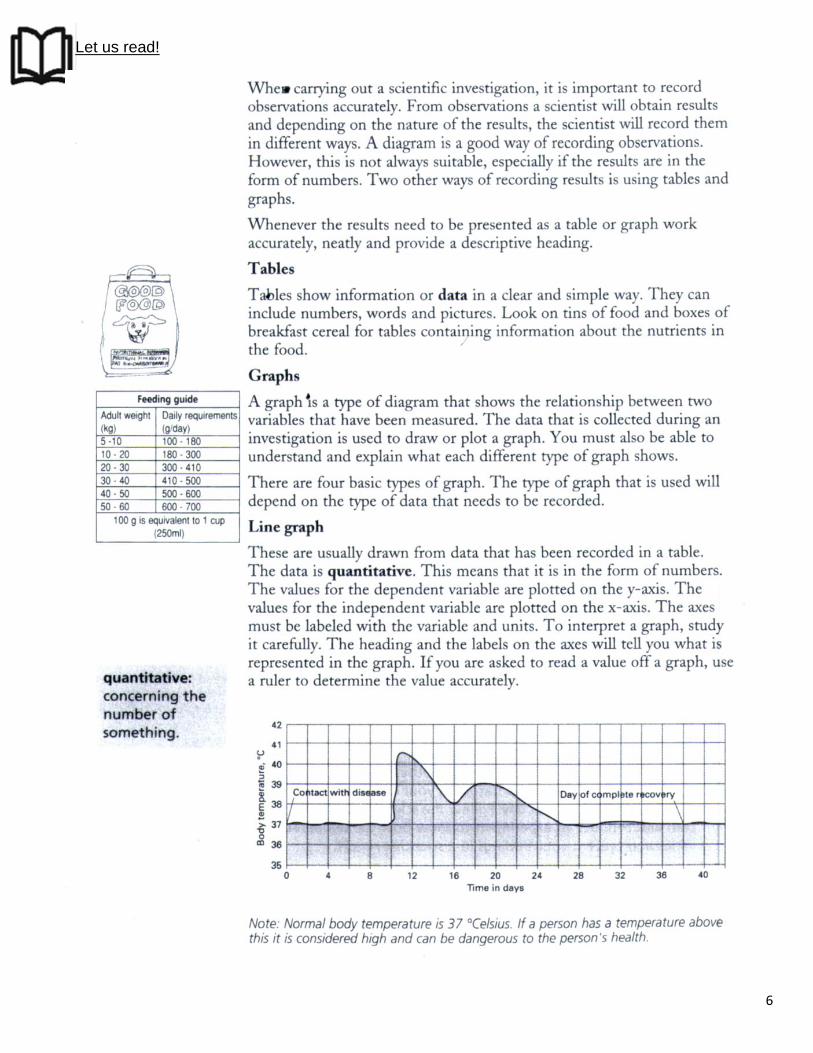
Line graph Quantitative (Numbers). Usually drawn from information in a table.
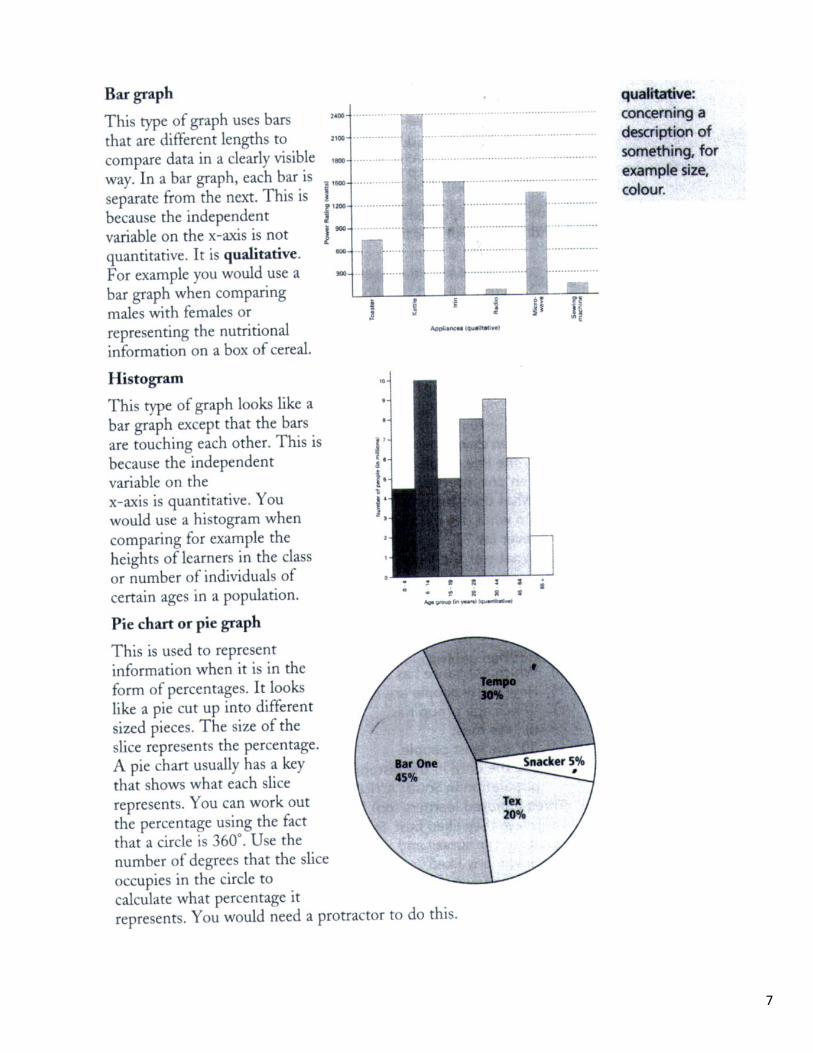
Histogram Drawn when the x-axis is quantitative or in ranges for a number. Bars touch.
Bar graph Drawn when the x-axis is qualitative e.g. race or appliances. Bars do not touch
Pie chart Drawn when using percentages.
Independent variable Not dependent on any variable.
Dependent variable Depends on the independent variable. Value being measured.
Quantitative Numbers
Qualitative Physical objects or things that are not number e.g. race
6
Let us read!
7
8
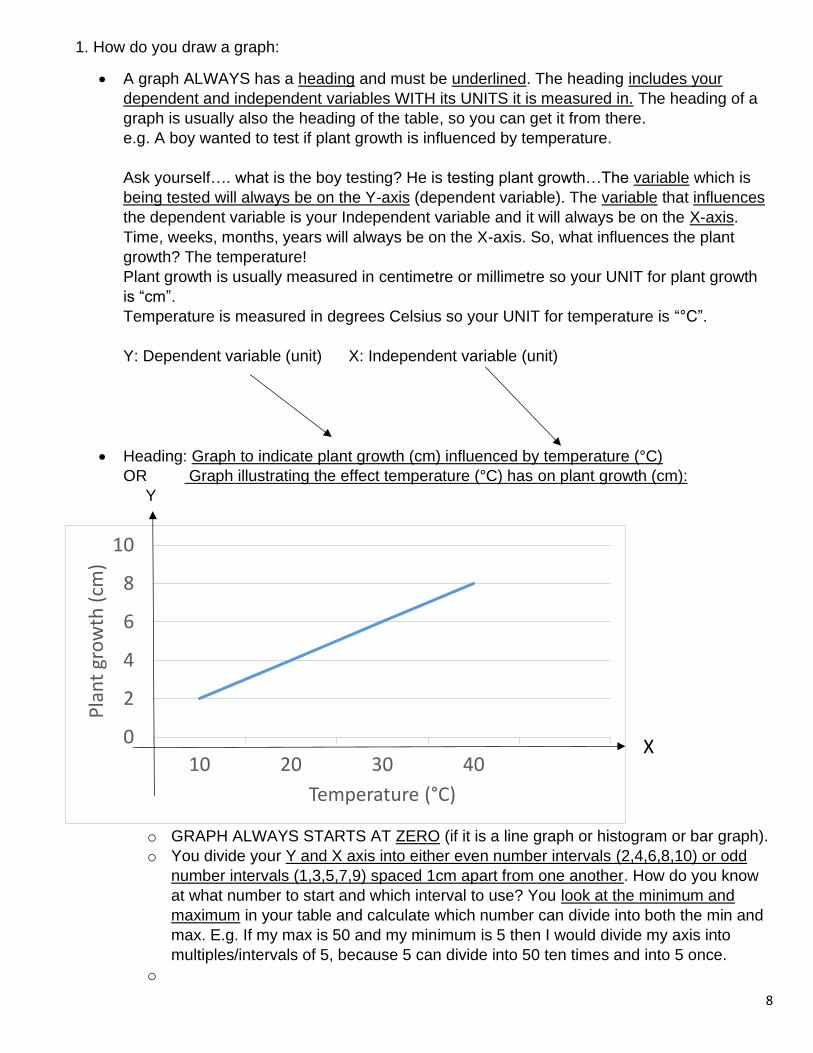
1. How do you draw a graph:
• A graph ALWAYS has a heading and must be underlined. The heading includes your
dependent and independent variables WITH its UNITS it is measured in. The heading of a
graph is usually also the heading of the table, so you can get it from there.
e.g. A boy wanted to test if plant growth is influenced by temperature.
Ask yourself…. what is the boy testing? He is testing plant growth…The variable which is
being tested will always be on the Y-axis (dependent variable). The variable that influences
the dependent variable is your Independent variable and it will always be on the X-axis.
Time, weeks, months, years will always be on the X-axis. So, what influences the plant
growth? The temperature!
Plant growth is usually measured in centimetre or millimetre so your UNIT for plant growth
is “cm”.
Temperature is measured in degrees Celsius so your UNIT for temperature is “°C”.
Y: Dependent variable (unit) X: Independent variable (unit)
• Heading: Graph to indicate plant growth (cm) influenced by temperature (°C)
OR Graph illustrating the effect temperature (°C) has on plant growth (cm):
Y
o GRAPH ALWAYS STARTS AT ZERO (if it is a line graph or histogram or bar graph).
o You divide your Y and X axis into either even number intervals (2,4,6,8,10) or odd
number intervals (1,3,5,7,9) spaced 1cm apart from one another. How do you know
at what number to start and which interval to use? You look at the minimum and
maximum in your table and calculate which number can divide into both the min and
max. E.g. If my max is 50 and my minimum is 5 then I would divide my axis into
multiples/intervals of 5, because 5 can divide into 50 ten times and into 5 once.
o
0
2
4
6
8
10
10 20 30 40
Pla
nt
gro
wth
(cm
)
Temperature (°C)
X
9
o Note: You use a line graph if you work with numbers (quantitively) and usually the
information given is in the form of a table.
o You use a histogram when you are comparing numbers and if the numbers are in
ranges.
o You use a bar graph when you are comparing variables and your independent
variable (X-axis) is something that is not in the form of numbers (qualitative).
o You use a pie-chart when working with percentages.
Y-axis: Dependent Variable: Can be manipulated. IT IS WHAT YOU MEASURE IN AN
EXPERIMENT. Depends on the Independent *variable.
X-axis: Independent Variable: Have control over. Can’t easily be manipulated e.g.
time/months/years
Variable: A value that can be changed.
Let us sum it up!
• A graph must always have a heading.
• Your horizontal axis on your graph is your X-axis and must be labelled with a measuring
unit. It will always be your independent variable.
• Your vertical axis on your graph is your Y-axis and must be labelled with a measuring unit. It
will always be your dependent variable.
• Your graph starts at zero.
• Divide your axes in to single OR odd OR equal intervals.
• Use 1 cm for each interval.
Tips from the teacher:
1. Remember which variable is which axis.
Did you understand the work?
Please do all 4 graph activities between Day 3 and Day 4.
10
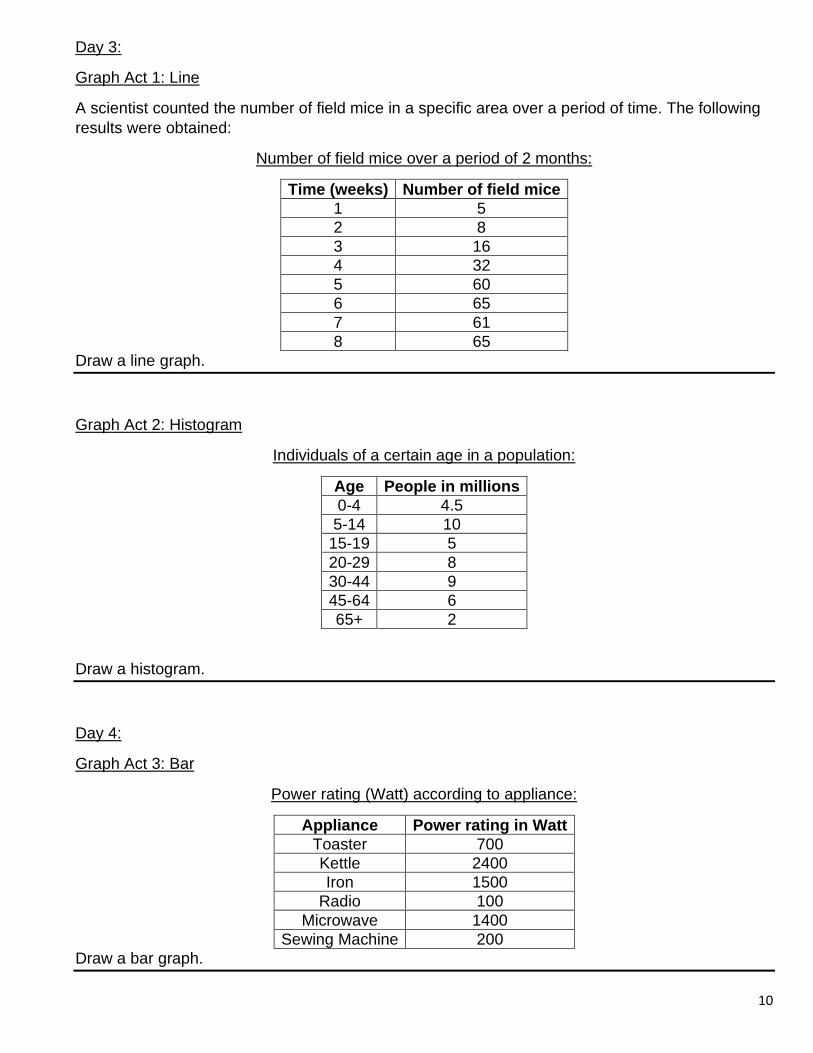
Day 3:
Graph Act 1: Line
A scientist counted the number of field mice in a specific area over a period of time. The following
results were obtained:
Number of field mice over a period of 2 months:
Time (weeks) Number of field mice
1 5
2 8
3 16
4 32
5 60
6 65
7 61
8 65
Draw a line graph.
Graph Act 2: Histogram
Individuals of a certain age in a population:
Age People in millions
0-4 4.5
5-14 10
15-19 5
20-29 8
30-44 9
45-64 6
65+ 2
Draw a histogram.
Day 4:
Graph Act 3: Bar
Power rating (Watt) according to appliance:
Appliance Power rating in Watt
Toaster 700
Kettle 2400
Iron 1500
Radio 100
Microwave 1400
Sewing Machine 200
Draw a bar graph.
11
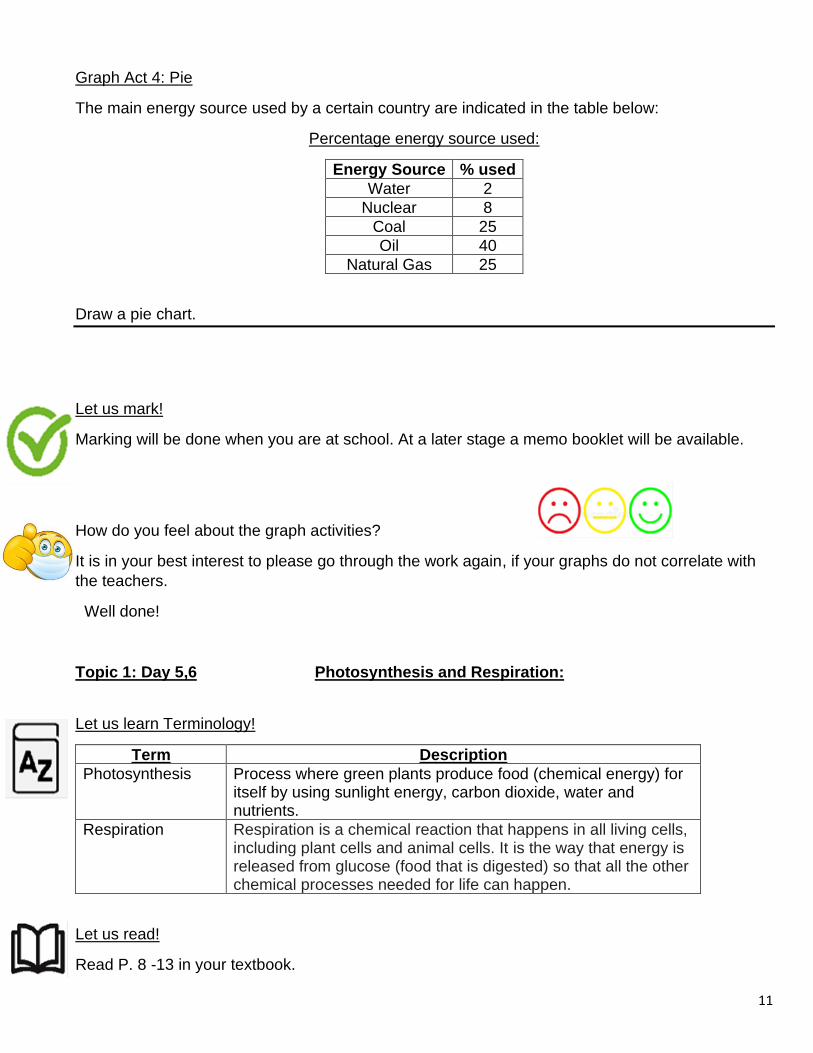
Graph Act 4: Pie
The main energy source used by a certain country are indicated in the table below:
Percentage energy source used:
Energy Source % used
Water 2
Nuclear 8
Coal 25
Oil 40
Natural Gas 25
Draw a pie chart.
Let us mark!
Marking will be done when you are at school. At a later stage a memo booklet will be available.
How do you feel about the graph activities?
It is in your best interest to please go through the work again, if your graphs do not correlate with
the teachers.
Well done!
Topic 1: Day 5,6 Photosynthesis and Respiration:
Let us learn Terminology!
Term Description
Photosynthesis Process where green plants produce food (chemical energy) for itself by using sunlight energy, carbon dioxide, water and nutrients.
Respiration Respiration is a chemical reaction that happens in all living cells, including plant cells and animal cells. It is the way that energy is released from glucose (food that is digested) so that all the other chemical processes needed for life can happen.
Let us read!
Read P. 8 -13 in your textbook.
12
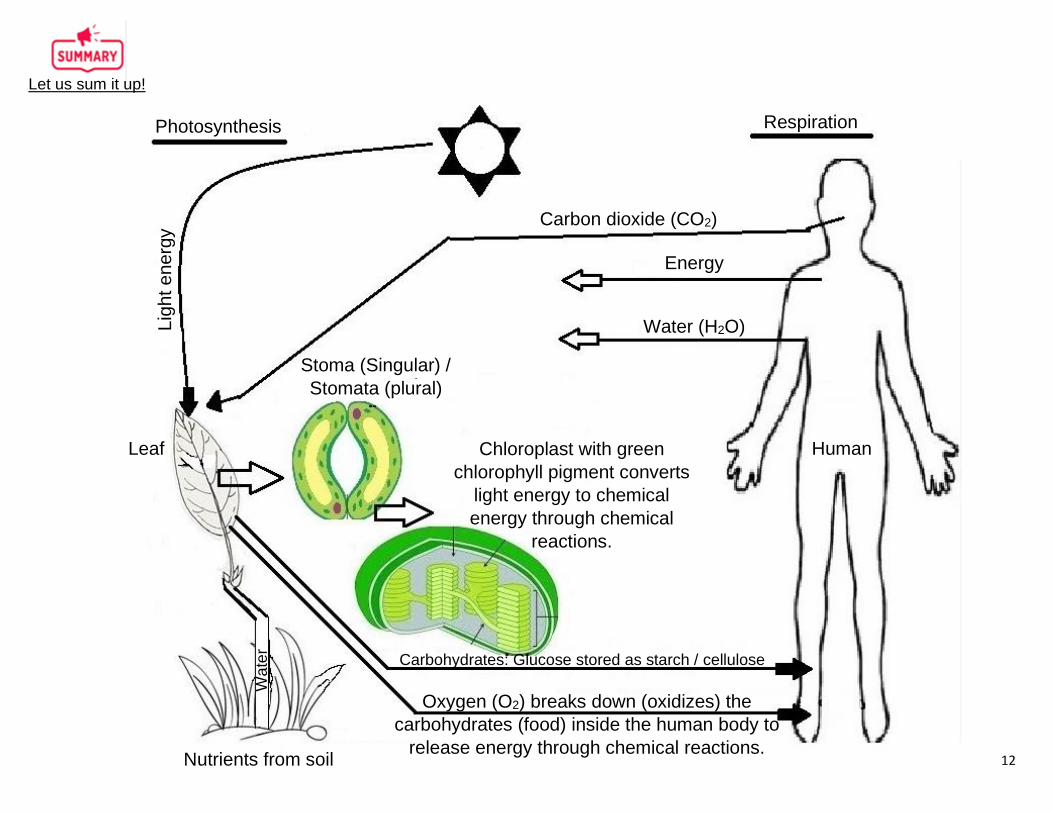
Let us sum it up!
Photosynthesis Respiration
Lig
ht e
ne
rgy
Leaf
Carbon dioxide (CO2)
Energy
Water (H2O)
Stoma (Singular) /
Stomata (plural)
Chloroplast with green
chlorophyll pigment converts
light energy to chemical
energy through chemical
reactions.
Human
Carbohydrates: Glucose stored as starch / cellulose
Oxygen (O2) breaks down (oxidizes) the
carbohydrates (food) inside the human body to
release energy through chemical reactions. Nutrients from soil
Wa
ter
13
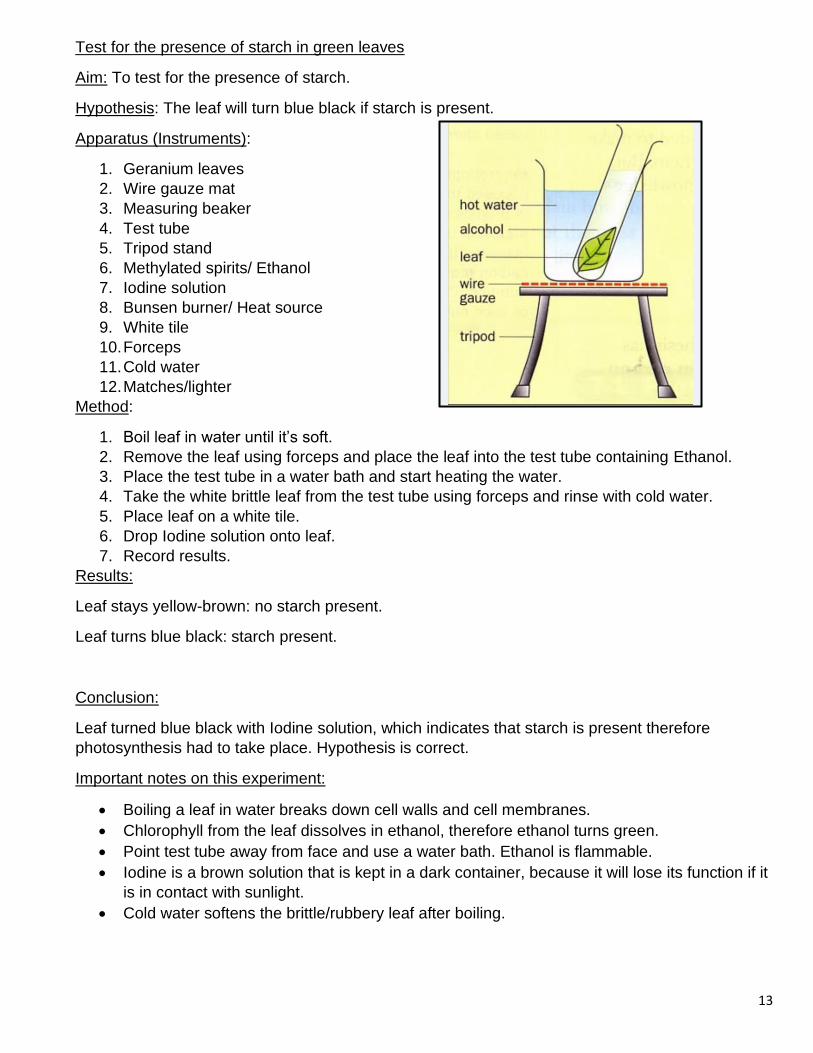
Test for the presence of starch in green leaves
Aim: To test for the presence of starch.
Hypothesis: The leaf will turn blue black if starch is present.
Apparatus (Instruments):
1. Geranium leaves
2. Wire gauze mat
3. Measuring beaker
4. Test tube
5. Tripod stand
6. Methylated spirits/ Ethanol
7. Iodine solution
8. Bunsen burner/ Heat source
9. White tile
10. Forceps
11. Cold water
12. Matches/lighter
Method:
1. Boil leaf in water until it’s soft.
2. Remove the leaf using forceps and place the leaf into the test tube containing Ethanol.
3. Place the test tube in a water bath and start heating the water.
4. Take the white brittle leaf from the test tube using forceps and rinse with cold water.
5. Place leaf on a white tile.
6. Drop Iodine solution onto leaf.
7. Record results.
Results:
Leaf stays yellow-brown: no starch present.
Leaf turns blue black: starch present.
Conclusion:
Leaf turned blue black with Iodine solution, which indicates that starch is present therefore
photosynthesis had to take place. Hypothesis is correct.
Important notes on this experiment:
• Boiling a leaf in water breaks down cell walls and cell membranes.
• Chlorophyll from the leaf dissolves in ethanol, therefore ethanol turns green.
• Point test tube away from face and use a water bath. Ethanol is flammable.
• Iodine is a brown solution that is kept in a dark container, because it will lose its function if it
is in contact with sunlight.
• Cold water softens the brittle/rubbery leaf after boiling.
14
Topic 1: Day 7: Test for Cellular Respiration:
Aim: To test if carbon dioxide is a by-product of cellular respiration.
Hypothesis: Clear limewater will turn milky in the presence of Carbon dioxide
Apparatus:
1. Clear limewater (Calcium Hydroxide)
2. Test tube
3. Straw
Method:
1. Pour clear limewater in test tube and breathe out into straw.
Result:
Clear limewater turned milky when exhaled air is bubbled through clear limewater.
Conclusion:
Clear limewater turned milky when exhaled air containing Carbon dioxide was bubbled through
clear limewater, which indicates that cellular respiration is taking place in the body. Hypothesis is
correct.
Word and Chemical Equations for Photosynthesis and Respiration:
Photosynthesis:
Carbon dioxide +Water Sunlight (Radiant)energy and Chlorophyll⇒ Carbohydrates (Glucose) + Oxygen
6CO2 + 6H2O -------------sunlight energy--------→ C6H12O6 + 6O2
Cellular Respiration:
Carbohydrates (Glucose) + Oxygen ⇒ Carbon dioxide +Water + Energy
C6H12O6 + 6O2 → 6CO2 + 6H2O + Energy
Tips from the teacher:
1. The equation for Photosynthesis and Respiration are opposites of one another with minor
changes, therefore for example if you know Photosynthesis’ equation it can be used to write
Respiration’s equation and vice versa.
15
Did you understand the work?
Do Exercise 1 P. 10 in your workbook under the heading “Ex.1 P.10”.
Do Exercise 2 P.13 in your workbook under the heading “Ex.2 P.13”. At nr.1 you have to plan an
experimental design using the Scientific Method based on P.10 “Test for starch” layout.
Let us mark!
Marking will be done when you are at school. At a later stage a memo booklet will be available.
What was your score out of 9 for Ex1 and 8 for Ex2? How do you feel about it?
If you didn't achieve at least 5/9 and 4/8, it is in your best interest to please go through the work
again.
Well done!
TOPIC 1: DAY 8 – UNPREPARED TEST: PHOTOSYNTHESIS AND RESPIRATION
If you are at home, it takes SELF DISCIPLINE to not look for the answers in your textbook and to do the test by yourself. Please note unprepared tests do not count marks. The reason why you write it is to see what work you are struggling with or what work you need to focus on.
At the back of your book write “Unprepared test: Photosynthesis and Respiration” as your heading with the date and write the test.
Questions:
1. What does the word Photosynthesis mean? 2 2. Name the 4 components that are needed for Photosynthesis. 4 3. What sugar is produced during Photosynthesis? 1 4. As what is this sugar (mentioned in the previous question) stored? 1 5. What is the waste product of Photosynthesis? 1 6. Name the gas that is needed for Respiration? 1 7. Where do we get the gas that is needed for Respiration? 1 8. Does Respiration take place in all living organisms? 2 9. What gas is formed after Respiration took place? 1 10. Where is this gas, mentioned in the previous question, used? 1
Total: 15
16
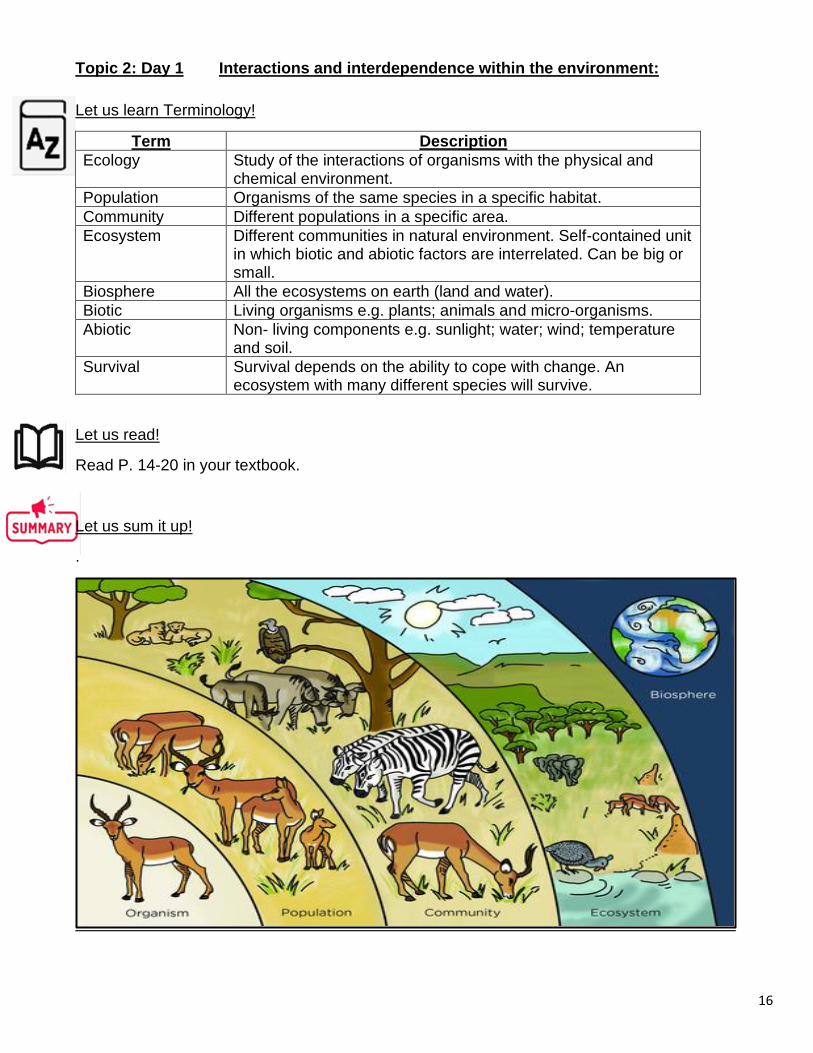
Topic 2: Day 1 Interactions and interdependence within the environment:
Let us learn Terminology!
Term Description
Ecology Study of the interactions of organisms with the physical and chemical environment.
Population Organisms of the same species in a specific habitat.
Community Different populations in a specific area.
Ecosystem Different communities in natural environment. Self-contained unit in which biotic and abiotic factors are interrelated. Can be big or small.
Biosphere All the ecosystems on earth (land and water).
Biotic Living organisms e.g. plants; animals and micro-organisms.
Abiotic Non- living components e.g. sunlight; water; wind; temperature and soil.
Survival Survival depends on the ability to cope with change. An ecosystem with many different species will survive.
Let us read!
Read P. 14-20 in your textbook.
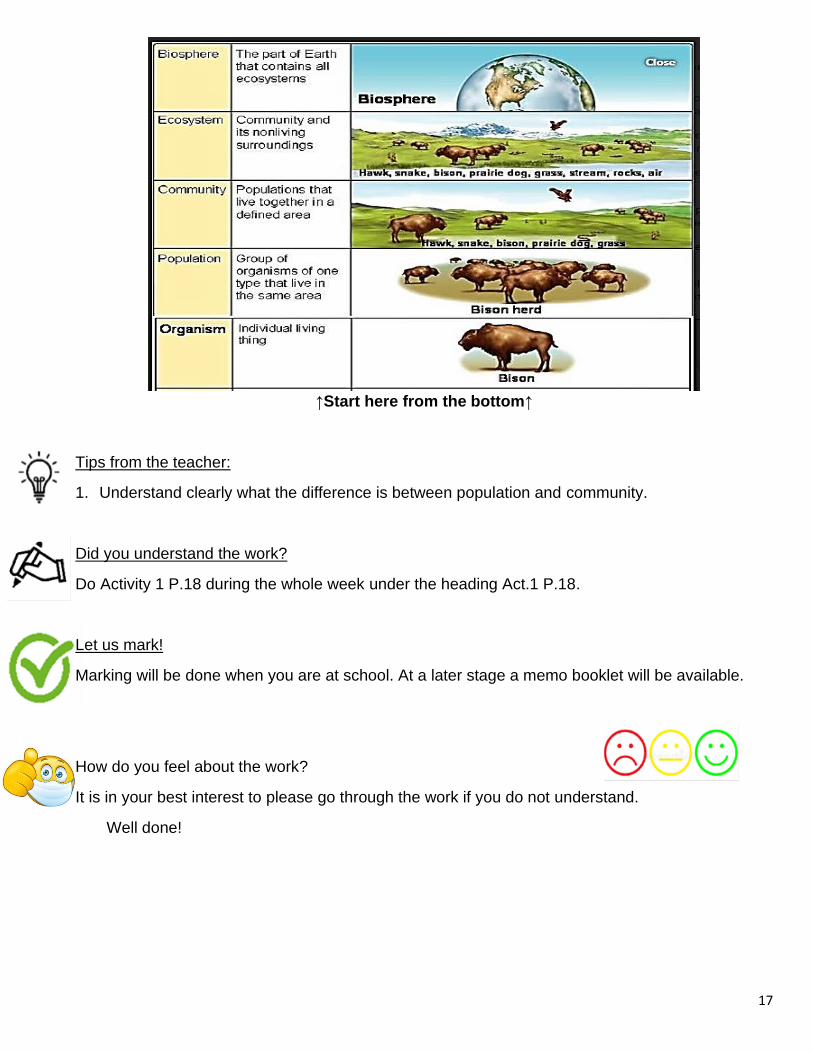
Let us sum it up!
.
17
↑Start here from the bottom↑
Tips from the teacher:
1. Understand clearly what the difference is between population and community.
Did you understand the work?
Do Activity 1 P.18 during the whole week under the heading Act.1 P.18.
Let us mark!
Marking will be done when you are at school. At a later stage a memo booklet will be available.
How do you feel about the work?
It is in your best interest to please go through the work if you do not understand.
Well done!
18
Topic 2: Day 2 Feeding relationships:
Let us learn Terminology!
Term Description
Producer Green plant producing its own food by changing light energy to chemical energy. Producer does not depend on another organism for food.
Consumer Organism that depends on another organism for food.
Feeder A person or animal that eats a particular food depending on its dentition (type of teeth and arrangement).
Decomposer Organism that break down dead or decaying organisms.
Let us read!
Read P.21-22 in your textbook.
Let us sum it up!
• Producer: Produce (make) food for animals e.g. plants and algae.
• Consumers: Consume (eat) food. 1) Primary Consumer
2) Secondary Consumer
3) Tertiary Consumer
• Feeders:
1) Herbivore (plant eater) e.g. cow (gets food directly)
2) Carnivore (flesh/meat eater) e.g. predators (hunt prey); scavengers (feed off dead);
insectivores feed off insects). Gets energy indirectly.
3) Omnivore (flesh and plant eater) e.g. humans and baboons
4) Decomposers (Recycle nutrients/break down dead material) e.g. micro-organisms like
earthworms, bacteria and fungi release it as heat (compost heap feels warm)
19
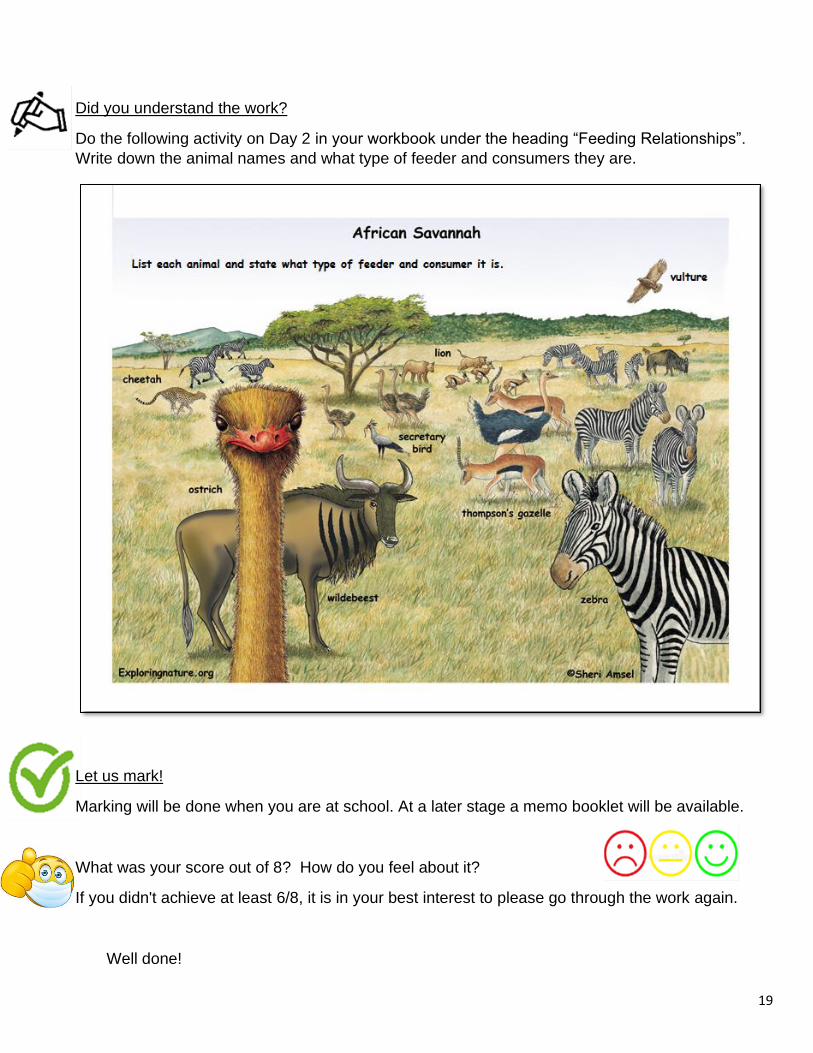
Did you understand the work?
Do the following activity on Day 2 in your workbook under the heading “Feeding Relationships”.
Write down the animal names and what type of feeder and consumers they are.
Let us mark!
Marking will be done when you are at school. At a later stage a memo booklet will be available.
What was your score out of 8? How do you feel about it?
If you didn't achieve at least 6/8, it is in your best interest to please go through the work again.
Well done!
20
Topic 2: Day 3 Food chains:
Let us learn Terminology!
Term Description
Food chain Energy is passed on from one organism to the next by feeding on a plant or animal.
Let us read!
Read P.23-24 in your textbook.
Let us sum it up!
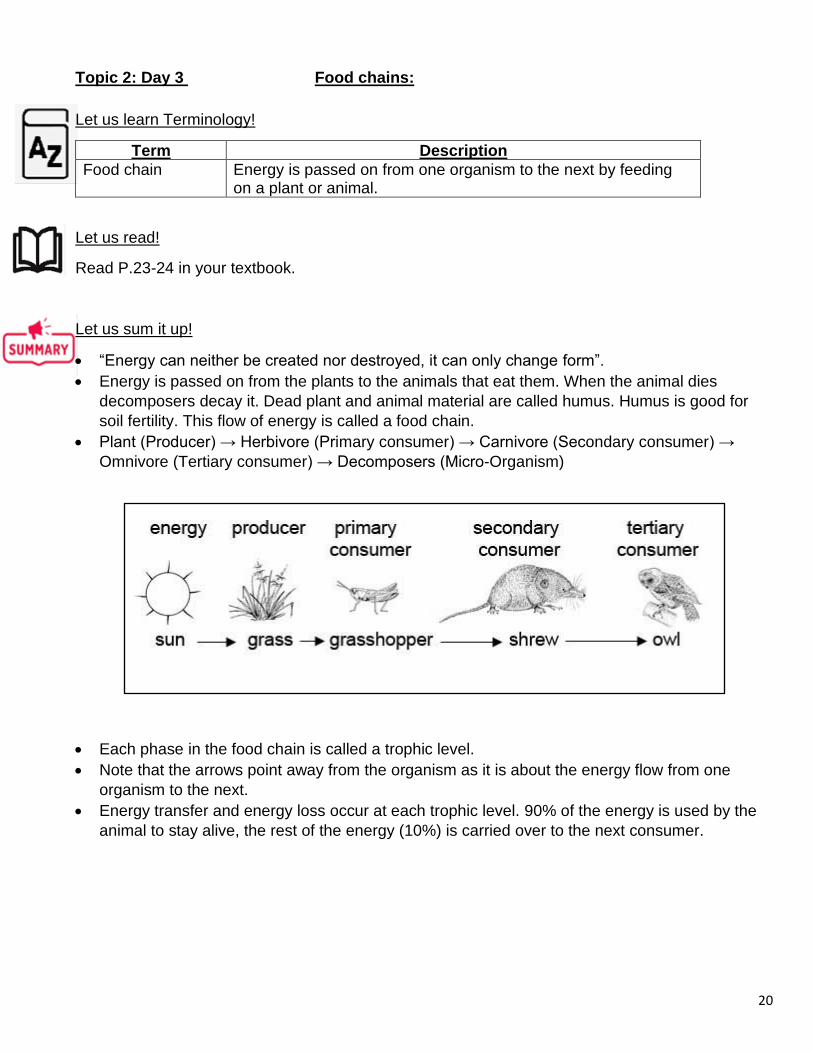
• “Energy can neither be created nor destroyed, it can only change form”.
• Energy is passed on from the plants to the animals that eat them. When the animal dies
decomposers decay it. Dead plant and animal material are called humus. Humus is good for
soil fertility. This flow of energy is called a food chain.
• Plant (Producer) → Herbivore (Primary consumer) → Carnivore (Secondary consumer) →
Omnivore (Tertiary consumer) → Decomposers (Micro-Organism)
• Each phase in the food chain is called a trophic level.
• Note that the arrows point away from the organism as it is about the energy flow from one
organism to the next.
• Energy transfer and energy loss occur at each trophic level. 90% of the energy is used by the
animal to stay alive, the rest of the energy (10%) is carried over to the next consumer.
21
Tips from the teacher:
1. Do not physically draw animals. When you “draw” a food chain or food web or energy pyramid
you only write down labels.
2. Remember that the arrows point away from organisms.
Topic 2: Day 4: Did you understand the work?
Under the heading “Food chains”, please draw 5 different food chains with different organisms
each time.
Let us mark!
Marking will be done when you are at school. At a later stage a memo booklet will be available.
What was your score out of 25? How do you feel about it?
If you didn't achieve at least 20/25, it is in your best interest to please go through the work again.
Well done!
22
Topic 2: Day 5 Food web:
Let us learn Terminology!
Term Description
Food web Many food chains that are interwoven.
Let us read!
Read P.26
Let us sum it up!
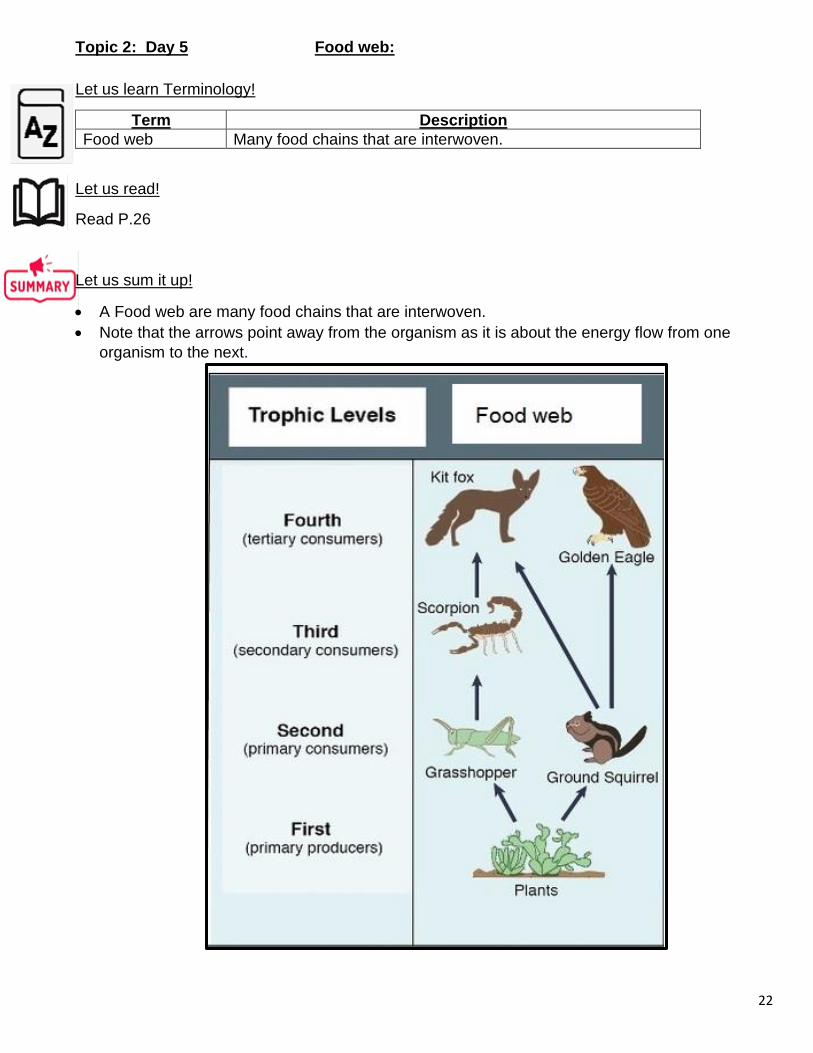
• A Food web are many food chains that are interwoven.
• Note that the arrows point away from the organism as it is about the energy flow from one
organism to the next.
23
Tips from the teacher:
1. Do not physically draw animals. When you “draw” a food chain or food web or energy pyramid
you only write down labels.
2. Remember that the arrows point away from organisms.
Did you understand the work?
Do Activity 3 P.27 based on your own garden in your workbook under heading P.27 Act.3. Make
sure you list at least 5 organisms.
Topic 2: Day 6: On Day 6 draw your own food web with at least 5 herbivores.
Let us mark!
Marking will be done when you are at school. At a later stage a memo booklet will be available.
What was your score out of 10 for Act.3? How do you feel about it?
If you didn't achieve at least 5/10, it is in your best interest to please go through the work again.
Well done!
24
Topic 2: Day 7 and 8 Energy Pyramid
Let us learn Terminology!
Term Description
Energy pyramid Representation to show the energy available for each trophic level.
Let us read!
Read P.24 in your textbook.
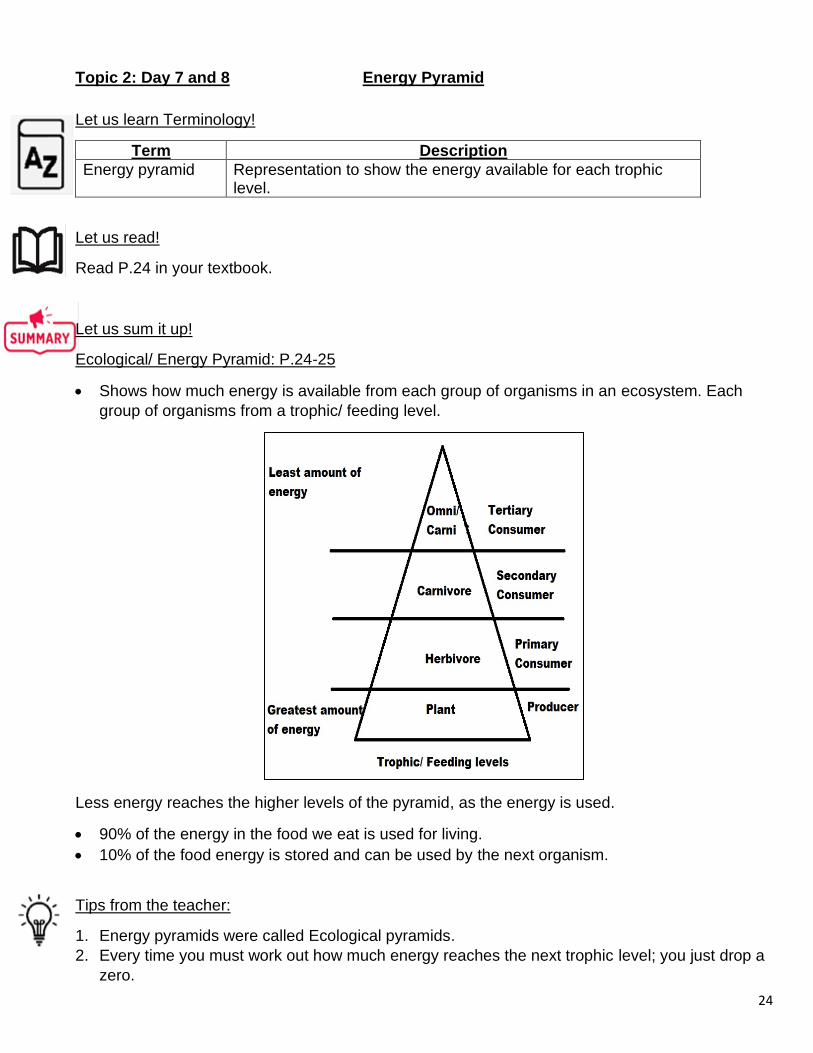
Let us sum it up!
Ecological/ Energy Pyramid: P.24-25
• Shows how much energy is available from each group of organisms in an ecosystem. Each
group of organisms from a trophic/ feeding level.
Less energy reaches the higher levels of the pyramid, as the energy is used.
• 90% of the energy in the food we eat is used for living.
• 10% of the food energy is stored and can be used by the next organism.
Tips from the teacher:
1. Energy pyramids were called Ecological pyramids.
2. Every time you must work out how much energy reaches the next trophic level; you just drop a
zero.
25
Did you understand the work?
Do Activity 2 P.25 in your workbook under the heading Act.2 P.25 on Topic 2 Day 8.
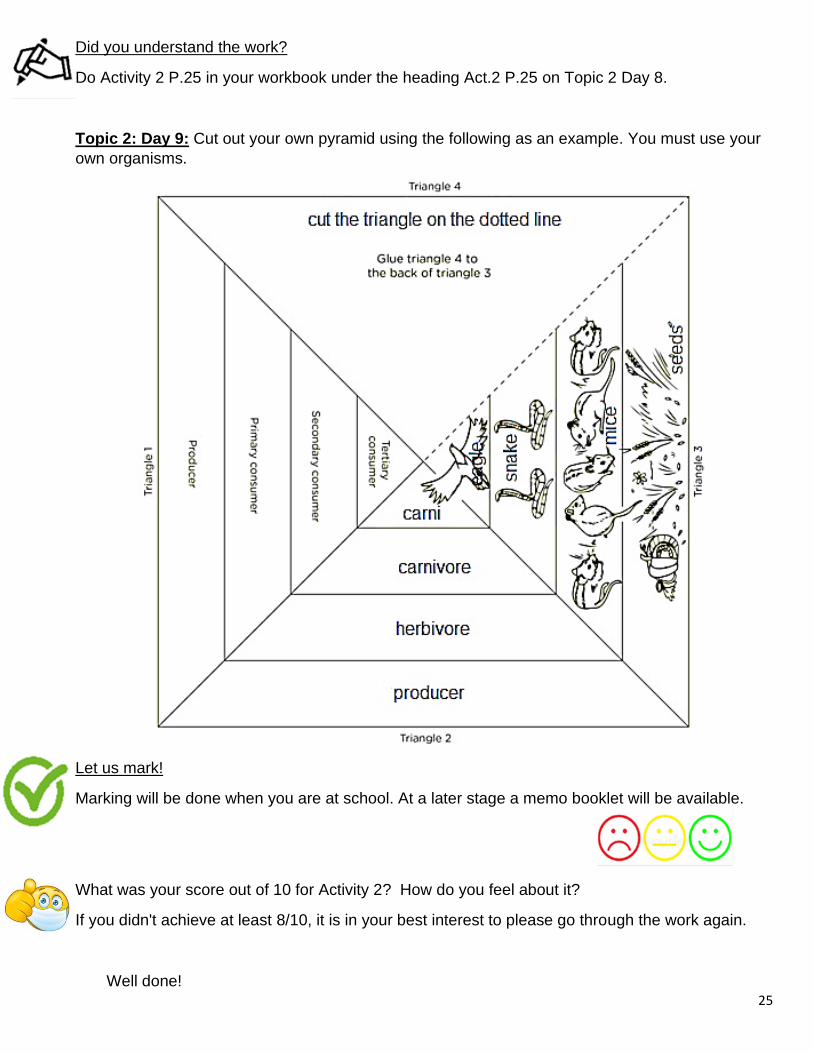
Topic 2: Day 9: Cut out your own pyramid using the following as an example. You must use your
own organisms.
Let us mark!
Marking will be done when you are at school. At a later stage a memo booklet will be available.
What was your score out of 10 for Activity 2? How do you feel about it?
If you didn't achieve at least 8/10, it is in your best interest to please go through the work again.
Well done!
26
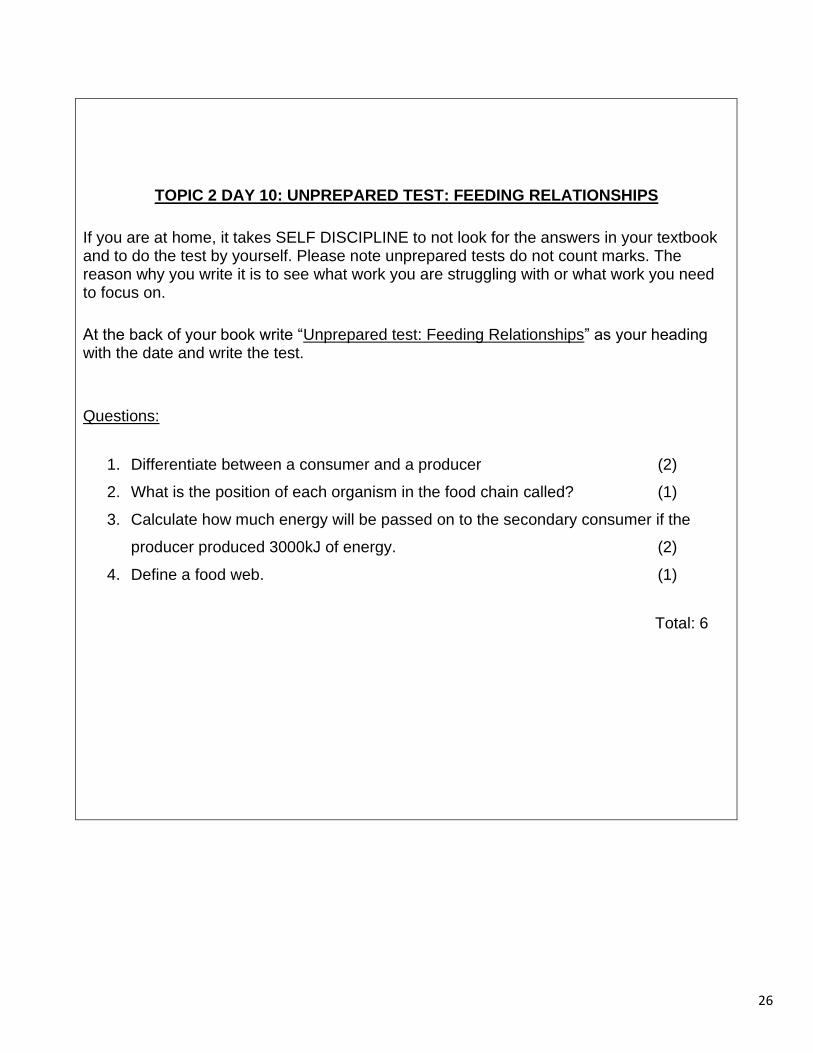
TOPIC 2 DAY 10: UNPREPARED TEST: FEEDING RELATIONSHIPS
If you are at home, it takes SELF DISCIPLINE to not look for the answers in your textbook and to do the test by yourself. Please note unprepared tests do not count marks. The reason why you write it is to see what work you are struggling with or what work you need to focus on.
At the back of your book write “Unprepared test: Feeding Relationships” as your heading with the date and write the test.
Questions:
1. Differentiate between a consumer and a producer (2)
2. What is the position of each organism in the food chain called? (1)
3. Calculate how much energy will be passed on to the secondary consumer if the
producer produced 3000kJ of energy. (2)
4. Define a food web. (1)
Total: 6
27
Topic 2: Day 11 Balance in an ecosystem and carrying capacity: Natural factors
Let us learn Terminology!
Term Description
Carrying capacity Maximum life an area of land can support because of the available resources.
Let us read!
Read P.27-28 in your textbook.
Let us sum it up!
• An ecosystem can only accommodate as many organisms as its resources= carrying capacity.
• If there are more organisms than resources, then there will be an imbalance in the ecosystem.
• Factors that influence the balance:
Sunlight (Photosynthesis)
Wind/Air (Pollinate/ Oxygen/ Carbon dioxide)
Minerals
o Metallic (gold/silver/iron/copper)
o Non- metallic (clay/sand/loam)
Water
Plants and animals
Fossil fuels (oil)
• Natural disruptive factors:
Droughts
Floods
Change in climate/weather/sudden temperature changes.
Did you understand the work?
On Day 11 summarize Natural disruptive factors in your workbook under the heading “Natural
Disruptive factors”.
How do you feel about it?
It is in your best interest to please go through the work again, if you do not understand it.
Well done!
28
Topic 2: Day 12, 13 Balance in an ecosystem and carrying capacity: Human factors
Let us learn Terminology!
Term Description
Pollution A foreign object/substance that leads to an imbalance in the environment
Habitat destruction Natural habitat becomes incapable of supporting life because of e.g. industries, farming, buildings.
Poaching Illegal hunting, capturing and killing of wild animals.
Let us read!
Read P.28,29,31 in your textbook.
Let us sum it up!
• Human disruptive factors:
Deforestation/ Habitat destruction: We take land away from other animals because we need
more land for mining, building factories and houses and farming to supply food for the
human population.
Poaching: Illegal removal of organisms from the environment e.g. rhino and elephant for its
horn/tusks, pangolins for its scales, tigers, gorillas, sea turtles.
Pollution = When we pollute the environment either by air, water or soil, the effects remains
harmful for all the living organisms and the environment. For example, when we pollute the
air, the heat from the sun gets trapped by air pollutant gas particles causing the earth to
heat up over a long period, this can cause global warming. That in turn causes day and
night temperatures to change, more droughts, floods and natural disasters occur, ice caps
melt which has a direct effect on polar bears, sea temperatures rise which has a direct
effect on corals.
If we pollute the soil by littering with plastic or cans it ends up in the ocean where sea
creatures eat it or get strangled by it and die.
Mines or humans illegally dump toxic substances in rivers, which kills river organisms and
eventually sea creatures.
• WHAT CAN WE DO?
REDUCE POLLUTION BY CONSERVING ENERGY AND NOT LITTERING, NOT DRIVING
CARS, REUSE PLASTICS, RECYCLE GLASS AND PLASTICS etc.
Did you understand the work?
On Day 12 summarize Human disruptive factors in your workbook under the heading “Human
disruptive factors”.
On Day 13 do Activity 4 P.30-31 under the heading “Act.4 P.30-31”.
29
Let us mark!
Marking will be done when you are at school. At a later stage a memo booklet will be available.
What was your score out of 14 for Act.4? How do you feel about it?
If you didn't achieve at least 10/14, it is in your best interest to please go through the work again.
Well done!
Topic 2: Day 14 and 15 Adaptations:
Let us learn Terminology!
Term Description
Adaptation Change in structure/ function/ behaviour of an organism to survive. If an organism can’t change to adapt to its environment it will die.
Xerophyte Plant that can grow in an area with low rainfall. Stores water e.g. succulent plants.
Mesophyte Plant that grows in an area with normal rainfall e.g. garden plants.
Hydrophyte Plant that grows in or near water. Air filled chambers to float.e.g. water lily.
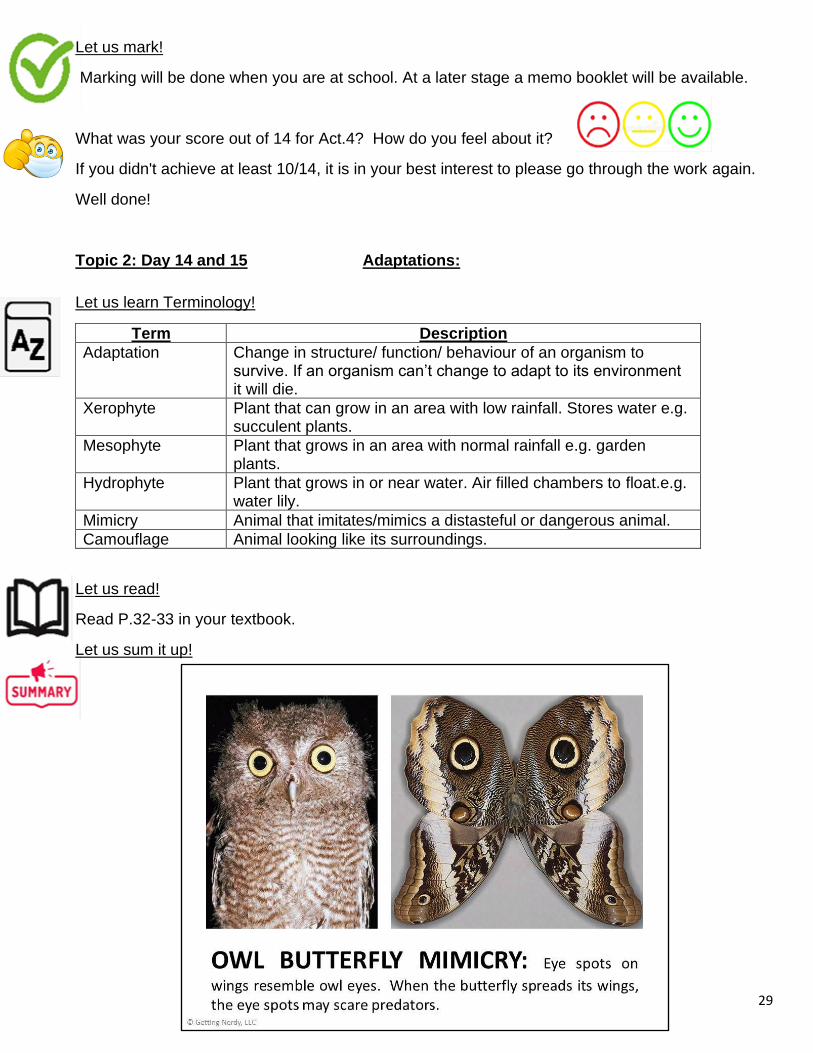
Mimicry Animal that imitates/mimics a distasteful or dangerous animal.
Camouflage Animal looking like its surroundings.
Let us read!
Read P.32-33 in your textbook.
Let us sum it up!
30
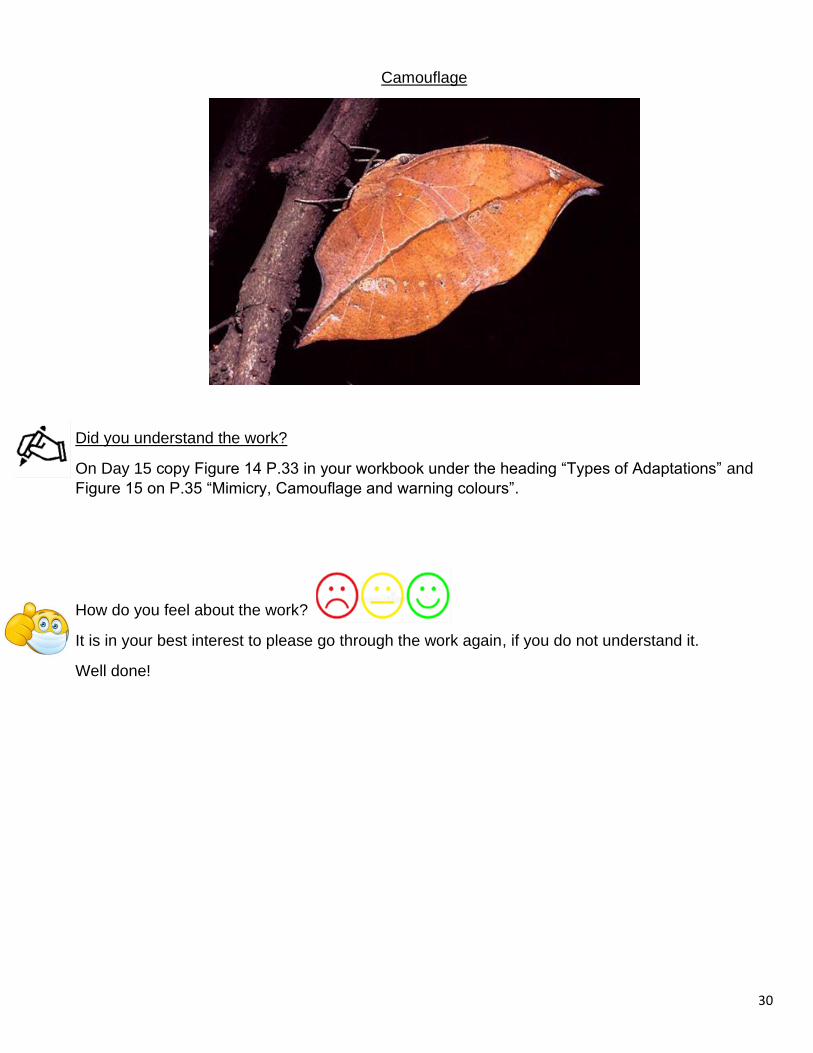
Camouflage
Did you understand the work?
On Day 15 copy Figure 14 P.33 in your workbook under the heading “Types of Adaptations” and
Figure 15 on P.35 “Mimicry, Camouflage and warning colours”.
How do you feel about the work?
It is in your best interest to please go through the work again, if you do not understand it.
Well done!
31
Topic 2: Day 16 Extinction:
Let us learn Terminology!
Term Description
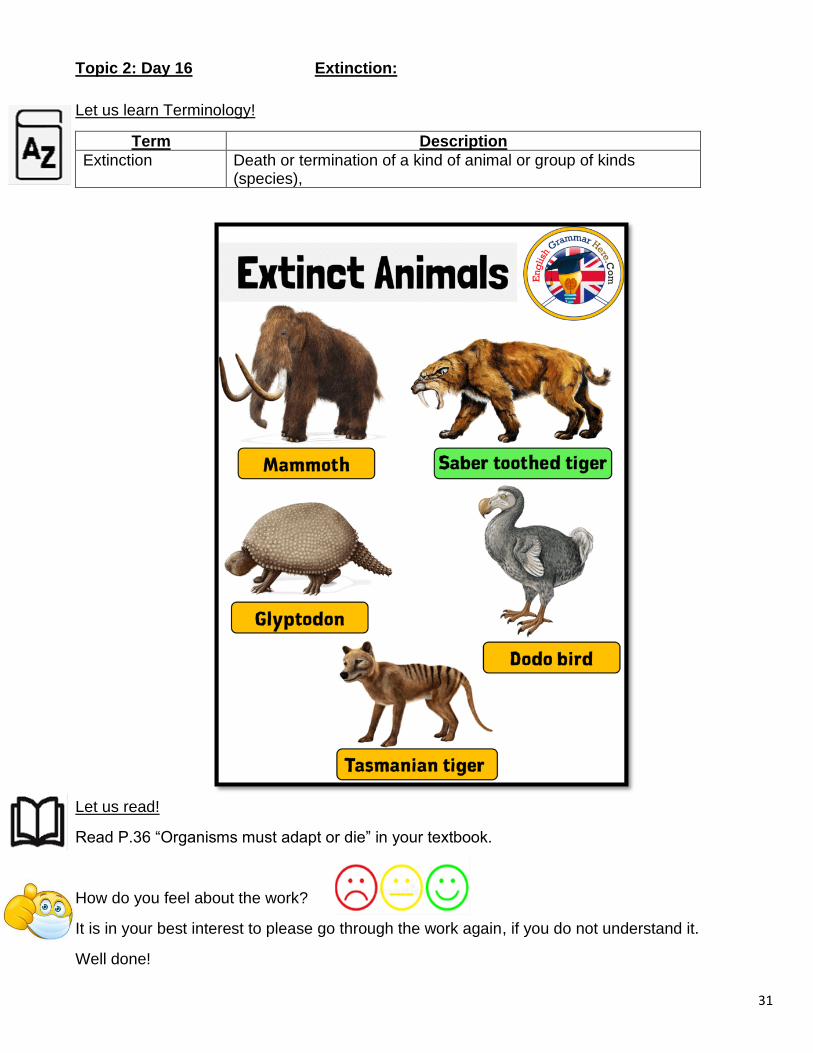
Extinction Death or termination of a kind of animal or group of kinds (species),
Let us read!
Read P.36 “Organisms must adapt or die” in your textbook.
How do you feel about the work?
It is in your best interest to please go through the work again, if you do not understand it.
Well done!
32
Topic 2: Day 17 Conservation:
Let us learn Terminology!
Term Description
Conservation Preserve an area in its original form.
Alien vegetation Plants that are brought in from other parts of the world.
Wetlands Area of land where the soil is covered with a shallow layer of water.
Let us read!
Read P.36 -38 in your textbook.
Let us sum it up!
• We are disrupting the ecosystem by bringing in alien vegetation (companies plant foreign trees
for paper), using wetlands for crops/waste disposal sites.
• If alien vegetation grows, it takes away all the nutrients and water from our indigenous
(domestic/native) vegetation, in turn indigenous vegetation die and ALL the animals that
depend on it also die.
• Wetlands act as filters as water washes over it. Wetlands attract many different species of
animals. If humans dump waste in wetlands or use it for growing crops because of the increase
in human population, then the wetland can’t filter water and ALL the animals that were
dependent on wetlands also die.
Did you understand the work?
On Day 17 copy Figure A P.38 “Importance of conserving biodiversity and natural resources” in
your workbook.
How do you feel about work?
It is in your best interest to please go through the work again, if you do not understand.
Well done!
33
Topic 2: Day 18 Humans and Conservation:
Let us learn Terminology!
Term Description
Biodegradable waste Can be broken down by decomposers e.g. Garden compost (rotten vegetable/fruit; peels); paper.
Non-biodegradable waste
ONLY PRODUCED BY HUMANS. CAN NOT DECOMPOSE e.g. metals and plastic.
Let us read!
Read P. 39-40 in your
textbook.
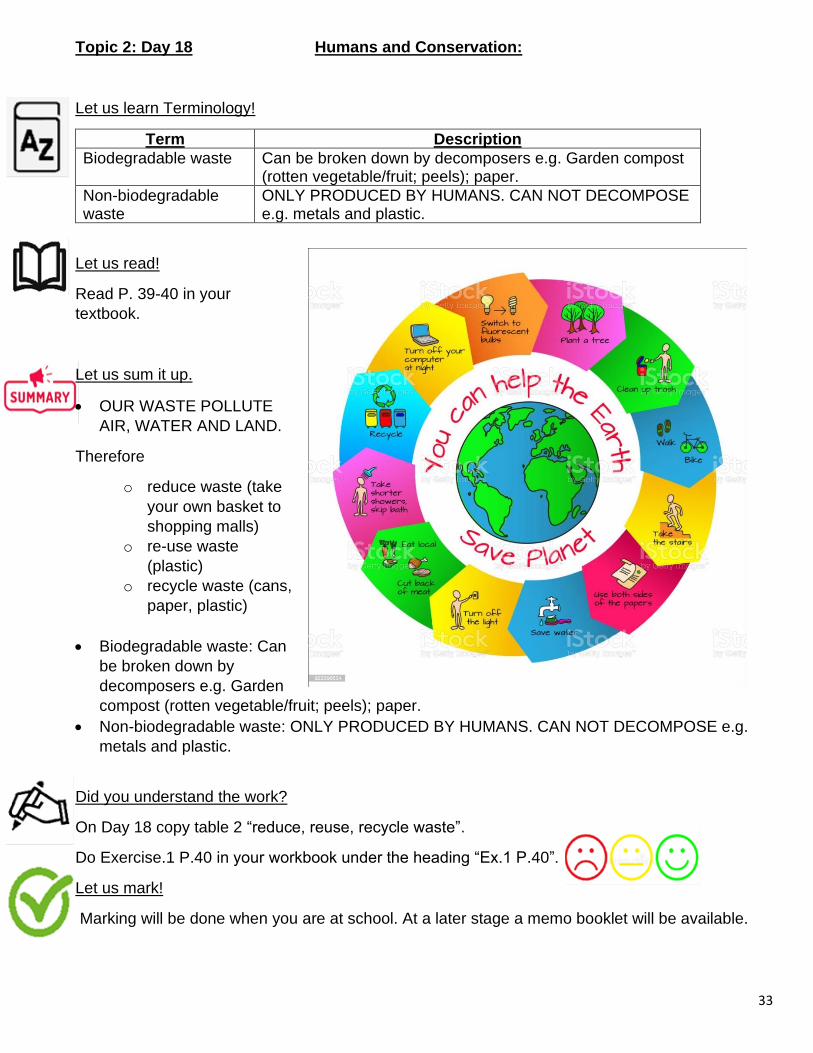
Let us sum it up.
• OUR WASTE POLLUTE
AIR, WATER AND LAND.
Therefore
o reduce waste (take
your own basket to
shopping malls)
o re-use waste
(plastic)
o recycle waste (cans,
paper, plastic)
• Biodegradable waste: Can
be broken down by
decomposers e.g. Garden
compost (rotten vegetable/fruit; peels); paper.
• Non-biodegradable waste: ONLY PRODUCED BY HUMANS. CAN NOT DECOMPOSE e.g.
metals and plastic.
Did you understand the work?
On Day 18 copy table 2 “reduce, reuse, recycle waste”.
Do Exercise.1 P.40 in your workbook under the heading “Ex.1 P.40”.
Let us mark!
Marking will be done when you are at school. At a later stage a memo booklet will be available.
34
How do you feel about the work?
It is in your best interest to please go through the work again, if you do not understand it.
Well done!
DAY 19: UNPREPARED TEST: BALANCE IN AN ECOSYSTEM
If you are at home, it takes SELF DISCIPLINE to not look for the answers in your textbook and to do the test by yourself. Please note unprepared tests do not count marks. The reason why you write it is to see what work you are struggling with or what work you need to focus on.
At the back of your book write “Unprepared test: Balance in an Ecosystem” as your heading with the date and write the test.
Questions:
1. Define a population. (1)
2. Many populations form a community. Is this statement true or false? (1)
3. Define abiotic components and give an example. (2)
4. Define biotic components and give an example. (2)
5. What do many communities together with their natural environment form? (1)
6. Define Biosphere. (1)
7. Arrange the ecological levels from smallest to biggest. (5)
8. What term is given when you study the interactions of living organisms with
each other and their non-environment? (1)
9. On what does survival of organisms depend to carry on surviving? (1)
Total: 15
35
Topic 3: Day 1 and 2 Micro-Organisms
Let us learn Terminology!
Term Description
Micro-Organisms Small living organism that you can’t see with the naked eye. Some are harmful, some are useful.
Vaccine Substance used to stimulate the production of antibodies and provide immunity against certain diseases.
Let us read!
Read P. 42-45 in your textbook.
Let us sum it up!
Micro-organisms are living. Too small to see with naked eye.
Disease causing micro-organisms are found everywhere and can cause even death, Cholera
(waterborne) and diarrhoea to name a few. Wash vegetables, fruits and hands, sterilize
instruments to prevent getting ill.
• Virus - acellular (not a cell); needs a living host.
• Bacteria -unicellular (consist of only one cell
• Protista - unicellular; damp areas: ponds, rivers, streams and oceans
• Fungi -unicellular; can be parasites, release powerful enzyme to break food down.
o Yeast (single celled)
o Mould (multi-cellular) (Alexander Fleming: discovered antibiotic Penicillin)
o Mushroom
Louis Pasteur played an important role in identifying disease-causing micro-organisms and
creating vaccines.
How do you feel about the work?
It is in your best interest to please go through the work again, if you do not understand it.
Well done!
36
Topic 3: Day 3 and 4 Harmful Micro-Organisms and Useful Micro-Organism
Let us read!
Read P.47-52 in your textbook.
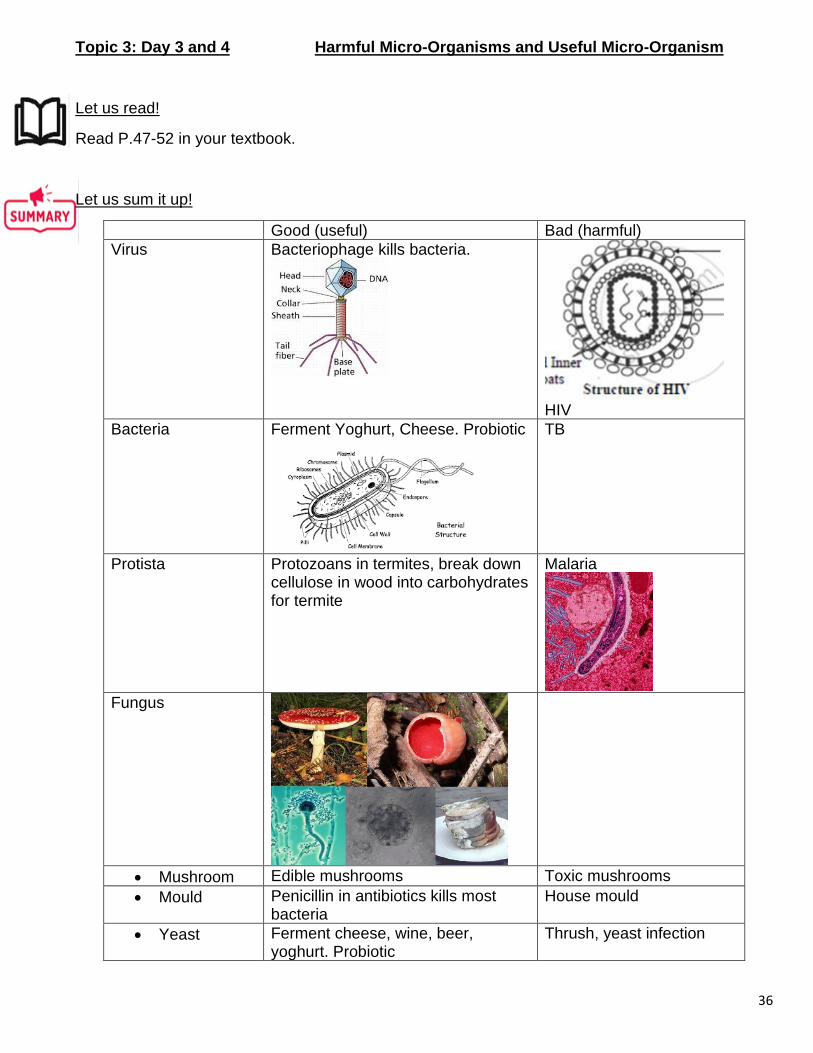
Let us sum it up!
Good (useful) Bad (harmful)
Virus Bacteriophage kills bacteria.
HIV
Bacteria Ferment Yoghurt, Cheese. Probiotic
TB
Protista Protozoans in termites, break down cellulose in wood into carbohydrates for termite
Malaria
Fungus
• Mushroom Edible mushrooms Toxic mushrooms
• Mould Penicillin in antibiotics kills most bacteria
House mould
• Yeast Ferment cheese, wine, beer, yoghurt. Probiotic
Thrush, yeast infection
37
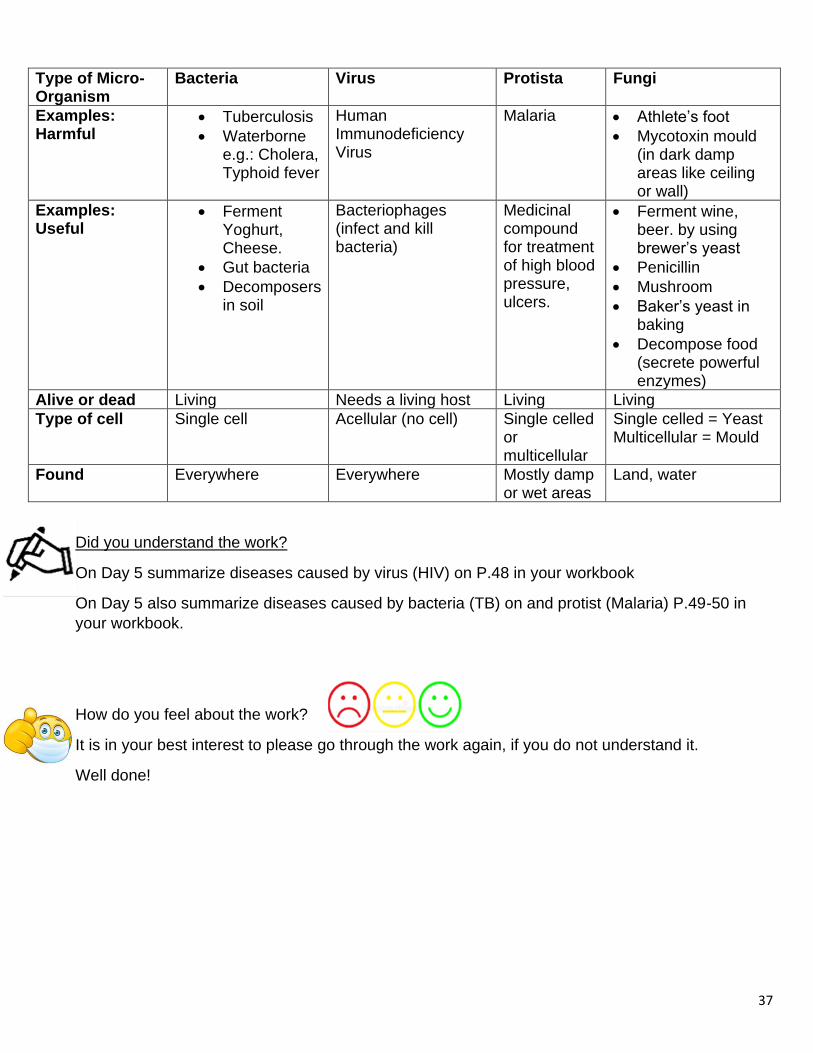
Type of Micro-Organism
Bacteria Virus Protista Fungi
Examples: Harmful
• Tuberculosis
• Waterborne e.g.: Cholera, Typhoid fever
Human Immunodeficiency Virus
Malaria • Athlete’s foot
• Mycotoxin mould (in dark damp areas like ceiling or wall)
Examples: Useful
• Ferment Yoghurt, Cheese.
• Gut bacteria
• Decomposers in soil
Bacteriophages (infect and kill bacteria)
Medicinal compound for treatment of high blood pressure, ulcers.
• Ferment wine, beer. by using brewer’s yeast
• Penicillin
• Mushroom
• Baker’s yeast in baking
• Decompose food (secrete powerful enzymes)
Alive or dead Living Needs a living host Living Living
Type of cell Single cell Acellular (no cell) Single celled or multicellular
Single celled = Yeast Multicellular = Mould
Found Everywhere Everywhere Mostly damp or wet areas
Land, water
Did you understand the work?
On Day 5 summarize diseases caused by virus (HIV) on P.48 in your workbook
On Day 5 also summarize diseases caused by bacteria (TB) on and protist (Malaria) P.49-50 in
your workbook.
How do you feel about the work?
It is in your best interest to please go through the work again, if you do not understand it.
Well done!
38
Topic 3: Day 6 and 7 Useful Micro-Organism and Fermentation
Let us learn Terminology!
Term Description
Fermentation Process where glucose is chemically broken down by bacteria or yeast therefore giving off heat, producing ethyl alcohol, carbon dioxide as well as heat.
Let us read!
Read P.53-57 in your textbook.
Let us sum it up!
• Louis Pasteur played an important role in identifying disease-causing micro-organisms and
creating vaccines.
• Alexander Fleming: discovered mould antibiotic Penicillin.
• Fermentation is the process where glucose is chemically broken down by bacteria or yeast
therefore giving off heat, producing ethyl alcohol in the process and carbon dioxide. This
process takes place in the anaerobically.
Did you understand the work?
Summarize Fermentation (P.54) in your workbook on Day 6.
How do you feel about the work?
It is in your best interest to please go through the work again, if you do not understand it.
Well done!
39
TOPIC 3 DAY 7: UNPREPARED TEST: MICRO-ORGANISMS
If you are at home, it takes SELF DISCIPLINE to not look for the answers in your textbook and to do the test by yourself. Please note unprepared tests do not count marks. The reason why you write it is to see what work you are struggling with or what work you need to focus on.
At the back of your book write “Unprepared test: Micro-Organisms” as your heading with the date and write the test.
Questions: 1 Can you see Micro- Organisms? (1)
2 Name 4 types of Micro-Organisms. (4)
3 Are all Micro-Organisms living? (1)
4 Name a harmful virus. (1)
5 What can useful bacteria or fungi be used for? (1)
6 Louis Pasteur is famous for discovering what? (1)
7 Alexander Fleming discovered what? (1)
8 Where are Protists found? (1)
9 Are fungi multicellular and single celled? (1)
10 Name 3 ways how you can protect yourself from harmful Micro-Organisms. (3)
Total: 15


![Booklet 1st term[1]](https://img.pdfslide.net/doc/110x75/557c1565d8b42ad1658b53f6/booklet-1st-term1.jpg)