Embed Size (px)
Citation preview
A.1
Test 1 : Standard Slump and Flow Table Tests Objective To determine the reference slump value for Kistner concrete mix design and to calibrate it against an equivalent measure using a flow table. Materials Natural coarse aggregate and siliceous fine aggregate with maximum size of 3/8 in., supplied by Kistner Concrete Products, Inc. Soda-lime glass aggregate passing #4 standard sieve. Portland cement ASTM Types I and III. ASR suppressant: Metamax, a high-reactivity metakaolin of regular particle size, manufactured by Engelhard Corporation. MB VR, an air-entraining admixture, manufactured by Master Builders Technologies, Inc. Pozzolith 400N, a high-range water-reducing admixture, manufactured by Master Builders Technologies, Inc. Pozzolith 322-N, concrete stabilizer, manufactured by Master Builders Technologies, Inc. Mix Design The mortar mixes were prepared according to ASTM C 192: W/C = 0.63, A/C (coarse and sand aggregate) = 3.96, A/C (sand aggregate only) = 1.72 All ASR suppressant material was added to the mix as cement replacement. Natural coarse aggregate grading:
2" 1" 1/2" 1/4" #31/2 #4 Minus #4 0.0% 0.0% 4.0% 82.1% 8.3% 4.1% 1.4%
Natural fine aggregate grading (weight percentage relative to the total weight of sand):
#3/8 #4 # 8 # 16 # 30 # 50 # 100 - #100 0.0% 0.0% 4.6% 21.0% 27.0% 28.3% 13.4% 5.7%
Glass aggregate grading (weight percentage relative to the total weight of glass):
#3/8 #4 # 8 # 16 # 30 # 50 # 100 - #100 0.0% 0.0% 6.8% 19.2% 27.2% 27.6% 13.4% 5.8%
Test Dates June 1998
A.2
Test Description For commercial production purposes it is important to assure that the final concrete mix design yet to be determined has a similar workability as the mix currently used by Kistner Concrete Products. The Kistner concrete mix was designed for a relatively high flow of 9 inches to facilitate placement and consolidation of reinforced concrete products with minimum vibration. This mix contains coarse aggregate as large as 1/2 inch. The slump of such concrete can only be determined through the standard ASTM C 143 / C 143M-97 test. In order to permit more efficient testing to determine optimum fiber contents and suitable admixtures, a flow table test method was incorporated in parallel, which uses only fine aggregate mortars. The mix design includes a number of admixtures that affect the rheology and durability. Pozzolith 322-N is used to improve workability of the fresh mix and, more importantly, to avoid separation of the high-flow concrete. MB VR, an entraining air admixture, is used mainly to increase resistance to damage from freezing and thawing. The manufacturer claims that it also improves plasticity and workability. Pozzolith 400 N, a high-water-reducing admixture designed to produce concrete with a high workability is also added. As shown in Table 1.1, seven batches were tested for workability and flow. Batch one established the reference slump value for the Kistner mix using the standard ASTM cone test. The water content was adjusted to compensate for the dry gravel and sand used in the lab. The flow table test procedure does not conform with ASTM standard and is as follows. Concrete is placed into a cylindrical steel mold with an inner diameter of 36 mm. After lifting of the cylinder, the mix is allowed to spread, and the diameter of the mortar cake is measured. By substituting a large glass plate for the round flow table of the standard ASTM flow test, the modified test procedure is not subject to a maximum flow limit. Batches 2 through 7 contained no coarse aggregate and had the same w/c value as Batch 2, which is considered the reference mix for the flow table tests. In Batches 3 through 7, glass was used as fine aggregate, and flow table tests were performed to assess the effect of different types and dosages of superplasticizer.
A.3
Results and Discussion Test results are summarized in Table 1.2. The following observations can be made from these results: 1. The Kistner concrete mix achieved a high slump of nearly 9 inches, using a water -cement
ratio (w/c) of 0.63. This is different from the 0.4 value actually used by Kistner, because they use wet aggregate in their manufacturing facilities.
2. The equivalent flow table test result for the same mix, but without the coarse aggregate, was 166 mm. This value will thus serve as the reference for subsequent flow table test results. It can also be considered the target flow value, since Kistner Concrete Products appears to be satisfied with the workability of such a mix.
3. A mortar mix with glass aggregate and partial substitution of Meta Max for cement results in the very low flow value of 40 mm. Upon increasing the superplasticizer (Pozzolith 400N) dosage from 0.75% to 2.17%, the flow value increased continually up to 226 mm, which is 36% higher than the 166 mm target value achieved using natural aggregate.
4. The dosage of Pozzolith 400N that gives the glass aggregate concrete mix a flow equal to the target value of 166 mm is approximately 1.4% by weight of cement. If use of a different admixture is under consideration, a similar optimization procedure is necessary.
5. A different type of high-range water-reducer, Reobuild 1000, was added at a level of 2.17% by weight of cement. Its impact on the flow was much lower than that achieved by using Pozzolith 400N. This could be attributed to the high water content of the mortar mix and its negative effect on the plasticizer.
Conclusion The test demonstrated that an equivalent slump can be achieved for glass aggregate if an appropriate dosage of Pozzolith 400N superplasticizer is added. For this specific mix, Pozzolith 400N performed better than Reobuild 1000. More work is needed to improve the mix design and to determine the appropriate dosage of the superplasticizer, particularly when recycled carpet fibers are added to the mortar mix.
A.4
Table 1.1: Summary of Concrete Batches
Batch
No Aggregate w/c Ratio
Cementitious
Material Admixtures Superplasticizer
1 Natural Aggregate
(coarse + fine) 0.63
Type III
Portland
Cement
MB VR and
Pozzolith
322-N
Pozzolith 400N
(0.75%)
2 Natural Aggregate
(fine only) 0.63
Type III
Portland
Cement
MB VR and
Pozzolith 322-N
Pozzolith 400N
(0.75%)
3 Glass Aggregate
(fine only) 0.63
80% Type III
Portland
Cement + 20%
Metamax
MB VR and
Pozzolith
322-N
Pozzolith 400N
(0.75%)
4 Glass Aggregate
(fine only) 0.63
80% Type I
Portland
Cement + 20%
Metamax
MB VR and
Pozzolith
322-N
Pozzolith 400N
(1.24%)
5 Glass Aggregate
(fine only) 0.63
80% Type I
Portland
Cement + 20%
Metamax
MB VR and
Pozzolith
322-N
Pozzolith 400N
(1.50%)
6 Glass Aggregate
(fine only) 0.63
80% Type I
Portland
Cement + 20%
Metamax
MB VR and
Pozzolith
322-N
Pozzolith 400N
(2.17%)
7 Glass Aggregate
(fine only) 0.63
80% Type I
Portland
Cement + 20%
Metamax
MB VR and
Pozzolith
322-N
Reobuild 1000
(2.17%)
A.5
Table 1.2: Summary of Test Results
Batch No
Aggregate Superplasticizer Slump Test (in.)
Flow Test (mm)
1
Natural
Aggregate
(coarse + fine) Pozzolith 400N (0.75%) 8.75 ---
2
Natural
Aggregate
(fine only) Pozzolith 400N (0.75%) --- 166
3
Glass
Aggregate
(fine only) Pozzolith 400N (0.75%) --- 40
4
Glass
Aggregate
(fine only) Pozzolith 400N (1.24%) --- 134
5
Glass
Aggregate
(fine only) Pozzolith 400N (1.50%) --- 186
6
Glass
Aggregate
(fine only) Pozzolith 400N (2.17%) --- 226
7
Glass
Aggregate
(fine only) Reobuild 1000 (2.17%) --- 166
A.6
Test 2 : Effect of Mixing Procedure on Flow and Compressive Strength Objective To determine the effect of mixing procedure of glascrete mortar on the flow value and compressive strength. Materials Soda-lime glass aggregate passing #4 standard sieve. Portland cement ASTM Type I. ASR suppressant: a proprietary powder admixture. MB VR, air-entraining admixture, manufactured by Master Builders Technologies, Inc. Pozzolith 400N, a high-range water-reducing admixture, manufactured by Master Builders Technologies, Inc. Pozzolith 322-N, concrete admixture manufactured by Master Builders Technologies, Inc. Mix Design The mortar mixes were prepared according to ASTM C 192 and four other procedures. W/C = 0.63, A/C = 1.72 All ASR-suppressant material was added to the mix as cement replacement The following amounts of admixtures were used for all batches:
Pozzolith 322-N: 0.24% of cement by weight. Pozzolith 400-N: 1.25% of cement by weight. Air entrainment agent MB VR: 0.16% of cement by weight. ASR suppressant admixture: 20% by weight as cement substitution.
Glass aggregate grading: same as in Test 1. Test Dates July 1998
A.7
Test Description This test was carried out to determine the proper mixing procedure in terms of the sequence in which materials are added. The amounts of glass aggregate, cement, ASR suppressant, and admixtures were the same for all batches. The dosages (in percent of cement by weight) of the various admixtures were as follows: Pozzolith 400N 1.25%; Pozzolith 322-N 0.24%; MB VR 0.16%. The flow values were determined using the static free flow table apparatus described in Test 1. Five different procedures were investigated, and the flow values were measured and recorded in each case. The general process followed the ASTM C 192 standard for procedure I, and the relative modifications for the other procedures are as follows: Procedure I 1. Add MB VR to the first part of water (67%) and add to the mixer. 2. Add cement and ASR suppressant into the mixing bowl and start the mixer at slow speed for
30 sec. 3. Stop the mixer and quickly scrape down into the batch any mortar collected on the side of the
bowl. 4. Add small portions of the remaining 33% water to the separate containers with Pozzolith
400N and 322-N. 5. Turn on the mixer and add glass aggregate, Pozzolith 400N, and the remaining water and mix
for 30 sec at low speed. 6. Stop mixer, change to medium speed and let mortar stand for 1.5 min (during the first 15 sec
quickly scrape down into the batch any mortar collected on the side of the bowl) 7. Finish by mixing for 1 min at medium speed and during the first 10 sec quickly add Pozzolith
322-N. 8. Measure flow. Procedure II 1. Add MB VR to the first part of water (67%) and add to the mixer. 2. Add cement and ASR suppressant into the bowl and start the mixer at slow speed for 30 sec. 3. Add Pozzolith 400N while mixer is running. 4. Stop the mixer and quickly scrape down into the batch any mortar collected on the side of the
bowl and add glass aggregate. Start the mixer and add the second part of water during a mixing period of 30 sec at low speed.
5. Stop the mixer and let the mortar stand for 1.5 min (during the first 15 sec quickly scrape down into the batch any mortar collected on the side of the bowl).
6. Change to medium speed and finish by mixing for 1 min at medium speed. 7. Measure flow. 8. Add Pozzolith 322-N and mix by hand. 9. Measure flow.
A.8
Procedure III 1. Add MB VR to the first part of water (67%) and add to the mixer. 2. Add cement and ASR suppressant into the bowl and start the mixer at slow speed for 30 sec. 3. Slowly add glass aggregate over 30 sec, then add Pozzolith 400N and the second part of
water while mixing at slow speed. 4. Stop the mixer, change to medium speed and run for 30 sec. 5. Stop the mixer and let the mortar stand for 1.5 min (during the first 15 sec quickly scrape
down into the batch any mortar collected on the side of the bowl). 6. Finish by mixing for 1 min at medium speed. 7. Measure flow. 8. Add Pozzolith 322-N and mix by hand. 9. Measure flow. Procedure IV 1. Add MB VR to the first part of water (67%) and add to the mixer. 2. Add glass aggregate into the bowl and start the mixer at slow speed for 30 sec. 3. Add small portions of the remaining 33% water to the separate containers with Pozzolith
400N and 322-N. 4. Add cement and ASR suppressant and mix at slow speed for 30 sec. 5. Add the second part of water over a 30 sec period, and then add Pozzolith 400N while
mixing at slow speed. 6. Stop the mixer, change to medium speed and mix for 30 sec. 7. Stop the mixer and let the mortar stand for 1.5 min (during the first 15 sec quickly scrape
down into the batch any mortar collected on the side of the bowl). 8. Finish by mixing for 1 min at medium speed. 9. Measure flow. 10. Add Pozzolith 322-N and mix by hand. 11. Measure flow. Procedure V 1. Add MB VR to the first part of water (67%) and add to the mixer. 2. Place ASR suppressing powder into the bowl and mix by hand. 3. Add small portions of the remaining 33% water to the separate containers with Pozzolith
400N and 322-N. 4. Place cement into the bowl and then start the mixer at low speed for 30 sec. 5. Add glass aggregate and second part of water during 30 sec at medium speed. 6. Stop the mixer and let the mortar stand for 1.5 min (during the first 15 sec quickly scrape
down into the batch any mortar collected on the side of the bowl). 7. Finish by mixing for 1 min at medium speed. 8. Measure flow. 9. Add Pozzolith 322-N and mix by hand. 10. Measure flow.
A.9
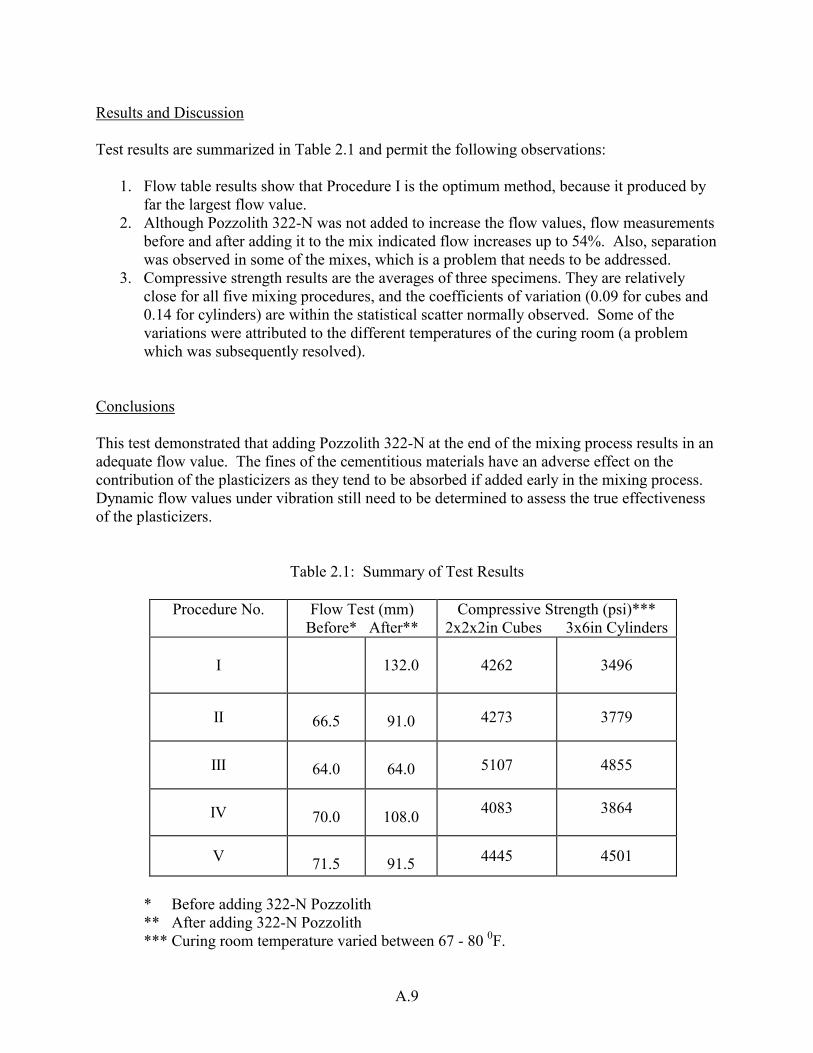
Results and Discussion Test results are summarized in Table 2.1 and permit the following observations:
1. Flow table results show that Procedure I is the optimum method, because it produced by far the largest flow value.
2. Although Pozzolith 322-N was not added to increase the flow values, flow measurements before and after adding it to the mix indicated flow increases up to 54%. Also, separation was observed in some of the mixes, which is a problem that needs to be addressed.
3. Compressive strength results are the averages of three specimens. They are relatively close for all five mixing procedures, and the coefficients of variation (0.09 for cubes and 0.14 for cylinders) are within the statistical scatter normally observed. Some of the variations were attributed to the different temperatures of the curing room (a problem which was subsequently resolved).
Conclusions This test demonstrated that adding Pozzolith 322-N at the end of the mixing process results in an adequate flow value. The fines of the cementitious materials have an adverse effect on the contribution of the plasticizers as they tend to be absorbed if added early in the mixing process. Dynamic flow values under vibration still need to be determined to assess the true effectiveness of the plasticizers.
Table 2.1: Summary of Test Results
Procedure No.
Flow Test (mm)
Before* After** Compressive Strength (psi)***
2x2x2in Cubes 3x6in Cylinders
I
132.0
4262 3496
II
66.5
91.0 4273 3779
III
64.0
64.0 5107 4855
IV
70.0
108.0
4083
3864
V 71.5
91.5 4445 4501
* Before adding 322-N Pozzolith
** After adding 322-N Pozzolith *** Curing room temperature varied between 67 - 80 0F.
A.10
Test 3 : Effect of Superplasticizer and W/C Ratio on Flow and Compressive Strength
Objective To determine the effect of superplasticizer content and water-cement ratio of glascrete mortar on the flow table values and compressive strength. Materials Soda-lime glass aggregate passing #4 standard sieve. Portland cement ASTM Type III, supplied by Blue Circle, Inc. ASR suppressant: a proprietary powder admixture. MB VR, an air-entraining admixture, manufactured by Master Builders Technologies, Inc. Reobuild 1000, a high-range water-reducing admixture, manufactured by Master Builders Technologies, Inc. Mix Design The mortar mixes were prepared according to ASTM C 109/C109M-98, using Procedure 1 as described in Test #2. W/C = 0.63 and 0.47, A/C = 1.72 The following amounts of admixtures were used for all batches:
Reobuild: from 0.8 to 1.95% by weight of cement Air entrainment agent MB VR: 0.16% of cement by weight. ASR suppressant: 20% by weight as cement substitution.
Glass aggregate grading: same as in Test 1. Test Dates August 1998
A.11
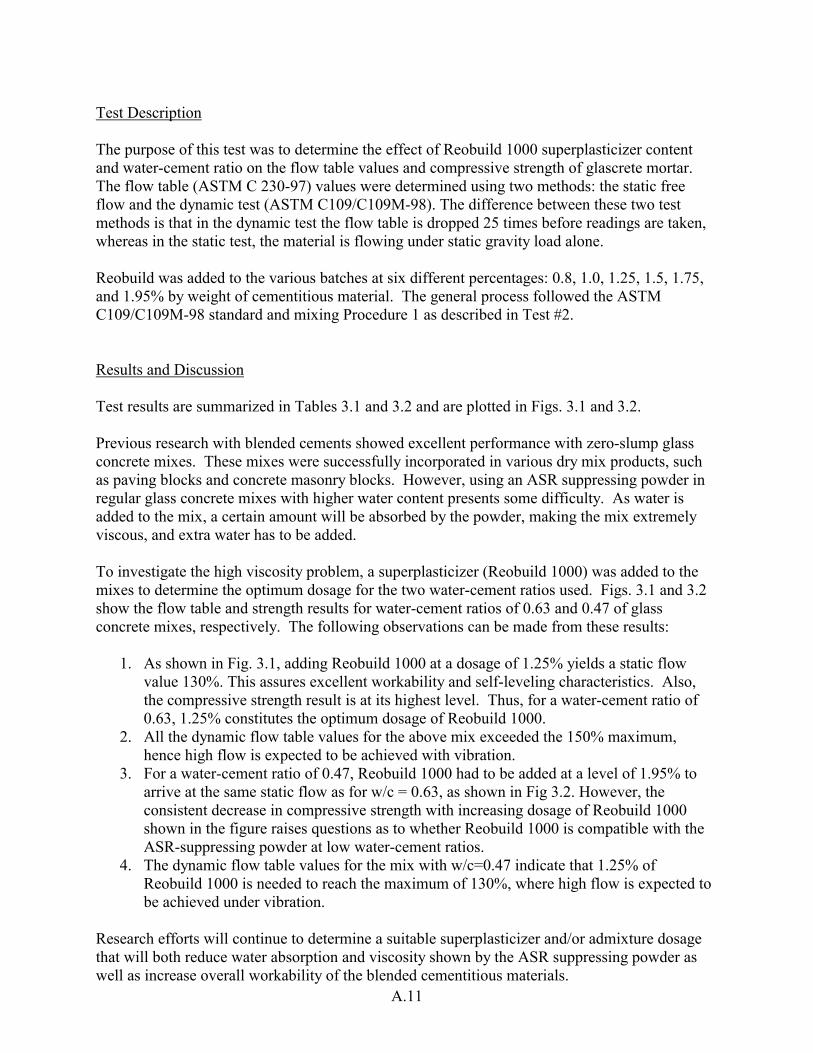
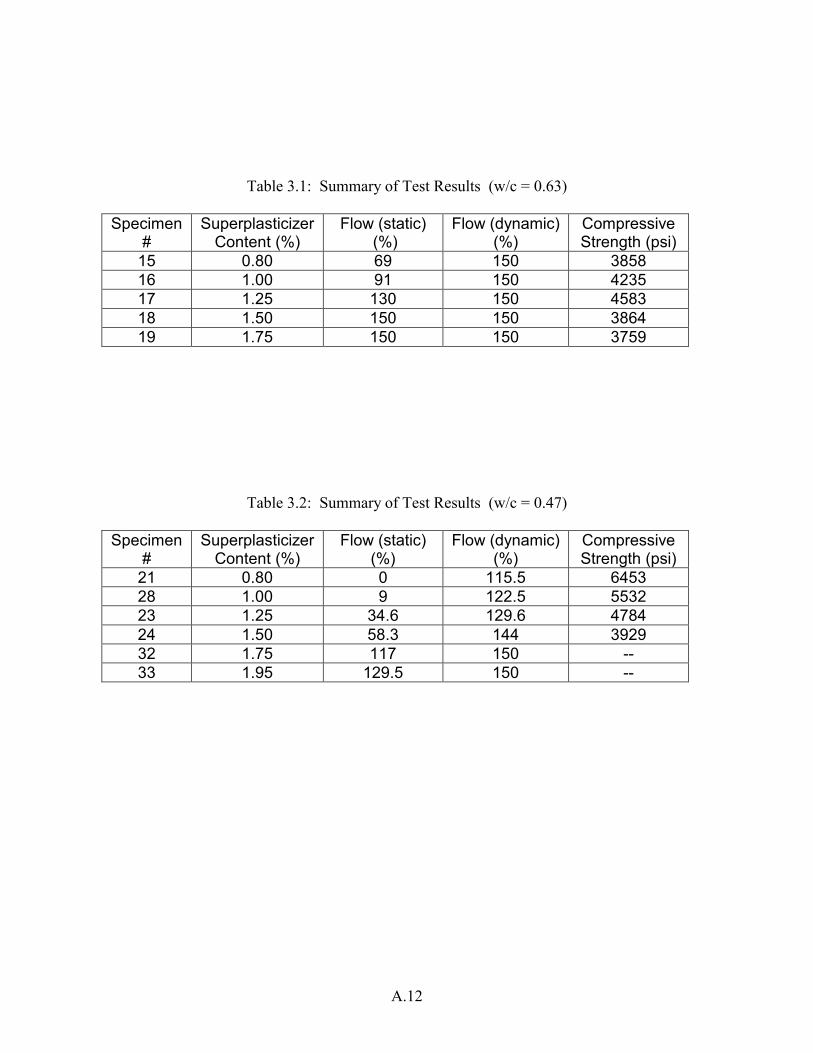
Test Description The purpose of this test was to determine the effect of Reobuild 1000 superplasticizer content and water-cement ratio on the flow table values and compressive strength of glascrete mortar. The flow table (ASTM C 230-97) values were determined using two methods: the static free flow and the dynamic test (ASTM C109/C109M-98). The difference between these two test methods is that in the dynamic test the flow table is dropped 25 times before readings are taken, whereas in the static test, the material is flowing under static gravity load alone. Reobuild was added to the various batches at six different percentages: 0.8, 1.0, 1.25, 1.5, 1.75, and 1.95% by weight of cementitious material. The general process followed the ASTM C109/C109M-98 standard and mixing Procedure 1 as described in Test #2. Results and Discussion Test results are summarized in Tables 3.1 and 3.2 and are plotted in Figs. 3.1 and 3.2. Previous research with blended cements showed excellent performance with zero-slump glass concrete mixes. These mixes were successfully incorporated in various dry mix products, such as paving blocks and concrete masonry blocks. However, using an ASR suppressing powder in regular glass concrete mixes with higher water content presents some difficulty. As water is added to the mix, a certain amount will be absorbed by the powder, making the mix extremely viscous, and extra water has to be added. To investigate the high viscosity problem, a superplasticizer (Reobuild 1000) was added to the mixes to determine the optimum dosage for the two water-cement ratios used. Figs. 3.1 and 3.2 show the flow table and strength results for water-cement ratios of 0.63 and 0.47 of glass concrete mixes, respectively. The following observations can be made from these results:
1. As shown in Fig. 3.1, adding Reobuild 1000 at a dosage of 1.25% yields a static flow value 130%. This assures excellent workability and self-leveling characteristics. Also, the compressive strength result is at its highest level. Thus, for a water-cement ratio of 0.63, 1.25% constitutes the optimum dosage of Reobuild 1000.
2. All the dynamic flow table values for the above mix exceeded the 150% maximum, hence high flow is expected to be achieved with vibration.
3. For a water-cement ratio of 0.47, Reobuild 1000 had to be added at a level of 1.95% to arrive at the same static flow as for w/c = 0.63, as shown in Fig 3.2. However, the consistent decrease in compressive strength with increasing dosage of Reobuild 1000 shown in the figure raises questions as to whether Reobuild 1000 is compatible with the ASR-suppressing powder at low water-cement ratios.
4. The dynamic flow table values for the mix with w/c=0.47 indicate that 1.25% of Reobuild 1000 is needed to reach the maximum of 130%, where high flow is expected to be achieved under vibration.
Research efforts will continue to determine a suitable superplasticizer and/or admixture dosage that will both reduce water absorption and viscosity shown by the ASR suppressing powder as well as increase overall workability of the blended cementitious materials.
A.12
Table 3.1: Summary of Test Results (w/c = 0.63)
Specimen #
Superplasticizer Content (%)
Flow (static) (%)
Flow (dynamic) (%)
Compressive Strength (psi)
15 0.80 69 150 3858 16 1.00 91 150 4235 17 1.25 130 150 4583 18 1.50 150 150 3864 19 1.75 150 150 3759
Table 3.2: Summary of Test Results (w/c = 0.47)
Specimen #
Superplasticizer Content (%)
Flow (static) (%)
Flow (dynamic) (%)
Compressive Strength (psi)
21 0.80 0 115.5 6453 28 1.00 9 122.5 5532 23 1.25 34.6 129.6 4784 24 1.50 58.3 144 3929 32 1.75 117 150 -- 33 1.95 129.5 150 --
A.13
Fig 3.1: Test Results (Reobuild 1000, w/c=0.63)
0
1000
2000
3000
4000
5000
6000
0.80 1.00 1.20 1.40 1.60 1.80 2.00 Superplasticizer Content (%)
Com
pres
sive
Stre
ngth
(psi
)
0
20
40
60
80
100
120
140
160
Flow
(%)
Compressive StrengthFlow (static) Flow (dynamic)
Fig. 3.2: Test Results (Reobuild 1000, w/c=0.47)
0
1500
3000
4500
6000
7500
9000
0.80 1.00 1.20 1.40 1.60 1.80 2.00 Superplasticizer Content (%)
Com
pres
sive
Stre
ngth
(psi
)
0
20
40
60
80
100
120
140
160
Flow
(%)
Compressive StrengthFlow (static) Flow (dynamic)

A.14
Test 4 : Effect of Superplasticizer and W/C Ratio on Flow and Compressive Strength - II
Objective To determine the effect of Pozzolith 400N superplasticizer content and water-cement ratio of glascrete mortar on the flow table values and compressive strength. Materials Soda-lime glass aggregate passing #4 standard sieve. Portland cement ASTM Type III, supplied by Blue Circle, Inc. ASR suppressant: a proprietary powder admixture. MB VR, an air-entraining admixture, manufactured by Master Builders Technologies, Inc. Pozzolith 400N, a high-range water-reducing admixture, manufactured by Master Builders Technologies, Inc. Mix Design The mortar mixes were prepared according to ASTM C 109/C109M-98, using Procedure 1 as described in Test #2. W/C = 0.63 and 0.47, A/C = 1.72 All ASR suppressant material was added to the mix as cement replacement Glass aggregate grading: same as in Test 1. Test Dates September 1998
A.15
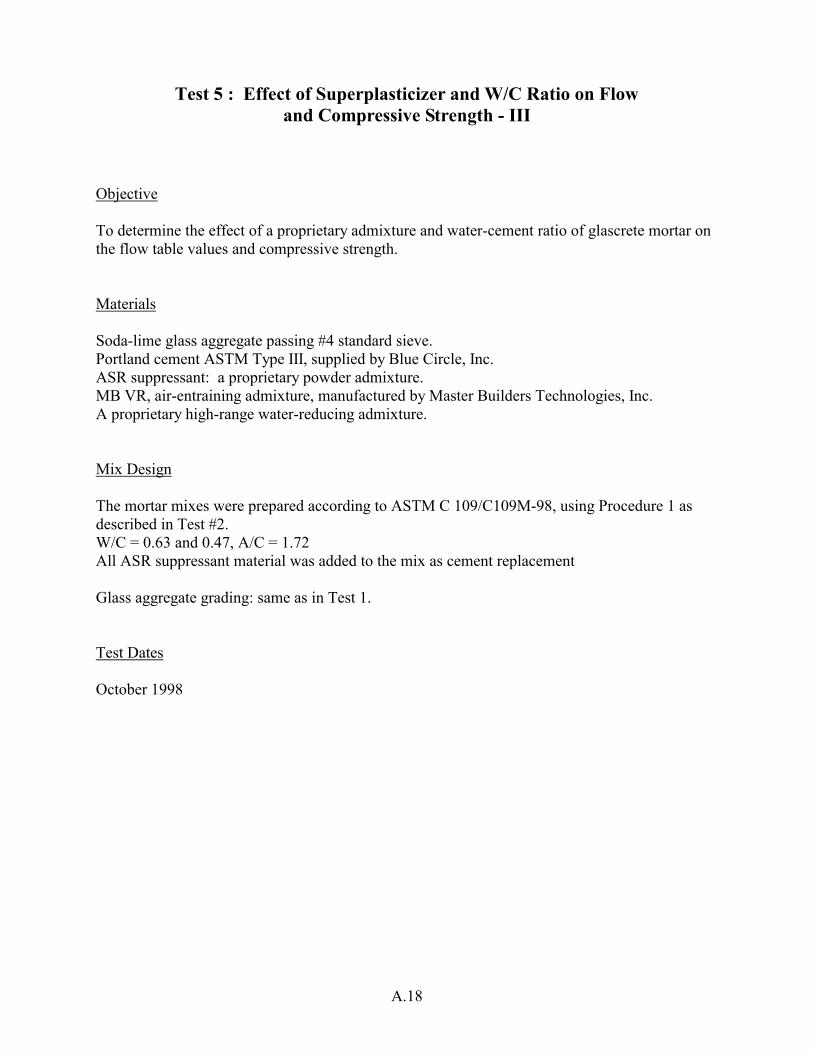
Test Description This test was conducted to continue the search for a suitable plasticizer for blended cements that contain the ASR suppressing powder. A naphthalene-based superplasticizer (Pozzolith 400N) was added to the mixes to determine the optimum dosage for two different water-cement ratios. The amounts of glass aggregate, cement, and admixtures were the same for all batches. Two water-cement ratios were used, 0.63 and 0.47. Six different dosages of Pozzolith 400N were studied: 0.8, 1.0, 1.25, 1.5, 1.75, and 1.95% by weight of cement. The admixture MB VR was added at the fixed dosages of 0.16% of cement by weight. The ASR suppressant was used as a substitute for cement at a level of 20% by weight. The flow table (ASTM C 230-97) values were measured using two methods: the static free flow, and the dynamic values measured after 25 table drops (ASTM C109/C109M-98). The general process followed the ASTM C109/C109M-98 standard and mixing Procedure 1 as described in Test #2. Results and Discussion Test results are summarized in Tables 4.1 and 4.2 and plotted in Figs. 4.1 and 4.2, which show the flow table and strength results for water-cement ratios of 0.63 and 0.47 of glass concrete mixes, respectively. The following observations can be made from these results:
1. Fig. 4.1 (w/c=0.63) shows that adding 1.5% or more Pozzolith 400N induced a highly workable mix with excellent self-leveling characteristics and a static flow value of 150%. The compressive strength also reaches its maximum at this dosage of superplasticizer.
2. For w/c = 0.63, the maximum dynamic flow table result of 150% was obtained with the lowest dosage of Pozzolith 400N (0.8%) that was tested.
3. For w/c = 0.47, Pozzolith 400N had to be added at a level of 1.75% to achieve maximum flow of 150% (Fig 4.2). Compressive strength decreased with increasing superplasticizer dosage up to a value of 1.25%. Thereafter, strength increased gradually, with a maximum reached with a 1.95% dosage. A comparison with Test 3 results indicates that Pozzolith 400N appears to perform better than Reobuild 1000, since no deterioration of strength was observed with the higher superplasticizer dosages.
4. The dynamic flow table values for the mix with w/c = 0.47 reached consistently the maximum of 150% as expected, except that at 1% dosage a slight reduction in workability was observed. This could have been an aberration.
Two additional studies on superplasticizers will be conducted in order to study in further depth their effect on cements that contain the ASR suppressing powder admixture.
A.16
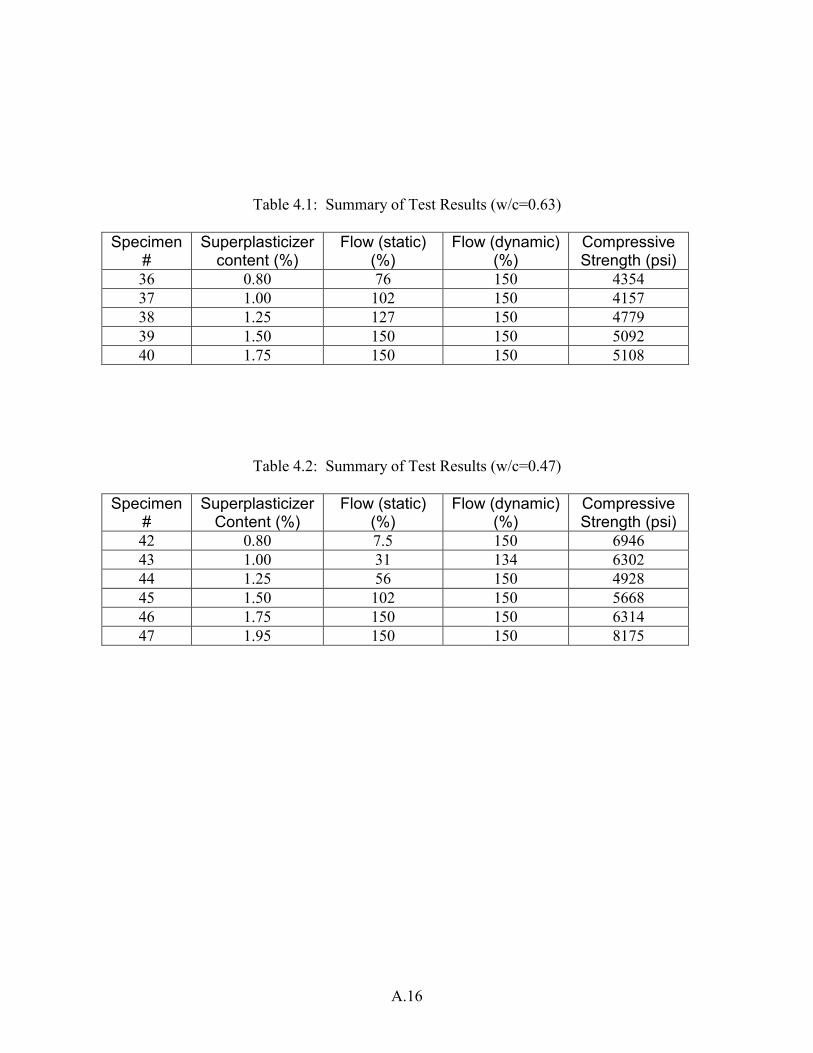
Table 4.1: Summary of Test Results (w/c=0.63)
Specimen #
Superplasticizer content (%)
Flow (static) (%)
Flow (dynamic) (%)
Compressive Strength (psi)
36 0.80 76 150 4354 37 1.00 102 150 4157 38 1.25 127 150 4779 39 1.50 150 150 5092 40 1.75 150 150 5108
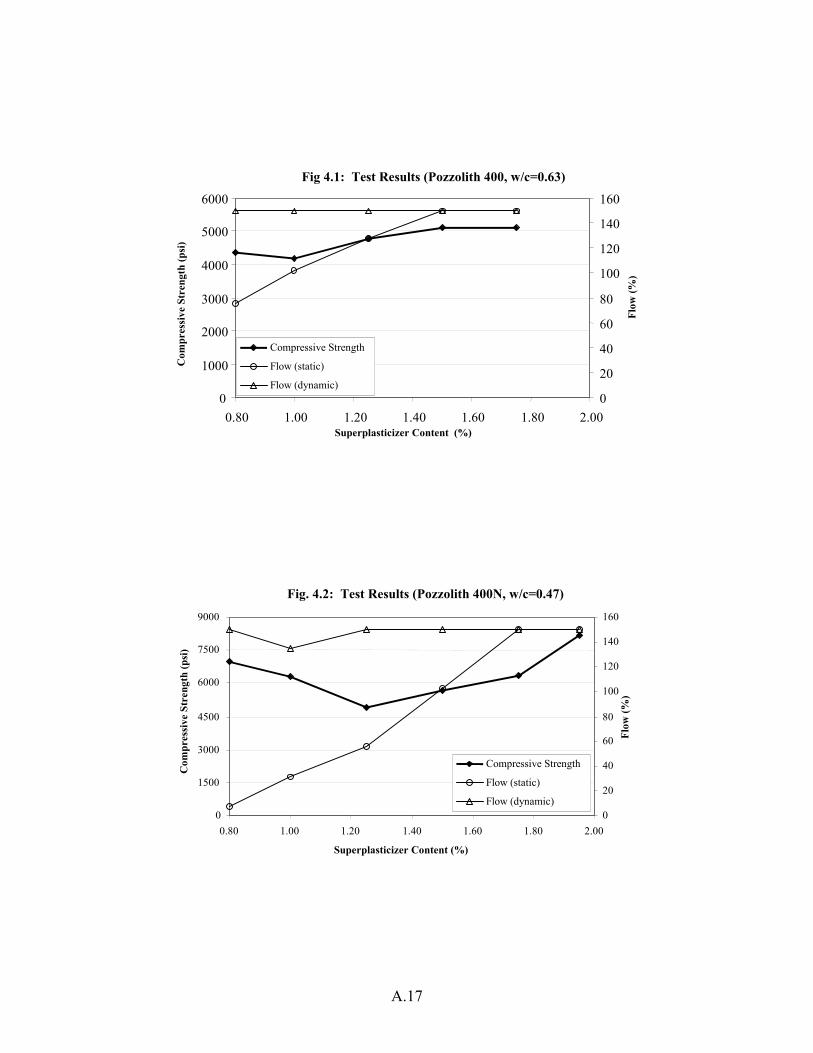
Table 4.2: Summary of Test Results (w/c=0.47)
Specimen #
Superplasticizer Content (%)
Flow (static) (%)
Flow (dynamic) (%)
Compressive Strength (psi)
42 0.80 7.5 150 6946 43 1.00 31 134 6302 44 1.25 56 150 4928 45 1.50 102 150 5668 46 1.75 150 150 6314 47 1.95 150 150 8175
A.17
Fig 4.1: Test Results (Pozzolith 400, w/c=0.63)
0
1000
2000
3000
4000
5000
6000
0.80 1.00 1.20 1.40 1.60 1.80 2.00 Superplasticizer Content (%)
Com
pres
sive
Str
engt
h (p
si)
0
20
40
60
80
100
120
140
160
Flow
(%)
Compressive Strength
Flow (static) Flow (dynamic)
Fig. 4.2: Test Results (Pozzolith 400N, w/c=0.47)
0
1500
3000
4500
6000
7500
9000
0.80 1.00 1.20 1.40 1.60 1.80 2.00 Superplasticizer Content (%)
Com
pres
sive
Str
engt
h (p
si)
0
20
40
60
80
100
120
140
160 Fl
ow (%
)
Compressive Strength Flow (static)
Flow (dynamic)
A.18
Test 5 : Effect of Superplasticizer and W/C Ratio on Flow and Compressive Strength - III
Objective To determine the effect of a proprietary admixture and water-cement ratio of glascrete mortar on the flow table values and compressive strength. Materials Soda-lime glass aggregate passing #4 standard sieve. Portland cement ASTM Type III, supplied by Blue Circle, Inc. ASR suppressant: a proprietary powder admixture. MB VR, air-entraining admixture, manufactured by Master Builders Technologies, Inc. A proprietary high-range water-reducing admixture. Mix Design The mortar mixes were prepared according to ASTM C 109/C109M-98, using Procedure 1 as described in Test #2. W/C = 0.63 and 0.47, A/C = 1.72 All ASR suppressant material was added to the mix as cement replacement Glass aggregate grading: same as in Test 1. Test Dates October 1998
A.19
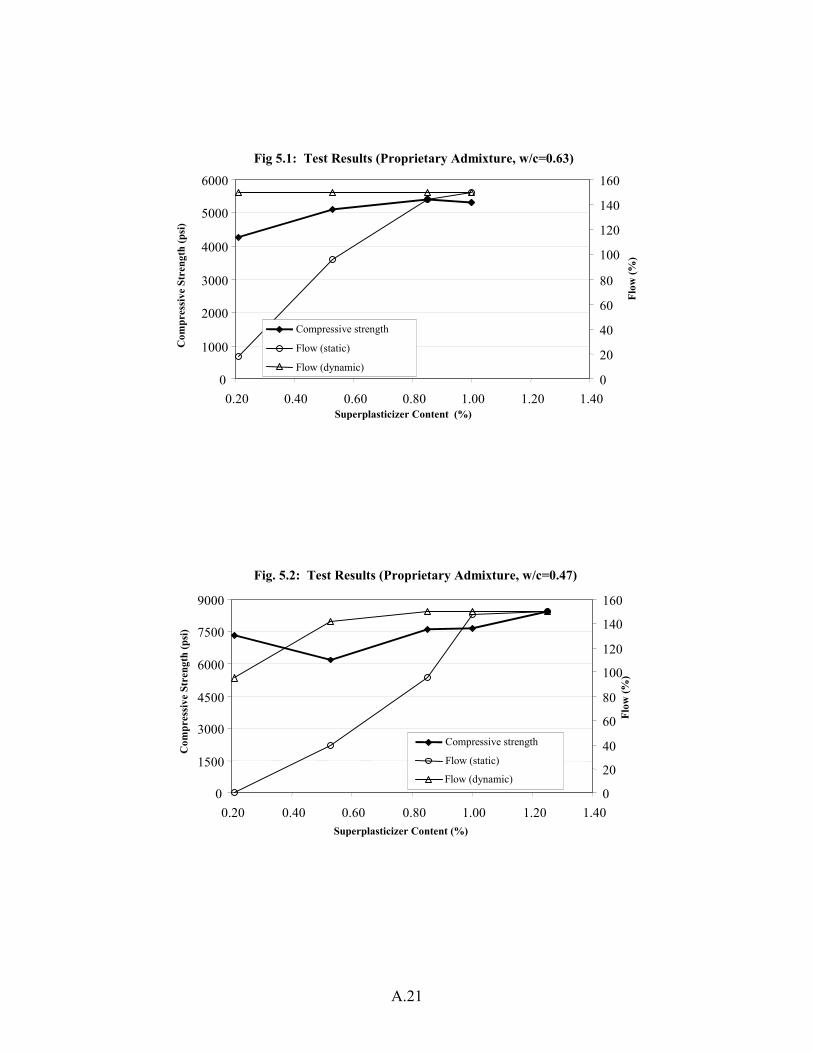
Test Description The purpose of this test was to determine the effect of a proprietary admixture and water-cement ratio on the flow table values and compressive strength of glascrete mortar. The amounts of glass aggregate, cement, and admixtures were the same for all batches. Two water-cement ratios were used: 0.63 and 0.47. MB VR was used at a fixed dosage of 0.16% of cement by weight. The ASR suppressing admixture was used as a substitute for cement at a level of 20% by weight. The flow table (ASTM C 230-97) values were determined using two methods: static free flow and dynamic values measured after 25 table drops (ASTM C109/C109M-98). Five different percentages of the proprietary admixture were studied to determine the optimum dosage: 0.21, 0.53, 0.85, 1.0, and 1.25% by weight of cementitious materials, except that for w/c = 0.63, the 1.25% dosage was found to be not necessary. The general process followed the ASTM C109/C109M-98 standard and mixing Procedure 1 as described in Test #2. Results and Discussion This test was conducted in continuation of our efforts to find a suitable plasticizer for blended cements that contain ASR suppressing powder. The flow table and compressive strength test results are summarized in Tables 5.1 and 5.2 and plotted in Figs. 5.1 and 5.2 for water-cement ratios of 0.63 and 0.47 of glass concrete mixes, respectively. The following observations can be made from these results:
1. As shown in Fig. 5.1 (w/c=0.63), 1% of the proprietary admixture gave a static flow value of 150%, i.e., a highly workable mix with excellent self-leveling characteristics. A dosage of 0.85% appears to have yielded the optimum strength and almost maximum flow, whereas for the 1% dosage the strength was slightly less.
2. The dynamic flow table results for w/c=0.63 reached the 150% maximum limit even with the lowest tested dosage of 0.21%.
3. For a water-cement ratio of 0.47, Fig 5.2, 1.25% of the admixture had to be added to achieve maximum static flow of 150%, whereas a 1% dosage almost reached this target value. Compressive strength, after a drop at 0.53%, increased gradually up to a maximum at 1.25%. Compared with Pozzolith 400N, the proprietary admixture gave consistently higher compressive strength results at much lower dosages.
4. The dynamic flow table values for the mix with w/c=0.47 increased with higher admixture dosage, reaching the maximum flow of 150% at a 0.85% level.
5. Specimen 49, made with w/c = 0.47 and 0.53% admixture gave slightly lower strength. Visual inspection revealed a high level of porosity and air bubbles due to the high viscosity of this batch.
One more study on superplasticizers will be conducted in order to conclude this investigation of their effect on blended cements that contain ASR suppressing powder admixture.
A.20
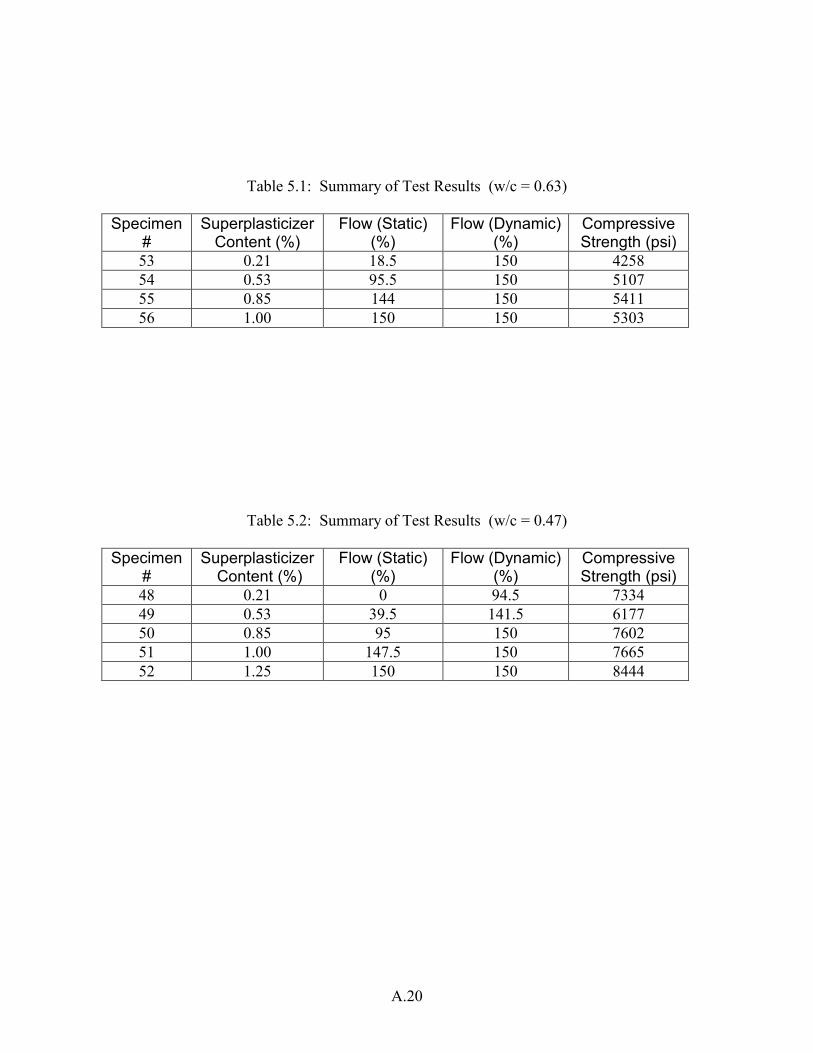
Table 5.1: Summary of Test Results (w/c = 0.63)
Specimen #
Superplasticizer Content (%)
Flow (Static) (%)
Flow (Dynamic) (%)
Compressive Strength (psi)
53 0.21 18.5 150 4258 54 0.53 95.5 150 5107 55 0.85 144 150 5411 56 1.00 150 150 5303
Table 5.2: Summary of Test Results (w/c = 0.47)
Specimen #
Superplasticizer Content (%)
Flow (Static) (%)
Flow (Dynamic)(%)
Compressive Strength (psi)
48 0.21 0 94.5 7334 49 0.53 39.5 141.5 6177 50 0.85 95 150 7602 51 1.00 147.5 150 7665 52 1.25 150 150 8444
A.21
Fig 5.1: Test Results (Proprietary Admixture, w/c=0.63)
0
1000
2000
3000
4000
5000
6000
0.20 0.40 0.60 0.80 1.00 1.20 1.40 Superplasticizer Content (%)
Com
pres
sive
Str
engt
h (p
si)
0
20
40
60
80
100
120
140
160
Flow
(%)
Compressive strength
Flow (static)
Flow (dynamic)
Fig. 5.2: Test Results (Proprietary Admixture, w/c=0.47)
0
1500
3000
4500
6000
7500
9000
0.20 0.40 0.60 0.80 1.00 1.20 1.40 Superplasticizer Content (%)
Com
pres
sive
Str
engt
h (p
si)
0
20
40
60
80
100
120
140
160
Flow
(%)
Compressive strength
Flow (static)
Flow (dynamic)
A.22
Test 6 : Effect of Superplasticizer and W/C Ratio on Flow and Compressive Strength - IV
Objective To determine the effect of Borem 900 LSL superplasticizer content and water-cement ratio of glascrete mortar on the flow table values and compressive strength. Materials Soda-lime glass aggregate passing #4 standard sieve. Portland cement ASTM Type III, supplied by Blue Circle, Inc. ASR suppressant: a proprietary powder admixture. MB VR, air-entraining admixture, manufactured by Master Builders Technologies, Inc. Borem 900 LSL, a high-range water-reducing admixture, manufactured by Borden & Remington Corp. Mix Design The mortar mixes were prepared according to ASTM C 109/C109M-98, using Procedure 1 as described in Test #2. W/C = 0.63 and 0.47, A/C = 1.72 All ASR suppressant material was added to the mix as cement replacement. Glass aggregate grading: same as in Test 1. Test Dates November 1998
A.23
Test Description The purpose of this test was to determine the effect of Borem 900 superplasticizer and water-cement ratio on the flow table values and compressive strength of glascrete mortar. The amounts of glass aggregate, cement, and admixtures were the same for all batches. Two water-cement ratios were used, 0.63 and 0.47. MB VR was used at a fixed dosage of 0.16% of cement by weight. The ASR suppressing powder admixture was used as a substitute for cement at a level of 20% by weight. The flow table (ASTM C 230-97) values were determined using two methods: the static free flow, and the dynamic values measured after 25 table drops (ASTM C109/C109M-98). Seven different percentages of Borem 900 were studied to determine the optimum dosage: 0.8, 1.0, 1.25, 1.5, 1.75, 1.95, and 2.19% by weight of cementitious materials, except that for w/c = 0.63, the two highest dosages were found to be not necessary. The general process followed the ASTM C109/C109M-98 standard and mixing Procedure 1 as described in Test #2. Results and Discussion This test was conducted in continuation of our earlier efforts to find a suitable plasticizer for blended cements that contain the ASR suppressing powder admixture. The superplasticizer studied was Borem 900, a naphthalene-based admixture. The flow table and compressive strength test results are summarized in Tables 6.1 and 6.2 and plotted in Figs. 6.1 and 6.2 for water-cement ratios of 0.63 and 0.47, respectively. The following observations can be made from these results:
1. As shown in Fig. 6.1 (w/c=0.63), the maximum static flow of 150% is obtained by adding at least 1.5% of Borem 900. That means, such a dosage gives a workable mix with excellent self-leveling characteristics. The compressive strength also appears to have reached its maximum.
2. The dynamic flow table results for w/c=0.63 reached the 150% maximum limit already with the lowest tested dosage of 0.8%.
3. For a water-cement ratio of 0.47, Fig 6.2, the maximum static flow of 150% was not reached, even with 2.19% of Borem 900. The compressive strength improved minimally beyond a level of 1.75% and reached a maximum at a 2.19% dosage. Borem 900 did not cause deterioration of strength at the highest dosage levels.
4. The dynamic flow table values for the mix with w/c=0.47 increased gradually up to 150% at the maximum dosage of 2.19%.
5. As observed in Test #5 with the proprietary admixture, specimens made with w/c = 0.47 showed a reduction in compressive strength for Borem 900 dosages of 1% through 1.5%. Visual inspection of those specimens revealed a high level of porosity and air bubbles due to high viscosity.
A.24
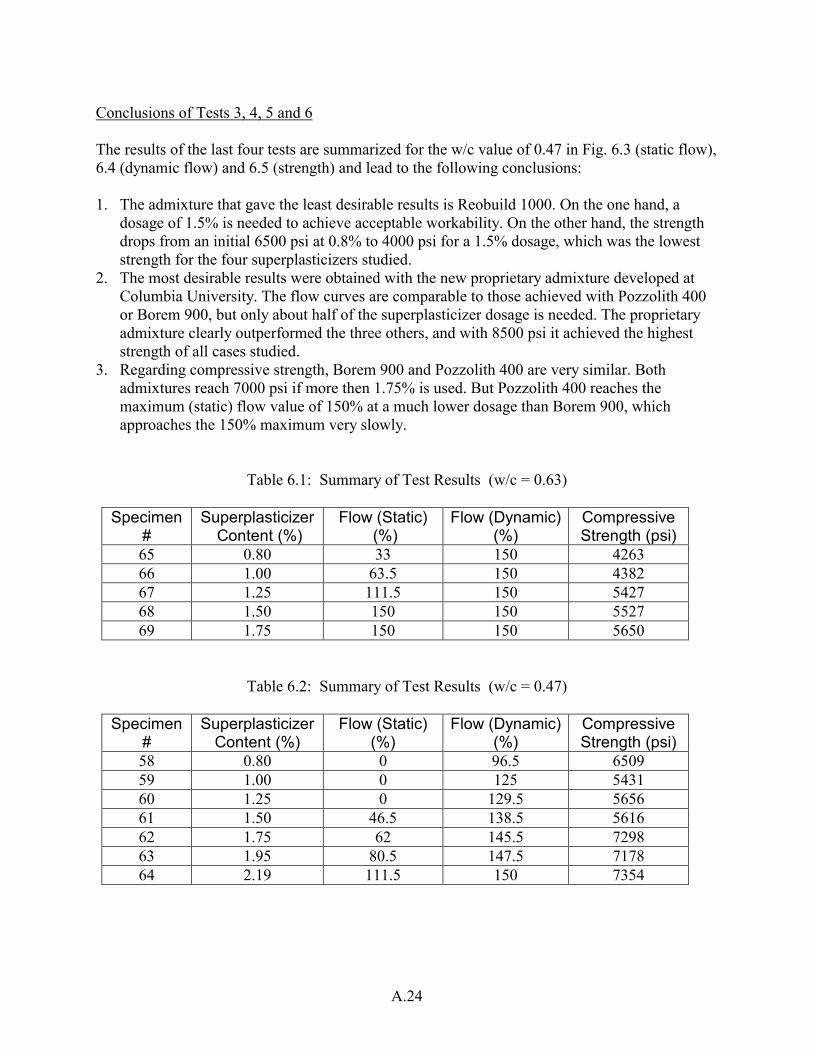
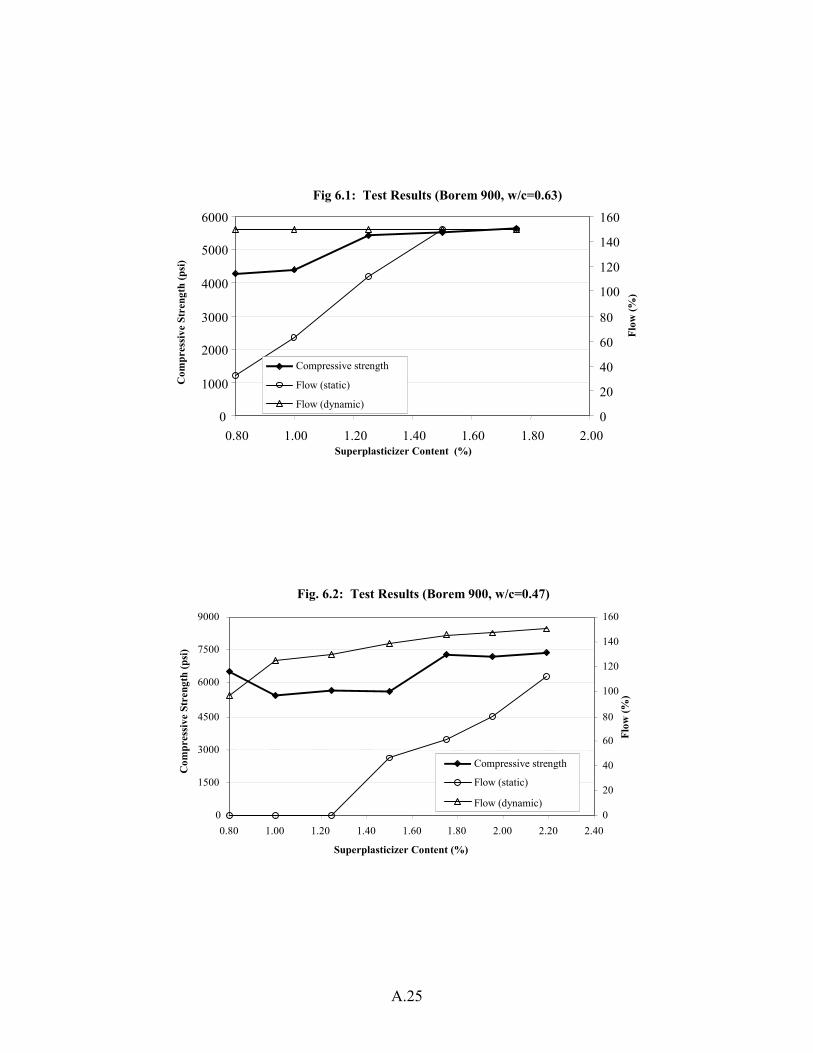
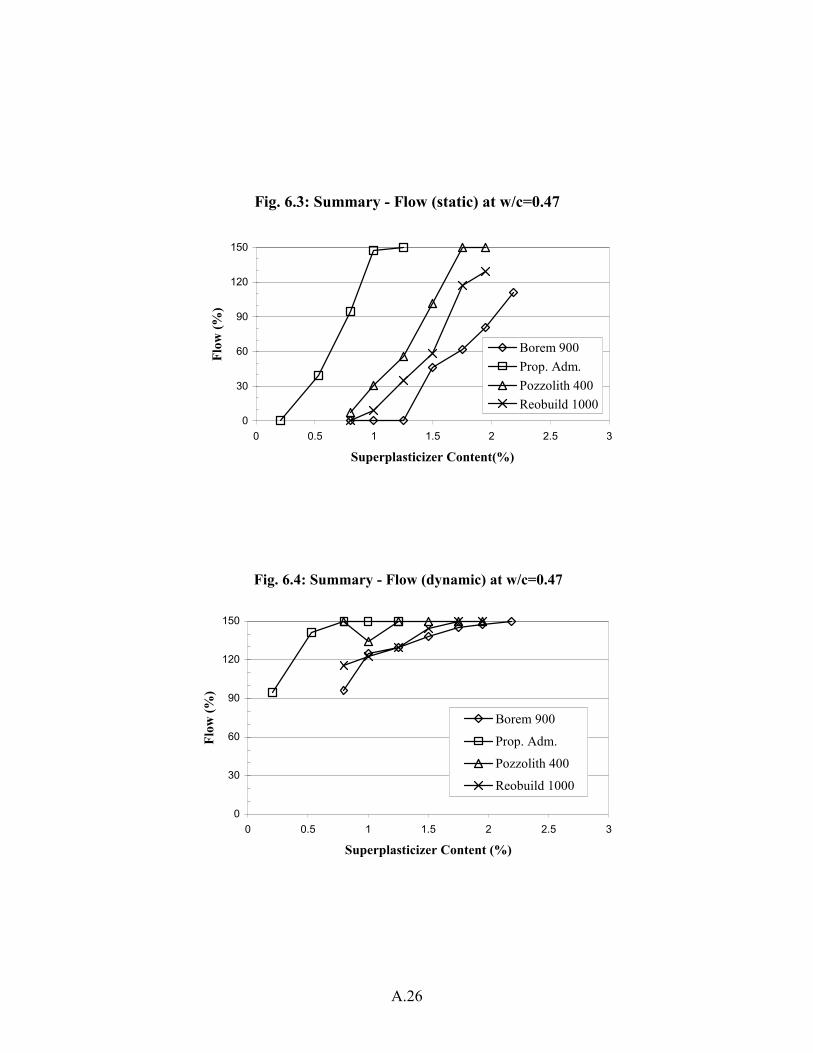
Conclusions of Tests 3, 4, 5 and 6 The results of the last four tests are summarized for the w/c value of 0.47 in Fig. 6.3 (static flow), 6.4 (dynamic flow) and 6.5 (strength) and lead to the following conclusions: 1. The admixture that gave the least desirable results is Reobuild 1000. On the one hand, a
dosage of 1.5% is needed to achieve acceptable workability. On the other hand, the strength drops from an initial 6500 psi at 0.8% to 4000 psi for a 1.5% dosage, which was the lowest strength for the four superplasticizers studied.
2. The most desirable results were obtained with the new proprietary admixture developed at Columbia University. The flow curves are comparable to those achieved with Pozzolith 400 or Borem 900, but only about half of the superplasticizer dosage is needed. The proprietary admixture clearly outperformed the three others, and with 8500 psi it achieved the highest strength of all cases studied.
3. Regarding compressive strength, Borem 900 and Pozzolith 400 are very similar. Both admixtures reach 7000 psi if more then 1.75% is used. But Pozzolith 400 reaches the maximum (static) flow value of 150% at a much lower dosage than Borem 900, which approaches the 150% maximum very slowly.
Table 6.1: Summary of Test Results (w/c = 0.63)
Specimen #
Superplasticizer Content (%)
Flow (Static) (%)
Flow (Dynamic) (%)
Compressive Strength (psi)
65 0.80 33 150 4263 66 1.00 63.5 150 4382 67 1.25 111.5 150 5427 68 1.50 150 150 5527 69 1.75 150 150 5650
Table 6.2: Summary of Test Results (w/c = 0.47)
Specimen #
Superplasticizer Content (%)
Flow (Static) (%)
Flow (Dynamic)(%)
Compressive Strength (psi)
58 0.80 0 96.5 6509 59 1.00 0 125 5431 60 1.25 0 129.5 5656 61 1.50 46.5 138.5 5616 62 1.75 62 145.5 7298 63 1.95 80.5 147.5 7178 64 2.19 111.5 150 7354
A.25
Fig 6.1: Test Results (Borem 900, w/c=0.63)
0
1000
2000
3000
4000
5000
6000
0.80 1.00 1.20 1.40 1.60 1.80 2.00 Superplasticizer Content (%)
Com
pres
sive
Str
engt
h (p
si)
0
20
40
60
80
100
120
140
160
Flow
(%)
Compressive strength
Flow (static)
Flow (dynamic)
Fig. 6.2: Test Results (Borem 900, w/c=0.47)
0
1500
3000
4500
6000
7500
9000
0.80 1.00 1.20 1.40 1.60 1.80 2.00 2.20 2.40 Superplasticizer Content (%)
Com
pres
sive
Str
engt
h (p
si)
0
20
40
60
80
100
120
140
160 Fl
ow (%
)
Compressive strength
Flow (static)
Flow (dynamic)
A.26
Fig. 6.3: Summary - Flow (static) at w/c=0.47
0
30
60
90
120
150
0 0.5 1 1.5 2 2.5 3
Superplasticizer Content(%)
Flow
(%)
Borem 900Prop. Adm.Pozzolith 400Reobuild 1000
Fig. 6.4: Summary - Flow (dynamic) at w/c=0.47
0
30
60
90
120
150
0 0.5 1 1.5 2 2.5 3
Superplasticizer Content (%)
Flow
(%)
Borem 900
Prop. Adm.
Pozzolith 400
Reobuild 1000
A.27
Fig. 6.5: Summary - Strength at w/c=0.47
0100020003000400050006000700080009000
0 0.5 1 1.5 2 2.5
Superplasticizer Content (%)
Stre
ngth
(Psi)
Borem 900Prop. Adm.Pozzolith 400Reobuild 1000
A.28
Test 7 : Unit Weight of Glass Concrete With High Fiber Content
Objective To determine the unit weight of glass concrete incorporating a high volume fraction of recycled fiber. Materials Soda-lime glass aggregate passing #4 standard sieve. Portland cement ASTM Type III, supplied by Blue Circle, Inc. ASR suppressant: a proprietary powder admixture. Fiber: recycled nylon carpet fiber supplied by DuPont recycling facility, Chattanooga, TN MB VR, air-entraining admixture, manufactured by Master Builders Technologies, Inc. Pozzolith 400N, a high-range water-reducing admixture, manufactured by Master Builders Technologies, Inc. A proprietary high-range water-reducing admixture. Mix Design The mortar mixes were prepared according to ASTM C 109/C109M-98, using Procedures 1 and 2 as described in Test #2. W/C = 0.63 and 0.47, A/C = 1.72 All ASR suppressant material was added to the mix as cement replacement. Glass aggregate grading: same as in Test 1. Test Dates December 1998
A.29
Test Description It is well documented in the literature that lightweight concrete possesses excellent thermal resistance properties. The micro air voids generated by either a foaming agent or created by using single-sized aggregates serve as thermal breaks and slow the heat transfer through the concrete. But weight density also correlates with compressive strength; therefore, very lightweight concretes are largely limited to nonstructural applications. It was the purpose of this test to explore whether the strong correlation between weight density and thermal resistance can be exploited to predict thermal performance of concrete reinforced with recycled carpet fibers. Hollow-core nylon carpet fibers, if added at the right volume fraction, might have similar effects as an air-entraining agent. The purpose of this test was to examine the effect of recycled nylon fiber on the unit weight of glass concrete. Three different batches were made. All batches contained the same amounts of glass aggregate, cement, ASR suppressing powder, and water, as well as air-entraining agent MB VR at a fixed dosage of 0.16%. The ASR suppressing powder admixture was used as a substitute for cement at a level of 20% by weight. Batch one was the regular glass concrete mix, with mix proportions similar to the Kistner concrete mix, the workability and strength properties of which have been documented in earlier test reports. The batch was made with Pozzolith 400N superplasticizer. Batches two and three were glass concrete mixes containing a proprietary admixture at a dosage of 1.25% by weight of cement. Recycled nylon fibers were used for both batches at a volume fraction of 5%. This is the maximum volume fraction that can be added without severely affecting workability. The general process followed the ASTM C109/C109M-98 standard mixing Procedure 1 for batch two (glass concrete I) and Procedure 2 for batch three (glass concrete II) as described in Test 2. The primary characteristics of the three batches are summarized in Table 7.1. The three batches were molded into 3-inch cylinders and were cured for one week at 100% relative humidity before testing. Unit weight was determined as outlined in ASTM C12 for all specimens. The specimens were dried at 80 0C until the difference between two subsequent readings was less than 0.3%. The specimen volumes were determined using the standard measurement procedure and also by submerging specimens in water, after applying a suitable concrete polymer sealer. Unit weights were determined by dividing the weight of the specimen in air by either the volume based on standard measurement or by the volume based on submersion in water. Results and Discussion Test results are summarized in Table 7.2. The following observations can be made from these results: 1. Density determinations are fairly similar, whether based on standard measurement or on the
water submersion method. The differences are less than 2%. 2. The method of mixing had virtually no effect on the densities of glass concrete specimens.
A.30
3. The density of glass concrete containing 5% recycled nylon fiber was basically the same as that of glass concrete without fiber.
Conclusion It appears to be impossible to make predictions regarding thermal properties based on the unit weight method. The measurements were inconclusive and therefore ineffective in gauging the beneficial effect of recycled nylon fibers. Therefore, a method based on thermal measurements needs be used to assess the thermal performance of glass concrete reinforced with recycled nylon fiber.
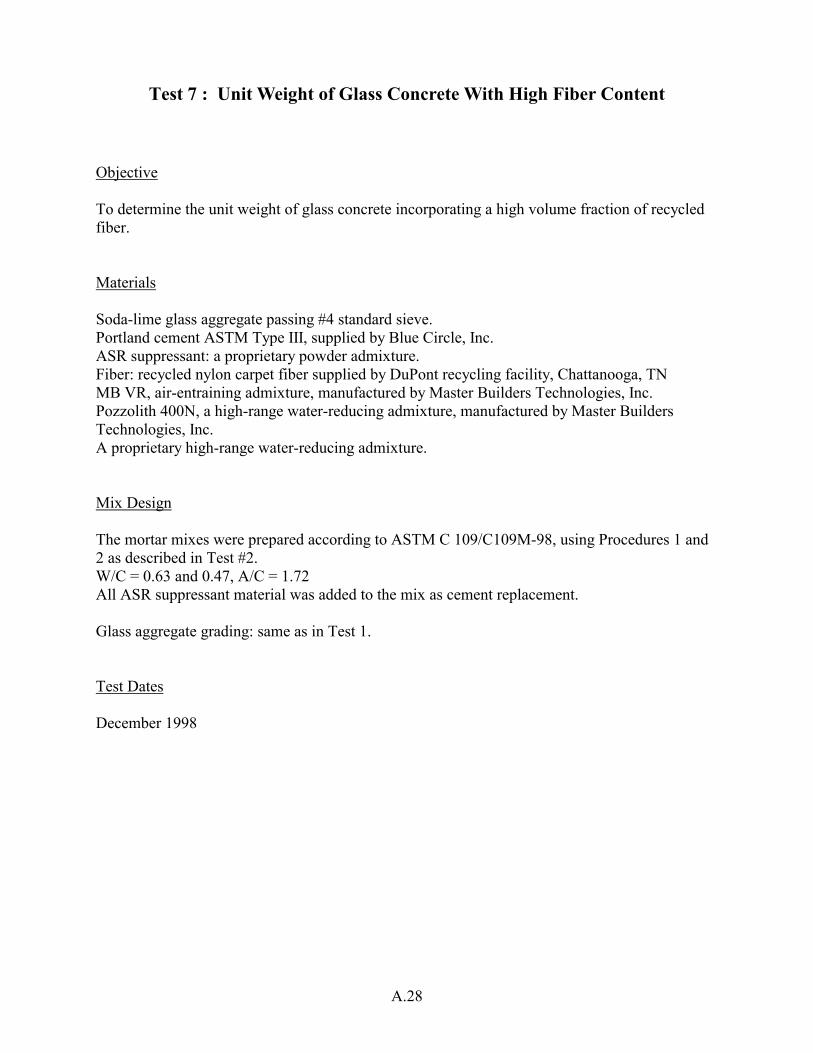
Table 7.1: Summary of Test Batches
Batch
Mixing Procedure
Superplasti-cizer
Aggregate Type
Cement Fiber
Glass Concrete Reference
I Pozzolith 400N
Glass aggregate
Portland Type I + ASR powder
0%
Glass Concrete I
I Proprietary Admixture
Glass aggregate
Portland Type I + ASR powder
5%
Glass Concrete II
II Proprietary Admixture
Glass aggregate
Portland Type I + ASR powder
5%
Table 7.2: Summary of Test Results
Batch Standard Measurement Test
Volume Density (cm3) (g/cm3)
Water Submersion Test
Volume Density (cm3) (g/cm3)
Deviation
(%)
Glass Concrete Reference
673.32
1.85
661.20
1.88
1.61
Glass
Concrete I
684.34
1.87
679.20
1.88
0.53
Glass
Concrete II
681.60
1.82
674.83
1.83
0.55
A.31
Test 8 : Effect of A New Admixture on ASR Expansion
Objective To study the effect of a new proprietary admixture on ASR expansion of glascrete specimens. Materials Green soda-lime glass aggregate passing #4 standard sieve. Portland cement ASTM Type I. ASR suppressants: 1. A proprietary powder admixture. 2. New proprietary admixture (PA). MB VR, air-entraining admixture, manufactured by Master Builders Technologies, Inc. Pozzolith 400N, a high-range water-reducing admixture, manufactured by Master Builders Technologies, Inc. Pozzolith 322-N, stabilizing concrete admixture, manufactured by Master Builders Technologies, Inc. Mix Design The mortar bars were prepared according to ASTM C1260 (except for the aggregate grading). W/C = 0.47, A/C = 1.75 ASR suppressant material was added to the mix as cement replacement (20%). Glass aggregate grading: same as in Test 1. Testing Dates March 1999
A.32
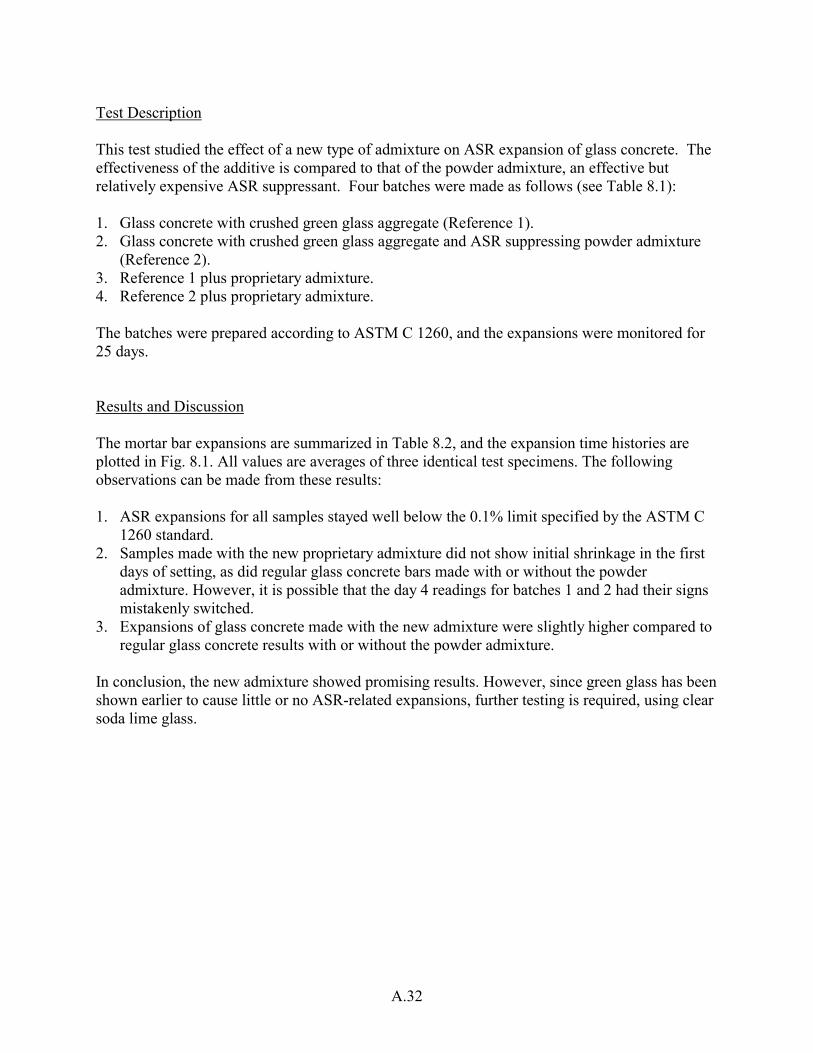
Test Description This test studied the effect of a new type of admixture on ASR expansion of glass concrete. The effectiveness of the additive is compared to that of the powder admixture, an effective but relatively expensive ASR suppressant. Four batches were made as follows (see Table 8.1): 1. Glass concrete with crushed green glass aggregate (Reference 1). 2. Glass concrete with crushed green glass aggregate and ASR suppressing powder admixture
(Reference 2). 3. Reference 1 plus proprietary admixture. 4. Reference 2 plus proprietary admixture. The batches were prepared according to ASTM C 1260, and the expansions were monitored for 25 days. Results and Discussion The mortar bar expansions are summarized in Table 8.2, and the expansion time histories are plotted in Fig. 8.1. All values are averages of three identical test specimens. The following observations can be made from these results: 1. ASR expansions for all samples stayed well below the 0.1% limit specified by the ASTM C
1260 standard. 2. Samples made with the new proprietary admixture did not show initial shrinkage in the first
days of setting, as did regular glass concrete bars made with or without the powder admixture. However, it is possible that the day 4 readings for batches 1 and 2 had their signs mistakenly switched.
3. Expansions of glass concrete made with the new admixture were slightly higher compared to regular glass concrete results with or without the powder admixture.
In conclusion, the new admixture showed promising results. However, since green glass has been shown earlier to cause little or no ASR-related expansions, further testing is required, using clear soda lime glass.
A.33
Table 8.1: Summary of Mortar Bar Mixes Batch No.
Description Aggregate Cementitious material Additional ASR suppressant
1 Reference 1 100% green glass
100% Portland cement ----
2 Reference 2
100% green glass
80%Portland cement + 20% ASR powder admixture
----
3 Reference 1 plus proprietary admixture
100% green glass
Portland cement Proprietary admixture
4 Reference 2 plus proprietary admixture
100% green glass
80% Portland cement + 20% ASR powder admixture
Proprietary admixture
Table 8.2: Summary of Mortar Bar Expansions (%)
Age (Days) Batch #1 Batch #2 Batch #3 Batch #4
2 0.000 0.0000 0.0000 0.0000 4 -0.0136 -0.0138 0.0216 0.0172 5 0.0084 0.0156 0.0228 0.0216 7 0.0132 0.0192 0.0264 0.0240 8 0.0144 0.0208 0.0254 0.0264 11 0.0128 0.0240 0.0272 0.0288 12 0.0144 0.0219 0.0268 0.0272 14 0.0204 0.0331 0.0334 0.0380 18 0.0172 0.0307 0.0316 0.0372 21 0.0200 0.0331 0.0334 0.0380 25 0.0268 0.0384 0.0368 0.0382
A.34
Fig. 8.1: Mortar Bar Expansion Test Results
-0.06
-0.04
-0.02
0
0.02
0.04
0.06
0 5 10 15 20 25 30DaysEx
pans
ion
(%)
Batch 1
Batch 2
Batch 3
Batch 4
A.35
Test 9 : Test Method for Thermal Performance of Concrete
Objective To develop a non-standard test method for evaluating the thermal performance of material in general and glass concrete incorporating recycled carpet fibers in particular. Materials Soda-lime glass aggregate passing #4 standard sieve. Portland cement ASTM Type III, supplied by Blue Circle, Inc. ASR suppressant: a proprietary powder admixture. Fiber: recycled nylon carpet fiber supplied by DuPont recycling facility, Chattanooga, TN. MB VR, air-entraining admixture, manufactured by Master Builders Technologies, Inc. A proprietary high-range water-reducing admixture. Equipment Electric oven with maximum temperature of 1000 ºC at an 80% efficiency, model HDT-5210 with window opening of 4x3 inches., manufactured by Basic Products Corporation. Thermocouples type K (Chromel Alumel), digital thermometer (Omega Temp), and switch control, all manufactured by Omega Engineering, Inc. Mix Design The mortar mixes were prepared according to ASTM C 109/C109M-98, using Procedure 1 as described in Test #2. W/C = 0.47, A/C = 1.75 ASR suppressant material was added to the mix as cement replacement Glass aggregate grading: same as in Test 1. Test Dates April 1999
A.36
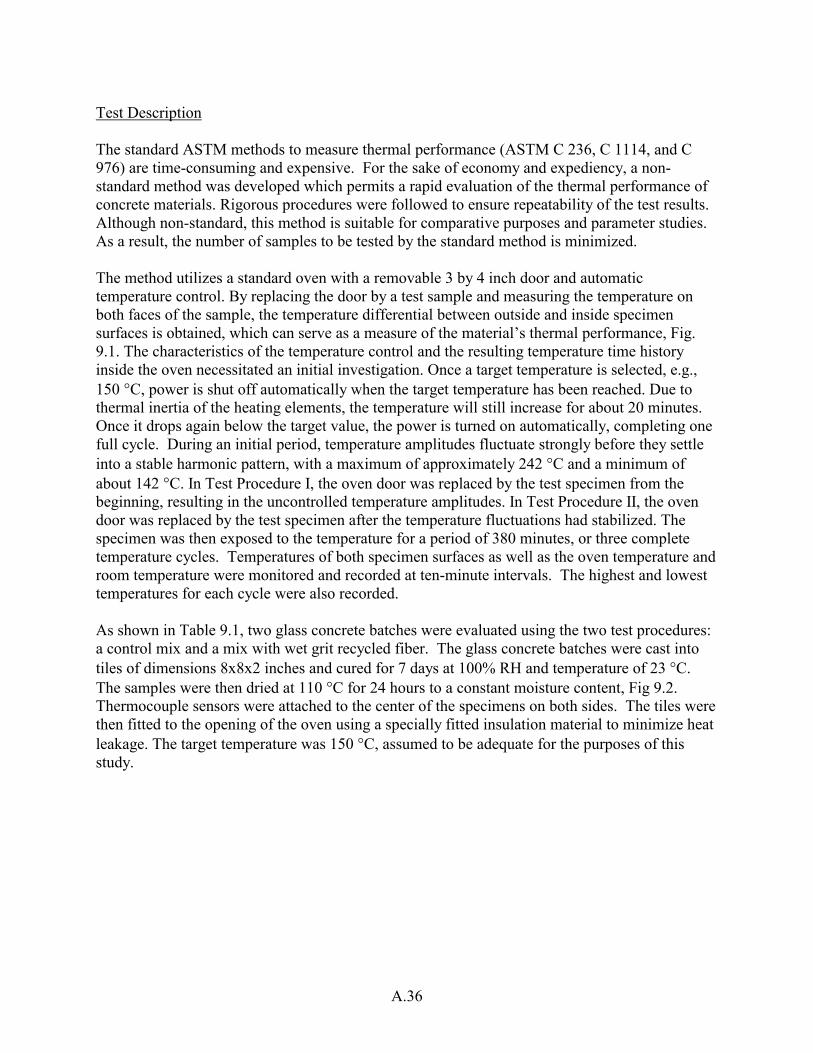
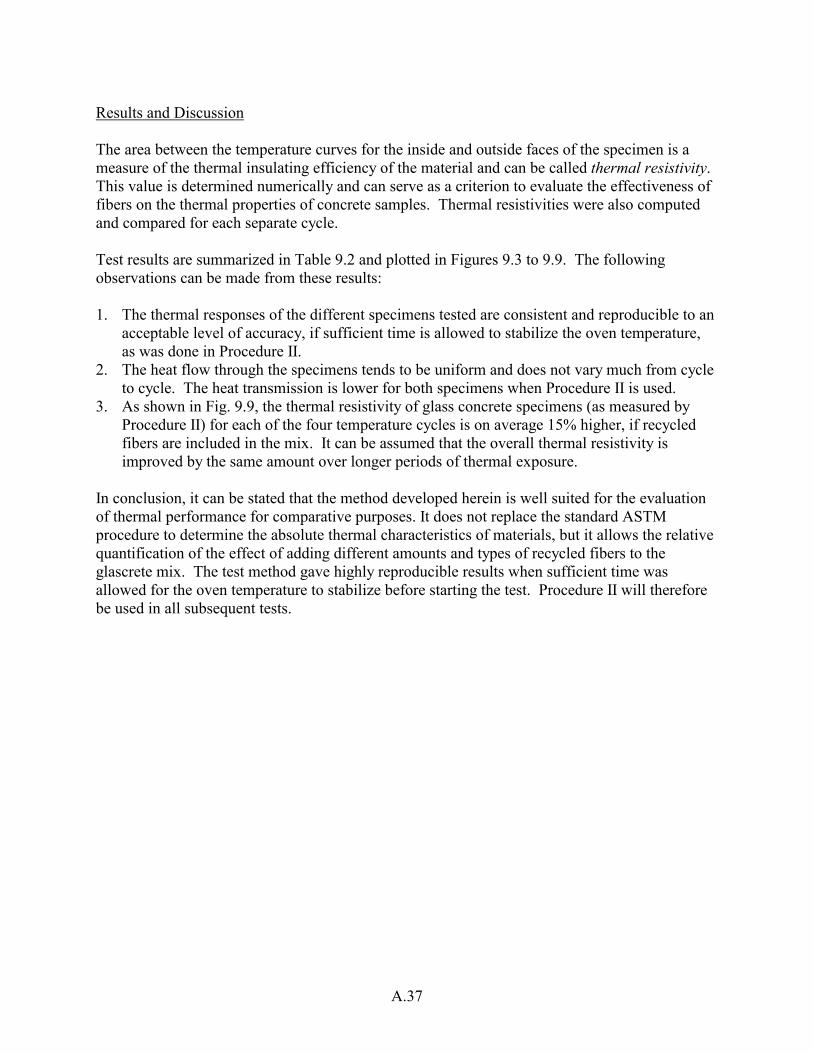
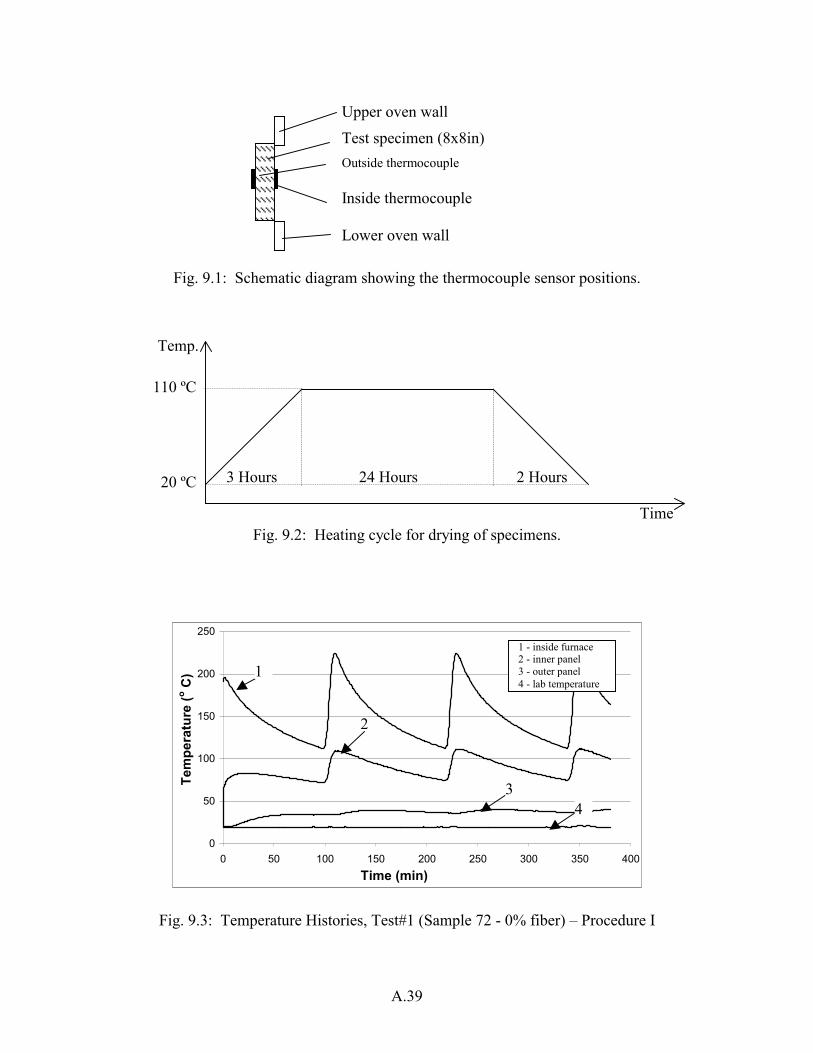
Test Description The standard ASTM methods to measure thermal performance (ASTM C 236, C 1114, and C 976) are time-consuming and expensive. For the sake of economy and expediency, a non-standard method was developed which permits a rapid evaluation of the thermal performance of concrete materials. Rigorous procedures were followed to ensure repeatability of the test results. Although non-standard, this method is suitable for comparative purposes and parameter studies. As a result, the number of samples to be tested by the standard method is minimized. The method utilizes a standard oven with a removable 3 by 4 inch door and automatic temperature control. By replacing the door by a test sample and measuring the temperature on both faces of the sample, the temperature differential between outside and inside specimen surfaces is obtained, which can serve as a measure of the material’s thermal performance, Fig. 9.1. The characteristics of the temperature control and the resulting temperature time history inside the oven necessitated an initial investigation. Once a target temperature is selected, e.g., 150 °C, power is shut off automatically when the target temperature has been reached. Due to thermal inertia of the heating elements, the temperature will still increase for about 20 minutes. Once it drops again below the target value, the power is turned on automatically, completing one full cycle. During an initial period, temperature amplitudes fluctuate strongly before they settle into a stable harmonic pattern, with a maximum of approximately 242 °C and a minimum of about 142 °C. In Test Procedure I, the oven door was replaced by the test specimen from the beginning, resulting in the uncontrolled temperature amplitudes. In Test Procedure II, the oven door was replaced by the test specimen after the temperature fluctuations had stabilized. The specimen was then exposed to the temperature for a period of 380 minutes, or three complete temperature cycles. Temperatures of both specimen surfaces as well as the oven temperature and room temperature were monitored and recorded at ten-minute intervals. The highest and lowest temperatures for each cycle were also recorded. As shown in Table 9.1, two glass concrete batches were evaluated using the two test procedures: a control mix and a mix with wet grit recycled fiber. The glass concrete batches were cast into tiles of dimensions 8x8x2 inches and cured for 7 days at 100% RH and temperature of 23 °C. The samples were then dried at 110 °C for 24 hours to a constant moisture content, Fig 9.2. Thermocouple sensors were attached to the center of the specimens on both sides. The tiles were then fitted to the opening of the oven using a specially fitted insulation material to minimize heat leakage. The target temperature was 150 °C, assumed to be adequate for the purposes of this study.
A.37
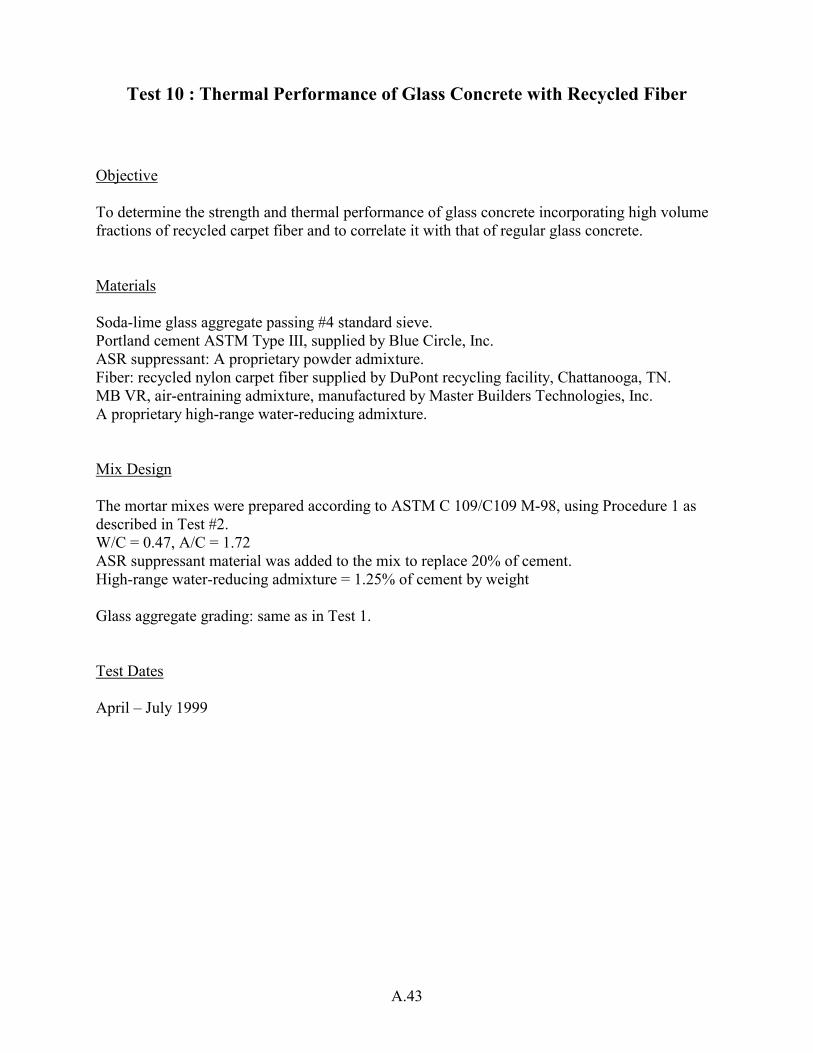
Results and Discussion The area between the temperature curves for the inside and outside faces of the specimen is a measure of the thermal insulating efficiency of the material and can be called thermal resistivity. This value is determined numerically and can serve as a criterion to evaluate the effectiveness of fibers on the thermal properties of concrete samples. Thermal resistivities were also computed and compared for each separate cycle. Test results are summarized in Table 9.2 and plotted in Figures 9.3 to 9.9. The following observations can be made from these results: 1. The thermal responses of the different specimens tested are consistent and reproducible to an
acceptable level of accuracy, if sufficient time is allowed to stabilize the oven temperature, as was done in Procedure II.
2. The heat flow through the specimens tends to be uniform and does not vary much from cycle to cycle. The heat transmission is lower for both specimens when Procedure II is used.
3. As shown in Fig. 9.9, the thermal resistivity of glass concrete specimens (as measured by Procedure II) for each of the four temperature cycles is on average 15% higher, if recycled fibers are included in the mix. It can be assumed that the overall thermal resistivity is improved by the same amount over longer periods of thermal exposure.
In conclusion, it can be stated that the method developed herein is well suited for the evaluation of thermal performance for comparative purposes. It does not replace the standard ASTM procedure to determine the absolute thermal characteristics of materials, but it allows the relative quantification of the effect of adding different amounts and types of recycled fibers to the glascrete mix. The test method gave highly reproducible results when sufficient time was allowed for the oven temperature to stabilize before starting the test. Procedure II will therefore be used in all subsequent tests.
A.38
Table 9.1: Summary of Glass Concrete Batches
Test #
Specimen #
Aggregate Type
Cement Composition
Super-plasticizer
Type
Fiber Type Fiber (%)
Test Proc.
1 I
2
72
Glass
aggregate
Portland Type I + ASR
powder
Proprietary Admixture
----
0
II
3 I
4
77
Glass
aggregate
Portland Type I + ASR
powder
Proprietary Admixture
Recycled Grit (mixed fiber) - ¼”
10 II
Table 9.2: Summary of Thermal Resistivity Results (Area between inside and outside surface temperature curves)
Test #
Specimen #
Procedure First Cycle
Second Cycle
Third Cycle
Fourth Cycle
Total
1
I 3355 3220 3140 3065 12780
2
72
II 2380 2690 2730 2720 10520
3 I 3520 3295 3280 3200 13295
4
77 II 2760 3105 3115 3040 12020
A.39
Fig. 9.1: Schematic diagram showing the thermocouple sensor positions.
Fig. 9.2: Heating cycle for drying of specimens.
0
50
100
150
200
250
0 50 100 150 200 250 300 350 400Time (min)
Tem
pera
ture
(o C)
Fig. 9.3: Temperature Histories, Test#1 (Sample 72 - 0% fiber) – Procedure I
110 ºC
Upper oven wall
Test specimen (8x8in) Outside thermocouple Inside thermocouple Lower oven wall
20 ºC 3 Hours 24 Hours 2 Hours
Temp.
Time
1 - inside furnace 2 - inner panel 3 - outer panel 4 - lab temperature
1
2
34
A.40
0
50
100
150
200
250
300
0:00 1:12 2:24 3:36 4:48 6:00 7:12Time (h:m)
Tem
pera
ture
(0C
)
Outside Face
Inside Face
Oven Indicator - Test#2
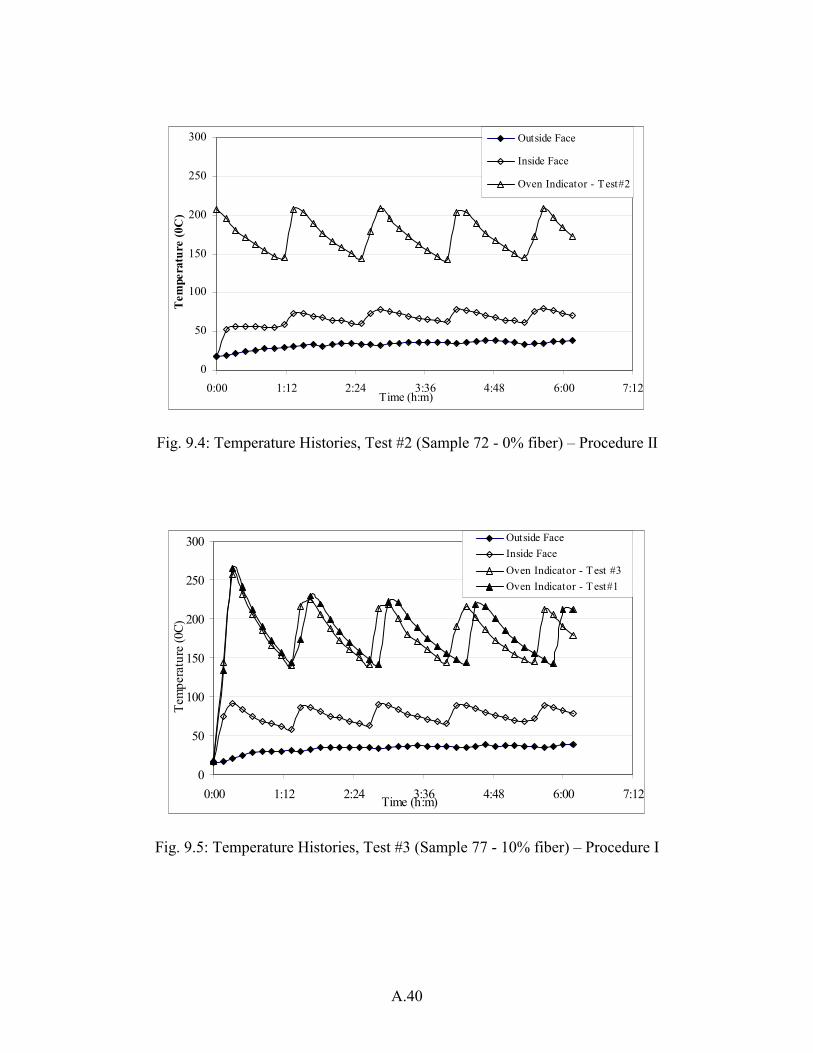
Fig. 9.4: Temperature Histories, Test #2 (Sample 72 - 0% fiber) – Procedure II
0
50
100
150
200
250
300
0:00 1:12 2:24 3:36 4:48 6:00 7:12Time (h:m)
Tem
pera
ture
(0C)
Outside FaceInside FaceOven Indicator - Test #3Oven Indicator - Test#1
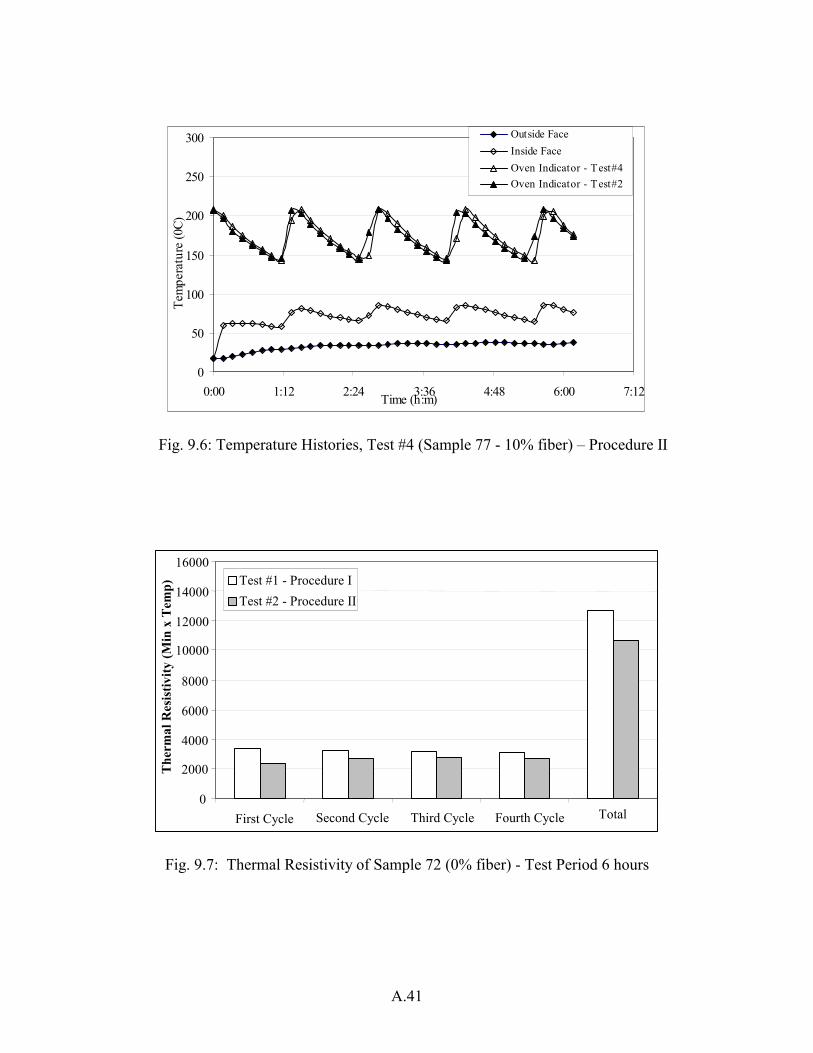
Fig. 9.5: Temperature Histories, Test #3 (Sample 77 - 10% fiber) – Procedure I
A.41
0
50
100
150
200
250
300
0:00 1:12 2:24 3:36 4:48 6:00 7:12Time (h:m)
Tem
pera
ture
(0C)
Outside FaceInside FaceOven Indicator - Test#4Oven Indicator - Test#2
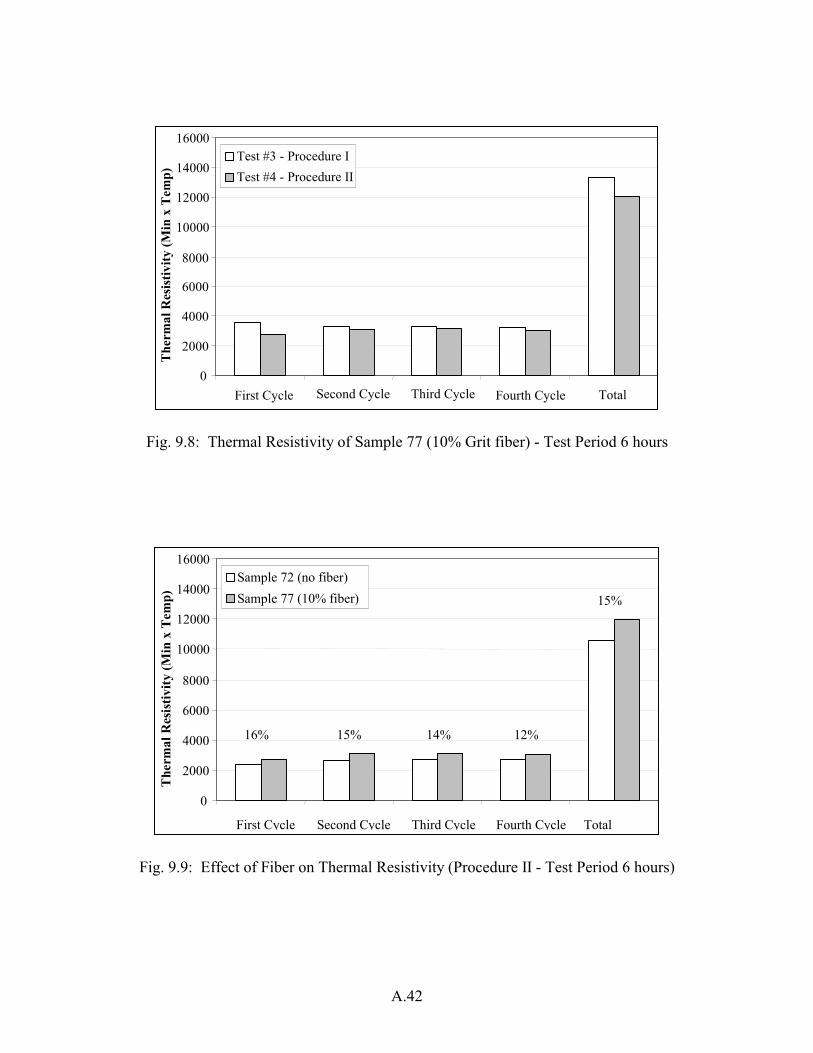
Fig. 9.6: Temperature Histories, Test #4 (Sample 77 - 10% fiber) – Procedure II
0
2000
4000
6000
8000
10000
12000
14000
16000
First Cycle Second Cycle Third Cycle Fourth Cycle Total
The
rmal
Res
istiv
ity (M
in x
Tem
p) Test #1 - Procedure I
Test #2 - Procedure II
Fig. 9.7: Thermal Resistivity of Sample 72 (0% fiber) - Test Period 6 hours
A.42
0
2000
4000
6000
8000
10000
12000
14000
16000
First Cycle Second Cycle Third Cycle Fourth Cycle Total
The
rmal
Res
istiv
ity (M
in x
Tem
p)Test #3 - Procedure ITest #4 - Procedure II
Fig. 9.8: Thermal Resistivity of Sample 77 (10% Grit fiber) - Test Period 6 hours
0
2000
4000
6000
8000
10000
12000
14000
16000
First Cycle Second Cycle Third Cycle Fourth Cycle Total
The
rmal
Res
istiv
ity (M
in x
Tem
p)
Sample 72 (no fiber)Sample 77 (10% fiber)
16% 15% 14% 12%
15%
Fig. 9.9: Effect of Fiber on Thermal Resistivity (Procedure II - Test Period 6 hours)
A.43
Test 10 : Thermal Performance of Glass Concrete with Recycled Fiber
Objective To determine the strength and thermal performance of glass concrete incorporating high volume fractions of recycled carpet fiber and to correlate it with that of regular glass concrete. Materials Soda-lime glass aggregate passing #4 standard sieve. Portland cement ASTM Type III, supplied by Blue Circle, Inc. ASR suppressant: A proprietary powder admixture. Fiber: recycled nylon carpet fiber supplied by DuPont recycling facility, Chattanooga, TN. MB VR, air-entraining admixture, manufactured by Master Builders Technologies, Inc. A proprietary high-range water-reducing admixture. Mix Design The mortar mixes were prepared according to ASTM C 109/C109 M-98, using Procedure 1 as described in Test #2. W/C = 0.47, A/C = 1.72 ASR suppressant material was added to the mix to replace 20% of cement. High-range water-reducing admixture = 1.25% of cement by weight Glass aggregate grading: same as in Test 1. Test Dates April – July 1999
A.44
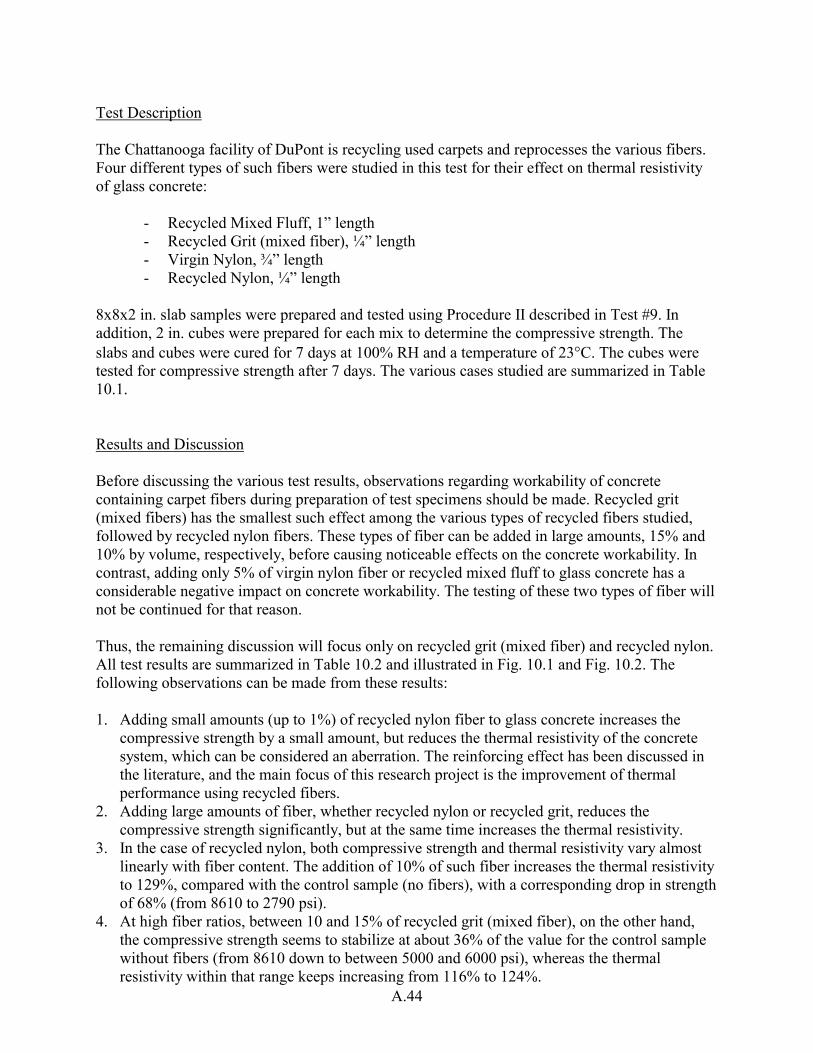
Test Description The Chattanooga facility of DuPont is recycling used carpets and reprocesses the various fibers. Four different types of such fibers were studied in this test for their effect on thermal resistivity of glass concrete:
- Recycled Mixed Fluff, 1” length - Recycled Grit (mixed fiber), ¼” length - Virgin Nylon, ¾” length - Recycled Nylon, ¼” length
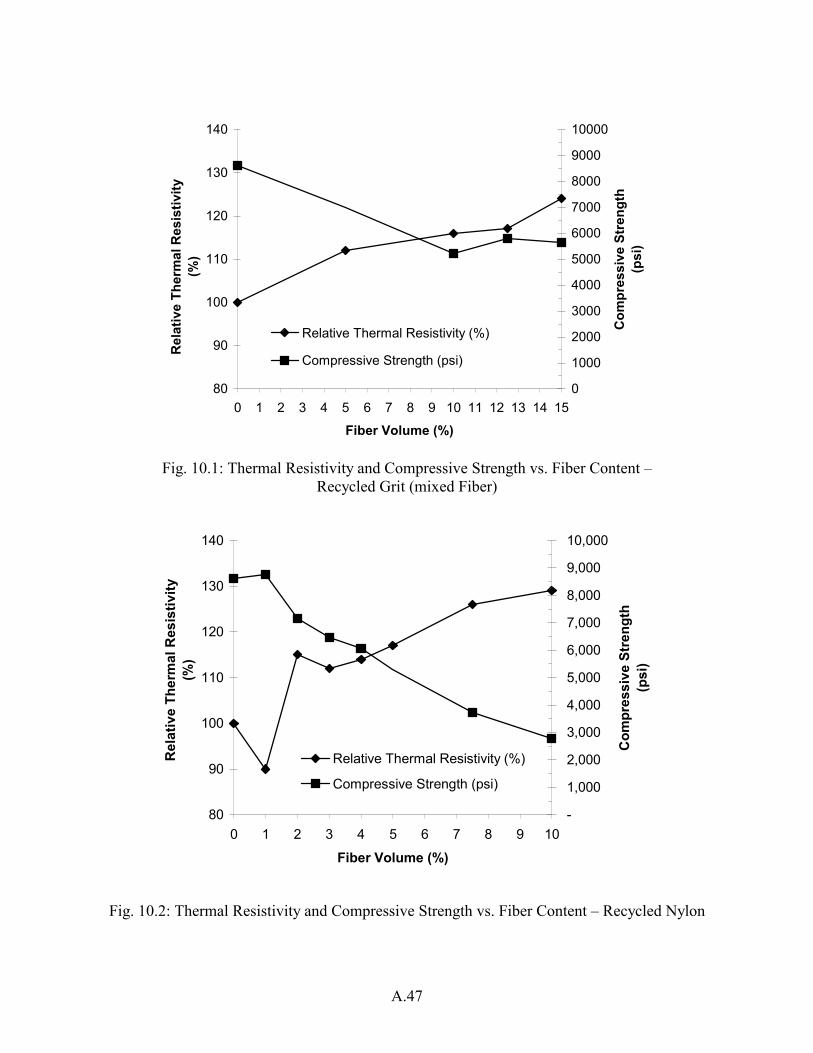
8x8x2 in. slab samples were prepared and tested using Procedure II described in Test #9. In addition, 2 in. cubes were prepared for each mix to determine the compressive strength. The slabs and cubes were cured for 7 days at 100% RH and a temperature of 23°C. The cubes were tested for compressive strength after 7 days. The various cases studied are summarized in Table 10.1. Results and Discussion Before discussing the various test results, observations regarding workability of concrete containing carpet fibers during preparation of test specimens should be made. Recycled grit (mixed fibers) has the smallest such effect among the various types of recycled fibers studied, followed by recycled nylon fibers. These types of fiber can be added in large amounts, 15% and 10% by volume, respectively, before causing noticeable effects on the concrete workability. In contrast, adding only 5% of virgin nylon fiber or recycled mixed fluff to glass concrete has a considerable negative impact on concrete workability. The testing of these two types of fiber will not be continued for that reason. Thus, the remaining discussion will focus only on recycled grit (mixed fiber) and recycled nylon. All test results are summarized in Table 10.2 and illustrated in Fig. 10.1 and Fig. 10.2. The following observations can be made from these results: 1. Adding small amounts (up to 1%) of recycled nylon fiber to glass concrete increases the
compressive strength by a small amount, but reduces the thermal resistivity of the concrete system, which can be considered an aberration. The reinforcing effect has been discussed in the literature, and the main focus of this research project is the improvement of thermal performance using recycled fibers.
2. Adding large amounts of fiber, whether recycled nylon or recycled grit, reduces the compressive strength significantly, but at the same time increases the thermal resistivity.
3. In the case of recycled nylon, both compressive strength and thermal resistivity vary almost linearly with fiber content. The addition of 10% of such fiber increases the thermal resistivity to 129%, compared with the control sample (no fibers), with a corresponding drop in strength of 68% (from 8610 to 2790 psi).
4. At high fiber ratios, between 10 and 15% of recycled grit (mixed fiber), on the other hand, the compressive strength seems to stabilize at about 36% of the value for the control sample without fibers (from 8610 down to between 5000 and 6000 psi), whereas the thermal resistivity within that range keeps increasing from 116% to 124%.
A.45
Although not the primary focus of this test, further improvements of thermal resistivity were achieved by combining the use of fibers with an aerated cement matrix. In order to explore this possibility, foaming admixtures were added to two test specimens with extraordinary results. Samples 89 and 87 show increases of thermal performance of 54% and 45%, respectively. However, the foaming admixtures lowered the compressive strength to almost 10% of the value for the reference mix. Further experiments are needed to evaluate the suitability of such foaming agents. Conclusion In summary, carpet fibers can be added to concrete to increase its thermal performance, but at the cost of greatly reduced strength. If strength is not overly important, improvements of thermal resistivity of up to 29% can be achieved (with 10% nylon fiber), compared with the reference mix, without excessive loss of workability. The use of 15% of recycled grit improved the thermal resistivity by 24% with much less loss in strength as experienced with the recycled nylon fiber.
Table 10.1: Summary of Glass Concrete Batches
Specimen No. Fiber Type Fiber Volume (%)
72 Reference 0 73 Recycled Mixed Fluff-1" 5 74 Recycled Grit (mixed fiber) 5 75 Recycled Nylon -¼" 5 76 Virgin Nylon - ¾” 5 77 Recycled Grit (mixed fiber) 10 78 Recycled Nylon- ¼” 4 79 Recycled Nylon- ¼” 3 80 Recycled Nylon- ¼” 2 81 Recycled Nylon- ¼” 1 82 Recycled Grit (mixed fiber) 12.5 83 Recycled Grit (mixed fiber) 15 86 Recycled Nylon- ¼” 10 87 *1Recycled Grit (mixed fiber) 10 88 Recycled Nylon- ¼” 7.5 89 *2Recycled Nylon- ¼” 5
*1 contains an experimental type NW Foam Admixture *2 contains an experimental type L Foam Admixture
A.46
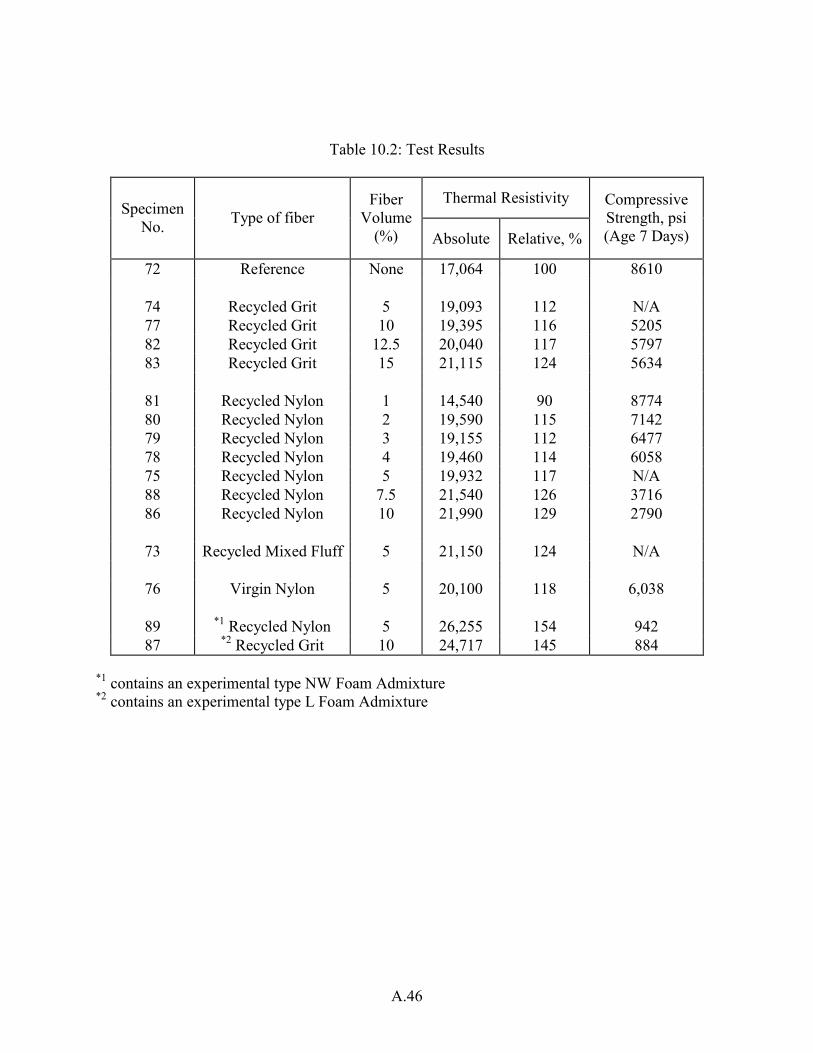
Table 10.2: Test Results
Thermal Resistivity Specimen
No. Type of fiber Fiber
Volume (%) Absolute Relative, %
Compressive Strength, psi (Age 7 Days)
72 Reference None 17,064 100 8610
74 Recycled Grit 5 19,093 112 N/A 77 Recycled Grit 10 19,395 116 5205 82 Recycled Grit 12.5 20,040 117 5797 83 Recycled Grit 15 21,115 124 5634
81 Recycled Nylon 1 14,540 90 8774 80 Recycled Nylon 2 19,590 115 7142 79 Recycled Nylon 3 19,155 112 6477 78 Recycled Nylon 4 19,460 114 6058 75 Recycled Nylon 5 19,932 117 N/A 88 Recycled Nylon 7.5 21,540 126 3716 86 Recycled Nylon 10 21,990 129 2790
73 Recycled Mixed Fluff 5 21,150 124 N/A
76 Virgin Nylon 5 20,100 118 6,038
89 *1 Recycled Nylon 5 26,255 154 942 87 *2 Recycled Grit 10 24,717 145 884
*1 contains an experimental type NW Foam Admixture *2 contains an experimental type L Foam Admixture
A.47
80
90
100
110
120
130
140
0 1 2 3 4 5 6 7 8 9 10 11 12 13 14 15
Fiber Volume (%)
Rel
ativ
e Th
erm
al R
esis
tivity
(%)
0
1000
2000
3000
4000
5000
6000
7000
8000
9000
10000
Com
pres
sive
Str
engt
h(p
si)
Relative Thermal Resistivity (%)
Compressive Strength (psi)
Fig. 10.1: Thermal Resistivity and Compressive Strength vs. Fiber Content –
Recycled Grit (mixed Fiber)
80
90
100
110
120
130
140
0 1 2 3 4 5 6 7 8 9 10
Fiber Volume (%)
Rel
ativ
e Th
erm
al R
esis
tivity
(%)
-
1,000
2,000
3,000
4,000
5,000
6,000
7,000
8,000
9,000
10,000
Com
pres
sive
Str
engt
h(p
si)
Relative Thermal Resistivity (%)
Compressive Strength (psi)
Fig. 10.2: Thermal Resistivity and Compressive Strength vs. Fiber Content – Recycled Nylon
A.48
Test 11 : Influence of Foaming Agents on Thermal Performance of Glass Concrete with Recycled Fiber
Objective To determine the thermal performance of glass concrete with different volume fractions of recycled fiber, to correlate it with that of regular glass concrete, and to study the influence of quantity and type of a foaming agent on the strength and thermal performance of a concrete with an aerated cement-based matrix. Materials Soda-lime glass aggregate passing #4 standard sieve. Crushed stone aggregate, size 3/8, obtained from Kistner Concrete Products. Portland cement ASTM Type III, supplied by Blue Circle, Inc. ASR suppressant: a proprietary powder admixture. Recycled nylon fibers, ¼” length, supplied by DuPont recycling facility, Chattanooga, TN. Recycled mixed fibers, ¼” length, supplied by DuPont recycling facility, Chattanooga, TN. Proprietary foaming agents, types “S” and “N”. Proprietary high-range water-reducing admixture. Mix Design The mortar mixes were prepared according to ASTM C 109/C109 M-98, using Procedure 1 as described in Test #2. W/C = 0.3 to 0.63, A/C = 1.72 ASR suppressant material was added to mix to replace 20% of cement. High-range water-reducing admixture = 1.25% of cement by weight Glass aggregate grading: same as in Test 1. Test Dates August – October 1999
A.49
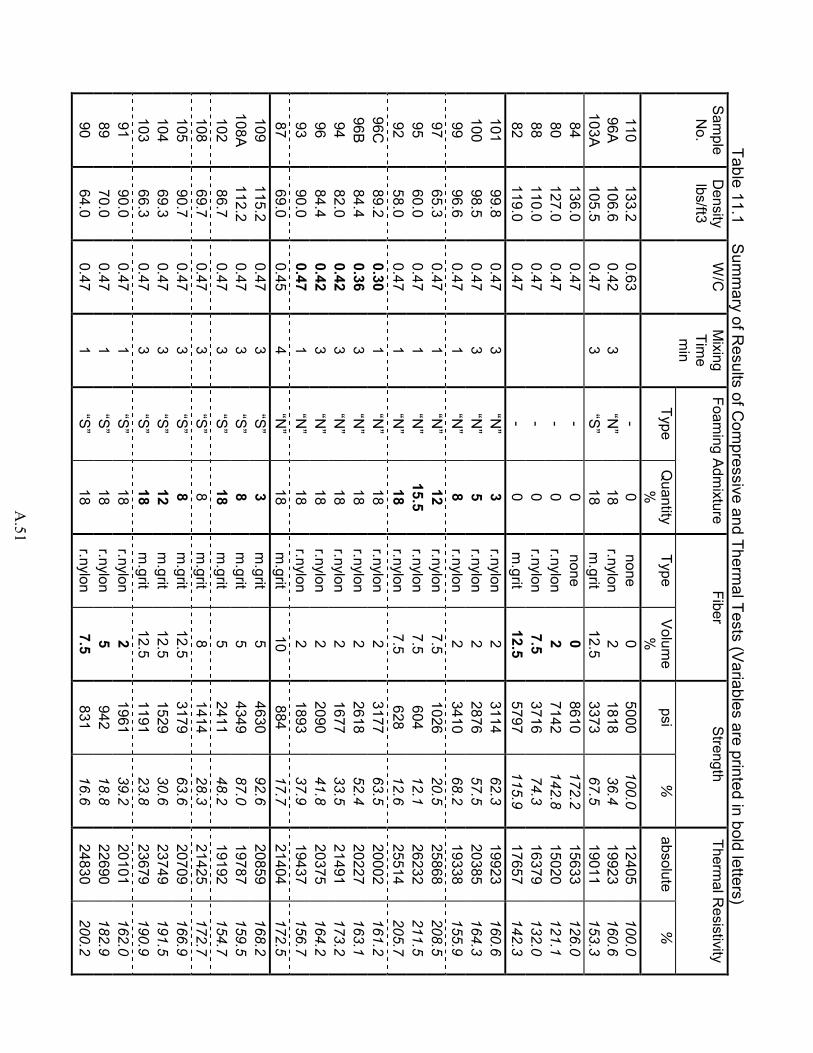
Test Description Concrete samples were made containing various amounts of two different fibers (recycled nylon and mixed grit) and two different foaming agents (types “S” and “N”) as summarized in Table 11.1. For each mix, 6 cubes of dimensions 2x2x2 inch were prepared for compressive strength tests, and one tile of dimensions 8x8x2 inch to determine thermal resistivity. All specimens were cured for 7 days at temperature 23°C and relative humidity 50-60 %. Compressive strength tests were performed after 7 and 28 days. Tests of the thermal resistivity were performed as described in Test 9, with the difference that a new measuring device was introduced. An OMEGA HH611PL4C Logging Thermometer was used to automatically take four independent temperature readings once every minute. Temperatures were measured inside the furnace and of the inner and outer surfaces of the sample. The fourth channel recorded the room temperature. After 380 minutes, the collected data was downloaded to a personal computer and processed using standard spreadsheet software. By taking advantage of the much higher data resolution, a more accurate determination of thermal resistivity was possible than before. Thermal performances of previously tested samples 80, 82, 84, 88 (see Test 10) were evaluated again using the new procedure to serve as references for samples of the present test series and to determine the effect of the added foam agents. The basic reference for all specimens was sample 110, which is the concrete mix used by the Kistner Company for basement wall panels. Results and Discussion All test results are summarized in Table 11.1 and plotted in Figs. 11.1 through 11.6. To facilitate an analysis of these data, the values of the parameters being studied are printed in bold face in Table 11.1. Compressive Strength Results 1. The strong inverse correlation between strength and w/c-ratio is confirmed by comparing
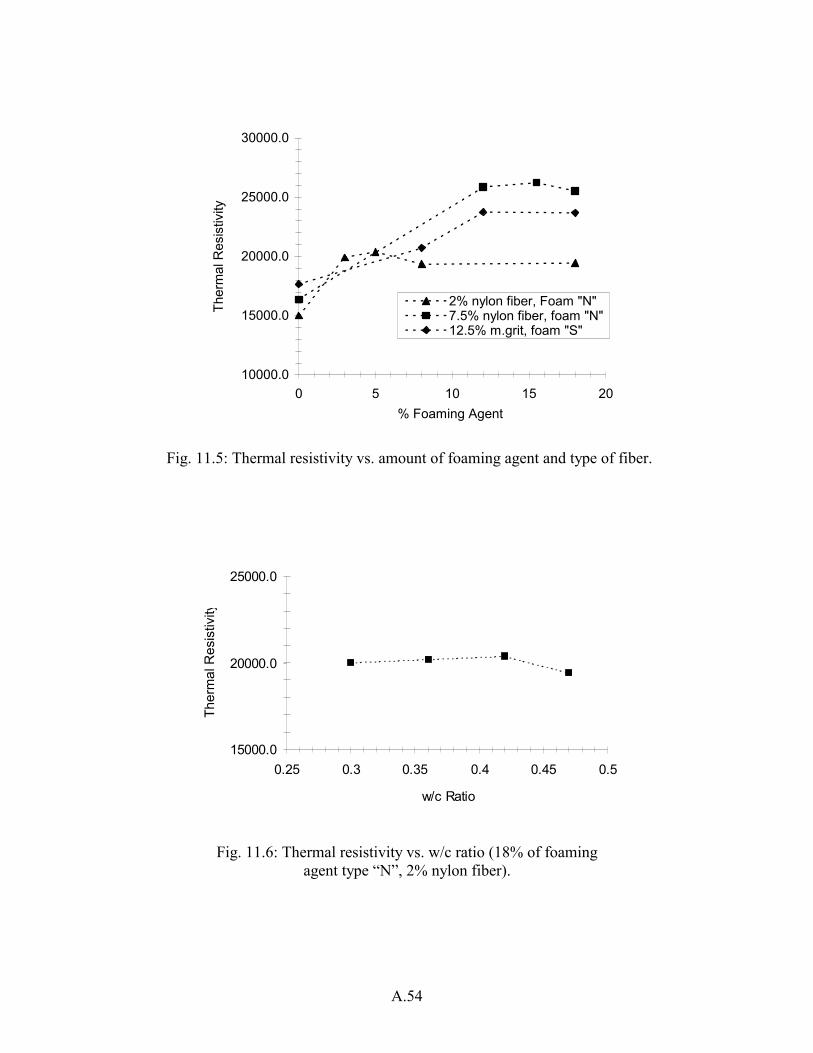
samples 110 and 84, both of which contained neither fiber nor a foaming agent. It also applies in the presence of 2% nylon fiber and 18% of foaming agent type “N”, as illustrated in Fig. 11.3 (samples 96C, 96B, 96, 93). The results are also affected by mixing times. The strength results for samples 94 and 96 are quite different, although all mix variables were identical. Because the exceptionally low result for sample 94 does not fit the general trend, it should be considered an aberration.
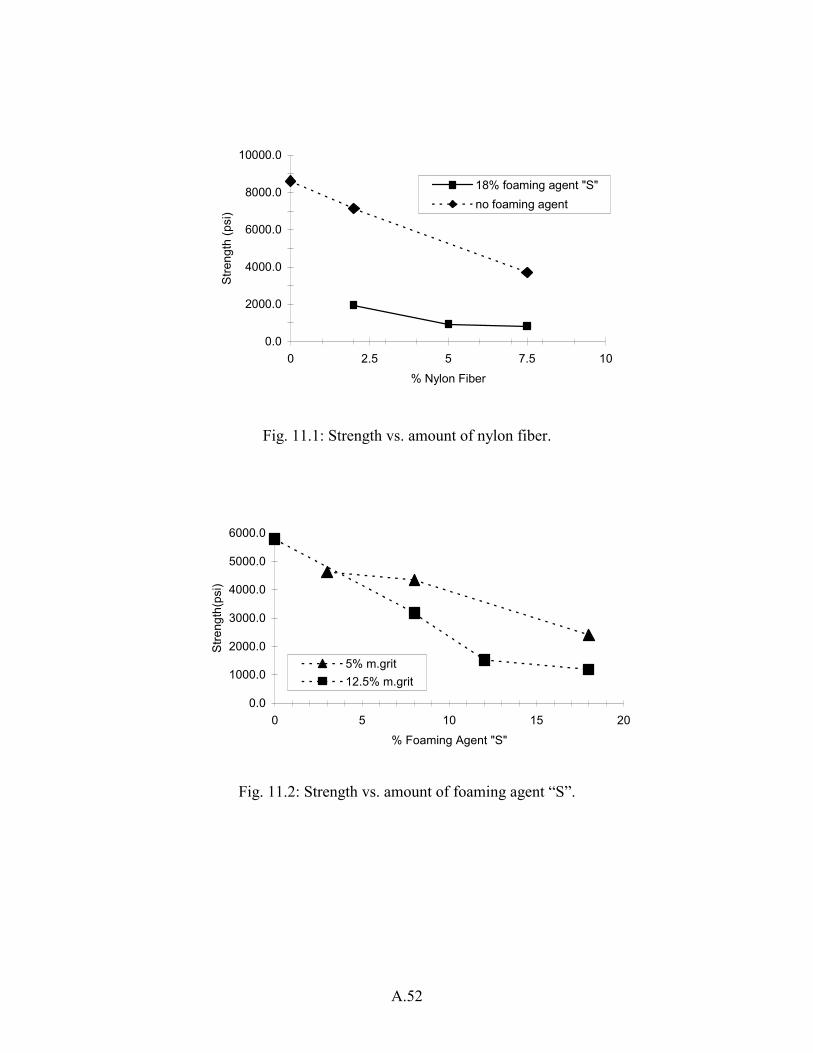
2. The results of Fig 11.1 confirm the known fact that strength decreases with increasing fiber content (see also Test 10).
3. The addition of 18% of foaming agent “S” lowers the concrete strength considerably (compare samples 91, 89, 90 with samples 80 and 88, and see Fig. 11.1).
A.50
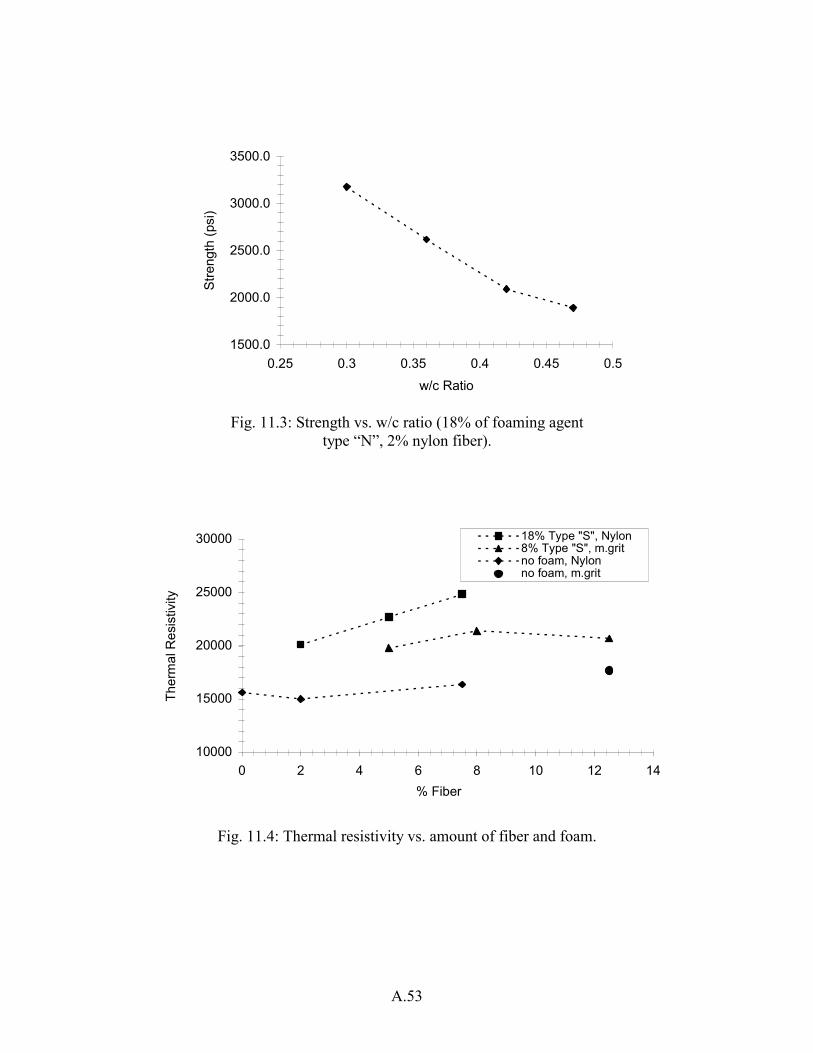
4. It is well known that strength decreases with increasing porosity, such as that produced by a foaming agent. Fig.11.2 illustrates the strength drop in the presence of 5% mixed grit fibers (samples 109, 108A, 102) as well as 12.5% mixed grit fibers (samples 105, 104, 103).
Thermal Resistivity Results 1. The thermal resistivities cover a considerable range, from a low of 121% (sample 80) to a
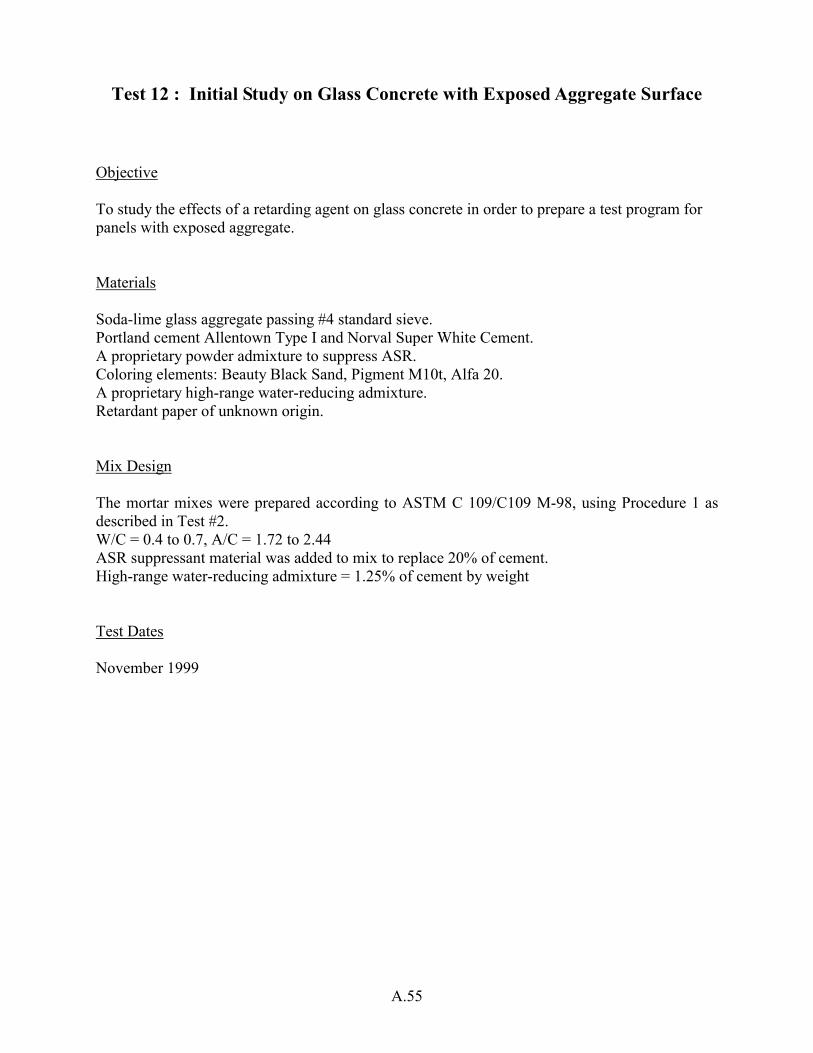
high of 211% (sample 95), compared with the reference Kistner mix (sample 110). 2. The influence of fiber volume is illustrated in Fig 11.4, for three different volumes of foam
agent “S”. With one exception (sample 105), thermal resistivity increases with fiber content and volume of foam agent “S”. Also, the reference sample 84 (no foam, no fiber) defies the trend, but only by a small amount.
3. In Fig. 11.5, the same results are replotted, with the foaming agent dosage replacing the fiber volume as the variable plotted on the horizontal axis. Again, the beneficial effect of both fiber and foaming agent is apparent. But the effectiveness of fibers appears to decrease in mixes with large amounts of foaming agent.
4. It was observed that mixes with more than 15% foaming agent had a very high flow, and the thermal resistivity started to decrease.
5. Comparing sample 90 with 92, and 91 with 93, indicates that, all other variables being equal, the two different foaming agents improve thermal resistivity by approximately the same amount.
6. The w/c ratio has very little influence on the thermal resistivity. Fig. 11.6 shows the results of four samples which vary only in their w/c ratio, with the amount of nylon fiber held constant at 2% and the amount of foaming agent “N” at 18%.
Conclusion As a compromise between strength and thermal resistivity, the most promising result was achieved by specimen 109. Compared with the reference material (the Kistner mix, specimen 110), it exhibited an increase of thermal resistivity of 68%, while experiencing a strength drop of only 7.4%. This result was achieved with combining 3% foam agent “S” and 5% mixed grit fiber.
A.51
Table 11.1 S
umm
ary of Results of C
ompressive and Therm
al Tests (Variables are printed in bold letters)
Sample
No.
Density
lbs/ft3 W
/C
Mixing
Time
min
Foaming Adm
ixture Fiber
Strength Therm
al Resistivity
Type Q
uantity %
Type
Volume
%
psi %
absolute
%
110 133.2
0.63
- 0
none 0
5000 100.0
12405 100.0
96A 106.6
0.42 3
“N”
18 r.nylon
2 1818
36.4 19923
160.6 103A
105.5 0.47
3 “S”
18 m
.grit 12.5
3373 67.5
19011 153.3
84 136.0
0.47
- 0
none 0
8610 172.2
15633 126.0
80 127.0
0.47
- 0
r.nylon 2
7142 142.8
15020 121.1
88 110.0
0.47
- 0
r.nylon 7.5
3716 74.3
16379 132.0
82 119.0
0.47
- 0
m.grit
12.5 5797
115.9 17657
142.3 101
99.8 0.47
3 “N
” 3
r.nylon 2
3114 62.3
19923 160.6
100 98.5
0.47 3
“N”
5 r.nylon
2 2876
57.5 20385
164.3 99
96.6 0.47
1 “N
” 8
r.nylon 2
3410 68.2
19338 155.9
97 65.3
0.47 1
“N”
12 r.nylon
7.5 1026
20.5 25868
208.5 95
60.0 0.47
1 “N
” 15.5
r.nylon 7.5
604 12.1
26232 211.5
92 58.0
0.47 1
“N”
18 r.nylon
7.5 628
12.6 25514
205.7 96C
89.2
0.30 1
“N”
18 r.nylon
2 3177
63.5 20002
161.2 96B
84.4 0.36
3 “N
” 18
r.nylon 2
2618 52.4
20227 163.1
94 82.0
0.42 3
“N”
18 r.nylon
2 1677
33.5 21491
173.2 96
84.4 0.42
3 “N
” 18
r.nylon 2
2090 41.8
20375 164.2
93 90.0
0.47 1
“N”
18 r.nylon
2 1893
37.9 19437
156.7 87
69.0 0.45
4 “N
” 18
m.grit
10 884
17.7 21404
172.5 109
115.2 0.47
3 “S”
3 m
.grit 5
4630 92.6
20859 168.2
108A 112.2
0.47 3
“S” 8
m.grit
5 4349
87.0 19787
159.5 102
86.7 0.47
3 “S”
18 m
.grit 5
2411 48.2
19192 154.7
108 69.7
0.47 3
“S” 8
m.grit
8 1414
28.3 21425
172.7 105
90.7 0.47
3 “S”
8 m
.grit 12.5
3179 63.6
20709 166.9
104 69.3
0.47 3
“S” 12
m.grit
12.5 1529
30.6 23749
191.5 103
66.3 0.47
3 “S”
18 m
.grit 12.5
1191 23.8
23679 190.9
91 90.0
0.47 1
“S” 18
r.nylon 2
1961 39.2
20101 162.0
89 70.0
0.47 1
“S” 18
r.nylon 5
942 18.8
22690 182.9
90 64.0
0.47 1
“S” 18
r.nylon 7.5
831 16.6
24830 200.2
A.52
0.0
2000.0
4000.0
6000.0
8000.0
10000.0
0 2.5 5 7.5 10
% Nylon Fiber
Stre
ngth
(psi
)
18% foaming agent "S"no foaming agent
Fig. 11.1: Strength vs. amount of nylon fiber.
0.0
1000.0
2000.0
3000.0
4000.0
5000.0
6000.0
0 5 10 15 20
% Foaming Agent "S"
Stre
ngth
(psi
)
5% m.grit12.5% m.grit
Fig. 11.2: Strength vs. amount of foaming agent “S”.
A.53
1500.0
2000.0
2500.0
3000.0
3500.0
0.25 0.3 0.35 0.4 0.45 0.5
w/c Ratio
Stre
ngth
(psi
)
Fig. 11.3: Strength vs. w/c ratio (18% of foaming agent
type “N”, 2% nylon fiber).
10000
15000
20000
25000
30000
0 2 4 6 8 10 12 14% Fiber
Ther
mal
Res
istiv
ity
18% Type "S", Nylon8% Type "S", m.gritno foam, Nylonno foam, m.grit
Fig. 11.4: Thermal resistivity vs. amount of fiber and foam.
A.54
10000.0
15000.0
20000.0
25000.0
30000.0
0 5 10 15 20% Foaming Agent
Ther
mal
Res
istiv
ity
2% nylon fiber, Foam "N"7.5% nylon fiber, foam "N"12.5% m.grit, foam "S"
Fig. 11.5: Thermal resistivity vs. amount of foaming agent and type of fiber.
15000.0
20000.0
25000.0
0.25 0.3 0.35 0.4 0.45 0.5
w/c Ratio
Ther
mal
Res
istiv
ity
Fig. 11.6: Thermal resistivity vs. w/c ratio (18% of foaming agent type “N”, 2% nylon fiber).
A.55
Test 12 : Initial Study on Glass Concrete with Exposed Aggregate Surface Objective To study the effects of a retarding agent on glass concrete in order to prepare a test program for panels with exposed aggregate. Materials Soda-lime glass aggregate passing #4 standard sieve. Portland cement Allentown Type I and Norval Super White Cement. A proprietary powder admixture to suppress ASR. Coloring elements: Beauty Black Sand, Pigment M10t, Alfa 20. A proprietary high-range water-reducing admixture. Retardant paper of unknown origin. Mix Design The mortar mixes were prepared according to ASTM C 109/C109 M-98, using Procedure 1 as described in Test #2. W/C = 0.4 to 0.7, A/C = 1.72 to 2.44 ASR suppressant material was added to mix to replace 20% of cement. High-range water-reducing admixture = 1.25% of cement by weight Test Dates November 1999
A.56
Introduction It was one of the objectives of this research project to develop architectural concrete panels for façade elements with crushed waste glass as aggregate. The aim is to provide an architect, for example, with a spectrum of possibilities to chose from, so he may develop detailed specifications for texture and color scheme of the architectural concrete surfaces. Among the means to produce exposed aggregate surfaces, retarding agents have been in use in the building industry for many years. Certain chemicals in the retarding agent penetrate into the fresh concrete, affect the cement hydration, and slow down the hardening process. If such a retarding agent is applied to the mold before placing of concrete, the result is a material with an overall strength as usual, but with a very soft cement matrix layer on the surface that was in contact with the retarder. This soft matrix layer can easily be washed off with a high-pressure clear water hose. This washing process can take place as soon as the concrete part that is unaffected by the retarding agent is strong enough to withstand the pressure of the water hose. On the other hand, washing must be carried out before the effect of the regarding agent fades and the surface of the concrete specimen becomes too hard for washing. Washing is generally done at a concrete age between 12 and 24 hours. Retarding agents come in two forms: either as coated paper or as a liquid product, which is brushed or sprayed onto the mold. The penetration depth of the retarding agent into the fresh concrete is mainly a function of the strength of the active chemical. It is further slightly influenced by the slump of the mix, the time and intensity of vibration, and the water/cement and aggregate/cement ratios. It is still unknown how specific retarding agents interact with glass concrete, the chemistry of which is slightly different from conventional systems, especially if it contains the powder admixture to suppress the ASR problem. The diffusion process by which the retarding agent penetrates into the specimen is also influenced by the density of the fresh concrete mix. In the architectural concrete industry, coarse aggregate is commonly used, and up to 1 inch of the concrete surface is washed out to expose the large stones. In comparison, the crushed glass particles in glass concrete are of much smaller size, typically no larger than #4. Therefore, no more than 4 mm of the surface matrix should be washed out to expose the coarsest glass particles. In this initial phase of the complex iteration process to develop a façade element with appearance and properties attractive to an architect, the main effort was directed towards understanding the use of retarding agents with glass concrete. A secondary goal of this test was to achieve a moderately rough surface finish, comparable to that of cut, but unpolished, natural stone. “Beauty Black Sand” and various color pigments were used to create random dark spots in a gray matrix, similar to those found in natural granite. A particular type of retarding paper (unknown type, purchased in summer 1998) was used to determine when to demold and when to wash the specimen. Different concrete mixes where tried to study the effect that different glass aggregate sizes and water-cement ratios would have on an exposed aggregate surface. Finalizing the color scheme, surface texture, and glass particle size distribution will be the objective of subsequent studies, in close cooperation with the product user, such as an architect.
A.57
Test Description Six concrete samples were prepared according to the mix designs listed in Table 12.1. Retardant paper was placed on the mould. The times between casting the specimens and both removing the retardant paper from the surface and washing the surface were selected intuitively during the test and are listed in Table 12.1. The washing was carried out with a regular water hose until no more particles from the specimen were found in the run-off. Results and Conclusions Standard retarding agents that are available commercially can be used with glass concrete to achieve exposed aggregate surfaces. The retarding agent of unknown origin that was used in this test turned out to be very strong. The first two specimens were demolded after 21 hours and washed immediately. A high loss of more than 7 mm of the concrete surface was experienced. This could have been acceptable if the concrete mix had contained coarse particles with sizes well above 10 mm. In the mixes of this test series, however, the largest particles were of size #8, i.e., much smaller than 7 mm. Therefore, a considerable amount of surface material was lost due to washout. Better results are expected when much weaker chemicals are used. Four different solvents supplied by Fosroc, Inc. will be tested in the next test, together with two different weak retarding papers supplied by American Concrete Chemicals, Inc. It is obvious that the concrete unaffected by the retarding agent would be hard enough to withstand a standard water hose at an age well below 24 hours. Still, in order to decrease the amount of material washout, it was decided to extend the time until demolding and to introduce a second waiting period before commencing with the washing process. In hindsight, this decision was premature, because it led to an overemphasis of this study on issues of production, rather than finding the right type of retarding agent and concrete mix parameters. Aside from studying the type of retarding agent and the production process, this test gave insight into important factors affecting the appearance of exposed aggregate surfaces. It was found especially that large glass aggregate sizes dominate the surface texture. In future tests, a broad spectrum of texture patterns shall be studied by systematically varying the glass aggregate grading. Some experience was gained about how the color of larger glass particles interacts with the color of the cement matrix. The use of randomly distributed black sand particles achieved the goal of simulating the appearance of natural granite. The surface of the concrete specimens and the amounts of washout were controlled mainly by modifying the times of demolding and washing. No knowledge was gained on the other parameters influencing the penetration depth of a retarding agent, like slump of the concrete mix, duration of vibration, aggregate/cement and water/cement ratios.
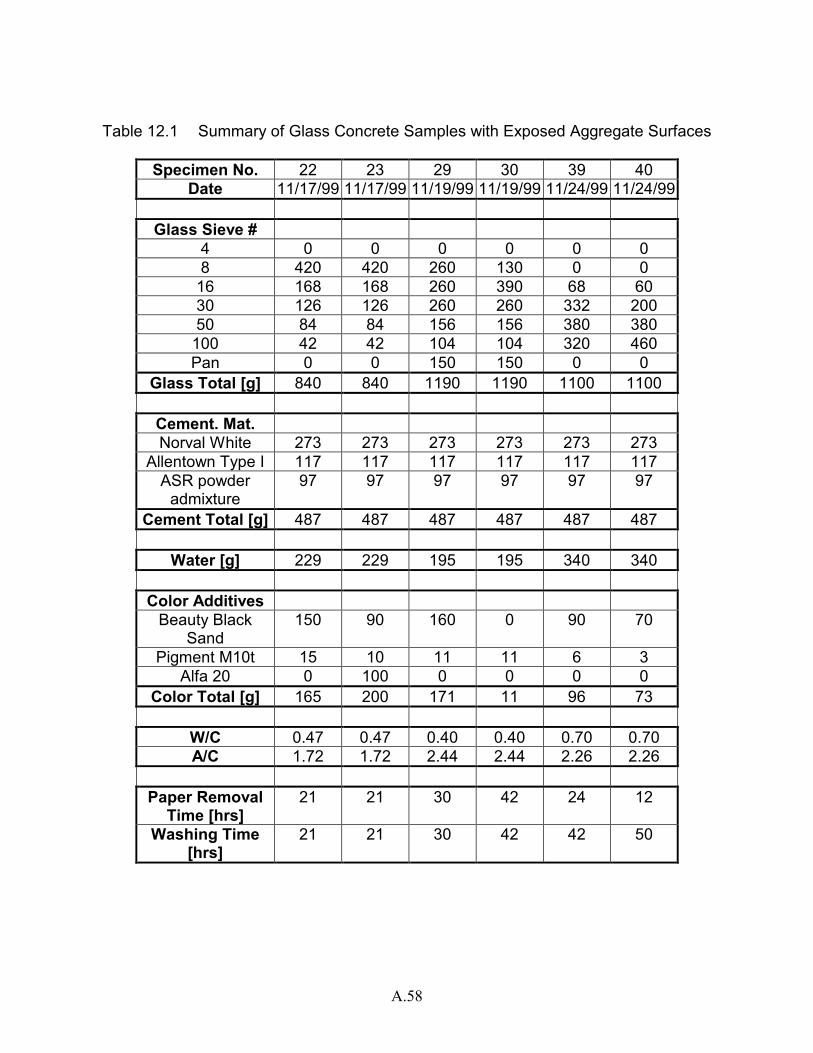
A.58
Table 12.1 Summary of Glass Concrete Samples with Exposed Aggregate Surfaces
Specimen No. 22 23 29 30 39 40
Date 11/17/99 11/17/99 11/19/99 11/19/99 11/24/99 11/24/99
Glass Sieve # 4 0 0 0 0 0 0 8 420 420 260 130 0 0
16 168 168 260 390 68 60 30 126 126 260 260 332 200 50 84 84 156 156 380 380
100 42 42 104 104 320 460 Pan 0 0 150 150 0 0
Glass Total [g] 840 840 1190 1190 1100 1100
Cement. Mat. Norval White 273 273 273 273 273 273
Allentown Type I 117 117 117 117 117 117 ASR powder
admixture 97 97 97 97 97 97
Cement Total [g] 487 487 487 487 487 487
Water [g] 229 229 195 195 340 340
Color Additives Beauty Black
Sand 150 90 160 0 90 70
Pigment M10t 15 10 11 11 6 3 Alfa 20 0 100 0 0 0 0
Color Total [g] 165 200 171 11 96 73
W/C 0.47 0.47 0.40 0.40 0.70 0.70 A/C 1.72 1.72 2.44 2.44 2.26 2.26
Paper Removal
Time [hrs] 21 21 30 42 24 12
Washing Time [hrs]
21 21 30 42 42 50
A.59
Test 13 : Determining the Proper Use of Different Retarding Papers and Solvent Retarders
Objective To find the optimal usage of four different solvent retarders and two retarding papers for the production of glass concrete products with exposed aggregate surface. Materials Brown glass aggregate passing #4 standard sieve. Portland cement Allentown Type I and Norval Super White Cement. Meta Max, a high-reactivity metakaolin manufactured by Engelhard Corporation. Coloring elements: several colors of pigments. A proprietary high-range water-reducing admixture. Retardant Papers supplied by American Concrete Chemical, Inc., Fort Lauderdale, FL. Paper Types: 15 and 25. Solvent Retarders supplied by Preco Line of Master Builders, Inc., Lexington, KY. Solvent Types: MINI-COTE C, HEAT-COTE Blue and Gold, TUF-COTE Lilac. Mix Design The mortar mixes were prepared according to ASTM C 109/C109 M-98, using Procedure 1 as described in Test #2. W/C = 0.34, A/C = 2.75 Amount of coloring elements = 2% of cement by weight ASR suppressant material was added to mix to replace 20% of cement. High-range water-reducing admixture = 1.25% of cement by weight Glass aggregate grading (weight percentage relative to the total weight of glass):
3/8" #4 # 8 # 16 # 30 # 50 # 100 - #100 0.0% 0.0% 22% 22% 22% 18% 10% 6%
Test Dates January, 2000
A.60
Introduction Test 12 showed that the effective use of retarding paper involves a learning process and that very attractive results can be achieved when the retarding agents are used correctly. The important variables involved are the slump and hardening rate of the mix, time of demolding and washing, time and intensity of vibration, strength of retarding agent, and blend of aggregate. In this test, four solvent retarding agents and two retarding papers were investigated. Preco Line of Master Builders, Inc., Lexington, KY, supplied all the solvent agents. They were designated, in the order of increasing strength, as MINI-COTE C, HEAT-COTE Blue, HEAT-COTE Gold, and TUF-COTE Lilac. American Concrete Chemical, Inc., Fort Lauderdale, FL, supplied the two types of retarding paper, type P15 being the weaker and type P25 the stronger one. All parameters except the type of retarder and the timing of demolding and washing were kept constant. The appearance of an exposed aggregate surface depends very much on the time at which it is demolded and at which it is washed. These times are subject to two constraints. First, the concrete surface must not be too hard at the time of washing. This means the washing must be carried out before the effect of the retarding agent fades. On the other hand, to avoid an uncontrolled and unwanted excess loss of material, the specimen should not be washed before the concrete not affected by the retarding agent has hardened enough to withstand the pressure of the water hose used for washing. This second constraint is independent of the penetration depth of the retarding agent. The amount of washout should not be controlled by the production timing, but by the type of retarding agent used for a particular application. Setup and Testing Procedure Retarding Solvents. To limit the number of required samples, all four retarding agents were used simultaneously on each specimen. To achieve this without interference between the different agents, the mold face was divided into four quarters using regular ¾-inch masking tape. The four quadrants are designated as surfaces a,b,c,d (Table 13.1). After preparing the first specimen (#41) it was found that the release agent seemed to be incompatible with the dense and aggressive retarding solvents. The procedure of mold preparation was therefore modified as follows: apply one layer of Preco Mold Release, 10 min rest, apply first coat of retarding agent, 15 min rest, apply second coat of retarding agent, 15 min rest, then place concrete. Retarding Paper. One half of the mold was covered with one retarding paper and the other half with the other paper. The two halves were identified as surfaces a and b (Table 13.1). The paper itself proved to be an excellent release agent, so that only the sides of the mould had to be treated with a standard release agent. The mould was immediately ready to be used. Procedure of Demolding and Washing. Specimens that were not to be washed right after demolding were returned to the moisture room with their exposed aggregate surface facing upwards. In order to keep the washing procedure as consistent as possible, the washing was done as described in Test 12, with the highest available water pressure until no further washout was recognizable. The program is summarized in Table 13.1.
A.61
Results Retarding solvents offer a wide variety of achievable results. The amount of washout can be reduced to layers as thin as approximately 1 mm, by choosing the weakest available retarding agent, which, against expectation, was not Preco Mini Cote C, but Preco Heat Cote Blue. The two strongest solvent retarding agents, Preco Heat Cote Gold and Preco Tuf Cote Lilac, caused washouts as high as 5 – 7 mm and should only be used to expose glass particles of size #4 and larger. The combination of demolding and immediate washing after 16-24 hours showed the best results. Washing before 16 hours caused too much loss of aggregate, and waiting longer than 24 hours resulted in the concrete becoming too hard and the production time being unnecessarily prolonged. When the weaker retarding paper was used, a small depth of penetration of the retarding agent into the fresh concrete was expected. However, the amount of material lost due to washout was even higher than when Preco Heat Cote Gold was used, i.e. the second strongest solvent retarder used in this test program. Otherwise, the two papers led to nearly the same results. The best results were achieved when demolding and washing was carried out at the same time, after approximately 16 hours. Discussion Mold preparation for the use of solvent retarding agents is obviously a very time-consuming process. In contrast, the relatively easy procedure for the use of retarding papers is appreciated especially when small samples are prepared. However, when production of large surfaces is considered, the first method could prove to be very effective, whereas the application of retarding paper could slow down the production. In that case, industrialized spraying of solvent agents or application of large-sized self-sticking papers should be considered. Preferences with regard to exposed glass aggregate concrete surfaces are largely subjective. However, the surfaces obtained during this and the previous test demonstrated that truly novel effects are achievable with exposed glass aggregate, which can be exploited for a variety of applications, such as building façade elements. Since the spectrum of achievable effects is very wide, it is not necessary or even desirable to restrict the development efforts to the task of simply simulating natural stone, but rather to pursue one of the two options. First, a “catalog” of different surface textures can be generated, by varying the strength of the retarding agent and the glass aggregate grading curve. The second approach would be to work closely with an architect or other design professional to achieve a surface with specific texture and color features. A point of concern is the relatively poor bond strength between the glass particles and the cement matrix in the exposed aggregate surface zone. Roughened by the washing process, an increased surface area is exposed to external environmental influences such as rain and wind. A small but constant loss of glass particles was observed throughout both tests, resulting in small but noticeable spot defects in the concrete surface. Since the ultimate objective of this research is the development of concrete elements for outdoor applications, it may be necessary to strengthen the bond between the glass and cement matrix.
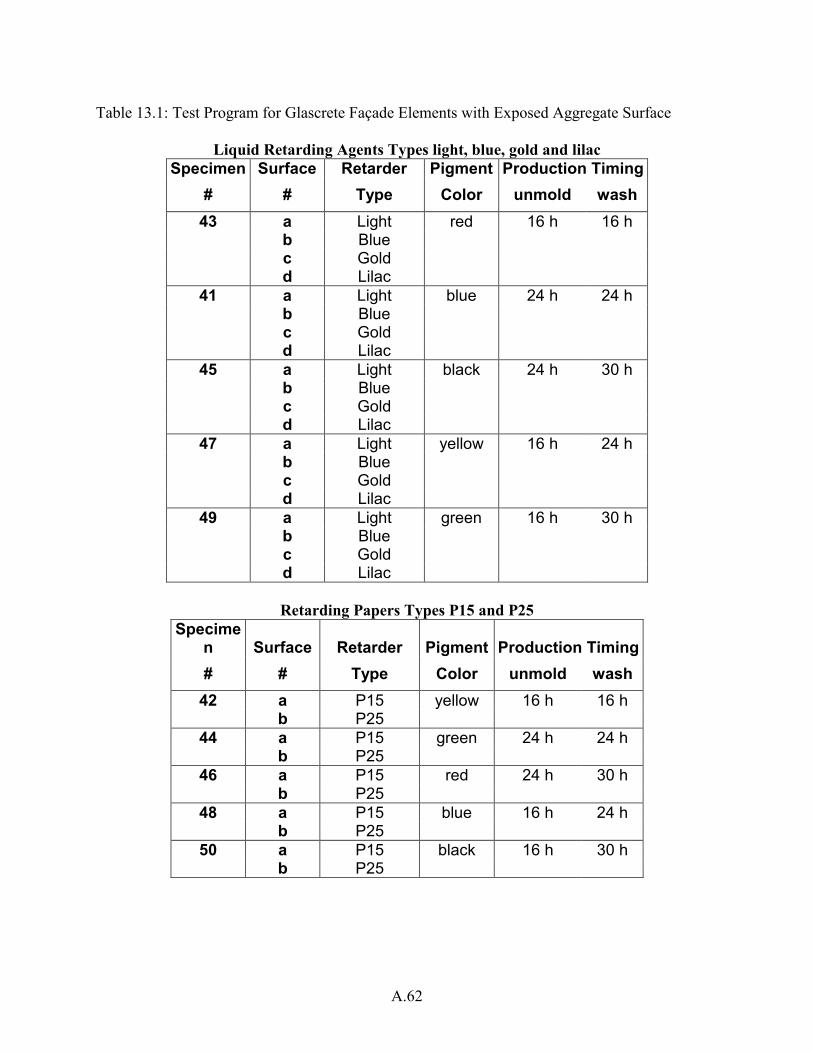
A.62
Table 13.1: Test Program for Glascrete Façade Elements with Exposed Aggregate Surface
Liquid Retarding Agents Types light, blue, gold and lilac Specimen Surface Retarder Pigment Production Timing
# # Type Color unmold wash 43 a Light red 16 h 16 h b Blue c Gold d Lilac
41 a Light blue 24 h 24 h b Blue c Gold d Lilac
45 a Light black 24 h 30 h b Blue c Gold d Lilac
47 a Light yellow 16 h 24 h b Blue c Gold d Lilac
49 a Light green 16 h 30 h b Blue c Gold d Lilac
Retarding Papers Types P15 and P25
Specimen Surface Retarder Pigment Production Timing # # Type Color unmold wash
42 a P15 yellow 16 h 16 h b P25
44 a P15 green 24 h 24 h b P25
46 a P15 red 24 h 30 h b P25
48 a P15 blue 16 h 24 h b P25
50 a P15 black 16 h 30 h b P25
A.63
Test 14 : Effect of Glass Grading on Exposed Aggregate Surface Objective In addition to the type of retarding agent, the glass grading strongly influences the texture of an exposed aggregate surface. In this test, the glass grading was systematically varied. The objective was to create a wide range of surface textures and to summarize them in form of a “catalog”. Materials Brown glass aggregate passing #4 standard sieve. Portland Cement Allentown Type I and Norval Super White Cement Type I. A proprietary powder admixture to suppress ASR. Coloring elements: Beyferrox 420 (yellow). A proprietary high-range water reducing admixture. Retardant Paper Type 15 supplied by American Concrete Chemical, Inc., Fort Lauderdale, FL. Solvent Retarders supplied by Preco Line of Master Builders, Inc., Lexington, KY. Solvent Types: MINI-COTE C, HEAT-COTE Blue. Mix Design The mortar mixes were prepared according to ASTM C 109/C109 M-98, using Procedure 1 as described in Test #2. W/C = 0.34 to 0.37, A/C = 2.75 Variations of glass aggregate grading and amount of coloring elements. ASR-suppressant material was added to mix to replace 20% of cement. High-range water-reducing admixture = 1.25% of cement by weight. Test Dates March, 2000
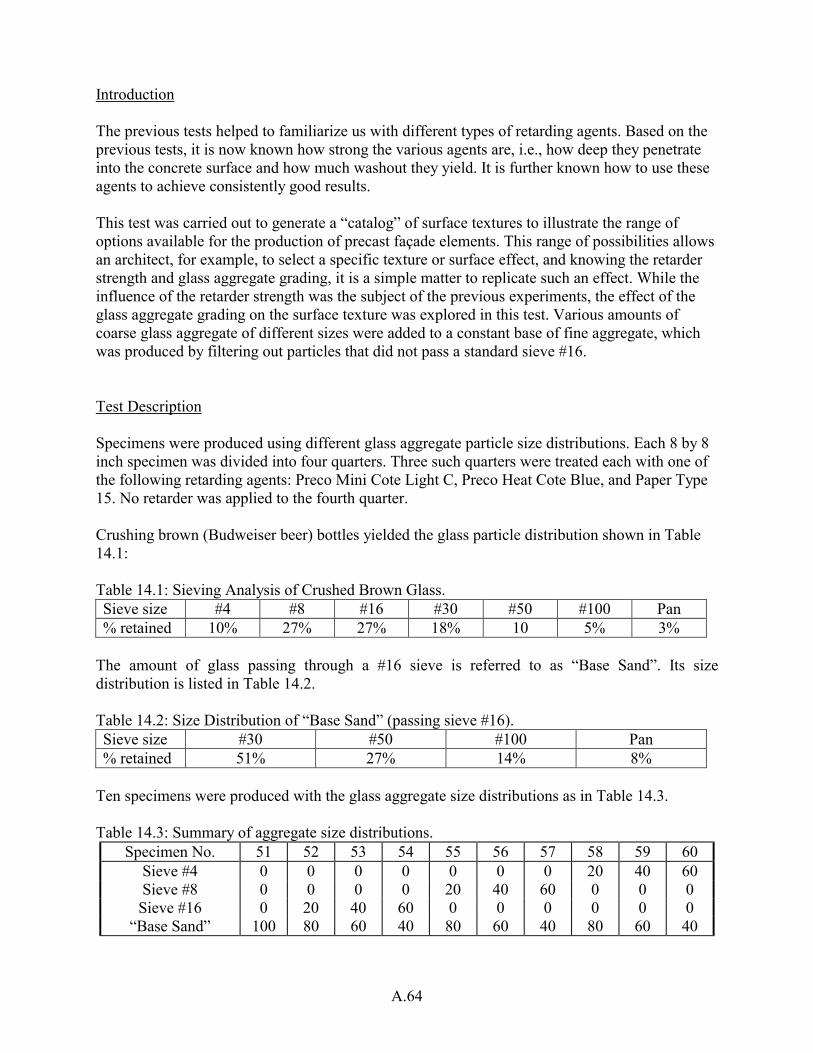
A.64
Introduction The previous tests helped to familiarize us with different types of retarding agents. Based on the previous tests, it is now known how strong the various agents are, i.e., how deep they penetrate into the concrete surface and how much washout they yield. It is further known how to use these agents to achieve consistently good results. This test was carried out to generate a “catalog” of surface textures to illustrate the range of options available for the production of precast façade elements. This range of possibilities allows an architect, for example, to select a specific texture or surface effect, and knowing the retarder strength and glass aggregate grading, it is a simple matter to replicate such an effect. While the influence of the retarder strength was the subject of the previous experiments, the effect of the glass aggregate grading on the surface texture was explored in this test. Various amounts of coarse glass aggregate of different sizes were added to a constant base of fine aggregate, which was produced by filtering out particles that did not pass a standard sieve #16. Test Description Specimens were produced using different glass aggregate particle size distributions. Each 8 by 8 inch specimen was divided into four quarters. Three such quarters were treated each with one of the following retarding agents: Preco Mini Cote Light C, Preco Heat Cote Blue, and Paper Type 15. No retarder was applied to the fourth quarter. Crushing brown (Budweiser beer) bottles yielded the glass particle distribution shown in Table 14.1: Table 14.1: Sieving Analysis of Crushed Brown Glass. Sieve size #4 #8 #16 #30 #50 #100 Pan % retained 10% 27% 27% 18% 10 5% 3%
The amount of glass passing through a #16 sieve is referred to as “Base Sand”. Its size distribution is listed in Table 14.2. Table 14.2: Size Distribution of “Base Sand” (passing sieve #16). Sieve size #30 #50 #100 Pan % retained 51% 27% 14% 8%
Ten specimens were produced with the glass aggregate size distributions as in Table 14.3. Table 14.3: Summary of aggregate size distributions.
Specimen No. 51 52 53 54 55 56 57 58 59 60 Sieve #4 0 0 0 0 0 0 0 20 40 60 Sieve #8 0 0 0 0 20 40 60 0 0 0 Sieve #16 0 20 40 60 0 0 0 0 0 0
“Base Sand” 100 80 60 40 80 60 40 80 60 40
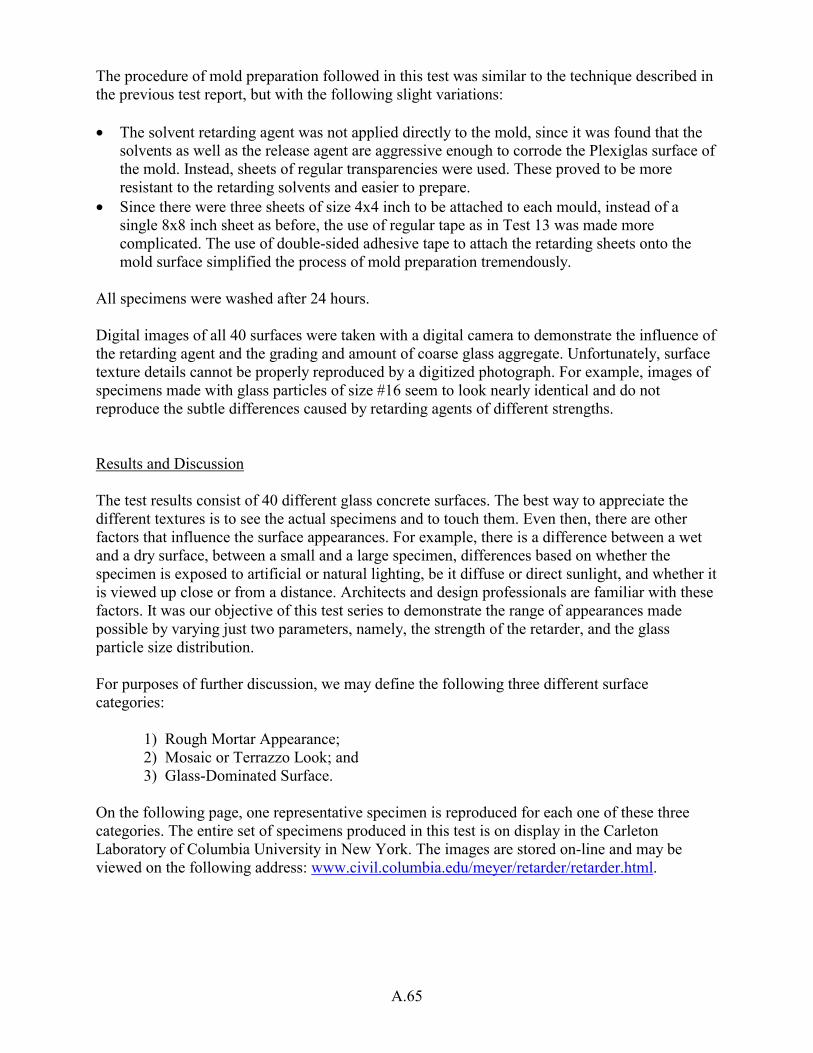
A.65
The procedure of mold preparation followed in this test was similar to the technique described in the previous test report, but with the following slight variations: • The solvent retarding agent was not applied directly to the mold, since it was found that the
solvents as well as the release agent are aggressive enough to corrode the Plexiglas surface of the mold. Instead, sheets of regular transparencies were used. These proved to be more resistant to the retarding solvents and easier to prepare.
• Since there were three sheets of size 4x4 inch to be attached to each mould, instead of a single 8x8 inch sheet as before, the use of regular tape as in Test 13 was made more complicated. The use of double-sided adhesive tape to attach the retarding sheets onto the mold surface simplified the process of mold preparation tremendously.
All specimens were washed after 24 hours. Digital images of all 40 surfaces were taken with a digital camera to demonstrate the influence of the retarding agent and the grading and amount of coarse glass aggregate. Unfortunately, surface texture details cannot be properly reproduced by a digitized photograph. For example, images of specimens made with glass particles of size #16 seem to look nearly identical and do not reproduce the subtle differences caused by retarding agents of different strengths. Results and Discussion The test results consist of 40 different glass concrete surfaces. The best way to appreciate the different textures is to see the actual specimens and to touch them. Even then, there are other factors that influence the surface appearances. For example, there is a difference between a wet and a dry surface, between a small and a large specimen, differences based on whether the specimen is exposed to artificial or natural lighting, be it diffuse or direct sunlight, and whether it is viewed up close or from a distance. Architects and design professionals are familiar with these factors. It was our objective of this test series to demonstrate the range of appearances made possible by varying just two parameters, namely, the strength of the retarder, and the glass particle size distribution. For purposes of further discussion, we may define the following three different surface categories:
1) Rough Mortar Appearance; 2) Mosaic or Terrazzo Look; and 3) Glass-Dominated Surface.
On the following page, one representative specimen is reproduced for each one of these three categories. The entire set of specimens produced in this test is on display in the Carleton Laboratory of Columbia University in New York. The images are stored on-line and may be viewed on the following address: www.civil.columbia.edu/meyer/retarder/retarder.html.
A.66
Rough Mortar Appearance When only the “base sand” or a small amount of glass particles of size #16 is used, the surfaces have the homogeneous look of a rough mortar or concrete made with a very fine sand. Since no coarse particles are present in the mix, the retarder strength has little influence on the appearance of the surface, even though it does effect the depth of penetration into the concrete. The amount of concrete lost by washing can be minimized by using a weak retarder. Mosaic or Terrazzo Look This surface has great potential for façade elements. The relatively smooth surface contains few large particles, randomly distributed within a homogeneous matrix. This matrix has an appearance similar to the rough mortar described above. If beside the base sand, the glass grading contains 20% coarse particles of size #8 or even #4, then a weak retarding agent produces a smooth surface with a few coarse glass particles characteristic of a mosaic style. Since the glass does not stick out of the concrete, the risk of glass being broken out mechanically is minimized, making this type of surface very durable. Glass Dominated Surface If the amount of glass particles greater than #16 is large (>40%) and a strong retarder is used, the resulting surface is no longer dominated by the rough mortar but by the glass. With #8 glass the surface feels sharp edged, though this effect disappears as the glass particles become larger. Typically only one-half of single coarse glass particles is embedded in the concrete matrix. Such particles are obviously much easier to remove. It needs to be determined how such a surface will hold up under realistic service conditions.
A.67
Test 15 : Study of Glass Concrete Containing Different Types of Recycled Carpet Fibers
Objective During the course of this research project, DuPont modified its carpet recycling process and therefore was not able to continue to supply either one of the two favored types of fibers (recycled nylon and recycled mixed grit). Extensive efforts were undertaken to replicate previously obtained test results with the new types of fiber that DuPont was now able to supply in quantity. It was the objective of this test to conduct a preliminary screening of the many types of fiber provided to us and to identify those types which appeared to be most suitable for our purposes. Test Dates July 2000 – April 2001 Introduction The supply of recycled carpet fibers originally provided by DuPont’s recycling facility in Chattanooga, TN, was depleted before a series of samples for final testing could be produced. Unfortunately, in the meantime, the recycling process had been modified so that DuPont personnel were unable to resupply the same type of fiber we had determined to best suit our purposes, which was referred to as “mixed grit” (mix #82). In an attempt to fulfill our needs, DuPont personnel provided various types of fibers drawn from different locations in a complex recycling stream. None of these fibers came close to the original mixed grit, either in physical appearance or in its effect on the concrete specimens produced with it. Compared with the large spectrum of newly provided fibers, “mixed grit” fibers appeared to be relatively clean, rather small in size, and not too stiff. Prompted by the variability of newly supplied fibers, we decided for the first time to examine the fiber cross sections under a light microscope. It was discovered that recycled mixed grit contained hardly any hollow nylon fibers, as was assumed originally. Most of the fibers examined had Y-shaped cross-sections. This discovery called into question our original hypothesis that recycled hollow-fill carpet fibers would reduce the thermal conductivity of glass concrete. As an alternative to DuPont, a different carpet producer, Collins and Aikman (www.colaik.com), provided us with a sample of their shearing waste. Unlike products provided by DuPont, this was the very first one that could be verified to contain only hollow nylon fibers. The preliminary screening and subsequent identification of the most suitable fibers involved an iterative process consisting of four steps, as described in detail in Test 16. Most of the fibers were eliminated from further consideration after Step 1. Two types of fiber appeared to be more promising in terms of workability, strength, and thermal resistivity, and therefore were subjected to all four steps of the subsequent test program (see Test 16).
A.68
Fibers Fibers from different locations of DuPont’s waste stream. These fibers were subjected only to Step 1 of Test 16 and were eliminated from further consideration: WitteT – Shaker Test Oli Light – Oliver Light Oli Heavy – Oliver Heavy ST1 60 – 1st Sweco (referred to in Test 16 as ST(1)) ST2 60 – 2nd Sweco DC1 – 1st Dust Collector DC2 – 2nd Dust Collector CL – Cleaner Grit 50/50 CL & Oli Light Fibers that were most promising and therefore subjected to all four steps of Test 16 were: DFN – DuPont’s main recycling product C&A Fiber – hollow nylon fiber provided by Collins and Aikman Custom-modified fiber samples were: ST1(2) – same as ST1(1), but with particles smaller than #100 sieved out DFN(2) – same as DFN, but treated in acid solution to switch surface charge Visual Description and Microscopic Inspection In general three different fiber shapes were identified by optical microscopy – solid circular, hollow, and solid Y-shaped cross sections. Representative samples of all three types are illustrated in Fig. 15.1. These images were obtained as follows. Small samples of fiber were placed on paper and covered with drops of Liquid Paper, the correction fluid produced by the Gillette Company. After the liquid paper had hardened, thin slices (<0.5mm) were cut out by a razor blade to expose the fiber cross-sections. WitteT – Shaker Test: Contains considerable amount of dirt, nearly no fine dust and large
(4mm) mostly colorless fibers. This is the only sample that contains thick and long (>10mm) polymer fibers. The mix appears clean and stiff. The fiber cross sections are entirely Y-shaped.
Oli Light – Oliver Light: Nearly free of dust, but it contains coarse dirt and short, thick fiber pieces similar to WitteT. The mix is stiff and colored. The fiber cross sections are about 50% hollow and 50% solid circular.
Oli Heavy – Oliver Heavy: Contains many coarse pieces of material and only few fibers, 95% of which are Y-shaped and 5% hollow.
ST1 60 – 1st Sweco: Nearly no fiber, but unlike Oli Heavy, the fibers are very fine and the non-fibrous components very fine and dusty. The fibers are 99% Y-shaped and 1% hollow.
ST2 60 – 2nd Sweco: Very comparable to ST1 but not as dirty. The fibers are 99% Y-shaped and 1% hollow.
A.69
DC1 – 1st Dust Collector: Contains few coarse dirt particles, a lot of dust and stiff long fibers. The cross sections are 50% hollow and 50% Y-shaped.
DC2 – 2nd Dust Collector: This is really nothing but dust. The few fine fibers are 90% circular solid and 10% Y-shaped.
CL – Cleaner Grit: Contains both dust and coarse dirt particles. The fibers are long and mostly Y-shaped with 1% of hollow fibers.
50/50 – CL & Oli Light: Contains many large fibrous and dirt particles. The fibers are 80% Y-shaped and 20% hollow.
Mixed Grit: Compared to all other fiber samples, this one is very white and clean. The fibers appear soft; the sample contains very few larger particles. All fibers are Y-shaped.
DFN: The final product of DuPont’s new recycling process. The sample is very clean. It contains neither large particles nor dust. The fibers are 90% Y-shaped and 10% hollow.
C&A fiber: Virgin nylon fiber. It is multicolored, 100% hollow, and the only sample with exceptionally smooth fiber surfaces, Fig. 15.1e.
Note on Custom-Modified Fiber Samples The ST1(2) sample was identical to ST1(1), except that particles smaller than #100, basically dust and dirt, were sieved out. The idea was to create a cleaner sample, which might increase the compressive strength of concrete made with this type of fiber. Test results did not support this premise. DFN(2) is the same as DFN but treated in acid solution to change the surface charge. At some point, DuPont was considering using alkali solution for cleaning the fiber. This would yield a surface charge, which would decrease the bond between fiber and cement paste. By washing the fibers in an acid solution we did in fact change the surface charge and showed that the concrete compressive strength decreased as a result. DuPont personnel assured us later that they would use clean water to treat their waste stream. Fiber Analysis DuPont provided for each of the fiber samples a breakdown by weight of fiber and organic and inorganic matter (dirt). This information is summarized in Table 15.1. An additional test was carried out to quantify the amount of dust and dirt in each fiber sample. For this test, an amount of 5 g of a sample was added to a glass container with 500 ml of water. The material was generally observed to remain on the water surface initially, but after several hours would settle on the bottom of the container. Recycled carpet fibers do not float, because the weight of each single fiber is increased by the solid particles bonded to its surface, Fig. 15.1d. After placing the fibers onto the water, enough air is captured initially around the fibers to make the fibers float for a while, but eventually they are enclosed by water and sink to the bottom of the container. Because all material eventually sinks, the final sediment depth is inversely proportional to overall material density. Samples containing large amounts of dust (i.e., DC2 or CL) created small amounts of sediment of higher density, whereas clean samples with lower density (specific weight of fiber material is lower than that of dirt) occupied larger volumes for the same total weight. The test results, given in mm of sediment thickness, are listed in the last column of Table 15.1. Samples ST1, DC2 and CL contained the largest amounts of solid dust and dirt per unit
A.70
weight. This observation agrees with the general visual description of the samples. Oli Light and the 50/50 mix of CL and Oli Light generated the largest amounts of sediment, since they contain very little dust, but relatively long and coarse fibers.
Table 15.1: Characterization of Recycled Carpet Fiber Samples.
DuPont Description (% by weight)
Test 1
Inorganic organic fiber Sediment depth, mm
WitteT – Shaker Test
51.14 25.07 23.79 30
Oli Light – Oliver Light
10.93 4.67 84.40 50
Oli Heavy – Oliver Heavy
34.77 34.86 30.37 30
ST1 60 – 1st Sweco
48.87 14.13 37.00 15
ST2 60 – 2nd Sweco
31.79 12.81 55.40 20
DC1 – 1st Dust Collector
33.09 12.61 54.30 35
DC2 – 2nd Dust Collector
49.80 21.51 28.69 10
CL – Cleaner Grit
39.77 15.85 44.38 15
50/50 – CL & Oli Light
32.99 24.57 42.44 40
To further characterize the differences between Mixed Grit, the output of DuPont’s original dry process, and “DFN”, the fiber resulting from the new wet process, a sieve analysis was performed of both types of fiber. The results are shown in Fig. 15.2. Although these graphs are not actual representations of the fiber’s particle size distributions, they accurately reflect the relative differences, because both fiber types were subjected to the same sieving process. Mixed Grit obviously has a larger fraction of particles passing sieve #50, whereas DFN contains a much larger amount of coarse bent fibers, which create an interlocking network such that they are retained on sieve #30. Although each fiber would be small enough to pass through that and the finer sieves, the interlocking network prevented them from doing so. On the other hand, Mixed Grit contains a larger amount of small-sized solid dirt particles than DFN. Both samples contained fibers of lengths varying from 4 mm to fractions of a millimeter. Finally, several of the fiber samples were studied under a Scanning Electron Microscope (SEM). Representative images are reproduced in Figs. 15.3 – 15.5. Whereas the light microscope produced useful images of the fiber cross sections, the SEM images had better depth of focus (even for the same magnification) and therefore gave better overall fiber representation, e.g., it showed their lengths. Fig. 15.3 shows the relative cleanliness of the Collins and Aikman fibers and provides a quantitative representation of the fiber lengths. Fig. 15.4 illustrates the impurities attached to Mixed Grit fibers. In particular, a large dirt particle of several hundred micron can be seen in Fig. 15.4d. Similar observations can be made in Fig. 15.5 for DFN recycled carpet fiber.
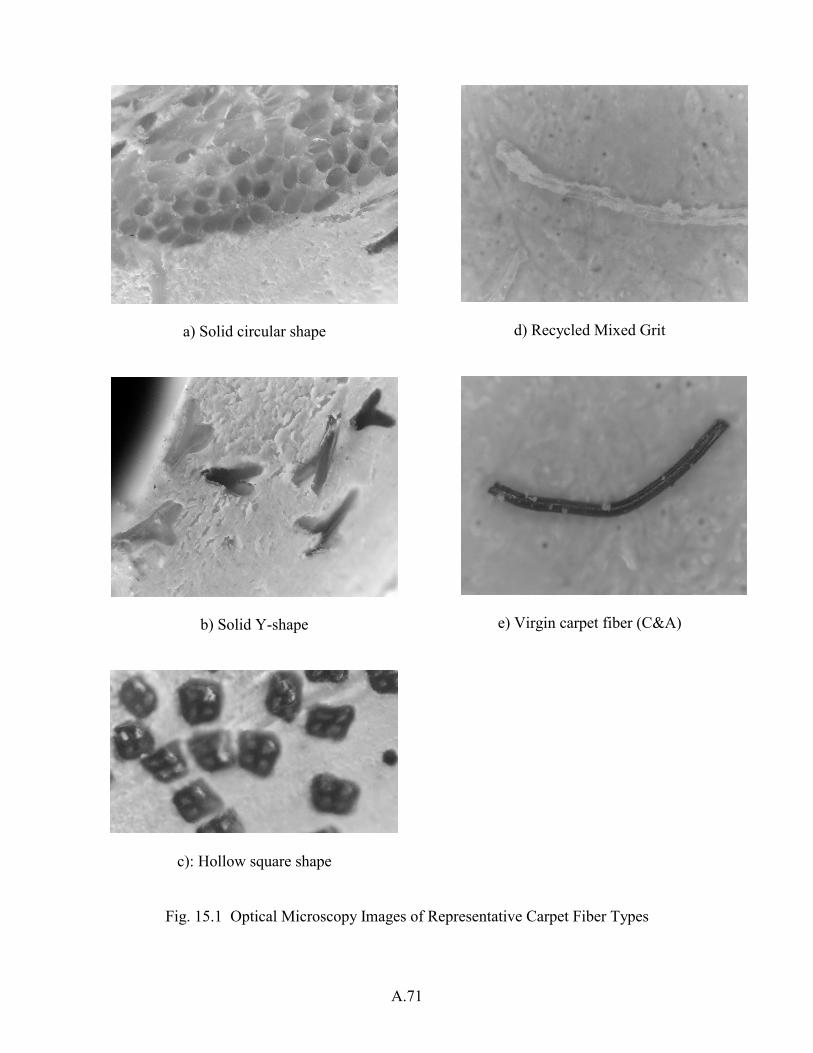
A.71
a) Solid circular shape
b) Solid Y-shape
c): Hollow square shape
d) Recycled Mixed Grit
e) Virgin carpet fiber (C&A)
Fig. 15.1 Optical Microscopy Images of Representative Carpet Fiber Types
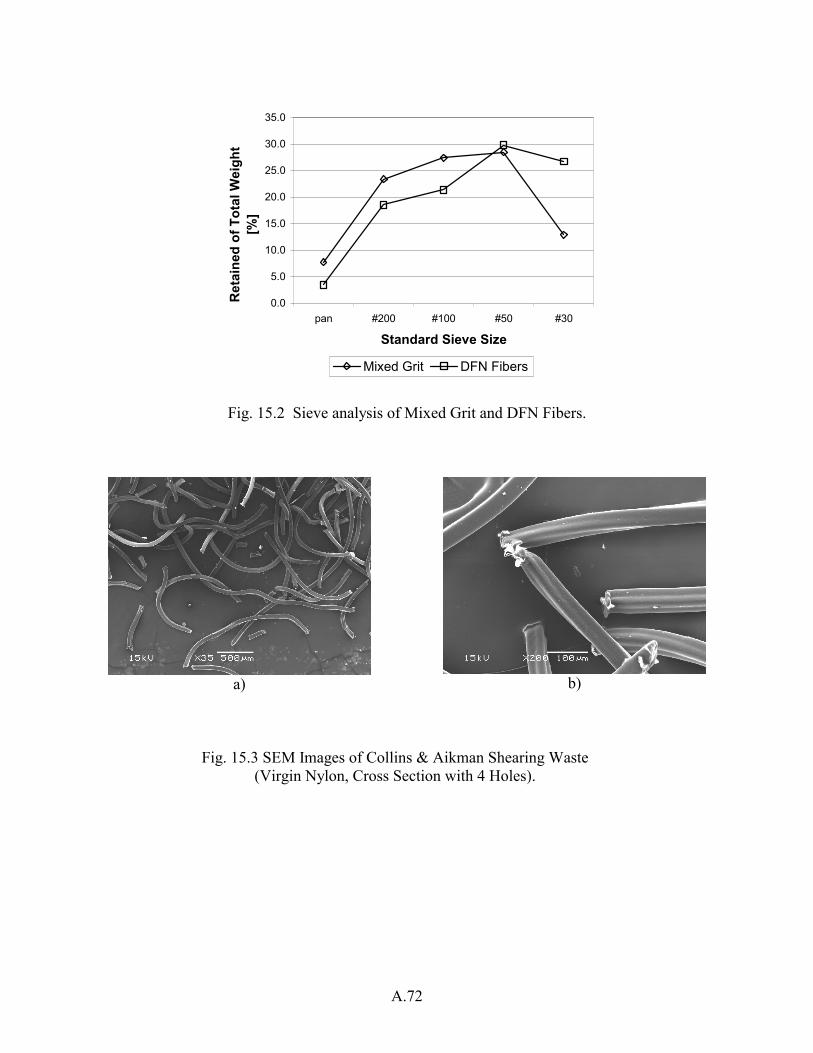
A.72
0.0
5.0
10.0
15.0
20.0
25.0
30.0
35.0
pan #200 #100 #50 #30
Standard Sieve Size
Ret
aine
d of
Tot
al W
eigh
t[%
]
Mixed Grit DFN Fibers
Fig. 15.2 Sieve analysis of Mixed Grit and DFN Fibers.
a)
b)
Fig. 15.3 SEM Images of Collins & Aikman Shearing Waste
(Virgin Nylon, Cross Section with 4 Holes).
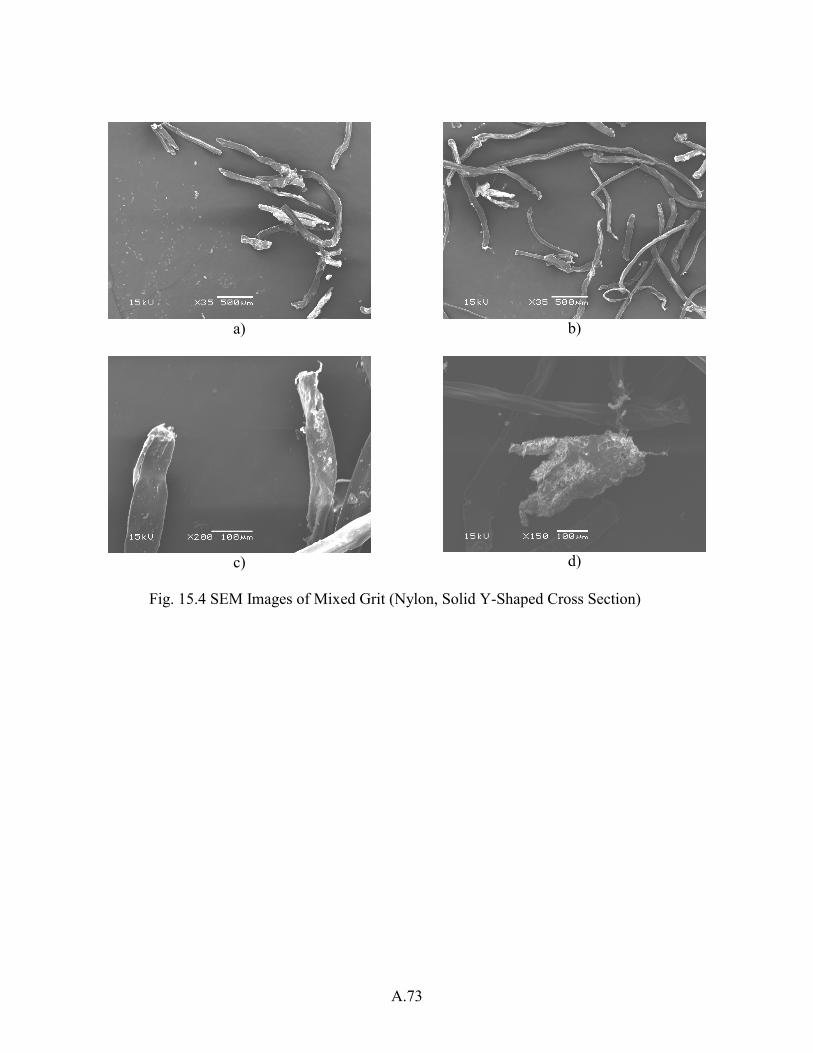
A.73
a)
c)
b)
d)
Fig. 15.4 SEM Images of Mixed Grit (Nylon, Solid Y-Shaped Cross Section)
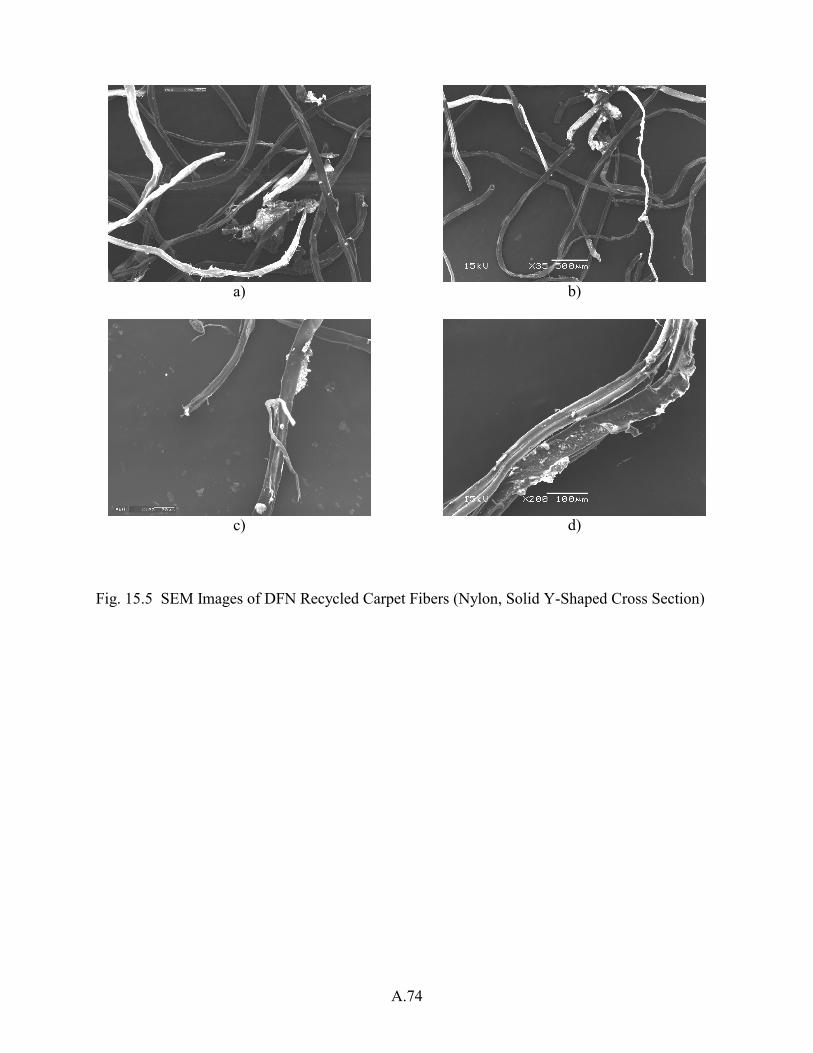
A.74
a)
c)
b)
d)
Fig. 15.5 SEM Images of DFN Recycled Carpet Fibers (Nylon, Solid Y-Shaped Cross Section)
A.75
Test 16 : Study of Glass Concrete Containing Carpet Fibers Other than Recycled Mixed Grit or Recycled Nylon
Objective DuPont’s recent modification of its carpet recycling process created a problem in that neither one of the previous two favored types of carpet fiber (recycled Mixed Grit and recycled nylon) was available any more in quantity. Whereas the new types of fiber provided by DuPont were characterized in Test 15, it was the objective of this test to identify the types with performance characteristics closest to the recycled Mixed Grit and recycled nylon studied previously (e.g., mix #82). Materials Soda-lime glass aggregate passing #4 standard sieve. Portland cement ASTM Type III supplied by Blue Circle, Inc. ASR suppressant: a proprietary powder admixture. Various recycled carpet fibers, supplied by DuPont recycling facility, Chattanooga, TN. “Shearing Waste” (virgin Hollow Nylon66), supplied by Collins and Aikman. MB VR, air-entraining admixture, manufactured by Master Builders Technologies, Inc. Geofoam, a foaming agent manufactured by Engelhard Corporation. A proprietary high-range water-reducing admixture. Mix Design The mortar mixes were prepared according to ASTM C 109/C109 M-98, using Procedure 1 as described in Test #2. W/C = 0.34 to 0.79, A/C = 1.72 ASR suppressant material was added to mix to replace 20% of cement. High-range water-reducing admixture = 1.25% of cement by weight. Glass aggregate grading: same as in Test 1. Test Dates July 2000 – April 2001
A.76
Introduction As described in Test 15, our supply of recycled carpet fibers originally provided by DuPont’s Chattanooga facility was depleted shortly before all of the tests required within the scope of this research project could be completed. Only a final set of specimens needed to be produced to perform standard ASTM thermal tests as well as to determine some mechanical properties. The change of the recycling process set us back almost to the beginning of the project, forcing a resumption of the search for the fiber type or types most suitable for our purposes. Ideally, such fiber would be as close as possible to the recycled Mixed Grit, which was previously considered optimal. Mix #82, which incorporated this type of fiber, had given the most promising test results. To search for a substitute fiber, the various materials provided by DuPont as output of the new recycling process needed to be investigated. In particular, it was necessary to determine what made the Recycled Mixed Grit such a special material in the first place. Limited characterization and analysis of the various fiber types were given in Test 15. In this test, a more systematic four-step procedure was followed to eliminate obviously unsuitable fiber types. This test program was similar to the one described in the earlier test reports, except that it was highly compressed. Test Plan The test program is summarized in Table 16.1, together with selected test results. The program was broken down into four steps. Below, each step is described in detail, together with test results and conclusions drawn from them, which determined the test program for the consecutive steps.
Step 1 To determine how much fiber can be utilized before the flow decreases below 90, mixes were prepared with 2% weight increments of fiber content, at a constant w/c ratio of 0.34. Samples with eight different fibers were produced, and their compressive strengths were determined after seven days. Results and Discussion The compressive strength test results are given in Table 16.1 and plotted in Fig. 16.1 together with those for the original Recycled Mixed Grit for reference. The flow values listed in Table 16.1 are those for the highest fiber content at which the flow values drops below 90, for a given fiber. For example, while 8% of ST1(2) produced a flow greater than 90, 10% of ST1(2) gave a flow value of 82. None of the samples made with the new fiber types gave compressive strengths that came even close to those achieved with the original Recycled Mixed Grit, for comparable fiber weight ratios. For this reason it was decided to continue this study with only two new fiber types. These are DFN, DuPont’s main recycling product, and Hollow Nylon 66, provided by Collins and Aikman. Both types of fibers can be reliably provided in large quantities.
A.77
Step 2 In this step, test specimens were produced with larger fiber weight ratios (8% and 12% for DFN and 12% and 16% for C&A). To achieve this goal, the w/c ratio was increased until a flow value of 90 was obtained. As expected, this increase in water caused a considerable reduction in compressive strength, which was measured after 7 days and for the specimens with the higher fiber weight ratios also after 28 days. Results and Discussion Compressive strength results are summarized in Table 16.1 and plotted in Fig. 16.2. The vertical dashed lines for samples with 12% DFN and 16% C&A fiber tie together the 7-day and 28-day compressive strengths. As can be seen, mixes with large fiber contents gave very low strengths. Based on the assumption that a minimum 28-day strength of 4000 psi would be adequate for practical purposes, it was decided to continue the test program with the following fiber ratios: 5% and 7% of DFN, and 11% and 14% of C&A fibers. The strength test results listed for these cases are indeed adequate (see Table 16.1).
Step 3 Four 8x8x2 inch panels, containing either DFN fiber (5% and 7% by weight) or C&A Nylon fiber (11% and 14% by weight), were prepared and tested for their thermal resistance, following the procedure described in earlier tests. Because the temperature profile of the furnace, which had used in those previous tests, had changed meanwhile, some of the previously tested panels were tested again to permit a valid comparison between the current and earlier thermal tests results. In addition, compressive strengths were tested after 7 and 28 days. Results and Discussion All test results are summarized in Table 16.1. The results of the compressive strength tests are plotted in Fig. 16.3, together with those that were already presented in Fig. 16.2. Again, the vertical dashed lines tie together strengths after 7 and 28 days. Thermal resistivity results of two old and the four new panels are shown in Fig. 16.4. The sample 72_111_a without fiber served as the reference case. The lower thermal performance of C&A fibers led to the exclusion of this fiber type from further consideration. On the other hand, specimens made with 5% by weight of DFN fibers combine a more than adequate strength (4358 psi after 7 days, and 7435 psi after 28 days) with thermal resistivity of 124%, compared to the reference mix with no fiber. Thus, DFN was the only fiber remaining for Step 4.
Step 4 In order to study the effect of a foaming agent on strength and thermal resistivity, three 8x8x2 inch panels were prepared and tested. Two panels contained 5% by weight DFN fibers, combined with two different dosages of “Geofoam”, a foaming agent provided by Engelhardt (0.33% and 1% by weight). The third sample contained no fiber but 1% by weight of the
A.78
foaming agent. This test allowed comparison of the effects of only fibers or only foaming agent on both thermal performance and mechanical strength. Results and Discussion Thermal resistivities and 7-day compressive strength test results are given in Table 16.1 and Fig. 16.5. If either only 1% of “Geofoam” or 5% DFN fibers were used, the results were very similar. Compared to a reference mix containing neither foaming agent nor recycled carpet fibers, the thermal performance is raised by approximately 20%, but the 7-day compressive strength drops from 9.6 ksi to 5.3 and 4.4 ksi for foam and fiber, respectively. If 5% DFN fibers are used together with 1% foaming agent, the thermal performance can be raised by 61%, but the compressive strength drops to an unacceptable 907 psi, and 2317 psi, if the 5% fiber is combined with as little as 0.33% foaming agent. Summary After an initial first stage only DuPont’s DFN fibers and nylon shearing waste provided by Collins and Aikman were studied in further detail, mostly because only these two types of fibers can be delivered in large quantities. The round and hollow virgin C&A fibers were very clean compared to the Y-shaped DFN fibers, which contained dust and dirt both in loose form in the fiber mix and attached to the fiber surface. This fact explains two phenomena that were observed. First, C&A fibers exhibited better bond, and mixes that contained them were denser and stronger than mixes containing DFN fibers. Secondly, the larger surface area and the attached dust make DFN fibers hydrophobic. They naturally enclose more air in the concrete matrix than the smooth, virgin C&A nylon fibers. From a thermal insulation aspect, the DFN fibers are therefore preferable. The original hypothesis that hollow fibers encapsulate air in the concrete system and therefore have a thermal insulating effect could not be supported. Glass concrete containing 5% DFN fibers and no foaming agent appeared to be the most economic mix, providing good workability and relatively good thermal insulation without overly compromising compressive strength. Conclusions Recycling products are difficult to deal with because of uncertainties regarding their properties and dependability of their supplies. After having encountered problems with waste glass, similar experiences were made with recycled carpet fibers. Concrete can be used successfully as a medium to recycle either waste material. It has been shown that recycled carpet fibers can increase the concrete’s thermal performance, but only by sacrificing strength. To conclude this study, k-values need to be determined by standard tests as described in the following test report.
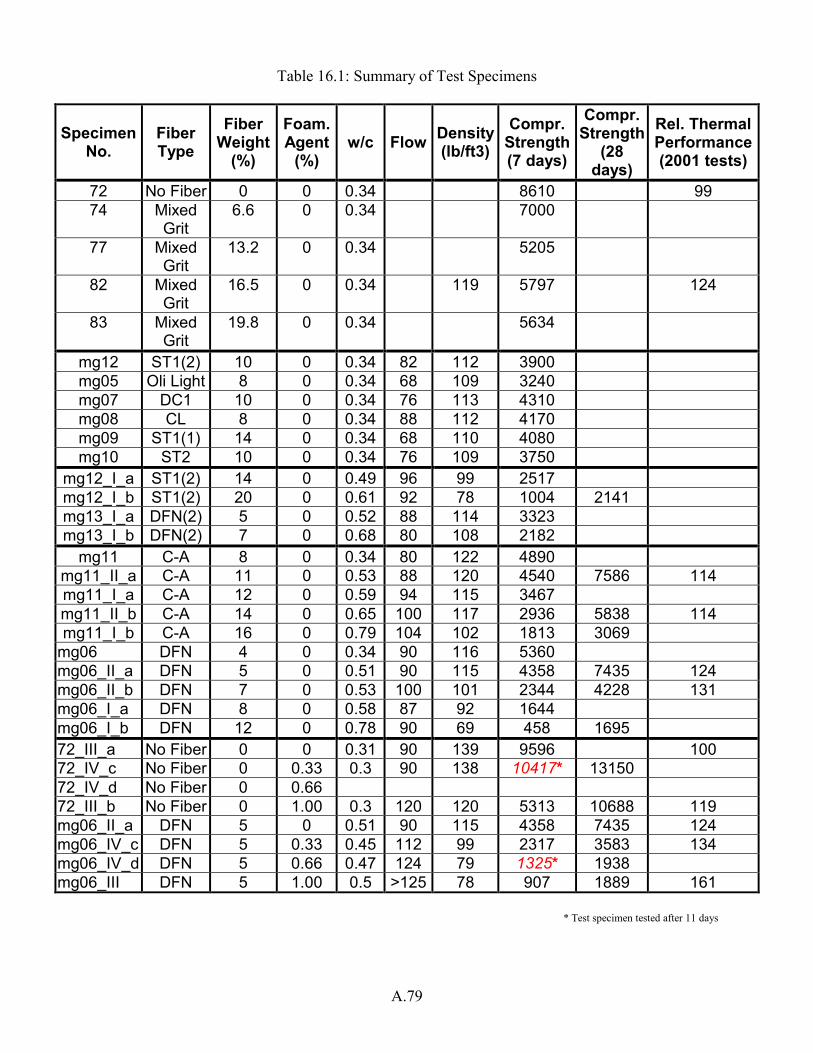
A.79
Table 16.1: Summary of Test Specimens
Specimen No.
Fiber Type
Fiber Weight
(%)
Foam.Agent
(%) w/c Flow Density
(lb/ft3)Compr.
Strength(7 days)
Compr. Strength
(28 days)
Rel. ThermalPerformance(2001 tests)
72 No Fiber 0 0 0.34 8610 99 74 Mixed
Grit 6.6 0 0.34 7000
77 Mixed Grit
13.2 0 0.34 5205
82 Mixed Grit
16.5 0 0.34 119 5797 124
83 Mixed Grit
19.8 0 0.34 5634
mg12 ST1(2) 10 0 0.34 82 112 3900 mg05 Oli Light 8 0 0.34 68 109 3240 mg07 DC1 10 0 0.34 76 113 4310 mg08 CL 8 0 0.34 88 112 4170 mg09 ST1(1) 14 0 0.34 68 110 4080 mg10 ST2 10 0 0.34 76 109 3750
mg12_I_a ST1(2) 14 0 0.49 96 99 2517 mg12_I_b ST1(2) 20 0 0.61 92 78 1004 2141 mg13_I_a DFN(2) 5 0 0.52 88 114 3323 mg13_I_b DFN(2) 7 0 0.68 80 108 2182
mg11 C-A 8 0 0.34 80 122 4890 mg11_II_a C-A 11 0 0.53 88 120 4540 7586 114 mg11_I_a C-A 12 0 0.59 94 115 3467 mg11_II_b C-A 14 0 0.65 100 117 2936 5838 114 mg11_I_b C-A 16 0 0.79 104 102 1813 3069
mg06 DFN 4 0 0.34 90 116 5360 mg06_II_a DFN 5 0 0.51 90 115 4358 7435 124 mg06_II_b DFN 7 0 0.53 100 101 2344 4228 131 mg06_I_a DFN 8 0 0.58 87 92 1644 mg06_I_b DFN 12 0 0.78 90 69 458 1695 72_III_a No Fiber 0 0 0.31 90 139 9596 100 72_IV_c No Fiber 0 0.33 0.3 90 138 10417* 13150 72_IV_d No Fiber 0 0.66 72_III_b No Fiber 0 1.00 0.3 120 120 5313 10688 119 mg06_II_a DFN 5 0 0.51 90 115 4358 7435 124 mg06_IV_c DFN 5 0.33 0.45 112 99 2317 3583 134 mg06_IV_d DFN 5 0.66 0.47 124 79 1325* 1938 mg06_III DFN 5 1.00 0.5 >125 78 907 1889 161
* Test specimen tested after 11 days
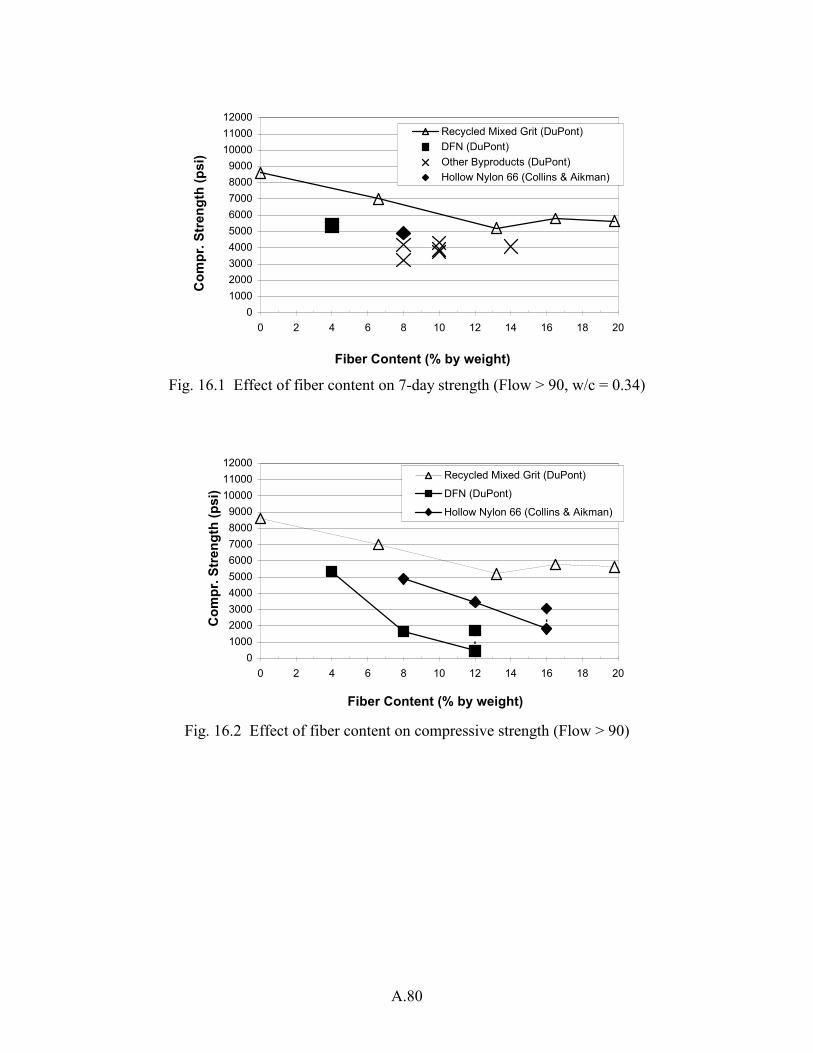
A.80
0100020003000400050006000700080009000
100001100012000
0 2 4 6 8 10 12 14 16 18 20
Fiber Content (% by weight)
Com
pr. S
tren
gth
(psi
)
Recycled Mixed Grit (DuPont)DFN (DuPont)Other Byproducts (DuPont)Hollow Nylon 66 (Collins & Aikman)
Fig. 16.1 Effect of fiber content on 7-day strength (Flow > 90, w/c = 0.34)
0100020003000400050006000700080009000
100001100012000
0 2 4 6 8 10 12 14 16 18 20
Fiber Content (% by weight)
Com
pr. S
tren
gth
(psi
)
Recycled Mixed Grit (DuPont)
DFN (DuPont)
Hollow Nylon 66 (Collins & Aikman)
Fig. 16.2 Effect of fiber content on compressive strength (Flow > 90)
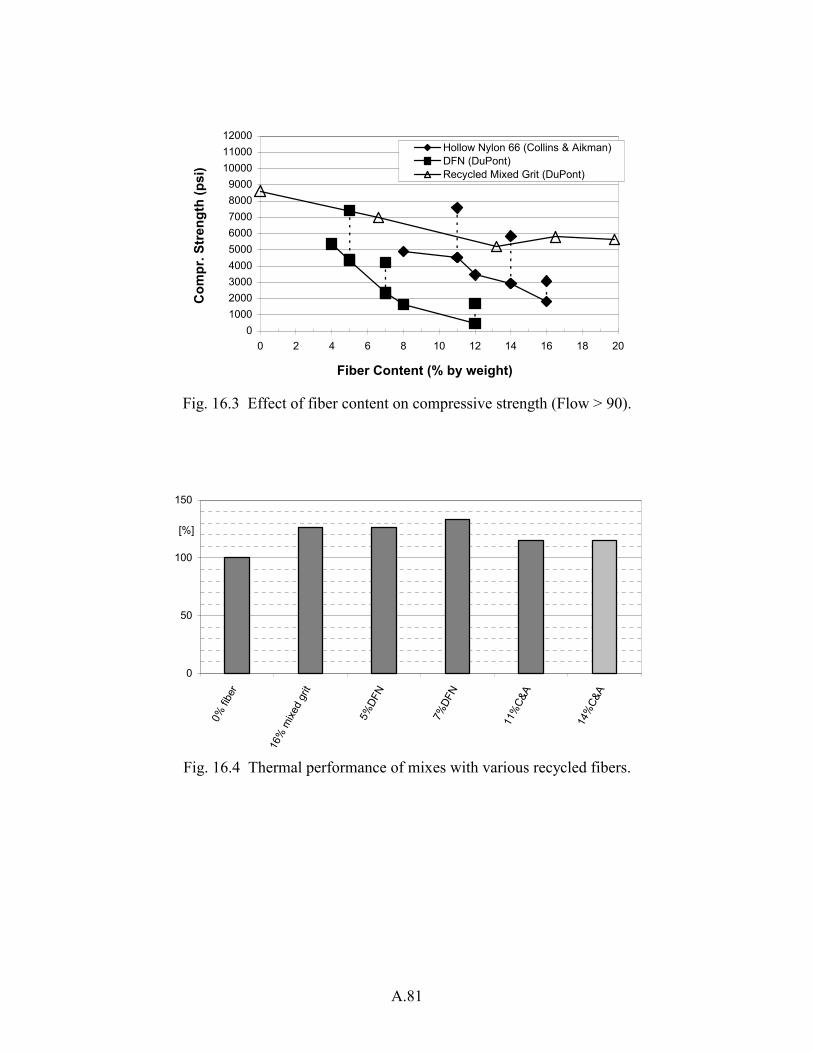
A.81
0100020003000400050006000700080009000
100001100012000
0 2 4 6 8 10 12 14 16 18 20
Fiber Content (% by weight)
Com
pr. S
tren
gth
(psi
)
Hollow Nylon 66 (Collins & Aikman)DFN (DuPont)Recycled Mixed Grit (DuPont)
Fig. 16.3 Effect of fiber content on compressive strength (Flow > 90).
0
50
100
150
0% fi
ber
16%
mixe
d gr
it
5%DF
N
7%DF
N
11%
C&A
14%
C&A
[%]
Fig. 16.4 Thermal performance of mixes with various recycled fibers.
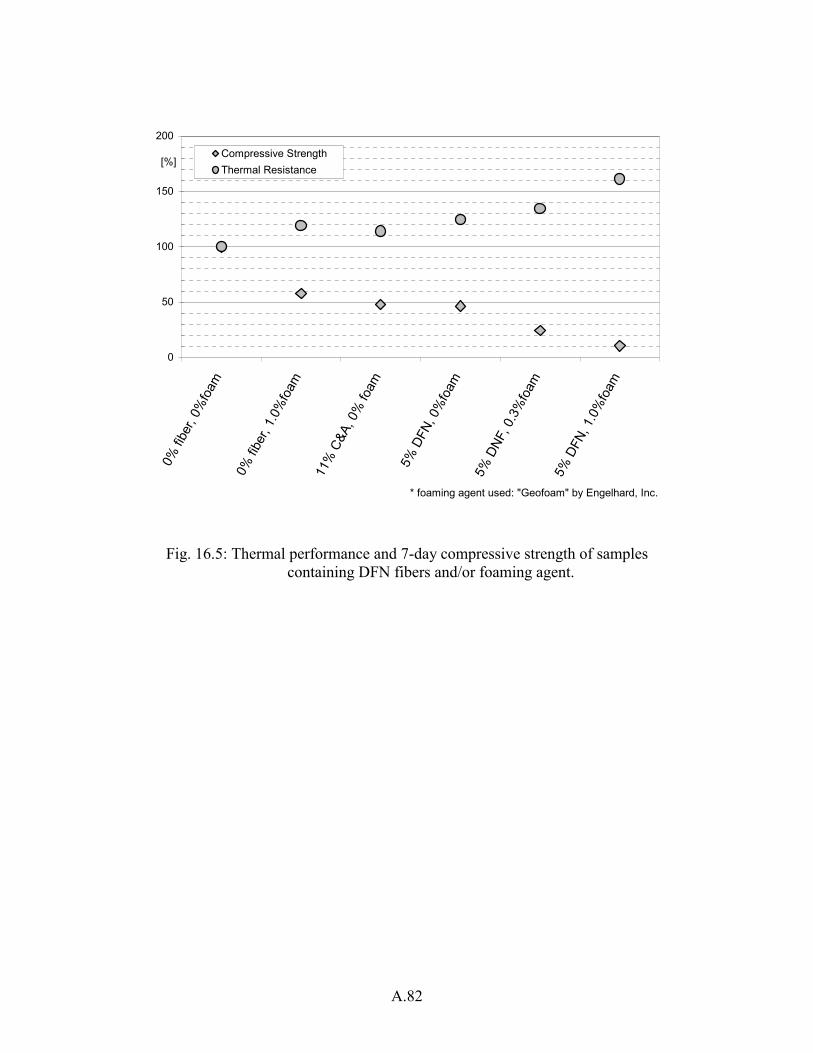
A.82
0
50
100
150
200
0% fi
ber,
0%fo
am
0% fi
ber,
1.0%
foam
11%
C&A
, 0%
foam
5% D
FN, 0
%fo
am
5% D
NF, 0
.3%
foam
5% D
FN, 1
.0%
foam
* foaming agent used: "Geofoam" by Engelhard, Inc.
[%]Compressive StrengthThermal Resistance
Fig. 16.5: Thermal performance and 7-day compressive strength of samples containing DFN fibers and/or foaming agent.
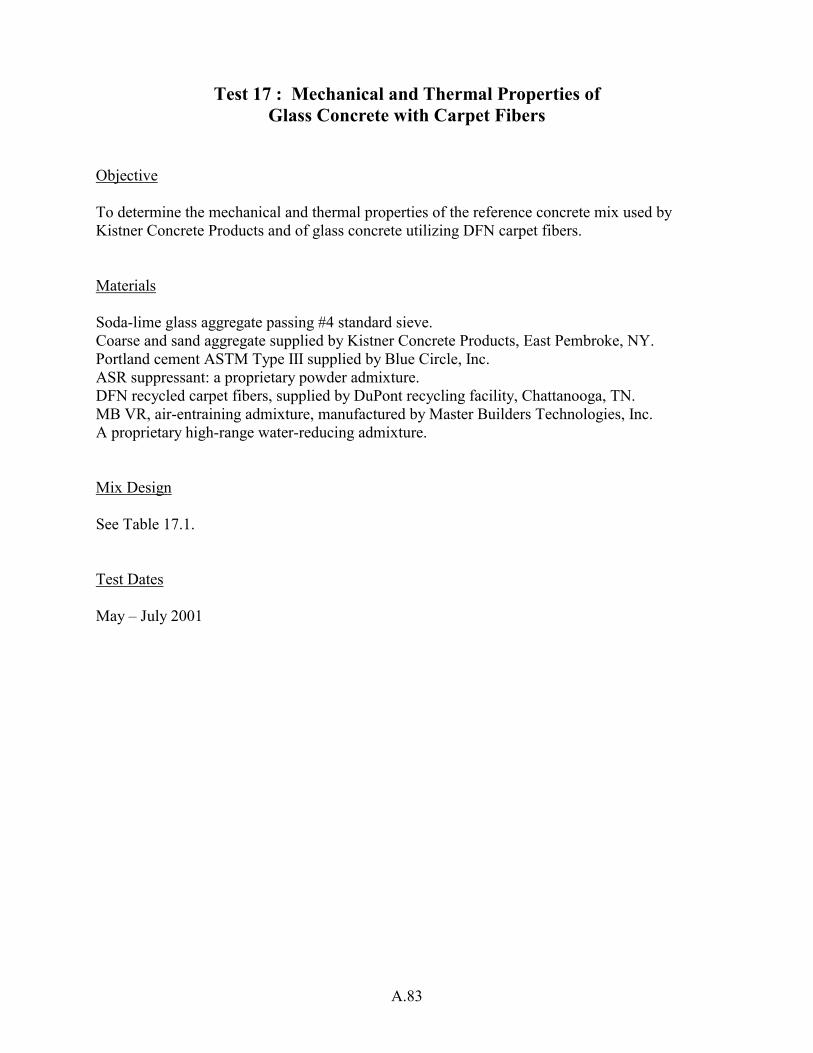
A.83
Test 17 : Mechanical and Thermal Properties of Glass Concrete with Carpet Fibers
Objective To determine the mechanical and thermal properties of the reference concrete mix used by Kistner Concrete Products and of glass concrete utilizing DFN carpet fibers. Materials Soda-lime glass aggregate passing #4 standard sieve. Coarse and sand aggregate supplied by Kistner Concrete Products, East Pembroke, NY. Portland cement ASTM Type III supplied by Blue Circle, Inc. ASR suppressant: a proprietary powder admixture. DFN recycled carpet fibers, supplied by DuPont recycling facility, Chattanooga, TN. MB VR, air-entraining admixture, manufactured by Master Builders Technologies, Inc. A proprietary high-range water-reducing admixture. Mix Design See Table 17.1. Test Dates May – July 2001
A.84
Introduction As described in the previous two test reports, the change in DuPont’s carpet recycling process made it necessary to study those recycled fiber materials that DuPont was now able to provide in quantity and to evaluate their potential for use in concrete applications. In Test 16 it was determined that the material designated as “DFN” had the most promising potential in this regard, in that a reasonable tradeoff between workability, strength, and thermal resistivity was considered possible. To conclude this research project, it was still necessary to develop a concrete mix that might be suitable for Kistner Concrete Products of East Pembroke, NY, for use in their precast basement wall panels. For this purpose, test specimens were produced with the original Kistner mix design, and materials as well as glass concrete mixes containing DFN fiber. Important mechanical properties were determined for each of these mixes. As for the determination of thermal properties, the screening test described in Test 9 had been used exclusively up to this point. However, as this is not a standard test, specimens were prepared and sent to the Holometrix Micromet Laboratory, Bedford, MA, to determine thermal conductivity and resistance according to standard ASTM tests. Test Plan Two concrete systems were tested: “Kistner Concrete” (to serve as reference) and “Glass Concrete” containing 5% by weight DFN recycled carpet fibers. Due to the relatively large volume of concrete involved, the required test samples were produced in two batches for each of the two concrete systems. Details of the mix designs are given in Table 17.1, and the test plan is summarized in Table 17.2. All test specimens were kept in the moisture room for the first 7 days after casting, and then stored in a regular lab environment (20o C, 60% relative humidity). Mechanical strength tests were conducted in the Carleton Laboratory after 28 days, following standard ASTM procedures (see Table 17.2). For the thermal conductivity tests, two slabs of 12 by 12 by 2 inch were cast for each of the Kistner and the Glass Concrete mixes. In order to prepare them for testing, they were ground to a constant 2-inch thickness and then shipped to the Holometrics Micromet Laboratories, Bedford, MA, where they were tested according to ASTM C177. The scope of this test, the “Standard Test Method for Steady-State Heat Flux Measurements and Thermal Transmission Properties by Means of the Guarded-Hot-Plate Apparatus”, is to measure a steady-state heat flux through one or two flat, homogeneous specimen(s). Fig. 17.1 summarizes the layout of an apparatus to obtain such measurements. A primary plate is heated by external power and maintained at constant temperature (Guarded Hot Plate). By insulating the test specimens at their edges, the heat is essentially forced to travel vertically through the test specimens and into heat sinks (Cold Surface Assembly). In the beginning of such a test the assembly will seek some kind of thermal equilibrium or steady state, displayed in Fig. 17.2. The determination of heat flow rate (Q), as indicated, is the objective of this test. By observing temperatures at both sides of the test specimens, the quantity of this steady-state heat flux can be measured. The temperature difference stands for the energy that is absorbed by the specimens. Considering the temperature gradient and the thickness of the specimens, conductivity (W/m K) and resistance (m2 K / W) can be calculated. These numbers are independent of the specimens’
A.85
geometry and allow a comparison of the thermal performance of the material of the test specimens with that of other building materials. Test Results and Discussion Test results are summarized in Table 17.3. Workability. The Kistner mix design has been used successfully for many years in commercial production and does not need to be addressed at this point. Concerning the Glass Concrete mix with DFN recycled carpet fibers, all prior experience was gathered only by studying mortar. When coarse aggregate was added to produce concrete, more water was needed to moisten the surface of the gravel. When using a DFN fiber amount of 5% by weight, according to the results of Test 15, a w/c ratio of 0.51 should be chosen for mortar. In order to produce concrete, this ratio should be increased up to about 0.6 to achieve acceptable workability and still avoid bleeding and segregation. The first batch of Glass Concrete with coarse stone aggregate was produced with w/c = 0.66 to have a standard slump of 7 inch, which is comparable to that of the Kistner mix. But this mix contained too much water and bleeding was observed. The second batch was produced with less water (w/c = 0.58), but a slump test was not carried out, because the high amount of fibers did not allow the slump cone to settle like regular concrete. However, the mix for the second batch was workable as well as compactable. Mechanical Performance. The Glass Concrete system was designed to match the mechanical performance of the Kistner reference concrete mix. To obtain a compressive strength of more than 4 ksi with the mortar after 7 days, the amount of DFN fibers should not exceed 5%. For this fiber content, the compressive strength still exceeds that of the Kistner mix by ~40%. Regarding tensile strength, the DFN carpet fibers do not increase the peak load in a bending test or split cylinder test. On the contrary, tensile strength reductions of 13% and 21% were observed, respectively. However, the fibers are known to help control shrinkage cracks and increase toughness by bridging cracks after reaching the peak load. This effect of the fibers is illustrated very clearly in Fig. 17.3, which shows load-deformation curves for fiber-reinforced specimens in a three-point bending test. It should be recalled that the standard Kistner mix contains 0.5% of ¼-inch long polypropylene fibers. If bridging of both micro- and macro-cracks is to be achieved, a combination of short fibers (such as recycled carpet fibers) and long fibers (such as ¼-inch polypropylene fibers) may be considered. Nevertheless, when increased flexural performance is needed, stronger materials must be chosen for the fibers. Carpet fibers consist mainly of nylon and polypropylene. These are relatively weak materials with low Young’s moduli compared with other types of fibers used to reinforce concrete. Thermal Performance. Both concrete systems contain a small amount of MB VR, an air-entraining admixture, which should provide them with thermal properties superior to those of regular concrete systems. Compared to the Kistner concrete mix, the carpet fibers in the Glass Concrete system improve the thermal performance by approximately 45%, by reducing the thermal conductivity from 1.11 to 0.77 W/m-K (SI units) or from 7.73 to 5.34 Btu-in / hr-F-ft2 (British units). This effect can be explained either with the excellent thermal properties of the polypropylene fibers themselves or by the additional surface area created by the fibers within the concrete matrix. Whether recycled carpet fibers are bound tightly into the cementitious matrix or
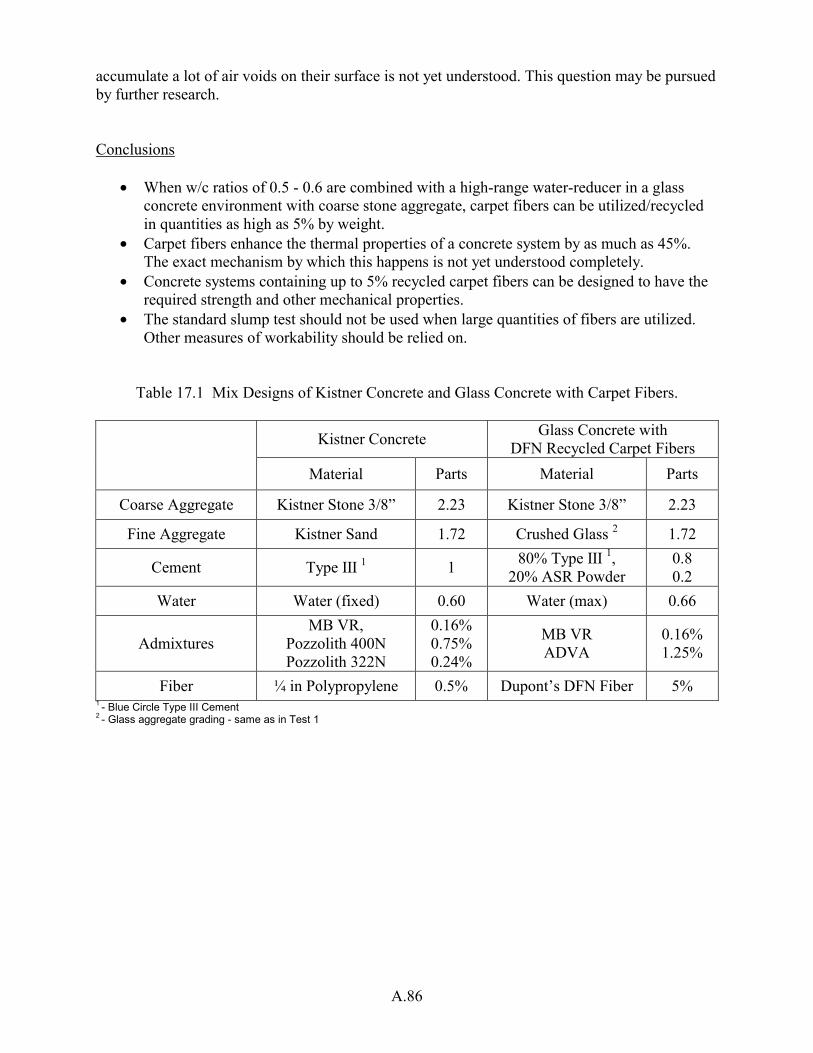
A.86
accumulate a lot of air voids on their surface is not yet understood. This question may be pursued by further research. Conclusions
• When w/c ratios of 0.5 - 0.6 are combined with a high-range water-reducer in a glass concrete environment with coarse stone aggregate, carpet fibers can be utilized/recycled in quantities as high as 5% by weight.
• Carpet fibers enhance the thermal properties of a concrete system by as much as 45%. The exact mechanism by which this happens is not yet understood completely.
• Concrete systems containing up to 5% recycled carpet fibers can be designed to have the required strength and other mechanical properties.
• The standard slump test should not be used when large quantities of fibers are utilized. Other measures of workability should be relied on.
Table 17.1 Mix Designs of Kistner Concrete and Glass Concrete with Carpet Fibers.
Kistner Concrete Glass Concrete with DFN Recycled Carpet Fibers
Material Parts Material Parts
Coarse Aggregate Kistner Stone 3/8” 2.23 Kistner Stone 3/8” 2.23
Fine Aggregate Kistner Sand 1.72 Crushed Glass 2 1.72
Cement Type III 1 1 80% Type III 1, 20% ASR Powder
0.8 0.2
Water Water (fixed) 0.60 Water (max) 0.66
Admixtures MB VR,
Pozzolith 400N Pozzolith 322N
0.16% 0.75% 0.24%
MB VR ADVA
0.16% 1.25%
Fiber ¼ in Polypropylene 0.5% Dupont’s DFN Fiber 5% 1 - Blue Circle Type III Cement 2 - Glass aggregate grading - same as in Test 1
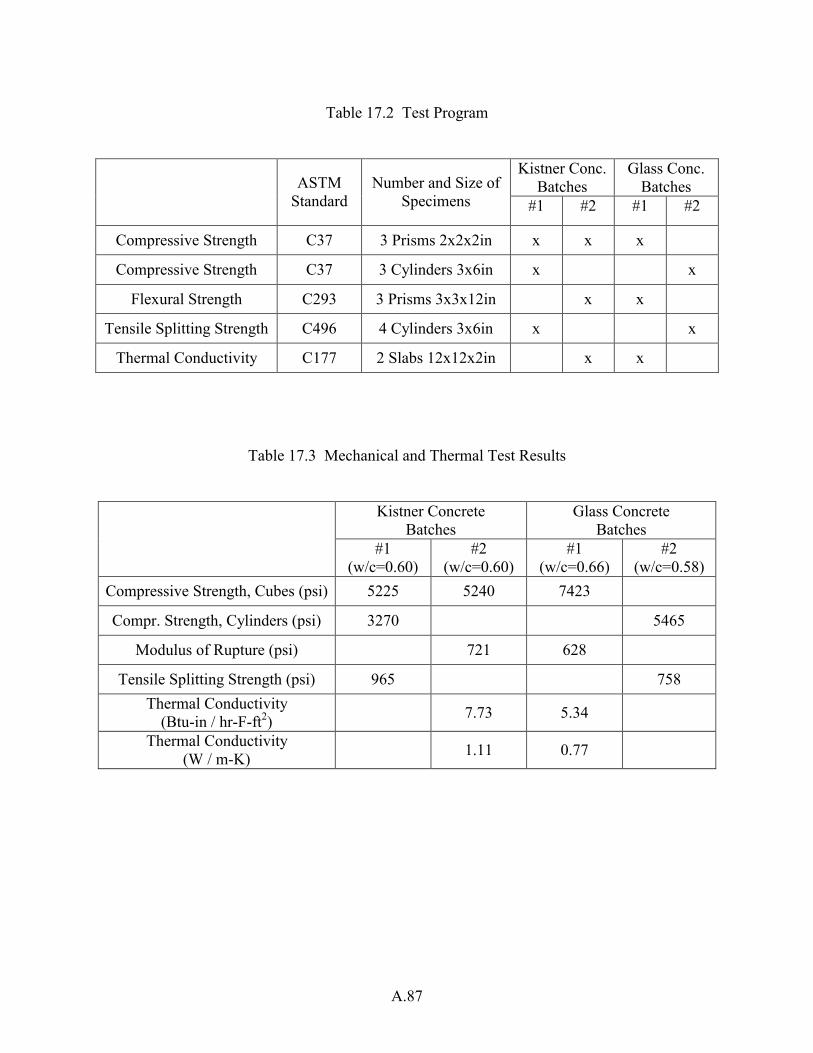
A.87
Table 17.2 Test Program
Kistner Conc. Batches
Glass Conc. Batches ASTM
Standard Number and Size of
Specimens #1 #2 #1 #2
Compressive Strength C37 3 Prisms 2x2x2in x x x
Compressive Strength C37 3 Cylinders 3x6in x x
Flexural Strength C293 3 Prisms 3x3x12in x x
Tensile Splitting Strength C496 4 Cylinders 3x6in x x
Thermal Conductivity C177 2 Slabs 12x12x2in x x
Table 17.3 Mechanical and Thermal Test Results
Kistner Concrete Batches
Glass Concrete Batches #1
(w/c=0.60) #2
(w/c=0.60) #1
(w/c=0.66) #2
(w/c=0.58) Compressive Strength, Cubes (psi) 5225 5240 7423
Compr. Strength, Cylinders (psi) 3270 5465
Modulus of Rupture (psi) 721 628
Tensile Splitting Strength (psi) 965 758 Thermal Conductivity
(Btu-in / hr-F-ft2) 7.73 5.34
Thermal Conductivity (W / m-K) 1.11 0.77
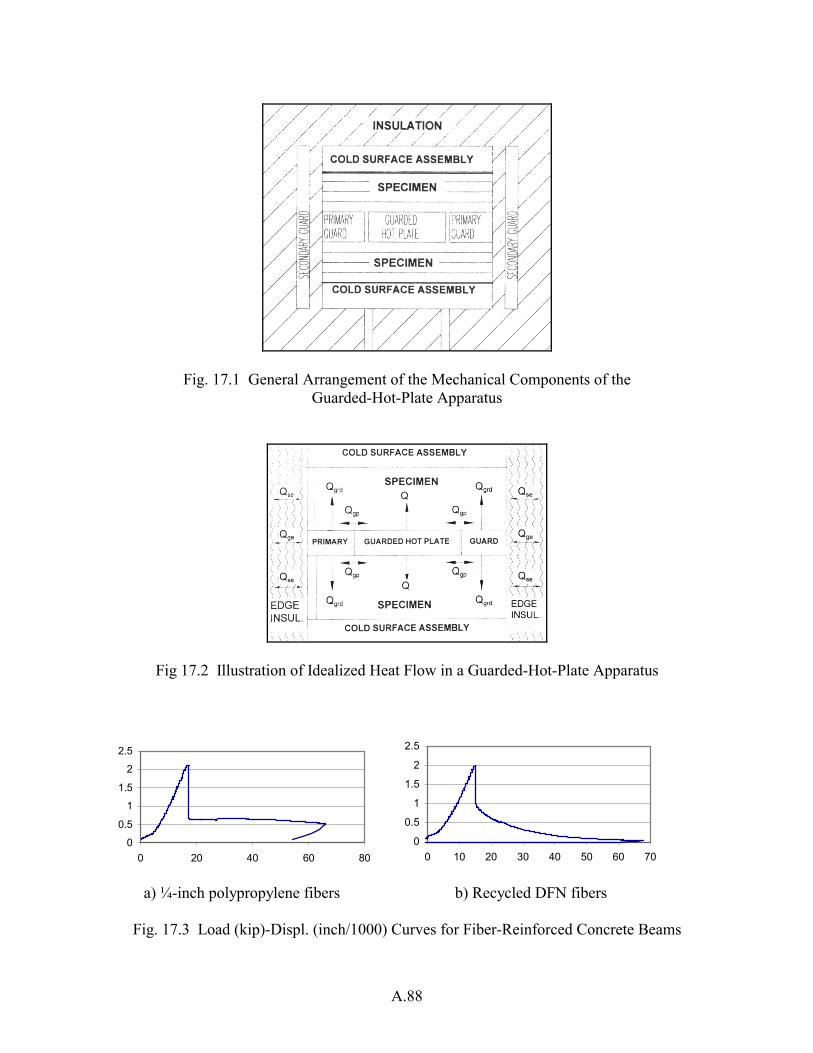
A.88
Fig. 17.1 General Arrangement of the Mechanical Components of the Guarded-Hot-Plate Apparatus
Fig 17.2 Illustration of Idealized Heat Flow in a Guarded-Hot-Plate Apparatus
a) ¼-inch polypropylene fibers b) Recycled DFN fibers
Fig. 17.3 Load (kip)-Displ. (inch/1000) Curves for Fiber-Reinforced Concrete Beams
0
0.5
1
1.5
2
2.5
0 20 40 60 800
0.5
1
1.5
2
2.5
0 10 20 30 40 50 60 70
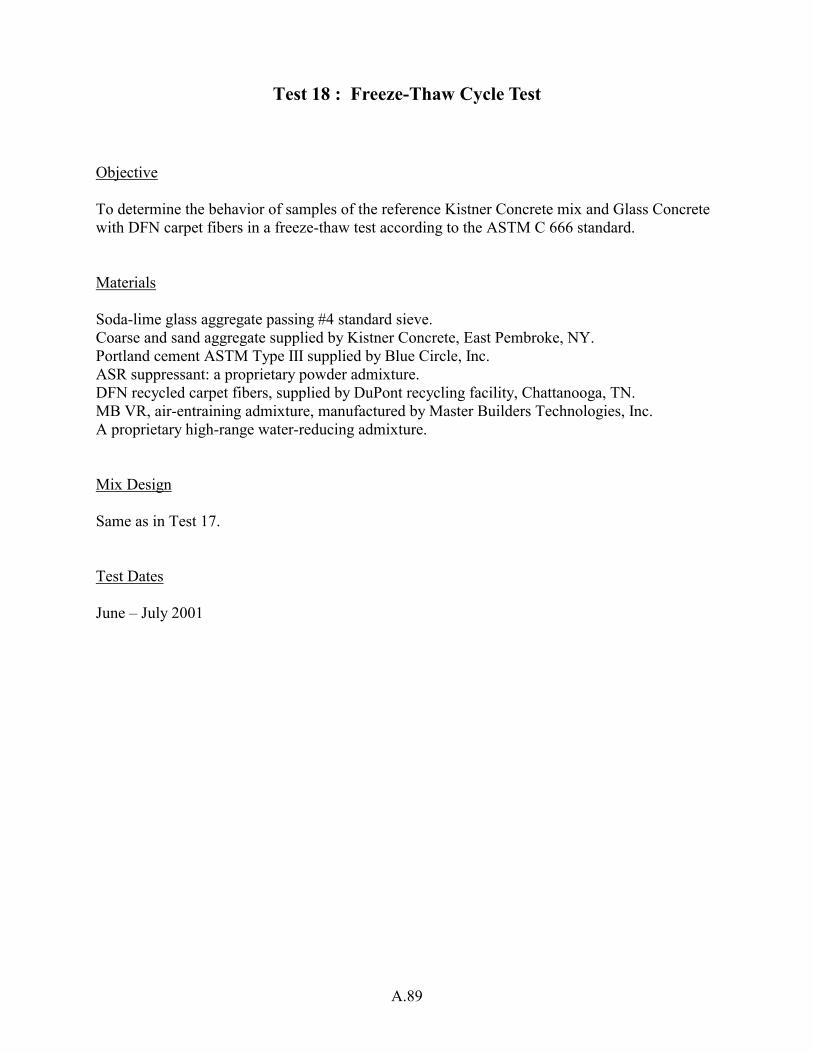
A.89
Test 18 : Freeze-Thaw Cycle Test Objective To determine the behavior of samples of the reference Kistner Concrete mix and Glass Concrete with DFN carpet fibers in a freeze-thaw test according to the ASTM C 666 standard. Materials Soda-lime glass aggregate passing #4 standard sieve. Coarse and sand aggregate supplied by Kistner Concrete, East Pembroke, NY. Portland cement ASTM Type III supplied by Blue Circle, Inc. ASR suppressant: a proprietary powder admixture. DFN recycled carpet fibers, supplied by DuPont recycling facility, Chattanooga, TN. MB VR, air-entraining admixture, manufactured by Master Builders Technologies, Inc. A proprietary high-range water-reducing admixture. Mix Design Same as in Test 17. Test Dates June – July 2001
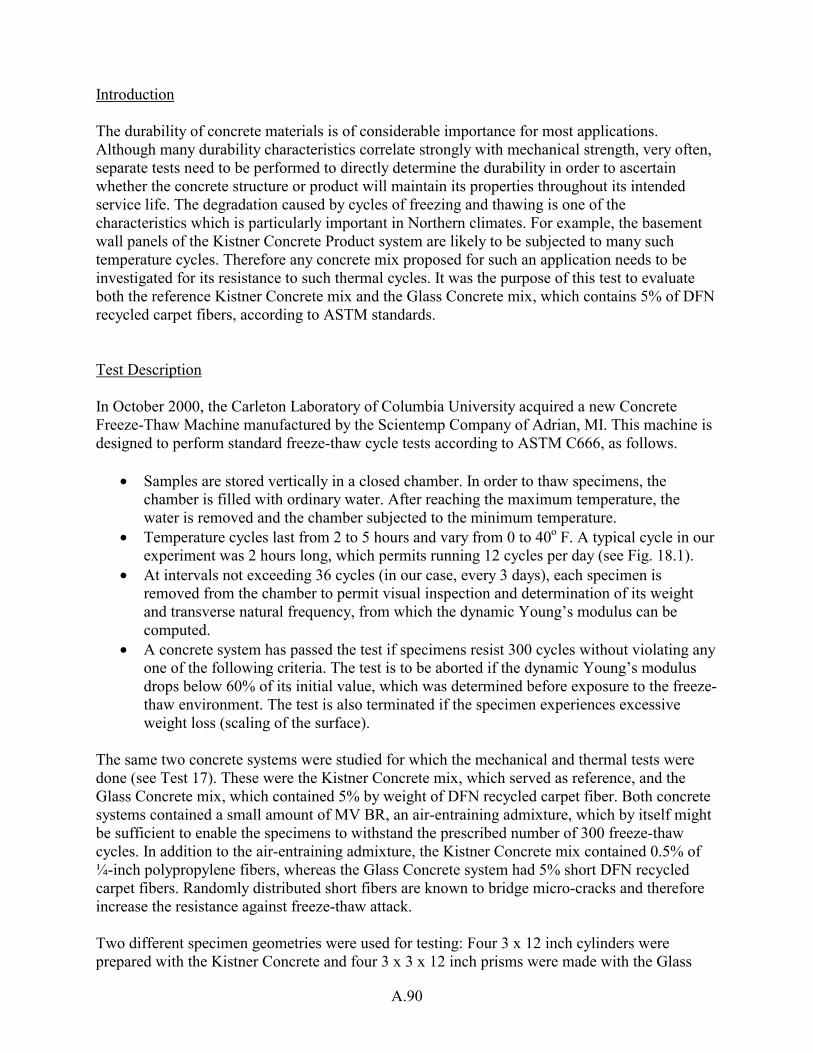
A.90
Introduction The durability of concrete materials is of considerable importance for most applications. Although many durability characteristics correlate strongly with mechanical strength, very often, separate tests need to be performed to directly determine the durability in order to ascertain whether the concrete structure or product will maintain its properties throughout its intended service life. The degradation caused by cycles of freezing and thawing is one of the characteristics which is particularly important in Northern climates. For example, the basement wall panels of the Kistner Concrete Product system are likely to be subjected to many such temperature cycles. Therefore any concrete mix proposed for such an application needs to be investigated for its resistance to such thermal cycles. It was the purpose of this test to evaluate both the reference Kistner Concrete mix and the Glass Concrete mix, which contains 5% of DFN recycled carpet fibers, according to ASTM standards. Test Description In October 2000, the Carleton Laboratory of Columbia University acquired a new Concrete Freeze-Thaw Machine manufactured by the Scientemp Company of Adrian, MI. This machine is designed to perform standard freeze-thaw cycle tests according to ASTM C666, as follows.
• Samples are stored vertically in a closed chamber. In order to thaw specimens, the chamber is filled with ordinary water. After reaching the maximum temperature, the water is removed and the chamber subjected to the minimum temperature.
• Temperature cycles last from 2 to 5 hours and vary from 0 to 40o F. A typical cycle in our experiment was 2 hours long, which permits running 12 cycles per day (see Fig. 18.1).
• At intervals not exceeding 36 cycles (in our case, every 3 days), each specimen is removed from the chamber to permit visual inspection and determination of its weight and transverse natural frequency, from which the dynamic Young’s modulus can be computed.
• A concrete system has passed the test if specimens resist 300 cycles without violating any one of the following criteria. The test is to be aborted if the dynamic Young’s modulus drops below 60% of its initial value, which was determined before exposure to the freeze-thaw environment. The test is also terminated if the specimen experiences excessive weight loss (scaling of the surface).
The same two concrete systems were studied for which the mechanical and thermal tests were done (see Test 17). These were the Kistner Concrete mix, which served as reference, and the Glass Concrete mix, which contained 5% by weight of DFN recycled carpet fiber. Both concrete systems contained a small amount of MV BR, an air-entraining admixture, which by itself might be sufficient to enable the specimens to withstand the prescribed number of 300 freeze-thaw cycles. In addition to the air-entraining admixture, the Kistner Concrete mix contained 0.5% of ¼-inch polypropylene fibers, whereas the Glass Concrete system had 5% short DFN recycled carpet fibers. Randomly distributed short fibers are known to bridge micro-cracks and therefore increase the resistance against freeze-thaw attack. Two different specimen geometries were used for testing: Four 3 x 12 inch cylinders were prepared with the Kistner Concrete and four 3 x 3 x 12 inch prisms were made with the Glass
A.91
Concrete. The test specimens were in the moisture room for the first 7 days and then stored in an ordinary lab environment (20o C, 60% relative humidity) for another 21 days. After passing the prescribed 300 freeze-thaw cycles, one of the four samples was removed from the freeze-thaw chamber each after 400, 500, 600, and 700 cycles. The specimens were cut into 3 parts, each 3 inches long, and tested for residual compressive strength. In addition, several thin slices were prepared and inspected under an ordinary light microscope as well as under a scanning electron microscope in order to study internal damage. Determination of Dynamic Young’s Modulus ASTM Standard C-666 requires that the test specimen’s natural frequency of transverse vibration be determined to monitor the dynamic modulus of elasticity as an indicator of freeze-thaw- induced damage. The method to obtain the natural frequency is described in ASTM C-215. Although this is a standard procedure, it shall be described here in some detail for completeness. The experimental setup is illustrated in Fig. 18.2. Whether of circular or square cross section, the beam specimen is placed horizontally such that it can vibrate freely in its fundamental transverse mode. This can be achieved by supporting it on soft mats at its quarter-points. An accelerometer is mounted on top, at one of its cantilever overhangs and connected to a high-speed data acquisition system. The specimen is hit carefully at the center, for example, with a small hammer, and its response is recorded and evaluated immediately by an attached computer. In order to achieve reliable and repeatable results, the following precautions should be taken.
• The specimen should be hit neither too softly nor too hard to excite its fundamental mode of vibration. Some trial and error is needed to determine the appropriate force level, which should then be maintained throughout the duration of the experiment, i.e., at least through 300 freeze-thaw cycles.
• For specimens with square cross sections it was found to be sufficient to simply place the accelerometer onto the beam. In the case of cylindrical specimens, a rubber band was used to hold the accelerometer in place on the concrete surface. In no case should any kind of attachment device be used, which might introduce errors into the output signal. Because of the learning process involved, useful data were acquired during this test only after the 250th freeze-thaw cycle. Since no damage had been observed by then, this absence of data was without significant consequences.
• For the data acquisition system, a sampling rate of at least twice the expected frequency should be chosen. ASTM C-215 specifies at least 20kHz, which was used in this test.
Typical results are shown in Fig. 18.3 for the Kistner Concrete mix. Fig. 18.3a contains 4000 data points sampled after impact, representing the acceleration time history for a duration of ¼ second. Fig. 18.3b is a close-up of the strong-motion part of the response and includes only 1000 data points, starting at 500 points after impact. ASTM C-215 prescribes the disregard of the first 500 sampling points to exclude potential noise created by the impact. The 1000 sampling points of Fig. 18.3b are used to perform a Fast Fourier Transform to determine the frequency spectrum shown in Fig. 18.3c. This graph clearly identifies the fundamental frequency to be 1920 Hz. This frequency is converted to the dynamic Young’s modulus using the following formula, given in ASTM C-215,
A.92
Dynamic E = C M n2
where M is the specimen mass, and n is the fundamental frequency. The quantity C depends on the geometric shape and size of the specimen, as well as the Poisson’s ratio of the material. For the Kistner Concrete specimens, n = 1920 Hz, M = 2.9 kg, and C was found to be 1758, so that the dynamic modulus becomes 2629 ksi. For the Glass Concrete specimens, n = 2700 Hz, M = 4.0 kg, and C = 1115, giving a dynamic modulus of 4645 ksi. Test Results The specimen weights are plotted in Fig. 18.4 and their natural frequencies in Fig. 18.5, both as functions of the number of freeze-thaw cycles. (No natural frequency data were plotted for the first 250 cycles for reasons stated earlier.) No weight loss due to scaling was detected for either mix throughout the duration of the test, which was terminated after 700 cycles, as described earlier. Also, no significant decrease in the natural frequency could be discerned. Table 18.1 summarizes the strength test results for the four specimens of each of the two mixes. No directly comparable test data were obtained for samples prior to the freeze-cycle test. However, as already documented in Test 17, 28-day compressive strengths were obtained with 3 by 6 inch cylinders and listed again in Table 18.1. However, strengths measured on specimens with those dimensions are considerably lower, for an identical material, than those obtained with 3 by 3 inch cylinders or 3 inch cubes, and therefore these data are not directly comparable. A typical photographic image taken of a Glass Concrete sample on the optical microscope is reproduced in Fig. 18.6. Even though the specimen has been subjected to 700 freeze-thaw cycles, no indication of damage is detectable, either in the interfacial transition zone between aggregate and cement matrix, nor in the matrix itself. Thin slices of both the Kistner Concrete and Glass Concrete samples were also studied under a scanning electron microscope. The extent of microcracking was comparable to that detectable in specimens that had not been subjected to freezing and thawing. Because the attached camera was temporarily unavailable, no micrographs are provided here to substantiate that claim. Conclusions Both, the reference Kistner Concrete mix and the Glass Concrete mix, which contains 5% of DFN recycled carpet fibers, responded to the standard ASTM freeze-thaw cycle test beyond expectations, exceeding by a wide margin the 300 cycles prescribed by ASTM C-666. Whether this performance was due to the air-entraining admixture or other aspects of the concrete mixes is difficult to tell. However, the most important conclusion is that 5% of DFN recycled carpet fiber can be added to the Kistner Concrete mix and part of the natural aggregate replaced by crushed waste glass without impairing the excellent freeze-thaw resistance of the mix.
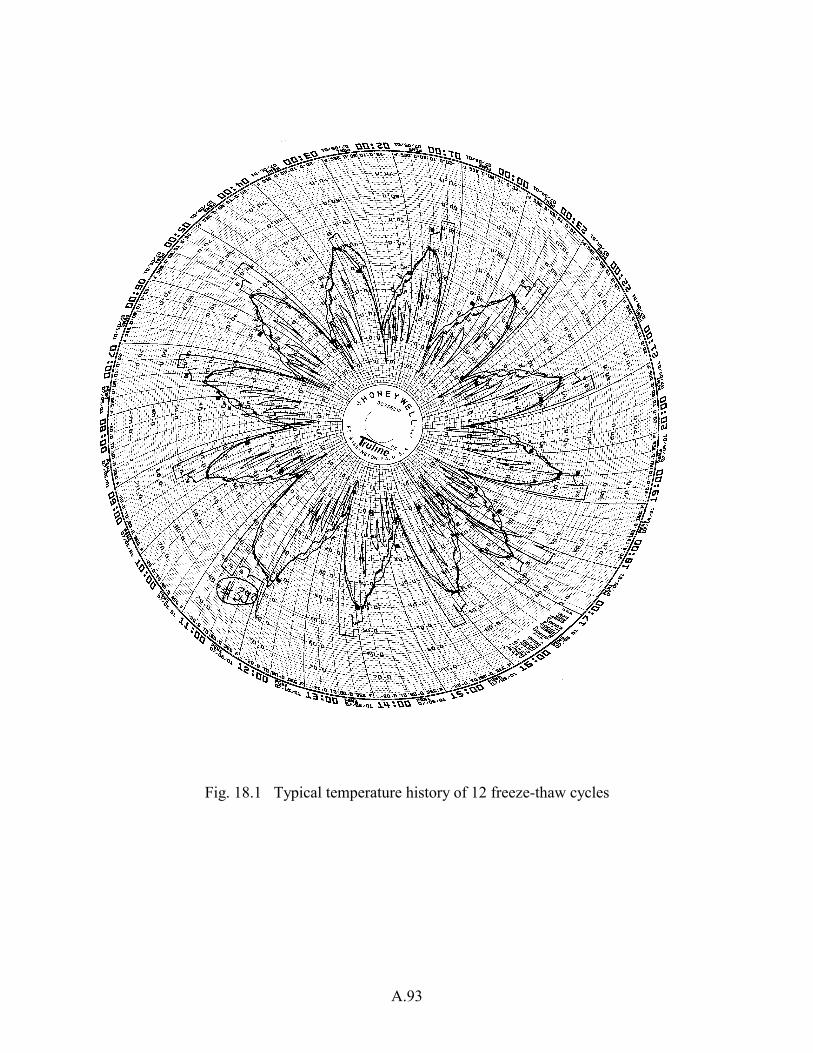
A.93
Fig. 18.1 Typical temperature history of 12 freeze-thaw cycles
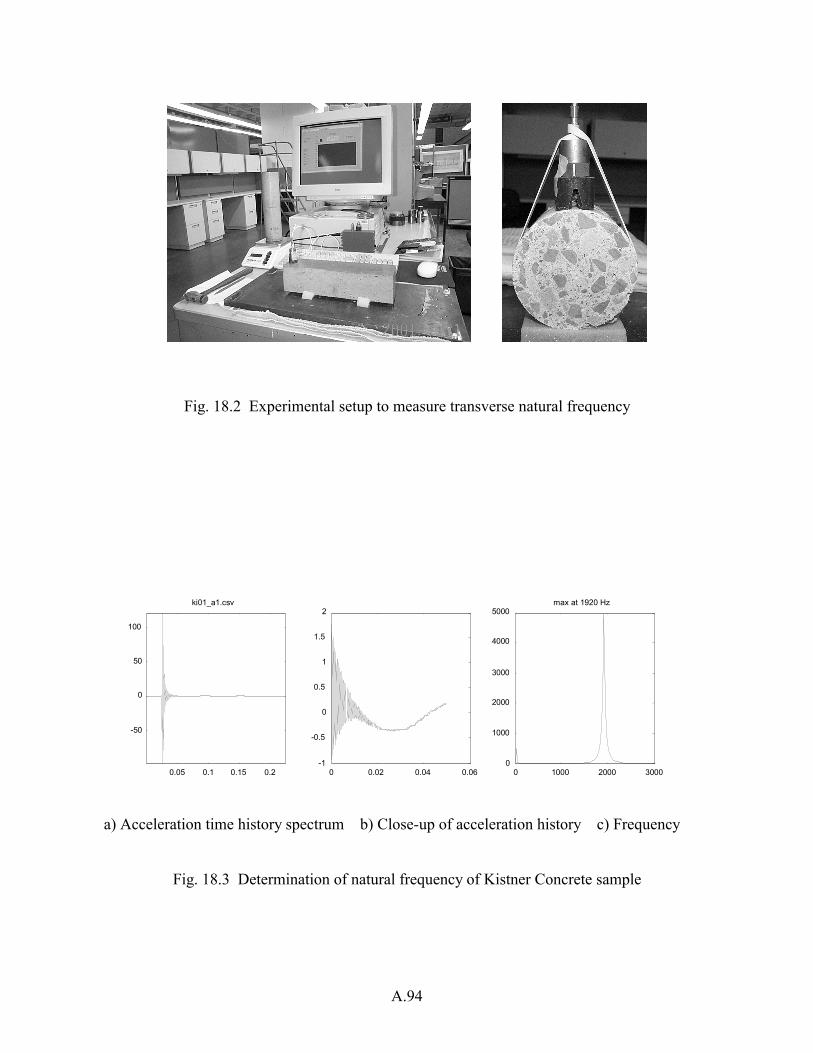
A.94
Fig. 18.2 Experimental setup to measure transverse natural frequency
0.05 0.1 0.15 0.2
-50
0
50
100 ki01_a1.csv
0 0.02 0.04 0.06-1
-0.5 0
0.5 1
1.5 2
0 1000 2000 30000
1000
2000
3000
4000
5000max at 1920 Hz
a) Acceleration time history spectrum b) Close-up of acceleration history c) Frequency
Fig. 18.3 Determination of natural frequency of Kistner Concrete sample
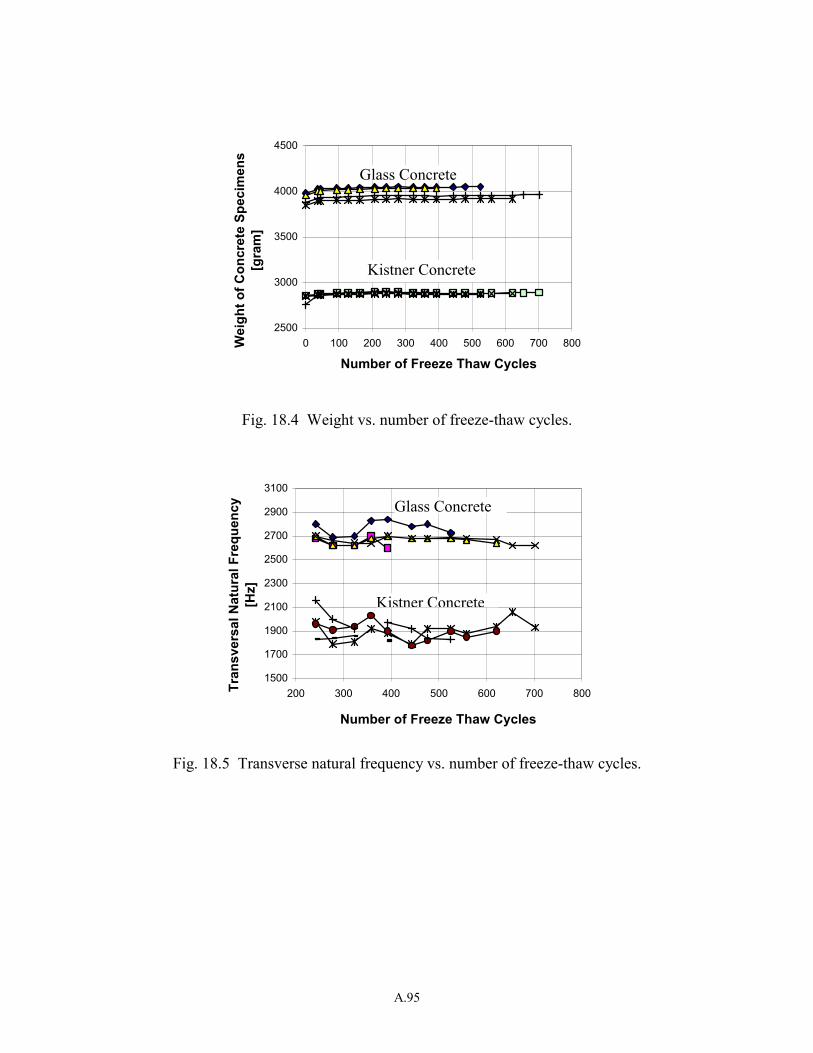
A.95
2500
3000
3500
4000
4500
0 100 200 300 400 500 600 700 800
Number of Freeze Thaw Cycles
Wei
ght o
f Con
cret
e Sp
ecim
ens
[gra
m]
Fig. 18.4 Weight vs. number of freeze-thaw cycles.
1500
1700
1900
2100
2300
2500
2700
2900
3100
200 300 400 500 600 700 800
Number of Freeze Thaw Cycles
Tran
sver
sal N
atur
al F
requ
ency
[Hz]
Fig. 18.5 Transverse natural frequency vs. number of freeze-thaw cycles.
Kistner Concrete
Glass Concrete
Kistner Concrete
Glass Concrete
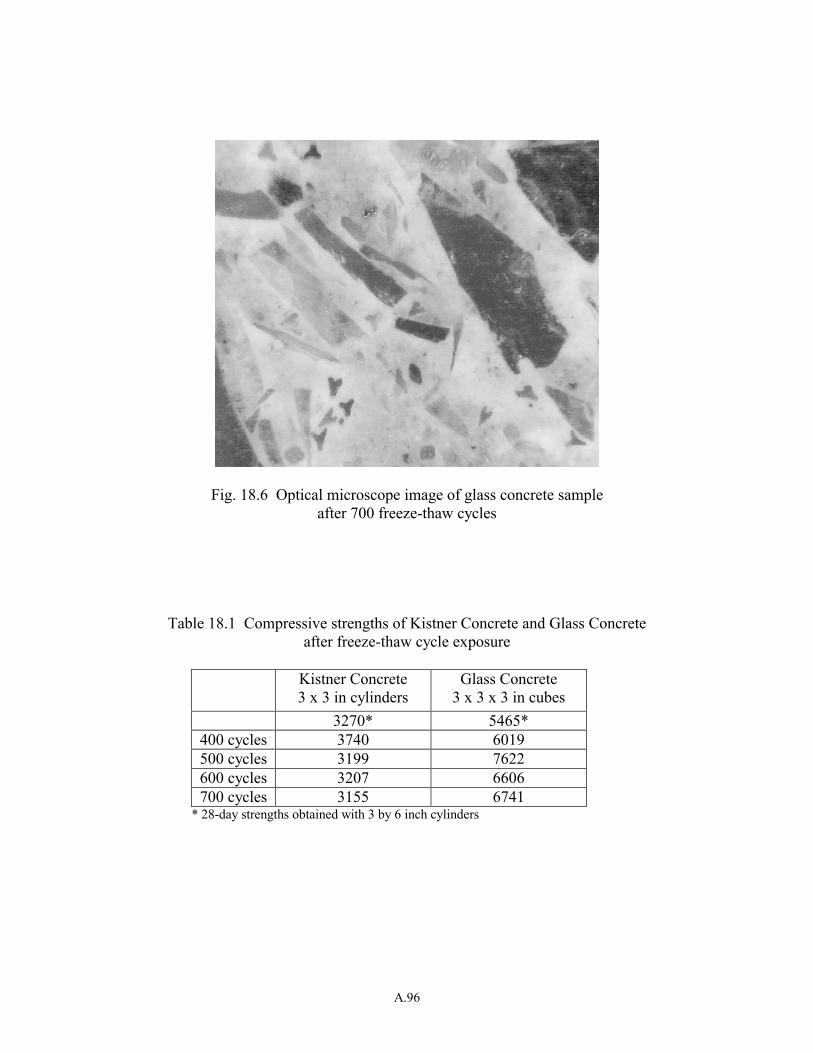
A.96
Fig. 18.6 Optical microscope image of glass concrete sample after 700 freeze-thaw cycles
Table 18.1 Compressive strengths of Kistner Concrete and Glass Concrete after freeze-thaw cycle exposure
Kistner Concrete
3 x 3 in cylinders Glass Concrete
3 x 3 x 3 in cubes 3270* 5465*
400 cycles 3740 6019 500 cycles 3199 7622 600 cycles 3207 6606 700 cycles 3155 6741
* 28-day strengths obtained with 3 by 6 inch cylinders