Embed Size (px)
Citation preview
J. Phys. G: Nucl. Part. Phys.25 (1999) 2161–2175. Printed in the UK PII: S0954-3899(99)03839-6
Test of high-energy interaction models using the hadronic coreof EAS
T Antoni†, W D Apel†, K Bekk†, K Bernlohr†, E Bollmann†, K Daumiller†,P Doll†, J Engler†, F Feßler†, H J Gils†, R Glasstetter†, R Haeusler†,W Hafemann†, A Haungs†, D Heck†, J R Horandel†¶, T Holst†,K-H Kampert†, H O Klages†, J Knapp†+, H J Mathes†, H J Mayer†,J Milke†, D Muhlenberg†, J Oehlschlager†, H Rebel†, M Risse†, M Roth†,G Schatz†, H Schieler†, F K Schmidt†, T Thouw†, H Ulrich†, J Unger†∗,J H Weber†, J Wentz†, T Wiegert†, D Wochele†, J Wochele†, J Kempa‡,T Wibig‡, J Zabierowski‡, F Badea§, H Bozdog§, I M Brancus§, M Petcu§,B Vulpescu§, A Chilingarian‖ and A Vardanyan‖† Institut fur Kernphysik and Institut fur Experimentelle Kernphysik, Forschungszentrum andUniversitat Karlsruhe, PO Box 3640, D-76021 Karlsruhe, Germany‡ Institute for Nuclear Studies and Department of Experimental Physics, University of Lodz,PL-90950 Lodz, Poland§ Institute of Physics and Nuclear Engineering, RO-7690 Bucharest, Romania‖ Cosmic Ray Division, Yerevan Physics Institute, Yerevan 36, Armenia
E-mail: [email protected] (J R Horandel)
Received 28 April 1999, in final form 14 July 1999
Abstract. Using the large hadron calorimeter of the KASCADE experiment, hadronic cores ofextensive air showers have been studied. The hadron lateral and energy distributions have beeninvestigated in order to study the reliability of the shower simulation programCORSIKAwith respectto particle transport, decays, treatment of low-energy particles, etc. A good description of the datahas been found at large distances from the shower core for several interaction models. The innerpart of the hadron distribution, on the other hand, reveals pronounced differences among interactionmodels. Several hadronic observables are compared withCORSIKA simulations using theQGSJET,VENUS andSIBYLL models. QGSJET reproduces the hadronic distributions best. At the highestenergy, in the 10 PeV region, however, none of these models can describe the experimental datasatisfactorily. The expected number of hadrons in a shower is too large compared with the observednumber, when the data are classified according to the muonic shower size.
1. Proem
The interpretation of extensive air shower (EAS) measurements in the PeV domain andabove relies strongly on the hadronic interaction model applied when simulating the showerdevelopment in the Earth’s atmosphere. Such models are needed to describe the interactionprocesses of the primary particles with the air nuclei and the production of secondary particles.
¶ Author to whom correspondence should be addressed. Present address: University of Chicago, Enrico FermiInstitute, Chicago, IL 60637, USA.+ Present address: University of Leeds, Leeds LS2 9JT, UK.∗ Present address: Hewlett-Packard GmbH, Herrenbergerstrasse, D-71004 Boblingen, Germany.
0954-3899/99/102161+15$30.00 © 1999 IOP Publishing Ltd 2161
2162 T Antoni et al
In the EAS Monte Carlo (MC) codes the electromagnetic and weak interactions can becalculated with good accuracy. Hadronic interactions, on the other hand, are still uncertainto a large extent. A wealth of data exists on particle production from pp colliders up toenergies which correspond to 2 PeV/c laboratory momentum and from heavy ion experimentsup to energies of 200 GeV/nucleon. However, almost all collider experiments do not registerparticles emitted in the very forward direction where most of the energy flows. These particlescarry the preponderant part of the energy and, therefore, are of utmost importance for theshower development of an EAS. Since most of these particles are produced in interactionswith small momentum transfer, QCD is not presently capable of calculating their kinematicparameters.
Many phenomenological models have been developed to reproduce the experimentalresults. Extrapolations to higher energies, to small angles, and to nucleus–nucleus collisionshave been performed under different theoretical assumptions. The number of participantnucleons in the latter case is another important parameter which influences the longitudinaldevelopment of a shower. Many EAS experiments have used specific models to determine theprimary energy and to extract information about the primary mass composition. Experienceshows that different models can lead to different results when applied to the same data.
Therefore, it is of crucial importance to verify the individual models experimentally asthoroughly as possible. When planning the KASCADE experiment, one of the principalmotivations to build the hadron calorimeter was the intention to verify available interactionmodels by studying the hadronic central core. In the MC codeCORSIKA [1] five differentinteraction codes have been implemented and placed at the users’ disposal. By examining thehadron distribution in the very centre these interaction models are tested. The propagationcode itself, namely hadron transport, decay modes, scattering etc, is checked by looking to thehadron lateral distribution further outside up to distances of 100 m from the core.
2. The apparatus
The KASCADE experiment consists of an array of 252 stations for electron and muon detectionand a calorimeter in its centre for hadron detection and spectroscopy. It has been describedin detail elsewhere [2]. The muon detectors in the array are positioned directly below thescintillators of the electron detectors and are shielded by slabs of lead and iron correspondingto 20 radiation lengths in total. The absorber imposes an energy threshold of about 300 MeVfor muon detection.
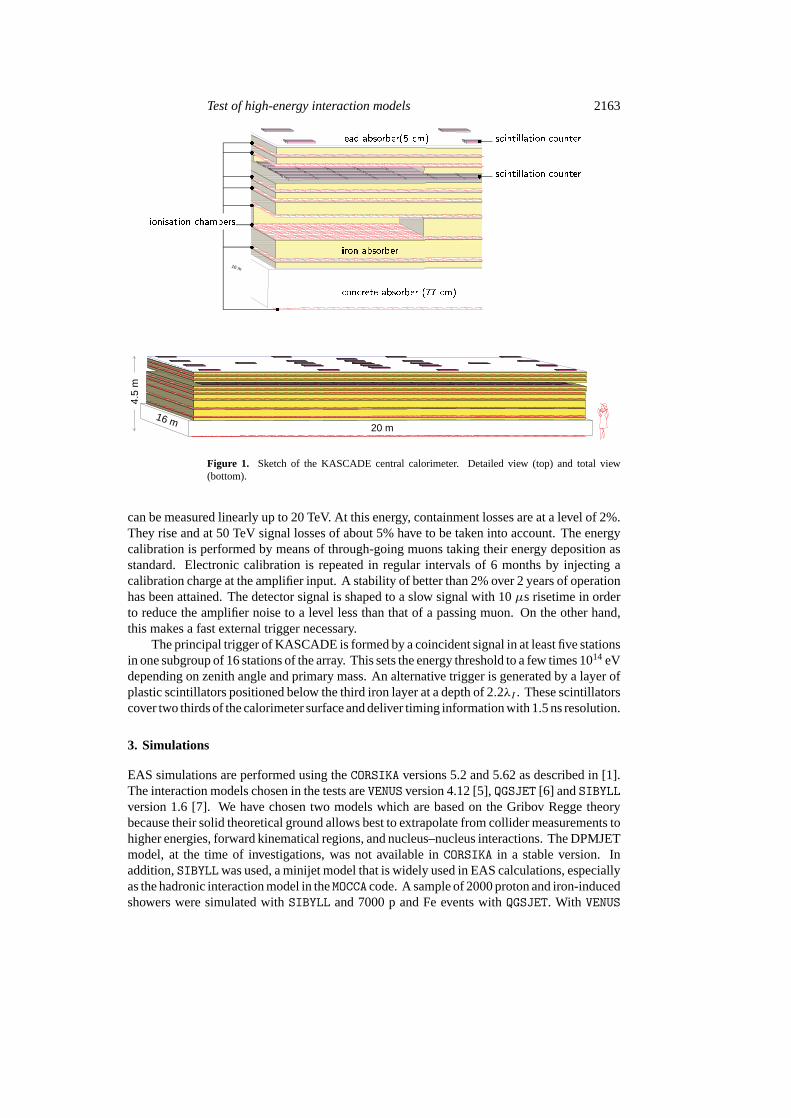
The calorimeter is of the sampling type, the energy being absorbed in an iron stack andsampled in eight layers by ionization chambers. Its performance is described in detail byEngleret al [3]. A sketch of the set up is shown in figure 1. The iron slabs are 12–36 cmthick, becoming thicker in deeper parts of the calorimeter. Therefore, the energy resolutiondoes not scale as 1/
√E, but is rather constant varying slowly fromσ/E = 20% at 100 GeV
to 10% at 10 TeV. The concrete ceiling of the detector building is the last part of the absorberand the ionization chamber layer below acts as tail catcher. In total, the calorimeter thicknesscorresponds to 11 interaction lengthsλI for vertical hadrons. On top, a 5 cm lead layer filtersoff the electromagnetic component to a sufficiently low level.
The liquid ionization chambers use the room temperature liquids tetramethylsilane (TMS)and tetramethylpentane (TMP). A detailed description of their performance can be foundelsewhere [4]. Liquid ionization chambers exhibit a linear signal behaviour with a very largedynamic range. The latter is limited only by the electronics to about 5× 10⁴ of the amplifierrms noise, i.e., the signal of one to more than 104 passing muons, equivalent to 10 GeVdeposited energy, is read out without saturation. This ensures the energy of individual hadrons
Test of high-energy interaction models 2163
20 m16 m
4.5
m
16 m
Figure 1. Sketch of the KASCADE central calorimeter. Detailed view (top) and total view(bottom).
can be measured linearly up to 20 TeV. At this energy, containment losses are at a level of 2%.They rise and at 50 TeV signal losses of about 5% have to be taken into account. The energycalibration is performed by means of through-going muons taking their energy deposition asstandard. Electronic calibration is repeated in regular intervals of 6 months by injecting acalibration charge at the amplifier input. A stability of better than 2% over 2 years of operationhas been attained. The detector signal is shaped to a slow signal with 10µs risetime in orderto reduce the amplifier noise to a level less than that of a passing muon. On the other hand,this makes a fast external trigger necessary.
The principal trigger of KASCADE is formed by a coincident signal in at least five stationsin one subgroup of 16 stations of the array. This sets the energy threshold to a few times 1014 eVdepending on zenith angle and primary mass. An alternative trigger is generated by a layer ofplastic scintillators positioned below the third iron layer at a depth of 2.2λI . These scintillatorscover two thirds of the calorimeter surface and deliver timing information with 1.5 ns resolution.
3. Simulations
EAS simulations are performed using theCORSIKA versions 5.2 and 5.62 as described in [1].The interaction models chosen in the tests areVENUS version 4.12 [5],QGSJET [6] andSIBYLLversion 1.6 [7]. We have chosen two models which are based on the Gribov Regge theorybecause their solid theoretical ground allows best to extrapolate from collider measurements tohigher energies, forward kinematical regions, and nucleus–nucleus interactions. The DPMJETmodel, at the time of investigations, was not available inCORSIKA in a stable version. Inaddition,SIBYLLwas used, a minijet model that is widely used in EAS calculations, especiallyas the hadronic interaction model in theMOCCA code. A sample of 2000 proton and iron-inducedshowers were simulated withSIBYLL and 7000 p and Fe events withQGSJET. With VENUS
2164 T Antoni et al
2000 showers were generated, each for p, He, O, Si and Fe primaries. The showers weredistributed in the energy range of 0.1 to 31.6 PeV according to a power law with a differentialindex of−2.7 and were equally spread in the interval of 15◦ to 20◦ zenith angle. In addition,the changing of the index to−3.1 at the knee position, which is assumed to be at 5 PeV,was taken into account. The shower axes were spread uniformly over the calorimeter surfaceextended by 2 m beyond its boundary.
In order to determine the signals in the individual detectors, all secondary particles atground level are passed through a detector simulation program using theGEANT package [8].By these means, the instrumental response is taken into account and the simulated events areanalysed in the same way as the experimental data, an important aspect to avoid systematicbiases by pattern recognition and reconstruction algorithms.
4. Shower size determination
The data evaluation proceeds via three levels. In a first step the shower core and its direction ofincidence are reconstructed and, using the single-muon calibration of the array detectors, theirenergy deposits are converted into numbers of particles. In the next stage, iterative correctionsfor electromagnetic punch-through in the muon detectors and muonic energy deposits in theelectron detectors are applied. The particle densities are fitted with a likelihood function tothe Nishimura–Kamata–Greisen (NKG) formula [9]. Radius parameters of 89 m and 420 mare used for electrons and muons, respectively. Because of limited statistics, the radial slopeparameter (age) is fixed for the muons. The radius parameters deviate from the parametersoriginally proposed, but have been found to yield the best agreement with the data. Themuon fit extends from 40 to 200 m, the lower cut being imposed by the strong hadronicand electromagnetic punch-through near the shower centre. The upper boundary reflects thegeometrical acceptance. In a final step, the muon fit function is used to correct the electronnumbers and vice versa.
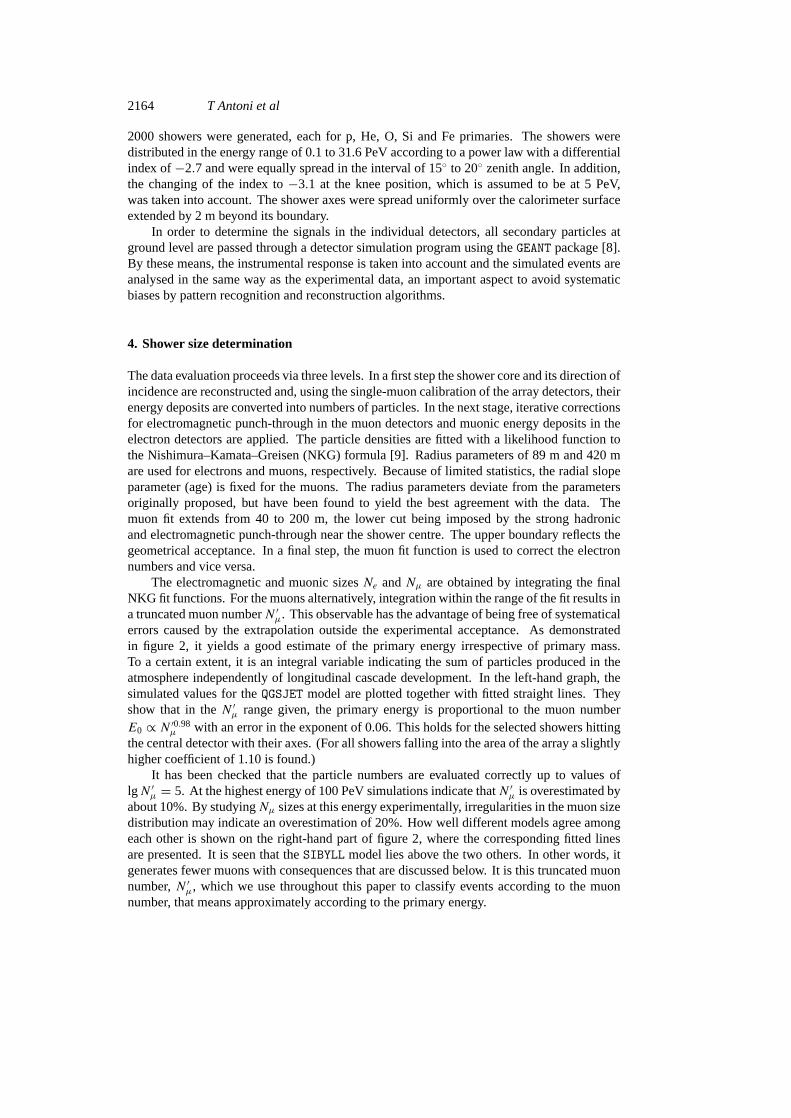
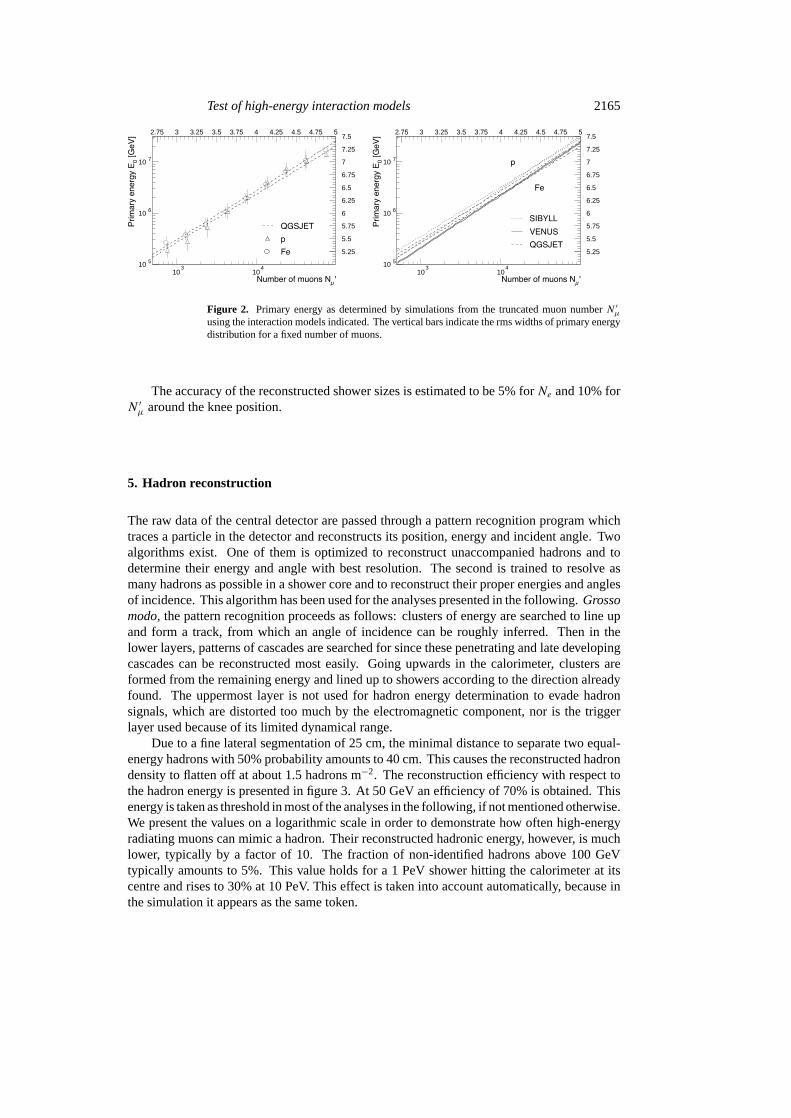
The electromagnetic and muonic sizesNe andNµ are obtained by integrating the finalNKG fit functions. For the muons alternatively, integration within the range of the fit results ina truncated muon numberN ′µ. This observable has the advantage of being free of systematicalerrors caused by the extrapolation outside the experimental acceptance. As demonstratedin figure 2, it yields a good estimate of the primary energy irrespective of primary mass.To a certain extent, it is an integral variable indicating the sum of particles produced in theatmosphere independently of longitudinal cascade development. In the left-hand graph, thesimulated values for theQGSJET model are plotted together with fitted straight lines. Theyshow that in theN ′µ range given, the primary energy is proportional to the muon numberE0 ∝ N ′0.98
µ with an error in the exponent of 0.06. This holds for the selected showers hittingthe central detector with their axes. (For all showers falling into the area of the array a slightlyhigher coefficient of 1.10 is found.)
It has been checked that the particle numbers are evaluated correctly up to values oflgN ′µ = 5. At the highest energy of 100 PeV simulations indicate thatN ′µ is overestimated byabout 10%. By studyingNµ sizes at this energy experimentally, irregularities in the muon sizedistribution may indicate an overestimation of 20%. How well different models agree amongeach other is shown on the right-hand part of figure 2, where the corresponding fitted linesare presented. It is seen that theSIBYLL model lies above the two others. In other words, itgenerates fewer muons with consequences that are discussed below. It is this truncated muonnumber,N ′µ, which we use throughout this paper to classify events according to the muonnumber, that means approximately according to the primary energy.
Test of high-energy interaction models 2165
10 5
10 6
10 7
103
104
5.25
5.5
5.75
6
6.25
6.5
6.75
7
7.25
7.52.75 3 3.25 3.5 3.75 4 4.25 4.5 4.75 5
10 5
10 6
10 7
103
104
5.25
5.5
5.75
6
6.25
6.5
6.75
7
7.25
7.52.75 3 3.25 3.5 3.75 4 4.25 4.5 4.75 5
Figure 2. Primary energy as determined by simulations from the truncated muon numberN ′µusing the interaction models indicated. The vertical bars indicate the rms widths of primary energydistribution for a fixed number of muons.
The accuracy of the reconstructed shower sizes is estimated to be 5% forNe and 10% forN ′µ around the knee position.
5. Hadron reconstruction
The raw data of the central detector are passed through a pattern recognition program whichtraces a particle in the detector and reconstructs its position, energy and incident angle. Twoalgorithms exist. One of them is optimized to reconstruct unaccompanied hadrons and todetermine their energy and angle with best resolution. The second is trained to resolve asmany hadrons as possible in a shower core and to reconstruct their proper energies and anglesof incidence. This algorithm has been used for the analyses presented in the following.Grossomodo, the pattern recognition proceeds as follows: clusters of energy are searched to line upand form a track, from which an angle of incidence can be roughly inferred. Then in thelower layers, patterns of cascades are searched for since these penetrating and late developingcascades can be reconstructed most easily. Going upwards in the calorimeter, clusters areformed from the remaining energy and lined up to showers according to the direction alreadyfound. The uppermost layer is not used for hadron energy determination to evade hadronsignals, which are distorted too much by the electromagnetic component, nor is the triggerlayer used because of its limited dynamical range.
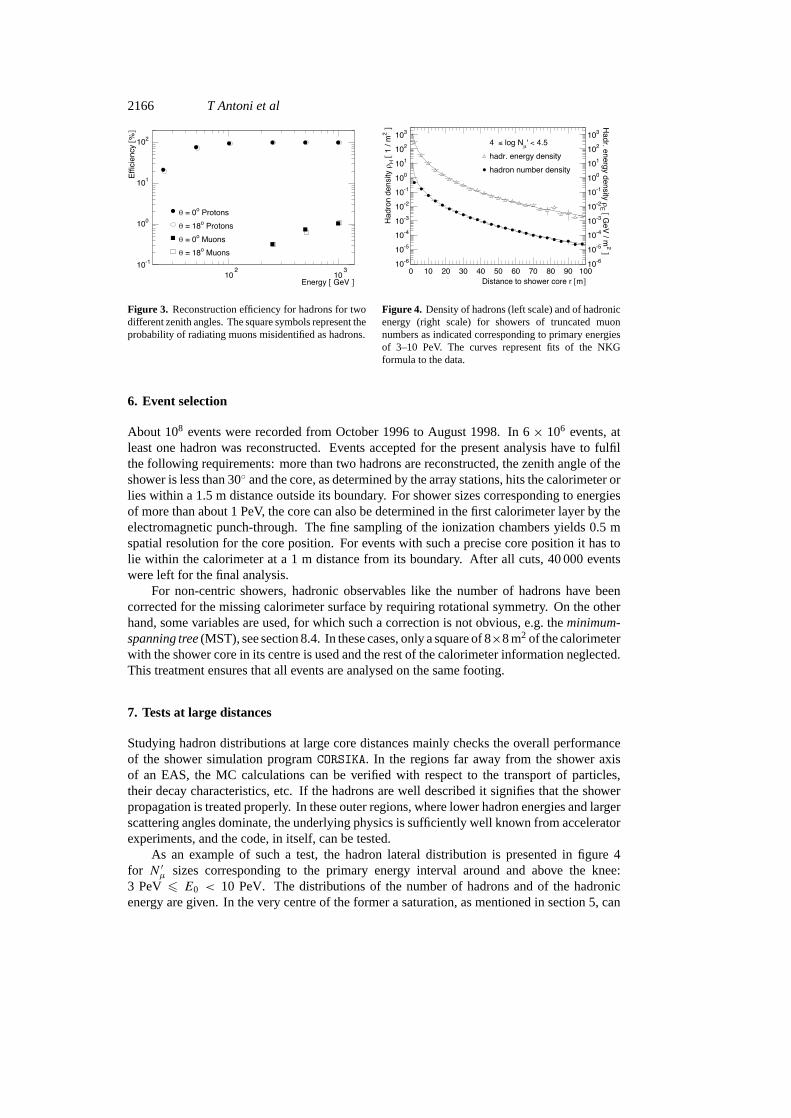
Due to a fine lateral segmentation of 25 cm, the minimal distance to separate two equal-energy hadrons with 50% probability amounts to 40 cm. This causes the reconstructed hadrondensity to flatten off at about 1.5 hadrons m−2. The reconstruction efficiency with respect tothe hadron energy is presented in figure 3. At 50 GeV an efficiency of 70% is obtained. Thisenergy is taken as threshold in most of the analyses in the following, if not mentioned otherwise.We present the values on a logarithmic scale in order to demonstrate how often high-energyradiating muons can mimic a hadron. Their reconstructed hadronic energy, however, is muchlower, typically by a factor of 10. The fraction of non-identified hadrons above 100 GeVtypically amounts to 5%. This value holds for a 1 PeV shower hitting the calorimeter at itscentre and rises to 30% at 10 PeV. This effect is taken into account automatically, because inthe simulation it appears as the same token.
2166 T Antoni et al
Figure 3. Reconstruction efficiency for hadrons for twodifferent zenith angles. The square symbols represent theprobability of radiating muons misidentified as hadrons.
Figure 4. Density of hadrons (left scale) and of hadronicenergy (right scale) for showers of truncated muonnumbers as indicated corresponding to primary energiesof 3–10 PeV. The curves represent fits of the NKGformula to the data.
6. Event selection
About 108 events were recorded from October 1996 to August 1998. In 6× 10⁶ events, atleast one hadron was reconstructed. Events accepted for the present analysis have to fulfilthe following requirements: more than two hadrons are reconstructed, the zenith angle of theshower is less than 30◦ and the core, as determined by the array stations, hits the calorimeter orlies within a 1.5 m distance outside its boundary. For shower sizes corresponding to energiesof more than about 1 PeV, the core can also be determined in the first calorimeter layer by theelectromagnetic punch-through. The fine sampling of the ionization chambers yields 0.5 mspatial resolution for the core position. For events with such a precise core position it has tolie within the calorimeter at a 1 mdistance from its boundary. After all cuts, 40 000 eventswere left for the final analysis.
For non-centric showers, hadronic observables like the number of hadrons have beencorrected for the missing calorimeter surface by requiring rotational symmetry. On the otherhand, some variables are used, for which such a correction is not obvious, e.g. theminimum-spanning tree(MST), see section 8.4. In these cases, only a square of 8×8 m2 of the calorimeterwith the shower core in its centre is used and the rest of the calorimeter information neglected.This treatment ensures that all events are analysed on the same footing.
7. Tests at large distances
Studying hadron distributions at large core distances mainly checks the overall performanceof the shower simulation programCORSIKA. In the regions far away from the shower axisof an EAS, the MC calculations can be verified with respect to the transport of particles,their decay characteristics, etc. If the hadrons are well described it signifies that the showerpropagation is treated properly. In these outer regions, where lower hadron energies and largerscattering angles dominate, the underlying physics is sufficiently well known from acceleratorexperiments, and the code, in itself, can be tested.
As an example of such a test, the hadron lateral distribution is presented in figure 4for N ′µ sizes corresponding to the primary energy interval around and above the knee:3 PeV6 E0 < 10 PeV. The distributions of the number of hadrons and of the hadronicenergy are given. In the very centre of the former a saturation, as mentioned in section 5, can

Test of high-energy interaction models 2167
Figure 5. Density of hadronic energy (filled circles) versus core distance for two intervals ofprimary energy. The indicated muon numbers correspond to 1 PeV6 E0 < 3 PeV and3 PeV6 E0 < 10 PeV. TheCORSIKA simulations (open symbols) represent primary protonand iron nuclei with theQGSJET model.
be noticed. Several functions have been tried to fit the data points, among others, exponentialsas suggested by Kempa [10]. However, by far the best fit was obtained when applying the NKGformula represented by the curves shown in the graph. This finding is not particularly surprisingbecause hadrons of an energy of approximately 100 GeV [10], when passing through theatmosphere, generate the electromagnetic component, and the NKG formula has been derivedfor electromagnetic cascades. In addition, multiple scattering of electrons determining theMoli ere radius resembles the scattering character of hadrons with a mean transverse momentumof 400 MeV/c irrespective of their energy. Replacing the mean multiple scattering by the latterand the radiation length by the interaction length one arrives at a radiusRH of about 10 m.We expect this value to take the place of the Moliere radius in the NKG formula for electronmeasurements. Indeed, values of this order are found experimentally.
Lateral hadron distributions compared withCORSIKA simulations are shown in figure 5for primary energies below and above the knee. In the diagrams the hadronic energy densityis plotted for muon numbers corresponding to the primary energy intervals of 1 PeV6 E0 <
3 PeV and 3 PeV6 E0 < 10 PeV. The data points are compared with primary proton and ironsimulations applying theQGSJET model. These two extreme assumptions about the massesresult in nearly identical hadron densities and the measured data coincide with the simulations,thereby verifying the calculations. Similar good agreement is found for theVENUS andSIBYLLmodels. Simulations and data agree well up to 100 m distance from the core. Only in thevery inner region of 10 m, do the simulations yield deviating hadron densities for differentprimary masses. Nevertheless, the measurements here lie well within the two extreme primarycompositions of pure protons or pure iron nuclei.
8. Tests at shower core
8.1. Hadron lateral distribution
To begin with, the lateral distributions are compared with values published in the literature.Hadron distributions in the core of EAS have been measured at Ooty by Vatcha and Sreekantan[11] and at Tien Shan by Danilovaet al[12]. Results of earlier experiments have been examinedand discussed by Sreekantanet al [13]. In the experiments different techniques for hadrondetection have been applied: a cloud chamber at Ooty, long gaseous ionization tubes at TienShan and liquid ionization chambers in the present experiment. Therefore, it is of interest to
2168 T Antoni et al
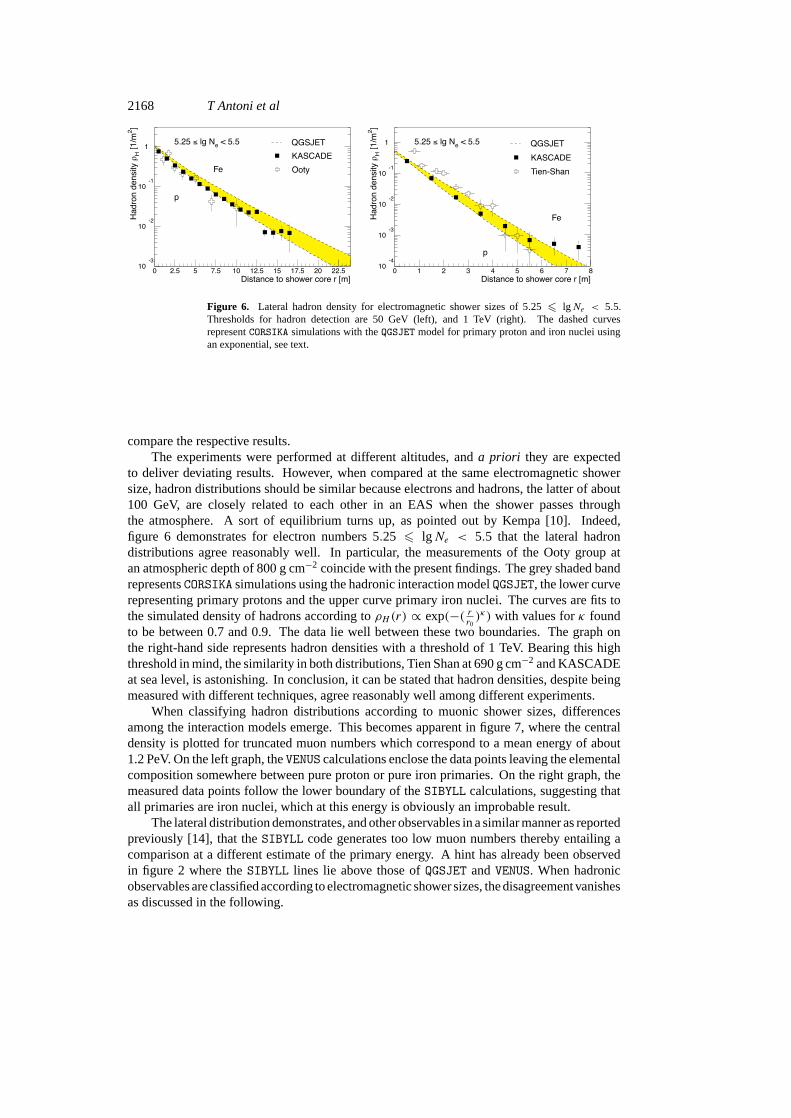
Figure 6. Lateral hadron density for electromagnetic shower sizes of 5.25 6 lgNe < 5.5.Thresholds for hadron detection are 50 GeV (left), and 1 TeV (right). The dashed curvesrepresentCORSIKA simulations with theQGSJET model for primary proton and iron nuclei usingan exponential, see text.
compare the respective results.The experiments were performed at different altitudes, anda priori they are expected
to deliver deviating results. However, when compared at the same electromagnetic showersize, hadron distributions should be similar because electrons and hadrons, the latter of about100 GeV, are closely related to each other in an EAS when the shower passes throughthe atmosphere. A sort of equilibrium turns up, as pointed out by Kempa [10]. Indeed,figure 6 demonstrates for electron numbers 5.25 6 lgNe < 5.5 that the lateral hadrondistributions agree reasonably well. In particular, the measurements of the Ooty group atan atmospheric depth of 800 g cm−2 coincide with the present findings. The grey shaded bandrepresentsCORSIKA simulations using the hadronic interaction modelQGSJET, the lower curverepresenting primary protons and the upper curve primary iron nuclei. The curves are fits tothe simulated density of hadrons according toρH (r) ∝ exp(−( r
r0)κ) with values forκ found
to be between 0.7 and 0.9. The data lie well between these two boundaries. The graph onthe right-hand side represents hadron densities with a threshold of 1 TeV. Bearing this highthreshold in mind, the similarity in both distributions, Tien Shan at 690 g cm−2 and KASCADEat sea level, is astonishing. In conclusion, it can be stated that hadron densities, despite beingmeasured with different techniques, agree reasonably well among different experiments.
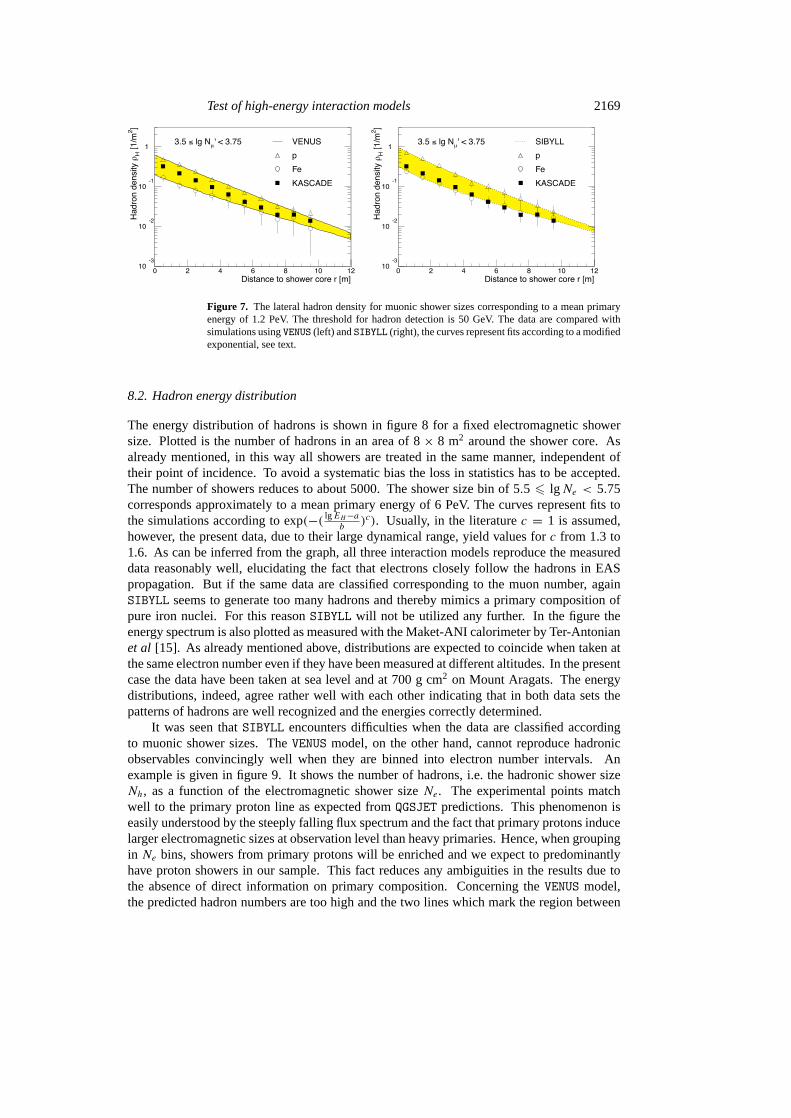
When classifying hadron distributions according to muonic shower sizes, differencesamong the interaction models emerge. This becomes apparent in figure 7, where the centraldensity is plotted for truncated muon numbers which correspond to a mean energy of about1.2 PeV. On the left graph, theVENUS calculations enclose the data points leaving the elementalcomposition somewhere between pure proton or pure iron primaries. On the right graph, themeasured data points follow the lower boundary of theSIBYLL calculations, suggesting thatall primaries are iron nuclei, which at this energy is obviously an improbable result.
The lateral distribution demonstrates, and other observables in a similar manner as reportedpreviously [14], that theSIBYLL code generates too low muon numbers thereby entailing acomparison at a different estimate of the primary energy. A hint has already been observedin figure 2 where theSIBYLL lines lie above those ofQGSJET andVENUS. When hadronicobservables are classified according to electromagnetic shower sizes, the disagreement vanishesas discussed in the following.
Test of high-energy interaction models 2169
Figure 7. The lateral hadron density for muonic shower sizes corresponding to a mean primaryenergy of 1.2 PeV. The threshold for hadron detection is 50 GeV. The data are compared withsimulations usingVENUS (left) andSIBYLL (right), the curves represent fits according to a modifiedexponential, see text.
8.2. Hadron energy distribution
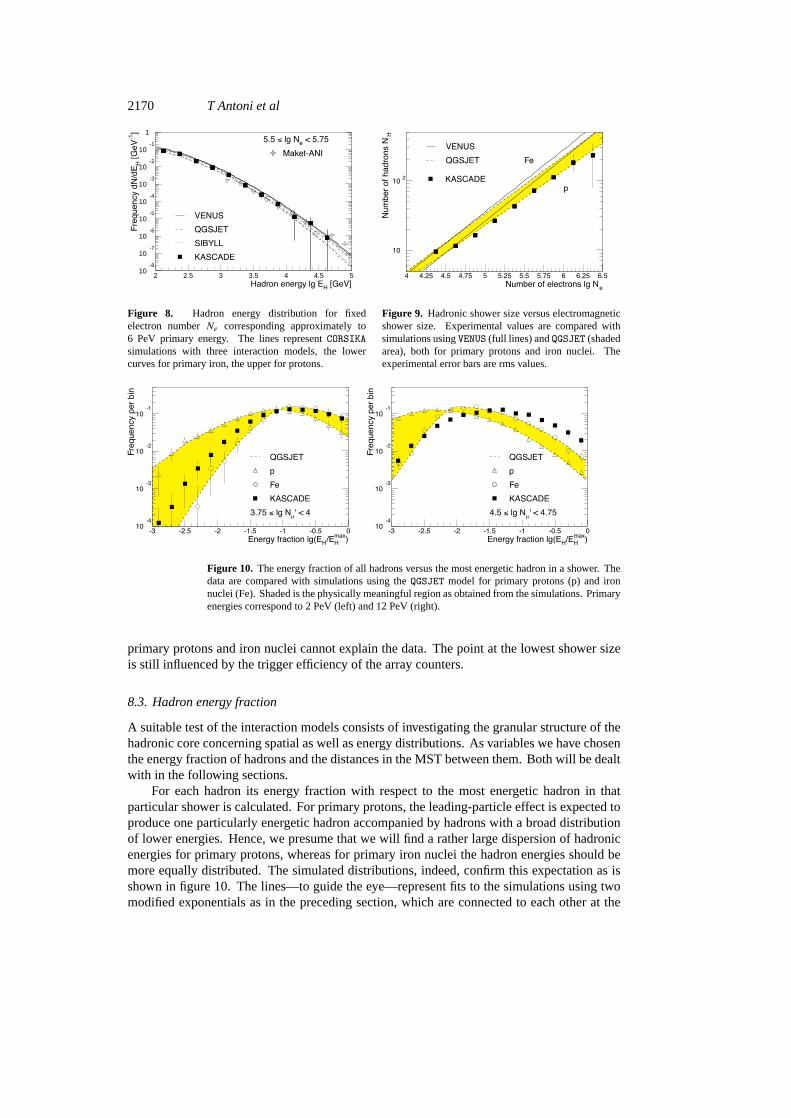
The energy distribution of hadrons is shown in figure 8 for a fixed electromagnetic showersize. Plotted is the number of hadrons in an area of 8× 8 m2 around the shower core. Asalready mentioned, in this way all showers are treated in the same manner, independent oftheir point of incidence. To avoid a systematic bias the loss in statistics has to be accepted.The number of showers reduces to about 5000. The shower size bin of 5.5 6 lgNe < 5.75corresponds approximately to a mean primary energy of 6 PeV. The curves represent fits tothe simulations according to exp(−( lgEH−a
b)c). Usually, in the literaturec = 1 is assumed,
however, the present data, due to their large dynamical range, yield values forc from 1.3 to1.6. As can be inferred from the graph, all three interaction models reproduce the measureddata reasonably well, elucidating the fact that electrons closely follow the hadrons in EASpropagation. But if the same data are classified corresponding to the muon number, againSIBYLL seems to generate too many hadrons and thereby mimics a primary composition ofpure iron nuclei. For this reasonSIBYLL will not be utilized any further. In the figure theenergy spectrum is also plotted as measured with the Maket-ANI calorimeter by Ter-Antonianet al [15]. As already mentioned above, distributions are expected to coincide when taken atthe same electron number even if they have been measured at different altitudes. In the presentcase the data have been taken at sea level and at 700 g cm2 on Mount Aragats. The energydistributions, indeed, agree rather well with each other indicating that in both data sets thepatterns of hadrons are well recognized and the energies correctly determined.
It was seen thatSIBYLL encounters difficulties when the data are classified accordingto muonic shower sizes. TheVENUS model, on the other hand, cannot reproduce hadronicobservables convincingly well when they are binned into electron number intervals. Anexample is given in figure 9. It shows the number of hadrons, i.e. the hadronic shower sizeNh, as a function of the electromagnetic shower sizeNe. The experimental points matchwell to the primary proton line as expected fromQGSJET predictions. This phenomenon iseasily understood by the steeply falling flux spectrum and the fact that primary protons inducelarger electromagnetic sizes at observation level than heavy primaries. Hence, when groupingin Ne bins, showers from primary protons will be enriched and we expect to predominantlyhave proton showers in our sample. This fact reduces any ambiguities in the results due tothe absence of direct information on primary composition. Concerning theVENUS model,the predicted hadron numbers are too high and the two lines which mark the region between
2170 T Antoni et al
10-8
10-7
10-6
10-5
10-4
10-3
10-2
10-1
1
2 2.5 3 3.5 4 4.5 5
Figure 8. Hadron energy distribution for fixedelectron numberNe corresponding approximately to6 PeV primary energy. The lines representCORSIKAsimulations with three interaction models, the lowercurves for primary iron, the upper for protons.
Figure 9. Hadronic shower size versus electromagneticshower size. Experimental values are compared withsimulations usingVENUS (full lines) andQGSJET (shadedarea), both for primary protons and iron nuclei. Theexperimental error bars are rms values.
Figure 10. The energy fraction of all hadrons versus the most energetic hadron in a shower. Thedata are compared with simulations using theQGSJET model for primary protons (p) and ironnuclei (Fe). Shaded is the physically meaningful region as obtained from the simulations. Primaryenergies correspond to 2 PeV (left) and 12 PeV (right).
primary protons and iron nuclei cannot explain the data. The point at the lowest shower sizeis still influenced by the trigger efficiency of the array counters.
8.3. Hadron energy fraction
A suitable test of the interaction models consists of investigating the granular structure of thehadronic core concerning spatial as well as energy distributions. As variables we have chosenthe energy fraction of hadrons and the distances in the MST between them. Both will be dealtwith in the following sections.
For each hadron its energy fraction with respect to the most energetic hadron in thatparticular shower is calculated. For primary protons, the leading-particle effect is expected toproduce one particularly energetic hadron accompanied by hadrons with a broad distributionof lower energies. Hence, we presume that we will find a rather large dispersion of hadronicenergies for primary protons, whereas for primary iron nuclei the hadron energies should bemore equally distributed. The simulated distributions, indeed, confirm this expectation as isshown in figure 10. The lines—to guide the eye—represent fits to the simulations using twomodified exponentials as in the preceding section, which are connected to each other at the
Test of high-energy interaction models 2171
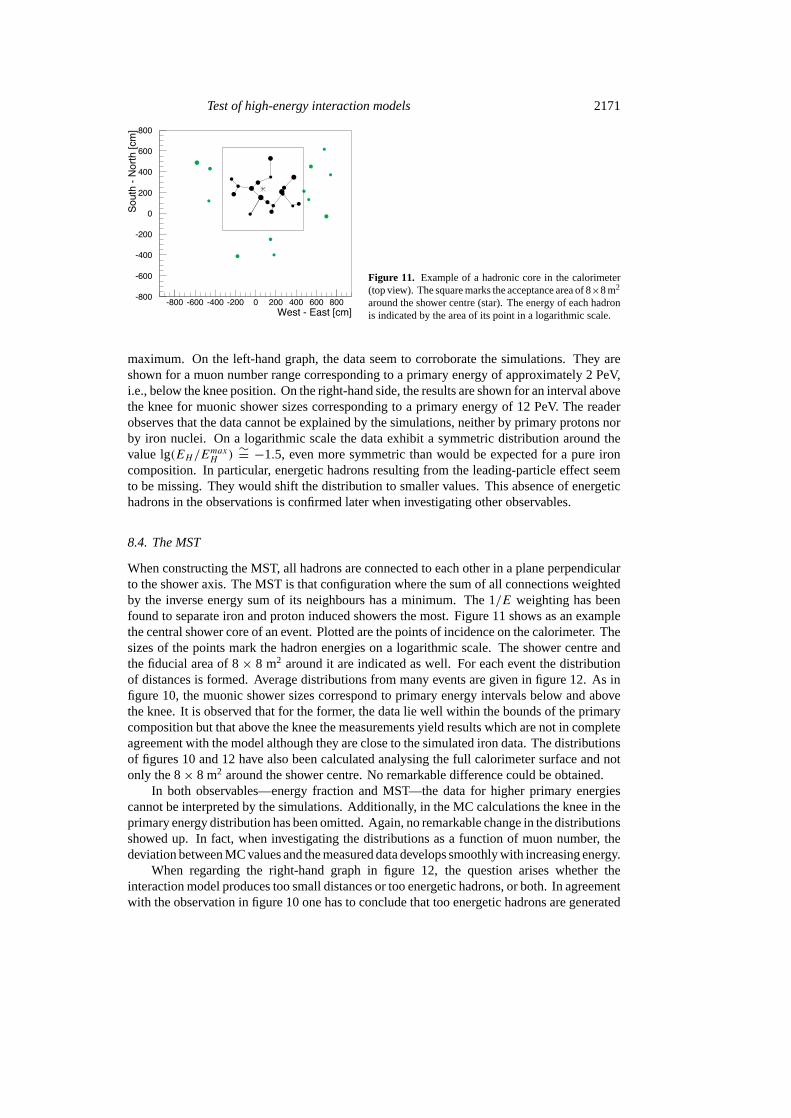
Figure 11. Example of a hadronic core in the calorimeter(top view). The square marks the acceptance area of 8×8 m2
around the shower centre (star). The energy of each hadronis indicated by the area of its point in a logarithmic scale.
maximum. On the left-hand graph, the data seem to corroborate the simulations. They areshown for a muon number range corresponding to a primary energy of approximately 2 PeV,i.e., below the knee position. On the right-hand side, the results are shown for an interval abovethe knee for muonic shower sizes corresponding to a primary energy of 12 PeV. The readerobserves that the data cannot be explained by the simulations, neither by primary protons norby iron nuclei. On a logarithmic scale the data exhibit a symmetric distribution around thevalue lg(EH/EmaxH ) ∼= −1.5, even more symmetric than would be expected for a pure ironcomposition. In particular, energetic hadrons resulting from the leading-particle effect seemto be missing. They would shift the distribution to smaller values. This absence of energetichadrons in the observations is confirmed later when investigating other observables.
8.4. The MST
When constructing the MST, all hadrons are connected to each other in a plane perpendicularto the shower axis. The MST is that configuration where the sum of all connections weightedby the inverse energy sum of its neighbours has a minimum. The 1/E weighting has beenfound to separate iron and proton induced showers the most. Figure 11 shows as an examplethe central shower core of an event. Plotted are the points of incidence on the calorimeter. Thesizes of the points mark the hadron energies on a logarithmic scale. The shower centre andthe fiducial area of 8× 8 m2 around it are indicated as well. For each event the distributionof distances is formed. Average distributions from many events are given in figure 12. As infigure 10, the muonic shower sizes correspond to primary energy intervals below and abovethe knee. It is observed that for the former, the data lie well within the bounds of the primarycomposition but that above the knee the measurements yield results which are not in completeagreement with the model although they are close to the simulated iron data. The distributionsof figures 10 and 12 have also been calculated analysing the full calorimeter surface and notonly the 8× 8 m2 around the shower centre. No remarkable difference could be obtained.
In both observables—energy fraction and MST—the data for higher primary energiescannot be interpreted by the simulations. Additionally, in the MC calculations the knee in theprimary energy distribution has been omitted. Again, no remarkable change in the distributionsshowed up. In fact, when investigating the distributions as a function of muon number, thedeviation between MC values and the measured data develops smoothly with increasing energy.
When regarding the right-hand graph in figure 12, the question arises whether theinteraction model produces too small distances or too energetic hadrons, or both. In agreementwith the observation in figure 10 one has to conclude that too energetic hadrons are generated
2172 T Antoni et al
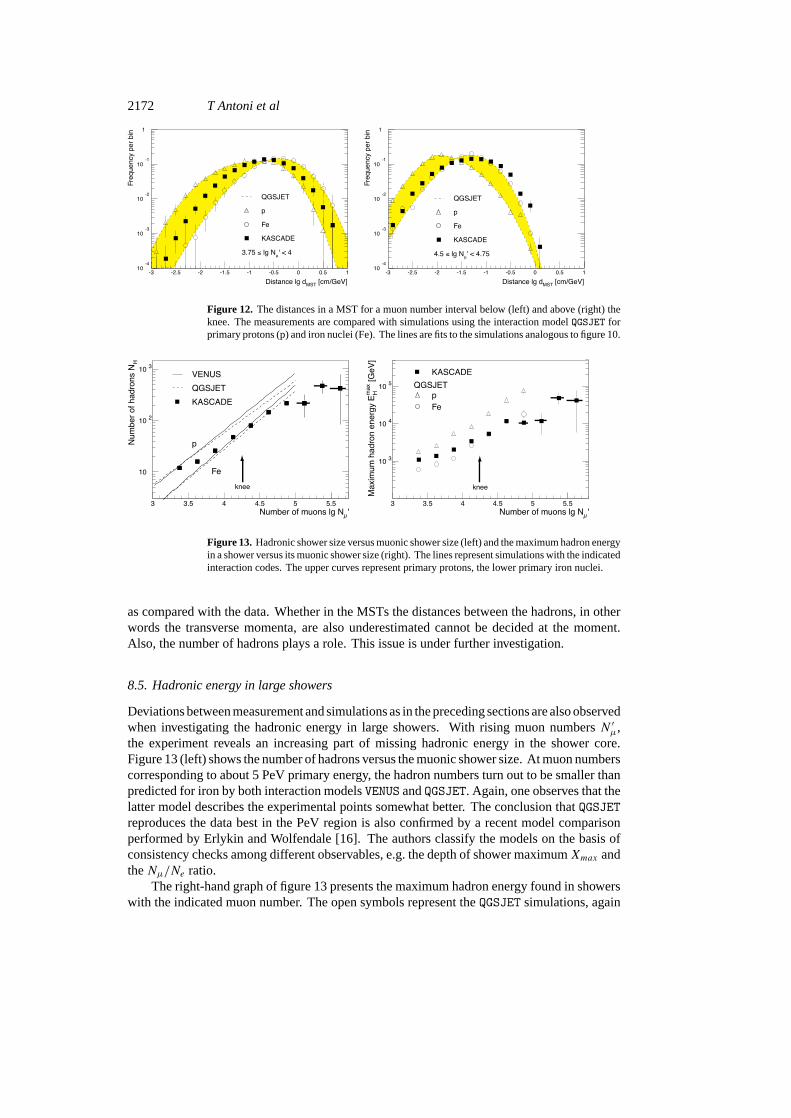
Figure 12. The distances in a MST for a muon number interval below (left) and above (right) theknee. The measurements are compared with simulations using the interaction modelQGSJET forprimary protons (p) and iron nuclei (Fe). The lines are fits to the simulations analogous to figure 10.
Figure 13. Hadronic shower size versus muonic shower size (left) and the maximum hadron energyin a shower versus its muonic shower size (right). The lines represent simulations with the indicatedinteraction codes. The upper curves represent primary protons, the lower primary iron nuclei.
as compared with the data. Whether in the MSTs the distances between the hadrons, in otherwords the transverse momenta, are also underestimated cannot be decided at the moment.Also, the number of hadrons plays a role. This issue is under further investigation.
8.5. Hadronic energy in large showers
Deviations between measurement and simulations as in the preceding sections are also observedwhen investigating the hadronic energy in large showers. With rising muon numbersN ′µ,the experiment reveals an increasing part of missing hadronic energy in the shower core.Figure 13 (left) shows the number of hadrons versus the muonic shower size. At muon numberscorresponding to about 5 PeV primary energy, the hadron numbers turn out to be smaller thanpredicted for iron by both interaction modelsVENUS andQGSJET. Again, one observes that thelatter model describes the experimental points somewhat better. The conclusion thatQGSJETreproduces the data best in the PeV region is also confirmed by a recent model comparisonperformed by Erlykin and Wolfendale [16]. The authors classify the models on the basis ofconsistency checks among different observables, e.g. the depth of shower maximumXmax andtheNµ/Ne ratio.
The right-hand graph of figure 13 presents the maximum hadron energy found in showerswith the indicated muon number. The open symbols represent theQGSJET simulations, again
Test of high-energy interaction models 2173
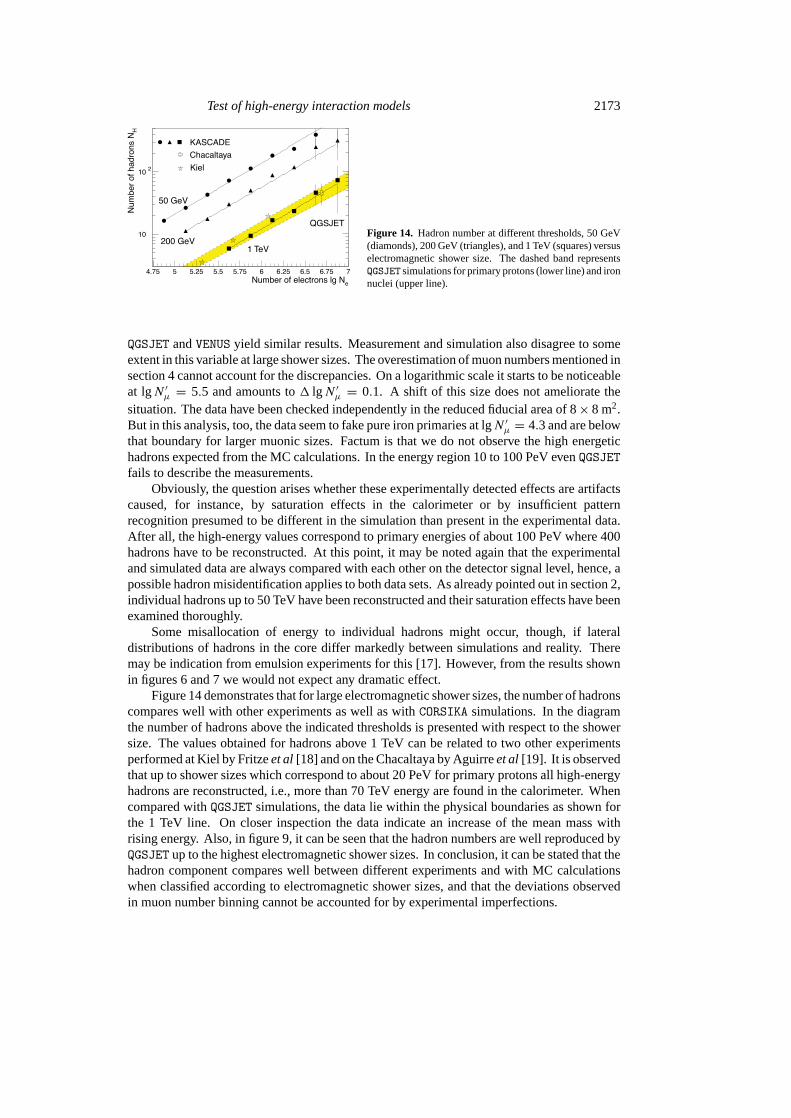
Figure 14. Hadron number at different thresholds, 50 GeV(diamonds), 200 GeV (triangles), and 1 TeV (squares) versuselectromagnetic shower size. The dashed band representsQGSJET simulations for primary protons (lower line) and ironnuclei (upper line).
QGSJET andVENUS yield similar results. Measurement and simulation also disagree to someextent in this variable at large shower sizes. The overestimation of muon numbers mentioned insection 4 cannot account for the discrepancies. On a logarithmic scale it starts to be noticeableat lgN ′µ = 5.5 and amounts to1 lgN ′µ = 0.1. A shift of this size does not ameliorate thesituation. The data have been checked independently in the reduced fiducial area of 8× 8 m2.But in this analysis, too, the data seem to fake pure iron primaries at lgN ′µ = 4.3 and are belowthat boundary for larger muonic sizes. Factum is that we do not observe the high energetichadrons expected from the MC calculations. In the energy region 10 to 100 PeV evenQGSJETfails to describe the measurements.
Obviously, the question arises whether these experimentally detected effects are artifactscaused, for instance, by saturation effects in the calorimeter or by insufficient patternrecognition presumed to be different in the simulation than present in the experimental data.After all, the high-energy values correspond to primary energies of about 100 PeV where 400hadrons have to be reconstructed. At this point, it may be noted again that the experimentaland simulated data are always compared with each other on the detector signal level, hence, apossible hadron misidentification applies to both data sets. As already pointed out in section 2,individual hadrons up to 50 TeV have been reconstructed and their saturation effects have beenexamined thoroughly.
Some misallocation of energy to individual hadrons might occur, though, if lateraldistributions of hadrons in the core differ markedly between simulations and reality. Theremay be indication from emulsion experiments for this [17]. However, from the results shownin figures 6 and 7 we would not expect any dramatic effect.
Figure 14 demonstrates that for large electromagnetic shower sizes, the number of hadronscompares well with other experiments as well as withCORSIKA simulations. In the diagramthe number of hadrons above the indicated thresholds is presented with respect to the showersize. The values obtained for hadrons above 1 TeV can be related to two other experimentsperformed at Kiel by Fritzeet al [18] and on the Chacaltaya by Aguirreet al [19]. It is observedthat up to shower sizes which correspond to about 20 PeV for primary protons all high-energyhadrons are reconstructed, i.e., more than 70 TeV energy are found in the calorimeter. Whencompared withQGSJET simulations, the data lie within the physical boundaries as shown forthe 1 TeV line. On closer inspection the data indicate an increase of the mean mass withrising energy. Also, in figure 9, it can be seen that the hadron numbers are well reproduced byQGSJET up to the highest electromagnetic shower sizes. In conclusion, it can be stated that thehadron component compares well between different experiments and with MC calculationswhen classified according to electromagnetic shower sizes, and that the deviations observedin muon number binning cannot be accounted for by experimental imperfections.
2174 T Antoni et al
9. Conclusion and outlook
Three interaction models have been tested by examining the hadronic cores of large EAS. Itturned out thatQGSJETbest reproduces the data, but at large muonic shower sizes, i.e. at energiesabove the knee even this model fails to reproduce certain observables. Most importantly, themodel predicts more hadrons than are observed experimentally.
The current investigation is a first approach with a first data sample of the KASCADEexperiment. Better statistics, both in the data and in the MC calculations, are imperative,especially above the knee in the 10 PeV region, and are expected from the further operationof the experiment. In addition, other experimental methods have to be developed to check thesimulation codes even more rigorously. Such a stringent check consists of verifying absoluteparticle fluxes at ground level at energies where the primary flux is reasonably well known.Improvements in the interaction models are also under way.NEXUS is in statu nascendi, a jointenterprise by the authors ofVENUS andQGSJET [20]. It has become evident that a very precisedescription of the shower development in the atmosphere is needed if the mass of the primariesis to be estimated by means of ground-level particle distributions.
Acknowledgments
The authors would like to thank the members of the engineering and technical staff of theKASCADE collaboration who contributed with enthusiasm and engagement to the success ofthe experiment.
The Polish group gratefully acknowledges support by the Polish State Committee forScientific Research (grant no 2 P03B 16012). The work has been partly supported by a grantof the Rumanian Ministry of Research and Technology and by the research grant no 94964of the Armenian Government and ISTC project A 116. The support of the experiment by theMinistry for Research of the German Federal Government is gratefully acknowledged.
References
[1] Heck Det al 1998ReportFZKA 6019 Forschungszentrum Karlsruhe[2] Klages H Oet al (KASCADE Collaboration) 1997Nucl. Phys. B (Proc. Suppl.)B 5292[3] Engler J, Fessler F, Horandel J R, Holst T, Keim H, Mathes H J, Mielke H H, Milke J, Raidt U and Wochele J
1999Nucl. Instrum. MethodsA 427528[4] Mielke H H et al 1995Nucl. Instrum. MethodsA 360367 and references therein[5] Werner K 1993Phys. Rep.23287[6] Kalmykov N N and Ostapchenko S S 1993Yad. Fiz.56105
Kalmykov N N and Ostapchenko S S 1993Phys. At. Nucl.56346Kalmykov N N, Ostapchenko S S and Pavlov A I 1994Bull. Russ. Acad. Sci. (Physics)581966
[7] Engel J, Gaisser T K, Lipari P and Stanev T 1992Phys. Rev.D 465013Fletcher R S, Gaisser T K, Lipari P and Stanev T 1994Phys. Rev.D 505710
[8] CERN 1993GEANT 3.15, Detector Description and Simulation Tool, CERN Program Library Long WriteupW5015
[9] Kamata Ket al 1958Suppl. Prog. Theor. Phys.6 93[10] Kempa J 1976Nuovo CimentoA 31581[11] Vatcha R H and Sreekantan B V 1973J. Phys. A: Math. Gen.6 1050[12] Danilova T Vet al 1985Proc. Int. Conf. on Cosmic Rays (La Jolla)vol 7, p 40[13] Sreekantan B Vet al 1983Phys. Rev.D 281050[14] Horandel J Ret al (KASCADE Collaboration) 1997Proc. Int. Conf. on Cosmic Rays (Durban)vol 6, p 93
Horandel J R 1998ReportFZKA 6015 Forschungszentrum Karlsruhe[15] Ter-Antonian S Vet al 1995Proc. Int. Conf. on Cosmic Rays (Rome)vol 1, p 369[16] Erlykin A D and Wolfendale A W 1998Astropart. Phys.9 213

Test of high-energy interaction models 2175
[17] Tamada M 1999Nucl. Phys.B (Proc. Suppl.)75A 156[18] Fritze Ret al 1969Acta Phys. Sci. Hung. Suppl.29439[19] Aguirre Cet al 1998 Institute of cosmic ray researchUniversity of Tokyo Report434-98-30, p 17[20] Werner K 1998 Private communication