Embed Size (px)
Citation preview
CIER
A REP
ORT
Text Levelingand Little Booksin First-Grade ReadingJames V. Hoffman, Nancy L. Roser, Rachel Salas, Elizabeth Patterson, and Julie PenningtonThe University of Texas—Austin
CIERA REPORT #1-010March 31, 2000
Text Leveling and Little Books in First-Grade
Reading
CIERA Report #1-010
James V. Hoffman, Nancy L. Roser, Rachel Salas, Elizabeth Patterson, and Julie PenningtonThe University of Texas—Austin
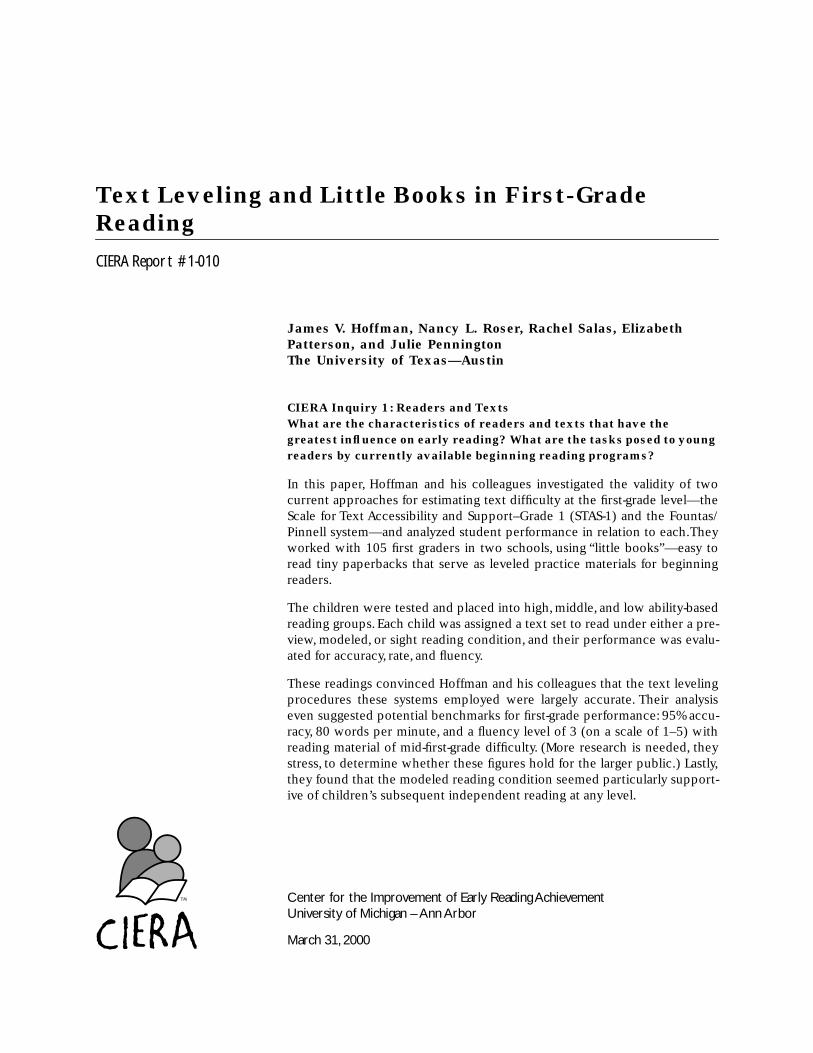
CIERA Inquiry 1: Readers and TextsWhat are the characteristics of readers and texts that have the greatest influence on early reading? What are the tasks posed to young readers by currently available beginning reading programs?
In this paper, Hoffman and his colleagues investigated the validity of twocurrent approaches for estimating text difficulty at the first-grade level—theScale for Text Accessibility and Support–Grade 1 (STAS-1) and the Fountas/Pinnell system—and analyzed student performance in relation to each.Theyworked with 105 first graders in two schools, using “little books”—easy toread tiny paperbacks that serve as leveled practice materials for beginningreaders.
The children were tested and placed into high, middle, and low ability-basedreading groups. Each child was assigned a text set to read under either a pre-view, modeled, or sight reading condition, and their performance was evalu-ated for accuracy, rate, and fluency.
These readings convinced Hoffman and his colleagues that the text levelingprocedures these systems employed were largely accurate. Their analysiseven suggested potential benchmarks for first-grade performance: 95% accu-racy, 80 words per minute, and a fluency level of 3 (on a scale of 1–5) withreading material of mid-first-grade difficulty. (More research is needed, theystress, to determine whether these figures hold for the larger public.) Lastly,they found that the modeled reading condition seemed particularly support-ive of children’s subsequent independent reading at any level.
Center for the Improvement of Early Reading AchievementUniversity of Michigan – Ann Arbor
March 31, 2000
University of Michigan School of Education
610 E University Ave., Rm 1600 SEBAnn Arbor, MI 48109-1259
734.647.6940 voice734.763.1229 [email protected]
www.ciera.org
©2000 Center for the Improvement of Early Reading Achievement.
This research was supported under the Educational Research and Develop-ment Centers Program, PR/Award Number R305R70004, as administered bythe Office of Educational Research and Improvement, U.S. Department ofEducation. However, the comments do not necessarily represent the posi-tions or policies of the National Institute of Student Achievement, Curricu-lum, and Assessment or the National Institute on Early ChildhoodDevelopment, or the U.S. Department of Education, and you should notassume endorsement by the Federal Government.
1
Text Leveling and Little Books in
First-Grade Reading
James V. Hoffman, Nancy L. Roser, Rachel Salas,Elizabeth Patterson, and Julie PenningtonThe University of Texas—Austin
S
oon after the Greeks borrowed and perfected the alphabet, young boyswere taught to read. According to some historians, the challenge for theteacher of the day was that there was nothing for children to read betweenthe alphabet and Homer (Guéraud & Jouguet, 1938, as cited in Harris,1989). The evolving story of reading instruction has been (at least partly)the story of filling the gap between single words and great works with textsintended to support the developing reader (Smith, 1965/1986). For exam-ple, a beginning reader in colonial America was offered the
New EnglandPrimer,
a text which provided the basic elements of literacy—letters, sylla-bles, and rhyming couplets—all intended to “prime” the child’s later readingof the more difficult scriptures. Later, “spellers” were introduced as yetanother bridge to more challenging readers (Venezky, 1987).
By the middle of the nineteenth century, arrays of increasingly difficult read-ers began to be associated with grade levels. By the mid-twentieth century,students’ basal series comprised a collection of leveled texts arranged ingraduated levels of difficulty, as verified by readability formulas. Typically, afirst grader was offered three “preprimers” to build the recognition vocabu-lary required by the primer, and a “first reader” to stretch the beginner fur-ther. The control over the difficulty level for these texts was achievedthrough careful selection, introduction, and repetition of words (Smith,1965/1986).
For the beginning reader, standard instruction through the mid-1980s meantpracticing in texts that provided for substantial success and a modicum ofchallenge. In the late 1980s, calls for more authentic literature and less con-trived language for beginning reading instruction led basal publishers toabandon their strict leveling procedures and vocabulary control (Wepner &Feeley, 1986) and provide young readers with reproduced trade literature.This “quality literature,” with its naturally occurring rhymes, rhythms, andpatterns, replaced the carefully leveled vocabulary-controlled texts. Tradebook anthologies became the standard basals of the 1990s. The publisher-assigned levels within these basal programs were perhaps driven more byinstructional goals and/or thematic integrity than a clear leveling of the

CIERA Report 1-010
2
materials according to one or another standard of difficulty (Hoffman et al.,1994).
Classroom research focusing on this shift toward “authentic” literature infirst grade revealed mixed effects (Hoffman, Roser, & Worthy, 1998).Although teachers found the new materials more motivating and engagingfor their average and above-average readers, they reported difficulties inmeeting the needs of their struggling readers with texts so challenging andvariable in difficulty. In an attempt to address the need, both basal publish-ers and others offered supplementary or alternative texts that provided forsmaller steps—more refined or narrow levels of text difficulty. Called “littlebooks,” these 8-, 12-, or 16-page paperbound texts were designed to providefor practice by combining control (of vocabulary or spelling patterns) withpredictable language patterns—the latter an attempt to ensure interest andto include literary traits.
Precise leveling of these little books has been an elusive exercise for bothdevelopers and users (Peterson, 1991). Traditional readability formulas, rely-ing on word frequency and syntactic complexity, have not been able toaccount for variations within the first grade (Klare, 1984). Neither do tradi-tional readability formulas consider features of text support associated withpredictable texts (Rhodes, 1981).
Although procedures exist for judging the appropriateness of text–readermatch when children are actually reading (e.g., informal reading inventories,running records), the set of teacher tools available for making
a priori
judg-ments and planning decisions regarding the challenge level of texts is quitelimited. Neither are there clearly developed benchmarks for publishers instandardizing the challenge level of the texts they produce. Finally, there areno existing data to validate the text leveling systems that teachers rely uponto array the plethora of practice materials in beginners’ classrooms.
The purpose of this study was to investigate the validity of two relativelyrecent approaches for estimating text difficulty and scaling at the first-gradelevel: the Scale for Text Accessibility and Support—Grade 1 (STAS-1; Hoff-man et al., 1994, 1997) and the Fountas and Pinnell system (1996, 1999).Both attempt to provide teachers with tools that can be used for meeting thegoal of putting appropriately leveled practice materials into beginners’hands.
The Scale for Text Accessibility and Support—Grade 1
The first version of the STAS-1 was developed as a tool for investigating thechanges in basal texts that had occurred in the transition from the carefullycontrolled 1980s versions to the literature-based anthologies of the 1990s(Hoffman et al., 1994). In its earliest permutation, STAS-1 consisted of twoseparate subscales, representing two separate holistic ratings of text.
1
Thefirst subscale focused on decodability features, and the second focused onpredictability. Decodability was conceptualized as a factor operating prima-rily at the word level and affecting the accessibility of text. The assumptionwas that irregular words—those that do not conform to common ortho-

Text Leveling and Little Books
3
graphic and sound pattern relationships—and longer words place demandson the developing reader that can make word identification difficult. Predict-ability was primarily conceptualized as a between-word factor. Larger unitsof language structure (e.g., rhyming phrases) and other supports (e.g., pic-tures, familiar concepts) can also support the reader toward accurate wordidentification and text processing. These two features (decodability and pre-dictability) are independent of one another, at least conceptually (i.e., it ispossible to create text that is low in one factor, but high in the other).
To reflect the degree of decodability and predictability demands, the twosubscales were arranged on a 5-point rating system, with the lower numbersindicating greater levels of text support available to the reader, and thehigher reflecting an increase in challenge level. As with all holistic scales,the categories were designed to represent ranges rather than precise points.
Rating Scale for Decodability
In judging beginners’ text for the degree of decodability, the rater focuses onthe words in the text, making word-level judgments about the regularity ofspelling and phonetic patterns. To judge the degree of decodability, the raterconsiders the following characteristics:
1. Highly Decodable Text
The emergent or beginning reader would find mostly high-utility spellingpatterns (e.g., CVC) in one-syllable words (e.g.,
cat, had, sun
). Other wordsmay be short and high frequency (e.g.,
the, was, come
). Some inflectionalendings are in evidence (e.g., plurals).
2. Very Decodable Text
Beginners still meet mostly high-utility rimes, but useful vowel and conso-nant combinations appear (e.g.,
that, boat, pitch
). Words that seem lessdecodable are both short and high frequency. Some simple compoundwords (e.g.,
sunshine
) and contractions (e.g.,
can’t, I’m, didn’t
) may appear.In addition, longer, more irregular words occasionally appear as story “fea-tures” (e.g., character names, sound words). Although these high-interestwords are infrequent, they are often repeated (e.g.,
Carlotta, higglety-pigglety
).
3. Decodable Text
Beginners find access to these texts through regularly spelled one- and two-syllable words. Longer words are also composed of regularly spelled units.However, less common rimes may appear (e.g.,
-eigh, -irt/-urt
), and morevariantly spelled function words (e.g.,
their, through
).
4. Somewhat Decodable
Text
Beginning readers require more sophisticated decoding skills to access thetext, since there is little obvious attention to spelling regularity or pattern.Although most of the vocabulary is still in the one- to two-syllable range,there is greater frequency of derivational affixes (e.g.,
dis-, -able
). Someinfrequent words and longer nondecodable words appear.
5. Minimally Decodable
Text
Beginners’ access to this text may depend upon more well-developed skills,since the text includes a plethora of spelling-sound patterns, includinglonger and more irregularly spelled words (e.g.,
thorough, saucer
). There isa full range of derivational and inflectional affixes.
CIERA Report 1-010
4
Rating Scale for Predictability
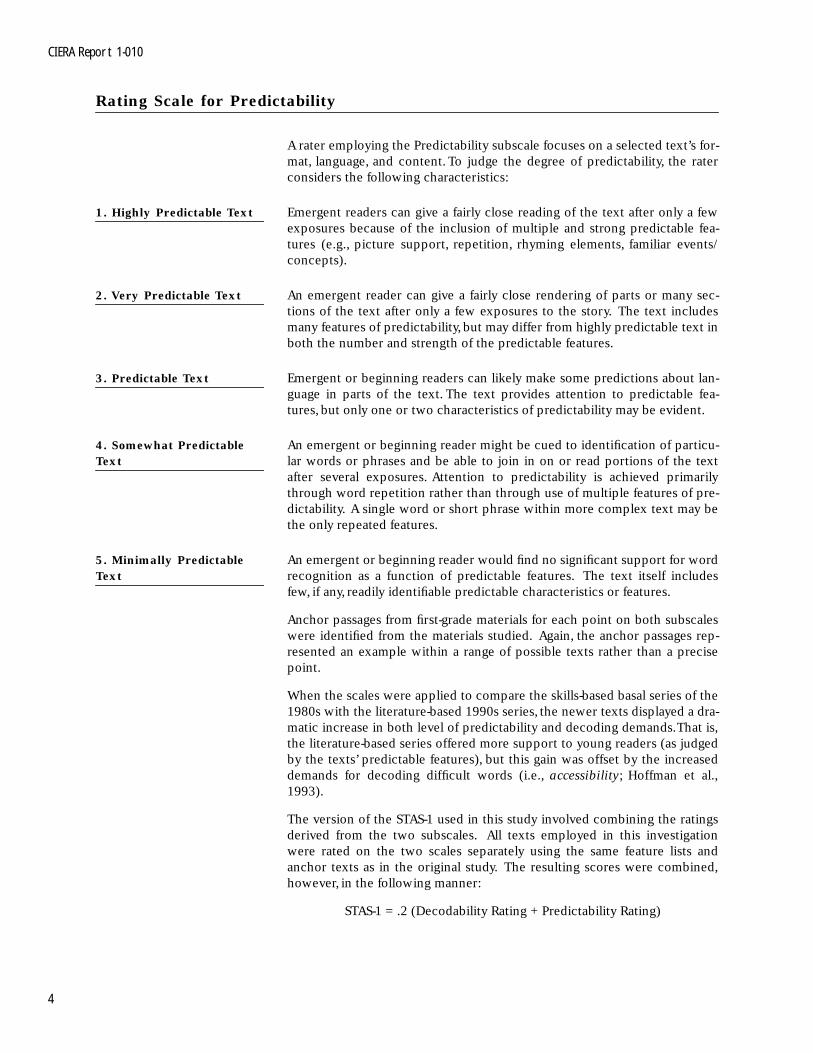
A rater employing the Predictability subscale focuses on a selected text’s for-mat, language, and content. To judge the degree of predictability, the raterconsiders the following characteristics:
1. Highly Predictable Text
Emergent readers can give a fairly close reading of the text after only a fewexposures because of the inclusion of multiple and strong predictable fea-tures (e.g., picture support, repetition, rhyming elements, familiar events/concepts).
2. Very Predictable Text
An emergent reader can give a fairly close rendering of parts or many sec-tions of the text after only a few exposures to the story. The text includesmany features of predictability, but may differ from highly predictable text inboth the number and strength of the predictable features.
3. Predictable Text
Emergent or beginning readers can likely make some predictions about lan-guage in parts of the text. The text provides attention to predictable fea-tures, but only one or two characteristics of predictability may be evident.
4. Somewhat Predictable
Text
An emergent or beginning reader might be cued to identification of particu-lar words or phrases and be able to join in on or read portions of the textafter several exposures. Attention to predictability is achieved primarilythrough word repetition rather than through use of multiple features of pre-dictability. A single word or short phrase within more complex text may bethe only repeated features.
5. Minimally Predictable
Text
An emergent or beginning reader would find no significant support for wordrecognition as a function of predictable features. The text itself includesfew, if any, readily identifiable predictable characteristics or features.
Anchor passages from first-grade materials for each point on both subscaleswere identified from the materials studied. Again, the anchor passages rep-resented an example within a range of possible texts rather than a precisepoint.
When the scales were applied to compare the skills-based basal series of the1980s with the literature-based 1990s series, the newer texts displayed a dra-matic increase in both level of predictability and decoding demands. That is,the literature-based series offered more support to young readers (as judgedby the texts’ predictable features), but this gain was offset by the increaseddemands for decoding difficult words (i.e.,
accessibility
; Hoffman et al.,1993).
The version of the STAS-1 used in this study involved combining the ratingsderived from the two subscales. All texts employed in this investigationwere rated on the two scales separately using the same feature lists andanchor texts as in the original study. The resulting scores were combined,however, in the following manner:
STAS-1 = .2 (Decodability Rating + Predictability Rating)
Text Leveling and Little Books
5
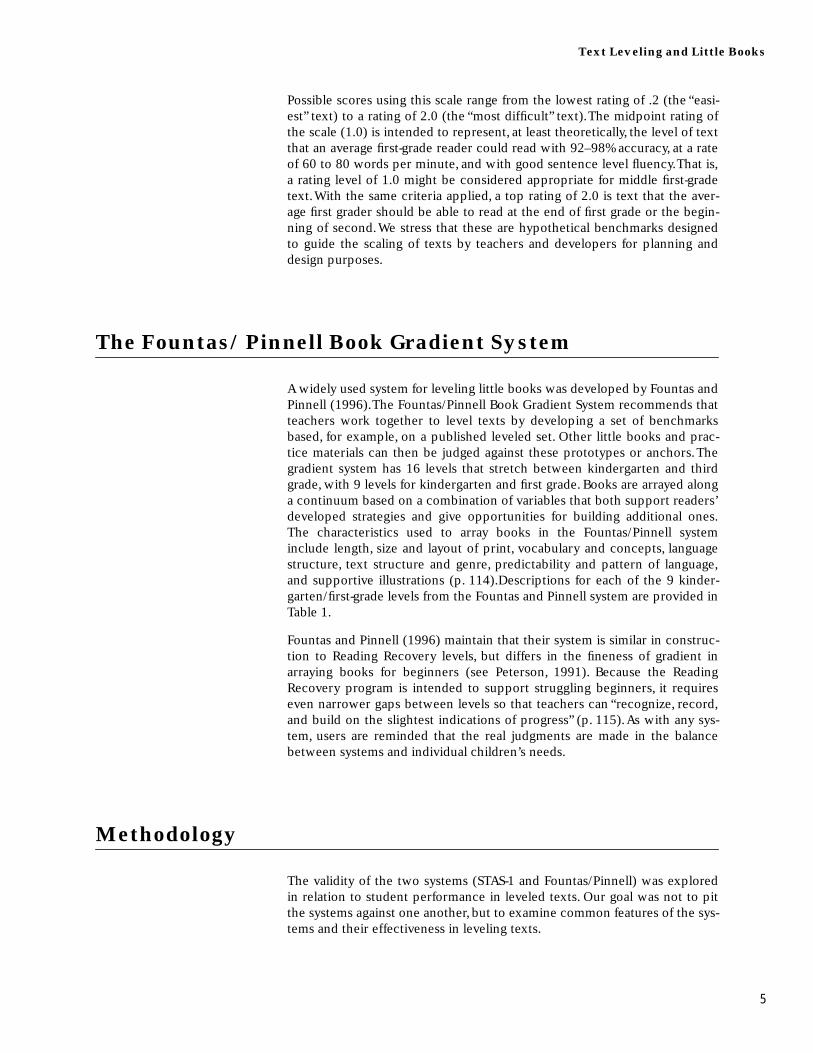
Possible scores using this scale range from the lowest rating of .2 (the “easi-est” text) to a rating of 2.0 (the “most difficult” text). The midpoint rating ofthe scale (1.0) is intended to represent, at least theoretically, the level of textthat an average first-grade reader could read with 92–98% accuracy, at a rateof 60 to 80 words per minute, and with good sentence level fluency. That is,a rating level of 1.0 might be considered appropriate for middle first-gradetext. With the same criteria applied, a top rating of 2.0 is text that the aver-age first grader should be able to read at the end of first grade or the begin-ning of second. We stress that these are hypothetical benchmarks designedto guide the scaling of texts by teachers and developers for planning anddesign purposes.
The Fountas/Pinnell Book Gradient System
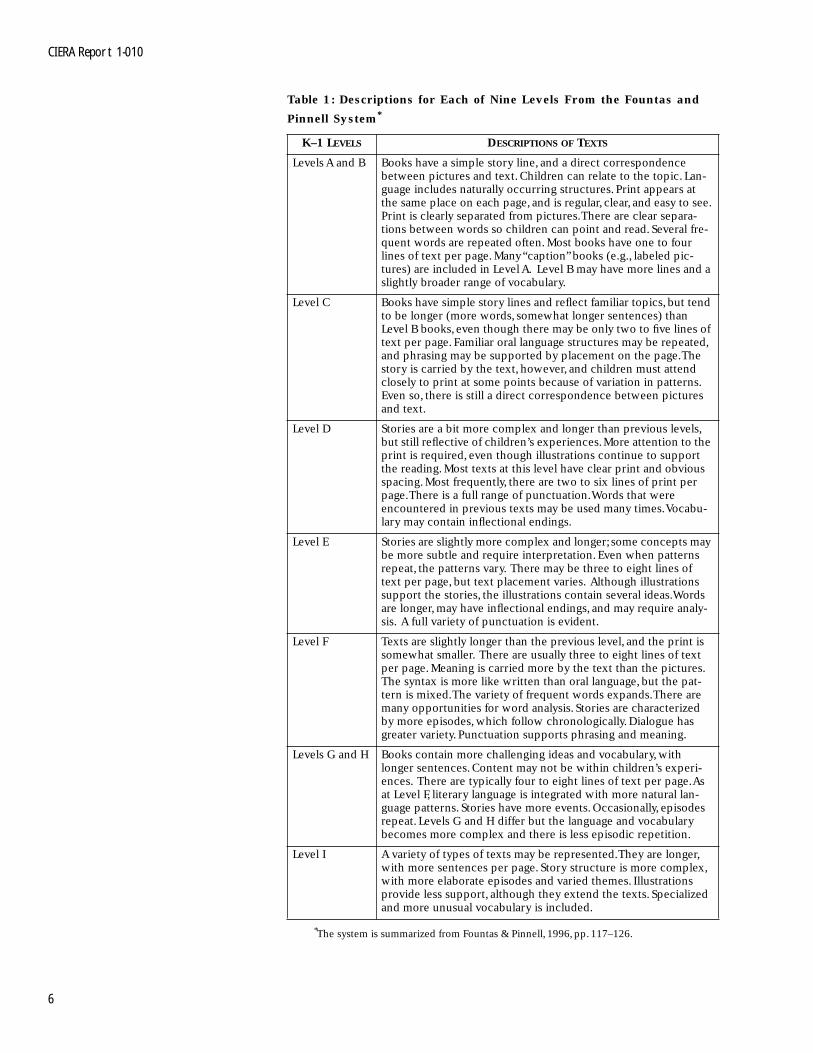
A widely used system for leveling little books was developed by Fountas andPinnell (1996). The Fountas/Pinnell Book Gradient System recommends thatteachers work together to level texts by developing a set of benchmarksbased, for example, on a published leveled set. Other little books and prac-tice materials can then be judged against these prototypes or anchors. Thegradient system has 16 levels that stretch between kindergarten and thirdgrade, with 9 levels for kindergarten and first grade. Books are arrayed alonga continuum based on a combination of variables that both support readers’developed strategies and give opportunities for building additional ones.The characteristics used to array books in the Fountas/Pinnell systeminclude length, size and layout of print, vocabulary and concepts, languagestructure, text structure and genre, predictability and pattern of language,and supportive illustrations (p. 114).Descriptions for each of the 9 kinder-garten/first-grade levels from the Fountas and Pinnell system are provided inTable 1.
Fountas and Pinnell (1996) maintain that their system is similar in construc-tion to Reading Recovery levels, but differs in the fineness of gradient inarraying books for beginners (see Peterson, 1991). Because the ReadingRecovery program is intended to support struggling beginners, it requireseven narrower gaps between levels so that teachers can “recognize, record,and build on the slightest indications of progress” (p. 115). As with any sys-tem, users are reminded that the real judgments are made in the balancebetween systems and individual children’s needs.
Methodology
The validity of the two systems (STAS-1 and Fountas/Pinnell) was exploredin relation to student performance in leveled texts. Our goal was not to pitthe systems against one another, but to examine common features of the sys-tems and their effectiveness in leveling texts.
CIERA Report 1-010
6
Table 1: Descriptions for Each of Nine Levels From the Fountas and
Pinnell System
*
K–1 L
EVELS
D
ESCRIPTIONS
OF
T
EXTS
Levels A and B Books have a simple story line, and a direct correspondence between pictures and text. Children can relate to the topic. Lan-guage includes naturally occurring structures. Print appears at the same place on each page, and is regular, clear, and easy to see. Print is clearly separated from pictures. There are clear separa-tions between words so children can point and read. Several fre-quent words are repeated often. Most books have one to four lines of text per page. Many “caption” books (e.g., labeled pic-tures) are included in Level A. Level B may have more lines and a slightly broader range of vocabulary.
Level C Books have simple story lines and reflect familiar topics, but tend to be longer (more words, somewhat longer sentences) than Level B books, even though there may be only two to five lines of text per page. Familiar oral language structures may be repeated, and phrasing may be supported by placement on the page. The story is carried by the text, however, and children must attend closely to print at some points because of variation in patterns. Even so, there is still a direct correspondence between pictures and text.
Level D Stories are a bit more complex and longer than previous levels, but still reflective of children’s experiences. More attention to the print is required, even though illustrations continue to support the reading. Most texts at this level have clear print and obvious spacing. Most frequently, there are two to six lines of print per page. There is a full range of punctuation. Words that were encountered in previous texts may be used many times. Vocabu-lary may contain inflectional endings.
Level E Stories are slightly more complex and longer; some concepts may be more subtle and require interpretation. Even when patterns repeat, the patterns vary. There may be three to eight lines of text per page, but text placement varies. Although illustrations support the stories, the illustrations contain several ideas.Words are longer, may have inflectional endings, and may require analy-sis. A full variety of punctuation is evident.
Level F Texts are slightly longer than the previous level, and the print is somewhat smaller. There are usually three to eight lines of text per page. Meaning is carried more by the text than the pictures. The syntax is more like written than oral language, but the pat-tern is mixed. The variety of frequent words expands. There are many opportunities for word analysis. Stories are characterized by more episodes, which follow chronologically. Dialogue has greater variety. Punctuation supports phrasing and meaning.
Levels G and H Books contain more challenging ideas and vocabulary, with longer sentences. Content may not be within children’s experi-ences. There are typically four to eight lines of text per page. As at Level F, literary language is integrated with more natural lan-guage patterns. Stories have more events. Occasionally, episodes repeat. Levels G and H differ but the language and vocabulary becomes more complex and there is less episodic repetition.
Level I A variety of types of texts may be represented. They are longer, with more sentences per page. Story structure is more complex, with more elaborate episodes and varied themes. Illustrations provide less support, although they extend the texts. Specialized and more unusual vocabulary is included.
*
The system is summarized from Fountas & Pinnell, 1996, pp. 117–126.
Text Leveling and Little Books
7
Setting and Participants
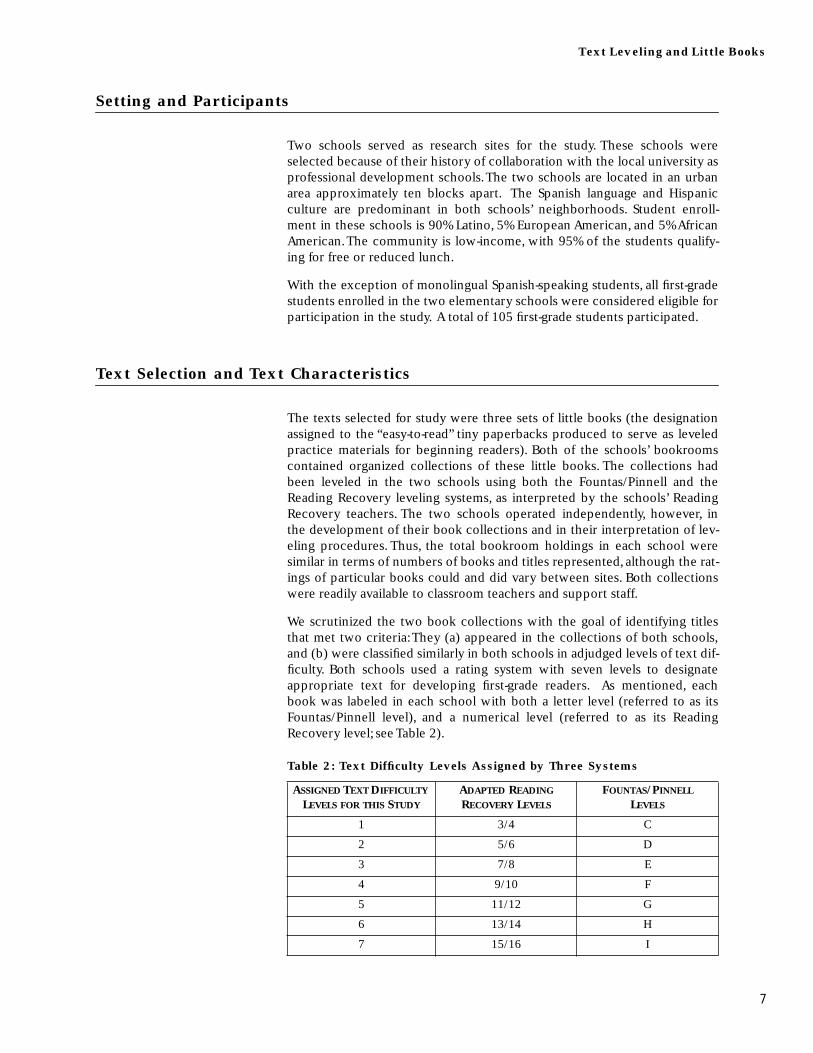
Two schools served as research sites for the study. These schools wereselected because of their history of collaboration with the local university asprofessional development schools. The two schools are located in an urbanarea approximately ten blocks apart. The Spanish language and Hispanicculture are predominant in both schools’ neighborhoods. Student enroll-ment in these schools is 90% Latino, 5% European American, and 5% AfricanAmerican. The community is low-income, with 95% of the students qualify-ing for free or reduced lunch.
With the exception of monolingual Spanish-speaking students, all first-gradestudents enrolled in the two elementary schools were considered eligible forparticipation in the study. A total of 105 first-grade students participated.
Text Selection and Text Characteristics
The texts selected for study were three sets of little books (the designationassigned to the “easy-to-read” tiny paperbacks produced to serve as leveledpractice materials for beginning readers). Both of the schools’ bookroomscontained organized collections of these little books. The collections hadbeen leveled in the two schools using both the Fountas/Pinnell and theReading Recovery leveling systems, as interpreted by the schools’ ReadingRecovery teachers. The two schools operated independently, however, inthe development of their book collections and in their interpretation of lev-eling procedures. Thus, the total bookroom holdings in each school weresimilar in terms of numbers of books and titles represented, although the rat-ings of particular books could and did vary between sites. Both collectionswere readily available to classroom teachers and support staff.
We scrutinized the two book collections with the goal of identifying titlesthat met two criteria: They (a) appeared in the collections of both schools,and (b) were classified similarly in both schools in adjudged levels of text dif-ficulty. Both schools used a rating system with seven levels to designateappropriate text for developing first-grade readers. As mentioned, eachbook was labeled in each school with both a letter level (referred to as itsFountas/Pinnell level), and a numerical level (referred to as its ReadingRecovery level; see Table 2).
Table 2: Text Difficulty Levels Assigned by Three Systems
A
SSIGNED
T
EXT
D
IFFICULTY
L
EVELS
FOR
THIS
S
TUDY
A
DAPTED
R
EADING
R
ECOVERY
L
EVELS
F
OUNTAS
/P
INNELL
L
EVELS
1 3/4 C
2 5/6 D
3 7/8 E
4 9/10 F
5 11/12 G
6 13/14 H
7 15/16 I

CIERA Report 1-010
8
Once the set of common titles in each library collection had been identified,we randomly selected three book titles for each level of difficulty (from 1through 7). The three books for each level were then randomly assigned tocreate three Text Sets (A, B, and C). Thus, each of the three Text Sets con-sisted of one book from each of the seven levels of difficulty for a total of 21titles (see Table 3).
Text Analysis Measures and Ratings
We ran multiple analyses of each of the selected little books. Most of themeasures, such as total number of unique words and type/token ratio, havebeen used in previous studies examining text difficulty (Hiebert & Raphael,1998; Klare, 1984). All of the words in all 21 texts (with the exception ofthe title words) were used to calculate these measures (see Table 4).
We calculated the decodability and predictability of each text using theSTAS-1 subscales in the following way: At least two members of the researchteam rated each of the 21 little books for both decodability and predictabil-ity. None of the raters’ independent judgments varied by more than +/-1 oneither scale. Where differences existed in the ratings (e.g., raters split
Table 3: Titles of Texts in Each Text Set
B
OOK
L
EVELS
T
EXT
S
ET
A T
EXT
S
ET
B T
EXT
S
ET
C
1
A Hug is Warm Come On Danger
2
Miss Pool No, No Bread
3
Jump in a Sack Mrs. Wishy Washy Go Back to Sleep
4
Grandpa Snored Meanies Poor Old Polly
5
Greedy Cat Caterpillar Diary Grandpa, Grandpa
6
Ratty Tatty Mr. Whisper Mrs. Grindy
7
Poor, Sore Paw Nowhere, Nothing Mrs. Muddle
Table 4: Assessments of Beginners’ Texts
M
EASURE
E
XPLANATION
Total Number of Words All text words, exclusive of the title
Total Number of Unique Words
Total number of different words (including inflections and derivations)
Type/Token Ratio Incidence of unique words in the total text. Calculated by dividing Measure 2 (total number of unique words) by Measure 1 (total number of words)
Readability Index Produced through the Right-Writer text analysis system. The lowest (default) score for a text with this index is 1.0 (first-grade level)
Syllables Per Sentence Average number of syllables in each sentence
Syllables Per Word Average number of syllables in the words in a text
Average Sentence Length
Average number of words per sentence in a text

Text Leveling and Little Books
9
between scoring 2 and 3), a midpoint rating was assigned (e.g., 2.5). Finally,we created a composite score by summing the two rating scores (decodabil-ity + predictability) for each text and multiplying by .2 to reach a rating foreach text. This scale had the potential to range from a low of .4 (easiest/mostsupported passage) to a high score of 2.0 (hardest/least supported passage).
Design
The independent variable of primary interest was the text difficulty, or textleveling factor. However, two other variables were considered as part of theresearch design: student word recognition level and reading condition (theinstructional procedures used to introduce the reading task).
The word recognition skill levels of the 105 students participating in thestudy were estimated by administering the Word List section of the Qualita-tive Reading Inventory (QRI; Leslie & Caldwell, 1990). A total word accu-racy score was calculated for each student. Students were then assigned toone of three ability groups (High, Middle, or Low) based on their perfor-mance on the word list. Approximately the top third of the scores were des-ignated as high, the middle third designated as midrange, and the bottomthird designated as low. The average score on the QRI for the high groupwas 82.9 (
SD
= 11.7); for the middle group, 33.0 (
SD
= 16.1); and for thelow group, 10.4 (
SD
= 3.5).
To approximate the varying ways little books are used with young childrenin classrooms, we also varied the experimental reading conditions to reflectvarying levels of support. The first condition was a “Preview” reading condi-tion (similar to guided reading, but without its detail and implied knowledgeof the learner) in which a member of the research team provided an oppor-tunity for the student to preview the story under the guidance of theresearch team member. The student also received some limited help/instruction with potentially challenging words. In the second condition,labeled “Modeled” reading, the text was read aloud to a student by a memberof the research team before the student was asked to read it aloud on his orher own. Each student was invited to follow along in the text as it was readaloud, but no specific attention was given to instructing difficult words. Thisprocedure closely matches the classroom instructional procedure calledshared reading, but leaves out many of the important support elementsdescribed by Holdaway (1979). In the third condition, labeled “Sight” read-ing, the students were simply invited to read the text aloud without anydirect support (see Table 5). In classrooms, the third condition would bemost directly comparable to a cold reading of a text.
Students from each of the three ability groups were assigned proportionallyto one of the three experimental conditions. Each stratified group of stu-dents was assigned to read texts (the ordering of which had been random-ized) in one of the three possible classroom simulated instructionalconditions. Thus, each student participating in the study, whatever theirlevel of word-reading skill, read all seven texts in one of the sets (either A, B,or C) under one of the three experimental conditions (Preview, Modeled, orSight). The design was balanced to permit examination of the relationshipbetween any of these variables and student performance.

CIERA Report 1-010
10
Procedures
Outside their regular classrooms, each student met with a member of theresearch team in three separate sessions. All three sessions were tape-recorded. In Session 1, students read from the first five word lists (preprimerthrough grade 2) of the QRI. During Session 2, the students read the firstthree texts (the order of which had been randomized) of their assigned TextSet, following the treatment plan they had been assigned. In all treatmentconditions, the students read directly from the little books. To be responsiveto student frustration with difficult texts, researchers provided help if stu-dents paused longer than five seconds for a word regardless of treatmentcondition.
During Session 3, which took place on the following day, the students readthe remaining four little books under the same condition they experiencedin Session 2 (Preview, Modeled, or Sight). Most of the students were able tocomplete the reading of the passages in two sessions of approximately 25 to30 minutes each, but some students required an additional session.
Data Analysis
Each student’s oral reading performance was monitored (by a runningrecord) and examined in relation to three independent variables: (a) stu-dents’ entering word-reading skill level (high, middle, or low); (b) the read-ing conditions (Preview, Modeled, or Sight); and (c) the text difficulty(Levels 1 through 7 based on the combined Fountas/Pinnell and ReadingRecovery systems). A 3 x 3 x 7 factorial design was employed.
Table 5: Description of Instructional Support Procedures
M
ODIFIED
M
ETHOD
D
ESCRIPTION
Sight Reading In the sight reading condition, we stated the title of the book while pointing to each word. We explained to the students that they should try their best, read independently, and keep going if they got stuck. After these quick instructions, the students read the book.
Preview (Guided) Reading
In the preview condition, we prepared and followed a script for each book. We created each script based on story ele-ments Fountas and Pinnell emphasize in their guided reading model. After stating and pointing to the title, we gave a short introductory statement of the story’s plot. Next, we invited the students to “take a walk through the pictures” and to talk about what they saw in each illustration. During the book walk, we stopped the students one or two times to introduce a vocabulary word or concept. At the end of the book walk, we read a closing statement about the story. After encouraging students to do their best, we invited them to read the book.
Modeled (Shared) Reading
For the modeled reading condition, we stated the title of the book while pointing to each word, and then read the book aloud to the students, pointing as we read. When we were finished reading, we invited the students to read the book.
Text Leveling and Little Books
11
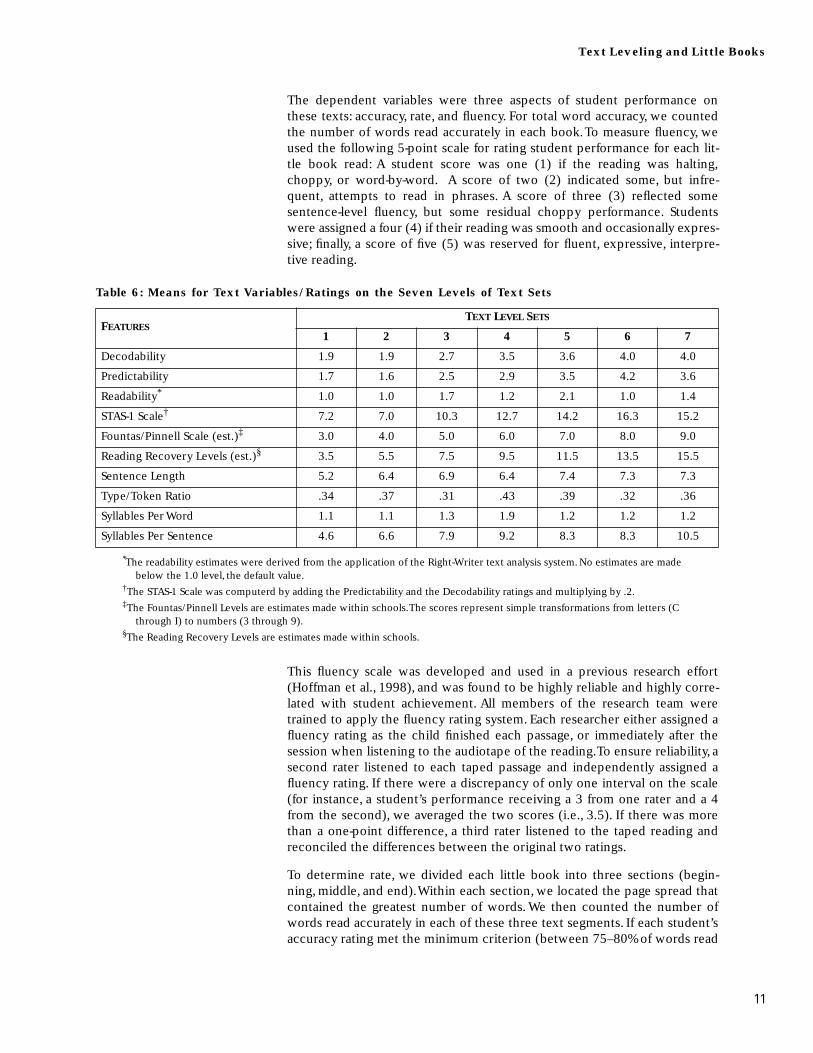
The dependent variables were three aspects of student performance onthese texts: accuracy, rate, and fluency. For total word accuracy, we countedthe number of words read accurately in each book. To measure fluency, weused the following 5-point scale for rating student performance for each lit-tle book read: A student score was one (1) if the reading was halting,choppy, or word-by-word. A score of two (2) indicated some, but infre-quent, attempts to read in phrases. A score of three (3) reflected somesentence-level fluency, but some residual choppy performance. Studentswere assigned a four (4) if their reading was smooth and occasionally expres-sive; finally, a score of five (5) was reserved for fluent, expressive, interpre-tive reading.
This fluency scale was developed and used in a previous research effort(Hoffman et al., 1998), and was found to be highly reliable and highly corre-lated with student achievement. All members of the research team weretrained to apply the fluency rating system. Each researcher either assigned afluency rating as the child finished each passage, or immediately after thesession when listening to the audiotape of the reading. To ensure reliability, asecond rater listened to each taped passage and independently assigned afluency rating. If there were a discrepancy of only one interval on the scale(for instance, a student’s performance receiving a 3 from one rater and a 4from the second), we averaged the two scores (i.e., 3.5). If there was morethan a one-point difference, a third rater listened to the taped reading andreconciled the differences between the original two ratings.
To determine rate, we divided each little book into three sections (begin-ning, middle, and end). Within each section, we located the page spread thatcontained the greatest number of words. We then counted the number ofwords read accurately in each of these three text segments. If each student’saccuracy rating met the minimum criterion (between 75–80% of words read
Table 6: Means for Text Variables/Ratings on the Seven Levels of Text Sets
F
EATURES
T
EXT
L
EVEL
S
ETS
1 2 3 4 5 6 7
Decodability 1.9 1.9 2.7 3.5 3.6 4.0 4.0
Predictability 1.7 1.6 2.5 2.9 3.5 4.2 3.6
Readability
*
1.0 1.0 1.7 1.2 2.1 1.0 1.4
STAS-1 Scale
†
7.2 7.0 10.3 12.7 14.2 16.3 15.2
Fountas/Pinnell Scale (est.)
‡
3.0 4.0 5.0 6.0 7.0 8.0 9.0
Reading Recovery Levels (est.)
§
3.5 5.5 7.5 9.5 11.5 13.5 15.5
Sentence Length 5.2 6.4 6.9 6.4 7.4 7.3 7.3
Type/Token Ratio .34 .37 .31 .43 .39 .32 .36
Syllables Per Word 1.1 1.1 1.3 1.9 1.2 1.2 1.2
Syllables Per Sentence 4.6 6.6 7.9 9.2 8.3 8.3 10.5
*
The readability estimates were derived from the application of the Right-Writer text analysis system. No estimates are made below the 1.0 level, the default value.
†
The STAS-1 Scale was computerd by adding the Predictability and the Decodability ratings and multiplying by .2.
‡
The Fountas/Pinnell Levels are estimates made within schools. The scores represent simple transformations from letters (C through I) to numbers (3 through 9).
§
The Reading Recovery Levels are estimates made within schools.
CIERA Report 1-010
12
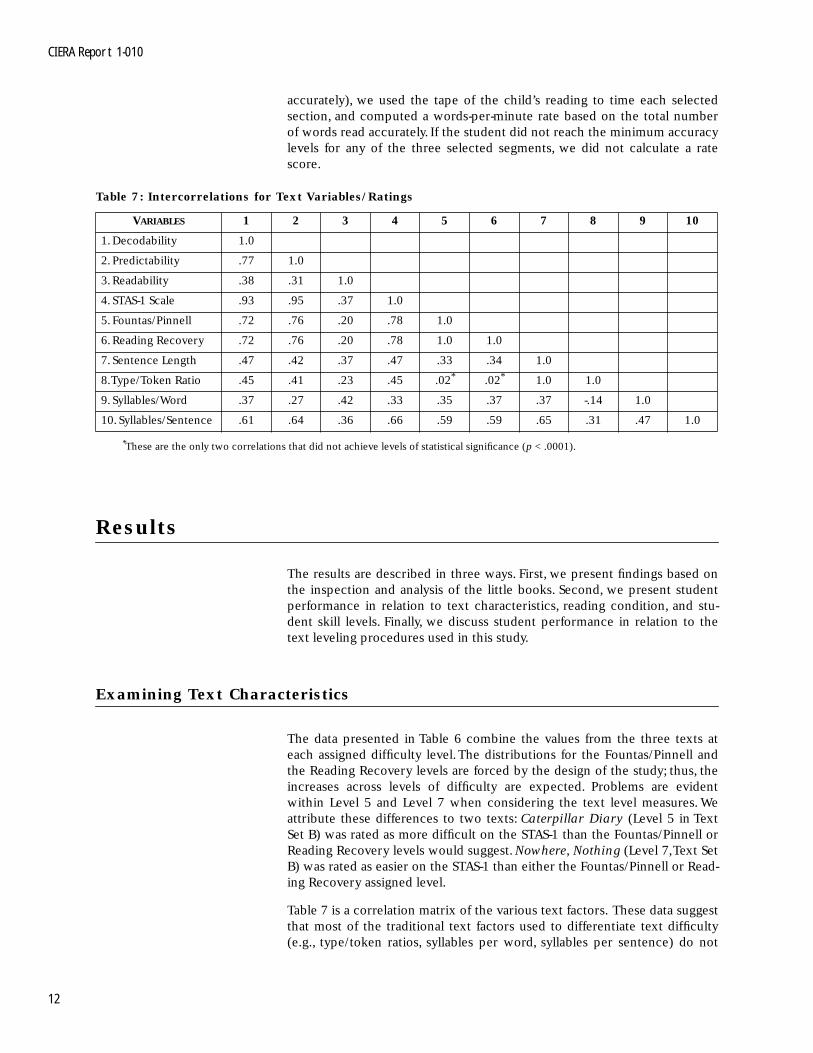
accurately), we used the tape of the child’s reading to time each selectedsection, and computed a words-per-minute rate based on the total numberof words read accurately. If the student did not reach the minimum accuracylevels for any of the three selected segments, we did not calculate a ratescore.
Results
The results are described in three ways. First, we present findings based onthe inspection and analysis of the little books. Second, we present studentperformance in relation to text characteristics, reading condition, and stu-dent skill levels. Finally, we discuss student performance in relation to thetext leveling procedures used in this study.
Examining Text Characteristics
The data presented in Table 6 combine the values from the three texts ateach assigned difficulty level. The distributions for the Fountas/Pinnell andthe Reading Recovery levels are forced by the design of the study; thus, theincreases across levels of difficulty are expected. Problems are evidentwithin Level 5 and Level 7 when considering the text level measures. Weattribute these differences to two texts: Caterpillar Diary (Level 5 in TextSet B) was rated as more difficult on the STAS-1 than the Fountas/Pinnell orReading Recovery levels would suggest. Nowhere, Nothing (Level 7, Text SetB) was rated as easier on the STAS-1 than either the Fountas/Pinnell or Read-ing Recovery assigned level.
Table 7 is a correlation matrix of the various text factors. These data suggestthat most of the traditional text factors used to differentiate text difficulty(e.g., type/token ratios, syllables per word, syllables per sentence) do not
Table 7: Intercorrelations for Text Variables/Ratings
VARIABLES 1 2 3 4 5 6 7 8 9 10
1. Decodability 1.0
2. Predictability .77 1.0
3. Readability .38 .31 1.0
4. STAS-1 Scale .93 .95 .37 1.0
5. Fountas/Pinnell .72 .76 .20 .78 1.0
6. Reading Recovery .72 .76 .20 .78 1.0 1.0
7. Sentence Length .47 .42 .37 .47 .33 .34 1.0
8. Type/Token Ratio .45 .41 .23 .45 .02* .02* 1.0 1.0
9. Syllables/Word .37 .27 .42 .33 .35 .37 .37 -.14 1.0
10. Syllables/Sentence .61 .64 .36 .66 .59 .59 .65 .31 .47 1.0
*These are the only two correlations that did not achieve levels of statistical significance (p < .0001).
Text Leveling and Little Books
13
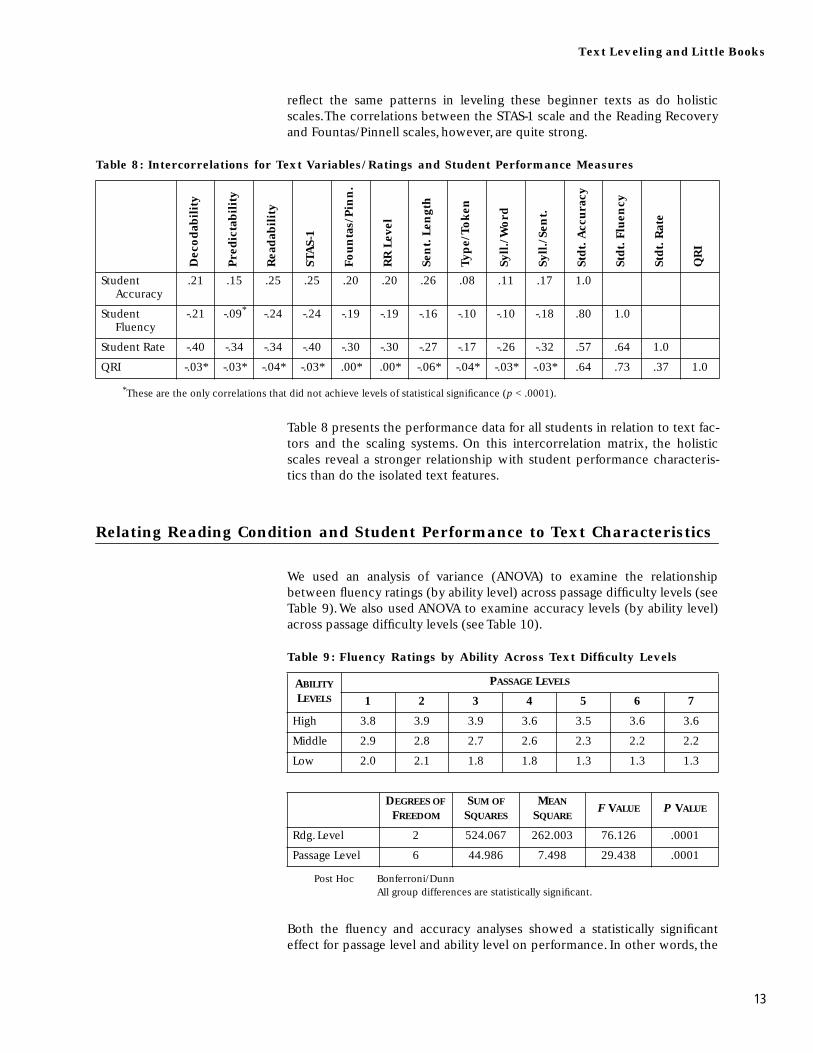
reflect the same patterns in leveling these beginner texts as do holisticscales. The correlations between the STAS-1 scale and the Reading Recoveryand Fountas/Pinnell scales, however, are quite strong.
Table 8 presents the performance data for all students in relation to text fac-tors and the scaling systems. On this intercorrelation matrix, the holisticscales reveal a stronger relationship with student performance characteris-tics than do the isolated text features.
Relating Reading Condition and Student Performance to Text Characteristics
We used an analysis of variance (ANOVA) to examine the relationshipbetween fluency ratings (by ability level) across passage difficulty levels (seeTable 9). We also used ANOVA to examine accuracy levels (by ability level)across passage difficulty levels (see Table 10).
Both the fluency and accuracy analyses showed a statistically significanteffect for passage level and ability level on performance. In other words, the
Table 8: Intercorrelations for Text Variables/Ratings and Student Performance Measures
Dec
od
abil
ity
Pre
dic
tab
ilit
y
Rea
dab
ilit
y
STA
S-1
Fo
un
tas/
Pin
n.
RR
Lev
el
Sen
t. L
engt
h
Typ
e/T
ok
en
Syll
./W
ord
Syll
./Se
nt.
Std
t. A
ccu
racy
Std
t. F
luen
cy
Std
t. R
ate
QR
I
Student Accuracy
.21 .15 .25 .25 .20 .20 .26 .08 .11 .17 1.0
Student Fluency
-.21 -.09* -.24 -.24 -.19 -.19 -.16 -.10 -.10 -.18 .80 1.0
Student Rate -.40 -.34 -.34 -.40 -.30 -.30 -.27 -.17 -.26 -.32 .57 .64 1.0
QRI -.03* -.03* -.04* -.03* .00* .00* -.06* -.04* -.03* -.03* .64 .73 .37 1.0
* These are the only correlations that did not achieve levels of statistical significance (p < .0001).
Table 9: Fluency Ratings by Ability Across Text Difficulty Levels
ABILITY LEVELS
PASSAGE LEVELS
1 2 3 4 5 6 7
High 3.8 3.9 3.9 3.6 3.5 3.6 3.6
Middle 2.9 2.8 2.7 2.6 2.3 2.2 2.2
Low 2.0 2.1 1.8 1.8 1.3 1.3 1.3
Post Hoc Bonferroni/Dunn All group differences are statistically significant.
DEGREES OF FREEDOM
SUM OF SQUARES
MEAN SQUARE
F VALUE P VALUE
Rdg. Level 2 524.067 262.003 76.126 .0001
Passage Level 6 44.986 7.498 29.438 .0001

CIERA Report 1-010
14
more challenging the passages were, the lower the performance was onboth variables. To ground these data in a central reference point, we foundthat the average rate on the middle level set of passages (Level 4 texts) was95% (SD = .06). The average fluency level for the Level 4 texts was 2.7 (SD =1.1). The analyses of the rate data, however, proved problematic. To attemptto make the rate data meaningful, we set a base-level criterion on word-reading accuracy that the student must achieve (80% or better on all threesamples) before we would attempt to calculate that student’s rate. Because
many of the low group readers, and even some of the middle group readers,did not achieve this level of accuracy, their rate data were not included. Theresulting uneven cell sizes made calculating statistical effects impossible.Our analysis of rate, therefore, was limited to a consideration of the perfor-mance of middle and high-skill readers. For both groups, we found a statisti-cally significant effect for passage level on rate (p = .01) with an average rateof 125 words per minute on the easiest passages (Level 1 texts), an averagerate of 82 words per minute on the middle set of passages (Level 4 texts),
Table 10: Accuracy Ratings by Ability Across Text Difficulty Levels
ABILITY LEVELS
PASSAGE LEVELS
1 2 3 4 5 6 7
High .98 .98 .98 .96 .96 .96 .96
Middle .89 .91 .86 .82 .76 .78 .79
Low .70 .69 .65 .59 .49 .48 .50
Post Hoc Bonferroni/Dunn All group differences are statistically significant.
DEGREES OF FREEDOM
SUM OF SQUARES
MEAN SQUARE
F VALUE P VALUE
Rdg. Level 2 18.237 9.119 70.082 .0001
Passage Level 6 1.850 .308 26.907 .0001
Table 11: Fluency Levels by Treatment Condition
CONDITIONPASSAGE LEVELS
1 2 3 4 5 6 7
Sight 2.5 2.5 2.3 2.3 2.1 2.2 2.1
Preview 2.8 2.7 2.7 2.4 2.2 2.3 2.3
Modeled 3.6 3.7 3.6 3.4 2.9 2.8 2.7
Post Hoc Bonferroni/DunnStatistically significant differences for the Modeled condition, but not between Sight and Preview.
DEGREES OF FREEDOM
SUM OF SQUARES
MEAN SQUARE
F VALUE P VALUE
Condition 2 125.682 62.841 8.641 .0003
Passage Level 6 44.986 7.498 30.364 .0001
Text Leveling and Little Books
15
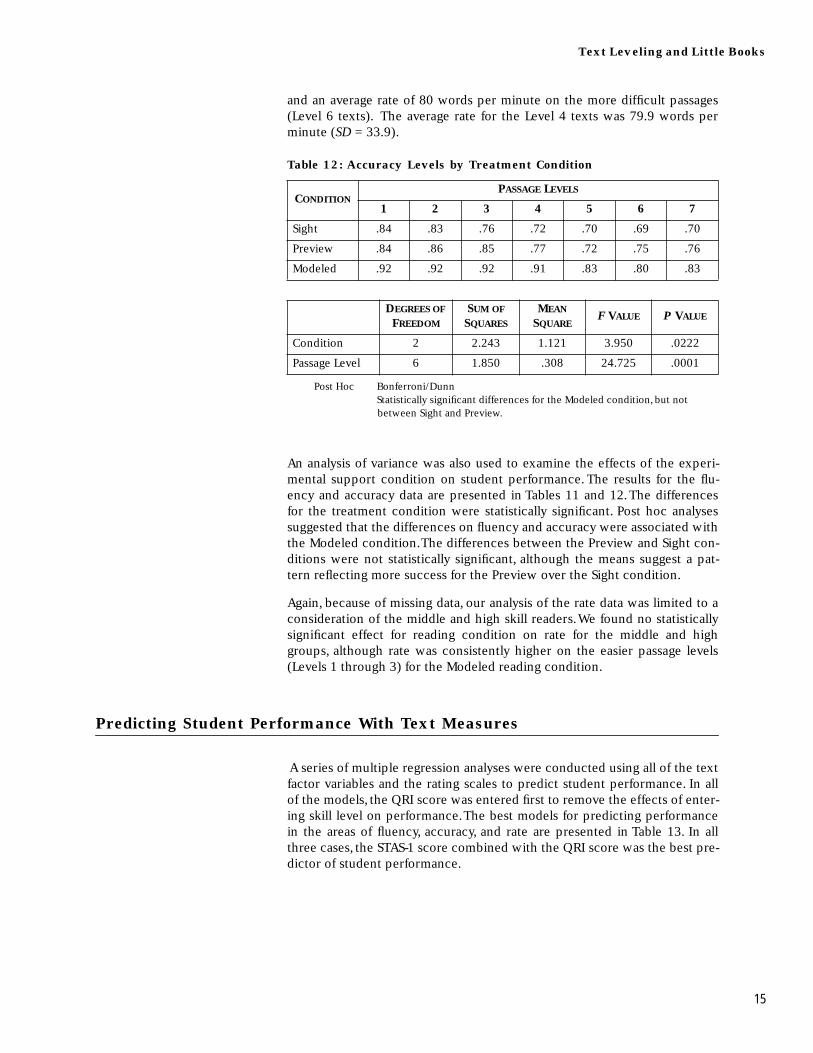
and an average rate of 80 words per minute on the more difficult passages(Level 6 texts). The average rate for the Level 4 texts was 79.9 words perminute (SD = 33.9).
An analysis of variance was also used to examine the effects of the experi-mental support condition on student performance. The results for the flu-ency and accuracy data are presented in Tables 11 and 12. The differencesfor the treatment condition were statistically significant. Post hoc analysessuggested that the differences on fluency and accuracy were associated withthe Modeled condition. The differences between the Preview and Sight con-ditions were not statistically significant, although the means suggest a pat-tern reflecting more success for the Preview over the Sight condition.
Again, because of missing data, our analysis of the rate data was limited to aconsideration of the middle and high skill readers. We found no statisticallysignificant effect for reading condition on rate for the middle and highgroups, although rate was consistently higher on the easier passage levels(Levels 1 through 3) for the Modeled reading condition.
Predicting Student Performance With Text Measures
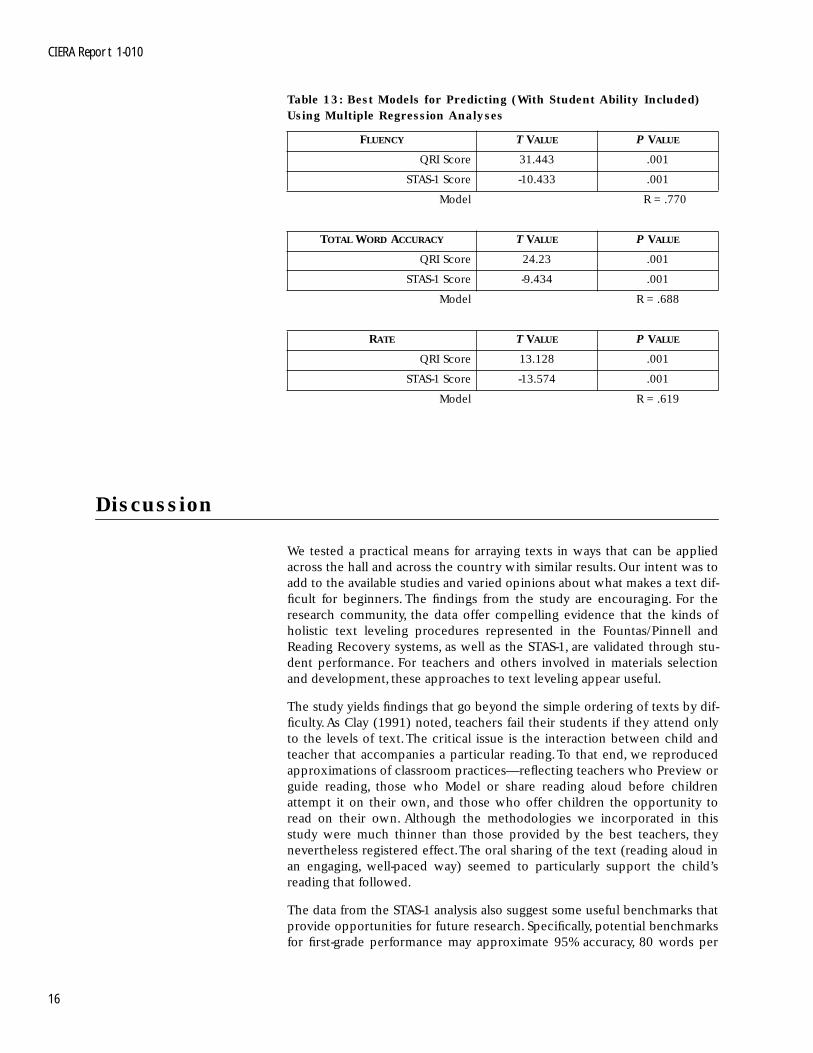
A series of multiple regression analyses were conducted using all of the textfactor variables and the rating scales to predict student performance. In allof the models, the QRI score was entered first to remove the effects of enter-ing skill level on performance. The best models for predicting performancein the areas of fluency, accuracy, and rate are presented in Table 13. In allthree cases, the STAS-1 score combined with the QRI score was the best pre-dictor of student performance.
Table 12: Accuracy Levels by Treatment Condition
CONDITIONPASSAGE LEVELS
1 2 3 4 5 6 7
Sight .84 .83 .76 .72 .70 .69 .70
Preview .84 .86 .85 .77 .72 .75 .76
Modeled .92 .92 .92 .91 .83 .80 .83
Post Hoc Bonferroni/DunnStatistically significant differences for the Modeled condition, but not between Sight and Preview.
DEGREES OF FREEDOM
SUM OF SQUARES
MEAN SQUARE
F VALUE P VALUE
Condition 2 2.243 1.121 3.950 .0222
Passage Level 6 1.850 .308 24.725 .0001
CIERA Report 1-010
16
Discussion
We tested a practical means for arraying texts in ways that can be appliedacross the hall and across the country with similar results. Our intent was toadd to the available studies and varied opinions about what makes a text dif-ficult for beginners. The findings from the study are encouraging. For theresearch community, the data offer compelling evidence that the kinds ofholistic text leveling procedures represented in the Fountas/Pinnell andReading Recovery systems, as well as the STAS-1, are validated through stu-dent performance. For teachers and others involved in materials selectionand development, these approaches to text leveling appear useful.
The study yields findings that go beyond the simple ordering of texts by dif-ficulty. As Clay (1991) noted, teachers fail their students if they attend onlyto the levels of text. The critical issue is the interaction between child andteacher that accompanies a particular reading. To that end, we reproducedapproximations of classroom practices—reflecting teachers who Preview orguide reading, those who Model or share reading aloud before childrenattempt it on their own, and those who offer children the opportunity toread on their own. Although the methodologies we incorporated in thisstudy were much thinner than those provided by the best teachers, theynevertheless registered effect. The oral sharing of the text (reading aloud inan engaging, well-paced way) seemed to particularly support the child’sreading that followed.
The data from the STAS-1 analysis also suggest some useful benchmarks thatprovide opportunities for future research. Specifically, potential benchmarksfor first-grade performance may approximate 95% accuracy, 80 words per
Table 13: Best Models for Predicting (With Student Ability Included) Using Multiple Regression Analyses
FLUENCY T VALUE P VALUE
QRI Score 31.443 .001
STAS-1 Score -10.433 .001
Model R = .770
TOTAL WORD ACCURACY T VALUE P VALUE
QRI Score 24.23 .001
STAS-1 Score -9.434 .001
Model R = .688
RATE T VALUE P VALUE
QRI Score 13.128 .001
STAS-1 Score -13.574 .001
Model R = .619
Text Leveling and Little Books
17
minute, and a fluency level of 3 when the children read texts judged as mid-first-grade difficulty (Levels 3–5). We pose these tentative figures with thecaution that they represent data gathered in very particularized conditionsand contexts.
Although both leveling systems stood up well under the scrutiny of thisstudy, there appear to be distinct strengths associated with each. The STAS-1scale offers the advantage of unpacking the features of predictablity fromdecodability. It may also offer a slight advantage in terms of ease of use. TheFountas/Pinnell system offers the advantage of considering a broader arrayof text features such as the overall length of the text, the number of wordsper page, and the size of print. Neither system offers a very careful inspec-tion of word-level features. We suspect that the work of Hiebert (1999) inthis area may enrich the set of tools available to inspect the texts used forbeginning readers.
But What About . . . ?
Several design decisions and unalterable circumstances of our study mayhave affected the generalizability of results. For example, we observed andmeasured students enrolled in the professional development schools inwhich we work. The children in these low-income neighborhoods are pre-dominantly Hispanic and speak English as their second language. We do notknow if the patterns we described will generalize more broadly to first-gradestudents in other settings. Certainly, other categories of readers must be con-sidered before we can suggest general implications.
Second, we focused closely on word-level issues in our measures, narrowlydefining children’s reading both in our initial measure and in our judgmentsof book reading performance. Neither did we consider the physical designsof books as a potential support for beginning readers (Peterson, 1991). Toexamine only a portion of reading prowess is to ignore such important fac-tors as comprehension, engagement, interest, decoding strategies, and chil-dren’s instructional and life histories. In limiting our focus, we did notdiscount the wide-ranging goals of effective reading. Rather, in the interestof expediency, we focused on decoding and fluency. In the case of the QRIword recognition test, for example, we selected a manageable instrumentwith which many children could experience some success—even thosewhose literacy was just beginning to emerge. We recognize the need towiden the lens in our determination of reading performance, incorporatingmore of the potential scaffolds available to teachers. However, even withoutattending to a full range of text features or knowing our participants’ individ-ual backgrounds and needs, we found that the accuracy and fluency thatthese children demonstrated while reading leveled little books gave usinsight into their text processing. We can now use these findings in investi-gating the broader set of reading issues that concern us. The results of thisstudy are in no sense definitive or as clear-cut as we might have hoped. Weconcur with Hiebert’s (1999) admonition that the debate over which textfeatures are useful for beginners has continued for too long in the absence of

CIERA Report 1-010
18
empirical data. This investigation linking text factors with student perfor-mance is a step toward investigating these issues with a finer lens.
Text Leveling and Little Books
19
Notes
1. The original scale and procedures are presented in NRRC Technical Report #6 entitled So What's New in the New Basals? A Focus on First Grade. The scale presented here has been rearranged in terms of the direction of difficulty. This change was made to permit combining the two scales. Some minor modifications have also been made in the scal-ing features based on experiences in the training of coders to high levels of reliability.

CIERA Report 1-010
20
References
Clay, M. M. (1991). Becoming literate: The construction of inner control.Portsmouth, NH: Heinemann.
Fountas, I. C., & Pinnell, G. S. (1996). Guided reading: Good first teachingfor all children. Portsmouth, NH: Heinemann.
Fountas, I. C., & Pinnell, G. S. (1999). Matching books to readers: Using lev-eled books in guided reading, K–3. Portsmouth, NH: Heinemann.
Harris, W. V. (1989). Ancient literacy. Cambridge, MA: Harvard UniversityPress.
Hiebert, E. H. (1999). Text matters in learning to read. The Reading Teacher,52, 552–566.
Hiebert, E. H., & Raphael, T. E. (1998). Early literacy instruction. FortWorth, TX: Harcourt Brace.
Hoffman, J. V., McCarthey, S. J., Abbott, J., Christian, C., Corman, L., Curry,C., Dressman, M., Elliott, B., Matherne, D., & Stahle, D. (1993). Sowhat’s new in the new basals? A focus on first grade (National ReadingResearch Report No. 6). Athens, GA, and College Park, MD: NationalReading Research Center.
Hoffman, J. V., McCarthey, S. J., Abbott, J., Christian, C., Corman, L., Dress-man, M., Elliot, B., Matherne, D., & Stahle, D. (1994). So what’s new inthe “new” basals? Journal of Reading Behavior, 26, 47–73.
Hoffman, J. V., McCarthey, S. J., Elliott, B., Bayles, D. L., Price, D. P., Ferree, A.,& Abbott, J. A. (1997). The literature-based basals in first-grade class-rooms: Savior, Satan, or same-old, same old? Reading Research Quar-terly, 33 (2), 168–197.
Hoffman, J. V., Roser, N. L., & Worthy, J. (1998). Challenging the assessmentcontext for literacy instruction in first grade: A collaborative study. In C.Harrison & T. Salinger (Eds.), Assessing reading: Theory and practice(pp 166–181). London: Routledge.
Holdaway, D. (1979). The foundations of literacy. Exeter, NH: Heinemann.
Klare, G. (1984). Readability. In P. D. Pearson, R. Barr, M. Kamil, & P.Mosenthal (Eds.), Handbook of reading research (pp. 681–744). NewYork: Longman.
Leslie, L., & Caldwell, J. (1990). Qualitative reading inventory. New York:HarperCollins.
Peterson, B. (1991). Selecting books for beginning readers: Children’s litera-ture suitable for young readers. In D. E. DeFord, C. A. Lyons, & G. S. Pin-nell (Eds.), Bridges to literacy: Learning from Reading Recovery (pp.115–147). Portsmouth, NH: Heinemann.
Rhodes, L. K. (1981). I can read! Predictable books as resources for readingand writing instruction. The Reading Teacher, 36, 511–518.

Text Leveling and Little Books
21
Smith, N. B. (1965/1986). American reading instruction. Newark, DE: Inter-national Reading Association.
Venezky, R. L. (1987). A history of the American reading textbook. The Ele-mentary School Journal, 87, 247–281.
Wepner, S., & Feeley, J. (1986). Moving forward with literature: Basals,books, and beyond. New York: Maxwell Macmillan International.

About CIERA
The Center for the Improvement of Early Reading Achievement (CIERA) isthe national center for research on early reading and represents a consor-tium of educators in five universities (University of Michigan, University ofVirginia, and Michigan State University with University of Southern Califor-nia and University of Minnesota), teacher educators, teachers, publishers oftexts, tests, and technology, professional organizations, and schools andschool districts across the United States. CIERA is supported under the Edu-cational Research and Development Centers Program, PR/Award NumberR305R70004, as administered by the Office of Educational Research andImprovement, U.S. Department of Education.
Mission.
CIERA’s mission is to improve the reading achievement of Amer-ica’s children by generating and disseminating theoretical, empirical, andpractical solutions to persistent problems in the learning and teaching ofbeginning reading.
CIERA Research Model
The model that underlies CIERA’s efforts acknowledges many influences onchildren’s reading acquisition. The multiple influences on children’s earlyreading acquisition can be represented in three successive layers, each yield-ing an area of inquiry of the CIERA scope of work. These three areas ofinquiry each present a set of persistent problems in the learning and teach-ing of beginning reading:
CIERA Inquiry 1
Readers and Texts
Characteristics of readers and texts and their relationship to earlyreading achievement.
What are the characteristics of readers and textsthat have the greatest influence on early success in reading? How can chil-dren’s existing knowledge and classroom environments enhance the factorsthat make for success?
CIERA Inquiry 2
Home and School
Home and school effects on early reading achievment.
How do thecontexts of homes, communities, classrooms, and schools support high lev-els of reading achievement among primary-level children? How can thesecontexts be enhanced to ensure high levels of reading achievement for allchildren?
CIERA Inquiry 3
Policy and Profession
Policy and professional effects on early reading achievement.
Howcan new teachers be initiated into the profession and experienced teachersbe provided with the knowledge and dispositions to teach young children toread well? How do policies at all levels support or detract from providing allchildren with access to high levels of reading instruction?
www.ciera.org

610 E University Av, Rm 1600 SEBAnn Arbor, MI 48109-1259
734.647.6940 voice734.763.1229 [email protected]
www.ciera.org
University of Michigan School of Education
CIERA is a collaboration ofUniversity of MichiganUniversity of VirginiaMichigan State University
withUniversity of MinnesotaUniversity of Southern California