Embed Size (px)
Citation preview

TEXT MINING ON TWITTER DATA TO EVALUATE SENTIMENT
BY
SRIJANEE NIYOGI
Presented to the Faculty of the Graduate School of
The University of Texas at Arlington in Partial Fulfillment
of the Requirements
for the Degree of
MASTER OF SCIENCE IN COMPUTER SCIENCE
THE UNIVERSITY OF TEXAS AT ARLINGTON
December 2018

ii
Acknowledgements
I would like to express my sincere gratitude to Mr. David Levine, my thesis supervisor who has
guided and motivated me in the course of this thesis. His continuous support with patience and
enthusiasm has helped me in contributing my research work in this thesis. He has always been a
major support system in any problems that I faced academically and personal
I would like to acknowledge and thank my committee member for their co-operation, feedback
and support. They added some extra value to my thesis
My heartfelt thanks to my family without whose support and motivation, this would not have
been possible.
October 23, 2018

iii
Abstract
TWITTER DATA ANALYSIS ACCORDING TO SENTIMENT
BY
SRIJANEE NIYOGI
The University of Texas at Arlington, 2018
Supervising Professor: David Levine
Committee Members: Christoph Csallner
Farhad Kamangar
Social media platforms have been a major part of our daily lives. But with the freedom of
expression there is no way one can check whether the posts/tweets/expressions are classified on
which polarity. Since Twitter is one of the biggest social platforms for microblogging, hence the
experiment was done on this platform. There are several topics that are popular over the internet
like sports, politics, finance, technology are chosen as the source of the experiment. These tweets
were collected over a span of time for more than 2 months via a cron job.
Every tweet can be divided into three categories based on sentiment analysis, positive, negative
or neutral. In the process of analyzing the sentiment, Natural Language Processing is widely used
for data processing like removing stopwords, lemmatization, tokenization and POS tagging. In
this work, focus is on the detection and prediction of sentiments based on tweets, associated with
different topics. There are several ways to carry out the analysis using libraries, APIs, classifiers
and tools. The use of data mining techniques namely data extraction, data cleaning, data storage,
comparison with other reliable sources and finally sentiment analysis is followed for this thesis.
In this experiments and analysis, a comparative study of sentiment analysis of various tweets
collected over a span of time, by using many data mining techniques is presented. The
techniques used are mainly lexicon-based, machine learning based using Random Forest
Classifier, API based Stanford NLP Sentiment analyzer and a tool called SentiStrength. The fifth
way of analysis is an expert, i.e. a human carrying out the analysis. In this approach, the polarity
of a particular tweet is found, analyzed and a confusion matrix is prepared. From that matrix
tweets are broadly classified into 4 classes, namely False Positive, False Negative, True Positive
and True Negative, which are used to calculate parameters like accuracy, precision and recall.

iv
This entire task is transformed to a cloud-based web interface hosted on Amazon Web Services
to carry out the operations without human intervention on live data.
LIST OF FIGURES
2.1 The different steps of data mining
4.1 Crontab file
5.1 Different functionalities of NLTK
5.2 A list of stopwords
5.3 A pie chart representing the tweets extracted on the topic of politics and the names of
politicians used
5.4 A bar graph on number of tweets that are extracted over a week on each day
5.5 A bar graph to denote the frequency of every word used
6.1 Python code and result to show different functionalities with TextBlob
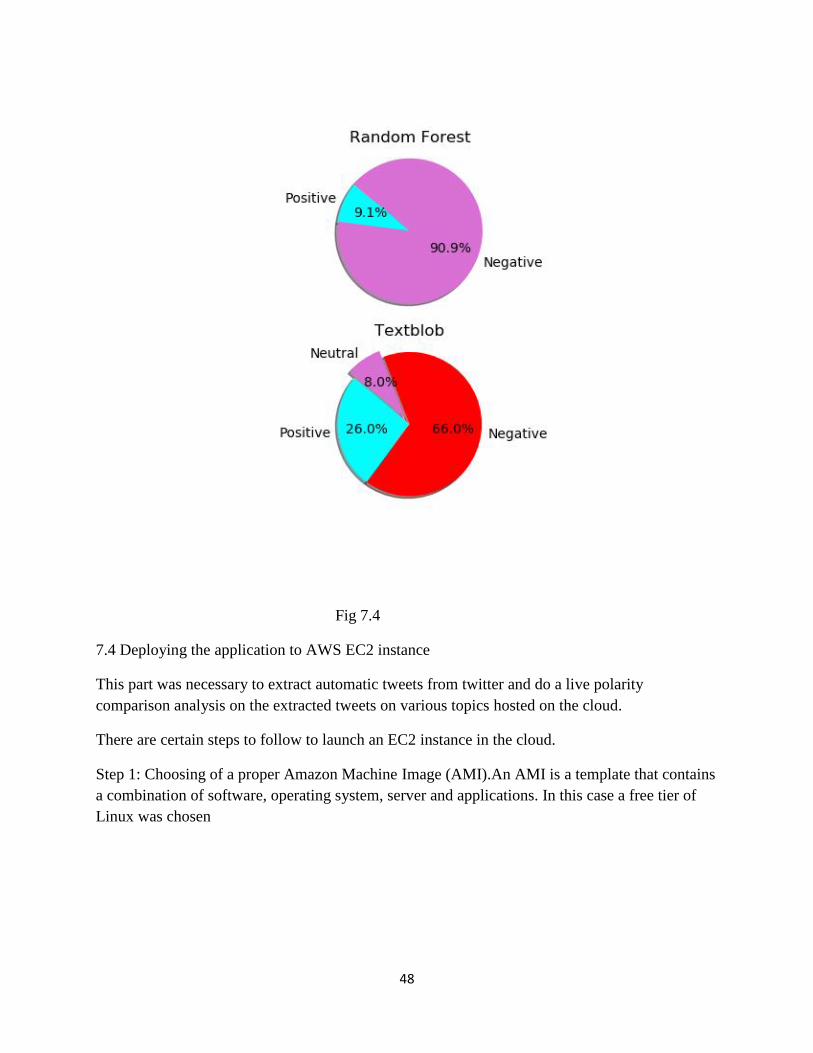
6.2 A % pie chart to determine the polarity of tweets using TextBlob
6.3 How the Random classifier works
6.4 Figure denotes the pie chart denoting polarity derived from applying Random Forest
Classifier
6.5 denotes the model constructed by both the training and the test data set.
6.6 A sentiment tree as evaluated by the Stanford NLP Tagger, the root determines the polarity in
this case negative
6.7 A positive analyzed tweet by Stanford NLP Tagger
6.8 Graph showing the plotting of the polarity of tweets over a time period of 15 days.
7.1 EC2 instance launched on AWS
7.2 Database instance launched on AWS
7.3 The input html page for the cloud application
7.4 The output html page of a pie chart for every separate tool doing sentiment analysis.
7.5 Choosing AMI server on configuring EC2
v
7.6 Choosing inbound nad outbound security rules on configuring EC2
7.7 Using Putty terminal to connect to AWS EC2 from a Windows 10 local machine
7.8 Using WinSCP to upload and download files to and from AWS EC2
8.1 CNN RSS Feeds page
8.2 The NLP analyzer shows every text in the form of binary trees and the red root denotes
negative polarity, blue=positive and white denotes neutral sentiments.
8.3 The comparison in performance for the 2 tools in the different natural language processing
activities.
8.4 Figure denotes a pie chart to find the percentage on negative and positive sentiments using
Naive Bayesian classifier
8.5 Customer reviews as available on the website of amazon.com
8.6 Mechanism of web scrapping

vi
LIST OF TABLES
3.1 Tags to different parts of speech as used by NLTK
4.1 Columns derived from every tweet extracted
5.1 Functions provided by Tweepy library
5.2 Timeline parameters for Tweepy API
6.0 A sample confusion matrix
6.1 denotes the evaluation of the polarity of the tweets that we have obtained with the help of a
confusion matrix with TextBlob
6.2 denotes the evaluation of the polarity of the tweets that we have obtained with the help of a
confusion matrix with Classifier
6.3 denotes the evaluation of the polarity of the tweets that we have obtained with the help of a
confusion matrix with SentiStrength
6.4 Denotes the evaluation of the polarity of the tweets that we have obtained with the help of a
confusion matrix with NLP tagger
6.5 Table denoting recall, precision and accuracy for four different tools on the topic of Finance
6.6 denotes the evaluation of the polarity of the tweets that we have obtained with the help of a
confusion matrix with TextBlob
6.7 denotes the evaluation of the polarity of the tweets that we have obtained with the help of a
confusion matrix with Classifier
6.8 denotes the evaluation of the polarity of the tweets that we have obtained with the help of a
confusion matrix with SentiStrength
6.9 Denotes the evaluation of the polarity of the tweets that we have obtained with the help of a
confusion matrix with NLP tagger
6.10 Table denoting recall, precision and accuracy for four different tools on the topic of Politics

vii
6.11 denotes the evaluation of the polarity of the tweets that we have obtained with the help of a
confusion matrix with TextBlob
6.12 denotes the evaluation of the polarity of the tweets that we have obtained with the help of a
confusion matrix with Classifier
6.13 denotes the evaluation of the polarity of the tweets that we have obtained with the help of a
confusion matrix with SentiStrength
6.14 Denotes the evaluation of the polarity of the tweets that we have obtained with the help of a
confusion matrix with NLP tagger
6.15 Table denoting recall, precision and accuracy for four different tools on the topic of Sports
6.16 Accuracy measurement for the 4 different tools on the 3 different topics
6.17 Precision measurement for the 4 different tools on the 3 different topics
6.18 Recall measurement for the 4 different tools on the 3 different topics
8.1 Sentiment analysis on RSS feeds by 4 tools and an expert.
8.2 Sentiment analysis on an excerpt of a fiction by 4 tools and an expert.
8.3 Sentiment analysis on customer reviews from a website by

viii
PROBLEM STATEMENT
Twitter is one of the biggest platforms of expressing a person’s feeling on a social media. These
set of information can be used in several ways as data to analyze or deduce something. There is a
lot of things happening around the world in the field of politics. This is affecting the common
people in mass. For example, if a new amendment law has been passed it can have its own pros
or cons depending on the set of people and how they are affected. I wanted to therefore analyze
the sentiment of each tweets and find out whether they are inclined more towards positive or
negative polarity. This in future would help in determining whether the political situation is
getting better or worse. This kind of analysis would set an alarm in the world and politicians
would get a feedback of whether their practices are creating a negative or positive impact to the
world.
Plus, the data sources are vast and vivid, that it is difficult to analyze it and access it. Had it been
a single source of data, checking the authenticity or polarity would have been easier. However,
Twitter seems to be a good source to predict the polarity of several topics like politics, finance,
sports and technology.

ix
TABLE OF CONTENTS
ACKNOWLEDGEMENTS . . . . . . . . . . . . . . . . . . . . . . . . . . . . . . . . . ii
ABSTRACT . . . . . . . . . . . . . . . . . . . . . . . . . . . . . . . . . . . . . . . . . . . . . iii
LIST OF FIGURES . . . . . . . . . . . . . . . . . . . . . . . . . . . . . . . . . . . . . . . .iv
LIST OF TABLES . . . . . . . . . . . . . . . . . . . . . . . . . . . . . . . . . . . . . . . . .vi
PROBLEM STATEMENT . . . . . . . . . . . . . . . . . . . . . . .. . . . . . . . . . ..viii
1. INTRODUCTION . . . . . . . . . . . . . . . . . . . . . . . . . . . . . . . . . . . . . . . . 1
1.1 Introduction and background . . . . . . . . . . . . . . . . . . . . . . . . . .. . . .. . 1
1.2 Motivation behind the thesis . . . . . . . . . . . . . . . . . .. . . . . . . . . . . . . . 2
1.3 Goals of the thesis . . . . . . . . . . . . . . . . . . . . . . . . . . . . . . . . . . . . . . . .3
1.4 Organization of the thesis . . . . . . . . . . . . . . . . . . . . . . . . . . . . . . . . . . 3
2. RELATEDWORK . . . . . . . . . . . . . . . . . . . . . . . . . . . . . . . . . . . . . . . . 4
3. An insight into the components used and the approach. . . . . . . . . . . . . 7
4. DATA . . . . . . . . . . . . . . . . . . . . . . . . . . . . . . . . . . . . . . . . . . . . . . . . . .11
4.1 Cron job . . . . . . . . . . . . . . . . . . . . . . . . . . . . . . . . . . . . . . . . . . . . . . . 11
4.2 Meaning of every column . . . . . . . . . . . . . . . . . . . . . . . . . . . . . . . . . .12
5. PRELIMINARY ANALYSES . . . . . . . . . . . . . . . . . . . . . . . . . . . . . . .13
5.1 Extracting tweets . . . . . . . . . . . . . . . . . . . . . . . . . . . . . . . . . . . . . . . . 13
5.2 Cleaning of tweets . . . . . . . . . . . . . . . . . . . . . . . . . . . . . . . . . . . . . . . 14
5.3 Initial Analysis . . . . . . . . . . . . . . . . . . . . . . . . . . . . . . . . . . . . . . . . . .17
6. EXPERIMENT AND ANALYSIS. . . . . . . . . . . . . . . . . . . . . . . . . . . .20
6.1 Sentiment analysis using Textblob. . . . . . . . . . . . . . . . . . . . . . . . . . . 21
6.2 Sentiment analysis using Random forest classifier. . . . . . . . . . . . . . .23
6.3 Sentiment analysis using tool SentiStrength. . . . . . . . . . . . . . . . . . . .26
6.4 Sentiment analysis using Stanford NLP Tagger. . . . . . . . . . . . . . . . .27
6.5 Evaluation. . . . . . . . . . . . . . . . . . . . . . . . . . . . . . . . . . . . . . . . . . . . .30
7. CLOUD IMPLEMENTATION . . . . . . . . . . . . . . . . . . . . . . . . . . . . . .45
7.1 Amazon Web Services EC2 . . . . . . . . . . . . . . . . . . . . . . . . . . . . . . .45
7.2 Amazon Web Services RDS instance for preserving data . . . . . . . . .46
7.3 Flask app . . . . . . . . . . . . . . . . . . . . . . . . . . . . . . . . . . . . . . . . . . . . . .46
7.4 Deploying the application to AWS EC2 instance . . . . . . . . . . . . . . . 48
8. CASE STUDY . . . . . . . . . . . . . .. . . . . . . . . . . . . . . . . . . . . . . . . . . . . 52
8.1 RSS Feed . . . . . . . . . . . . . . . . . . . . . . . . . . . . . . . . . . . . . . . . . . . . . 53
8.2 Sentiment Analysis on RSS feeds . . . . . . . . . . . . . . . . . . . . . . . . . . . 53
8.3 Fictional text . . . . . . . . . . . . . . . . . . . .. . . . . . . . . . . . . . . . . . . . . . . .55
8.4 Sentiment analysis on fiction. . . . . . . . . . . . . . . . . . . . . . . . . . . . . . . 55
8.5 spaCy library. . . . . . . . . . . . . . . . . . . . . . . .. . . . . . . . . . . . . . . . . . . . 56
8.6 Using Naïve Bayesian Classifier for classifying sentiments. . . . . . . 57
8.7 Sentiment analysis on Customer reviews. . . . . . . . . . . . . . . . . . . . . .60
9. SUMMARY AND CONCLUSION. . . . . . . . . . . . . . . . . . . .. . . . . . . 62
10.CHALLENGES FACED. . . . . . . . . . . . . . . . . . . .. . . . . . . . . . . . . . . 63
11.FUTURE WORK. . . . . . . . . . . . . . . . . . . .. . . . . . . . . . . . . . . . . . . . .65
References. . . . . . . . . . . . . . . . . . . .. . . . . . . . . . . . . . . . . . . . . . . . . . . . 66
Biographical Statement. . . . . . . . . . . . . . . . . . . .. . . . . . . . . . . . . . . . . . .68

1
Chapter 1
Introduction
1.1 Introduction and background
From the past few years, social media plays a vital role in modern life. Numbers of users of
social media goes on increasing day by day. Users post their view, thoughts, life events on
social media and that too without any restriction and hesitation. Some of the social media
allow users to interact with only with their friends and sharing their post with very easy level
of privacy. Due to simple and easy privacy policies, and easy accessibility of some social
media, users are migrated from traditional means of communication such as blogs or mailing
list to microblogging sites such as Twitter, Facebook etc. Billions of text data in the form of
messages on social media make it a very fascinating medium for data analysis for the
researchers.
In this thesis, Twitter was chosen as the platform for analysis. This is a social media website
where people are able to express with the help of tweets that are basically a string of words.
Millions of people are using this platform to express their views on any matter or current
affairs. But there is an immense risk of determining how authentic these posts were. So with
the help of certain useful parameters like accuracy, false positive tweets, false negative
tweets, recall and precision efficiency was measured on the analysis. Each and every term
and idea will be discussed in further depth in the upcoming chapters.
On working on this thesis, there were many things to be noted as to how to make use of data
analysis to meaningfully carve something. The focus of analysis was then chosen as
sentiments of tweets, that is closely connected to opinion mining. There are more heinous
crimes that are committed and there has to be some sort of an alarming situation to stop this
or at least reduce it. This analysis was done with the profiting the society and the world in
future to gradually irradiate the amount of violence in this world. Text analysis and opinion
mining have now become a very important part of our daily lives to deduce a lot of results
that can be useful.

2
1.2 Motivation behind the thesis
Staying safe is a topic which continues to be relevant as terrorist attacks are no longer a surprise
and mass shootings seem to be increasingly common. Is almost every destination in the world a
potential danger?
In fact, according to the latest Safe Cities Index, some places pose considerably more risk than
others. The report was released late last year by The Economist Intelligence Unit, the research
and analysis division of The Economist Group, a London-based company that specializes in
international business.
The index ranked the safety of 60 international cities across four categories, including personal
security, which scored each city on factors such as the number of terrorist attacks,
crime rates, threat of military conflict and threat of civil unrest.
The Safe Cities Index was first published in 2015, and the not-so-good news in the
second version released in 2017 is that levels of personal security appear to have declined in the
past two years, said Christopher Claque, a managing editor at The Economist Intelligence Unit
and the creator of the index.
In the field of technology too, trending software and digitalization is changing continuously over
time. It is very important to keep a check on all the new changes and stay well informed and well
equipped with the upcoming technologies.
Under such circumstances, this thesis attempts to provide analysis that may caution the world of
the negativity and pain that is occurring around the world. As this analysis will help in the future
to detect the polarity of a tweet and would set an alarm to the world and in this way, we can
bring a ray of peace and harmony to the world.
3
1.3 Goal of the thesis
The main objective of this thesis is to implement machine learning based data
analysis for finding sentiment or polarity for a particular tweet.
In order to get more appropriate results, the data goes through several steps of data was
collected over a large amount of time over many vivid topics. Then a proper cleaning of data
was performed to normalize the piece of information received. Steps have also been taken to
quantify the attributes with the help of machine learning algorithms and any possible noise or
outliers are marked. So that extreme results are not considered. Information regarding
possible polarity of tweets helps us in setting alarms of violence or peace in the world.
1.4 Organization of the thesis
The thesis in Chapter 1 start with an introduction and background about the topics, it
also covers the motivation and goals of the work. Chapter 2 gives an overview of related
work. Chapter 3 dives into an insight into the several components that play a role in this
work. Chapter 4 provides the background of the problem statement. Chapter 5 describes the
input data that is used, in this case tweets. Chapter 5 discusses the preliminary stages of the
experiment performed. Chapter 6 deals with the actual experiment and the analysis of the
results obtained with visualization. Chapter 7 performs the usage of cloud in the entire
implementation. Chapter 8 discusses a Case Study on discussing various cases of
implementing the sentiment analysis. Chapter 9 deals with the conclusion and inference of
the thesis. Chapter 10 deals with the Future Work that can be implemented with respect to
this experiment.

4
Chapter 2
Related Work
With the advancement of net and social platforms, the biggest challenge is to obtain data from
reliable sources and good data that would obtain results for accurate analysis. In order to conquer
the first challenge, Twitter was chosen as the data source. Since the focus was more on sentiment
analysis, data was be collected from various people with vivid mentality, living conditions,
dwelling areas etc.
Another challenge was data preprocessing and choosing the dimensionality of data, so that the
analysis fetched results as efficient as possible. Data preprocessing comprises of several steps
and since data here were tweets, the main goal was to remove junk information as much as
possible. Also choosing the right dimensions of data and the right column for performing our
analysis. In the below section, these are the topics to be discussed about.
2.1 Tweets
Twitter is one of the most popular social networking sites where users could post their thoughts,
expressions or beliefs. Every post can be of 140 characters. These posts can be viewed only by
their followers. There are numerous topics on which one can write, on a social topic, newsfeed or
just a feeling. [1] Twitter gives full freedom to users to choose their followers. A tweet can only
be viewed by followers. If one has a public account, then the posts will be visible to all like for
celebrities.
2.2 Data Mining
Data mining is the process of collecting data through various resources and finding some useful
patterns based on it. Meanwhile the raw data collected is in a raw form and may contain a lot of
outliers and have to be normalized. This can be done through the process of data cleaning. Once
an analysis is done, the next step is to interpret the analysis through some results. The results
obtained are done through some calculations and can also be visualized by charts.
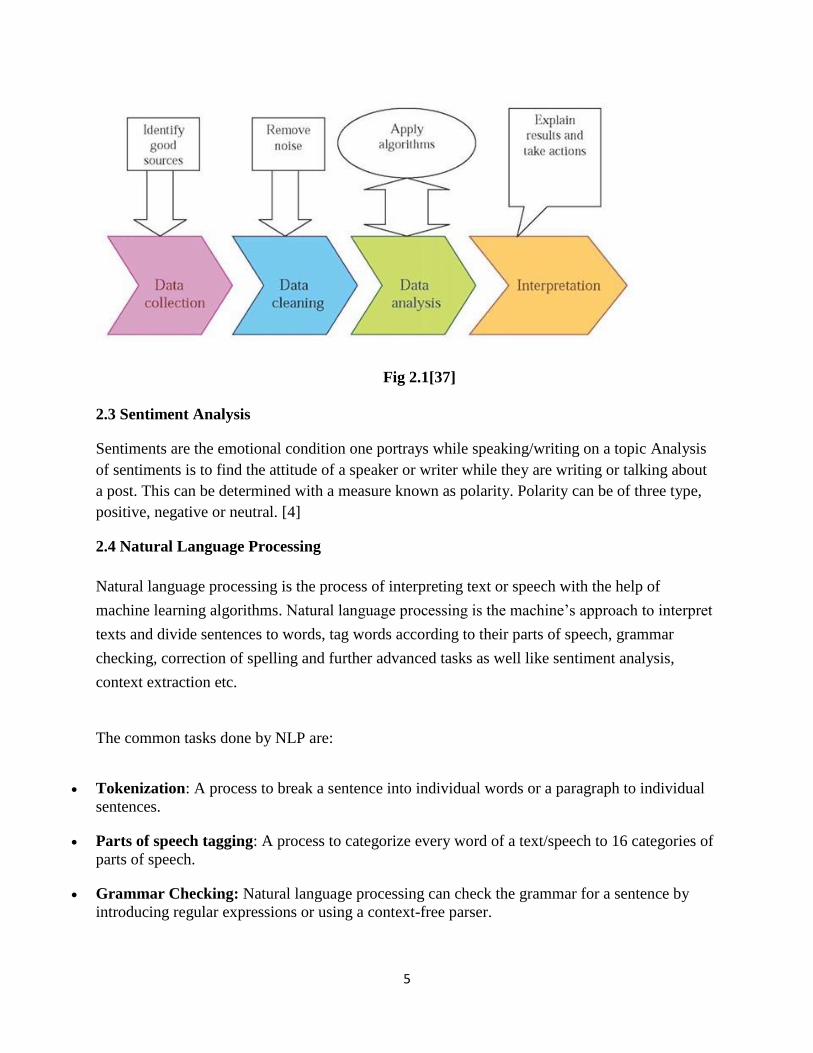
To conclude, the steps that are followed to carry out successful data mining process are
1. Collecting data from various data sources
2. Cleaning the collected data by removing outliers and normalizing the data.
3. Analyzing the data to find some interesting patterns.
4. Interpreting the results and visualizing it.
5
Fig 2.1[37]
2.3 Sentiment Analysis
Sentiments are the emotional condition one portrays while speaking/writing on a topic Analysis
of sentiments is to find the attitude of a speaker or writer while they are writing or talking about
a post. This can be determined with a measure known as polarity. Polarity can be of three type,
positive, negative or neutral. [4]
2.4 Natural Language Processing
Natural language processing is the process of interpreting text or speech with the help of
machine learning algorithms. Natural language processing is the machine’s approach to interpret
texts and divide sentences to words, tag words according to their parts of speech, grammar
checking, correction of spelling and further advanced tasks as well like sentiment analysis,
context extraction etc.
The common tasks done by NLP are:
• Tokenization: A process to break a sentence into individual words or a paragraph to individual
sentences.
• Parts of speech tagging: A process to categorize every word of a text/speech to 16 categories of
parts of speech.
• Grammar Checking: Natural language processing can check the grammar for a sentence by
introducing regular expressions or using a context-free parser.

6
• Sentiment analysis. Identifying the mood or opinion to how a speaker/writer feels on a
particular text/speech.
• Speech-to-text and text-to-speech conversion. Transforming voice commands into written text,
and vice versa. [5]
2.5 AWS EC2
Amazon Elastic Compute Cloud (Amazon EC2) is a web service that provides secure, resizable
compute capacity in the cloud. It is designed to make web-scale cloud computing easier for
developers.EC2 is the only service that uses Infrastructure as a Service (IAAS) which gives the
user the freedom to choose the server and operating system while the network and database is
chosen by the cloud service provider. [6]
2.5 AWS RDS
Amazon Relational Database Service (Amazon RDS) is a relational database that is hosted in the
cloud. It supports a cost-effective, easy to setup alternative to the classic databases. AWS RDS is
an effective database system that is compatible to several database providers like MySQL,
Microsoft SQL Server and MongoDB as well[7]. In this project I have used the database instance
for MySQL

7
Chapter 3
An insight into the components used and the approach
3.1 Choosing correct parameters in Tweets
TWEET1.csv
So, on the basis of the attached file, there are several columns. Since we were doing text
analysis, we were just interested in the main tweet that was in the text format. The rest columns
that is used and is helpful is the column named “IsRetweet”, It deliberately made an attempt to
choose only those tweets whose “IsRetweet” was FALSE. Else the same tweet reappearing may
enable fake results. Also, the “favorited” column was considered only for “TRUE” values. Since
this would mean they are the popular tweets and match the opinion with many users.
3.2 Data Preprocessing techniques
1. Text data are gradually stored into dataframes and have to be decoded to a correct format.
On further research it is found UTF-8 is the best format for dataframes as well as when
exported to Excel.
2. Some words do not add any significance in finding the opinion of users. These words as
known as stopwords like as, is, politics, science etc. These words are removed before the
text analysis is done
3. Punctuations are divided into priority. So punctuations like?, ., ! are retained and other like
, “”, $, # etc are removed.
4. Emoticons and expressions are an amalgamation of punctuation marks, hence these are
also removed as this could be misleading at times.
5. Every tweet is followed by a URL that provides a link to the actual tweet. This is not
required and removed.
6. Lemmatization is the technique of chopping words to remove their syllables and just
keeping back the basic word. For example working is changed to work .Lemmatization
also checks whether the chopped word exists in the dictionary or not and then saves it.
3.3 Sentiment analysis
Sentiment Analysis is the most common text classification tool that analyses an incoming
message and tells whether the underlying sentiment is positive, negative our neutral. This is also
described as opinion mining, since we can derive a person’s opinion or attitude who is posting.
In political field, it is used to keep track of political view, to detect consistency and inconsistency
between statements and actions at the government level. It can also check whether the politics is
leading to good or bad things. In other words, has there been some peaceful news or work or is it
still violent and negative. It can be used to predict election results as well.

8
Choosing the threshold value is an important aspect of doing this analysis. In this thesis, it was
maintained the basic numeric rule of 0 is the threshold for neutral tweets. However, there are
other aspects that help in determining the threshold value and in turn change the analysis that is
being performed.
Sentiment analysis gets more meaningful and interesting when a kind of weight is attached to
every sentence. This weight helps in categorizing sentiments in a more accurate way. The
weights chosen in this project was the Parts of speech tagging. Parts of speech denotes the
category to which a word belongs. In English language, words can be categorized into 8 sets,
namely noun, pronoun, adjective, adverb, verb, preposition, conjunction and interjection.
However, in this project NLTK is used for parts of speech tagging. The NLTK tool places words
in several categories.
PARTS OF SPEECH DESCRIPTION
CC Conjunction, joining words
ADJ Adjective to describe a noun
DT Determiner
IN Preposition
JJ Adjective, like big
JJR Adjective, comparative, like bigger
JJS Adjective, superlative, like biggest
NNS Plural noun, chocolates
NN Singular noun, chocolate
NNP Proper noun, like Donald Trump
PRP Personal pronoun, I, HE, SHE
PRP$ Possessive pronoun, his, her
UH Interjection
RB Adverb
RBR Comparative adverb
RBS Superlative adverb
VB Verb
VBD Verb, past tense
WRB Wh -adverb where, when
Table 3.1
On all the tags that are marked by the NLTK tool, there are some categories which would be
considered as the weights for sentiment analysis. The adverb, verb, adjective and noun would be
considered in this experiment and the rest will be ignored. In the categories of adverb, 3 classes
are considered.
Class 1: The RB class that defines an adverb plain. For example, if the sentence is “She is
looking good”

9
Class II: RBR this denotes a comparative degree of adverb, which means when a comparison is
done between objects then this degree is used. For example, we say “She has done better in her
test than him”. In this context it is clear that she has a better score and therefore will have a more
weight attached. This is because it will help in signifying whether an act is more positive or
negative
Class III: This is the superlative degree which denotes the highest degree for describing a verb.
For example, “Her performance was the best in the class”. This signifies a even more positive or
negative sentiment and has more weightage.
So, clearly it can be concluded that Case III has the highest weightage followed by Case II and
case I.
In case of adjectives, a similar rulebook can be set up, where JJS has the most weightage
followed by JJR and JJ
In this context, let the rest of the categories be given weightage accordingly. The existence of a
verb helps in defining a sentiment in a better way than that of a noun. Similarly, then a verb will
have more weightage than that of a noun.
So, if a weighted matrix is performed the list would go as,
Verb
Adverb
Noun
Adjective
3.4 Sentiment Analysis Classification: Techniques
In the Sentiment Analysis field, the biggest concern is to classify text into polarity according to
opinion expression. The two classes can be either positive or negative polarity. To this an
additional category can also be added, namely neutral sentiments. Sentiment Classification is
mainly divided into two different approaches: the machine learning approach and lexicon- based
approach.
The Lexicon-based approach uses a collection of positive, neutral and negative sentiment terms
and can be divided according to a predefined corpus or dictionary. The Machine Learning
approach uses classification algorithms, and Sentiment Analysis is classified similar to other text
classification. The Machine learning classifiers are divided into supervised learning and
unsupervised learning. In the next two sub-sections we will expand on these two approaches.
3.4.1Machine Learning Approach

10
The Machine Learning approach treats classification of sentiments as any other text classification
problem. Text classification is based on making decisions to classify to the correct categories.
[25]. It uses a set of training data to train a model that is used to predict new data that does not
belong to any class. Each record is labeled to a class. When a new unlabeled record is served as
an input, in this case it is a series of tweets, the model is used to predict its label class. These
classes are positive, negative or neutral, however, most of the time. The classifiers do not
categorize to neutral sentiments. In the Machine Learning Approach there are two different sub-
approaches based on the learning method used, supervised or the unsupervised learning. The
supervised learning uses a supervised classifier, which learns from training datasets and
categorizes the test data into the right label. These predefined labels help in determining the
opinion for the upcoming. The Supervised Learning algorithms are namely Decision Tree,
Linear, Rule Based and Probabilistic Classifier.
3.4.2 Lexicon-Based Approach
Lexicon-based method is another unsupervised approach, but in this case, it uses a
dictionary or corpus of words that are already classified according to sentiments. The two
approaches commonly used to categorize the sentiment of a word are the dictionary-based and
the corpus-based.
The Dictionary-Based approach has a strategy of manually collecting a small set of
opinion words and a larger set to the remaining words are added by searching similar words and
creating a WordNet. The cycle is repeated until no more words are to be found. The biggest
problem of this method is that it depends on the dictionary and user may not always have all the
words it requires present in the dictionary.
The Corpus-Based approach is done by finding the sentiments for a few words. Then expanding
the corpus by finding synonyms and antonyms and finding their polarity. This approach has a
drawback and is not as effective as the dictionary-based approach because it would need a corpus
with all the English words.
11
Chapter 4
Data
The tweets are collected over a long period of time on many topics. The tweets were collected
with the help of a cron job running on the AWS EC2 server that creates a CSV (Comma
separated value) file named on that particular date(for example 12-11-1018). We consider a
weekly time granularity because most machine learning algorithms work well on large sized
datasets, and one month is a reasonable time period to differentiate between polarity of tweets.
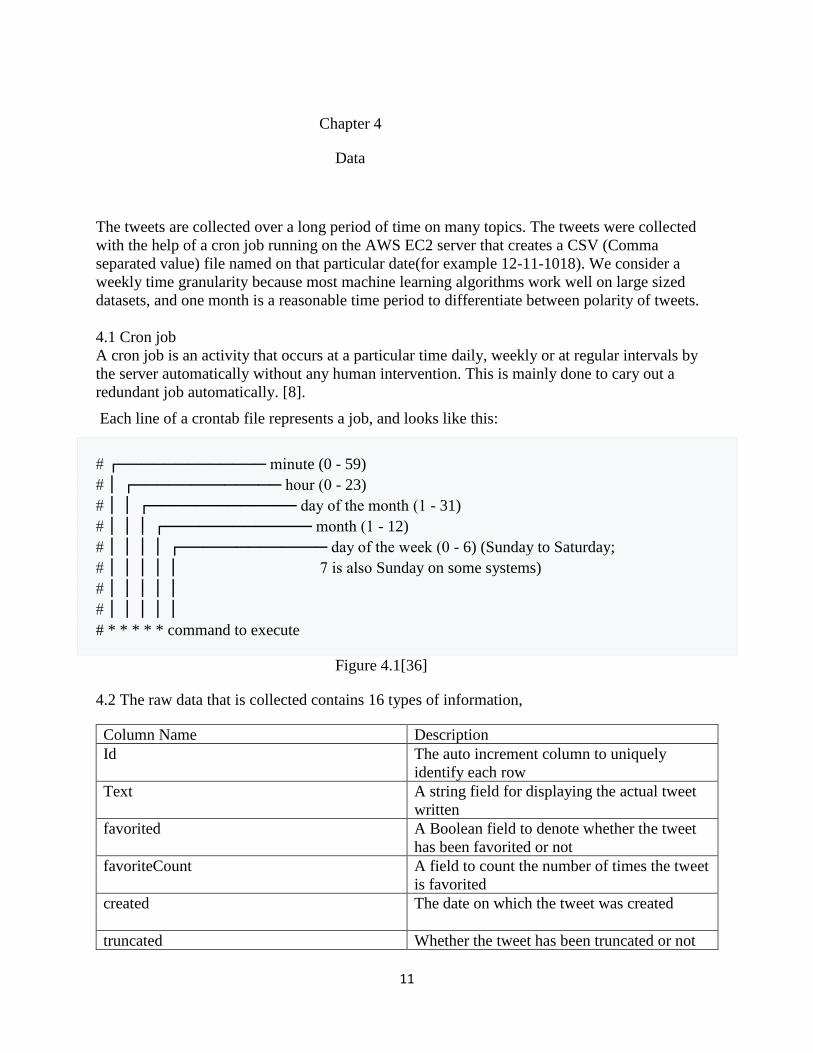
4.1 Cron job
A cron job is an activity that occurs at a particular time daily, weekly or at regular intervals by
the server automatically without any human intervention. This is mainly done to cary out a
redundant job automatically. [8].
Each line of a crontab file represents a job, and looks like this:
# ┌───────────── minute (0 - 59)
# │ ┌───────────── hour (0 - 23)
# │ │ ┌───────────── day of the month (1 - 31)
# │ │ │ ┌───────────── month (1 - 12)
# │ │ │ │ ┌───────────── day of the week (0 - 6) (Sunday to Saturday;
# │ │ │ │ │ 7 is also Sunday on some systems)
# │ │ │ │ │
# │ │ │ │ │
# * * * * * command to execute
Figure 4.1[36]
4.2 The raw data that is collected contains 16 types of information,
Column Name Description
Id The auto increment column to uniquely
identify each row
Text A string field for displaying the actual tweet
written
favorited
A Boolean field to denote whether the tweet
has been favorited or not
favoriteCount
A field to count the number of times the tweet
is favorited
created
The date on which the tweet was created
truncated Whether the tweet has been truncated or not

12
id
Id of the user who posted the tweet
statusSource
URL to the actual Twitter location of the post
screenName
The name used by user to post the tweet
retweetCount
The number of retweets posted on the original
tweet
isRetweet
Whether that particular tweet is a retweet or a
primary tweet
retweeted
A Boolean value to represent whether a tweet
is retweeted or not
longitude
The longitude of the user tweeting
latitude
The latitude of the user tweeting
Table 4.1
As is observed from the above table, there are a lot of unnecessary and redundant information.
There is a great deal of information that has to be normalized and cleaned. On extracting the
tweets, the fields latitude and longitude columns were removed, as it was not adding any
information required the kind of experiment were to be performed.
We also wanted to extract only those rows that are not retweets so that there were only unique
rows to extract as much as text possible, later used for text mining.

13
CHAPTER 5
PRELIMINARY ANALYSIS
This section is dedicated to the stepping stones of this thesis. The first part of the thesis involved
implementing a proof of concept to detect anomaly patterns in the datasets. The proof of concept
was executed locally. Some analyses were performed before the ideation of the proof of concept.
5.1 Extraction of tweets
5.1.1. Getting Twitter API keys
We need a Twitter account that would help generate some authentication keys and tokens (i.e.
API key, API secret, Access token and Access token secret) on the Twitter developer site to
access the Twitter API, following these steps:
• Logging in to https://apps.twitter.com/ with proper credentials
• All the details are filled, and we submit the form
• In the next page, click on “Keys and Access Tokens” tab, and copy “API key” and “API
secret” and further create my access token”, and copy your “Access token” and “Access
token secret”.
5.1.2. Connecting to Twitter Streaming APIs
There are 2 types of API namely Streaming API and Rest API. Everyday Twitter is responsible
for extracting around 600 tweets in a minute. However, Streaming data can only extract 1% of it.
The REST API on the other hand helps in retrieving tweets over a certain search criterion and
over a time period. Both the APIs have advantage, but for this experiment the Streaming API is
chosen as live data was the input for this experiment.
There will be 4 types of uniquely identifying tokens and keys used for OAuth authentication,
namely ACCESS_TOKEN, ACCESS_SECRET, CONSUMER_KEY, and
CONSUMER_SECRET. [9]
5.1.3 OAuth
OAuth 2.0 is an authorization mechanism to connect to Twitter from a desktop, mobile or other
interfaces..
5.1.4 Tweepy library
This provides a wrapper for the API as provided by Twitter to easily used by Python
language. The functions provided in this class are listed below.

14
Function Name Description
auth_handler This decides the type of authentication handler to be used
host The local host name
search_host The name of the host to be searched
cache The cache background to be used
api_root The general API path root
search_root The search API root
retry_count The default number of times retry attempts can be performed
retry_delay The number of seconds to be waited before retrying
retry_errors The HTTP error codes generated on retry
timeout Maximum response time
parser The object used to parse the tweet
compression Boolean value to denoted whether the expression is zipped or
not
wait_on_rate_limit Boolean value to denote whether tweepy should wait on rate
limit
wait_on_rate_limit_notify Boolean value to denote whether to wait when rate limit is
over
proxy URL of the HTTP proxy
Table 5.1
•
•
5.2 Cleaning of tweets
Cleaning of the tweets is very important to remove noise and outliers as that would greatly affect
the analysis on the data done.
5.2.1 Dataframes
The extracted tweets are first read from the csv file and then converted to dataframes using the
panda library. Dataframes are two-dimensional tabular datastructure that has to axes, i.e. rows
and columns. [11]
5.2.2 Pandas library
Pandas [12] is an open-source Python that is free. It not only stores a lo of data but also performs
many data analytics efficiently. It includes tools for efficiently reading and writing data between
in-memory data structures and different textual file formats, such as comma-separated value
files, Excel, text files and many other.
5.2.3 NLTK

15
NLTK (Natural Language Tool Kit) is a library used in Python that performs natural language
processing.It can be used for classification, tokenization, stemming, tagging, parsing, and
semantic reasoning, wrappers for industrial-strength NLP libraries. NLTK is an open-source free
library. [13]
Tokenize and tag some text:
Identify named entities:
Display a parse tree:
from nltk.corpus import treebank
t = treebank.parsed_sents('wsj_0001.mrg')[0]
t.draw()

16
Fig 5.1
5.2.4 Data clean up
Initially all the punctuation marks, hyperlink/ URL and all the text were converted to lowercase.
The stopwords from the tweets are removed
Fig 5.2 Stopword sample for tweets collected over the topic technology
Further, the data is preprocessed with the help of stemming and
lemmatization. Stemming usually refers to a process that just removes off the ends of words
without any defined rule.Often it is observed that the shorter word does not have any meaning as
per the English dictionary.Like ponies are transformed to poni, which does not exist in the
English dictionary.
Lemmatization usually refers to remove ends of words in a more systematic manner with the use
of a proper reference to a dictionary, which is referred to as a lemma. In this process, every time
lemmatization occurs, it checks whether the new formed word occurs in the lemma or not. If the
word is present in the lemma, then the chopping is done else the original word is returned.
Linguistic processing for stemming or lemmatization is often done with the help of a particular
algorithm or other external plug-ins. The algorithm used is Porter’s algorithm. Porter's algorithm

17
consists of 5 phases of word reductions, applied sequentially.
Further rules are applied like to checks the number of syllables to see whether a word is long
enough to be described as a word or not. [14]
The clean data is then transferred to a CSV file. Now the clean data is stored in a database in the
cloud, we used AWS RDS and the database instance of MySQL.
cleandata.csv
5.3 Initial Analysis
Tweets along with the fields has a lot of information embedded This could be helpful for some
initial analysis that would be useful to carry out opinion mining.

18
Fig 5.3
This image on the top denotes the interesting words that have come in the tweets extracted with
the topic of politics. It is easily understandable; the most popular topic/person is Obama. But the
question arises whether the word Obama is used to denote a negative or a positive sentiment.
Fig 5.4
This denotes the number of tweets that are extracted over a few weeks and how the number is
increased or decreased over the Weekdays.
The figure below denotes the frequency of every word used.

19
Fig 5.2

20
Chapter 6
Experiment and Analysis
On the data received, we are going to do a sentiment analysis. The objective is to class by types
the tweets. We are going to distinguish 3 kinds of tweets according to their polarity score. We
will have the positive tweets, the neutral tweets, and the negative tweets. We are going use
several different approaches to evaluate the polarity of tweets. Then we calculate certain
parameters to find the comparative report on the polarity of tweets
• First, we design a confusion matrix on the polarity of the tweets that are classified. There
are two possible predicted classes: "yes" and "no". If we were predicting the presence of
a person is pregnant or not, for example, "yes" would mean the lady is pregnant, and "no"
would mean they are not.
• The classifier made a total of 165 predictions (e.g., 165 patients were being tested for the
presence of that fetus or not).
• Out of those 165 cases, the classifier predicted "yes" 110 times, and "no" 55 times.
• In reality, 105 patients in the sample are pregnant, and 60 patients do not.
Let's now define the most basic terms, which are whole numbers (not rates):
• true positives (TP): These are cases in which we predicted yes (they are tested pregnant)
and are actually pregnant.
• true negatives (TN): We predicted no, and they are not pregnant
• false positives (FP): We predicted yes, but they don't actually are pregnant. (Also known
as a "Type I error.")
• false negatives (FN): We predicted no, but they actually are pregnant. (Also known as a
"Type II error.”) [15]
N=165 PREDICTED NO PREDICTED YES
ACTUAL NO TN=50 FP=10 60
ACTUAL YES FN=5 TP=100 105
55 110
Table 6.0
Therefore,
Accuracy=True Positive/Total positive tweets +True
Negative/Total Negative tweets

21
Precision=True Positive/True Positive +False Positive
Recall=True Positive/true Positive +False Negative
=True Positive/Total Actual Positive
6.1 Sentiment analysis using Textblob
Textblob is a Python (2 and 3) library for processing textual data. This is a simple, open source
API which is based on natural language processing to analyze sentiments. [16]
On evaluating text using textblob, two new results are obtained, i.e. polarity and subjectivity. For
sentiment analysis, the main goal would be to classify the polarity of a given text at different
levels —whether the expressed opinion in a document, a sentence or an entity feature/aspect
is positive, negative, or neutral.
Subjective sentence expresses some personal feelings, views, or beliefs. For example, the
statement “The sun rises on the east” this is a fact and hence it is an objective statement.
However if a statement is like “I think they live at Clinton Street” is a subjective statement since
this expresses someone’s belief, assumption. Subjectivity field is a float value that can take a
value ranging from 0.0 to 1.0 where 0.0 is very objective and 1.0 is very subjective. [17]
The results obtained is again saved in a CSV file
polarityonTextblob.
csv

22
Fig 6.1
The above figure shows the different functionalities with TextBlob. TextBlob is a library that
performs many natural language processing tasks quickly and with a lot more accuracy.

23
Fig 6.2
The above figure denotes a % pie chart to determine the polarity of tweets. TextBlob library is
the only tool as discussed in this thesis, categorizes neutral tweets as well. The rest all tools,
classifiers return only positive or negative polarity. Neutral sentiment is also useful in
determining certain cases, for example “the Coffee is hot”. It is difficult to denote the polarity of
this statement as some may prefer their coffee hot and some may prefer cold coffee. The third
class is necessary then this method eliminates on forcibly categorizing texts into a polarity. This
lexicon-based approach using TextBlob allows neutral category as well. Studies denote that
addition of the third class adds more accuracy to the sentiment analysis system.
6.2 Sentiment analysis using Random forest classifier.
Random forest (RF) is a mix of several decision tree classifiers and the output is based on the
result of all these classifiers. Each decision tree is constructed by using a random subset of the
training data with a fixed probability distribution. The more the number of trees are constructed,
the accuracy increases and the problem of overfitting does not exist. For the classification, a
training set is required to train the model with two labels of positive and negative tweets. Then
this prepared and learned model is used to predict the test data.

24
Fig 6.3 How the Random classifier works[35]
In this experiment, we divide the entire set into test and training data. First, the training data is
tokenized into individual words using NLTK tokenizer and then sentiment value is determined.
Based, on test data, the fit and transform function is implemented on the train data and polarity
of tweets is determined, i.e. 0 for negative tweets and 1 for positive tweets. The point to be
noted here as a drawback is that this classifier was bipolar in nature and was unable to categorize
tweets to neutral category.
6.2.1 Sklearn library
Scikit-learn (formerly scikits.learn) is a free software machine learning library for
the Python programming language. [20]
6.2.2 Count Tokenizer
Count tokenizer derived from the sklearn library uses the method of vectorization to split an
entire text to individual words and find its frequency. This is termed as bag of words. [19]
The output derived is also exported to a CSV
polarityonClassifier.
csv
25
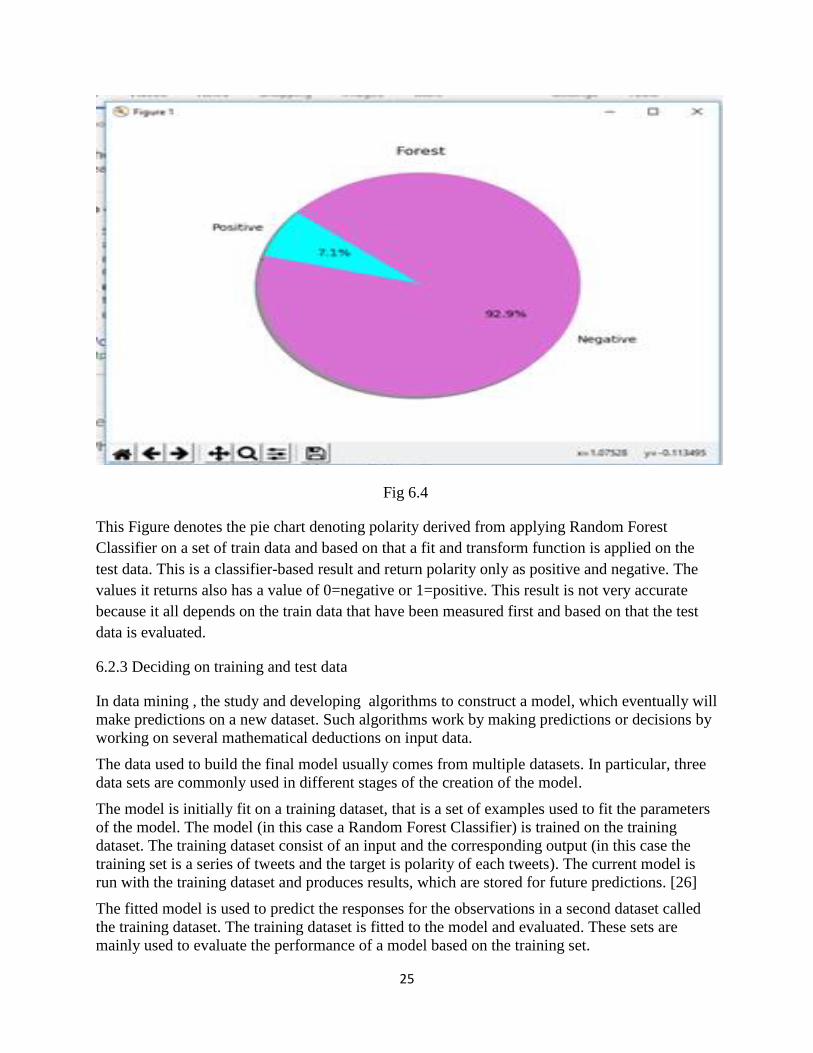
Fig 6.4
This Figure denotes the pie chart denoting polarity derived from applying Random Forest
Classifier on a set of train data and based on that a fit and transform function is applied on the
test data. This is a classifier-based result and return polarity only as positive and negative. The
values it returns also has a value of 0=negative or 1=positive. This result is not very accurate
because it all depends on the train data that have been measured first and based on that the test
data is evaluated.
6.2.3 Deciding on training and test data
In data mining , the study and developing algorithms to construct a model, which eventually will
make predictions on a new dataset. Such algorithms work by making predictions or decisions by
working on several mathematical deductions on input data.
The data used to build the final model usually comes from multiple datasets. In particular, three
data sets are commonly used in different stages of the creation of the model.
The model is initially fit on a training dataset, that is a set of examples used to fit the parameters
of the model. The model (in this case a Random Forest Classifier) is trained on the training
dataset. The training dataset consist of an input and the corresponding output (in this case the
training set is a series of tweets and the target is polarity of each tweets). The current model is
run with the training dataset and produces results, which are stored for future predictions. [26]
The fitted model is used to predict the responses for the observations in a second dataset called
the training dataset. The training dataset is fitted to the model and evaluated. These sets are
mainly used to evaluate the performance of a model based on the training set.

26
Finally, the test dataset is a dataset used to provide an unbiased evaluation of a final model fit on
the training dataset.
Fig 6.5 denotes the model constructed by both the training and the test data set.[33]
In this thesis, the Random Forest Classifier has also been performed with two sets of test and
train data. The approach used here was that the entire tweet that was extracted at runtime was
divided into a test-train ration of 60:40.
However, there are other approaches as well, one can use a separate dataset altogether that
consists of a corpus of mostly all positive and negative words. These documents can then be
compared to the current dataset and sentiment analysis can be done.
pos_tweets.txt
The above two attachments provide an example of how an example of a predefined test that that
was collected on previous tweets.
Another approach is using already analyzed scripts by other tools and libraries and then using
these as the test data to train the input tweets that are extracted.
6.3 Sentiment analysis using tool SentiStrength
SentiStrength is a useful tool to predict the sentiment for a text as well as find the strength of the
polarity of the tweets. For negative tweets the strength ranges from -1 (not negative) to -5
(extremely negative). For positive tweets strength ranges from1 (not positive) to 5 (extremely
positive)
SentiStrength analyzes text to binary polarity, to only positive and negative. This was initially
developed in English but now supports various other languages.[21]

27
We need to input a text file where each line would represent a tweet. In this text file we just used
the text field of the tweets.
Then, the tool processes the text and gives results immediately (as it has a capacity to process
16,000 texts in 1 minute). This text is very useful as it is fast and provides polarity of every word
and also gives the total negative and positive count of the tweets.
6..1 Choosing SentiStrength as the tool for analyzing sentiments in this experiment
Before using SentiStrength as a tool for using in the experiment. There were a couple of testing
done, where tweets were used as an input for various tools.
▪ Sentiment140: It was created by Alec Go, Richa Bhayani, and Lei Huang, who were
Computer Science graduate students at Stanford University. There approach is to use
machine learning based algorithms and design classifiers. Other products use a simpler
keyword-based approach which may have higher precision but lower recall. There is
greater transparency in the results that are given for every individual tweet, instead of as a
whole. However, this tool was rejected since its accuracy was very low.
▪ Chatterbox: Chatterbox's multi-lingual sentiment analysis for social media is clever,
fast, flexible & scalable. The goal of this tool is to perform sentiment analysis on textual
data that are facts derived from news websites and movie rating sites. However, this tool
does not work well with human written posts or blogs like Twitter or Facebook.
6.4 Sentiment analysis using Stanford NLP Tagger
Stanford also introduced its own version of NLP tagger. This tagger is also is responsible for
separating individual words within a text and then categorizing it to the correct parts of speech
(POS). The software is mainly a Java implementation but works with Python as a plug-in.
6.4.1 pycorenlp

28
This is a library used to import the Stanford NLP Tagger on a Python plug-in, since this tagger
was invented and written to be compatible with the programming language Java
For this, first we save the Tagger in our local machine,
wget http://nlp.stanford.edu/software/stanford-corenlp-full-2018-10-05.zip
unzip stanford-corenlp-full-2018-10-05.zip
Then the server is started
d stanford-corenlp-full-2018-10-05
java -mx5g -cp "*" edu.stanford.nlp. pipeline. StanfordCoreNLPServer -timeout 10000
Then the library pycorenlp is installed
Pip install pycorenlp
Fig 6.6 A sentiment tree as evaluated by the Stanford NLP Tagger, the root determines the
polarity in this case negative
29
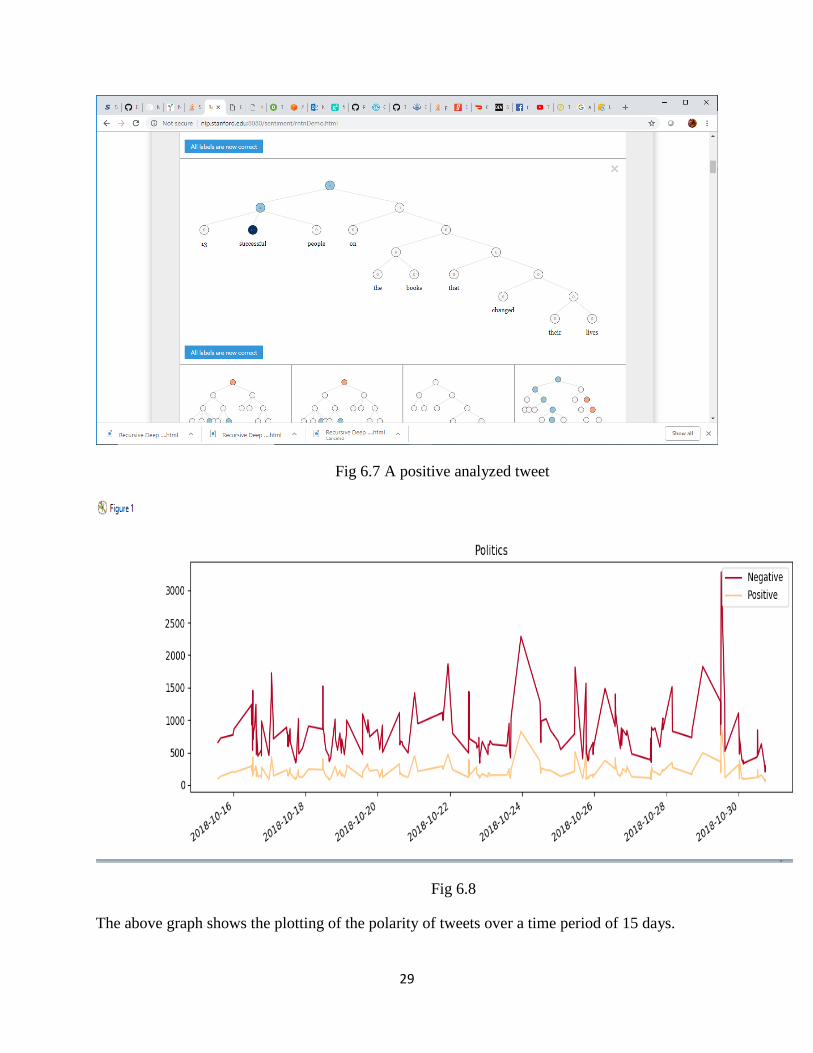
Fig 6.7 A positive analyzed tweet
Fig 6.8
The above graph shows the plotting of the polarity of tweets over a time period of 15 days.

30
6.5 Evaluation
finalEvalutionFinan
ce.xlsx
In the above figure, a comparative analysis is prepared on all the tools used for carrying out
experiment.
Column 1: denotes the results obtained by the Random Forest Classifier on the test set
Column 2: denotes the text on which polarity is calculated
Column 3: denotes the polarity results obtained by textblob library. The point to be noted is that,
all the rows with a polarity of “neutral” has been removed from evaluation, since the confusion
matrix only comprises of positive and negative polarity.
Column 4: denotes the overall positive polarity for each text based on the tool SentiStrength
Column 5: denotes the overall negative polarity for each text based on the tool SentiStrength
Column 6: denotes the evaluation done by a user by reading the text, without the use any tools
N=50 PREDICTED NO PREDICTED YES
ACTUAL NO TN=8 FP=2 10
ACTUAL YES FN=3 TP=37 40
11 39
Table 6.1
Table 6.1 denotes the evaluation of the polarity of the tweets that we have obtained with the help
of a confusion matrix. The columns to be considered from the previous Excel is Column 2 and
Column 6 to evaluate the values lie TN, FN, TP, FP
Here, TP means True positive, that means the number of positive tweets that have been evaluated
both by the user and the Textblob library
TN means True Negative, that means the number of negative tweets that have been evaluated
both by the user and the Textblob library

31
FP means False positive, that means the number of tweets that have been evaluated by Textblob
library as positive but were evaluated as Negative by user
FN means False Negative, that means the number of tweets that have been evaluated by Textblob
library as negative but were evaluated as positive by user
Now, we deduce these terms and values to find accuracy, recall and precision
Accuracy=TP/ACTUAL YES+ TN/ACTUAL NO
=37/40+8/10
=0.9
Precision=TP/TP+FP
=37/39
=0.948717
Recall=TP/TP+FN
=37/40
=0.925
N=50 PREDICTED NO PREDICTED YES
ACTUAL NO TN=8 FP=0 8
ACTUAL YES FN=32 TP=10 42
40 10
Table 6.2
Table 6.2 denotes the evaluation of the polarity of the tweets that we have obtained with the help
of a confusion matrix. The columns to be considered from the previous Excel is Column 2 and
Column 1 to evaluate the values lie TN, FN, TP, FP
Here, TP means True positive, that means the number of positive tweets that have been evaluated
both by the user and the Random forest Classifier experiment
TN means True Negative, that means the number of negative tweets that have been evaluated
both by the user and the Random forest Classifier experiment

32
FP means False positive, that means the number of tweets that have been evaluated by Random
forest Classifier experiment as positive but were evaluated as Negative by user
FN means False Negative, that means the number of tweets that have been evaluated by Random
forest Classifier experiment as negative but were evaluated as positive by user
Now, we deduce these terms and values to find accuracy, recall and precision
Accuracy=TP/ACTUAL YES+ TN/ACTUAL NO
=10/42+8/8
=0.36
Precision=TP/TP+FP
=10/10+0
=1.00
Recall=TP/TP+FN
=10/10+32
=0.42
N=50 PREDICTED NO PREDICTED YES
ACTUAL NO TN=8 FP=1 9
ACTUAL YES FN=6 TP=35 41
14 36
Table 6.3
Table 6.3 denotes the evaluation of the polarity of the tweets that we have obtained with the help
of a confusion matrix. The columns to be considered from the previous Excel is Column3,
Column 4 and Column 1 to evaluate the values lie TN, FN, TP, FP
Here, TP means True positive, that means the number of positive tweets that have been evaluated
both by the user and the SentiStrength tool
TN means True Negative, that means the number of negative tweets that have been evaluated
both by the user and the SentiStrength tool
FP means False positive, that means the number of tweets that have been evaluated by
SentiStrength tool as positive but were evaluated as Negative by user
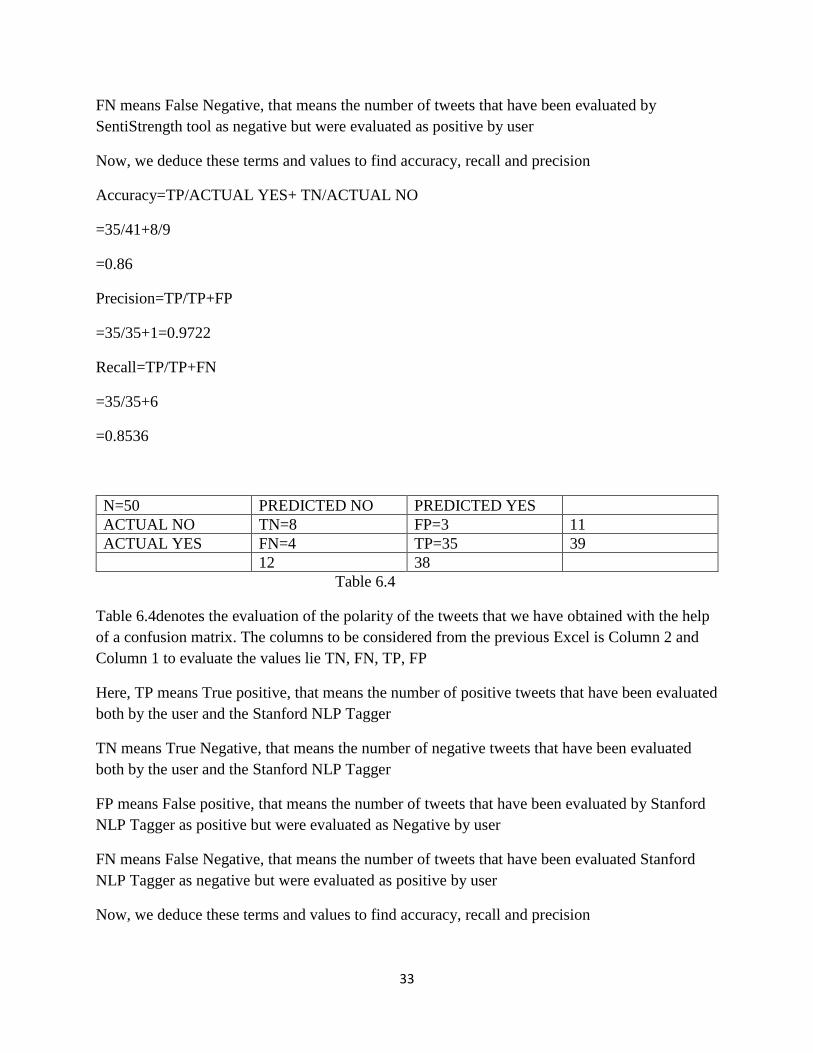
33
FN means False Negative, that means the number of tweets that have been evaluated by
SentiStrength tool as negative but were evaluated as positive by user
Now, we deduce these terms and values to find accuracy, recall and precision
Accuracy=TP/ACTUAL YES+ TN/ACTUAL NO
=35/41+8/9
=0.86
Precision=TP/TP+FP
=35/35+1=0.9722
Recall=TP/TP+FN
=35/35+6
=0.8536
N=50 PREDICTED NO PREDICTED YES
ACTUAL NO TN=8 FP=3 11
ACTUAL YES FN=4 TP=35 39
12 38
Table 6.4
Table 6.4denotes the evaluation of the polarity of the tweets that we have obtained with the help
of a confusion matrix. The columns to be considered from the previous Excel is Column 2 and
Column 1 to evaluate the values lie TN, FN, TP, FP
Here, TP means True positive, that means the number of positive tweets that have been evaluated
both by the user and the Stanford NLP Tagger
TN means True Negative, that means the number of negative tweets that have been evaluated
both by the user and the Stanford NLP Tagger
FP means False positive, that means the number of tweets that have been evaluated by Stanford
NLP Tagger as positive but were evaluated as Negative by user
FN means False Negative, that means the number of tweets that have been evaluated Stanford
NLP Tagger as negative but were evaluated as positive by user
Now, we deduce these terms and values to find accuracy, recall and precision
34
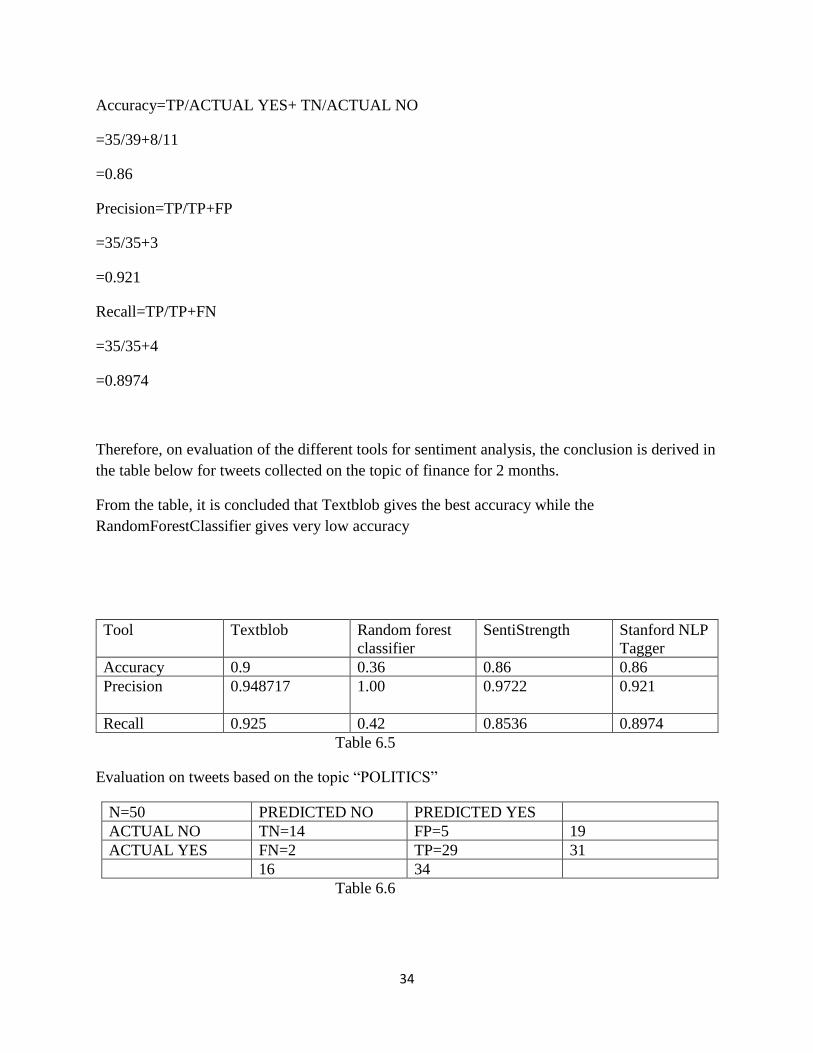
Accuracy=TP/ACTUAL YES+ TN/ACTUAL NO
=35/39+8/11
=0.86
Precision=TP/TP+FP
=35/35+3
=0.921
Recall=TP/TP+FN
=35/35+4
=0.8974
Therefore, on evaluation of the different tools for sentiment analysis, the conclusion is derived in
the table below for tweets collected on the topic of finance for 2 months.
From the table, it is concluded that Textblob gives the best accuracy while the
RandomForestClassifier gives very low accuracy
Tool Textblob Random forest
classifier
SentiStrength Stanford NLP
Tagger
Accuracy 0.9 0.36 0.86 0.86
Precision 0.948717
1.00 0.9722 0.921
Recall 0.925 0.42 0.8536 0.8974
Table 6.5
Evaluation on tweets based on the topic “POLITICS”
N=50 PREDICTED NO PREDICTED YES
ACTUAL NO TN=14 FP=5 19
ACTUAL YES FN=2 TP=29 31
16 34
Table 6.6

35
Table 6.6 denotes the evaluation of the polarity of the tweets that we have obtained with the help
of a confusion matrix. The columns to be considered from the previous Excel is Column 2 and
Column 6 to evaluate the values lie TN, FN, TP, FP
Here, TP means True positive, that means the number of positive tweets that have been evaluated
both by the user and the Textblob library
TN means True Negative, that means the number of negative tweets that have been evaluated
both by the user and the Textblob library
FP means False positive, that means the number of tweets that have been evaluated by Textblob
library as positive but were evaluated as Negative by user
FN means False Negative, that means the number of tweets that have been evaluated by Textblob
library as negative but were evaluated as positive by user
Now, we deduce these terms and values to find accuracy, recall and precision
Accuracy=TP/ACTUAL YES+ TN/ACTUAL NO
=29/31+14/19
=0.86
Precision=TP/TP+FP
=29/29+5
=0.852
Recall=TP/TP+FN
=29/29+2
=0.935
N=50 PREDICTED NO PREDICTED YES
ACTUAL NO TN=9 FP=12 21
ACTUAL YES FN=13 TP=16 29
21 28
Table 6.7

36
Table 6.7 denotes the evaluation of the polarity of the tweets that we have obtained with the help
of a confusion matrix. The columns to be considered from the previous Excel is Column 2 and
Column 1 to evaluate the values lie TN, FN, TP, FP
Here, TP means True positive, that means the number of positive tweets that have been evaluated
both by the user and the Random forest Classifier experiment
TN means True Negative, that means the number of negative tweets that have been evaluated
both by the user and the Random forest Classifier experiment
FP means False positive, that means the number of tweets that have been evaluated by Random
forest Classifier experiment as positive but were evaluated as Negative by user
FN means False Negative, that means the number of tweets that have been evaluated by Random
Forest Classifier experiment as negative but were evaluated as positive by user
Now, we deduce these terms and values to find accuracy, recall and precision
Accuracy=TP/ACTUAL YES+ TN/ACTUAL NO
=16/29+9/21
=0.5
Precision=TP/TP+FP
=16/16+12
=0.571
Recall=TP/TP+FN
=16/16+13
=0.55
N=50 PREDICTED NO PREDICTED YES
ACTUAL NO TN=7 FP=4 11
ACTUAL YES FN=13 TP=26 39
20 30
Table 6.8
Table 6.8 denotes the evaluation of the polarity of the tweets that we have obtained with the help
of a confusion matrix. The columns to be considered from the previous Excel is Column3,
Column 4 and Column 1 to evaluate the values lie TN, FN, TP, FP

37
Here, TP means True positive, that means the number of positive tweets that have been evaluated
both by the user and the SentiStrength tool
TN means True Negative, that means the number of negative tweets that have been evaluated
both by the user and the SentiStrength tool
FP means False positive, that means the number of tweets that have been evaluated by
SentiStrength tool as positive but were evaluated as Negative by user
FN means False Negative, that means the number of tweets that have been evaluated by
SentiStrength tool as negative but were evaluated as positive by user
Now, we deduce these terms and values to find accuracy, recall and precision
Accuracy=TP/ACTUAL YES+ TN/ACTUAL NO
=26/39+7/11
=0.66
Precision=TP/TP+FP
=26/26+4
=0.866
Recall=TP/TP+FN
=26/26+13
=0.666
N=50 PREDICTED NO PREDICTED YES
ACTUAL NO TN=5 FP=12 17
ACTUAL YES FN=4 TP=29 33
9 41
Table 6.9
Table 6.9denotes the evaluation of the polarity of the tweets that we have obtained with the help
of a confusion matrix. The columns to be considered from the previous Excel is Column 2 and
Column 1 to evaluate the values lie TN, FN, TP, FP
Here, TP means True positive, that means the number of positive tweets that have been evaluated
both by the user and the Stanford NLP Tagger

38
TN means True Negative, that means the number of negative tweets that have been evaluated
both by the user and the Stanford NLP Tagger
FP means False positive, that means the number of tweets that have been evaluated by Stanford
NLP Tagger as positive but were evaluated as Negative by user
FN means False Negative, that means the number of tweets that have been evaluated Stanford
NLP Tagger as negative but were evaluated as positive by user
Now, we deduce these terms and values to find accuracy, recall and precision
Accuracy=TP/ACTUAL YES+ TN/ACTUAL NO
=29/33+4/17
=0.66
Precision=TP/TP+FP
=29/29+12
=0.707
Recall=TP/TP+FN
=29/29+4
=0.87
Therefore, on evaluation of the different tools for sentiment analysis, the conclusion is derived in
the table below for tweets collected on the topic of finance for 2 months.
From the table, it is concluded that Textblob gives the best accuracy while the
RandomForestClassifier gives very low accuracy
Tool Textblob Random forest
classifier
SentiStrength Stanford NLP
Tagger
Accuracy 0.86 0.5 0.66 0.66
Precision 0.85
0.571 0.866 0.707
Recall 0.93 0.55 0.66 0.87
Table 6.10

39
Evaluation on tweets based on the topic “SPORTS”
N=50 PREDICTED NO PREDICTED YES
ACTUAL NO TN=8 FP=2 10
ACTUAL YES FN=3 TP=37 40
11 39
Table 6.11
Table 6.6 denotes the evaluation of the polarity of the tweets that we have obtained with the help
of a confusion matrix. The columns to be considered from the previous Excel is Column 2 and
Column 6 to evaluate the values lie TN, FN, TP, FP
Here, TP means True positive, that means the number of positive tweets that have been evaluated
both by the user and the Textblob library
TN means True Negative, that means the number of negative tweets that have been evaluated
both by the user and the Textblob library
FP means False positive, that means the number of tweets that have been evaluated by Textblob
library as positive but were evaluated as Negative by user
FN means False Negative, that means the number of tweets that have been evaluated by Textblob
library as negative but were evaluated as positive by user
Now, we deduce these terms and values to find accuracy, recall and precision
Accuracy=TP/ACTUAL YES+ TN/ACTUAL NO
=37/40+8/10
=0.9
Precision=TP/TP+FP
=39/41
=0.9512
Recall=TP/TP+FN
40
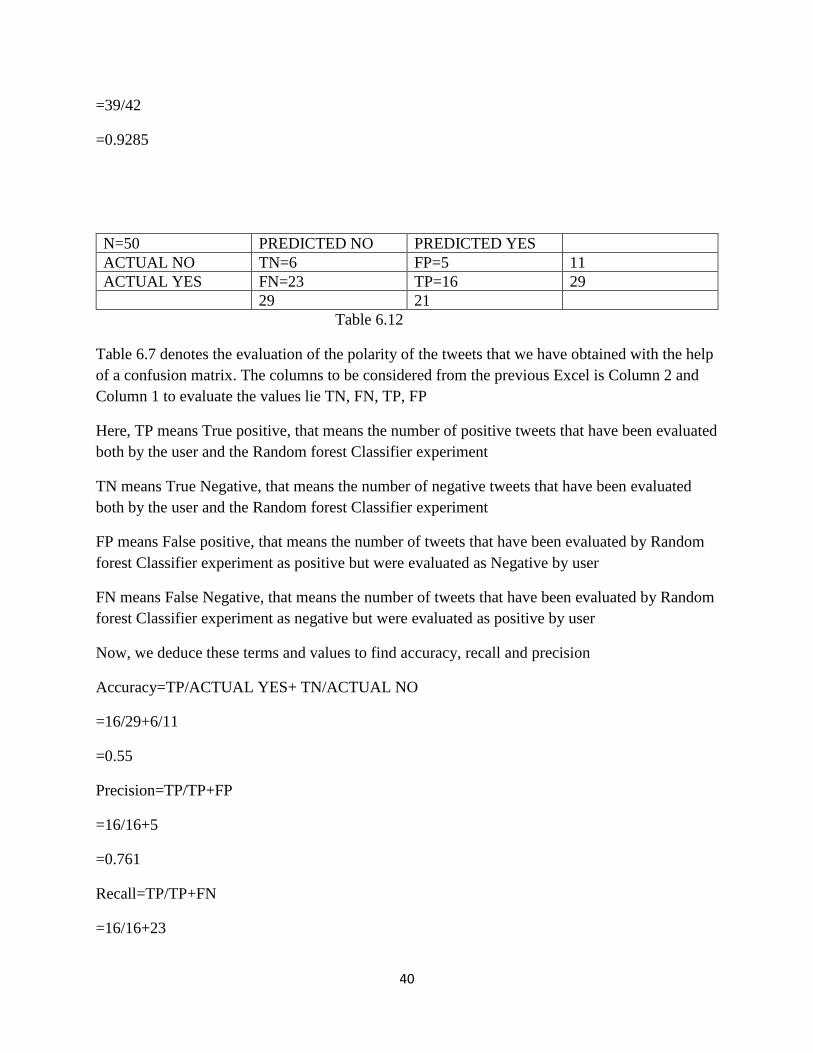
=39/42
=0.9285
N=50 PREDICTED NO PREDICTED YES
ACTUAL NO TN=6 FP=5 11
ACTUAL YES FN=23 TP=16 29
29 21
Table 6.12
Table 6.7 denotes the evaluation of the polarity of the tweets that we have obtained with the help
of a confusion matrix. The columns to be considered from the previous Excel is Column 2 and
Column 1 to evaluate the values lie TN, FN, TP, FP
Here, TP means True positive, that means the number of positive tweets that have been evaluated
both by the user and the Random forest Classifier experiment
TN means True Negative, that means the number of negative tweets that have been evaluated
both by the user and the Random forest Classifier experiment
FP means False positive, that means the number of tweets that have been evaluated by Random
forest Classifier experiment as positive but were evaluated as Negative by user
FN means False Negative, that means the number of tweets that have been evaluated by Random
forest Classifier experiment as negative but were evaluated as positive by user
Now, we deduce these terms and values to find accuracy, recall and precision
Accuracy=TP/ACTUAL YES+ TN/ACTUAL NO
=16/29+6/11
=0.55
Precision=TP/TP+FP
=16/16+5
=0.761
Recall=TP/TP+FN
=16/16+23

41
=0.410
N=50 PREDICTED NO PREDICTED YES
ACTUAL NO TN=8 FP=5 13
ACTUAL YES FN=3 TP=34 37
11 39
Table 6.13
Table 6.13 denotes the evaluation of the polarity of the tweets that we have obtained with the
help of a confusion matrix. The columns to be considered from the previous Excel is Column3,
Column 4 and Column 1 to evaluate the values lie TN, FN, TP, FP
Here, TP means True positive, that means the number of positive tweets that have been evaluated
both by the user and the SentiStrength tool
TN means True Negative, that means the number of negative tweets that have been evaluated
both by the user and the SentiStrength tool
FP means False positive, that means the number of tweets that have been evaluated by
SentiStrength tool as positive but were evaluated as Negative by user
FN means False Negative, that means the number of tweets that have been evaluated by
SentiStrength tool as negative but were evaluated as positive by user
Now, we deduce these terms and values to find accuracy, recall and precision
Accuracy=TP/ACTUAL YES+ TN/ACTUAL NO
=34/37+8/13
=0.84
Precision=TP/TP+FP
=34/34+5=0.871
Recall=TP/TP+FN
=34/34+3
=0.918
N=50 PREDICTED NO PREDICTED YES
ACTUAL NO TN=3 FP=3 6

42
ACTUAL YES FN=2 TP=42 44
5 45
Table 6.14
Table 6.14denotes the evaluation of the polarity of the tweets that we have obtained with the help
of a confusion matrix. The columns to be considered from the previous Excel is Column 2 and
Column 1 to evaluate the values lie TN, FN, TP, FP
Here, TP means True positive, that means the number of positive tweets that have been evaluated
both by the user and the Stanford NLP Tagger
TN means True Negative, that means the number of negative tweets that have been evaluated
both by the user and the Stanford NLP Tagger
FP means False positive, that means the number of tweets that have been evaluated by Stanford
NLP Tagger as positive but were evaluated as Negative by user
FN means False Negative, that means the number of tweets that have been evaluated Stanford
NLP Tagger as negative but were evaluated as positive by user
Now, we deduce these terms and values to find accuracy, recall and precision
Accuracy=TP/ACTUAL YES+ TN/ACTUAL NO
=42/44+3/6
=0.9
Precision=TP/TP+FP
=42/42+3
=0.93
Recall=TP/TP+FN
=42/42+2
=0.95
Therefore, on evaluation of the different tools for sentiment analysis, the conclusion is derived in
the table below for tweets collected on the topic of finance for 2 months.
From the table, it is concluded that Textblob and Stanford NLP Sentiment Analyzer gives the
best accuracy while the RandomForestClassifier gives very low accuracy

43
Tool Textblob Random forest
classifier
SentiStrength Stanford NLP
Tagger
Accuracy 0.9 0.55 0.84 0.9
Precision 0.951
0.76 0.871 0.93
Recall 0.928 0.41 0.918 0.95
Table 6.15
From the above results, a comparison is done on the parameters of accuracy, recall, precision on
the 4 tools used and on the 3 topics on which tweets are extracted
Tool Textblob Random forest
classifier
SentiStrength Stanford NLP
Tagger
Finance 0.9 0.36 0.86 0.86
Politics 0.86 0.5 0.66 0.66
Sports 0.9 0.55 0.84 0.9
Table 6.16 Accuracy measurement
Tool Textblob Random forest
classifier
SentiStrength Stanford NLP
Tagger
Finance 0.948 1.00 0.97 0.921
Politics 0.85 0.571 0.866 0.707
Sports 0.951 0.76 0.871 0.93
Table 6.17 Precision measurement
Tool Textblob Random forest
classifier
SentiStrength Stanford NLP
Tagger
Finance 0.925 0.42 0.853 0.8974
Politics 0.93 0.55 0.66 0.87

44
Sports 0.928 0.41 0.918 0.95
Table 6.18 Recall measurement
The above tables denote how the value of accuracy, recall and precision differ for all the tools
used on different topics.

45
Chapter 7
Cloud Implementation
The entire application uses Amazon Web Service as the cloud provider to implement the web
interface.
7.1 Amazon Web Services EC2 instance for hosting the web application
An EC2 instance is launched for the free tier Ubuntu Operating system and a new key pair is
generated
Fig 7.1
The key pair is useful for authenticated login and has to be converted into an SSL container with
an extension of. pem i.e. an entire certificate chain including public key, private key, and root
certificates
On using a Windows local host, I had to login to the ec2 instance using Putty and connected
using SSH authorization with the key pair generated.
46
Then we added the cron job as discussed in 4 in the crontab and would check regularly if a new
file was generated.
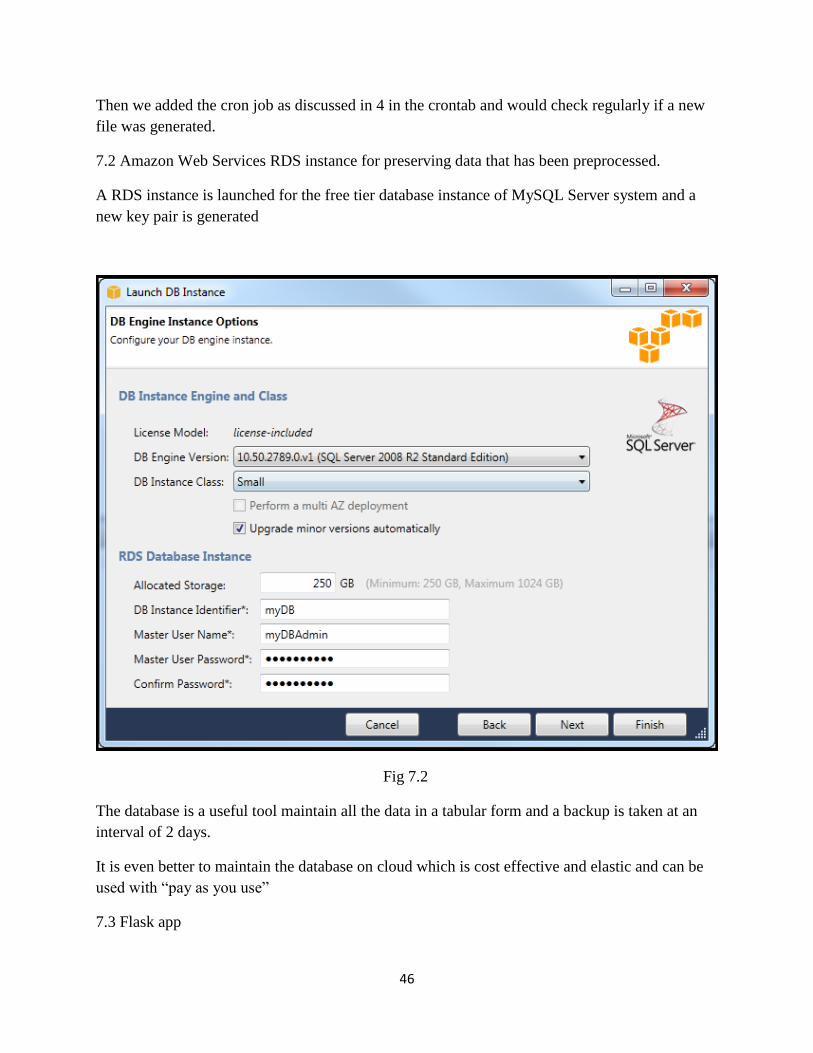
7.2 Amazon Web Services RDS instance for preserving data that has been preprocessed.
A RDS instance is launched for the free tier database instance of MySQL Server system and a
new key pair is generated
Fig 7.2
The database is a useful tool maintain all the data in a tabular form and a backup is taken at an
interval of 2 days.
It is even better to maintain the database on cloud which is cost effective and elastic and can be
used with “pay as you use”
7.3 Flask app

47
In order to python working as a backend system and able to interact with a front-end tool
like JavaScript, html, d3.js etc., a flask app is used. Flask is a web application framework
written in Python. Flask is based on Werkzeug WSGI toolkit and Jinja2 template engine.
[22].
The input html page was created
Fig 7.3
This figure provides the input page for the application where a user can select an option on the
topic on which they want tweets to be recovered. The usage of radio buttons helps to select only
one topic at a time.
On submission of the topic, tweets are extracted over a timeline. After that the data is
preprocessed using many functions. Then polarity is found based on different methods and the
final output as shown as in the figure below, shows the pie chart for every separate tool, library
or classifier used.
48
Fig 7.4
7.4 Deploying the application to AWS EC2 instance
This part was necessary to extract automatic tweets from twitter and do a live polarity
comparison analysis on the extracted tweets on various topics hosted on the cloud.
There are certain steps to follow to launch an EC2 instance in the cloud.
Step 1: Choosing of a proper Amazon Machine Image (AMI).An AMI is a template that contains
a combination of software, operating system, server and applications. In this case a free tier of
Linux was chosen

49
Fig 7.5
Step 2: The next steps are to configure the storage and tags. For this application, the default
settings are maintained.
Step 3: This is an important step to configure the security group. Security group mainly refers to
the firewall rules that are set to maintain a traffic for an instance. Generally, there is an
unrestricted access for both types SSH and HTTP
Fig 7.6
Step 4: Since a Windows machine is used for this thesis, there is a requirement of a terminal to
connect to remote SSH client. In this case Putty issued. The authorization is done through SSH
with the help of the. pem key pair that was generated in AWS while creating an instance.

50
Fig 7.7
Step 5: All the dependent libraries are installed, and program files are moved to the cloud using
the tool WinSCP. This tool is an open-source, free tool which works on FTP and SFTP protocol
to transfer files from local machine to the cloud. It is based on the SSH protocol of Putty and the
File Transfer Protocol from FileZilla.
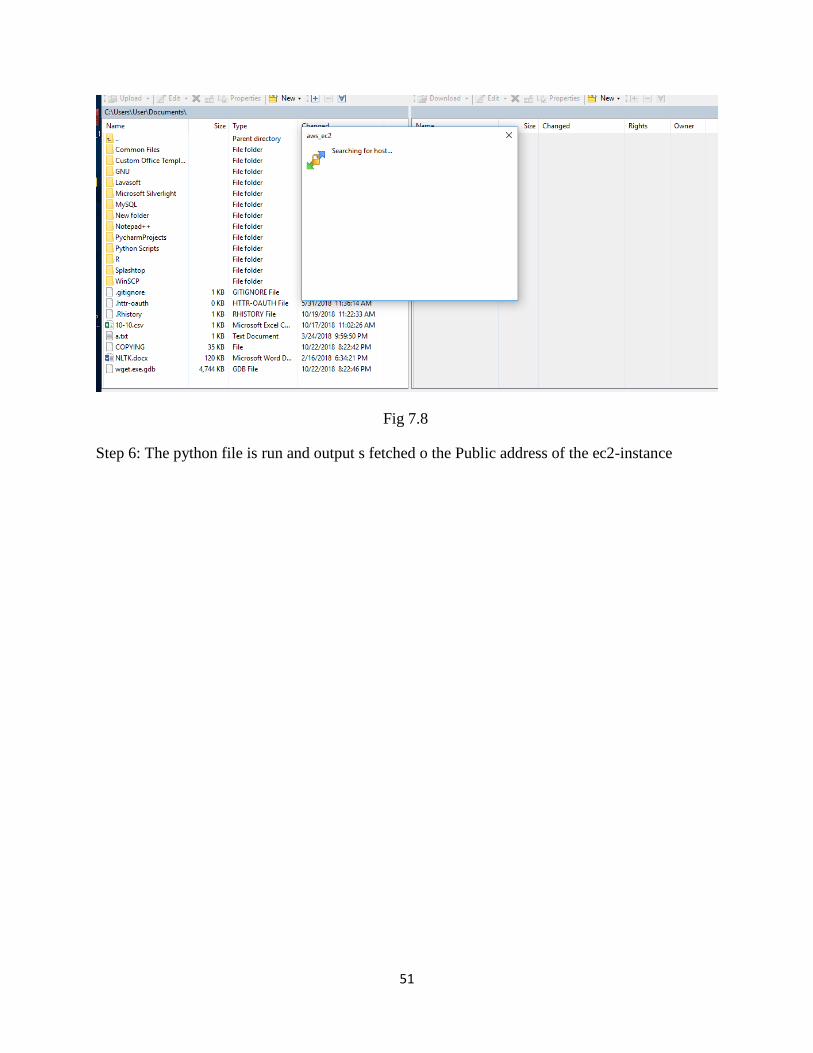
51
Fig 7.8
Step 6: The python file is run and output s fetched o the Public address of the ec2-instance

52
Chapter 8
Case Study
A case study is performed to evaluate the different tools working on different sources of text.
The first chosen was news so for this case study RSS feeds were collected from the one of the
most reliable news websites namely CNN. On a daily basis, this website posts news on various
topics and allows user to subscribe to its feeds. For this study, the news on topics of politics was
chosen. [32]
Fig 8.1
The above figure shows a sample of how the feeds are displayed on the website of CNN.
The feeds were converted into an Excel file. The CSV for is easier to read to exhibit sentiment
analysis.
rss_politics.csv
53
8.1 RSS Feed
RSS is referred to as Really Simple Syndication. This type of feed allows users and applications
to access updates of an online content in a readable format. In this experiment the feed for CNN
is used where several headlines based on a particular topic like politics, current affairs, sports or
similar topics. RSS supports several types of media like audio, video, text etc. An RSS document
also includes full or summarized text, and metadata, like publishing date and author's name.
An XML file format ensures compatibility with many different machines/programs. RSS feeds
also benefit users who want to receive timely updates from favorite websites or to aggregate data
from many sites [27].
Subscribing to RSS feeds, removes the need for a user to manually check the website for new
updates. Instead, their browser constantly monitors the site and informs the user for any updates.
This feed is particularly useful for news, sports or weather data that have frequently keep
changing.
8.2 Sentiment Analysis on RSS feeds.
The first analysis was done using the library TextBlob, which fetched the results as given below
rsspolarityonTextbl
ob.csv
The second analysis is carried out by a Random Forest Classifier, using training and test data.
rsspolarityonClassif
ier.csv
The other analysis was performed using the API SentiStrength
The other analysis was performed by Stanford NLP Sentiment Analyzer.

54
Fig 8.2
In the above figure, the analyzer shows every text in the form of binary trees and the red root
denotes negative polarity, blue=positive and white denotes neutral sentiments.
On evaluation of four approaches, a final result was prepared where an expert evaluation was a
also added, i.e. inputs by a user

55
classifier title textblob SentiStrengthStanford Expert
0 Trump, top Democrats cross country in frenetic final 48 hours before midterms0.166667 -2 0 -1
2 How Mike Lindell, the MyPillow guy, became a midterm messenger0 0 0 0
0 GA Sec. of State's office launching investigation after failed hacking attempt of voter registration system-0.3 -3 0 -1
0 Abrams: Trump is 'wrong', I am qualified to be Georgia's governor-0.5 0 -1 -1
1 The Trump factor: 2018's real test0.2 0 -1 0
1 John Legend to campaign in Ohio this Sunday0 0 -1 0
1 RNC chair on controversial Trump video: 'Good people are trying to come into the country, too'0.625 -2 0 1
1 Agriculture Sec. Sonny Perdue: Florida governor's race 'so cotton-pickin' important'0.15 0 -1 0
0 Utahns grieve for mayor killed in Afghanistan in 'apparent insider attack'-0.075 -3 0 -1
1 CNN Key Races: Six races move toward Democrats as battle for control of the House enters the home stretch0 -1 -1 1
0 Racist robocall targets Stacey Abrams, Oprah in Georgia governor's race0 -1 0 0
1 Two NY GOP incumbents taking different approach to embracing Trump0 0 -1 -1
0 How the economy is playing in five close House races0 1 -1 1
0 Trump's 2018 campaign, visualized0 0 1 0
0 Pentagon rejected request for troops it viewed as emergency law enforcement at border0 -2 1 -1
0 Michael Cohen claims Trump made repeated racist references0 -2 0 -1
1 GOP Sen. Jeff Flake: Obama's tone 'is better' than Trump's0.5 0 1 1
0 Trump video accused as racist also lacks factual basis0 -1 -1 -1
0 Messages show Roger Stone attacking the man he says was his WikiLeaks backchannel0 -2 1 -1
1 Trump raises doubts about Kavanaugh accusers after latest DOJ referral0.5 -1 -1 0
0 A ghoulish week in politics, GIF'd0 0 0 0
Table 8.1
From the above file, it shows that SentiStrength and TextBlob works similarly and is very
accurate to the expert classification. The Stanford Sentiment analyzer is the close third.
However, the classifier does not perform well since its bipolar and also depends on test data.
On conclusion, the above tools work very well with facts as in this case would be news from
CNN as RSS feeds,
8.3 Fictional text
Fiction is any story or setting that is derived from imagination. In this case study, an excerpt
from the book, The Picture of Dorian Gray by Oscar Wilde is taken as an input to conduct
sentiment analysis. [24]
fiction.csv
8.4 Sentiment analysis on fiction
The first analysis was done using the library TextBlob, which fetched the results as given below

56
fictionpolarityonTex
tblob.csv
The second analysis is carried out by a Random Forest Classifier, using training and test data.
fictionClassifier.csv
The other analysis was performed using the API SentiStrength
text SentiStrengthtexblob classifier expert
The studio was filled with the rich odor of roses, and when the light summer wind stirred amidst the trees of the garden there came through the open door the heavy scent of the lilac, or the more delicate perfume of the pink-flowering thorn.-4 0.167857 0 0
From the corner of the divan of Persian saddle-bags on which he was lying, smoking, as usual, innumerable cigarettes, Lord Henry Wotton could just catch the gleam of the honey-sweet and honey-colored blossoms of the laburnum, whose tremulous branches seemed hardly able to bear the burden of a beauty so flame-like as theirs; and now and then the fantastic shadows of birds in flight flitted across the long tussore-silk curtains that were stretched in front of the huge window, producing a kind of momentary Japanese effect, and making him think of those pallid jade-faced painters who, in an art that is necessarily immobile, seek to convey the sense of swiftness and motion.-3 0.172222 1 0
The sullen murmur of the bees shouldering their way through the long unmown grass, or circling with monotonous insistence round the black-crocketed spires of the early June hollyhocks, seemed to make the stillness more oppressive, and the dim roar of London was like the bourdon note of a distant organ.2 0.058333 1 0
In the centre of the room, clamped to an upright easel, stood the full-length portrait of a young man of extraordinary personal beauty, and in front of it, some little distance away, was sitting the artist himself, Basil Hallward, whose sudden disappearance some years ago caused, at the time, such public excitement, and gave rise to so many strange conjectures.0 0.072917 0 0
As he looked at the gracious and comely form he had so skilfully mirrored in his art, a smile of pleasure passed across his face, and seemed about to linger there. But he suddenly started up, and, closing [4] his eyes, placed his fingers upon the lids, as though he sought to imprison within his brain some curious dream from which he feared he might awake.0 0.066667 0 0
"It is your best work, Basil, the best thing you have ever done," said Lord Henry, languidly. "You must certainly send it next year to the Grosvenor. The Academy is too large and too vulgar. The Grosvenor is the only place."1 0.246939 1 0
"I don't think I will send it anywhere," he answered, tossing his head back in that odd way that used to make his friends laugh at him at Oxford. "No: I won't send it anywhere."1 0.044444 1 0
Table 8.2
From the above file, it shows that SentiStrength and TextBlob works similarly and is very
accurate to the expert classification. However, the classifier does perform well since its bipolar
and also depends on test data. The problem is since these are fictional statements, its difficult for
the expert to assign any polarity to them, hence all of them are treated as neutral polarity.
On conclusion, the above tools work not well with fiction as in this case would be parts of a story
by Oscar Wilde.
8.5 Use of spacy for Natural language processing
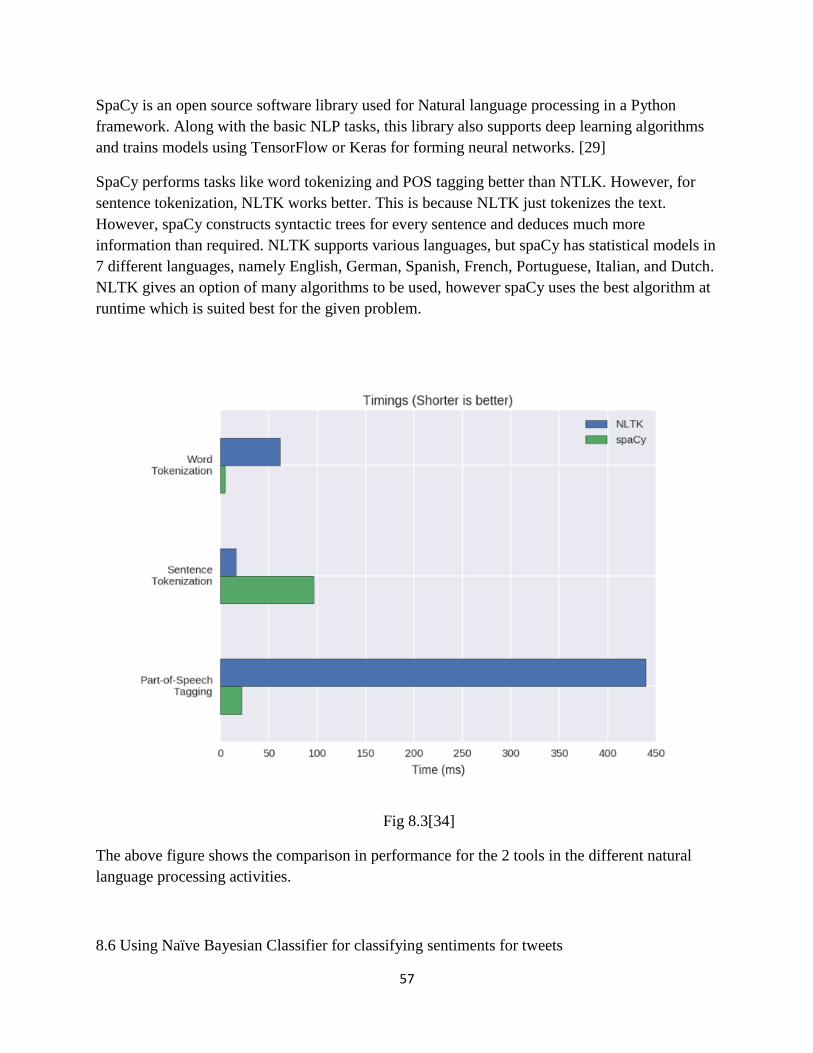
57
SpaCy is an open source software library used for Natural language processing in a Python
framework. Along with the basic NLP tasks, this library also supports deep learning algorithms
and trains models using TensorFlow or Keras for forming neural networks. [29]
SpaCy performs tasks like word tokenizing and POS tagging better than NTLK. However, for
sentence tokenization, NLTK works better. This is because NLTK just tokenizes the text.
However, spaCy constructs syntactic trees for every sentence and deduces much more
information than required. NLTK supports various languages, but spaCy has statistical models in
7 different languages, namely English, German, Spanish, French, Portuguese, Italian, and Dutch.
NLTK gives an option of many algorithms to be used, however spaCy uses the best algorithm at
runtime which is suited best for the given problem.
Fig 8.3[34]
The above figure shows the comparison in performance for the 2 tools in the different natural
language processing activities.
8.6 Using Naïve Bayesian Classifier for classifying sentiments for tweets

58
The classifier is based on the Bayesian theorem for conditional probability. The theorem is based
on the formula,
P(A/B) =P(A) P(B/A) P(B) [25]
Which tells us: how often A happens given that B happens, written P(A|B),
When we know: how often B happens given that A happens, written P(B|A)
and how likely A is on its own, written P(A)
and how likely B is on its own, written P(B)
For example, let us say P(Rain) means how often there is rain, and P(Cloudy) means how often
we see cloudy days, then:
P(Rain|Cloud) means how often there is rain when we can see clouds
P (Cloud | Rain) means how often we can it be cloudy as well as rain
So, this can be used in the form of Bayesian Theorem,
P (Rain| Cloud) = P(Rain) P(Cloud) P(Cloud/Rain)
The Naïve Bayesian classifier is an extension of the Bayesian classifier that is responsible for
creating a model using some test data and based on which the model can correctly classify any
train data to the correct sentiment. This classifier uses the concept of creating word bags from the
test data and training the model. On input of new data to the model, the model searches for
similar words which has already been classified and evaluates the test data. This classifier is
known as Naïve because it assumes the features to be unconditionally independent of each other.
For this experiment, data is divided into test and train data. Train data is a comma separated file
that comprises of tweets that are collected over a large amount of time whose sentiment is
already determined
The sentences in the test dataset is tokenized into a bag of words and an NLTK Naïve Bayesian
classifier is applied on the data. Then every data is classified according to sentiment and saved to
a CSV file.
The output is given as
NBeval.csv

59
The values are divided in sentiments of either 0 or 1 where 0 determines the negative polarity
and 1 is labelled as positive.
Fig 8.4
The above figure denotes a pie chart to find the percentage on negative and positive sentiments
from the total number of tweets that are present in the test dataset.
On evaluation of the results it is found that the Naïve Bayesian Classifier gives a better accuracy
than other classifier results. This is solely because the training set in this case is a separate
document that already had previously grouped data. Much different from the kind of results
deduced by the experiment with another type of classifier namely, Random forest Classifier. In
the second type, a single data set was divided into test and training data and fit and transform
functionalities were used on these.
So, we can conclude Naïve Bayesian proved to be accurate only by 1-2% which can be treated as
negligible. This also depends on the nature of selection of choosing the training and test data as
discussed above. Another factor which is greatly determining is the length of the datasets, the
more the data is, it will fetch better results. Since a wider variety of data means a wider variety of
words added to the corpus and hence fetches better results through classification.

60
8.7 Sentiment analysis on Customer reviews
Today products need, and choices are changing very fast. Customers have preferences that are
easy to change. Product based companies need to stay at par with these needs and choices.
Companies also need to compete with their rival companies that build similar products. For
example, in the field of technology laptops and phones are never constant. Reviews from
customers on websites or feedback from customers via customer support calls are important for
companies to understand the growing needs of customers. Sentiment of the reviews and calls
also help in determining whether products are liked by customers or there have to be made any
changes. In this experiment, Amazon.com was chosen to extract customer reviews.[30]
Fig 8.5
8.7.1 Web Scrapping and sentiment analysis
This is the process of extraction of data from a website and saved to a user-friendly format like
saving to a file in a location or converting to json or dataframes that can be used for further
analysis. Websites generally provide a lot of information that are ideal only to be viewed in the
web browser. The only way to access it is to copy and paste it manually. This is a very tedious
task and is not efficient at all. In such cases, web scrapping is used. This can be done by using
many software or using libraries and accessing the reviews. this experiment, two Python libraries
are used. Urllib is used to extract and access the data from the websites and BeautifulSoup is
used to extract the data and convert them into JSON files.

61
Fig 8.6[31]
amazonReviews.txt
The above attachment shows the extracted reviews from the Amazon website for the particular
product
Column1 polarity subjectivity
Ordered new unused "2018 Newest Acer 14-inch HD Chromebook" 6/23/18. Upon arrival noted manufacture date to be 7/29/2016. 23 MONTHS PRIOR.While this may not be outright fraud or false advertising according to some, it certainly seems misleading and disingenuous. Makes one wonder about the laptop and components 2 year storage environment conditions. Surely nothing that would effect product performance and life. You decide.BUYER BEWARE0.112662 0.628716
NOT a 2018 Chromebook as stated in the title. I was expecting a Chromebook manufactured in late 2017 or 2018. This particular Chromebook was manufactured in August of 2016. Very misleading title......definitely not the "2018 Newest". The Chromebook does seem to be pretty decent though.0.096667 0.58
nice 0.6 1
Like: weighs about 2.5lbs, easy to carry in backpack without need of additional case/sleeve, runs cool, long battery, matte screen so no reflections of people in lecture hall/class0.244444 0.627778
What I use laptop for: primarily taking pictures of my textbooks and notes. Most of what i do are on the web so this laptop fits my current needs.0.3 0.466667
Chrome OS: it took the laptop about 30mins to update but it updated to the current Chrome OS 69.0.3497.95. I did not encounter any issues with web store apps as stated by others.0 0.4
CPU: the cpu is faster than Celeron N3350 which are found on current chromebooks in this price range.0 0.4
Dislike: 1366x768 screen resolution & non back-lit keyboard. Since im reading my textbooks so it is okay. This laptop not for entertainment.0.5 0.5
Overall: the laptop looks great, feels sturdy. I'm happy with my purchase.0.533333 0.583333
i like its great thank you0.8 0.75
What a great value. I do all the basics plus some. Google has it down! Thanks0.268519 0.412963
Table 8.3
AmazonReviewsAna
lysis.xlsm

62
Chapter 9
Summary and Conclusion
This research started with a goal to classify tweets according to polarity. Identifying
polarity on tweets is analogous to finding a needle in a haystack. Challenges involved in
collecting effective data and preprocessing them so that all the text could be used. A proper
method was used to extract tweets was used with the help of a cron job that ran on a daily basis
and collected tweets over a time period of 2 months. Then the data was preprocessed using many
methods to make the data devoid of noise and outliers. The clean data was then further
preprocessed to avoid any piece of any information to be removed that was not helping in the
text analysis. Amazon Web service framework was used, EC2 to host the application. This
framework is also cost-effective and elastic to the needs of analysis. All these are achieved by
leveraging the benefits of cloud computing.
Experiments and analyses were conducted on real datasets to find the polarity of the tweets. The
different parameters chosen to measure the polarity were, TextBlob that was a library derived
from Natural Language Processing. The Random Forest Classifier was used to divide the entire
data set to train and test data. The third way used was using a very popular tool called
SentiStrength to evaluate the polarity. Various patterns were discovered and
described in the experiment These patterns aided in understanding and comparing the accuracy
of every method used. The case studies demonstrated the identification of performance evaluated
from different tools and how efficient they were to determine the polarity of tweets.
Opinion mining on tweets will continue to be an important area of research
with the growing market on machine learning and Social media. This thesis presented a
comparative analysis on sentiment analysis in a cloud based, scalable, and cost-effective data
mining framework.

63
Chapter 10
Challenges faced on carrying the experiment
On carrying out the experiment there were many barriers met and a lot of challenges that had to
be overcome.
The tone of the tweets
If two statements are considered[28]
The dress is nice
The dress is pink in color.
Most people would say that sentiment is positive for the first one and neutral for the second one,
right? All predicates (adjectives, verbs, and some nouns) should not be treated the same with
respect to how they create sentiment. In the examples above, nice is more subjective than pink.
This means nice will have more weight than pink, however both are simple adjectives
Context and Polarity
All the tweets and statements that are generated on the basis of a context. It is uttered by
someone at a particular time and space. But Twitter being a microblogging site allows only 140
characters to be written at a time. So, the context seems to be lost in some way. For example,
I support this motion.
I am not interested!
These two statements seem like an answer to a question .So the problem here is what is the
question, for the first one can answer to the question Did you like the topic of the debate or one
can ask did you dislike the topic .To both the above questions , the answers are valid .But the
tone and opinion of the statement completely changes to a negative or positive respectively.
Irony and Sarcasm
Differences between literal and intended meaning, irony and the deeper degree of irony which is
known as sarcasm usually changes positive sentiment into negative whereas negative or neutral
sentiment might be changed to positive. However, detecting irony or sarcasm takes a lot of extra
steps of analysis and cannot be done easily. In this experiment, this has been a drawback of not
able to analyze sarcasm and irony especially in texts/tweets dealing with politics
For example, look at some possible answers to the question Have you had a nice customer
experience with us? below.
Yes. Sure.
Assigning sentiments to any of the above statements is difficult. It sounds that an attached
positive tweet is added but one can be sarcastic.

64
Comparisons
How to treat comparisons in sentiment analysis is another challenge worth tackling. Look at the
texts below:
This book is second to none.
This is better than old choices.
This is better than nothing.
There are some comparisons like the first one above that do not need any contextual clues in
order to be classified correctly.
The second and third texts are a little more difficult to classify, though seeing the word better one
would immediately associate to a positive sentiment. But the question here is for the second
statement, the choices that are referred to can be good or bad choices. These both statements will
again create a problem to carry out a correct analysis
Emojis
There are two types of emojis according to Guibon et al.. Western emojis (e.g. :D) are encoded in
only one character or in a combination of a couple of them whereas Eastern emojis (e.g. ¯ \ _ (ツ) _ / ¯) are a longer combination of characters of a vertical nature. Particularly in tweets, emojis
play a role in the sentiment of texts.
The first step of preprocessing is to remove unnecessary punctuation marks that may be difficult
to analyze a given text.
Defining Neutral
Categorizing statements to neutral sentiment is another challenge to tackle in order to perform
accurate sentiment analysis. There are many statements that is best categorized as neutral,
however some classifiers do not allow texts to be classified as a neutral category. This leads to
many texts being wrongly classified.

65
Chapter 11
Future Work
In the future, experiments with other machine learning algorithms apart from Random Forest
Classifier will be a good space to explore. With the dataset given we can now run
many compute-intensive machine learning algorithms such as hierarchical clustering
on the cloud. By combining the results of current experiment with the analyses by
applying different algorithms that work well with our datasets will bring to light
compelling results. These results might lead us to new dimensions or ways to detect polarity in a
more efficient way.
Secondly, need to move forward from only text analysis to evaluate sentiments. For example,
usage of smileys and other emoticons can play an important role to define the polarity of a tweet.
After all, all the emoticons are denoting some kind of mood. Voice and tone analysis can be
another way of identifying the polarity of a statement. Face recognition and identification of
various facial expressions can also denote the sentiment of a speech and further helps in
analyzing.
Thirdly, one extremely interesting part of sentiment analysis of tweets or speech which deal with
sarcasm. Especially in dealing with tweets with politics, there have been several instances where
one was sarcastically being positive or negative. In future, if there is a tool designed to detect the
sarcasm and take that as a parameter to continue opinion mining would be great.

66
References
[1] https://en.wikipedia.org/wiki/Twitter
[2] file:///C:/Users/User/Downloads/9783540343509-c1.pdf
[3] http://www2.cs.uregina.ca/~dbd/cs831/notes/kdd/1_kdd.html
[4] https://en.wikipedia.org/wiki/Sentiment_analysis
[5] https://www.sas.com/en_us/insights/analytics/what-is-natural-language-processing-nlp.html
[6] https://aws.amazon.com/ec2/
[7] https://aws.amazon.com/rds/
[8] https://en.wikipedia.org/wiki/Cron
[9] http://socialmedia-class.org/twittertutorial.html
[10] https://tweepy.readthedocs.io/en/v3.5.0/api.html#tweepy-api-twitter-api-wrapper
[11] http://pandas.pydata.org/pandas-docs/version/0.23.4/generated/pandas.DataFrame.html
[12]https://brage.bibsys.no/xmlui/bitstream/handle/11250/2353488/13240_FULLTEXT.pdf?seq
uence=1&isAllowed=y
[13] Bird, Steven, Edward Loper and Ewan Klein (2009), Natural Language Processing with
Python. O’Reilly Media Inc.
[14] https://nlp.stanford.edu/IR-book/html/htmledition/stemming-and-lemmatization-1.html
[15] https://www.dataschool.io/simple-guide-to-confusion-matrix-terminology/
[16] https://pypi.org/project/textblob/
[17] https://www.quora.com/What-is-the-difference-between-Polarity-and-Subjectivity
[18]https://www.sciencedirect.com/science/article/pii/S1877050918301625
[19] http://scikit-learn.org/stable/modules/feature_extraction.html
[20] https://en.wikipedia.org/wiki/Scikit-learn
67
[21] http://sentistrength.wlv.ac.uk/
[22] https://www.tutorialspoint.com/flask/index.htm
[23] http://werkzeug.pocoo.org/
[24] https://www.gutenberg.org/files/4078/4078-h/4078-h.html
[25] https://www.mathsisfun.com/data/bayes-theorem.html
[26] https://en.wikipedia.org/wiki/Training,_validation,_and_test_sets
[27] http://www.cnn.com/services/rss/
[28] https://monkeylearn.com/sentiment-analysis/
[29] https://spacy.io/
[30]https://www.amazon.com/dp/B07DNMHBRC/ref=sspa_dk_detail_2?psc=1&pd_rd_i=B07D
NMHBRC&pd_rd_wg=70Lx2&pd_rd_r=30WME7MF7PT99664YZC9&pd_rd_w=Vf2js&smid
=A12LTVP7KBAA4
[31] https://www.google.com/imgres?imgurl=https%3A%2F%2Fcdn-images-
1.medium.com%2Fmax%2F1200%2F1*kfOsUxggG5wDbDcxgC0Uwg.png&imgrefurl=https%
3A%2F%2Fhackernoon.com%2Fmicroservice-series-scraper-
ee970df3e81f&docid=95BY_wsW3Hp5AM&tbnid=5yNUtsmHaKgTuM%3A&vet=10ahUKEw
iXq-6-0dneAhVNb60KHU-
0ANQQMwg_KAIwAg..i&w=658&h=224&bih=695&biw=1366&q=web%20scraping&ved=0a
hUKEwiXq-6-0dneAhVNb60KHU-0ANQQMwg_KAIwAg&iact=mrc&uact
[32] http://rss.cnn.com/rss/cnn_allpolitics.rss
[33] https://en.wikipedia.org/wiki/Training,_validation,_and_test_sets
[34]https://blog.thedataincubator.com/2016/04/nltk-vs-spacy-natural-language-processing-in-
python/
[35] http://dataaspirant.com/2017/05/22/random-forest-algorithm-machine-learing/
[36] https://www.ostechnix.com/a-beginners-guide-to-cron-jobs/
[37] https://towardsdatascience.com/data-mining-in-brief-26483437f178

68

69
Biographical Information
Srijanee Niyogi joined the University of Texas at Arlington in fall 2016. She
received her B. Tech in Computer Science from West Bengal University of
Technology, Kolkata in 2012.
She worked as a Software Developer for Tech Mahindra. Ltd in India for 3 years. In
United States she interned with Ayoka Systems as a web developer Intern and is currently
working with Deloitte USA as a Solution Specialist.
Her research interests are in areas of machine learning, Cloud Computing and
software development.