Embed Size (px)
Citation preview
8/7/2019 Thayer Vietnam's Defence Budget
http://slidepdf.com/reader/full/thayer-vietnams-defence-budget 1/16
Background Briefing:
Vietnam’s Defence Budget
Carlyle A. Thayer
April 23, 2011
Introduction
This Briefing Paper provides background for a discussion of media reporting in 2011
that Vietnam had embarked on a significant increase in defence spending. This
Briefing Paper takes issue with these assertions. It notes, in particular, that firmer
judgments cannot be made until the standard open sources on Vietnam’s defence
spending provide estimates for 2010, a necessary benchmark for determining
current trends.
Reliable figures on Vietnam’s defence budget are difficult to obtain.1 In 2004,
Vietnam released its second Defence White Paper and revealed for the first time
that it officially spent 2.5 percent of its Gross Domestic Product (GDP) on defense.
No further details were released.2
In 2009, in a further step towards transparency, Vietnam’s third Defence White
Paper also set forth for the first time official figures for defence spending for 2005‐
2008 (see Table 1).3 Vietnam did not provide a detailed breakdown how these
figures were calculated. As will be noted below, estimates provided by Western
defence specialists are much higher. It is widely assumed that Vietnam does not
include complete data on weapons and equipment procurements (some of it is by
barter trade), research and development costs, defence industrial investment,
pensions for retired military and defence civilians, paramilitary forces and extra‐
budgetary sources from military‐run enterprises.
1 For a discussion see: Carlyle A. Thayer, Vietnam People’s Army: Development and Modernization,
Armed Forces Lecture Paper Series Paper No. 4 (Bandar Seri Begawan: Sultan Haji Hassanal Bolkiah
Institute of Defence and Strategic Studies, 2009), pp. 9‐10 and 29‐30. Available at Scribd.com. 2 Socialist Republic of Vietnam, Vietnam’s National Defense in the Early Years of the 21
st Century
(Hanoi: Ministry of National Defense, 2004). The World Bank estimated Vietnam’s 2004 GDP at U.S.
$45.4 billion. This would have meant a defence budget of U.S. $1.135 billion. 3 Vietnam’s 2009 Defence White Paper was released publicly despite one assertion to the contrary;
see: Jon Grevatt, ‘Vietnam outlines 2011 strategy,’ Jane’s Defence Weekly , December 30, 2010,
electronic edition.
Thayer ConsultancyABN # 65 648 097 123
8/7/2019 Thayer Vietnam's Defence Budget
http://slidepdf.com/reader/full/thayer-vietnams-defence-budget 2/16
2
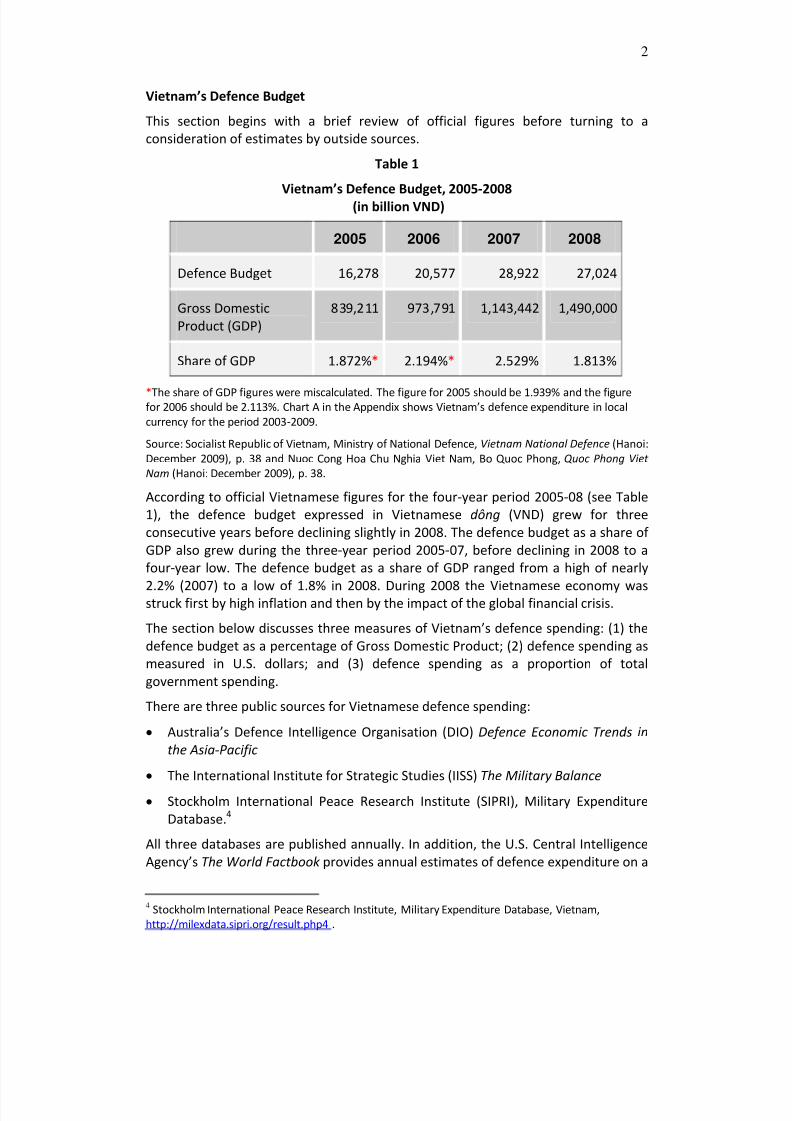
Vietnam’s Defence Budget
This section begins with a brief review of official figures before turning to a
consideration of estimates by outside sources.
Table 1
Vietnam’s Defence Budget, 2005‐2008
(in billion VND)
2005 2006 2007 2008
Defence Budget 16,278 20,577 28,922 27,024
Gross Domestic
Product (GDP)
839,211 973,791 1,143,442 1,490,000
Share of GDP 1.872%* 2.194%* 2.529% 1.813%
*The share of GDP figures were miscalculated. The figure for 2005 should be 1.939% and the figure
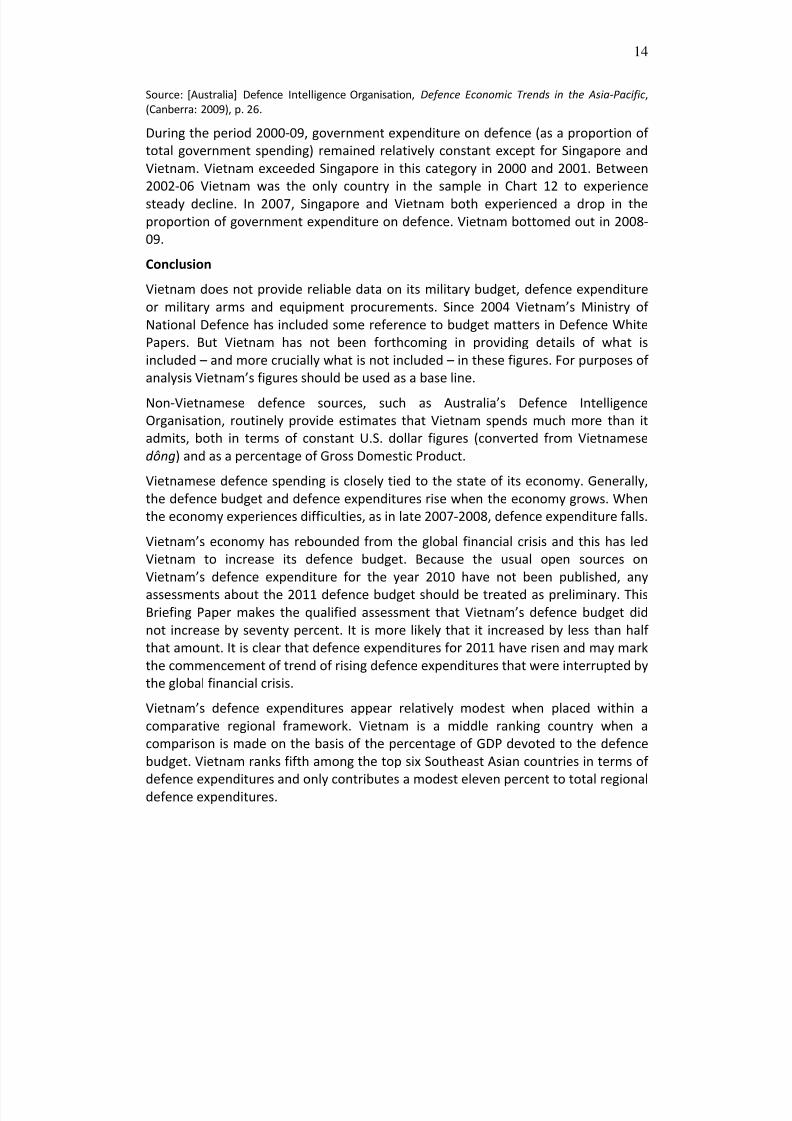
for 2006 should be 2.113%. Chart A in the Appendix shows Vietnam’s defence expenditure in local
currency for the period 2003‐2009.
Source: Socialist Republic of Vietnam, Ministry of National Defence, Vietnam National Defence (Hanoi:
December 2009), p. 38 and Nuoc Cong Hoa Chu Nghia Viet Nam, Bo Quoc Phong, Quoc Phong Viet
Nam (Hanoi: December 2009), p. 38.
According to official Vietnamese figures for the four‐year period 2005‐08 (see Table
1), the defence budget expressed in Vietnamese dông (VND) grew for three
consecutive years before declining slightly in 2008. The defence budget as a share of
GDP also grew during the three‐year period 2005‐07, before declining in 2008 to a
four‐year low. The defence budget as a share of GDP ranged from a high of nearly
2.2% (2007) to a low of 1.8% in 2008. During 2008 the Vietnamese economy was
struck first by high inflation and then by the impact of the global financial crisis.
The section below discusses three measures of Vietnam’s defence spending: (1) the
defence budget as a percentage of Gross Domestic Product; (2) defence spending as
measured in U.S. dollars; and (3) defence spending as a proportion of total
government spending.
There are three public sources for Vietnamese defence spending:
• Australia’s Defence Intelligence Organisation (DIO) Defence Economic Trends in
the Asia‐Pacific
• The International Institute for Strategic Studies (IISS) The Military Balance
• Stockholm International Peace Research Institute (SIPRI), Military Expenditure
Database.4
All three databases are published annually. In addition, the U.S. Central Intelligence
Agency’s The World Factbook provides annual estimates of defence expenditure on a
4 Stockholm International Peace Research Institute, Military Expenditure Database, Vietnam,
http://milexdata.sipri.org/result.php4 .
8/7/2019 Thayer Vietnam's Defence Budget
http://slidepdf.com/reader/full/thayer-vietnams-defence-budget 3/16
3
year by year basis and not as a time series. Estimates of Vietnam’s defence budget
may also be found in Jane’s country profile for Vietnam.
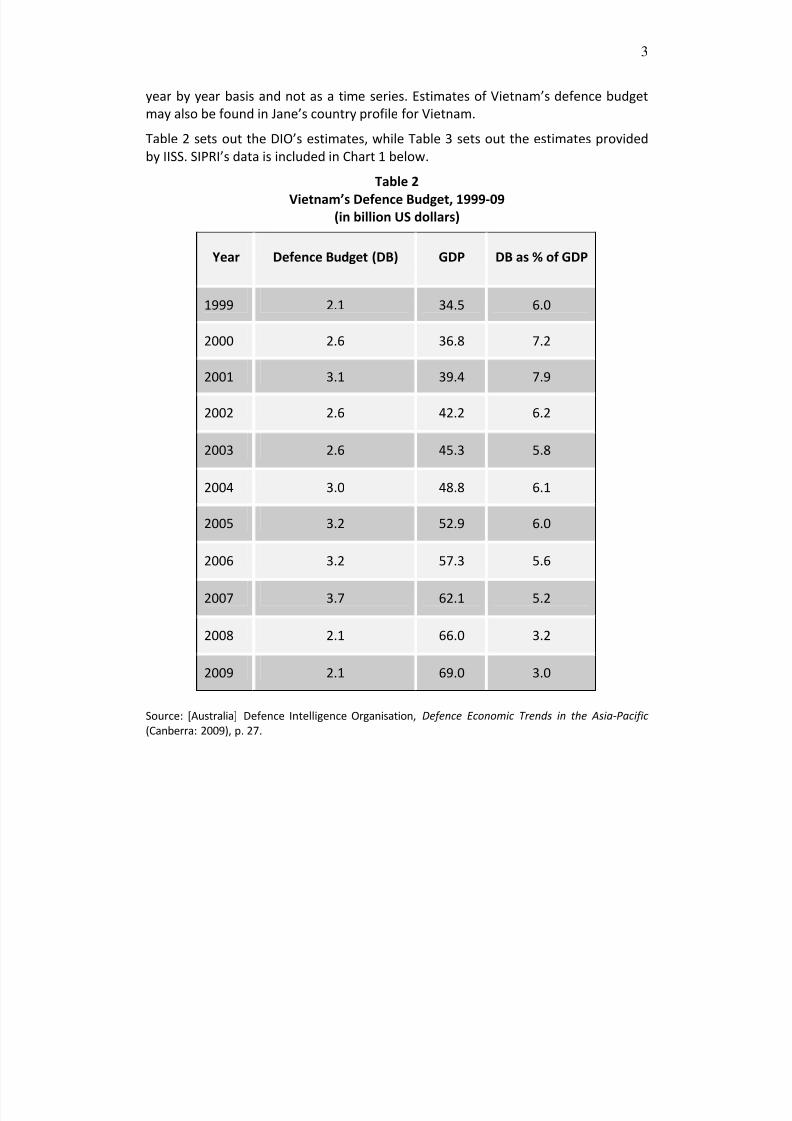
Table 2 sets out the DIO’s estimates, while Table 3 sets out the estimates provided
by IISS. SIPRI’s data is included in Chart 1 below.
Table 2
Vietnam’s Defence Budget, 1999‐09
(in billion US dollars)
Year Defence Budget (DB) GDP DB as % of GDP
1999 2.1 34.5 6.0
2000 2.6 36.8 7.2
2001 3.1 39.4 7.9
2002 2.6 42.2 6.2
2003 2.6 45.3 5.8
2004 3.0 48.8 6.1
2005 3.2 52.9 6.0
2006 3.2 57.3 5.6
2007 3.7 62.1 5.2
2008 2.1 66.0 3.2
2009 2.1 69.0 3.0
Source: [Australia] Defence Intelligence Organisation, Defence Economic Trends in the Asia‐Pacific
(Canberra: 2009), p. 27.
8/7/2019 Thayer Vietnam's Defence Budget
http://slidepdf.com/reader/full/thayer-vietnams-defence-budget 4/16
4
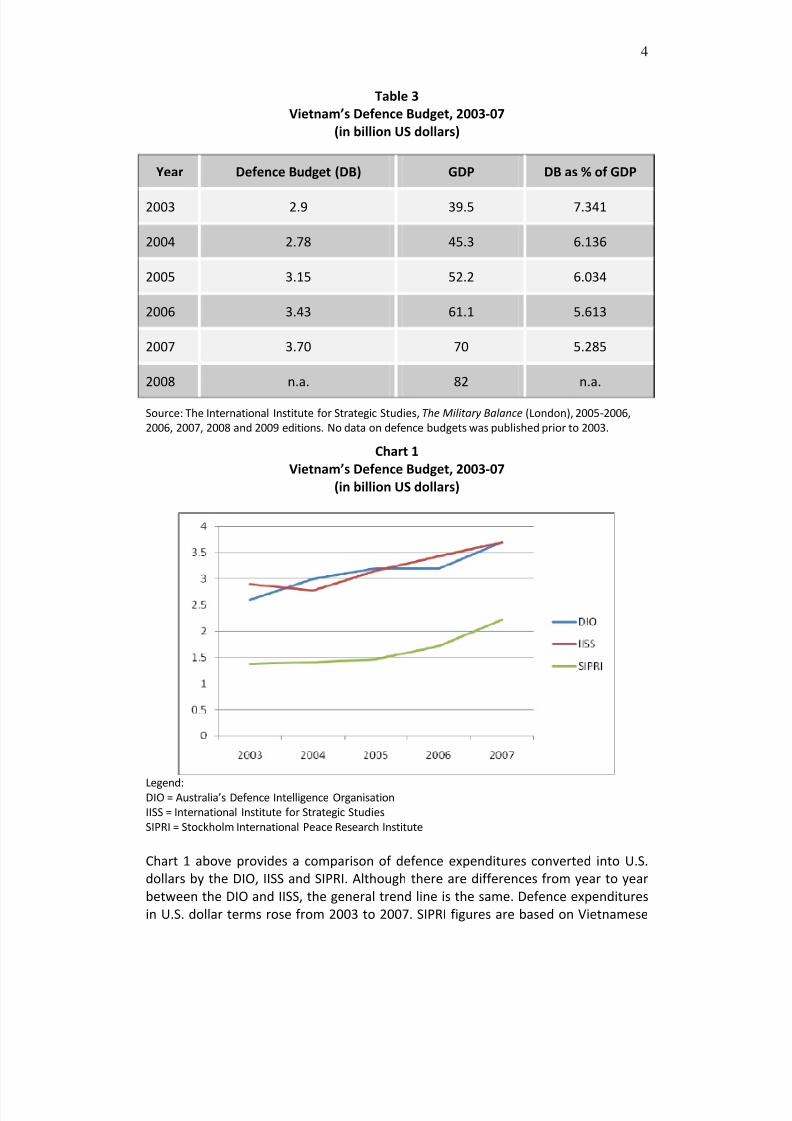
Table 3
Vietnam’s Defence Budget, 2003‐07
(in billion US dollars)
Year Defence Budget (DB) GDP DB as % of GDP
2003 2.9 39.5 7.341
2004 2.78 45.3 6.136
2005 3.15 52.2 6.034
2006 3.43 61.1 5.613
2007 3.70 70 5.285
2008 n.a. 82 n.a.
Source: The International Institute for Strategic Studies, The Military Balance (London), 2005‐2006,
2006, 2007, 2008 and 2009 editions. No data on defence budgets was published prior to 2003.
Chart 1
Vietnam’s Defence Budget, 2003‐07
(in billion US dollars)
Legend: DIO = Australia’s Defence Intelligence Organisation
IISS = International Institute for Strategic Studies
SIPRI = Stockholm International Peace Research Institute
Chart 1 above provides a comparison of defence expenditures converted into U.S.
dollars by the DIO, IISS and SIPRI. Although there are differences from year to year
between the DIO and IISS, the general trend line is the same. Defence expenditures
in U.S. dollar terms rose from 2003 to 2007. SIPRI figures are based on Vietnamese
8/7/2019 Thayer Vietnam's Defence Budget
http://slidepdf.com/reader/full/thayer-vietnams-defence-budget 5/16
5
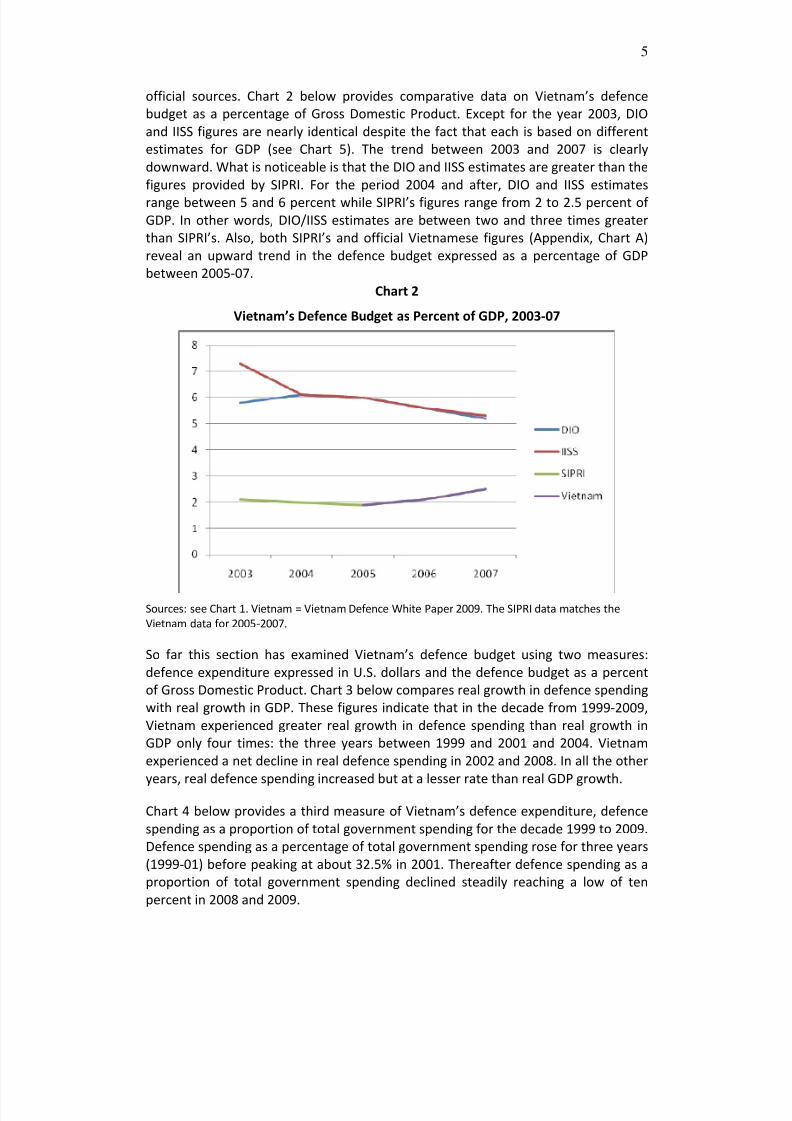
official sources. Chart 2 below provides comparative data on Vietnam’s defence
budget as a percentage of Gross Domestic Product. Except for the year 2003, DIO
and IISS figures are nearly identical despite the fact that each is based on different
estimates for GDP (see Chart 5). The trend between 2003 and 2007 is clearly
downward. What is noticeable is that the DIO and IISS estimates are greater than the
figures provided by SIPRI. For the period 2004 and after, DIO and IISS estimates
range between 5 and 6 percent while SIPRI’s figures range from 2 to 2.5 percent of
GDP. In other words, DIO/IISS estimates are between two and three times greater
than SIPRI’s. Also, both SIPRI’s and official Vietnamese figures (Appendix, Chart A)
reveal an upward trend in the defence budget expressed as a percentage of GDP
between 2005‐07.
Chart 2
Vietnam’s Defence Budget as Percent of GDP, 2003‐07
Sources: see Chart 1. Vietnam = Vietnam Defence White Paper 2009. The SIPRI data matches the
Vietnam data for 2005‐2007.
So far this section has examined Vietnam’s defence budget using two measures:
defence expenditure expressed in U.S. dollars and the defence budget as a percent
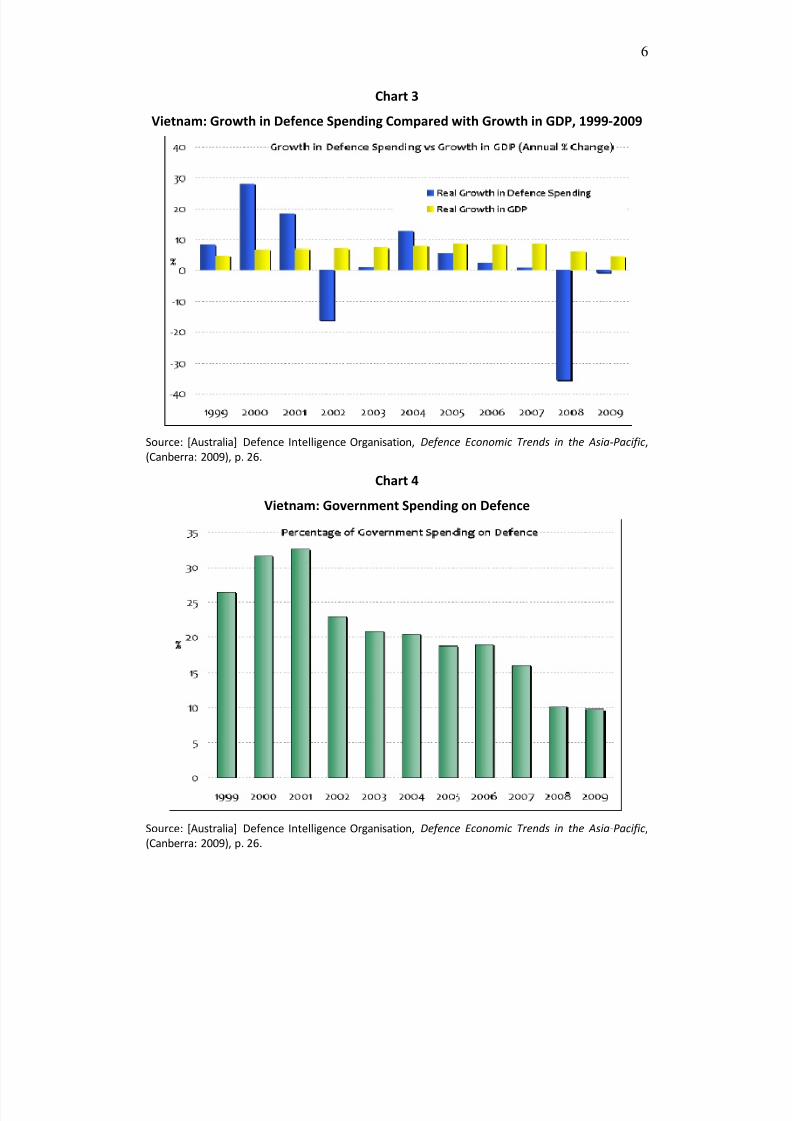
of Gross Domestic Product. Chart 3 below compares real growth in defence spending
with real growth in GDP. These figures indicate that in the decade from 1999‐2009,
Vietnam experienced greater real growth in defence spending than real growth in
GDP only four times: the three years between 1999 and 2001 and 2004. Vietnam
experienced a net decline in real defence spending in 2002 and 2008. In all the other
years, real defence spending increased but at a lesser rate than real GDP growth.
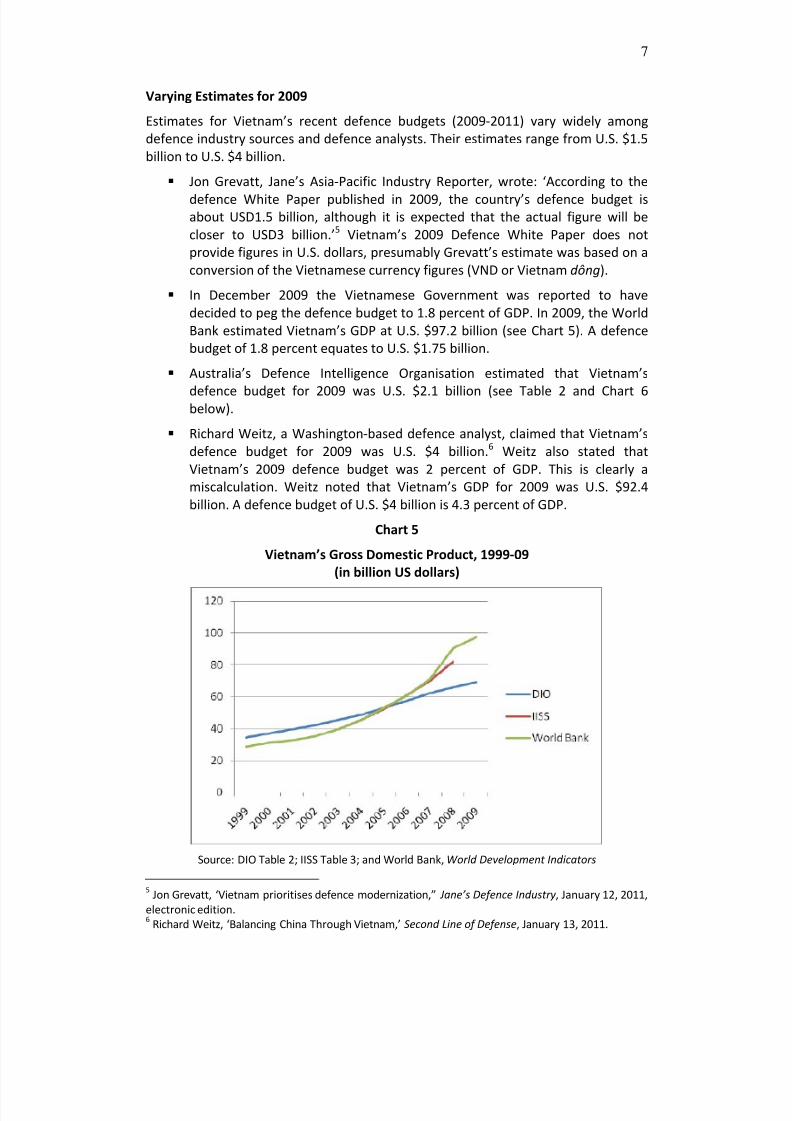
Chart 4 below provides a third measure of Vietnam’s defence expenditure, defence
spending as a proportion of total government spending for the decade 1999 to 2009.
Defence spending as a percentage of total government spending rose for three years
(1999‐01) before peaking at about 32.5% in 2001. Thereafter defence spending as a
proportion of total government spending declined steadily reaching a low of ten
percent in 2008 and 2009.
8/7/2019 Thayer Vietnam's Defence Budget
http://slidepdf.com/reader/full/thayer-vietnams-defence-budget 6/16
6
Chart 3
Vietnam: Growth in Defence Spending Compared with Growth in GDP, 1999‐2009
Source: [Australia] Defence Intelligence Organisation, Defence Economic Trends in the Asia‐Pacific,
(Canberra: 2009), p. 26.
Chart 4
Vietnam: Government Spending on Defence
Source: [Australia] Defence Intelligence Organisation, Defence Economic Trends in the Asia‐Pacific,
(Canberra: 2009), p. 26.
8/7/2019 Thayer Vietnam's Defence Budget
http://slidepdf.com/reader/full/thayer-vietnams-defence-budget 7/16
7
Varying Estimates for 2009
Estimates for Vietnam’s recent defence budgets (2009‐2011) vary widely among
defence industry sources and defence analysts. Their estimates range from U.S. $1.5
billion to U.S. $4 billion.
Jon Grevatt, Jane’s Asia‐Pacific Industry Reporter, wrote: ‘According to the
defence White Paper published in 2009, the country’s defence budget is
about USD1.5 billion, although it is expected that the actual figure will be
closer to USD3 billion.’5 Vietnam’s 2009 Defence White Paper does not
provide figures in U.S. dollars, presumably Grevatt’s estimate was based on a
conversion of the Vietnamese currency figures (VND or Vietnam dông).
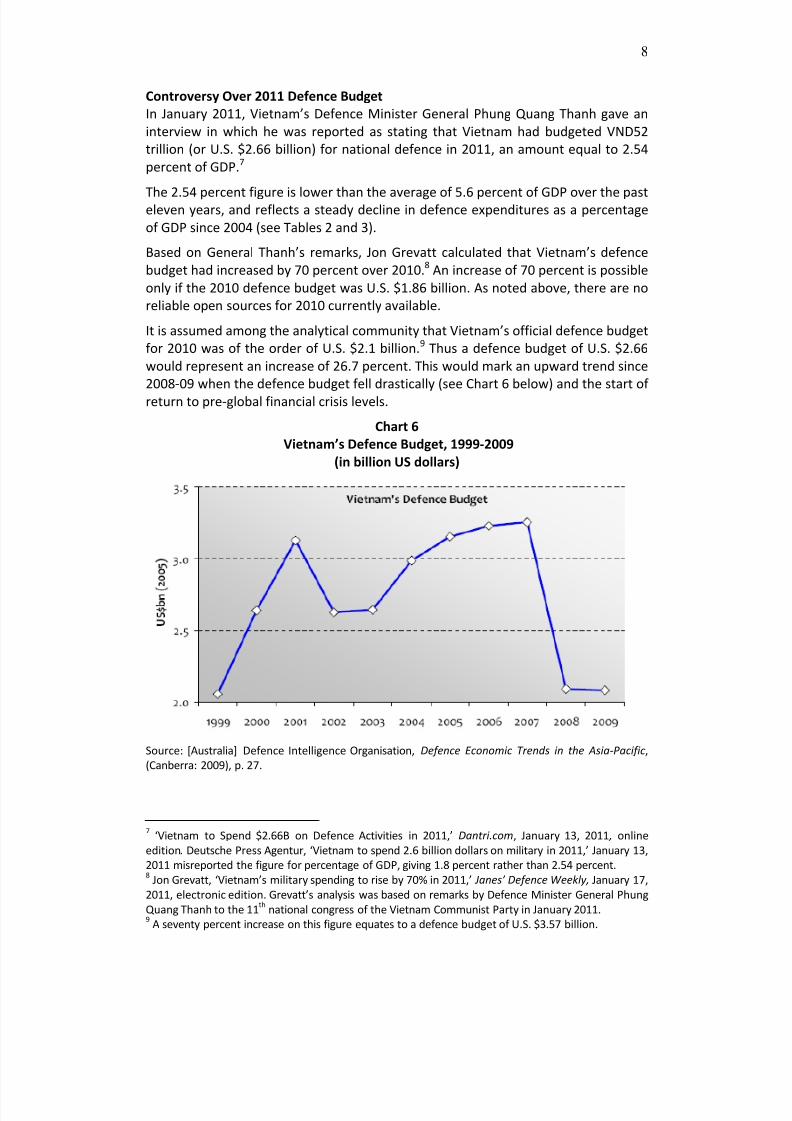
In December 2009 the Vietnamese Government was reported to have
decided to peg the defence budget to 1.8 percent of GDP. In 2009, the World
Bank estimated Vietnam’s GDP at U.S. $97.2 billion (see Chart 5). A defence
budget of 1.8 percent equates to U.S. $1.75 billion.
Australia’s Defence Intelligence Organisation estimated that Vietnam’s
defence budget for 2009 was U.S. $2.1 billion (see Table 2 and Chart 6
below).
Richard Weitz, a Washington‐based defence analyst, claimed that Vietnam’s
defence budget for 2009 was U.S. $4 billion.6 Weitz also stated that
Vietnam’s 2009 defence budget was 2 percent of GDP. This is clearly a
miscalculation. Weitz noted that Vietnam’s GDP for 2009 was U.S. $92.4
billion. A defence budget of U.S. $4 billion is 4.3 percent of GDP.
Chart 5
Vietnam’s Gross Domestic Product, 1999‐09
(in billion US dollars)
Source: DIO Table 2; IISS Table 3; and World Bank, World Development Indicators
5 Jon Grevatt, ‘Vietnam prioritises defence modernization,” Jane’s Defence Industry , January 12, 2011,
electronic edition. 6 Richard Weitz, ‘Balancing China Through Vietnam,’ Second Line of Defense, January 13, 2011.
8/7/2019 Thayer Vietnam's Defence Budget
http://slidepdf.com/reader/full/thayer-vietnams-defence-budget 8/16
8
Controversy Over 2011 Defence Budget
In January 2011, Vietnam’s Defence Minister General Phung Quang Thanh gave an
interview in which he was reported as stating that Vietnam had budgeted VND52
trillion (or U.S. $2.66 billion) for national defence in 2011, an amount equal to 2.54
percent of GDP.7
The 2.54 percent figure is lower than the average of 5.6 percent of GDP over the past eleven years, and reflects a steady decline in defence expenditures as a percentage
of GDP since 2004 (see Tables 2 and 3).
Based on General Thanh’s remarks, Jon Grevatt calculated that Vietnam’s defence
budget had increased by 70 percent over 2010.8 An increase of 70 percent is possible
only if the 2010 defence budget was U.S. $1.86 billion. As noted above, there are no
reliable open sources for 2010 currently available.
It is assumed among the analytical community that Vietnam’s official defence budget
for 2010 was of the order of U.S. $2.1 billion.9 Thus a defence budget of U.S. $2.66
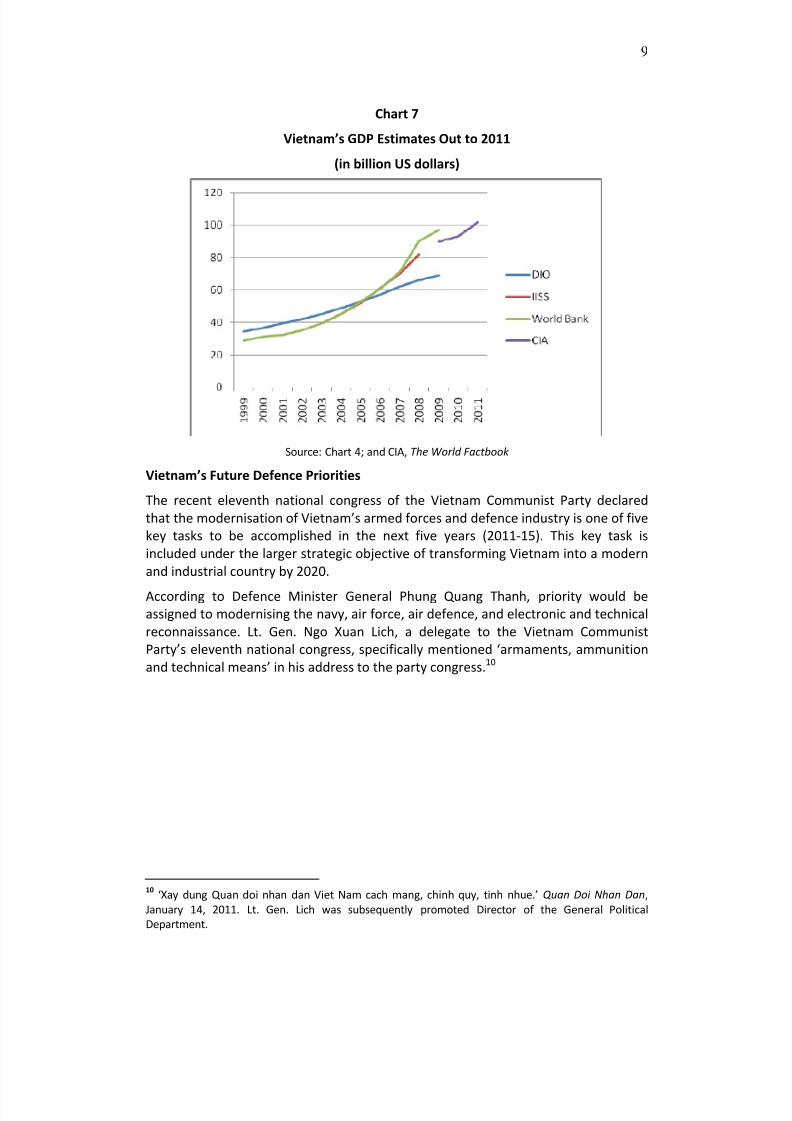
would represent an increase of 26.7 percent. This would mark an upward trend since
2008‐09 when the defence budget fell drastically (see Chart 6 below) and the start of
return to pre‐global financial crisis levels.
Chart 6
Vietnam’s Defence Budget, 1999‐2009
(in billion US dollars)
Source: [Australia] Defence Intelligence Organisation, Defence Economic Trends in the Asia‐Pacific,
(Canberra: 2009), p. 27.
7 ‘Vietnam to Spend $2.66B on Defence Activities in 2011,’ Dantri.com, January 13, 2011 , online
edition. Deutsche Press Agentur, ‘Vietnam to spend 2.6 billion dollars on military in 2011,’ January 13,
2011 misreported the figure for percentage of GDP, giving 1.8 percent rather than 2.54 percent. 8 Jon Grevatt, ‘Vietnam’s military spending to rise by 70% in 2011,’ Janes’ Defence Weekly, January 17,
2011, electronic edition. Grevatt’s analysis was based on remarks by Defence Minister General Phung
Quang Thanh to the 11th
national congress of the Vietnam Communist Party in January 2011. 9 A seventy percent increase on this figure equates to a defence budget of U.S. $3.57 billion.
8/7/2019 Thayer Vietnam's Defence Budget
http://slidepdf.com/reader/full/thayer-vietnams-defence-budget 9/16
9
Chart 7
Vietnam’s GDP Estimates Out to 2011
(in billion US dollars)
Source: Chart 4; and CIA, The World Factbook
Vietnam’s Future Defence Priorities
The recent eleventh national congress of the Vietnam Communist Party declared
that the modernisation of Vietnam’s armed forces and defence industry is one of five
key tasks to be accomplished in the next five years (2011‐15). This key task is
included under the larger strategic objective of transforming Vietnam into a modern
and industrial country by 2020.
According to Defence Minister General Phung Quang Thanh, priority would be
assigned to modernising the navy, air force, air defence, and electronic and technical
reconnaissance. Lt. Gen. Ngo Xuan Lich, a delegate to the Vietnam Communist
Party’s eleventh national congress, specifically mentioned ‘armaments, ammunition
and technical means’ in his address to the party congress.10
10 ‘Xay dung Quan doi nhan dan Viet Nam cach mang, chinh quy, tinh nhue.’ Quan Doi Nhan Dan,
January 14, 2011. Lt. Gen. Lich was subsequently promoted Director of the General Political
Department.
8/7/2019 Thayer Vietnam's Defence Budget
http://slidepdf.com/reader/full/thayer-vietnams-defence-budget 10/16
10
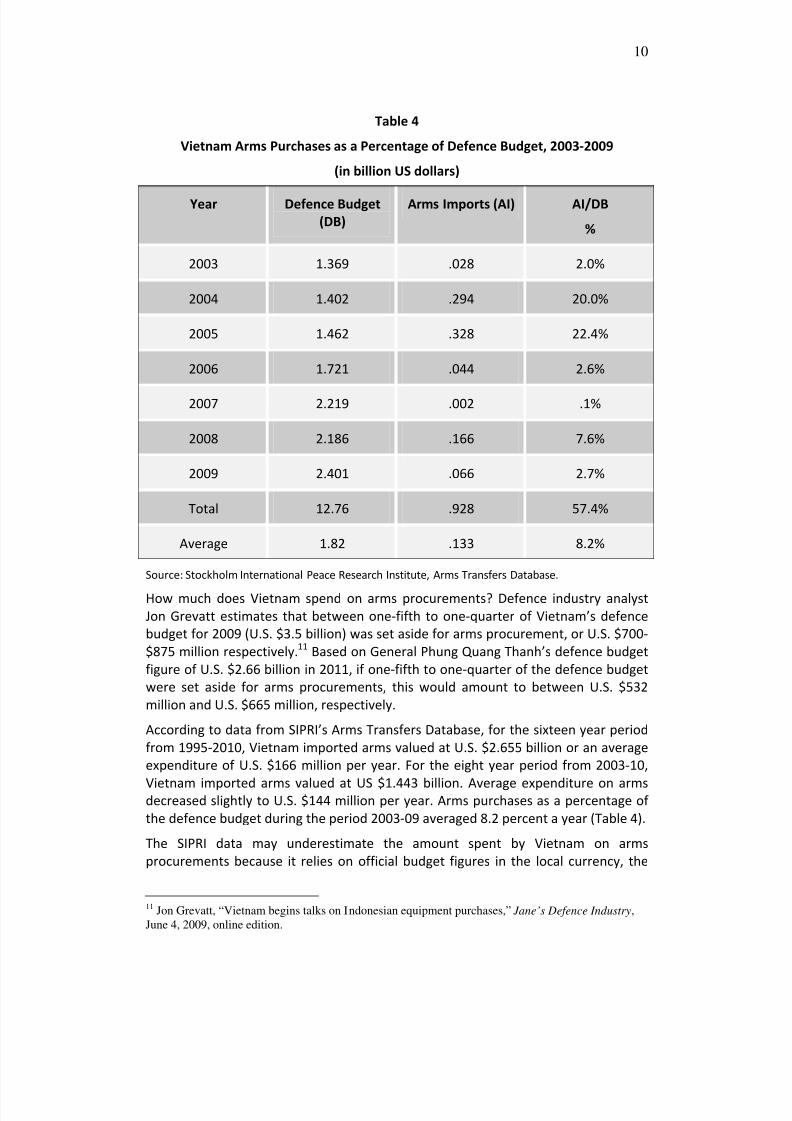
Table 4
Vietnam Arms Purchases as a Percentage of Defence Budget, 2003‐2009
(in billion US dollars)
Year Defence Budget
(DB)
Arms Imports (AI) AI/DB
%
2003 1.369 .028 2.0%
2004 1.402 .294 20.0%
2005 1.462 .328 22.4%
2006 1.721 .044 2.6%
2007 2.219 .002 .1%
2008 2.186 .166 7.6%
2009 2.401 .066 2.7%
Total 12.76 .928 57.4%
Average 1.82 .133 8.2%
Source: Stockholm International Peace Research Institute, Arms Transfers Database.
How much does Vietnam spend on arms procurements? Defence industry analyst
Jon Grevatt estimates that between one‐fifth to one‐quarter of Vietnam’s defence
budget for 2009 (U.S. $3.5 billion) was set aside for arms procurement, or U.S. $700‐
$875 million respectively.11 Based on General Phung Quang Thanh’s defence budget
figure of U.S. $2.66 billion in 2011, if one‐fifth to one‐quarter of the defence budget
were set aside for arms procurements, this would amount to between U.S. $532
million and U.S. $665 million, respectively.
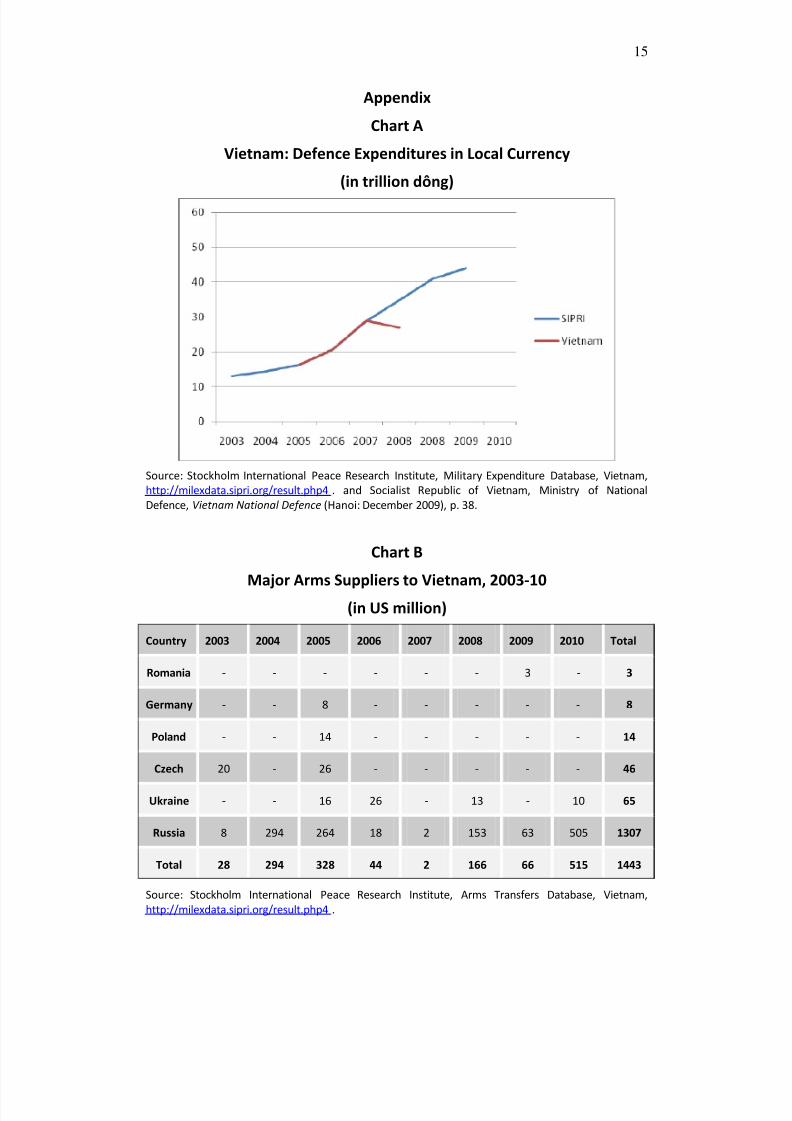
According to data from SIPRI’s Arms Transfers Database, for the sixteen year period
from 1995‐2010, Vietnam imported arms valued at U.S. $2.655 billion or an average
expenditure of U.S. $166 million per year. For the eight year period from 2003‐10,
Vietnam imported arms valued at US $1.443 billion. Average expenditure on arms
decreased slightly to U.S. $144 million per year. Arms purchases as a percentage of
the defence budget during the period 2003‐09 averaged 8.2 percent a year (Table 4).
The SIPRI data may underestimate the amount spent by Vietnam on arms
procurements because it relies on official budget figures in the local currency, the
11 Jon Grevatt, “Vietnam begins talks on Indonesian equipment purchases,” Jane’s Defence Industry,
June 4, 2009, online edition.
8/7/2019 Thayer Vietnam's Defence Budget
http://slidepdf.com/reader/full/thayer-vietnams-defence-budget 11/16
11
dông. As noted above (Chart 1), estimates by defence analysts are generally twice as
much as the official estimates on which SIPRI relies.
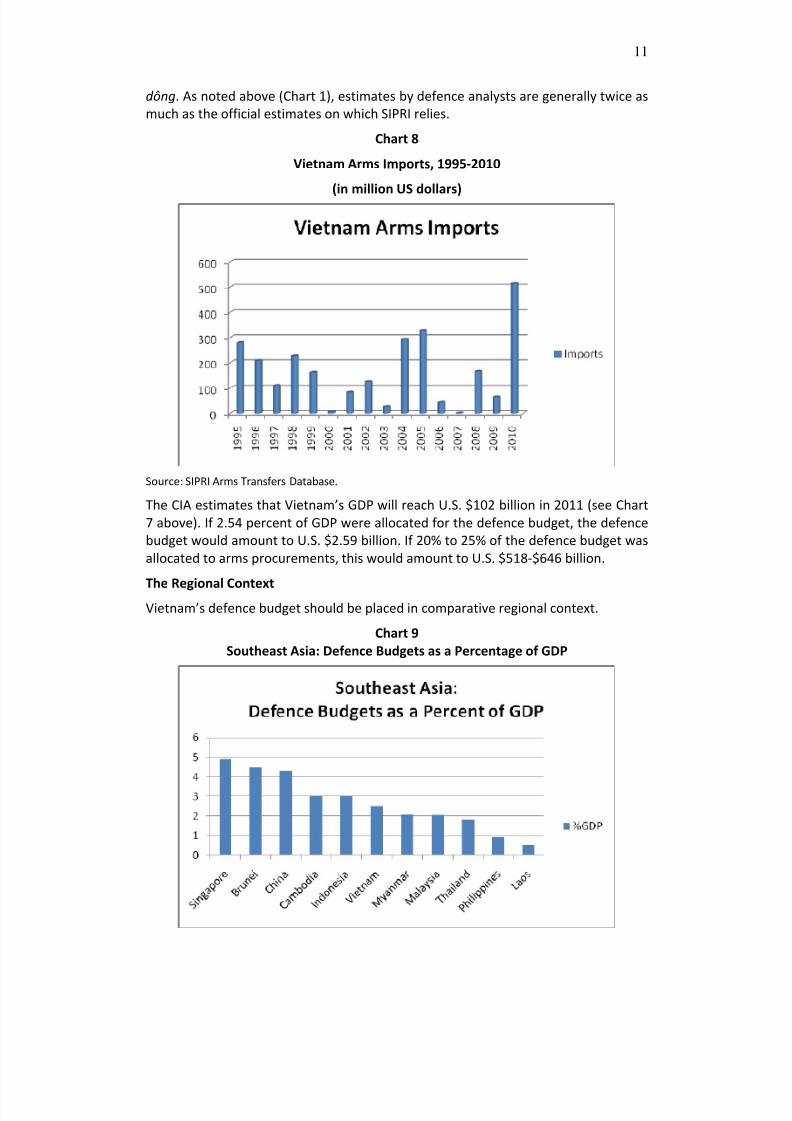
Chart 8
Vietnam Arms Imports, 1995‐2010
(in million US dollars)
Source: SIPRI Arms Transfers Database.
The CIA estimates that Vietnam’s GDP will reach U.S. $102 billion in 2011 (see Chart
7 above). If 2.54 percent of GDP were allocated for the defence budget, the defence
budget would amount to U.S. $2.59 billion. If 20% to 25% of the defence budget was
allocated to arms procurements, this would amount to U.S. $518‐$646 billion.
The
Regional
Context
Vietnam’s defence budget should be placed in comparative regional context.
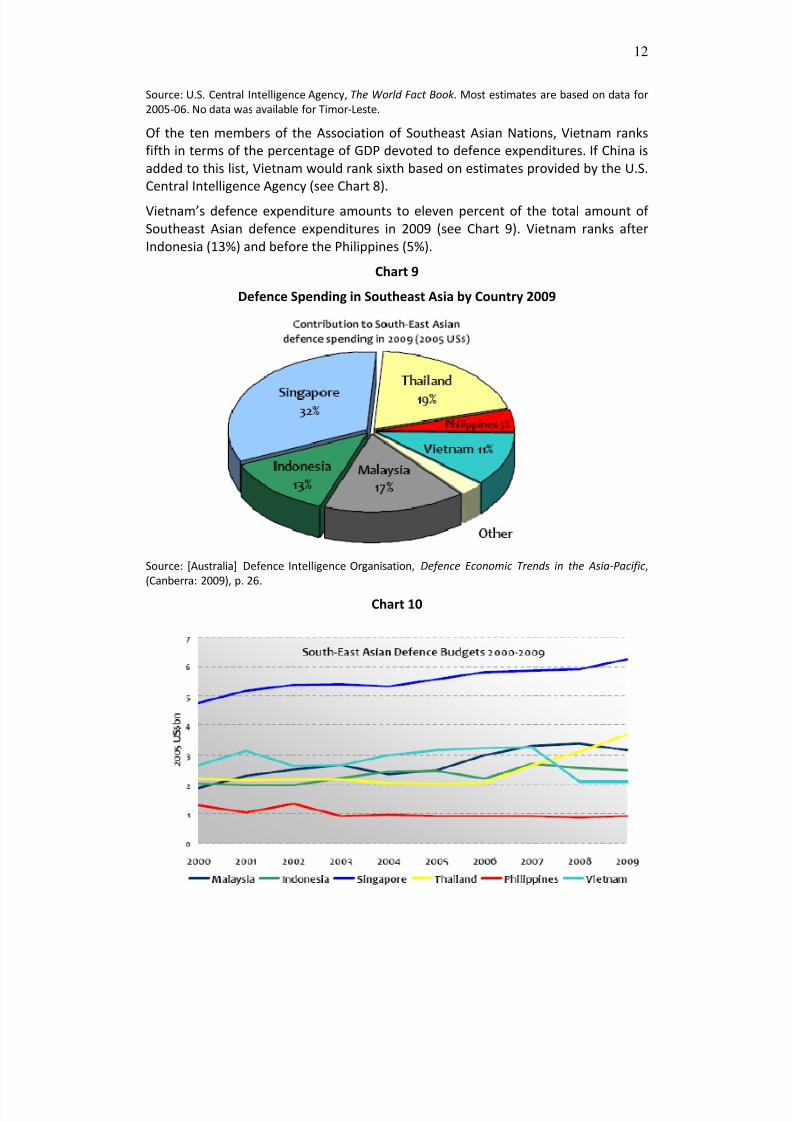
Chart 9
Southeast Asia: Defence Budgets as a Percentage of GDP
8/7/2019 Thayer Vietnam's Defence Budget
http://slidepdf.com/reader/full/thayer-vietnams-defence-budget 12/16
12
Source: U.S. Central Intelligence Agency, The World Fact Book . Most estimates are based on data for
2005‐06. No data was available for Timor‐Leste.
Of the ten members of the Association of Southeast Asian Nations, Vietnam ranks
fifth in terms of the percentage of GDP devoted to defence expenditures. If China is
added to this list, Vietnam would rank sixth based on estimates provided by the U.S.
Central Intelligence Agency (see Chart 8).
Vietnam’s defence expenditure amounts to eleven percent of the total amount of
Southeast Asian defence expenditures in 2009 (see Chart 9). Vietnam ranks after
Indonesia (13%) and before the Philippines (5%).
Chart 9
Defence Spending in Southeast Asia by Country 2009
Source: [Australia] Defence Intelligence Organisation, Defence Economic Trends in the Asia‐Pacific,
(Canberra: 2009), p. 26.
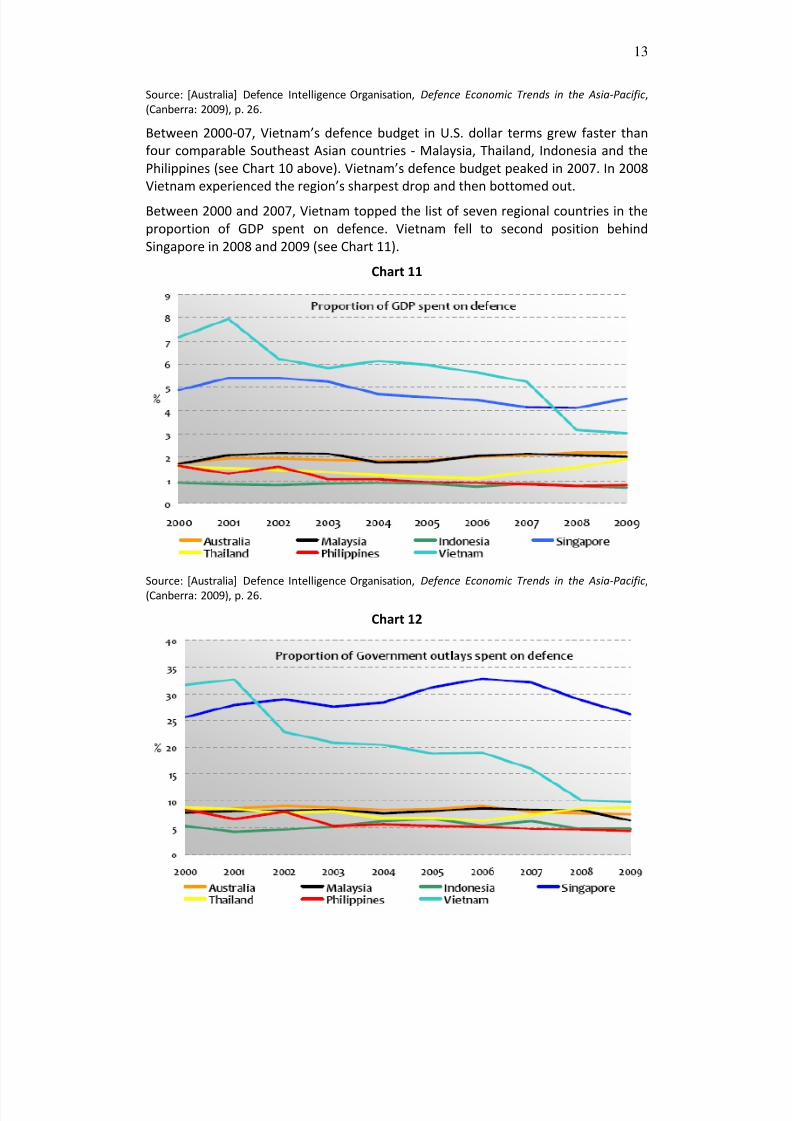
Chart 10
8/7/2019 Thayer Vietnam's Defence Budget
http://slidepdf.com/reader/full/thayer-vietnams-defence-budget 13/16
8/7/2019 Thayer Vietnam's Defence Budget
http://slidepdf.com/reader/full/thayer-vietnams-defence-budget 14/16
14
Source: [Australia] Defence Intelligence Organisation, Defence Economic Trends in the Asia‐Pacific,
(Canberra: 2009), p. 26.
During the period 2000‐09, government expenditure on defence (as a proportion of
total government spending) remained relatively constant except for Singapore and
Vietnam. Vietnam exceeded Singapore in this category in 2000 and 2001. Between
2002‐06 Vietnam was the only country in the sample in Chart 12 to experience
steady decline. In 2007, Singapore and Vietnam both experienced a drop in the
proportion of government expenditure on defence. Vietnam bottomed out in 2008‐
09.
Conclusion
Vietnam does not provide reliable data on its military budget, defence expenditure
or military arms and equipment procurements. Since 2004 Vietnam’s Ministry of
National Defence has included some reference to budget matters in Defence White
Papers. But Vietnam has not been forthcoming in providing details of what is
included – and more crucially what is not included – in these figures. For purposes of
analysis Vietnam’s figures should be used as a base line.
Non‐Vietnamese defence sources, such as Australia’s Defence Intelligence
Organisation, routinely provide estimates that Vietnam spends much more than it
admits, both in terms of constant U.S. dollar figures (converted from Vietnamese
dông) and as a percentage of Gross Domestic Product.
Vietnamese defence spending is closely tied to the state of its economy. Generally,
the defence budget and defence expenditures rise when the economy grows. When
the economy experiences difficulties, as in late 2007‐2008, defence expenditure falls.
Vietnam’s economy has rebounded from the global financial crisis and this has led
Vietnam to increase its defence budget. Because the usual open sources on
Vietnam’s defence expenditure for the year 2010 have not been published, any
assessments about the 2011 defence budget should be treated as preliminary. This
Briefing Paper makes the qualified assessment that Vietnam’s defence budget did
not increase by seventy percent. It is more likely that it increased by less than half
that amount. It is clear that defence expenditures for 2011 have risen and may mark
the commencement of trend of rising defence expenditures that were interrupted by
the global financial crisis.
Vietnam’s defence expenditures appear relatively modest when placed within a
comparative regional framework. Vietnam is a middle ranking country when a
comparison is made on the basis of the percentage of GDP devoted to the defence
budget. Vietnam ranks fifth among the top six Southeast Asian countries in terms of
defence
expenditures
and
only
contributes
a
modest
eleven
percent
to
total
regional
defence expenditures.
8/7/2019 Thayer Vietnam's Defence Budget
http://slidepdf.com/reader/full/thayer-vietnams-defence-budget 15/16
8/7/2019 Thayer Vietnam's Defence Budget
http://slidepdf.com/reader/full/thayer-vietnams-defence-budget 16/16
16
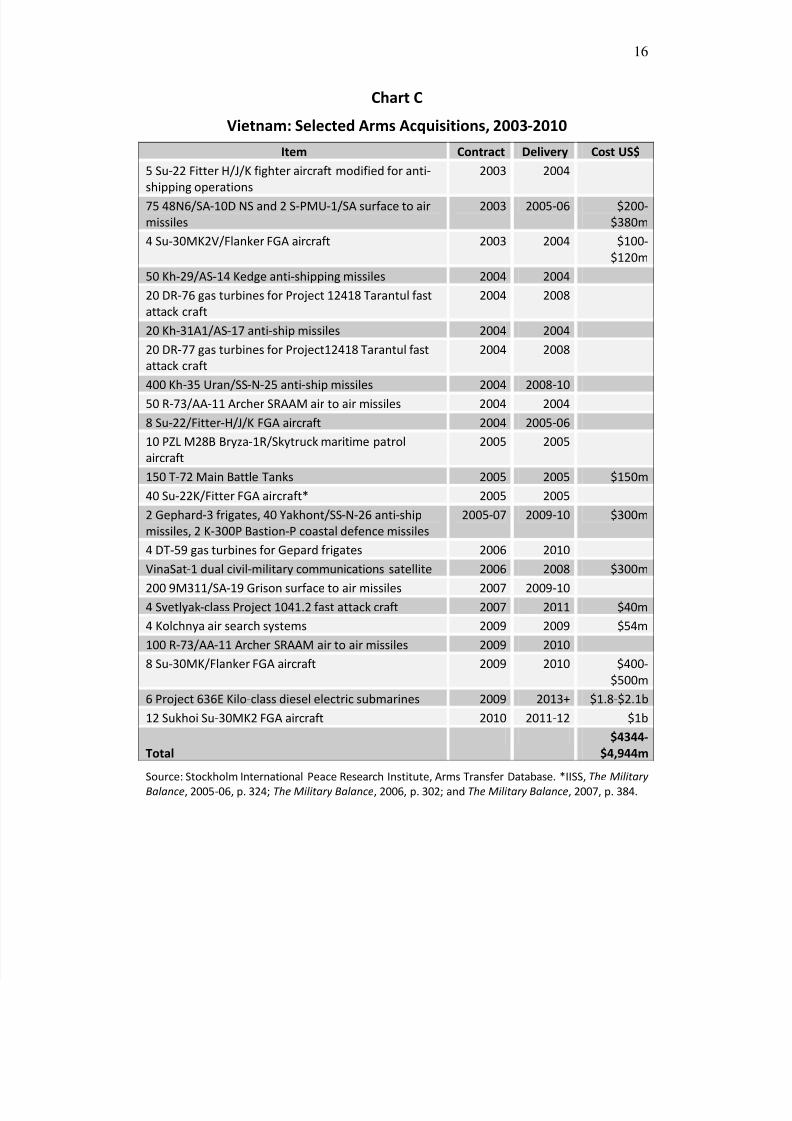
Chart C
Vietnam: Selected Arms Acquisitions, 2003‐2010
Item Contract Delivery Cost US$
5 Su‐22 Fitter H/J/K fighter aircraft modified for anti‐
shipping operations
2003 2004
75 48N6/SA‐10D NS and 2 S‐PMU‐1/SA surface to air
missiles
2003 2005‐06 $200‐
$380m
4 Su‐30MK2V/Flanker FGA aircraft 2003 2004 $100‐
$120m
50 Kh‐29/AS‐14 Kedge anti‐shipping missiles 2004 2004
20 DR‐76 gas turbines for Project 12418 Tarantul fast
attack craft
2004 2008
20 Kh‐31A1/AS‐17 anti‐ship missiles 2004 2004
20 DR‐77 gas turbines for Project12418 Tarantul fast
attack craft
2004 2008
400 Kh‐35 Uran/SS‐N‐25 anti‐ship missiles 2004 2008‐10
50 R‐73/AA‐11 Archer SRAAM air to air missiles 2004 2004
8 Su‐22/Fitter‐H/J/K FGA aircraft 2004 2005‐06
10 PZL M28B Bryza‐1R/Skytruck maritime patrol
aircraft
2005 2005
150 T‐72 Main Battle Tanks 2005 2005 $150m
40 Su‐22K/Fitter FGA aircraft* 2005 2005
2 Gephard‐3 frigates, 40 Yakhont/SS‐N‐26 anti‐ship
missiles, 2 K‐300P Bastion‐P coastal defence missiles
2005‐07 2009‐10 $300m
4 DT‐59 gas turbines for Gepard frigates 2006 2010
VinaSat‐1 dual civil‐military communications satellite 2006 2008 $300m
200 9M311/SA‐19 Grison surface to air missiles 2007 2009‐10
4 Svetlyak‐class Project 1041.2 fast attack craft 2007 2011 $40m
4 Kolchnya air search systems 2009 2009 $54m
100 R‐73/AA‐11 Archer SRAAM air to air missiles 2009 2010
8 Su‐30MK/Flanker FGA aircraft 2009 2010 $400‐
$500m
6 Project 636E Kilo‐class diesel electric submarines 2009 2013+ $1.8‐$2.1b
12 Sukhoi Su‐30MK2 FGA aircraft 2010 2011‐12 $1b
Total
$4344‐
$4,944m
Source: Stockholm International Peace Research Institute, Arms Transfer Database. *IISS, The Military
Balance, 2005‐06, p. 324; The Military Balance, 2006, p. 302; and The Military Balance, 2007, p. 384.