Embed Size (px)
Citation preview

The 2019 Survey of Consumer Payment Choice: Summary Results
2020 ● No. 20-3 Kevin Foster, Claire Greene, and Joanna Stavins
Abstract
In 2019, U.S. consumers made 69 payments per month on average. They made six in 10 payments with debit, credit, or prepaid cards, or 42 payments. Debit cards were used the most, for 24 payments, followed by credit cards (17 payments), and cash (15 payments). Over the 12 years of the survey, debit, cash, and credit have consistently been the most popular ways to pay.
Some notable results about consumer payment behavior in 2019:
• Fifty-nine percent of consumers adopted mobile banking and 75 percent online banking. • Half of consumers adopted at least one online payment method, such as PayPal, Venmo, or
Zelle. • Three-quarters of consumers paid electronically from a bank account, either by using their
bank’s online bill pay or providing their bank account number to a third party. • On average, consumers made 30 percent of in-person retail payments in cash in a typical month. • Half of consumers reported that in a typical month they made at least one payment to another
person (for example, friend or family).
From 2018 to 2019, the share of payments made with cash declined 2 percentage points, a statistically significant change. Also statistically significant, the share of payments made with online banking bill pay (OBBP) increased about one-half of 1 percentage point. The shares of payments made with cards (debit, credit, prepaid) were stable; no change was statistically significant. The shares of consumers who purchased goods or services online or who made a mobile payment were stable from 2018.
Interactive charts, showing payment use by transaction type, income, and age, are posted on the Atlanta Fed website.
Keywords: cash, checks, checking accounts, debit cards, credit cards, prepaid cards, electronic payments, payment preferences, unbanked, Survey of Consumer Payment Choice
JEL Classifications: D12, D14, E42
https://doi.org/10.29338/rdr2020-03
Kevin Foster is a senior survey specialist and Claire Greene is a retail payments risk expert, both at the Federal Reserve Bank of Atlanta. Joanna Stavins is a senior economist and policy adviser at the Federal Reserve Bank of Boston. Their email addresses are, respectively, [email protected], [email protected], and [email protected].
This report, which may be revised, is available on the Atlanta Fed website.
Acknowledgments appear on the following page. The authors are responsible for any errors.
The views expressed in this paper are those of the authors. They do not necessarily reflect the views of the Federal Reserve Banks of Atlanta or Boston, other Federal Reserve Banks, or the Board of Governors of the Federal Reserve System.
This version: June 16, 2020

2
Acknowledgments
The Survey of Consumer Payment Choice (SCPC) is a project of the Federal Reserve Bank of Atlanta. The following individuals contributed to the production and dissemination of the 2019 SCPC. From the Atlanta Fed are Kevin Foster, Claire Greene, Marcin Hitczenko, Brian Prescott, and Oz Shy. From the Boston Fed are Joanna Stavins and Liang Zhang. From the University of Southern California are Marco Angrisani, Tania Gutsche, Arie Kapteyn, Bart Orriens, and Albert Weerman.
Please contact Kevin Foster for more information about the Survey of Consumer Payment Choice.
Kevin Foster, Senior Business Survey Specialist Federal Reserve Bank of Atlanta (617) 973-3955 [email protected]
3
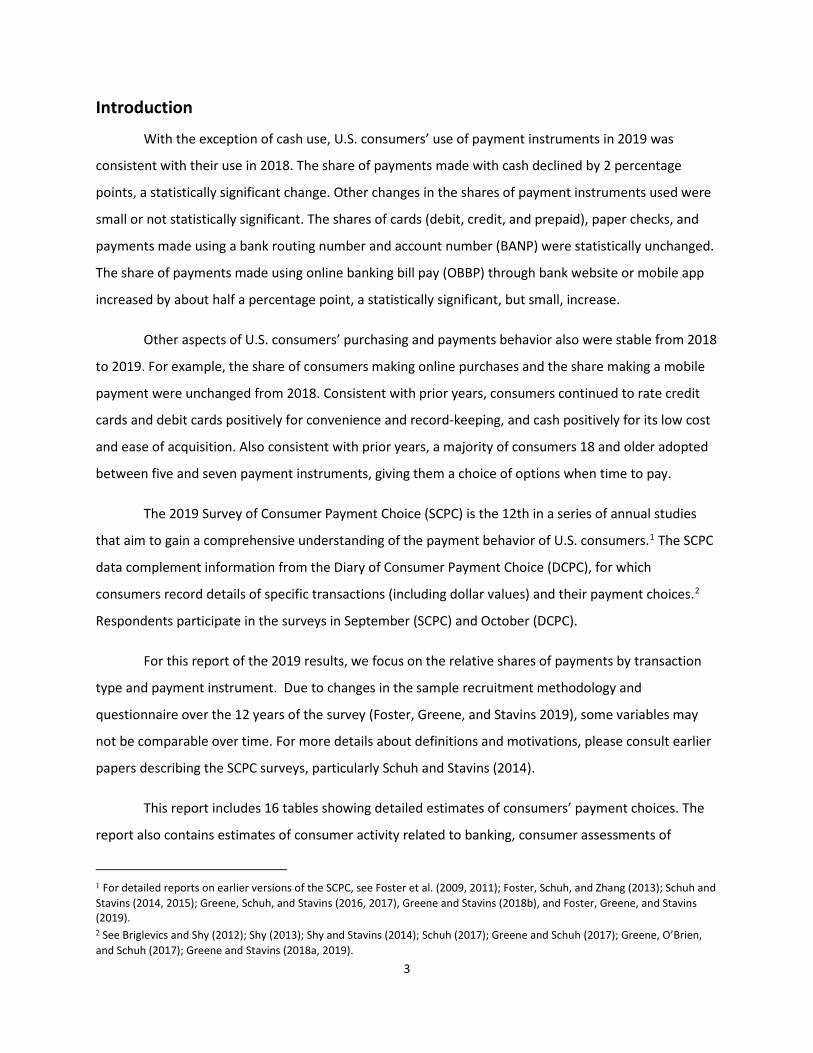
Introduction
With the exception of cash use, U.S. consumers’ use of payment instruments in 2019 was
consistent with their use in 2018. The share of payments made with cash declined by 2 percentage
points, a statistically significant change. Other changes in the shares of payment instruments used were
small or not statistically significant. The shares of cards (debit, credit, and prepaid), paper checks, and
payments made using a bank routing number and account number (BANP) were statistically unchanged.
The share of payments made using online banking bill pay (OBBP) through bank website or mobile app
increased by about half a percentage point, a statistically significant, but small, increase.
Other aspects of U.S. consumers’ purchasing and payments behavior also were stable from 2018
to 2019. For example, the share of consumers making online purchases and the share making a mobile
payment were unchanged from 2018. Consistent with prior years, consumers continued to rate credit
cards and debit cards positively for convenience and record-keeping, and cash positively for its low cost
and ease of acquisition. Also consistent with prior years, a majority of consumers 18 and older adopted
between five and seven payment instruments, giving them a choice of options when time to pay.
The 2019 Survey of Consumer Payment Choice (SCPC) is the 12th in a series of annual studies
that aim to gain a comprehensive understanding of the payment behavior of U.S. consumers.1 The SCPC
data complement information from the Diary of Consumer Payment Choice (DCPC), for which
consumers record details of specific transactions (including dollar values) and their payment choices.2
Respondents participate in the surveys in September (SCPC) and October (DCPC).
For this report of the 2019 results, we focus on the relative shares of payments by transaction
type and payment instrument. Due to changes in the sample recruitment methodology and
questionnaire over the 12 years of the survey (Foster, Greene, and Stavins 2019), some variables may
not be comparable over time. For more details about definitions and motivations, please consult earlier
papers describing the SCPC surveys, particularly Schuh and Stavins (2014).
This report includes 16 tables showing detailed estimates of consumers’ payment choices. The
report also contains estimates of consumer activity related to banking, consumer assessments of
1 For detailed reports on earlier versions of the SCPC, see Foster et al. (2009, 2011); Foster, Schuh, and Zhang (2013); Schuh and Stavins (2014, 2015); Greene, Schuh, and Stavins (2016, 2017), Greene and Stavins (2018b), and Foster, Greene, and Stavins (2019). 2 See Briglevics and Shy (2012); Shy (2013); Shy and Stavins (2014); Schuh (2017); Greene and Schuh (2017); Greene, O’Brien, and Schuh (2017); Greene and Stavins (2018a, 2019).

4
payment characteristics, and a rich set of consumer and household demographic characteristics. The
online version of this report includes figures that show consumers’ payment use by age, income, and
transaction type, available on the Atlanta Fed website. A total of 3,372 respondents completed the 2019
SCPC.
The remainder of this paper comprises three parts: 1) a summary of the key SCPC results, 2)
tables containing definitions of important survey concepts (Definition Tables), and 3) tables containing
SCPC results (SCPC Tables).
Summary of SCPC tables
The SCPC aims to measure U.S. consumer ownership (adoption) of payment instruments and the
use of these instruments (number of payments) in a typical month. The 2015 through 2019 results
appear in SCPC Tables 1–16 of this paper, organized into seven sections:
1. Adoption of accounts and payment instruments: consumer adoption of bank accounts, nonbank
payment accounts, and payment instruments [SCPC Tables 1 and 2]
2. Incidence of use of accounts and payments instruments: share of consumers using each payment
instrument and share making a transaction, by type of transaction [SCPC Tables 3 and 4]
3. Frequency of use of payment instruments and transactions: number and share of payments by
payment instrument and type of transaction as well as distributions of the number by payment
instrument and type of transaction [SCPC Tables 5 through 11]
4. Prevalence and amount of credit card debt [SCPC Table 12]
5. Loss, theft, or fraud: percentage of consumers experiencing loss, theft, or fraud by payment
instrument [SCPC Table 13]
6. Assessments: consumer assessments of key characteristics of payment instruments and payment
practices [SCPC Table 14]
7. Household characteristics: information about consumer demographic characteristics and financial
status [SCPC Tables 15 and 16]
All SCPC data are available free to the public at frbatlanta.org/banking-and-
payments/consumer-payments/survey-of-consumer-payment-choice.aspx. The following list
summarizes online resources for all years, 2008 through 2019:

5
• SCPC public-use microdata sets containing consumer-level SCPC responses to all survey questions as
well as the important created variables used to populate the official tables
• Tables containing estimates of the standard errors for the SCPC results
• “Data Guide to the Survey of Consumer Payment Choice,” defining each variable and providing a
frequency table of the responses (2018 and 2019 only)
• Survey questionnaire, including a complete list of variables
• Data and reports
• Interactive charts showing payment use by three income categories, six age groupings, and four
transaction types for 2015–193
All SCPC data users are strongly encouraged to read the technical appendix (Angrisani, Foster,
and Hitczenko, forthcoming; Angrisani, Foster, and Hitczenko, 2017). The SCPC estimates reported here
may be revised in the future as a result of additional process improvement or insights from new data.
Small discrepancies in the estimates may exist throughout the paper, due to rounding.
Bank account and payment instrument adoption
Payments behavior is measured as a two-step process: the consumer must “adopt”—that is,
own or have set up for use—the payment instrument to be able to use it. Adopting a bank account is a
prerequisite to adopting a number of payment instruments—for example, a debit card. Bank account
adoption has been high—always greater than 90 percent of U.S. consumers—in each of the 12 years of
the SCPC. In 2019, 92 percent of U.S. consumers had a bank account. Ninety percent of consumers had a
checking account; 72 percent had a savings account. Three-quarters of consumers used online banking,
and almost 60 percent used mobile banking (SCPC Table 1). Consumers also adopted nonbank payment
accounts. In 2018, almost 50 percent had a nonbank account such as PayPal or Venmo.
Cash adoption is defined as having used cash to make a payment in the prior 12 months or
having some cash on hand. Debit card adoption is defined as owning a debit card, and so on (see
Definitions Table 3). In 2019, most consumers—99 percent—had adopted cash. Ninety-seven percent of
consumers had some sort of payment card (debit, credit, or prepaid), with 82 percent owning a debit
3 For information on the methodology used to create these charts, see Connolly and Stavins (2015).

6
card. Three-quarters of consumers reported having a blank paper check on hand. About 2 percent of
U.S. consumers reported that they own virtual currency like Bitcoin, Litecoin, or Ethereum.
Two-thirds of consumers had set up one or both of the methods allowing payment directly from
a bank account (typically effected through an ACH transfer): online banking bill payment (OBBP) or bank
account number payment (BANP) (SCPC Table 2). The decline in the adoption of BANP from 18 percent
of U.S. consumers in 2018 to 11 percent in 2019 is unexplained (Figure 1). The SCPC questionnaire
defines BANP as “a payment made by providing a bank account number to a third party, such as an
employer or utility company. The number can be given on websites, paper forms, and more.” Since the
SCPC began in 2008, the uses of BANP have evolved to include a wider variety of payees, including other
people. Further investigation is required to understand how respondents in 2019 are interpreting this
definition. Figure 1 shows adoption rates over the past 12 years, with the caveat that changes in
sampling methodology and questionnaire affect the ability to compare year over year, particularly
before 2015, when a different survey vendor was used (Foster, Greene, and Stavins 2019).
Figure 1: Percentage of U.S. consumers adopting payment instruments
Notes: Results from 2009 through 2014 are based on the American Life Panel; 2015 through 2018 results are based on the Understanding America Study panel. OBBP stands for online banking bill payment; BANP stands for bank account number payment. Travelers’ checks were omitted from the questionnaire beginning in 2018.
Source: 2009–19 Surveys of Consumer Payment Choice
7
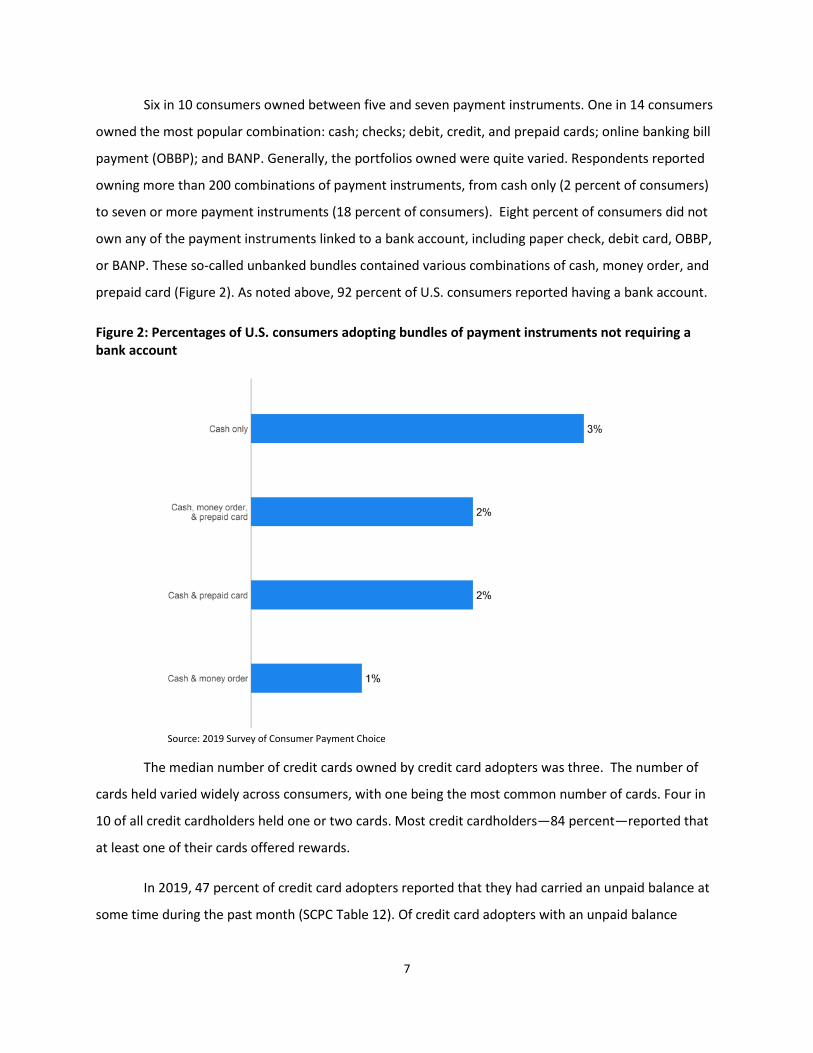
Six in 10 consumers owned between five and seven payment instruments. One in 14 consumers
owned the most popular combination: cash; checks; debit, credit, and prepaid cards; online banking bill
payment (OBBP); and BANP. Generally, the portfolios owned were quite varied. Respondents reported
owning more than 200 combinations of payment instruments, from cash only (2 percent of consumers)
to seven or more payment instruments (18 percent of consumers). Eight percent of consumers did not
own any of the payment instruments linked to a bank account, including paper check, debit card, OBBP,
or BANP. These so-called unbanked bundles contained various combinations of cash, money order, and
prepaid card (Figure 2). As noted above, 92 percent of U.S. consumers reported having a bank account.
Figure 2: Percentages of U.S. consumers adopting bundles of payment instruments not requiring a bank account
Source: 2019 Survey of Consumer Payment Choice
The median number of credit cards owned by credit card adopters was three. The number of
cards held varied widely across consumers, with one being the most common number of cards. Four in
10 of all credit cardholders held one or two cards. Most credit cardholders—84 percent—reported that
at least one of their cards offered rewards.
In 2019, 47 percent of credit card adopters reported that they had carried an unpaid balance at
some time during the past month (SCPC Table 12). Of credit card adopters with an unpaid balance

8
(“revolvers”), the median unpaid balance was about $1,500 (the mean was $5,273). Adopters estimated
their total credit limit on all cards to be about $24,000.
Consumers making payments in a typical month
In the SCPC, consumers report payment instrument use in the context of transaction type. They
report three types of bill payment (automatic; online; and by mail, in person, or by phone); three types
of purchases (in-person retail goods, in-person services, and online); and person to person (P2P)
payments. In 2019, 98 percent of respondents reported making at least one payment in a typical month.
Ninety-four percent reported making a bill payment of some type, 96 percent reported a purchase, and
48 percent reported making at least one payment to another person (for example, family or friend) in a
typical month. More than nine in 10 (93 percent) reported making at least one in-person purchase of
retail goods in a typical month, and 59 percent reported making an online purchase of goods or services
(SCPC Table 4). Note that more consumers paid bills online than made purchases online: 74 percent paid
at least one bill online in a typical month. Eighty-three percent of consumers paid online in a typical
month, defined as making an online purchase or an online bill payment at least once.4
For consumers overall, cash was used at least once by more consumers than any other payment
instrument: 82 percent reported using cash at least once during a typical month (SCPC Table 3). Two-
thirds of consumers used debit cards in a typical month, and a nearly identical number used BANP in a
typical month. More than half of consumers used credit cards: 63 percent. Less than half of consumers
reported that they used the other payment instruments in a typical month: 47 percent used a paper
check; 35 percent, online banking bill payment; 16 percent, a prepaid card; and 7 percent, a money
order (SCPC Table 3). In the SCPC, respondents reported use in terms of underlying payment
instruments. For example, they reported a PayPal payment funded by a credit card as a credit card
payment and a mobile payment funded by a coffee shop prepaid card or account as a prepaid card
payment.
4 Automatic payments that initially may have been set up online are excluded from this calculation. This is the share of consumers who actively made a payment online at least once in a typical month.

9
Number of payments in a typical month
The average number of total payments reported by consumers for a typical month declined
from 72 in 2018 to 69 payments on average. Although this change was statistically significant at the 95
percent confidence level, the number of payments was generally flat from 2015 to 2018 (Table 1).
Table 1: Average number of payments per consumer per month
2015 2016 2017 2018 2019 Average number of payments 68.9 67.8 69.6 72.1 68.5 95% confidence interval 65.4, 72.4 65.4, 70.2 66.7, 72.5 69.0, 75.2 65.0, 72.0
Source: 2015–19 Surveys of Consumer Payment Choice
As noted above, in a typical month in 2019, consumers reported making on average 69
payments, comprising purchases and P2P payments (hereafter, “purchases” is used for both) and bill
payments. This mean number of payments encompasses quite a bit of variability among individuals, in
particular for consumers making larger numbers of payments. As the distributions in SCPC Table 6 show,
the median number of payments was 56, and the middle 50 percent of consumers made between 29
and 92 payments per month (Figure 3). We find this sort of dispersion in much consumer payments
behavior, including, for example, the very large number of bundles of different payments instruments
that consumers own.
Figure 3: Number of payments by usage percentile, 2019
Note: The vertical rule inside the box displays the median value, and the box spans the 25% to 75% percentiles. The horizontal rules display the 5% and 95% percentiles. The dot inside the distribution is the mean.
Source: 2019 Survey of Consumer Payment Choice
Payments by payment instrument
In 2019, consumers made most of their payments with debit cards, followed by credit and cash.
In a typical month in 2019, consumers on average made 24 debit card payments (35 percent of all
payments), 17 credit or charge payments (24 percent), and 15 cash payments (22 percent) (SCPC Table
5). Consumers made three check payments per month on average in 2019, and eight payments directly

10
from a bank account, through either BANP or OBBP. Checks were 4 percent of all payments, and
electronic payments were 12 percent.
By mode, card payments were more popular than paper or electronic payments in 2019. In a
typical month, consumers made an average of 42 payments using debit, credit, or prepaid cards (or 61
percent of total payments); 18 payments using cash, paper checks, and other paper instruments (26
percent); and eight payments using electronic and other means of payment (12 percent).
SCPC Table 6 shows that the median number of card payments was 31, with the middle 50
percent of consumers making between 13 and 60 card payments. As noted above in the discussion of
payment instrument adoption, consumer behavior was highly varied. Figure 4 shows the distribution of
the number of payments by payment instrument (dots show the average number of payments per
consumer in a typical month; vertical rules inside the boxes show the median). Note that debit cards,
credit cards, and cash, which were used most, also had the greatest variation in use from one consumer
to another.

11
Figure 4: Distribution of consumer payments in a typical month, 2019
Notes: The vertical rule inside the box displays the median value, and the box spans the 25% to 75% percentiles. The horizontal rules display the 5% and 95% percentiles. The dots lying along the distributions are the population means. OBBP stands for online banking bill payment; BANP stands for bank account number payment.
Source: 2019 Survey of Consumer Payment Choice
Over the 12 years of the survey, debit, credit, and cash have consistently been the most popular
ways to pay (Figure 5). These “big three” payment instruments accounted for 81 percent of consumer
payments in 2015, and this relationship remains true for 2019, with the three payment instruments
comprising 80 percent of all consumer payments. In every year since 2010, debit card payments have
consistently been the largest share of consumer payments. The share of cash payments has declined
gradually since the financial crisis. In 2019, for the first time, the percentage share of credit card
payments exceeded the percentage share of cash payments. As noted above, the change in the
percentage share of cash payments from 2018 is statistically significant at the 95 percent level, and the
change in the percentage share of credit card payments is not statistically significant. The increase in
shares of OBBP is statistically significant (Figure 6).

12
Figure 5: Percentage share of consumer payments in a typical month, by type of payment instrument
Note: Results from 2009 through 2014 are based on the American Life Panel; 2015 through 2018 results are based on the Understanding America Study panel. OBBP stands for online banking bill payment; BANP stands for bank account number payment.
Source: 2009–19 Surveys of Consumer Payment Choice

13
Figure 6: Changes in percentage shares of payments instrument use, 2018–19
Note: The horizontal lines depict the 95 percent confidence intervals of the changes in the percentage shares of payments between 2018 and 2019, and the dots depict the point estimates. Confidence intervals that lie entirely to the left or to the right of the vertical zero line indicate changes that are statistically significantly different from zero.
Source: 2018 and 2019 Surveys of Consumer Payment Choice
Building on the work in Connolly and Stavins (2015), three charts posted online with this paper
(URL here) enable the user to examine payment instrument use by three income categories (less than
$40,000, $40,000–$75,000, and $75,000 or more), by six age groupings beginning at 18, and by four
transaction types (bills, purchases, P2P payments, and online payments).
Payments by transaction
Previous research has found that consumers make different payment choices depending on the
payment scenario—for example, paying a bill versus paying another person (Greene and Stavins
forthcoming). Therefore, it is useful to examine the mix of transactions that consumers reported making
in a typical month in 2019 and then to put their choice of payment instrument in the context of
transaction type. About 70 percent of payments were for purchases (including P2P payments) and 30
percent were bill payments (SCPC Table 7). This mix of transaction types has remained consistent over
the 12 years of the SCPC. P2P payments were 4 percent of payments in 2019.
In 2019, in-person purchases of retail goods accounted for the largest share of all payments,
about one-third. They represented about half of all purchases (in person and online and excluding P2P).

14
Online purchases, six per month, were 8 percent of all transactions and 12 percent of all purchases.
Note that online purchases were a relatively small share of all payments, as well as a relatively small
share of purchases.
In a typical month in 2019, consumers on average paid 14 bills automatically or online and seven
bills by mail, in person, or by phone. That is, they paid two-thirds of bills using channels that cannot accept
a paper payment instrument (check, money order, or cash) (SCPC Table 10). As noted above, bills
represented about 30 percent of consumer payments overall.
As was found for payment instrument use, the distribution of the number of transactions
reported by type also varied among consumers (Figure 7). For example, the median number of
purchases of goods at the in-person point of sale was 16, with half of all in-person purchases of goods
between six and 32 per month. For in-person purchases of services, the median was 10, with half
between four and 22.

15
Figure 7: Distribution of the number of payments by transaction type
Notes: Retail payments and services payments are by definition made in person. The vertical rule inside the box displays the median value, and the box spans the 25% to 75% percentiles. The horizontal rules display the 5% and 95% percentiles. The dots lying along the distributions are the population means.
Source: 2019 Survey of Consumer Payment Choice
Payments by transaction and payment instrument
As noted above, debit cards were the most-used payment method overall in a typical month in
2019. That year, debit cards also were the most-used payment instrument for the transaction categories
of bills, in-person purchases, and online purchases.
Debit cards were used most for bill payments overall—31 percent—as well as for each of the
three types of bill payments individually (automatic, online, mail/in person/phone). In 2019, consumers
paid slightly more than half of their bills using debit, credit, or prepaid cards. They made 31 percent of
bill payments using electronic methods (OBBP or BANP), and 15 percent using paper methods (cash,
check, money order) (Figure 8).
Debit cards were used more than cash for in-person purchases in 2019—they were used for 38
percent of in-person purchases of goods and services. Taken together, cards (debit, credit, and prepaid)
were preferred over paper instruments for in-person purchases. Consumers on average made 67
percent of in-person purchases with cards and 33 percent with paper instruments (comprising cash,
check, and money order) (Figure 8).

16
Debit cards also were used most for online purchases: 42 percent (SCPC Table 9). Cards overall
were used for 82 percent of online purchases (SCPC Table 9 and Figure 8). Note that the ways of making
online purchases have become increasingly varied, with merchants allowing consumers to buy and pay
online and pick up in store or to buy online and pay in store—thus the occasional use of paper
instruments to effect an online purchase.
Figure 8: Number of payments by transaction type and payment type
Source: 2019 Survey of Consumer Payment Choice
Cash was used for four in 10 P2P payments in 2019. Of note, four in 10 P2P payments were
made with a card or electronically, likely facilitated by one of many payment apps designed to transfer
money between individuals. Debit cards were the second-most-used method for making a P2P payment,
ahead of paper checks. Just 9 percent of P2P payments were with a paper check.
Assessments of payment instruments
Consumers’ assessments of payment instruments have remained fairly stable since 2015—and,
indeed, since the SCPC began in 2008 (SCPC Table 14). Consumers gave credit cards the highest rating
for security in 2019 and in all years but one since 2015. As SCPC Table 14 shows, consumers
differentiated among different card types for security ratings. They gave prepaid cards and cash similar

17
ratings for security (relatively poor in both instances) and consistently rated debit cards lower than
credit cards, again possibly because consumers rarely suffer financial losses when the security of their
credit cards is compromised. The survey question asks respondents to “rate the security of each method
against permanent financial loss or unwanted disclosure of personal information.” The rankings are
determined by first calculating the mean of each payment instrument assessment and then ranking the
payment instruments according to those means.5
In 2019, about one in five consumers had experienced identity theft themselves in the previous
12 months or knew someone who had. Ten percent of consumers reported that they had personally
experienced identity theft in the previous 12 months; 14 percent knew someone who had experienced
it; and 11 percent of consumers lost a debit card, a credit card, or some cash or had one of these stolen
(SCPC Table 13). Of debit card adopters, 4 percent experienced loss, theft, or fraud, compared to 5
percent of credit card adopters.
Consumers rated the three most-used payment instruments—credit cards, cash, and debit
cards—highest for acceptance by merchants and other payees. Consumers’ view of acceptance is
important because it influences their choice of what payment instruments to adopt and use (Koulayev et
al. 2016).
The SCPC defines convenience, a somewhat amorphous quality, as encompassing qualities
including speed, control over payment timing, ease of use, effort to carry, and the ability to keep or
store the payment method. Again, the three most-used payment instruments were rated highly, with
both kinds of cards (credit and debit) ranked above cash for convenience. Money orders were
consistently considered the least convenient.
As one might expect, credit cards consistently were rated worst for cost, defined as a
combination of interest and fees (which increase cost) and rewards (which reduce cost). Cash and OBBP
were viewed relatively favorably for cost, while money orders were rated relatively unfavorably.
5 See Greene, Schuh, and Stavins (2017), Tables 36a through 36f and 37a, for a comparison. These detailed shares of ratings are included in the data set for 2017, available free at https://www.frbatlanta.org/banking-and-payments/consumer-payments/survey-of-consumer-payment-choice/2017-survey.

18
Survey methodology
This is the fifth year the SCPC has been conducted using the Understanding America Study
(UAS), managed by the University of Southern California Dornsife Center for Economic and Social
Research. Of the 3,372 2019 SCPC respondents, 2,021 also responded to the 2016, 2017, and 2018
surveys (Table 2). Before the 2015 survey, the SCPC was conducted using the Rand Corporation’s
American Life Panel (ALP). Both panels are nationally representative. The charts presented in this report
incorporate data from both panels. ALP data is 2014 and before, UAS data is 2015 and after.
Table 2: SCPC Number of respondents, 2015–19
Survey year Number of respondents 2019 3,372 2018 3,153 2017 3,099 2016 3,404 2015 1,429
Source: 2015–19 Surveys of Consumer Payments Choice
To enable better inference of the entire population of U.S. consumers, SCPC respondents were
assigned post-stratified survey weights designed to align as much as possible the composition of the
SCPC sample with that of the Current Population Study (CPS). This follows common practice in other
social science surveys, such as the Consumer Expenditure Survey (see Angrisani, Foster, and Hitczenko
2017). Table 3 compares the SCPC 2019 panel to the October 2019 CPS.
Table 3: Comparison of SCPC panel to Current Population Survey6
October 2019 CPS 2019 SCPC Average age 47 48 Female 52% 52% Married 50% 56% Employed 61% 63% Race: Asian 6% 3% Race: Black 13% 15% Race: White 77% 73% Hispanic/Latino 17% 12% Mean household income $50,000–$59-000 $40,000–$49,000 Number of respondents 58,798 3,372
Source: 2019 Survey of Consumer Payments Choice, U.S. Census Bureau Current Population Survey
6 https://www.census.gov/programs-surveys/cps.html

19
Most SCPC respondents also complete the companion survey instrument, the Diary of Consumer
Payment Choice (Greene and Stavins 2019). The DCPC collects data on individual payments from daily
records kept by consumers, including the dollar values of payments. Due to the differences in data
collection methods, some estimates from the two surveys differ and should not be compared directly.
Reports and data for the 2018 DCPC are online at frbatlanta.org/banking-and-payments/consumer-
payments/diary-of-consumer-payment-choice. The 2019 DCPC results are forthcoming.
Conclusions
U.S. consumers have many choices for how to pay. This report describes how consumers assessed
characteristics of different payment instruments, what they chose to adopt, and how they paid in
particular situations. Consumers’ assessments of payment instruments were generally stable over time.
Adoption of payment instruments also is consistent year to year. From 2018 to 2019, there was a
statistically significant decline in the share of payments consumers made using cash and a statistically
significant increase in the share of payments made using OBBP. The share of consumers making online
purchases and the share of consumers making mobile payments were stable from 2018.
Definitions of concepts
This section contains tables with the definitions of concepts used in the SCPC questionnaire and
in the construction of the official tables of statistics. Some of the definitions presented to the survey
respondents may have been phrased differently from the way they are specified here. For more
information, consult the SCPC questionnaire, which is available online.

20
Definitions Table 1: Banking concepts
Concept Definition Asset Any item of monetary value, including bank accounts, real estate, stocks, bonds,
annuities, retirement accounts, motor vehicles, jewelry, rare or collectible goods, and personal or household goods
Automated teller machine (ATM)
A machine that allows customers to access their bank accounts with an ATM card, debit card, or credit card to withdraw cash, make deposits, view account balances, transfer money, and perform other related banking transactions
ATM card A card that allows a customer to deposit or withdraw cash from an automated teller machine, but that cannot be used for purchases or payments
Bank An institution that accepts deposits and offers checking accounts or savings accounts. Includes regular or internet-based commercial banks, credit unions, and savings and loan associations
Checking account An account that allows a customer to make payments or withdrawals as often as necessary, using checks, debit or ATM cards, or online or preauthorized withdrawal payments. Some checking accounts pay interest on deposits and may be called money market checking accounts.
Mobile banking A method of accessing one’s bank account with a mobile phone, by using the phone to access the bank’s web page on the mobile phone, send text messages, read emails from the bank, or use a downloaded app
Money market account A type of savings account offered by banks and credit unions that is similar to a regular savings account. The difference is that money market accounts usually pay higher interest, have higher minimum balance requirements, and allow fewer withdrawals per month. Another difference is that, similar to a checking account, many money market accounts allow the customer to write checks on the account, though no more than three a month.
Nonbank online payment account
A payment service provided by a company that is not a bank. These services allow an individual to send and receive money online.
Online banking A method of accessing a bank account through a bank’s website to perform such actions as viewing account balances, transferring funds between accounts, or paying bills electronically
Savings account A bank account that allows only a limited number of payments, withdrawals, or transfers. Savings accounts pay interest on deposits at rates that are usually higher than rates on interest-bearing checking accounts. Examples include traditional savings accounts, money market savings accounts, Christmas Club accounts, and Coverdell or 529 education accounts.
Telephone banking A method by which a bank’s customers can access their accounts by calling a phone number that the bank has provided. Customers interact with the system by using voice commands, using the phone’s numeric keypad, or speaking with a customer service representative.

21
Definitions Table 2: Payment instruments
Concept Definition Bank account number payment (BANP)
A payment made by providing a bank account number to a third party, such as an employer or utility company. The number can be given on websites, paper forms, and more.
Cash Coins and paper bills Check A piece of paper directing a financial institution to pay a specific amount of money
to a person or business Credit card A card that allows the cardholder to make a purchase by borrowing funds that will
be paid back to the credit card company later Debit card A type of card that allows the holder to make purchases or payments by accessing
funds in a bank account. It also allows access to bank accounts through an ATM. Deduction from income Direct payments from income—for example, automatic deductions for an
employee’s portion of health insurance or for transportation expenses (applies only for automatic bill payments)
Money order A type of payment that can be purchased from a bank or other institution. This payment allows the individual named on the order to receive a specified amount of cash on demand.
Online banking bill payment (OBBP)
A payment made from a bank’s website or mobile app that accesses funds from a customer’s checking or savings account to pay a bill or to pay other people. This payment does not require the bank or the customer to disclose his or her bank account number to a third party.
Prepaid card A card that stores or records a dollar value. It is also known as a stored-value card or gift card. Some of these cards may have a Visa, MasterCard, Discover, or American Express logo on them, but they are not credit or debit cards. Some cards—for example, a phone card—are for specific types of payment, and others, like a NetSpend or Green Dot card, work for many types of payment. In addition, there are government-issued prepaid cards, such as an EBT, Direct Express, SNAP, or TANF cards. Most prepaid cards have a dollar value that can be used to make payments, which are deducted from the value stored on the card. Other types of prepaid cards, such as a monthly public transit pass, are valid for use over a specific period of time, rather than having the value of the payment deducted each time the card is used.
Traveler’s check A piece of paper that is similar to a check but works like cash and is protected against loss or theft. Traveler’s checks are purchased in advance and issued for a specific amount of money.

22
Definitions Table 3: Adoption
Concept Consumer Behavior That Defines Adoption ATM card* Has an ATM card Bank account Has at least one checking account or savings account Cash Has used cash to make a payment at least once in the past 12 months, holds cash (on
person or on property), gets cash on a regular basis, or uses cash in a typical year Cell phone Has a cell phone Check Has used a check to make a payment at least once in the past 12 months, currently
has blank checks, or uses checks in a typical year Checking account Has at least one checking account Credit card* Has a credit card Current adoption The percentage of consumers who own a bank account or have a payment
instrument and have not discarded it as of the time of the survey Debit card* Has a debit card
Discarding rate The difference between historical and current adoption or ownership rates. It measures the minimum percentage of consumers who owned a bank account or had a payment instrument but discarded it and thus do not own or have it now.
Bank account number payment (BANP)
Makes an electronic BANP in a typical year
Historical adoption The percentage of consumers who have ever owned a bank account or had a payment instrument at any time (currently or in the past)
Mobile banking Has a bank account and a cell phone, and has set up mobile banking Money order Has used a money order in the past 12 months Nonbank online payment account
Has at least one nonbank online payment account
Online banking bill payment* (OBBP)
Has a bank account, has set up online banking, and has set up access to the online bill payment function
Online banking* Has a bank account and has set up online banking Ownership Equivalent to adoption, but for bank accounts Prepaid card* Has a prepaid card of any type Savings account Has at least one savings account Smartphone Has a smartphone Telephone banking* Has a bank account and has set up telephone banking Traveler’s check Has used a traveler’s check in the past 12 months *In a small number of cases where respondents did not answer the direct-adoption question for this concept, additional information from other questions was used to infer adoption in a manner consistent with the primary definition.

23
Definitions Table 4: Payment use
Concept Consumer Behavior That Defines Use Frequency of use See Use. Incidence of use The percentage of consumers who have used a particular payment instrument
at least once during a typical period of time Incidence of use, annual The percentage of consumers who have used a particular payment instrument
at least once in a typical year Incidence of use, monthly The percentage of consumers who have used a particular payment instrument
at least once in a typical month Use The number of times consumers use a particular instrument for payment
during a typical month. (Use for a typical week or year was converted to a typical month for comparability.)
Typical period A recent week, month, or year in which the consumer did not experience any unusual payments or other related events. Consumers choose the reporting frequency they prefer most. The most recent period is implied and assumed but not stated explicitly in the survey questions.

24
Definitions Table 5: Transaction types
Concept Definition Automatic bill payment A bill payment set up to occur on a regularly scheduled basis, typically
monthly. Once set up, these do not require any additional effort on the consumer’s part. They can be processed through bank account deductions, debit card transactions, or credit card charges, or paid directly from the consumer’s income.
Bill payment A payment made to a company or person at some date after the company or person has provided goods or services to a consumer. Examples include a payment to a utility company for energy services provided during a month or a payment to service a loan such as a mortgage payment. Most bill payments occur at regular frequencies, such as weekly, monthly, or yearly.
By mail, in person, or by phone bill payment
Payments for bills, subscriptions, or debt payments that one mails in, pays in person, or calls in on one’s phone.
Online bill payment (OBP) Payments made online for bills, subscriptions, or debt payments, but not set up to be paid automatically
Online payment (OP) Payments for items bought over the internet or donations made online Person-to-person payment Payments to people not made through a retail establishment, such as
payments for allowances, paying back a friend, or presenting gifts to other people
Retail purchases of goods Purchases of goods at stores, such as grocery stores, superstores, department stores, or drug stores
Retail services and other payments Purchases of services, such as those made at restaurants, bars, fast food and beverage establishments, transportation and toll locations, or doctor’s visits, or for childcare, haircuts, education, recreation, or entertainment

25
Definitions Table 6: Payment instrument characteristics
Concept Definition Acceptance for payment How likely each payment method is to be ACCEPTED for payment by
stores, companies, online merchants, and other people or organizations Convenience The CONVENIENCE consumers attribute to each payment method
Examples: speed; record keeping; control over payment timing; ease of use; effort to carry, get, or set up; ability to keep or store
Cost The COST of using each payment method Examples: Raising the cost are fees, penalties, postage, interest paid or lost, subscriptions, or materials. Reducing the cost are cash discounts and rewards (such as frequent flyer miles).
Getting and setting up The task of GETTING and SETTING UP each payment method before a consumer can use it Examples: getting cash at the ATM, spending time to get or set up a credit card, learning to use or install online banking bill pay
Payment records The quality of PAYMENT RECORDS offered by each method of payment, as assessed by consumers, taking into consideration both paper and electronic records Examples: proof of purchase, account balances, spending history, usefulness in correcting errors or dispute resolution, and ease of storage
Security The SECURITY of each method against permanent financial loss or unwanted disclosure of personal information if a payment method is stolen, misused, or accessed without the owner’s permission

26
Definitions Table 7: Other terms and concepts
Concept Definition Contactless payment technology
Allows the consumer to make a payment by tapping or waving a card or other instrument near a special electronic reading device without the consumer swiping, signing, or entering a personal identification number
Cryptocurrency Cryptocurrency exists online and is different from U.S. dollars ($), the euro (€), or other official foreign currencies. Cryptocurrency is sometimes called virtual currency or digital currency.
Electronic toll payment A contactless payment technology that allows motor vehicle drivers to drive through a toll without stopping and have the toll automatically billed to them. Examples are EZ-Pass, I-Pass, Smart Lane, and Smart Tag. The payment can be made from a bank account or by credit card, and sometimes by other methods.
Identity theft or fraud All types of crime in which someone uses (or attempts to use) someone else's personal information or data without the owner's permission to purchase goods or services, make payments, steal money, set up accounts, or commit fraud. Examples of information used include name and address, social security number, credit card or debit card number, and other related financial information.
Key fob A contactless payment technology that attaches to a key chain. Key fobs are branded by gas stations and credit card companies such as American Express, Visa, and MasterCard. An example is the Mobil Speedpass.
Overdraft protection A service that a bank provides when a customer makes a transaction that exceeds his or her account balance. It covers the difference between the transaction amount and the account balance and enables the customer to avoid incurring a fee from the retailer or merchant for having insufficient funds. Overdraft protection can be activated by linking a savings account or credit card to a checking account, or through overdraft insurance, for instance.
Overdraft Withdrawal of more money from a bank account than is currently in the account (also termed "insufficient funds"). Overdraft may occur, for example, when paying with a check, debit card, or electronic deduction.
Paid directly from income A payment made for a consumer by an employer or other income provider directly from the consumer’s wages, salary, or other income payment such as interest, dividends, social security payments, retirement plan distributions, alimony, child support, welfare, trust fund distributions, or other money received
Reward Any type of benefit given to payment cardholders when they use their card to make purchases and other payments. A reward is usually proportional to the dollar value of the purchase or payment. Examples include cash back (a percentage of the dollar value), frequent flyer miles (airlines), frequent stay points (lodging), college tuition funding, and shopping network points.
Unbanked A person who does not have any checking or savings accounts at a bank, credit union, brokerage, or investment firm
Underbanked Following the FDIC definition, a person who has a checking or savings account and who has purchased any of five services from a nonbank in the past 12 months (money order, cashier’s checks, check cashing, remittances, and payday loans) or who has used personal property to secure a loan at a pawn shop, used rent-to-own services, or taken out a tax refund anticipation loan

27
References
Angrisani, Marco, Kevin Foster, and Marcin Hitczenko. 2017. “The 2015 Survey of Consumer Payment Choice: Technical Appendix.” Federal Reserve Bank of Atlanta Research Data Report 17–4. https://www.frbatlanta.org/banking-and-payments/consumer-payments/research-data-reports/2017/the-2015-survey-of-consumer-payment-choice-technical-appendix.aspx.
Angrisani, Marco, Kevin Foster, Marcin Hitczenko, and Brian Prescott. Forthcoming. “The Survey and Diary of Consumer Payment Choice: Technical Appendix.” Federal Reserve Bank of Atlanta Research Data Report.
Briglevics, Tamás, and Oz Shy. 2012. “Why Don't Most Merchants Use Price Discounts to Steer Consumer Payment Choice?” Federal Reserve Bank of Boston Research Department Public Policy Discussion Papers, no. 12-9. https://www.bostonfed.org/publications/public-policy-discussion-paper/2012/why-dont-most-merchants-use-price-discounts-to-steer-consumer-payment-choice.aspx.
Connolly, Sean, and Joanna Stavins. 2015. “Payment Instrument Adoption and Use in the United States, 2009–2013, by Consumers’ Demographic Characteristics.” Federal Reserve Bank of Boston Research Data Reports, no. 15-6. https://www.bostonfed.org/publications/research-data-report/2015/payment-instrument-adoption-and-use-in-the-united-states-20092013-by-consumers-demographic-characteristics.aspx.
Foster, Kevin, Claire Greene, and Joanna Stavins. 2019. “2018 Survey of Consumer Payment Choice.” Federal Reserve Bank of Atlanta Research Data Report 19-02. https://www.frbatlanta.org/banking-and-payments/consumer-payments/survey-of-consumer-payment-choice/2018-survey.aspx.
Foster, Kevin, Erik Meijer, Scott Schuh, and Michael A. Zabek. 2009. “The 2008 Survey of Consumer Payment Choice.” Federal Reserve Bank of Boston Research Department Public Policy Discussion Papers, no. 9-10. https://www.bostonfed.org/publications/public-policy-discussion-paper/2009/the-2008-survey-of-consumer-payment-choice.aspx.
Foster, Kevin, Erik Meijer, Scott Schuh, and Michael A. Zabek. 2011. “The 2009 Survey of Consumer Payment Choice.” Federal Reserve Bank of Boston Research Department Public Policy Discussion Papers, no. 11-1. https://www.bostonfed.org/publications/public-policy-discussion-paper/2011/the-2009-survey-of-consumer-payment-choice.aspx.
Foster, Kevin, Scott Schuh, and Hanbing Zhang. 2013. “The 2010 Survey of Consumer Payment Choice.” Federal Reserve Bank of Boston Research Data Reports, no. 13-2. https://www.bostonfed.org/publications/research-data-report/2013/the-2010-survey-of-consumer-payment-choice.aspx.
Greene, Claire, Shaun O’Brien, and Scott Schuh. 2017. “U.S. Consumer Cash Use, 2012 and 2015: An Introduction to the Diary of Consumer Payment Choice.” Federal Reserve Bank of Boston Research Data Reports, no. 17-6. https://www.frbatlanta.org/banking-and-payments/consumer-payments/research-data-reports/2017/us-consumer-cash-use-2012-and-2015.aspx.
Greene, Claire, and Scott Schuh. 2017. “The 2016 Diary of Consumer Payment Choice.” Federal Reserve Bank of Boston Research Data Reports, no. 17-7. https://www.frbatlanta.org/banking-and-

28
payments/consumer-payments/research-data-reports/2017/the-2016-diary-of-consumer-payment-choice.aspx.
Greene, Claire, Scott Schuh, and Joanna Stavins. 2016. “The 2014 Survey of Consumer Payment Choice: Summary Results.” Federal Reserve Bank of Boston Research Data Reports, no. 16-3. https://www.frbatlanta.org/banking-and-payments/consumer-payments/research-data-reports/2016/2014-survey-of-consumer-payment-choice-summary-results.aspx.
Greene, Claire, Scott Schuh, and Joanna Stavins. 2017. “The 2015 Survey of Consumer Payment Choice: Summary Results.” Federal Reserve Bank of Boston Research Data Reports, no. 17-3. https://www.frbatlanta.org/banking-and-payments/consumer-payments/research-data-reports/2017/the-2015-survey-of-consumer-payment-choice-summary-results.aspx.
Greene, Claire, and Joanna Stavins. 2018a. “The 2017 Diary of Consumer Payment Choice.” Federal Reserve Bank of Atlanta Research Data Reports, no. 18-5. https://www.frbatlanta.org/banking-and-payments/consumer-payments/research-data-reports/2018/the-2017-diary-of-consumer-payment-choice.aspx.
Greene, Claire, and Joanna Stavins. 2018b. “The 2016 and 2017 Surveys of Consumer Payment Choice: Summary Results.” Federal Reserve Bank of Atlanta Research Data Reports, no. 18-3. https://www.frbatlanta.org/banking-and-payments/consumer-payments/research-data-reports/2018/the-2016-and-2017-surveys-of-consumer-payment-choice-summary-results.aspx.
Greene, Claire, and Joanna Stavins. 2019. “The 2018 Diary of Consumer Payment Choice.” Federal Reserve Bank of Atlanta Research Data Report 29-03. https://www.frbatlanta.org/-/media/documents/banking/consumer-payments/diary-of-consumer-payment-choice/2018/2018-diary-of-consumer-payment-choice.pdf.
Greene, Claire and Joanna Stavins. Forthcoming. “Consumer Payment Choice for Bill Payments.” Federal Reserve Bank of Boston Working Paper.
Koulayev, Sergei, Marc Rysman, Scott Schuh, and Joanna Stavins. 2016. “Explaining Adoption and Use of Payment Instruments by U.S. Consumers.” RAND Journal of Economics, Vol. 47, No. 2, Summer, pp. 293–325.
Schuh, Scott, and Joanna Stavins. 2014. “The 2011 and 2012 Surveys of Consumer Payment Choice: Summary Results.” Federal Reserve Bank of Boston Research Data Reports, no. 14-1. https://www.frbatlanta.org/banking-and-payments/consumer-payments/research-data-reports/2014/the-2011-and-2012-surveys-of-consumer-payment-choice.aspx.
Schuh, Scott, and Joanna Stavins. 2015. “The 2013 Survey of Consumer Payment Choice: Summary Results.” Federal Reserve Bank of Boston Research Data Reports, no. 15-4. https://www.frbatlanta.org/banking-and-payments/consumer-payments/research-data-reports/2015/the-2013-survey-of-consumer-payment-choice-summary-results.aspx.
Schuh, Scott. 2017. “Measuring Consumer Expenditures with Payment Diaries.” Federal Reserve Bank of Boston Research Department Working Papers, no. 17-2. https://www.bostonfed.org/publications/research-department-working-paper/2017/measuring-consumer-expenditures-with-payment-diaries.aspx.

29
Shy, Oz. 2013. “How Many Cards Do You Use?” Federal Reserve Bank of Boston Research Department Working Papers, no. 13-13. https://www.bostonfed.org/publications/research-department-working-paper/2013/how-many-cards-do-you-use.aspx.
Shy, Oz, and Joanna Stavins. 2014. “Merchant Steering of Consumer Payment Choice: Evidence from a 2012 Diary Survey.” Federal Reserve Bank of Boston Research Department Working Papers, no. 14-1. https://www.bostonfed.org/publications/research-department-working-paper/2014/merchant-steering-of-consumer-payment-choice-evidence-from-a-2012-diary-survey.aspx.

30
2015–2016–2017–2018 SCPC Tables