Embed Size (px)
Citation preview

AMERICAN JOURNAL OF PHYSICAL ANTHROPOLOGY 74231-238 (1987)
The Age-Sex Structure of the Slave Population in Harris County, Texas: 1850 and 1860
JANIS HUTCHINSON Department of Anthropology, University of Houston - University Park, Houstoh Texas 77004
KEY WORDS Yellow fever, Malaria
African, Caucasian, Mulatto, Slave, Mortality,
ABSTRACT The effect of the slave system on demography can be revealed by examining the age-sex structure of slave populations. The age-sex struc- ture of slaves in Harris County, Texas is investigated using the 1850 and 1860 slave schedules. Median ages for black and mulatto slaves suggest that the population was young. Population pyramids exhibit a narrow base and top with a broad middle. The high proportion of slaves between 10 and 30 years of age and the increase in population size between 1850 and 1860 were mainly related to the importation of slaves and only partly due to natural increase. The data also show that black slaves were older on small plantations while mulattoes were older on larger farms. It is suggested that differential treat- ment in terms of purchase practices, assignment of tasks, food allocation, and/ or differential susceptibility to infectious diseases may account for this pattern.
The system of slavery had an enormous impact on the demography of the African population in the United States. This system determined the distribution and numbers of Africans in the United States and in so doing affected fertility, mortality, morbidity, and longevity. In turn, these factors shaped the ability of Africans to adapt to the "New World" environment. This was an environ- ment which included not only the surround- ing physical environment, but also the cultural environment-the system of slavery. Factors controlled by this system which af- fected the demography of slaves have been examined in the eastern United States and the Caribbean, however studies on slavery in western states is limited (Evans, 1962; Vi- novskis, 1972). The present study provides information on the age-sex structure of a slave population in the West, in the State of Texas, and suggests how the system of slav- ery influenced the demography of this slave population. The age-sex structure and changing trends in this structure may pro- vide some indication of adaptation in Ameri- can slave populations.
The effect of slavery on the demographic structure of a slave population can be re- vealed by examining mortality, life expec-
tancy, and the age-sex structure. Mortality among blacks between 1840 and 1870 was high (Fogel et al., 1978). The crude death rate for blacks, between 1850 and 1860 in the U.S., was 25 to 30 per 1,000, while the rate for whites was below 25 per 1,000 (Steckel, 1977). In 1850, the average age of a slave at death in the U.S. was 21.4 years while for whites it was 25.5 years (Stampp, 1956). Us- ing plantation records, Steckel (1986) re- ported a post-neonatal infant mortality rate of 162 per 1,000. After the age of 6 years, slave mortality rates declined sharply to ten per 1,000 (Steckel, 1986).
The average life expectancy of slaves has also been investigated. For example, Vinov- skis (1972) calculated the life expectancy of slaves in Massachusetts using the 1859-61 registration data. He estimated an expecta- tion of life at birth of 46.4 years for males and 47.3 years for female slaves. Evans (1962) computed a life expectancy at birth of 35.5 and 38.1 years for males and females, respec- tively. Estimates of life expectancy at birth by Farley (1970) are lower, 27.8 years for females; after the age of 5, life expectancy was 41.9 years. Meech (1898) found an in-
Received October 6,1986; revision accepted May 26,1987
0 1987 ALAN R. LISS, INC.
232 J. HUTCHINSON
crease in life expectancy at birth for U.S. whites between 1830-1860 from 41.0 to 49.3 years for males and from 42.9 to 52.5 years for females. White males during this period had a life expectancy at birth of 40.4 years, 12% above slave life expectancy Fogel and Engerman, 1974). When a slave reached the age of 20 years, Syndor (1930) estimated a life expectancy of 22.3 years. Conrad and Meyer (1958) also calculated a life expec- tancy at age 20 of 30 to 35 years.
It should be stated that the accuracy of some of these estimates have been ques- tioned. For example, the calculations by Ev- ans (1962) were based upon the length of life for whites in 1850 that were calculated by Jacobson (1957). Estimates based upon the 1850 census are questionable because of the underreporting of deaths and because it is based on the experience of only one year. That year may have been atypical and would give a distorted picture of conditions in the United States (Vinovskis, 1972). Farley (1970) used a census-survival procedure to calcu- late life expectancy which uses the same group of individuals at two time periods. His estimates are lower than the others and may provide a more accurate picture of longevity among slaves. In addition, areal variation may have contributed to differences in these estimates.
Aged slaves were not common. According to Stampp (1956), only 3.5% of the slaves and 4.4% of the whites in the United States were over the age of 60 in 1860. Aged slaves per- formed functions similar to those of the eld- ers in African societies (Herskovits, 1941; Shelton, 1965; Genovese, 1974). For instance, among the lbo of West Africa, elders provide spiritual leadership, are lawgivers, negotiate marriages, teach customs, and are advisors (Shelton, 1965). These functions continued into slavery in the United States where el- ders were the storytellers, the advisors, and the historians; where they named slave chil- dren; and where they socialized youths into the norms of slavery (Stampp, 1956; Gutman, 1976; Pollard, 1981).
While age earned slaves respect, it also jeopardized the slaves’ existence in a system that valued only individuals’ productive ca- pacity (Pollard, 1981). Fogel and Engerman (1974) stated that aging was not a problem for slaves because of the agricultural nature of slavery. They believe that when slaves became aged their occupations were changed to allow for their diminished capacities. How-
ever, Genovese (1974) noted that behavior toward the aged ran from cruelty to kindness and security. Frederick Douglass, a states- man and former slave, stated that: “If any one thing in my experience more than an- other served to deepen my conviction of the infernal character of slavery and to fill me with unutterable loathing of slaveholders, it was their base ingratitude to my poor old grandmother” (Douglass, 1968).
The ensuing study examines the demogra- phy of a slave population by investigating the age-sex structure of slaves in Harris County, Texas in 1850 and 1860.
THE DATA
Materials for this investigation come from the Seventh and Eighth Censuses, 1850 and 1860, currently housed at the Barker Library in Austin, Texas. These schedules provide information on the name of the slaveholder, number of slaves per farm, and for slaves, their age, sex, and color. Names of the slaves, their occupations, and their marital statuses are absent. Color is designated as black or mulatto. A mulatto is defined as a person of mixed African and Caucasian ancestry while a black is an individual whose ancestors pre- sumably were all of African origin. It should be stated, however, that these designations may have differed in early historic times and were probably not 100% accurate. For exam- ple, some individuals may have had a Cau- casian ancestor in the past but were categorized as black. Also, ages for slaves may be estimates, although a tendency for even numbers or 5-year periods was not evi- dent in the data. In addition, the number of slaves per farm may have been underre- ported for tax purposes. Therefore it should be noted that an undeterminable error ele- ment is present in the data.
RESULTS
Table 1 provides the number of slaves by sex and color for 1850 and 1860 in Harris County, Texas. The Seventh Census records 513 slaves in Harris County for 1850. Three pages were partially torn out of the slave schedule and it is estimated that 20.8% of the data could not be recorded. Texas became a slave importing state in 1850, at which time the Seventh Census recorded 58,161 slaves in the state. The vast majority of slaves in Texas at this time were imported from other states (Bancroft, 1967).

SLAVES IN HARRIS COUNTY, TEXAS 233
The 1860 schedule was complete and re- corded 2,066 slaves in Harris County. The increase in population size between 1850 and 1860 was probably due to natural increase and the importation of slaves from other areas in the United States. The U.S. became a leading slave power in the Western Hemi- sphere because of the natural increase of the slave population (Fogel and Engerman, 1974; Gibbs et al., 1980). However the state of Texas based its economy on a labor force that was imported from other states in the south.
Table 2 gives the median and mean ages of slaves by sex and color. For both time periods blacks (males and females) are older on av- erage than mulattoes. Student's t test, how- ever, did not demonstrate a significant statistical difference between mean ages for blacks and mulattoes. All of the median ages, except €or black males in 1860, are 20 years or younger indicating a young population similar to Syrian (17.2 years) and Honduran (16.1 years) populations in 1960. Median ages between 20 and 30 years are intermediate and over 30 years signifies an old population (Shryock et al., 1976). The median age for black males in 1860 was 22.5 years which is intermediate, like Chile (23.3 years) in 1960 (Shryock et al., 1976). In 1850 and 1860 the median age for male slaves in the U.S. was 17 years; for female slaves the median age dropped from 17.4 to 17.2 years (Jackson, 1980). The median ages for these populations indicate that the average slave was young.
TABLE 1. Number of slave8 by sex and color
1850 1860
Males Black 169 Mulatto 55 Total 224
Black 225 Mulatto 64
Females
855 171
1,026
84 1 199
Total 289 1,040 Grand Total 513 (620)' 2,066
'Missing data included
Demographic structure can also be re- vealed by examining the proportion of indi- viduals under 15 years and over 65 years of age. In 1850,41.7% of the slave population in Harris County were under 15 years (under 30% is an old population and over 40% is young). This value also suggests a young pop- ulation similar to India (41.0%), Syria (46.3%), and Honduras (47.8%) in 1960. For 1860, 35.3% of the slaves were under 15 years. This population is intermediate and is similar to the U.S.S.R. (30.4%) and Chile (39.6%) in 1960 (Shryock et al., 1976). Ap- proximately 0.8% of the slaves in Harris County were over the age of 65. In the United States, at this time, 3.5% of the slaves and 4.4% of the whites were over 60 years (Stampp, 1956).
The following figure illustrates the age- sex distribution for black slaves in Harris County, Texas in 1850 (Fig. 1). The figure exhibits a narrow base and top and shows that the majority of slaves were between 6 and 30 years of age; the largest age cohort is the 21-30 year age groups.
The figure for mulattoes is similar (Fig. 2). It exhibits a narrow base with the majority of slaves between 2 and 30 years old. The largest age cohort is the 11-20 year age cat- egory. The broad middle in both figures sug- gest that the majority of slaves were pro- ducers and not dependents. Bancroft (1967) states that most imported slaves were of re- productive age (this is discussed further in the conclusions). While the total population size for males and females shows almost a one-to-one sex ratio, the population pyramids illustrate the existence of slightly more fe- males for almost every age category.
The 1860 census for blacks in Harris County also exhibits a narrow base and top with a broad middle (Fig. 3). The majority of individuals are between the ages of 11 and 40 years and the largest age cohort is the 21- 30 year age group for males and the 11-20 year age cohort for females.
TABLE 2. Median and mean ages of slaves bv sex and color
1850 1860 Median Mean SD Median Mean SD
Males Black 20.00 22.70 16.86 22.00 23.36 15.45 Mulatto 14.00 16.49 12.33 16.00 17.89 12.59
Black 20.00 22.66 16.07 20.00 22.87 16.21 Females
Mulatto 16.00 17.05 13.73 20.00 20.75 15.13

234 J. HUTCHINSON
BLACK MALES l*so BLACK FEMALES
91-100
71- 8 0 61- 70
ai - go
_ . .. &I 51- 80 $ 41- 50
31- 40 21- 30 11- 20 8- 10 2- 5
4 1
Fig. 1. The age-sex distribution of black slaves in Harris County, 1850.
1850 MULATTO MALES MULATTO FEMALES
91-100 81- 90
61- 70 W 51- 80 a < 41- 50
31- 4 0
71- ao
20 15 10 5 0 5 10 15 20
Fig. 2. The age-sex distribution of mulatto slaves in Harris County, 1850.
TABLE 3. Proportion of slaves under 30 years old
1850 1860
Males Black Mulatto
74.5 85.4
72.0 85.4
Females Black 73.1 71.1 Mulatto 86.0 78.0
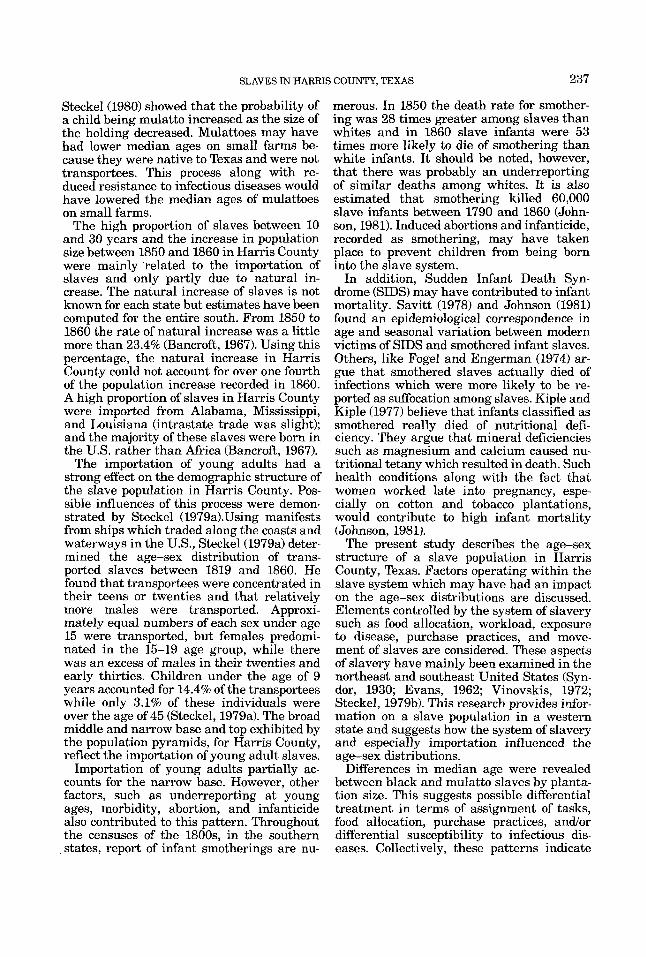
The 1860 population pyramid for mulattoes also has a broad middle (Fig. 4). Most individ- uals are between the ages of 2 and 30 years of age; the largest age cohort is the 11-20 year age category. The 1860 slave schedules indicate that the sexes are more evenly dis- tributed throughout the age cohorts. Only two individuals were 100 years of age, both were females, one black and one mulatto.
Table 3 shows that the majority of slaves for both time periods were under the age of 30 years. Over 70% of the slave population were under the age of 30 years and more mulattoes than blacks were under 30 years of age.
The proportion of slaves over thirty years was much smaller (Table 4). Slaves in their thirties in 1850 and 1860 comprised approxi- mately 11% of the population in the United States and Texas (Jackson, 1980). In Harris County, during these periods, they made up 13.2 and 15.7% of the slave population re- spectively. The proportion of slaves over thirty decreases with each increment in age cohort in Harris County and in the state of Texas.
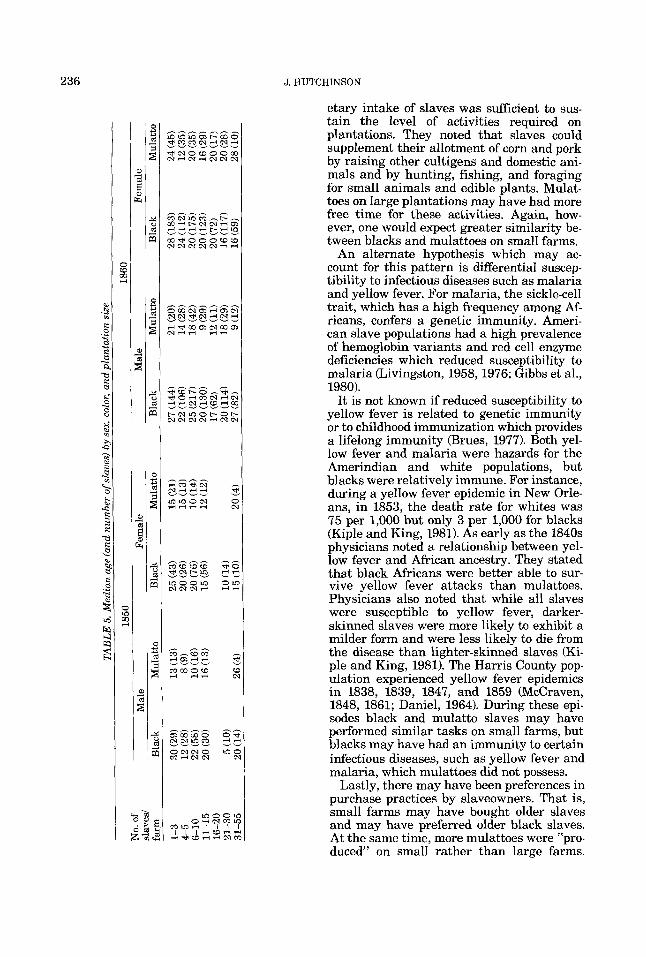
The age structure of slaves was also exam- ined by plantation size. Plantation sizes were grouped into categories because careful pe- rusal of the slave schedules showed that farm size clustered around certain groupings (Ta- ble 5). Here, an attempt is made to determine whether the demographic structure is influ- enced by the socioeconomics of various types of plantations. Large and small plantations differ in terms of the workload of slaves and nutritional and disease factors. The average number of slaves per farm in 1850 was 4.17 and in 1860 there were 7.7 slaves per farm among the slave-holding plantations.
Table 5 provides the median age and num- ber of slaves by sex, color, and plantation size for 1850 and 1860. In 1850, the median age for black slaves was oldest on small farms of one to three slaves. In contrast, for mulat- toes, the oldest slaves lived on large planta- tions of 31-55 slaves. This was true for males and females in 1850.
The 1860 data presents a different pattern for males (Table 5). The median age for black male slaves is 27 years on large and small farms. Mulatto males exhibit the oldest me- dian age on small farms. Females present a different pattern with black slaves possess- ing the oldest median age on the smallest farms while mulatto slaves are oldest on the largest farms. The median ages demonstrate a young to intermediate population for all of the plantation size cohorts.
DISCUSSION AND CONCLUSIONS
The age structure on large vs. small farms may be related to differential assignment of tasks. At age 5 or 6 slaves performed small tasks such as waiting on the mistress and running errands and at age 15 or earlier they
SLAVES IN HARRIS COUNTY, TEXAS 235
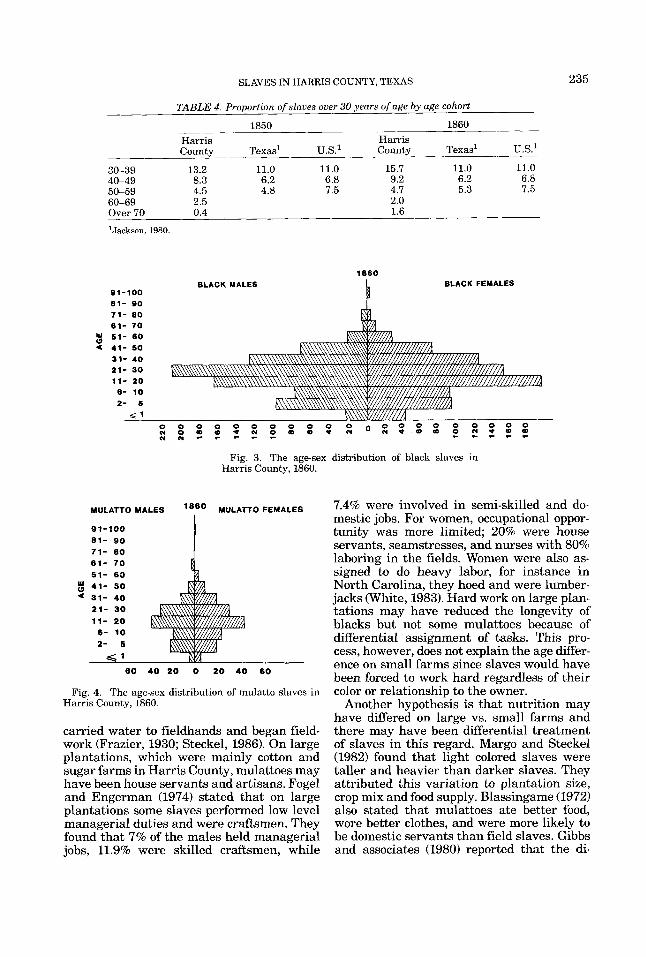
TABLE 4. Proportion of slaves over 30 years of age by age cohort
1850 1860 Harris Harris County Texas' U.S.' County Texas' U.S.'
30-39 13.2 11.0 11.0 15.7 11.0 11.0
50-59 4.5 4.8 7.5 4.7 5.3 7.5 60-69 2.5 2.0
40-49 8.3 6.2 6.8 9.2 6.2 6.8
Over 70 0.4 1.6
'Jackson, 1980.
91-100 81- 90 71- 80 61- 7 0
$ 51- 60 * 41- 50
91- 40 21- 30 11- 20 6- 10 2- 6
C 1 __
BLACK MALES 1860
BLACK FEMALES
Fig. 3. The age-sex distribution of black slaves in Harris County, 1860.
wuurro MALES la60 w u L A r r o FEMALES
i 91-100 81- 90 71- 80 61- 7 0 51- 60
$ 41- 50 31- 40 21- 30 11- 20
8- 10 2- 5 <l
60 40 20 0 20 40 60
Fig. 4. The age-sex distribution of mulatto slaves in Harris County, 1860.
carried water to fieldhands and began field- work (Frazier, 1930; Steckel, 1986). On large plantations, which were mainly cotton and sugar farms in Harris County, mulattoes may have been house servants and artisans. Fogel and Engerman (1974) stated that on large plantations some slaves performed low level managerial duties and were craftsmen. They found that 7% of the males held managerial jobs, 11.9% were skilled craftsmen, while
7.4% were involved in semi-skilled and do- mestic jobs. For women, occupational oppor- tunity was more limited; 20% were house servants, seamstresses, and nurses with 80% laboring in the fields. Women were also as- signed to do heavy labor, for instance in North Carolina, they hoed and were lumber- jacks (White, 1983). Hard work on large plan- tations may have reduced the longevity of blacks but not some mulattoes because of differential assignment of tasks. This pro- cess, however, does not explain the age differ- ence on small farms since slaves would have been forced to work hard regardless of their color or relationship to the owner.
Another hypothesis is that nutrition may have differed on large vs. small farms and there may have been differential treatment of slaves in this regard. Margo and Steckel (1982) found that light colored slaves were taller and heavier than darker slaves. They attributed this variation to plantation size, crop mix and food supply. Blassingame (1972) also stated that mulattoes ate better food, wore better clothes, and were more likely to be domestic servants than field slaves. Gibbs and associates (1980) reported that the di-
J. HUTCHINSON
etary intake of slaves was sufficient to sus- tain the level of activities required on plantations. They noted that slaves could supplement their allotment of corn and pork by raising other cultigens and domestic ani- mals and by hunting, fishing, and foraging for small animals and edible plants. Mulat- toes on large plantations may have had more free time for these activities. Again, how- ever, one would expect greater similarity be- tween blacks and mulattoes on small farms.
An alternate hypothesis which may ac- count for this pattern is differential suscep- tibility to infectious diseases such as malaria and yellow fever. For malaria, the sickle-cell trait, which has a high frequency among Af- ricans, confers a genetic immunity. Ameri- can slave populations had a high prevalence of hemoglobin variants and red cell enzyme deficiencies which reduced susceptibility to malaria (Livingston, 1958,1976; Gibbs et al., 1980).
It is not known if reduced susceptibility to yellow fever is related to genetic immunity or to childhood immunization which provides a lifelong immunity (Brues, 1977). Both yel- low fever and malaria were hazards for the Amerindian and white populations, but blacks were relatively immune. For instance, during a yellow fever epidemic in New Orle- ans, in 1853, the death rate for whites was 75 per 1,000 but only 3 per 1,000 for blacks (Kiple and King, 1981). As early as the 1840s physicians noted a relationship between yel- low fever and African ancestry. They stated that black Africans were better able to sur- vive yellow fever attacks than mulattoes. Physicians also noted that while all slaves were susceptible to yellow fever, darker- skinned slaves were more likely to exhibit a milder form and were less likely to die from the disease than lighter-skinned slaves (Ki- ple and King, 1981). The Harris County pop- ulation experienced yellow fever epidemics in 1838, 1839, 1847, and 1859 (McCraven, 1848, 1861; Daniel, 1964). During these epi- sodes black and mulatto slaves may have performed similar tasks on small farms, but blacks may have had an immunity to certain infectious diseases, such as yellow fever and malaria, which mulattoes did not possess.
Lastly, there may have been preferences in purchase practices by slaveowners. That is, small farms may have bought older slaves and may have preferred older black slaves. At the same time, more mulattoes were “pro- duced” on small rather than large farms.
SLAVES IN HARRIS COUNTY, TEXAS 237
Steckel(l980) showed that the probability of a child being mulatto increased as the size of the holding decreased. Mulattoes may have had lower median ages on small farms be- cause they were native to Texas and were not transportees. This process along with re- duced resistance to infectious diseases would have lowered the median ages of mulattoes on small farms.
The high proportion of slaves between 10 and 30 years and the increase in population size between 1850 and 1860 in Harris County were mainly related to the importation of slaves and only partly due to natural in- crease. The natural increase of slaves is not known for each state but estimates have been computed for the entire south. From 1850 to 1860 the rate of natural increase was a little more than 23.4% (Bancroft, 1967). Using this percentage, the natural increase in Harris County could not account for over one fourth of the population increase recorded in 1860. A high proportion of slaves in Harris County were imported from Alabama, Mississippi, and Louisiana (intrastate trade was slight); and the majority of these slaves were born in the U.S. rather than Africa (Bancroft, 1967).
The importation of young adults had a strong effect on the demographic structure of the slave population in Harris County. Pos- sible influences of this process were demon- strated by Steckel (1979a).Using manifests from ships which traded along the coasts and waterways in the US., Steckel(1979a) deter- mined the age-sex distribution of trans- ported slaves between 1819 and 1860. He found that transportees were concentrated in their teens or twenties and that relatively more males were transported. Approxi- mately equal numbers of each sex under age 15 were transported, but females predomi- nated in the 15-19 age group, while there was an excess of males in their twenties and early thirties. Children under the age of 9 years accounted for 14.4% of the transportees while only 3.1% of these individuals were over the age of 45 (Steckel, 1979a). The broad middle and narrow base and top exhibited by the population pyramids, for Harris County, reflect the importation of young adult slaves.
Importation of young adults partially ac- counts for the narrow base. However, other factors, such as underreporting at young ages, morbidity, abortion, and infanticide also contributed to this pattern. Throughout the censuses of the 1800s, in the southern states, report of infant smotherings are nu-
merous. In 1850 the death rate for smother- ing was 28 times greater among slaves than whites and in 1860 slave infants were 53 times more likely to die of smothering than white infants. It should be noted, however, that there was probably an underreporting of similar deaths among whites. It is also estimated that smothering killed 60,000 slave infants between 1790 and 1860 (John- son, 1981). Induced abortions and infanticide, recorded as smothering, may have taken place to prevent children from being born into the slave system.
In addition, Sudden Infant Death Syn- drome (SIDS) may have contributed to infant mortality. Savitt (1978) and Johnson (1981) found an epidemiological correspondence in age and seasonal variation between modern victims of SIDS and smothered infant slaves. Others, like Fogel and Engerman (1974) ar- gue that smothered slaves actually died of infections which were more likely to be re- ported as suffocation among slaves. Kiple and Kiple (1977) believe that infants classified as smothered really died of nutritional defi- ciency. They argue that mineral deficiencies such as magnesium and calcium caused nu- tritional tetany which resulted in death. Such health conditions along with the fact that women worked late into pregnancy, espe- cially on cotton and tobacco plantations, would contribute t o high infant mortality (Johnson, 1981).
The present study describes the age-sex structure of a slave population in Harris County, Texas. Factors operating within the slave system which may have had an impact on the age-sex distributions are discussed. Elements controlled by the system of slavery such as food allocation, workload, exposure to disease, purchase practices, and move- ment of slaves are considered. These aspects of slavery have mainly been examined in the northeast and southeast United States (Syn- dor, 1930; Evans, 1962; Vinovskis, 1972; Steckel, 197913). This research provides infor- mation on a slave population in a western state and suggests how the system of slavery and especially importation influenced the age-sex distributions.
Differences in median age were revealed between black and mulatto slaves by planta- tion size. This suggests possible differential treatment in terms of assignment of tasks, food allocation, purchase practices, andor differential susceptibility to infectious dis- eases. Collectively, these patterns indicate

238 J. HUTCHINSON
that through replacement in importing states, black populations had a stable demo- graphic structure. Enormous population movement during this period meant that any adaptations which occurred took place within an age-sex structure that was continually replenished with individuals of reproductive age.
Future research should continue to exam- ine the treatment of slaves on large vs. small plantations. An examination of slave occu- pation, farm production, and nutrition is nec- essary within the framework of differential treatment of slaves. While census data have often been used to reveal the condition of slaves, other researchers have examined the skeletal remains and ethnohistory of slaves and free black populations (Blakey, 1985; Rathbun, 1985; Kelly and Angel, 1985; Rose, 1985). Census data can augment these types of investigations. Such research can provide further information on the demography, health status, and epidemiology of diseases among slaves, free blacks, and other ethnic groups which may shed light on the etiology of diseases in contemporary populations.
LITERATURE CITED
Bancroft, F (1967) Slave Trading in the Old South. New York Frederick Ungar Publishing Company.
Blakey, ML (1985) Social policy, economics and demo- graphic change in Nanticoke-Moor ethnohistory. Pre- sented at the Annual Meeting of the American Association of Physical Anthropologists in Knoxville, Tennesse.
Blassingame, JW (1972) The Slave Community. Oxford: Oxford University Press.
Brues, AM (1977) People and Races. New York: Mac- Millan Publishing.
Conrad, AH, and Meyer, JR (1958) The economics of slavery in the ante-bellum south. J . Pol. Econ. 66:95- 130.
Daniel, AP (1964) Texas Avenue at Main Street. Hous- ton: Allen Press.
Douglass, F (1968) Narrative of the Life of Frederick Douglass, an American Slave. New York: New Ameri- can Library.
Evans, R, Jr. (1962) The economics of American Negro slavery. In Universities-National Bureau for Economic Research (ed): Aspects of Labor Economics. Princeton: Princeton University Press, pp. 184-256.
Farley, R (1970) Growth of the Black Population: A Study of Demographic Trends. Chicago: Markham Press.
Fogel, RW, and Engerman, SL (1974) Time on the Cross: The Economics of American Negro Slavery. Boston: Little, Brown and Company.
Fogel, RW, Engerman, SL, Trussell, J, Floud, R, Pope, CL, and Wimmer, LT (1978) The economics of mortality in North America, 1650-1910: a description of a re- search project. Hist. Meth. 11(2):75-108.
Frazier, EF (1930) The Negro slave family. J . Negro Hist. 15(2):198-259.
Genovese, ED (1974) Roll, Jordan, Roll: The World the Slaves Made. New York: Pantheon Books.
Gibbs, T, Cargill, K, Lieberman, LS, and Reitz, E (1980) Nutrition in a slave population: an anthropological examination. Med. Anthropol. 4:175-262.
Gutman, H (1976) Black Family in Slavery and Free-
dom, 1750-1925. New York: Pantheon Books. Herskovits, MJ (1941) The Myth of the Negro Past. New
York: Harper and Brothers. Jackson, S (1980) Slavery in Houston: the 1850s. The
Houston Review 2(2):66-82. Jacobson, PH (1957) An estimate of the expectation of
life in the United States in 1850. Milbank Mem. Fund Quart. 35197-201.
Johnson, MP (1981) Smothered slave infants: were slave mothers at fault? J. Southern Hist. 47:493-520.
Kelly, JO, and Angel, JL (1985) Stress of slavery, colon- ial period. Presented at the Annual Meeting of the American Association of Physical Anthropologists in Knoxville, Tennessee.
Kiple, KF, and King, VH (1981) Another Dimension to the Black Diaspora: Diet, Disease, and Racism. New York: Cambridge University Press.
Kiple, KF, and Kiple, V (1977) Slave child mortality: some nutritional answers to a perennial puzzle. J . So- cial Hist. 10:284-309.
Livingstone, FB (1958) Anthropological implications of sickle cell gene distribution in West Africa. Am. An- thropol. 60533-562.
Livingstone, FB (1976) Hemoglobin history in West Af- rica. Hum. Biol. 48:487-500.
Margo, RA, and Steckel, RH (1982) The heights of Amer- ican slaves: new evidence on slave nutrition and health. Social Science Hist. 6.516-538.
McCraven, W (1848) On the yellow fever of Houston, Texas in 1847. New Orleans Med. and Surg. J. 5227- 235.
McCraven, W (1861) Academics of yellow fever for 1859. New Orleans Med. News and Hosp. Gazette 7:105-110.
Meech, LW (1898) Systems and Tables of Life Insurance. New York: The Spectator Company.
Pollard, L J (1981) Aging and slavery: a gerontological perspective. J. Negro Hist. 66228-234.
Rathbun, TA (1985) Health and disease at a South Caro- lina plantation: 1840-1870. Presented a t the Annual Meeting of the American Association of Physical An- thropologists in Knoxville, Tennesse.
Rose, JC (1985) Gone to a Better Land A Biohistory of a Rural Black Cemetery in the Post-Reconstruction South. Arkansas Archeological Survey, Research Se- ries No. 25.
Savitt, TL (1978) Medicine and Slavery: The Diseases and Health Care of Blacks in Antebellum Virginia. Urbana: University of Illinois Press.
Shelton, AJ (1965) Ibo aging and eldership: notes for gerontologists and others. Gerontologist 5(1):20-23.
Shrycok, HS, Siegel, JS, et al. (1976) The Methods and Materials of Demography. New York Academic Press.
Stampp, K (1956) The Peculiar Institution: Slavery in the Ante-bellum South. New York: Alfred A. Knopf.
Steckel, RH (1977) The Economics of U.S. Slave and Southern White Fertility. Ph.D. Dissertation, Univer- sity of Chicago.
Steckel, RH (1979a) Slave height profiles from coastwise manifests. Explorations Econ. Hist. 16:363-380.
Steckel, RH (1979b) Slave mortality: analysis of evidence from plantation records. Soc. Sci. Hist. 3:86-114.
Steckel, RH (1980) Miscegenation and the American slave schedules. J. Interdiscip. Hist. 11:251-263.
Steckel, RH (1986) A peculiar population: the nutrition, health, and mortality of american slaves from child- hood to maturity. J . Econ. Hist. 36:721-739.
Syndor, CS (1930) Life span of Mississippi slaves. Am. Hist. Review 35566-574.
Vinovskis, MA (1972) Mortality rates and trends in Mas- sachusetts before 1860. J . Econ. Hist. 32:184-213.
White, DG (1983) Female slaves: sex roles and status in the antebellum plantation south. J . Family Hist. 8248- 261.