Embed Size (px)
Citation preview
This document and trademark(s) contained herein are protected by law as indicated in a notice appearing later in this work. This electronic representation of RAND intellectual property is provided for non-commercial use only. Unauthorized posting of RAND PDFs to a non-RAND Web site is prohibited. RAND PDFs are protected under copyright law. Permission is required from RAND to reproduce, or reuse in another form, any of our research documents for commercial use. For information on reprint and linking permissions, please see RAND Permissions.
Limited Electronic Distribution Rights
This PDF document was made available from www.rand.org as a public
service of the RAND Corporation.
6Jump down to document
THE ARTS
CHILD POLICY
CIVIL JUSTICE
EDUCATION
ENERGY AND ENVIRONMENT
HEALTH AND HEALTH CARE
INTERNATIONAL AFFAIRS
NATIONAL SECURITY
POPULATION AND AGING
PUBLIC SAFETY
SCIENCE AND TECHNOLOGY
SUBSTANCE ABUSE
TERRORISM AND HOMELAND SECURITY
TRANSPORTATION ANDINFRASTRUCTURE
WORKFORCE AND WORKPLACE
The RAND Corporation is a nonprofit research organization providing objective analysis and effective solutions that address the challenges facing the public and private sectors around the world.
Visit RAND at www.rand.org
Explore the RAND Safety and Justice Program
View document details
For More Information
Purchase this document
Browse Books & Publications
Make a charitable contribution
Support RAND
This product is part of the RAND Corporation technical report series. Reports may
include research findings on a specific topic that is limited in scope; present discus-
sions of the methodology employed in research; provide literature reviews, survey
instruments, modeling exercises, guidelines for practitioners and research profes-
sionals, and supporting documentation; or deliver preliminary findings. All RAND
reports undergo rigorous peer review to ensure that they meet high standards for re-
search quality and objectivity.
The National Computer Security Survey (NCSS)Final Methodology
Lois M. Davis, Daniela Golinelli, Robin Beckman,
Sarah K. Cotton, Robert H. Anderson, Anil Bamezai,
Christopher R. Corey, Megan Zander-Cotugno,
John L. Adams, Roald Euller, Paul Steinberg
Prepared for the Bureau of Justice Statistics
A RAND INFRASTRUCTURE, SAFETY, AND ENVIRONMENT PROGRAM
Safety and Justice
The RAND Corporation is a nonprofit research organization providing objective analysis and effective solutions that address the challenges facing the public and private sectors around the world. RAND’s publications do not necessarily ref lect the opinions of its research clients and sponsors.
R® is a registered trademark.
© Copyright 2008 RAND Corporation
All rights reserved. No part of this book may be reproduced in any form by any electronic or mechanical means (including photocopying, recording, or information storage and retrieval) without permission in writing from RAND.
Published 2008 by the RAND Corporation1776 Main Street, P.O. Box 2138, Santa Monica, CA 90407-2138
1200 South Hayes Street, Arlington, VA 22202-50504570 Fifth Avenue, Suite 600, Pittsburgh, PA 15213-2665
RAND URL: http://www.rand.orgTo order RAND documents or to obtain additional information, contact
Distribution Services: Telephone: (310) 451-7002; Fax: (310) 451-6915; Email: [email protected]
This report was prepared for the Bureau of Justice Statistics and conducted under the auspices of the Safety and Justice Program within RAND Infrastructure, Safety, and Environment (ISE).
Library of Congress Cataloging-in-Publication Data
National computer security survey : final methodology / Lois M. Davis ... [et al.]. p. cm. Includes bibliographical references. ISBN 978-0-8330-4467-9 (pbk. : alk. paper) 1. Computer crimes—United States. 2. Computer crimes—United States—Statistics. 3. Computer security—United States—Evaluation. I. Davis, Lois M.
HV6773.N38 2008 364.16'80973—dc22
2008018381
iii
Preface
The Bureau of Justice Statistics (BJS) within the U.S. Department of Justice (DOJ), along with the U.S. Department of Homeland Security (DHS), conducted the National Computer Security Survey (NCSS), a nationally representative sample of businesses across 36 industry sectors. The RAND Corporation was selected to implement the survey. The survey collects data on the nature, extent, and consequences of computer-security incidents, with the goal of producing reliable national estimates of the incidence and prevalence of such incidents against businesses and their resulting losses. This technical report summarizes the methodology used in this study. This report was supported by BJS award 2004-BJ-CX-K024. The opinions, find-ings, and conclusions or recommendations expressed in this document are those of the authors and do not necessarily represent the official position or policies of DOJ.
This report will be of interest to researchers and analysts who are interested in under-standing the methodology underlying the NCSS, including questionnaire design, survey field-ing, sampling, and weighting methodologies for this large-scale survey. The report will also be informative for scholars who are interested in analyzing the NCSS public-use data file.
The RAND Safety and Justice Program
This research was conducted under the auspices of the Safety and Justice Program within RAND Infrastructure, Safety, and Environment (ISE). The mission of the ISE is to improve the development, operation, use, and protection of society’s essential physical assets and natural resources and to enhance the related social assets of safety and security of individuals in tran-sit and in their workplaces and communities. Safety and Justice Program research addresses occupational safety, transportation safety, food safety, and public safety—including violence, policing, corrections, substance abuse, and public integrity.
Questions or comments about this report should be sent to the project leader, Lois Davis ([email protected]). Information about the Safety and Justice Program is available online (http://www.rand.org/ise/safety). Inquiries about research projects should be sent to the fol-lowing address:
Greg Ridgeway, Acting DirectorSafety and Justice Program, ISERAND Corporation1776 Main StreetP.O. Box 2138

iv The National Computer Security Survey (NCSS): Final Methodology
Santa Monica, CA 90407-2138310-393-0411, [email protected]
v
Contents
Preface . . . . . . . . . . . . . . . . . . . . . . . . . . . . . . . . . . . . . . . . . . . . . . . . . . . . . . . . . . . . . . . . . . . . . . . . . . . . . . . . . . . . . . . . . . . . . . . . . . . . . . . . . . . iiiTables . . . . . . . . . . . . . . . . . . . . . . . . . . . . . . . . . . . . . . . . . . . . . . . . . . . . . . . . . . . . . . . . . . . . . . . . . . . . . . . . . . . . . . . . . . . . . . . . . . . . . . . . . . . . viiSummary . . . . . . . . . . . . . . . . . . . . . . . . . . . . . . . . . . . . . . . . . . . . . . . . . . . . . . . . . . . . . . . . . . . . . . . . . . . . . . . . . . . . . . . . . . . . . . . . . . . . . . . . ixAcknowledgments . . . . . . . . . . . . . . . . . . . . . . . . . . . . . . . . . . . . . . . . . . . . . . . . . . . . . . . . . . . . . . . . . . . . . . . . . . . . . . . . . . . . . . . . . . . . . xiAbbreviations . . . . . . . . . . . . . . . . . . . . . . . . . . . . . . . . . . . . . . . . . . . . . . . . . . . . . . . . . . . . . . . . . . . . . . . . . . . . . . . . . . . . . . . . . . . . . . . . . . xiii
CHAPTER ONE
Introduction . . . . . . . . . . . . . . . . . . . . . . . . . . . . . . . . . . . . . . . . . . . . . . . . . . . . . . . . . . . . . . . . . . . . . . . . . . . . . . . . . . . . . . . . . . . . . . . . . . . . . 1Objective . . . . . . . . . . . . . . . . . . . . . . . . . . . . . . . . . . . . . . . . . . . . . . . . . . . . . . . . . . . . . . . . . . . . . . . . . . . . . . . . . . . . . . . . . . . . . . . . . . . . . . . . . . 1Organization of This Report . . . . . . . . . . . . . . . . . . . . . . . . . . . . . . . . . . . . . . . . . . . . . . . . . . . . . . . . . . . . . . . . . . . . . . . . . . . . . . . . . . . . 1
CHAPTER TWO
Frame Definition . . . . . . . . . . . . . . . . . . . . . . . . . . . . . . . . . . . . . . . . . . . . . . . . . . . . . . . . . . . . . . . . . . . . . . . . . . . . . . . . . . . . . . . . . . . . . . . . 3Rationale for Using Dun and Bradstreet . . . . . . . . . . . . . . . . . . . . . . . . . . . . . . . . . . . . . . . . . . . . . . . . . . . . . . . . . . . . . . . . . . . . . . 3Dealing with Large Corporations and Their Subsidiaries . . . . . . . . . . . . . . . . . . . . . . . . . . . . . . . . . . . . . . . . . . . . . . . . . . 3Exclusions from the Frame . . . . . . . . . . . . . . . . . . . . . . . . . . . . . . . . . . . . . . . . . . . . . . . . . . . . . . . . . . . . . . . . . . . . . . . . . . . . . . . . . . . . . . 5Industry Definitions . . . . . . . . . . . . . . . . . . . . . . . . . . . . . . . . . . . . . . . . . . . . . . . . . . . . . . . . . . . . . . . . . . . . . . . . . . . . . . . . . . . . . . . . . . . . . 7Classification of Industries by Risk Level . . . . . . . . . . . . . . . . . . . . . . . . . . . . . . . . . . . . . . . . . . . . . . . . . . . . . . . . . . . . . . . . . . . . 10Cleaning of the Sampling Frame and Sample . . . . . . . . . . . . . . . . . . . . . . . . . . . . . . . . . . . . . . . . . . . . . . . . . . . . . . . . . . . . . . . 12
CHAPTER THREE
Sampling Strategy . . . . . . . . . . . . . . . . . . . . . . . . . . . . . . . . . . . . . . . . . . . . . . . . . . . . . . . . . . . . . . . . . . . . . . . . . . . . . . . . . . . . . . . . . . . . . 13Overview of the Stratified Sampling Strategy . . . . . . . . . . . . . . . . . . . . . . . . . . . . . . . . . . . . . . . . . . . . . . . . . . . . . . . . . . . . . . . 13Certainty Companies . . . . . . . . . . . . . . . . . . . . . . . . . . . . . . . . . . . . . . . . . . . . . . . . . . . . . . . . . . . . . . . . . . . . . . . . . . . . . . . . . . . . . . . . . . . 13Treatment of Subsidiaries of Certainty and Noncertainty Companies . . . . . . . . . . . . . . . . . . . . . . . . . . . . . . . . . . . 14Sample Allocation . . . . . . . . . . . . . . . . . . . . . . . . . . . . . . . . . . . . . . . . . . . . . . . . . . . . . . . . . . . . . . . . . . . . . . . . . . . . . . . . . . . . . . . . . . . . . . . 14Frame and Sample Summary Statistics . . . . . . . . . . . . . . . . . . . . . . . . . . . . . . . . . . . . . . . . . . . . . . . . . . . . . . . . . . . . . . . . . . . . . . . 15
CHAPTER FOUR
Survey Methods and Fielding . . . . . . . . . . . . . . . . . . . . . . . . . . . . . . . . . . . . . . . . . . . . . . . . . . . . . . . . . . . . . . . . . . . . . . . . . . . . . . . 19Instrument Development . . . . . . . . . . . . . . . . . . . . . . . . . . . . . . . . . . . . . . . . . . . . . . . . . . . . . . . . . . . . . . . . . . . . . . . . . . . . . . . . . . . . . . 19
Key Modifications Made to the Survey Instrument . . . . . . . . . . . . . . . . . . . . . . . . . . . . . . . . . . . . . . . . . . . . . . . . . . . . . 20Fielding-Strategy Considerations . . . . . . . . . . . . . . . . . . . . . . . . . . . . . . . . . . . . . . . . . . . . . . . . . . . . . . . . . . . . . . . . . . . . . . . . . . . . . 22
Subsidiaries . . . . . . . . . . . . . . . . . . . . . . . . . . . . . . . . . . . . . . . . . . . . . . . . . . . . . . . . . . . . . . . . . . . . . . . . . . . . . . . . . . . . . . . . . . . . . . . . . . . 22Confidentiality . . . . . . . . . . . . . . . . . . . . . . . . . . . . . . . . . . . . . . . . . . . . . . . . . . . . . . . . . . . . . . . . . . . . . . . . . . . . . . . . . . . . . . . . . . . . . . . 23Endorsements . . . . . . . . . . . . . . . . . . . . . . . . . . . . . . . . . . . . . . . . . . . . . . . . . . . . . . . . . . . . . . . . . . . . . . . . . . . . . . . . . . . . . . . . . . . . . . . . . 24
vi The National Computer Security Survey (NCSS): Final Methodology
Multiple Fielding Waves . . . . . . . . . . . . . . . . . . . . . . . . . . . . . . . . . . . . . . . . . . . . . . . . . . . . . . . . . . . . . . . . . . . . . . . . . . . . . . . . . . . . . . . 26Multiple Modes . . . . . . . . . . . . . . . . . . . . . . . . . . . . . . . . . . . . . . . . . . . . . . . . . . . . . . . . . . . . . . . . . . . . . . . . . . . . . . . . . . . . . . . . . . . . . . 28Precalls and Web Lookups . . . . . . . . . . . . . . . . . . . . . . . . . . . . . . . . . . . . . . . . . . . . . . . . . . . . . . . . . . . . . . . . . . . . . . . . . . . . . . . . . . 28Incentive . . . . . . . . . . . . . . . . . . . . . . . . . . . . . . . . . . . . . . . . . . . . . . . . . . . . . . . . . . . . . . . . . . . . . . . . . . . . . . . . . . . . . . . . . . . . . . . . . . . . . . . 29Survey Implementation . . . . . . . . . . . . . . . . . . . . . . . . . . . . . . . . . . . . . . . . . . . . . . . . . . . . . . . . . . . . . . . . . . . . . . . . . . . . . . . . . . . . . . 29
Response-Rate Summary . . . . . . . . . . . . . . . . . . . . . . . . . . . . . . . . . . . . . . . . . . . . . . . . . . . . . . . . . . . . . . . . . . . . . . . . . . . . . . . . . . . . . . . 32Data-Editing Protocols . . . . . . . . . . . . . . . . . . . . . . . . . . . . . . . . . . . . . . . . . . . . . . . . . . . . . . . . . . . . . . . . . . . . . . . . . . . . . . . . . . . . . . . . 34
CHAPTER FIVE
Weighting Methodology and Nonresponse Analysis . . . . . . . . . . . . . . . . . . . . . . . . . . . . . . . . . . . . . . . . . . . . . . . . . . . 37Missing Data. . . . . . . . . . . . . . . . . . . . . . . . . . . . . . . . . . . . . . . . . . . . . . . . . . . . . . . . . . . . . . . . . . . . . . . . . . . . . . . . . . . . . . . . . . . . . . . . . . . . . 37Nonresponse Analysis . . . . . . . . . . . . . . . . . . . . . . . . . . . . . . . . . . . . . . . . . . . . . . . . . . . . . . . . . . . . . . . . . . . . . . . . . . . . . . . . . . . . . . . . . . 37Weighting Scheme . . . . . . . . . . . . . . . . . . . . . . . . . . . . . . . . . . . . . . . . . . . . . . . . . . . . . . . . . . . . . . . . . . . . . . . . . . . . . . . . . . . . . . . . . . . . . 40
Sampling Weights . . . . . . . . . . . . . . . . . . . . . . . . . . . . . . . . . . . . . . . . . . . . . . . . . . . . . . . . . . . . . . . . . . . . . . . . . . . . . . . . . . . . . . . . . . . . 40Nonresponse Weights . . . . . . . . . . . . . . . . . . . . . . . . . . . . . . . . . . . . . . . . . . . . . . . . . . . . . . . . . . . . . . . . . . . . . . . . . . . . . . . . . . . . . . . 40Analytic Weights . . . . . . . . . . . . . . . . . . . . . . . . . . . . . . . . . . . . . . . . . . . . . . . . . . . . . . . . . . . . . . . . . . . . . . . . . . . . . . . . . . . . . . . . . . . . . 40Post-Stratification Weights . . . . . . . . . . . . . . . . . . . . . . . . . . . . . . . . . . . . . . . . . . . . . . . . . . . . . . . . . . . . . . . . . . . . . . . . . . . . . . . . . . . 41
Examples of Weighted Estimates and Standard Errors . . . . . . . . . . . . . . . . . . . . . . . . . . . . . . . . . . . . . . . . . . . . . . . . . . . . . 41
APPENDIXES
A. Range and Edit Checks and Other Data Cleaning Procedures . . . . . . . . . . . . . . . . . . . . . . . . . . . . . . . . . . 47B. Questionnaire . . . . . . . . . . . . . . . . . . . . . . . . . . . . . . . . . . . . . . . . . . . . . . . . . . . . . . . . . . . . . . . . . . . . . . . . . . . . . . . . . . . . . . . . . . . . . 57
Bibliography . . . . . . . . . . . . . . . . . . . . . . . . . . . . . . . . . . . . . . . . . . . . . . . . . . . . . . . . . . . . . . . . . . . . . . . . . . . . . . . . . . . . . . . . . . . . . . . . . . . . 75
vii
Tables
2.1. Exclusions from the Sampling Frame: Ineligible NAICS Codes . . . . . . . . . . . . . . . . . . . . . . . . . . . . . . 6 2.2. NAICS Codes That Defined Each Industry Sector . . . . . . . . . . . . . . . . . . . . . . . . . . . . . . . . . . . . . . . . . . . . 7 2.3. Risk Level and Assignment of Industry Sectors . . . . . . . . . . . . . . . . . . . . . . . . . . . . . . . . . . . . . . . . . . . . . . . . 11 3.1. Frame and Sample Summary Statistics . . . . . . . . . . . . . . . . . . . . . . . . . . . . . . . . . . . . . . . . . . . . . . . . . . . . . . . . . 16 4.1. Final List of NCSS Project Supporters . . . . . . . . . . . . . . . . . . . . . . . . . . . . . . . . . . . . . . . . . . . . . . . . . . . . . . . . . . 25 4.2. Wave I Modal Test Design . . . . . . . . . . . . . . . . . . . . . . . . . . . . . . . . . . . . . . . . . . . . . . . . . . . . . . . . . . . . . . . . . . . . . . 26 4.3. Survey Sections for Multi-PIN Surveys . . . . . . . . . . . . . . . . . . . . . . . . . . . . . . . . . . . . . . . . . . . . . . . . . . . . . . . . 27 4.4. Final Response Rates, by Risk Level, Company Size, and Industry for the National
Computer Security Survey . . . . . . . . . . . . . . . . . . . . . . . . . . . . . . . . . . . . . . . . . . . . . . . . . . . . . . . . . . . . . . . . . . . . . . . . 33 5.1. Industries with the Lowest Response Rates. . . . . . . . . . . . . . . . . . . . . . . . . . . . . . . . . . . . . . . . . . . . . . . . . . . . . 39 5.2. Industries with the Highest Response Rates . . . . . . . . . . . . . . . . . . . . . . . . . . . . . . . . . . . . . . . . . . . . . . . . . . . 39 5.3. Weighted Estimates and Standard Errors Presenting the Results of the SUDAAN
Output . . . . . . . . . . . . . . . . . . . . . . . . . . . . . . . . . . . . . . . . . . . . . . . . . . . . . . . . . . . . . . . . . . . . . . . . . . . . . . . . . . . . . . . . . . . . . . 45

ix
Summary
The Bureau of Justice Statistics (BJS) in the Office of Justice Programs (OJP) of the U.S. Department of Justice (DOJ) conducted a pilot survey in 2001—the Computer Security Survey (CSS) pilot test—to collect information about computer infrastructure and security measures from businesses across a range of economic sectors, including finance, utilities, trans-portation, health care, telecommunications, petroleum mining and manufacturing, chemical and drug manufacturing, and Internet-service providers (ISPs).
Based on the pilot-survey results, BJS/DOJ, along with the U.S. Department of Home-land Security (DHS), decided to field a National Computer Security Survey (NCSS), a nation-ally representative sample of businesses across 36 industry sectors. The survey collected data on the nature, extent, and consequences of computer-security incidents. The goal was to pro-duce reliable national estimates of the incidence and prevalence of computer-security incidents (including denial-of-service attacks and other incidents with serious consequences, such as fraud, embezzlement, theft of intellectual property [IP], electronic vandalism, or sabotage) against businesses, as well as businesses’ resulting losses from such incidents. In 2004, RAND was selected to field the national survey. The survey itself was fielded in 2006; however, the data collected represent the experiences of companies in 2005.
This technical report details the methodology used to develop and field the NCSS as well as the sampling design and weighting methodology. The official survey results for the NCSS will be presented in a BJS report to be published in 2008. The NCSS is the first nationally representative survey on cyber security within the United States. More specifically, the survey was designed to collect data about the prevalence of different types of computer-security inci-dents and the monetary costs imposed by these incidents, across all industry sectors and espe-cially for those that comprise the U.S. critical infrastructure. In addition, the NCSS provides information about what computer-security measures are currently in place, the reporting of computer-security incidents, and whom companies identify as being the perpetrators of such incidents.

xi
Acknowledgments
The authors would like to thank the companies that have provided thoughtful information on their cyber-security postures and experiences with different types of computer-crime incidents. We also would like to thank the professional associations that lent their names in support of the NCSS and who helped get the word out to their industry sectors. Lastly, we wish to thank Ramona Rantala, Matthias Schonlau, and Patricia Gallagher, who reviewed and commented on drafts of this report.

xiii
Abbreviations
BJS Bureau of Justice Statistics
CSS Computer Security Survey
D&B Dun and Bradstreet
DHS U.S. Department of Homeland Security
DOJ U.S. Department of Justice
DSP data-safeguarding plan
D-U-N-S data universal numbering system
ESS effective sample size
FAQs frequently asked questions
HSPC Human Subjects Protection Committee
IP intellectual property
ISAC Information Sharing and Analysis Center
ISP Internet-service provider
IT information technology
MAR missing at random
MCAR missing completely at random
MNAR missing not at random
MSI Market Strategies International
NAICS North American Industry Classification System
NCSD National Cyber Security Division
NCSS National Computer Security Survey
OJP Office of Justice Programs
OMB Office of Management and Budget
xiv The National Computer Security Survey (NCSS): Final Methodology
OPSCAN optical scanning
PDF portable document format
PGP pretty good privacy
PIN personal identification number
RFP request for proposals
RMS record-management system
SAQ self-administered questionnaire
SRG Survey Research Group
SUDAAN survey-data analysis
1
CHAPTER ONE
Introduction
The Bureau of Justice Statistics (BJS) in the Office of Justice Programs (OJP) of the U.S. Department of Justice (DOJ) conducted a pilot survey in 2001—the Computer Security Survey (CSS) pilot test—to collect information about computer infrastructure and security measures from businesses across a range of economic sectors, including finance, utilities, trans-portation, health care, telecommunications, petroleum mining and manufacturing, chemical and drug manufacturing, and Internet-service providers (ISPs).
Based on the pilot-survey results, BJS/DOJ, along with the U.S. Department of Home-land Security (DHS), decided to field a National Computer Security Survey (NCSS), a nation-ally representative sample of businesses across 36 industry sectors. The survey collected data on the nature, extent, and consequences of computer-security incidents. The goal was to pro-duce reliable national estimates of the frequency and prevalence of computer-security incidents (including denial-of-service attacks and other incidents with serious consequences, such as fraud, embezzlement, theft of intellectual property [IP], electronic vandalism, or sabotage) against businesses, as well as businesses’ resulting losses from such incidents. In 2004, RAND was selected to field the national survey. The survey itself was fielded in 2006; however, the data collected represent the experiences of companies in 2005.
Objective
This technical report details the methodology used to develop and field the NCSS as well as the sampling design and weighting methodology. The official survey results for the NCSS will be presented in a BJS report to be published in 2008. The NCSS is the first nationally repre-sentative survey on cyber security within the United States. More specifically, the survey was designed to collect data about the prevalence of different types of computer-security incidents and the monetary costs imposed by these incidents, across all industry sectors and especially for those that comprise the U.S. critical infrastructure. In addition, the NCSS provides informa-tion about what computer-security measures are currently in place, the reporting of computer-security incidents, and whom companies identify as being the perpetrators of such incidents.
Organization of This Report
In this report, we have organized the description of the methodology used for the NCSS into five chapters. Chapter Two addresses frame definition, exclusions from the frame, and cleaning

2 The National Computer Security Survey (NCSS): Final Methodology
of the frame. Chapter Three presents the sampling methodology. Chapter Four presents the survey methodology. Chapter Five presents weighting methodology and nonresponse analy-sis, as well as examples of weighted estimates and standard errors using SUDAAN software.1 Appendix A provides details of the range and edit checks. Appendix B provides a copy of the long form of the questionnaire.
1 SUDAAN stands for survey-data analysis.
3
CHAPTER TWO
Frame Definition
Rationale for Using Dun and Bradstreet
While the 2001 CSS pilot study used the U.S. Census Bureau’s Business Register to derive its sampling frame, that database is not publicly available and so was unavailable to use for the NCSS. As an alternative, we selected Dun and Bradstreet (D&B®) as the database vendor of choice, given the complexity of content it can provide. Specifically, the D&B database has information on approximately 18.5 million active U.S. businesses on record. In comparison, InfoUSA’s and Experian’s databases contain only 13 million and 15 million businesses, respec-tively; in addition, we found that those databases had less depth of information on company hierarchy and corporate structure, or “family-tree” mapping, than D&B’s database had. Also, D&B’s database is continually updated, both manually and with automated data-collection tools. These updates are made from numerous sources, including public filings, global busi-ness-to-business transactions, direct investigations, Internet presence, and media reports. The National Science Foundation’s Information Technology Innovation Survey: Fall 2001, which had similar sampling priorities as the NCSS survey, also used D&B’s database (NSF, 2004).
D&B creates a nine-digit D-U-N-S® (data universal numbering system) for each com-pany in its system as a unique way of tracking and identifying businesses through changes and updates. This number is retained for the life of a business, with no two businesses ever receiv-ing the same D-U-N-S number. D-U-N-S numbers are not recycled; they follow a company from birth to growth and even death. Important to this study, the D&B database is able to reflect corporate hierarchy and corporate families based on each business’ D-U-N-S number.
Dealing with Large Corporations and Their Subsidiaries
D&B’s Strategic Marketing Records database served as the sampling frame for the NCSS. We received the data in February 2005 and drew the sample in November 2005, requesting at that time updated contact information.
The frame consisted of all companies operating in the United States with 10 or more employees. Given the large number of companies in the 2- to 9-employee size grouping and the small sampling fraction intended for this size group, we did not purchase the full set of records for the small companies. To include them in the sampling frame, we obtained counts by North American Industry Classification System (NAICS) codes, which were then used to
4 The National Computer Security Survey (NCSS): Final Methodology
group them into industries. The sampling allocation was done by industry, and the number of small companies allocated was converted back to counts per NAICS code. We then requested that D&B generate a random sample of small companies within each NAICS code based on these counts. The translation back to NAICS from industry was calculated by the percentage that a given NAICS code contributed to the total industry group. We purchased this stratified random sample of small companies. Companies in the D&B database with an employee count of one are largely nonemployers with just a single person operating the business and, thus, were not included in the sampling frame.
The sampling unit was a company, which we define as one or more business establish-ments under common ownership. Branches and divisions were not considered a company; however, subsidiaries of larger corporate trees were.
The sampling frame consisted of three types of companies:
companies comprised of one establishment (e.g., single-location companies)1. companies that may have several establishments nationwide but only one company 2. headquarters and that is not, in turn, owned by another companycompanies that are part of a large conglomerate (i.e., subsidiaries of other companies, 3. all of which form a pyramid with a final entity at the apex—what D&B refers to as the “ultimate” company).
From a sampling point of view, we define a company in the following way: Each single-location company or corporate headquarters of a multiestablishment company is treated as one sampling unit. Headquarters divide into two groups: (1) parent or ultimate headquarters and (2) subsidiary headquarters. We describe next how we dealt with companies that were part of large conglomerates.
The complexity of some corporate trees (category 3 in the list) was highlighted in the cognitive interviews we conducted. Information-security practices were found to vary consid-erably across companies, even though the companies might be part of the same corporate tree. The ultimate entity at the apex of a complex corporate tree was not always able to report about cyber security–related information for all its subsidiaries.
Further, analysis of the complex corporate trees included in D&B’s database and infor-mal discussions with company contacts indicated that there is wide heterogeneity in how IT is structured among these complex companies, which, in many instances, may limit the ultimate companies’ information about their subsidiaries’ experience with computer security incidents and the ultimates’ ability to report for all their subsidiaries. In addition, companies that were part of a complex corporate tree might also belong to different industrial sectors (our data suggest that approximately 20 percent of corporate trees span two or more of the 36 industry sectors). Yet a breakdown by subsidiary was required to allow for industry-level estimates (i.e., each company, including subsidiaries, needed to be in its proper industry sector).
For complex corporate trees, we struck a compromise. Because IT systems and information-security practices may not be fully integrated within complex companies and because subsidiar-ies of complex companies may belong to different industries, it was decided to treat subsidiaries belonging to the same parent companies independently. In other words, if a company owned, for example, five other companies, the links among these six companies were erased and all six companies had a positive sampling probability. That is, each company part of a complex tree was treated as an independent sampling and reporting unit. This decision also was reached due
Frame Definition 5
to sample size and budget constraints. Given a fixed budget, another option would have been to reduce the sample size and use available resources to do more-intensive follow-up with the complex companies, allowing an entire corporate tree to be treated as a sampling unit.
In addition, the survey instructed the target respondent to report only for his or her domes-tic operations, including all divisions and locations and excluding subsidiaries. The NCSS also contained a check at the end to confirm that subsidiary data had been excluded. This was done because we recognized that some companies may be unable to report information independent of their subsidiaries. So two questions were added at the end of the survey to verify for whom the respondent was reporting and the number of subsidiaries for which they were reporting. If the respondent indicated that information for its subsidiaries was included, the respondent was asked to list which additional companies were included in their report.
Thus, in some cases, companies filled out the survey including information for subsidiary firms within their corporate structure. We determined this from the response to question 21: “Information includes this company and some subsidiaries.” We obtained a list of these sub-sidiaries and compared these to the survey frame to determine whether any of the subsidiaries were part of the NCSS sample. If so, we included records for those subsidiaries in the database. We did not, however, fill in any of the fields for these subsidiary records, leaving these decisions up to the discretion of future analysts who may wish to analyze these data. Therefore, on the analytic file, all the fields on the subsidiary records are blank, except for the sampling strata and weight variables.
In using these data, analysts will need to make their own decisions whether, and how, to distribute the information on the parent-company record to the subsidiary records. Consider the following example: A parent company has three blank subsidiary records representing the companies in the sample frame for which the parent company provided data. If one assumes that the information was evenly distributed across the four companies (the parent company plus the three subsidiaries), then the counts of incidents detected, incidents reported, the dollar costs of the incidents, and so on, could be apportioned such that each company received 25 percent of the total. This is just one simple example of how the information supplied on behalf of subsidiary companies might be allocated to those companies.
Exclusions from the Frame
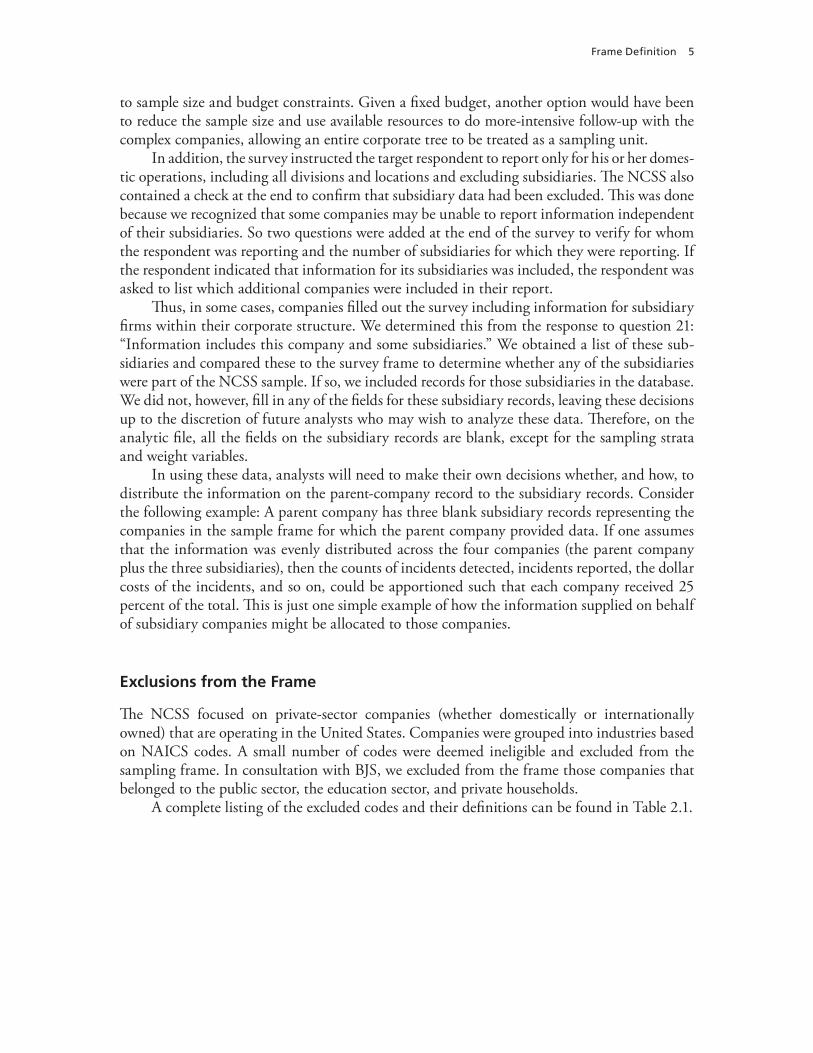
The NCSS focused on private-sector companies (whether domestically or internationally owned) that are operating in the United States. Companies were grouped into industries based on NAICS codes. A small number of codes were deemed ineligible and excluded from the sampling frame. In consultation with BJS, we excluded from the frame those companies that belonged to the public sector, the education sector, and private households.
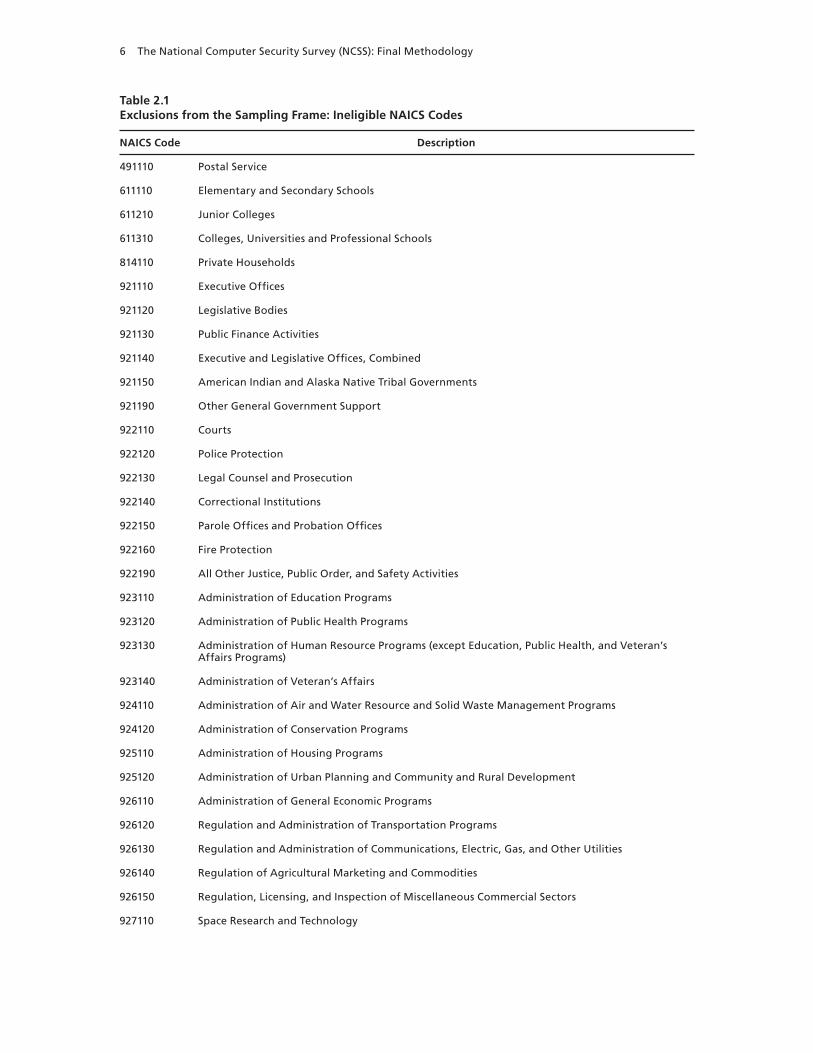
A complete listing of the excluded codes and their definitions can be found in Table 2.1.
6 The National Computer Security Survey (NCSS): Final Methodology
Table 2.1Exclusions from the Sampling Frame: Ineligible NAICS Codes
NAICS Code Description
491110 Postal Service
611110 Elementary and Secondary Schools
611210 Junior Colleges
611310 Colleges, Universities and Professional Schools
814110 Private Households
921110 Executive Offices
921120 Legislative Bodies
921130 Public Finance Activities
921140 Executive and Legislative Offices, Combined
921150 American Indian and Alaska Native Tribal Governments
921190 Other General Government Support
922110 Courts
922120 Police Protection
922130 Legal Counsel and Prosecution
922140 Correctional Institutions
922150 Parole Offices and Probation Offices
922160 Fire Protection
922190 All Other Justice, Public Order, and Safety Activities
923110 Administration of Education Programs
923120 Administration of Public Health Programs
923130 Administration of Human Resource Programs (except Education, Public Health, and Veteran’s Affairs Programs)
923140 Administration of Veteran’s Affairs
924110 Administration of Air and Water Resource and Solid Waste Management Programs
924120 Administration of Conservation Programs
925110 Administration of Housing Programs
925120 Administration of Urban Planning and Community and Rural Development
926110 Administration of General Economic Programs
926120 Regulation and Administration of Transportation Programs
926130 Regulation and Administration of Communications, Electric, Gas, and Other Utilities
926140 Regulation of Agricultural Marketing and Commodities
926150 Regulation, Licensing, and Inspection of Miscellaneous Commercial Sectors
927110 Space Research and Technology
Frame Definition 7
Table 2.1—Continued
NAICS Code Description
928110 National Security
928120 International Affairs
Industry Definitions
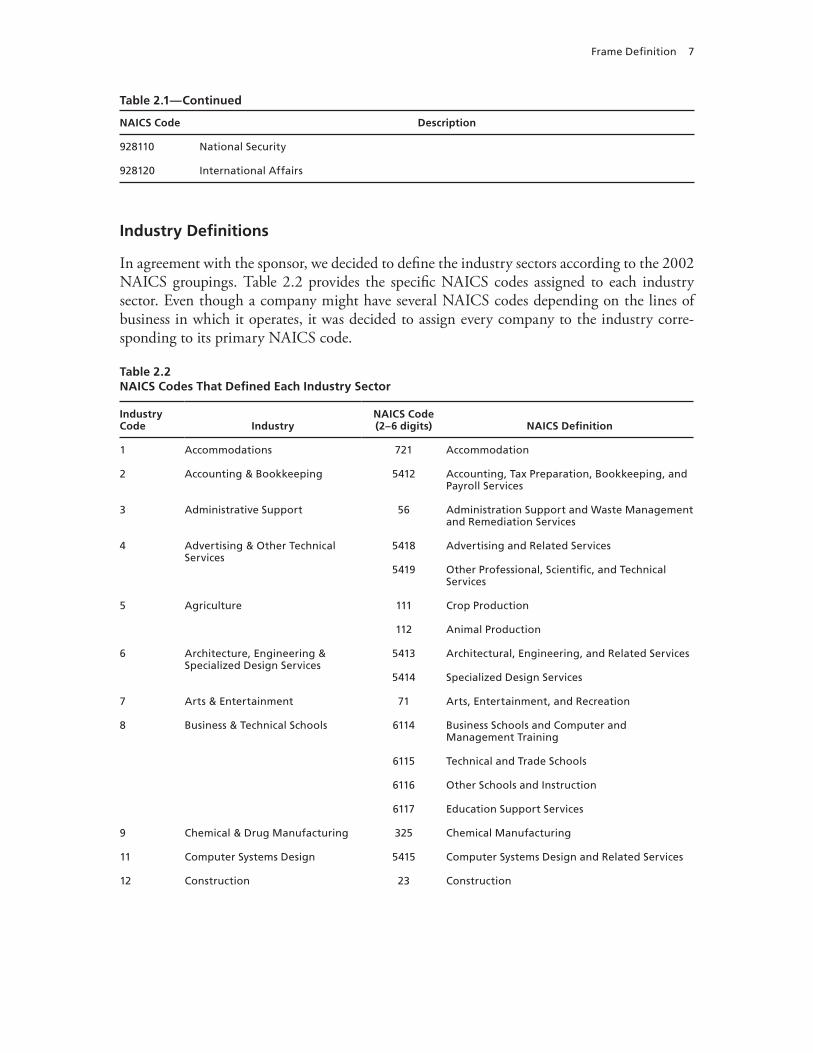
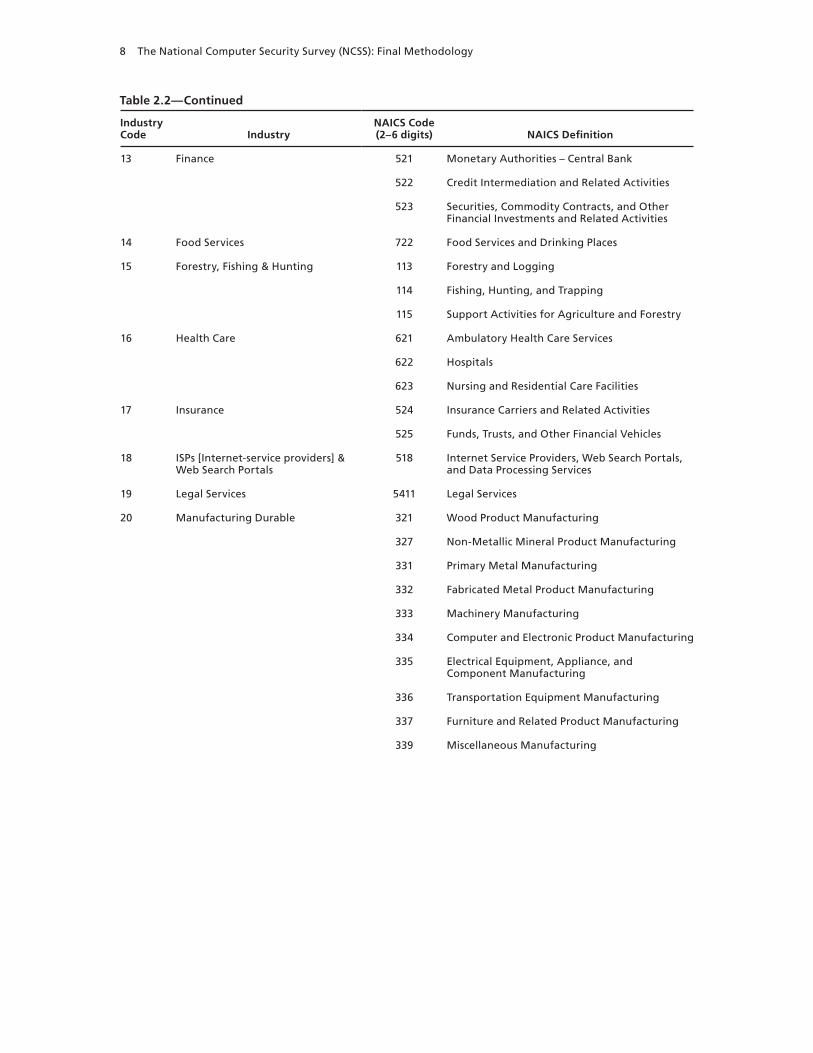
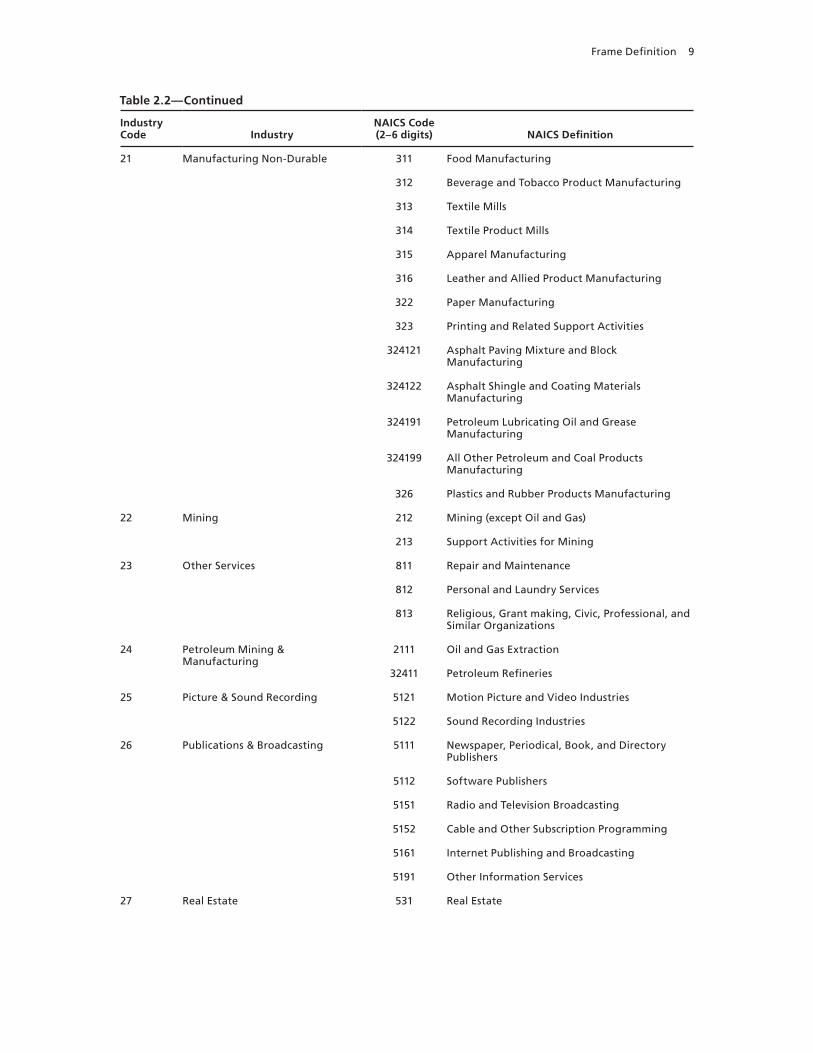
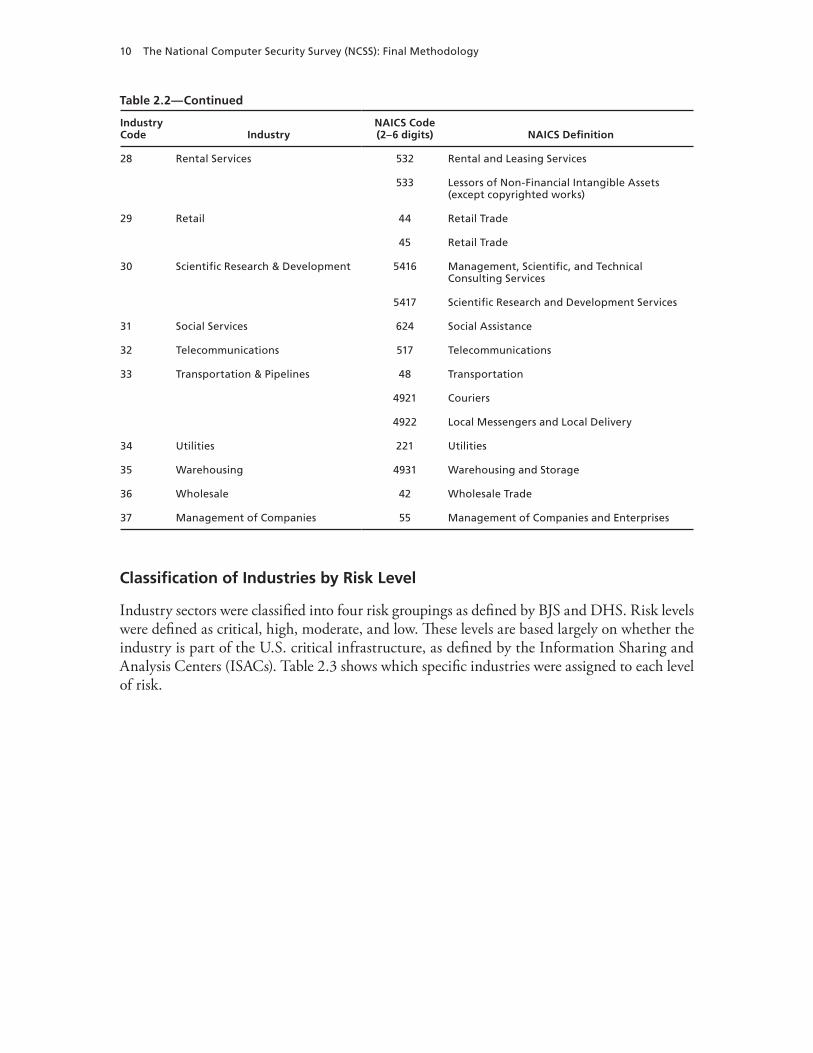
In agreement with the sponsor, we decided to define the industry sectors according to the 2002 NAICS groupings. Table 2.2 provides the specific NAICS codes assigned to each industry sector. Even though a company might have several NAICS codes depending on the lines of business in which it operates, it was decided to assign every company to the industry corre-sponding to its primary NAICS code.
Table 2.2NAICS Codes That Defined Each Industry Sector
Industry Code Industry
NAICS Code (2–6 digits) NAICS Definition
1 Accommodations 721 Accommodation
2 Accounting & Bookkeeping 5412 Accounting, Tax Preparation, Bookkeeping, and Payroll Services
3 Administrative Support 56 Administration Support and Waste Management and Remediation Services
4 Advertising & Other Technical Services
5418 Advertising and Related Services
5419 Other Professional, Scientific, and Technical Services
5 Agriculture 111 Crop Production
112 Animal Production
6 Architecture, Engineering & Specialized Design Services
5413 Architectural, Engineering, and Related Services
5414 Specialized Design Services
7 Arts & Entertainment 71 Arts, Entertainment, and Recreation
8 Business & Technical Schools 6114 Business Schools and Computer and Management Training
6115 Technical and Trade Schools
6116 Other Schools and Instruction
6117 Education Support Services
9 Chemical & Drug Manufacturing 325 Chemical Manufacturing
11 Computer Systems Design 5415 Computer Systems Design and Related Services
12 Construction 23 Construction
8 The National Computer Security Survey (NCSS): Final Methodology
Table 2.2—Continued
Industry Code Industry
NAICS Code (2–6 digits) NAICS Definition
13 Finance 521 Monetary Authorities – Central Bank
522 Credit Intermediation and Related Activities
523 Securities, Commodity Contracts, and Other Financial Investments and Related Activities
14 Food Services 722 Food Services and Drinking Places
15 Forestry, Fishing & Hunting 113 Forestry and Logging
114 Fishing, Hunting, and Trapping
115 Support Activities for Agriculture and Forestry
16 Health Care 621 Ambulatory Health Care Services
622 Hospitals
623 Nursing and Residential Care Facilities
17 Insurance 524 Insurance Carriers and Related Activities
525 Funds, Trusts, and Other Financial Vehicles
18 ISPs [Internet-service providers] & Web Search Portals
518 Internet Service Providers, Web Search Portals, and Data Processing Services
19 Legal Services 5411 Legal Services
20 Manufacturing Durable 321 Wood Product Manufacturing
327 Non-Metallic Mineral Product Manufacturing
331 Primary Metal Manufacturing
332 Fabricated Metal Product Manufacturing
333 Machinery Manufacturing
334 Computer and Electronic Product Manufacturing
335 Electrical Equipment, Appliance, and Component Manufacturing
336 Transportation Equipment Manufacturing
337 Furniture and Related Product Manufacturing
339 Miscellaneous Manufacturing
Frame Definition 9
Table 2.2—Continued
Industry Code Industry
NAICS Code (2–6 digits) NAICS Definition
21 Manufacturing Non-Durable 311 Food Manufacturing
312 Beverage and Tobacco Product Manufacturing
313 Textile Mills
314 Textile Product Mills
315 Apparel Manufacturing
316 Leather and Allied Product Manufacturing
322 Paper Manufacturing
323 Printing and Related Support Activities
324121 Asphalt Paving Mixture and Block Manufacturing
324122 Asphalt Shingle and Coating Materials Manufacturing
324191 Petroleum Lubricating Oil and Grease Manufacturing
324199 All Other Petroleum and Coal Products Manufacturing
326 Plastics and Rubber Products Manufacturing
22 Mining 212 Mining (except Oil and Gas)
213 Support Activities for Mining
23 Other Services 811 Repair and Maintenance
812 Personal and Laundry Services
813 Religious, Grant making, Civic, Professional, and Similar Organizations
24 Petroleum Mining & Manufacturing
2111 Oil and Gas Extraction
32411 Petroleum Refineries
25 Picture & Sound Recording 5121 Motion Picture and Video Industries
5122 Sound Recording Industries
26 Publications & Broadcasting 5111 Newspaper, Periodical, Book, and Directory Publishers
5112 Software Publishers
5151 Radio and Television Broadcasting
5152 Cable and Other Subscription Programming
5161 Internet Publishing and Broadcasting
5191 Other Information Services
27 Real Estate 531 Real Estate
10 The National Computer Security Survey (NCSS): Final Methodology
Table 2.2—Continued
Industry Code Industry
NAICS Code (2–6 digits) NAICS Definition
28 Rental Services 532 Rental and Leasing Services
533 Lessors of Non-Financial Intangible Assets (except copyrighted works)
29 Retail 44 Retail Trade
45 Retail Trade
30 Scientific Research & Development 5416 Management, Scientific, and Technical Consulting Services
5417 Scientific Research and Development Services
31 Social Services 624 Social Assistance
32 Telecommunications 517 Telecommunications
33 Transportation & Pipelines 48 Transportation
4921 Couriers
4922 Local Messengers and Local Delivery
34 Utilities 221 Utilities
35 Warehousing 4931 Warehousing and Storage
36 Wholesale 42 Wholesale Trade
37 Management of Companies 55 Management of Companies and Enterprises
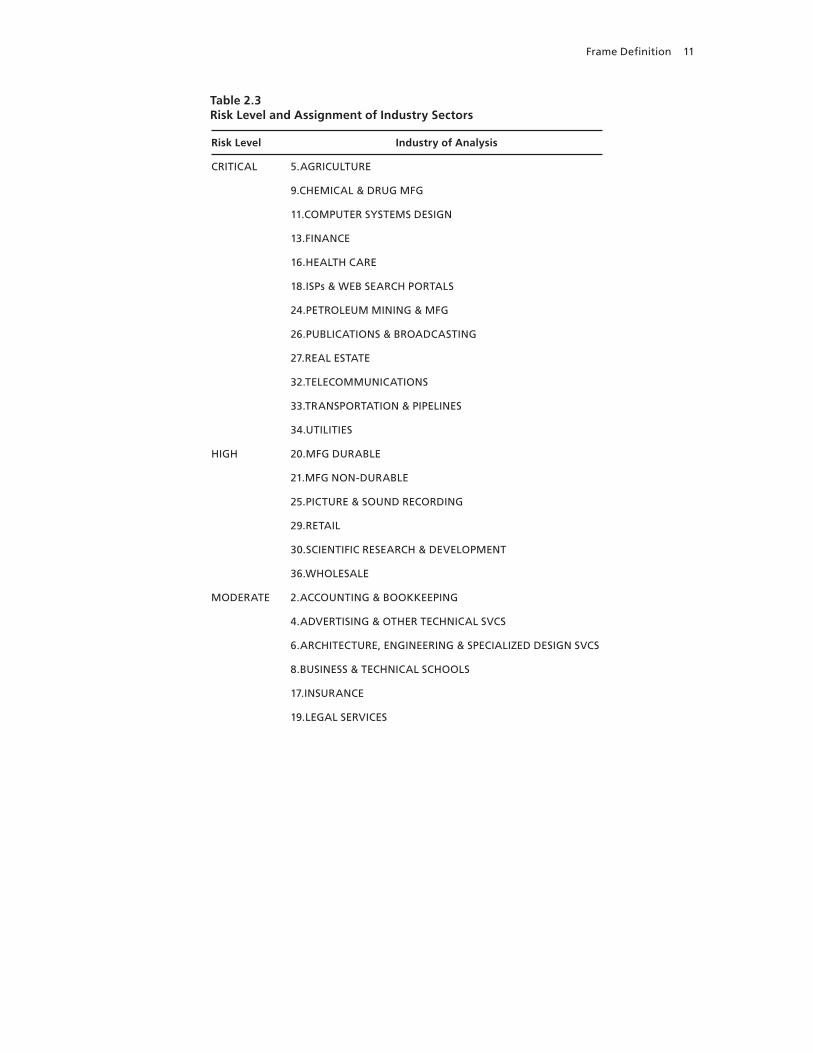
Classification of Industries by Risk Level
Industry sectors were classified into four risk groupings as defined by BJS and DHS. Risk levels were defined as critical, high, moderate, and low. These levels are based largely on whether the industry is part of the U.S. critical infrastructure, as defined by the Information Sharing and Analysis Centers (ISACs). Table 2.3 shows which specific industries were assigned to each level of risk.
Frame Definition 11
Table 2.3Risk Level and Assignment of Industry Sectors
Risk Level Industry of Analysis
CRITICAL 5.AGRICULTURE
9.CHEMICAL & DRUG MFG
11.COMPUTER SYSTEMS DESIGN
13.FINANCE
16.HEALTH CARE
18.ISPs & WEB SEARCH PORTALS
24.PETROLEUM MINING & MFG
26.PUBLICATIONS & BROADCASTING
27.REAL ESTATE
32.TELECOMMUNICATIONS
33.TRANSPORTATION & PIPELINES
34.UTILITIES
HIGH 20.MFG DURABLE
21.MFG NON-DURABLE
25.PICTURE & SOUND RECORDING
29.RETAIL
30.SCIENTIFIC RESEARCH & DEVELOPMENT
36.WHOLESALE
MODERATE 2.ACCOUNTING & BOOKKEEPING
4.ADVERTISING & OTHER TECHNICAL SVCS
6.ARCHITECTURE, ENGINEERING & SPECIALIZED DESIGN SVCS
8.BUSINESS & TECHNICAL SCHOOLS
17.INSURANCE
19.LEGAL SERVICES
12 The National Computer Security Survey (NCSS): Final Methodology
Table 2.3—Continued
Risk Level Industry of Analysis
LOW 1.ACCOMODATIONS
3.ADMINISTRATIVE SUPPORT
7.ARTS & ENTERTAINMENT
12.CONSTRUCTION
14.FOOD SERVICES
15.FORESTRY, FISHING & HUNTING
22.MINING
23.OTHER SERVICES
28.RENTAL SVCS
31.SOCIAL SERVICES
35.WAREHOUSING
37.MANAGEMENT OF COMPANIES
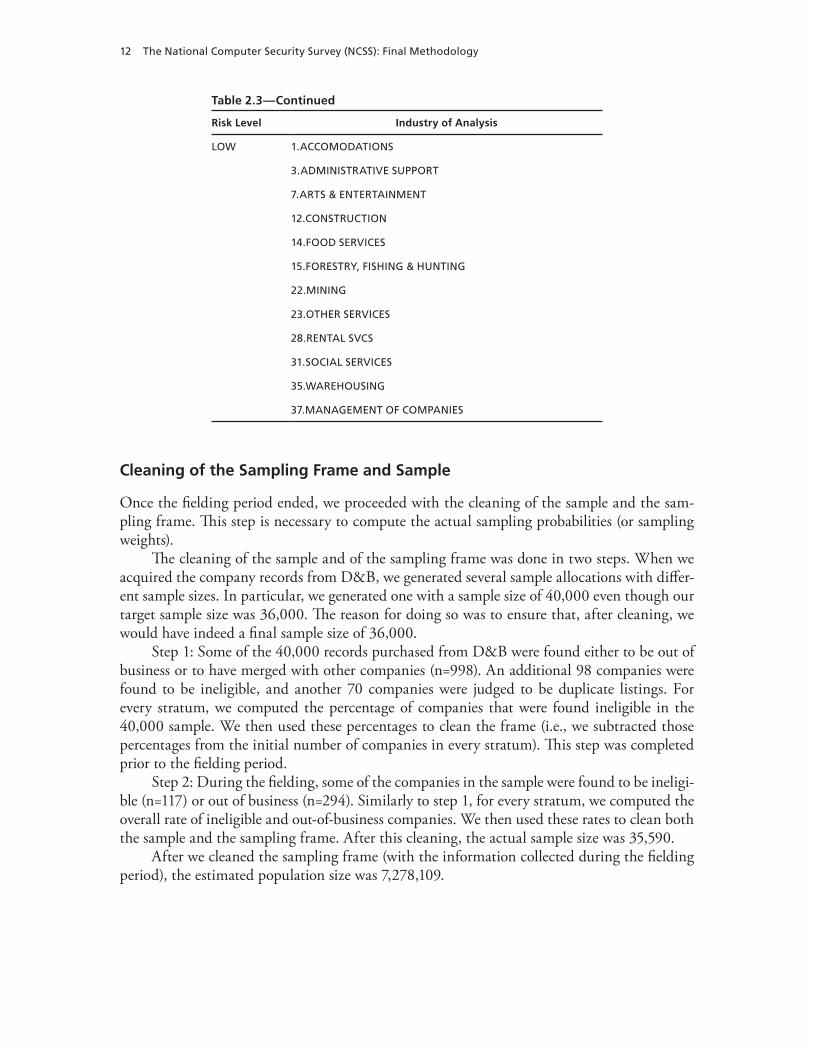
Cleaning of the Sampling Frame and Sample
Once the fielding period ended, we proceeded with the cleaning of the sample and the sam-pling frame. This step is necessary to compute the actual sampling probabilities (or sampling weights).
The cleaning of the sample and of the sampling frame was done in two steps. When we acquired the company records from D&B, we generated several sample allocations with differ-ent sample sizes. In particular, we generated one with a sample size of 40,000 even though our target sample size was 36,000. The reason for doing so was to ensure that, after cleaning, we would have indeed a final sample size of 36,000.
Step 1: Some of the 40,000 records purchased from D&B were found either to be out of business or to have merged with other companies (n=998). An additional 98 companies were found to be ineligible, and another 70 companies were judged to be duplicate listings. For every stratum, we computed the percentage of companies that were found ineligible in the 40,000 sample. We then used these percentages to clean the frame (i.e., we subtracted those percentages from the initial number of companies in every stratum). This step was completed prior to the fielding period.
Step 2: During the fielding, some of the companies in the sample were found to be ineligi-ble (n=117) or out of business (n=294). Similarly to step 1, for every stratum, we computed the overall rate of ineligible and out-of-business companies. We then used these rates to clean both the sample and the sampling frame. After this cleaning, the actual sample size was 35,590.
After we cleaned the sampling frame (with the information collected during the fielding period), the estimated population size was 7,278,109.
13
CHAPTER THREE
Sampling Strategy
Overview of the Stratified Sampling Strategy
For the NCSS, we adopted a stratified sampling design, since an important objective of the survey was to provide accurate estimates not only at the national level but also at the industry and company-size levels.
The sampling unit was the company, whether stand-alone or part of a large conglomer-ate. Branches and divisions were not considered a company; however, subsidiaries within large corporate trees were.
The variables we used to define the strata were industry (a 36-level categorical variable) and company size (a nine-level categorical variable). The U.S. economy was divided into 36 industries. For the definition of the 36 industries, we refer the reader to Table 2.2 in Chapter Two. Company size was defined as the total number of employees of a company. The total number of employees was defined as the sum of the employees at all the branches, divisions and subsidiaries belonging to a company in the case of a company with a complex corporate structure. This variable was then made categorical with nine size classes.
The strata were, therefore, defined by the interaction of these two variables. We also added nine other strata, one for every employment size class, called certainty strata. These nine certainty strata contain companies from the 36 industries that, because of their economic importance or size, were included in the sample with probability 1. So in total, we have 333 strata; however, 81 of the strata were empty, resulting in a total number of 252 sampling strata with at least one eligible sampling unit. The primary reason that some of the strata are empty is the certainty companies (for the definitions of certainty companies, please see the next section, Certainty Companies). In fact, in some instances, there is complete overlap between the larger companies and the certainty companies, therefore leaving many sampling strata empty.
The reason for creating the nine certainty strata was to make the sampling allocation cleaner. That is, in this way, companies sampled from one given stratum are sampled with the same sampling probability. If we had left the certainty companies in their own stratum, defined by their industry and company size, we would have ended up sampling some compa-nies with probability 1 and some with a probability less than 1 for some of the strata.
Certainty Companies
As noted, we sampled with 100-percent certainty several groups of companies because of their importance to the U.S. economy. We refer to these companies as certainty companies and refer
14 The National Computer Security Survey (NCSS): Final Methodology
to the process for including them as certainty sampling. In agreement with BJS, we decided that the companies satisfying the following criteria would be included in the sample with prob-ability 1.
Criteria defining the certainty companies were:
Fortune 1,000 companies, including all subsidiaries with 1,000 or more employees50 largest companies (by employment size) within each industry sectorcompanies with 5,000+ employees.
Treatment of Subsidiaries of Certainty and Noncertainty Companies
As discussed in Chapter Two, for the NCSS, the company was defined as the sampling unit. This meant that subsidiaries that were part of a large corporation but are companies in their own right were considered eligible sampling units. In particular, it was decided to treat com-panies (e.g., subsidiaries) belonging to some other company as independent sampling units. In other words, if a company owned another company, that link was broken, and both companies independently had a positive probability to be part of the sample (or the presence of a subsid-iary in the sample did not depend on the inclusion of its parent company in the sample).
The subsidiaries of some of the certainty companies were treated slightly differently only because of their overall importance. Criterion 1 in the list above states that not only the For-tune 1,000 ultimates (ultimate is the apex company of a large corporate tree) were included in the sample with probability 1, but also all their subsidiaries with 1,000 or more employees. The subsidiaries of the Fortune 1,000 companies with fewer than 1,000 employees were treated as any other subsidiary instead. That is, they had a positive probability of being included in the sample, and their inclusion in the sample did not depend on the inclusion of their ultimate.
In summary, all subsidiaries, with the exception of the subsidiaries of the Fortune 1,000 ultimates with 1,000 or more employees, had a positive probability to be sampled depending on the stratum to which they belonged.
Sample Allocation
As mentioned earlier, the NCSS data were collected with the intention of addressing multiple objectives. For example, the NCSS data were intended to provide accurate estimates of com-puter incidents by industry, company size, and whether they occurred at critical-infrastructure companies. It was therefore necessary to find a sample allocation that would be a good com-promise in achieving these contrasting goals. In fact, the optimal sample allocation that maxi-mizes precision across industries might not give adequate precision across company-size catego-ries. For this reason, we considered several allocations and chose the one that provided more homogenous effective sample sizes (ESSs) and precisions across industries and company-size classes.1 The adopted allocation was an adaptive one.
1 In this case, the ESS is the number of observations from a simple random sample needed to obtain an estimate with sampling variation equal to the sampling variation obtained when accounting for the finite population.
Sampling Strategy 15
Given a sample size of n sampling units to be allocated, we first allocate nc sampling units to the certainty strata. In other words, nc is the total number of certainty companies. We then allocate the remainder sample size (n–nc ) in the following way.
Allocate one sampling unit to all the nonempty strata (note that the certainty strata are 1. now excluded, since the certainty companies have already been sampled or allocated). If k is the number of nonempty strata, then k sampling units are allocated.Compute the ESS for every stratum, and assign the next sampling unit to the stratum 2. with the smallest ESS.Repeat 2 until (3. n–nc–k) sampling units have been allocated.
The ESS for stratum i is computed in the following way: ESSi = ni × (Ni–1) / (Ni–ni), where ni is the number of observations allocated to stratum i and Ni is the total number of companies in that stratum. Note that the ESSi is just given by the product of the sample size ni for stratum i and the finite population correction for that stratum, since, within a stratum, every company has the same probability of being sampled.
This allocation algorithm has several advantages. In particular, it can be easily modified to take into account other characteristics of interest. The algorithm as described deems all the strata equally important; however, it is easy to incorporate weights that weigh some industries more than others or give more weight to larger companies, for example. Lastly, the number of observations allocated to every stratum is an integer, and, therefore, a sample size of exactly of n units can be allocated.
We considered seven different sample allocations. One allocated the sampling units pro-portionally to the size of the strata. All the others used the algorithm just described. However, two allocations gave more weight to the larger companies. Two other allocations gave more weight to industries with a high risk rating. One allocation was a hybrid of the previous two types; i.e., it gave more weight to larger companies and to companies in higher-risk industries. Finally, the last allocation was the one described in the algorithm just given. We then assessed the seven allocations computing several summary statistics, such as the overall design effect, a weighted design effect with importance weights defined by company size and ESS, and standard errors by industry and company-size class. The chosen allocation had a very small weighted design effect and tended to have more-homogenous ESS and standard errors across industries and company-size classes than all the other considered allocations, therefore repre-senting the best compromise for the type of objectives that this survey data were intended to address.
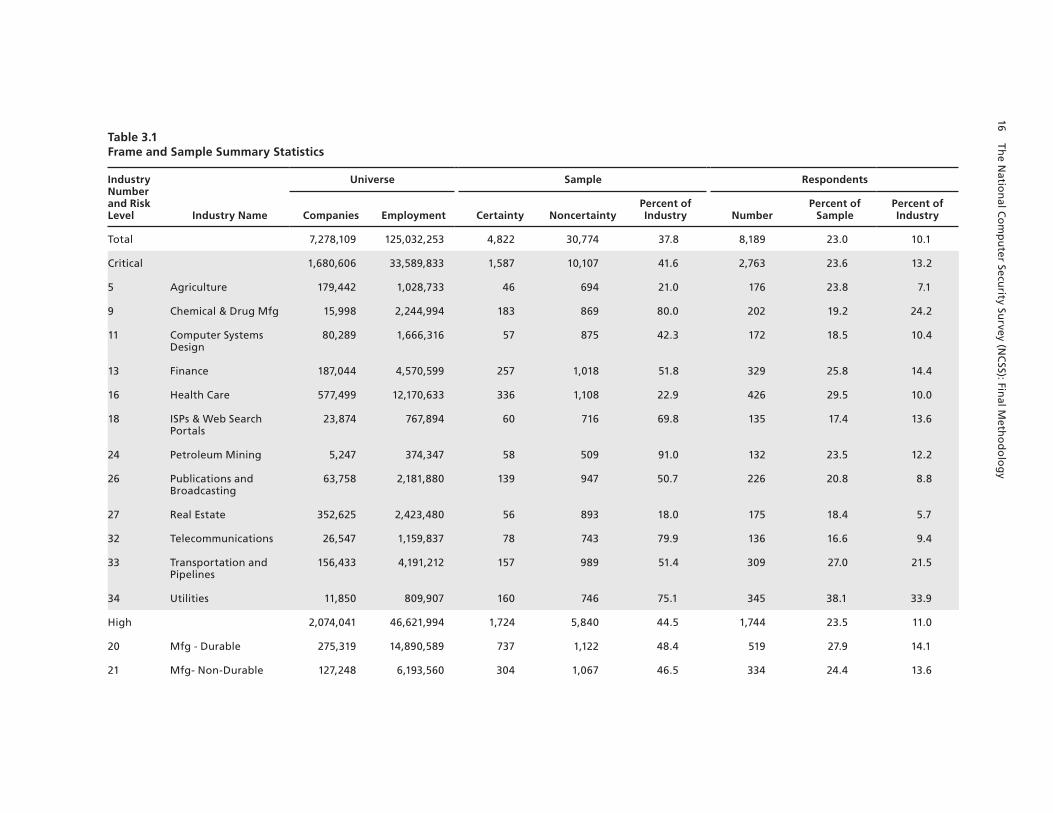
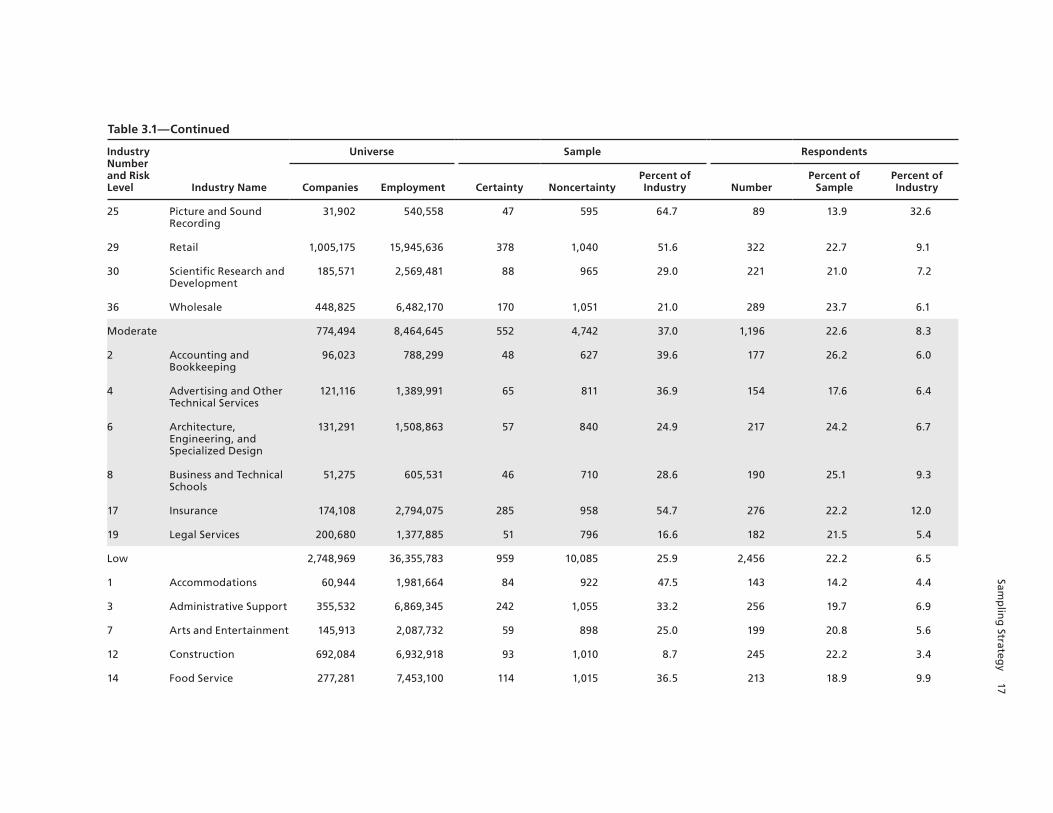
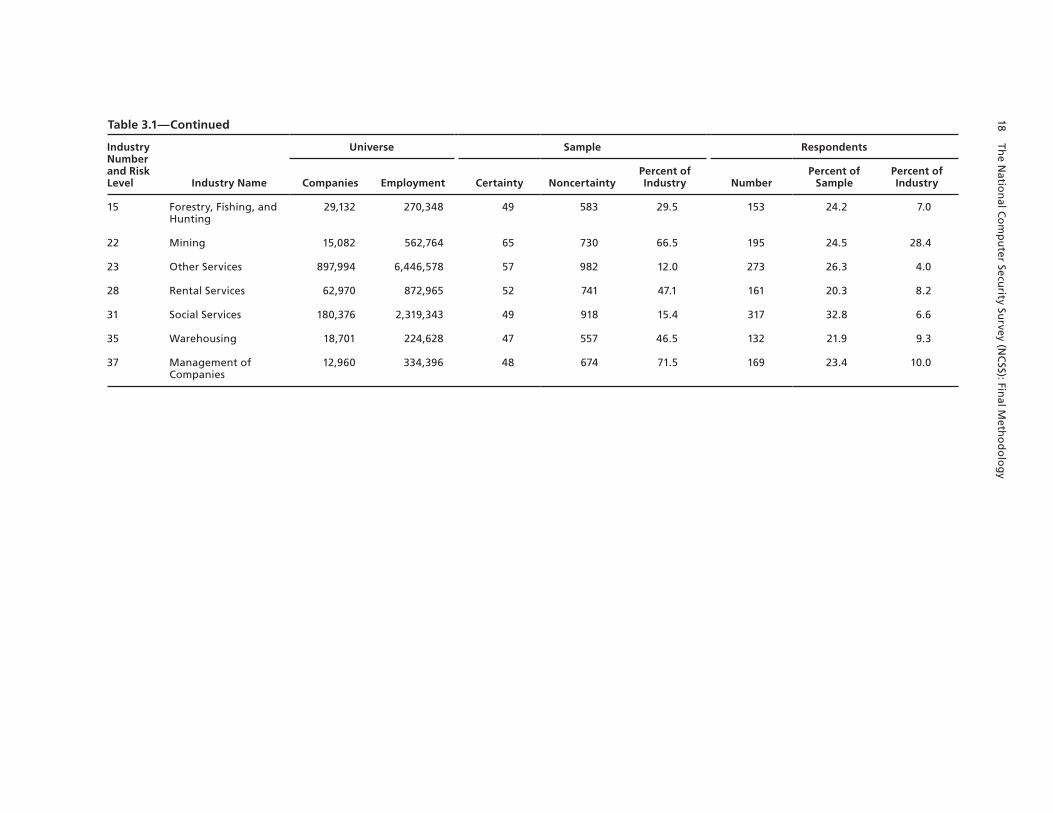
Frame and Sample Summary Statistics
Table 3.1 presents a summary of the sampling frame and summary statistics for the sample itself and respondents. The table is stratified by risk level and industry sector.
16 The N
ation
al Co
mp
uter Secu
rity Survey (N
CSS): Fin
al Meth
od
olo
gy
Table 3.1Frame and Sample Summary Statistics
Industry Number and Risk Level Industry Name
Universe Sample Respondents
Companies Employment Certainty NoncertaintyPercent of Industry Number
Percent of Sample
Percent of Industry
Total 7,278,109 125,032,253 4,822 30,774 37.8 8,189 23.0 10.1
Critical 1,680,606 33,589,833 1,587 10,107 41.6 2,763 23.6 13.2
5 Agriculture 179,442 1,028,733 46 694 21.0 176 23.8 7.1
9 Chemical & Drug Mfg 15,998 2,244,994 183 869 80.0 202 19.2 24.2
11 Computer Systems Design
80,289 1,666,316 57 875 42.3 172 18.5 10.4
13 Finance 187,044 4,570,599 257 1,018 51.8 329 25.8 14.4
16 Health Care 577,499 12,170,633 336 1,108 22.9 426 29.5 10.0
18 ISPs & Web Search Portals
23,874 767,894 60 716 69.8 135 17.4 13.6
24 Petroleum Mining 5,247 374,347 58 509 91.0 132 23.5 12.2
26 Publications and Broadcasting
63,758 2,181,880 139 947 50.7 226 20.8 8.8
27 Real Estate 352,625 2,423,480 56 893 18.0 175 18.4 5.7
32 Telecommunications 26,547 1,159,837 78 743 79.9 136 16.6 9.4
33 Transportation and Pipelines
156,433 4,191,212 157 989 51.4 309 27.0 21.5
34 Utilities 11,850 809,907 160 746 75.1 345 38.1 33.9
High 2,074,041 46,621,994 1,724 5,840 44.5 1,744 23.5 11.0
20 Mfg - Durable 275,319 14,890,589 737 1,122 48.4 519 27.9 14.1
21 Mfg- Non-Durable 127,248 6,193,560 304 1,067 46.5 334 24.4 13.6
Samp
ling
Strategy 17
Table 3.1—Continued
Industry Number and Risk Level Industry Name
Universe Sample Respondents
Companies Employment Certainty NoncertaintyPercent of Industry Number
Percent of Sample
Percent of Industry
25 Picture and Sound Recording
31,902 540,558 47 595 64.7 89 13.9 32.6
29 Retail 1,005,175 15,945,636 378 1,040 51.6 322 22.7 9.1
30 Scientific Research and Development
185,571 2,569,481 88 965 29.0 221 21.0 7.2
36 Wholesale 448,825 6,482,170 170 1,051 21.0 289 23.7 6.1
Moderate 774,494 8,464,645 552 4,742 37.0 1,196 22.6 8.3
2 Accounting and Bookkeeping
96,023 788,299 48 627 39.6 177 26.2 6.0
4 Advertising and Other Technical Services
121,116 1,389,991 65 811 36.9 154 17.6 6.4
6 Architecture, Engineering, and Specialized Design
131,291 1,508,863 57 840 24.9 217 24.2 6.7
8 Business and Technical Schools
51,275 605,531 46 710 28.6 190 25.1 9.3
17 Insurance 174,108 2,794,075 285 958 54.7 276 22.2 12.0
19 Legal Services 200,680 1,377,885 51 796 16.6 182 21.5 5.4
Low 2,748,969 36,355,783 959 10,085 25.9 2,456 22.2 6.5
1 Accommodations 60,944 1,981,664 84 922 47.5 143 14.2 4.4
3 Administrative Support 355,532 6,869,345 242 1,055 33.2 256 19.7 6.9
7 Arts and Entertainment 145,913 2,087,732 59 898 25.0 199 20.8 5.6
12 Construction 692,084 6,932,918 93 1,010 8.7 245 22.2 3.4
14 Food Service 277,281 7,453,100 114 1,015 36.5 213 18.9 9.9
18 The N
ation
al Co
mp
uter Secu
rity Survey (N
CSS): Fin
al Meth
od
olo
gy
Table 3.1—Continued
Industry Number and Risk Level Industry Name
Universe Sample Respondents
Companies Employment Certainty NoncertaintyPercent of Industry Number
Percent of Sample
Percent of Industry
15 Forestry, Fishing, and Hunting
29,132 270,348 49 583 29.5 153 24.2 7.0
22 Mining 15,082 562,764 65 730 66.5 195 24.5 28.4
23 Other Services 897,994 6,446,578 57 982 12.0 273 26.3 4.0
28 Rental Services 62,970 872,965 52 741 47.1 161 20.3 8.2
31 Social Services 180,376 2,319,343 49 918 15.4 317 32.8 6.6
35 Warehousing 18,701 224,628 47 557 46.5 132 21.9 9.3
37 Management of Companies
12,960 334,396 48 674 71.5 169 23.4 10.0
19
CHAPTER FOUR
Survey Methods and Fielding
Prior to RAND contracting with BJS to field the NCSS, BJS did a great deal of preparatory work in conjunction with the U.S. Census Bureau to develop a pilot computer-security survey instrument (at that time, called CSS) and to test the feasibility of fielding such a study among U.S. businesses. In 2001, the Census Bureau administered the CSS to 500 companies as a pilot test, whose “findings . . . illustrate[d] the feasibility and utility of a data collection program to be initiated in 2004 among some 36,000 businesses. . . .Results of this test demonstrated a need for an increased response rate to produce valid national estimates and a need to refine survey questions” (Rantala, 2004, p. 1). BJS subsequently awarded a contract to RAND in the fall of 2004 to field the national survey, designed to be nationally representative of U.S. busi-nesses’ experiences with computer-security incidents. The RAND project team began work shortly thereafter on the instrument adjustments and fielding design and methodology needed prior to implementation.
This chapter documents the overall testing of and revisions to the NCSS instrument with some comparisons to the 2001 CSS instrument; the initial fielding-strategy design and testing; fielding-strategy revisions based on testing; fielding implementation; and a summary of final response rates.
Instrument Development
The 2005 NCSS developed by BJS and given to RAND for testing was based closely on the 2001 CSS instrument used in the pilot test, with slight modifications made given changes in technology over a five-year period and with the addition of a limited number of new questions. BJS asked that RAND team–recommended changes to the instrument steer clear of a whole-sale rewrite that might diminish the benefit of the question-and-response–set testing that the Census Bureau had done prior to the fielding of the 2001 pilot.
In the Office of Management and Budget (OMB) application, three versions of the survey instrument were proposed, each tailored to a specific company size to reduce respondent burden. There were three versions that RAND tested:
standard form, for first and second packet mailings to companies with 25+ employeesshort form, for small companies (with fewer than 25 employees)conversion form, for those receiving the long form initially, to be used for nonrespondent conversion via the third and fourth survey-packet mailings.
20 The National Computer Security Survey (NCSS): Final Methodology
RAND’s Survey Research Group (SRG) tested the instruments by carrying out in-depth cognitive interviews. The cognitive-interview task was designed to achieve two goals: (1) iden-tify response error in the NCSS so as to maximize the reliability and the validity of the survey data gained through the NCSS instruments and (2) obtain information that would help inform the endorsement strategy for the survey. A third unintended, yet important, result of the inter-views was the capture of information on company information-technology (IT) structure, which later became critical to informing the NCSS sampling design and amending the survey instructions for companies regarding which parts of their companies they should report on (discussed in “Company-Structure and Fielding-Strategy Considerations”).
The RAND project team conducted 27 cognitive interviews with IT executives and related staff from a diverse range of industries and company sizes across the nation. Three sepa-rate protocols were used for this effort. The first protocol was based on the short version of the questionnaire and concentrated on testing both the response process and comprehension of the specific questions and response items. The second protocol represented the standard version of the questionnaire and focused on testing the overall flow of the questionnaire, concentrat-ing on comprehension of the questions, the terms used, and the respondent burden involved. The third version of the protocol was based on the details of Section III, “Types of Computer Security Incidents” in the questionnaire. Specifically, Section III asks respondents a series of questions about their experience with each of specific types of computer-security incidents, including embezzlement, theft of IP, fraud, computer viruses, electronic vandalism or sabo-tage, denial of service, and other computer-security incidents. The third version of the protocol tested both memory recall and definitions of the different terms used. Each interviewee was assigned to one of the three protocols, so that each interview focused exclusively on the items in that selected protocol.
Probes used in these semistructured interviews were based on items about which the BJS Project Manager had expressed concern, as well as items that the RAND project team antici-pated could be problematic. Overall, testing priority was given to new questions, questions with new response categories, questions about computer-security incidents, questions about mon-etary loss and costs, and questions related to networks accessed or affected, routes, reporting of incidents to organizations, reasons for not reporting, and offender/company relationship.
Key Modifications Made to the Survey Instrument
Overall, several major themes emerged, which fell generally into the following categories: clar-ity regarding improved ordering of question sets; individual questions deemed to be repeatedly problematic (linked to findings that the one-size-fits-all approach to question construction was not always successful); concerns about the survey length; and the importance of featured private-sector support and readily available benchmark reports as incentives to completion. The RAND team and BJS then met to discuss the recommendations, BJS approved a certain number of these and requested a few additional changes, and a final survey instrument was agreed upon. The macro-level changes recommended by the RAND team and accepted by BJS are documented next.
Restructuring of Survey Order. Cognitive testing revealed that certain panel sections were better suited to the technology-oriented audience being targeted, making these sections easier to answer for respondents and fostering a more positive (and less frustrating) initial expe-rience with the survey. These sections (computer viruses, denial-of-service attacks, electronic vandalism or sabotage) were more regularly encountered by the cognitive-testing respondents,
Survey Methods and Fielding 21
who, in turn, reflected the target audience for the 2005 NCSS. The testing team found that the remaining incident sections (embezzlement, fraud, and, to a lesser degree, theft of IP) were likely to need input or answering in full by other parties in the organization (and also were considered by the cognitive-interview subjects to be more sensitive in nature), strongly argu-ing for their inclusion following the sections that the targeted respondents could more easily answer. This reordering was tested during the latter half of the cognitive interviews and found to flow more naturally with respondents. Given this, the RAND team recommended reorder-ing of Section III for the panel-question sets accordingly. This recommendation was accepted by BJS and implemented in the 2005 NCSS.
Modification of Question-and-Response–Set Wording. Additionally, changes to some of the questions and response sets were recommended for minor modification based on inter-viewee feedback to improve data capture. BJS accepted some of these recommendations (e.g., divide current employees and current “other” workers into two separate perpetrator-response categories, as interviewees perceived them to contain substantially different risks), while others were not (e.g., collapse all “hacker” response categories into one with the option with an open comment field for recording country of origin, if known). The RAND team also recommended the addition of a question regarding computer-security incidents resulting from information obtained from a stolen laptop computer, given the rise in incidents based on this access point. BJS agreed to this addition. Finally, BJS requested that the 2001 section called Theft of Pro-prietary Information be divided into two sections: Theft of Intellectual Property and Theft of Personal or Financial Information. This change was executed as requested.
Company Structure. One of the final revelations from the cognitive interviews was that an assumption made earlier on—that companies’ IT structures for most conglomerates were centralized—was found not to be true in approximately half of the large companies inter-viewed. Instead, we found wide heterogeneity in how IT was structured among complex com-panies. For some, IT was integrated top to bottom, and a single chief security or technol-ogy officer at the ultimate company level could answer the survey’s questions about incident experiences across companies within that corporate family. For others, each company had its own IT structure, and, for an accurate report, each company in that family would have to be contacted. Still other corporate families reflected a mix of the two, with part of the corporate family integrated from an IT perspective but with other more recently acquired companies still operating and reporting IT activities separately. This limited some ultimate companies’ ready access to information about their subsidiaries’ experiences with computer-security incidents and, consequently, the ultimates’ ability to report for all their subsidiaries.
The information from the cognitive interviews also informed our sampling design and fielding protocol (to be discussed in greater detail in “Fielding Considerations”). The survey instrument’s instructions were revised to ask each company to report for all of its divisions and locations but to exclude subsidiaries, which could be contacted separately if sampled. However, knowing that the separation of this information would not be possible for all com-panies, a final question was added to the survey instrument to capture for whom the survey had been completed: “Does the information reported in this survey include this company or does it include this company and some or all of its subsidiaries?” If the response was SOME or ALL, the survey asked, “How many subsidiaries were included?” and “Please list subsidiaries included in this report.” This was a departure from the 2001 survey instrument, which asked companies to report for all divisions, locations, and subsidiaries. Appendix B provides the final questionnaire for the NCSS.
22 The National Computer Security Survey (NCSS): Final Methodology
Fielding-Strategy Considerations
Subsidiaries
As discussed previously, a key question for the project team during the design phase was how to most effectively survey large, complex companies with multiple subsidiaries. Two decisions made early on in the project affected the level of complexity faced during fielding:
As stated in the request for proposals (RFP), the NCSS would be a company-level versus an establishment-level survey.Each company and its subsidiaries would be placed in its proper industry sector to permit cross-sector comparisons.
To do justice to both of these objectives would require collecting information not only from each ultimate but also from a number of its subsidiaries separately. This meant that, for the large conglomerates, a large portion of the sample would potentially be tied up surveying these companies’ corporate family trees.
Following the 2001 pilot survey strategy of sending one survey per company family to each these large conglomerates could lead to several problems:
The respondent at the ultimate level of the pyramid may not have information for all the entities below it or may have this information for some types of questions (embezzlement, fraud) but not for others (denial-of-service attacks, computer-virus attacks).Analysts of the data would not know exactly for which entities within the organizational pyramid the respondent had reported.Companies within a pyramid could belong to multiple industry sectors that differ from that of the ultimate, making a clean breakdown of the data by industry sector impossible.
Thus, for the large conglomerates, a decision had to be made about which entities to treat as the reporting unit and a tailored survey-fielding and analytic strategy devised to ensure that
the data we received were as complete as possibleit was clear for which entities such data had been reportedthere was a strategy in place for dealing with omitted entities (i.e., when the ultimate responded only for itself but not its subsidiaries)at the time of analyzing the data, there would be agreement about how the large conglom-erates would be handled.
The decision was made to relax the definition of company, instead treating each subsidiary headquarters as both a sampling and reporting unit. We elected to survey the ultimate and a sample of subsidiaries beneath it individually. Each unit surveyed (the ultimate and the sample of subsidiaries beneath it) was asked to report information only about itself. As aforemen-tioned, this required modifications to the survey instructions about the definition of reporting entity and adding several new questions to the survey for data-validation purposes.
This decision also had implications for the survey-fielding strategy and analytic strategy regarding the reconciliation of overlapping cases. SRG staff allocated more time to reconcile inquiries from respondents about whether a company should report for itself as well as its sub-
Survey Methods and Fielding 23
sidiaries and what to do if a respondent were unable to disentangle information about itself from its subsidiaries. In many instances, inquiries were treated on a case-by-case basis, and, throughout the field period, new status codes were assigned to account for subsidiaries included with parent-company responses or parent companies responding for nonsampled subsidiaries.
Confidentiality
The need for confidentiality on the NCSS was of the utmost importance, since businesses were asked to provide sensitive information about computer-security issues that, if made public, could be detrimental to their reputations and the public’s perception of them. The agreement into which RAND entered with BJS and federal statutes under which the data were collected required that confidentiality be protected. The strategy for adhering to data-confidentiality and privacy-certification legislation included several parts:
the development of a detailed data-safeguarding plan (DSP),1 reviewed and approved by RAND’s Human Subjects Protection Committee (HSPC)a security audit of the vendor hosting the Web-based version of the surveya data-safeguarding review of the print vendor.
RAND’s DSP specified the standard operating procedures for the transmission of proj-ect data and their storage on RAND computer systems. Electronic transmission of data required the use of encrypted files using PGP-software2 public/private key combinations. In other instances, removable media were used to move data from one computer to another. The manual transfer of data was required, as the principal analyst used a computer that had no network access. Where collaboration was required, storage of computerized files on networked computers (e.g., the SRG phone center) was always on appliances in secured locations using password-protected computers that had no Internet access. In all instances, the sample data containing explicit identifiers were separate from substantive survey data.
Symantec was selected to conduct an assessment of RAND’s internal and Internet pres-ence. This included the detailed security audit of the Web-hosting vendor, Market Strate-gies International (MSI) and was expanded to include an application assessment of RAND’s Internet survey application and its host server. The audit of MSI was based on the ISO 17799 standard revised for this project’s requirements and including an application assessment of the Internet survey software employed. Beyond MSI’s overall security posture, the project insti-tuted procedures designed to “blind” MSI to respondents’ identities—both as companies and individuals.
Language regarding applicable privacy legislation was included on the survey instruments and the Web site. The survey implementation did not experience any breaches in data confi-dentiality. While a small number of companies self-identified via open-ended responses in the survey, confidentiality was maintained through several efforts: (1) in the analytic file, only Case IDs appear, not any company-identifying information and (2) all identifying informa-tion provided in open-ended questions was cleaned of identifying information before being
1 The DSP outlines overall responsibility for data safeguarding, how respondent identity will be protected, procedures for data transmittal, disclosure risks, audit and monitoring plans, client and respondent agreements, and data-safeguarding procedures.2 PGP stands for pretty good privacy.
24 The National Computer Security Survey (NCSS): Final Methodology
delivered to BJS. In this way, the data file would not reveal specific responses of a particular company that may have self-identified.
The project team periodically reviewed the DSP with RAND’s HSPC data-safeguarding expert and amended it to address unanticipated issues that arose during the course of fielding the survey.
Additional data-safeguarding efforts were undertaken in relation to the print vendor. The vendor had extensive experience in handling sensitive information for national educational and health surveys and so already was familiar with privacy-protection procedures. To ensure that the data-protection requirements were met for the NCSS, the RAND team additionally visited the printing facility to review its procedures for processing and handling materials and compli-ance with data-protection standards; required that the print vendor and subcontractors sign a nondisclosure agreement; and ensured that the vendor’s computing systems were on isolated networks with no Internet access.
Endorsements
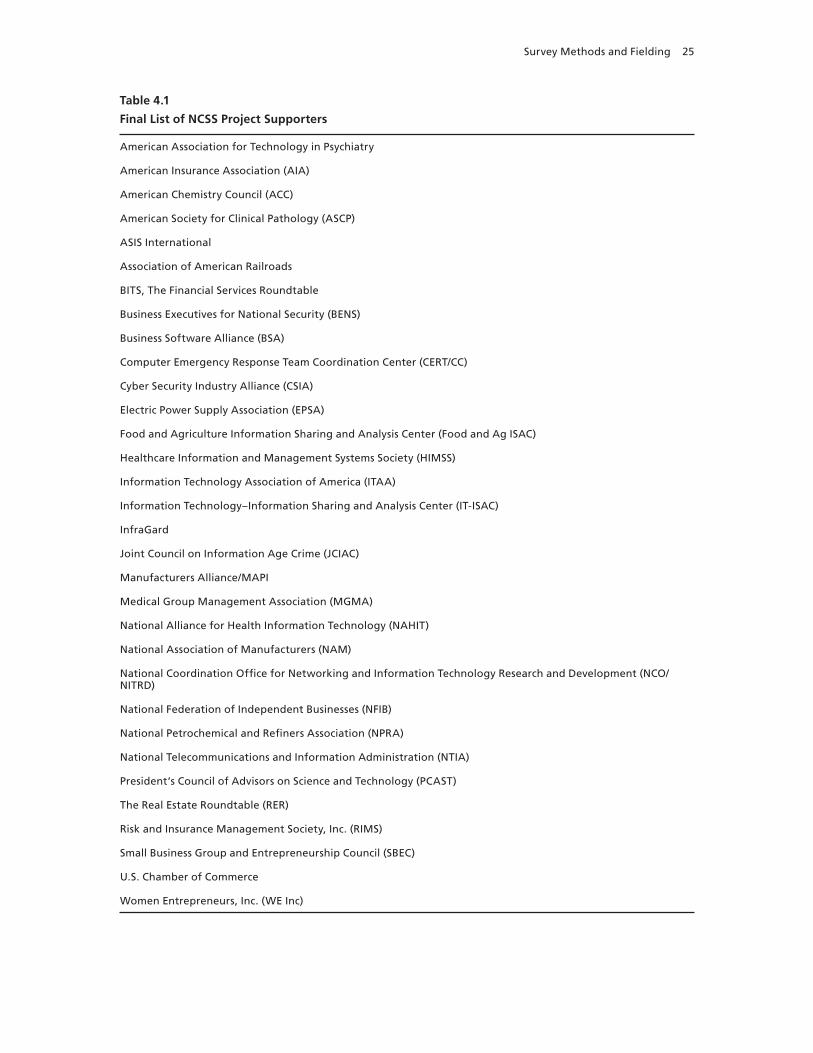
The RAND team and BJS worked hard to gain trade associations’ endorsements. The RAND team met either in-person or by telephone with more than 35 trade associations, participated in conference calls and individual trade-association meetings, and conducted telephone and email follow-up. Associations were asked to help get the word out about the survey by post-ing announcements in their newsletters or on their organizations’ Web sites, to provide quotes in support of the survey for use on the project Web site, and to send messages to their mem-berships to encourage participation in the survey. In addition to following up with previous contacts, BJS also called and met with more than a dozen organizations. Collectively, the RAND team and BJS had contacted approximately 50 organizations. A total of 32 organiza-tions agreed to be listed as project supporters (Table 4.1). In addition, quotes for use on the project Web site were obtained from 15 organizational leaders.
The RAND team developed a project Web site that listed the names of project sup-porters and informed industry, survey respondents, and endorsers about the purpose of the survey, provided additional information about the study, and encouraged participation. The Web site included a description of the project, information about the sponsors (DOJ/BJS and DHS/National Cyber Security Division [NCSD]), contact information for RAND and BJS, NCSS supporters’ information (includes a list of trade associations who have agreed to support this effort and quotes of support from trade-association leaders), frequently asked questions (FAQs), respondent information about how to participate in the survey, and privacy-policy information.
Survey Methods and Fielding 25
Table 4.1
Final List of NCSS Project Supporters
American Association for Technology in Psychiatry
American Insurance Association (AIA)
American Chemistry Council (ACC)
American Society for Clinical Pathology (ASCP)
ASIS International
Association of American Railroads
BITS, The Financial Services Roundtable
Business Executives for National Security (BENS)
Business Software Alliance (BSA)
Computer Emergency Response Team Coordination Center (CERT/CC)
Cyber Security Industry Alliance (CSIA)
Electric Power Supply Association (EPSA)
Food and Agriculture Information Sharing and Analysis Center (Food and Ag ISAC)
Healthcare Information and Management Systems Society (HIMSS)
Information Technology Association of America (ITAA)
Information Technology–Information Sharing and Analysis Center (IT-ISAC)
InfraGard
Joint Council on Information Age Crime (JCIAC)
Manufacturers Alliance/MAPI
Medical Group Management Association (MGMA)
National Alliance for Health Information Technology (NAHIT)
National Association of Manufacturers (NAM)
National Coordination Office for Networking and Information Technology Research and Development (NCO/NITRD)
National Federation of Independent Businesses (NFIB)
National Petrochemical and Refiners Association (NPRA)
National Telecommunications and Information Administration (NTIA)
President’s Council of Advisors on Science and Technology (PCAST)
The Real Estate Roundtable (RER)
Risk and Insurance Management Society, Inc. (RIMS)
Small Business Group and Entrepreneurship Council (SBEC)
U.S. Chamber of Commerce
Women Entrepreneurs, Inc. (WE Inc)
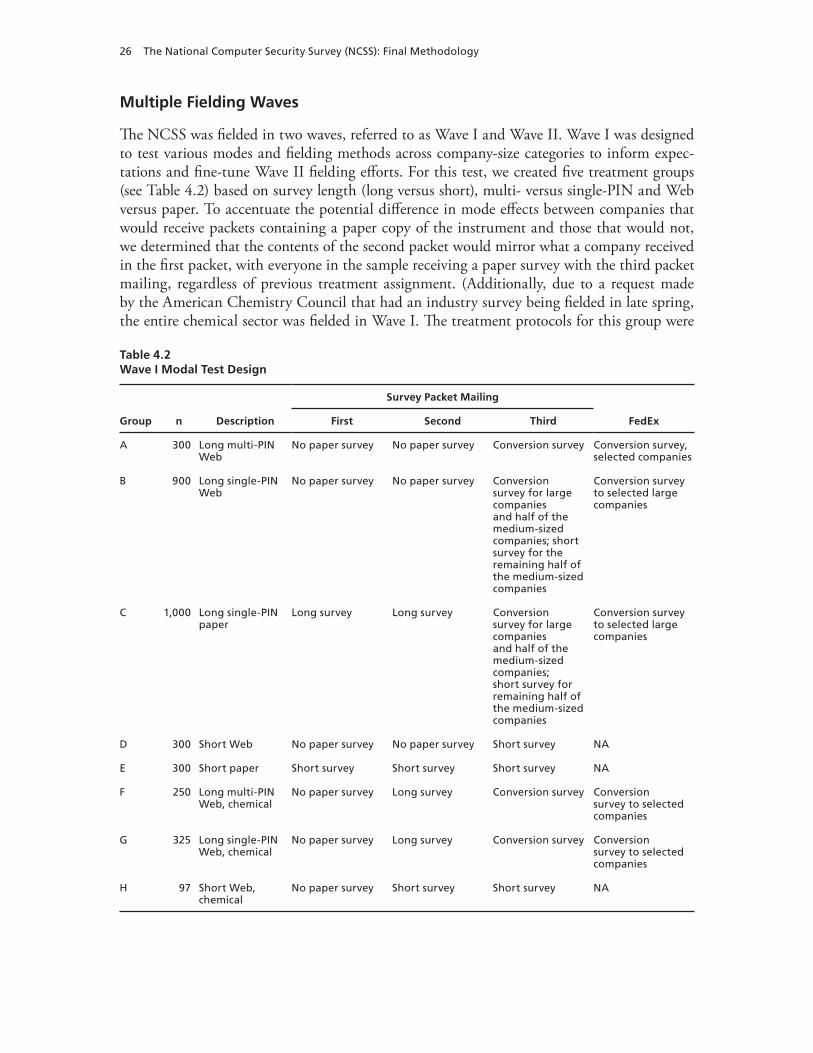
26 The National Computer Security Survey (NCSS): Final Methodology
Multiple Fielding Waves
The NCSS was fielded in two waves, referred to as Wave I and Wave II. Wave I was designed to test various modes and fielding methods across company-size categories to inform expec-tations and fine-tune Wave II fielding efforts. For this test, we created five treatment groups (see Table 4.2) based on survey length (long versus short), multi- versus single-PIN and Web versus paper. To accentuate the potential difference in mode effects between companies that would receive packets containing a paper copy of the instrument and those that would not, we determined that the contents of the second packet would mirror what a company received in the first packet, with everyone in the sample receiving a paper survey with the third packet mailing, regardless of previous treatment assignment. (Additionally, due to a request made by the American Chemistry Council that had an industry survey being fielded in late spring, the entire chemical sector was fielded in Wave I. The treatment protocols for this group were
Table 4.2Wave I Modal Test Design
Group n Description
Survey Packet Mailing
FedExFirst Second Third
A 300 Long multi-PIN Web
No paper survey No paper survey Conversion survey Conversion survey, selected companies
B 900 Long single-PIN Web
No paper survey No paper survey Conversion survey for large companies and half of the medium-sized companies; short survey for the remaining half of the medium-sized companies
Conversion survey to selected large companies
C 1,000 Long single-PIN paper
Long survey Long survey Conversion survey for large companies and half of the medium-sized companies; short survey for remaining half of the medium-sized companies
Conversion survey to selected large companies
D 300 Short Web No paper survey No paper survey Short survey NA
E 300 Short paper Short survey Short survey Short survey NA
F 250 Long multi-PIN Web, chemical
No paper survey Long survey Conversion survey Conversion survey to selected companies
G 325 Long single-PIN Web, chemical
No paper survey Long survey Conversion survey Conversion survey to selected companies
H 97 Short Web, chemical
No paper survey Short survey Short survey NA
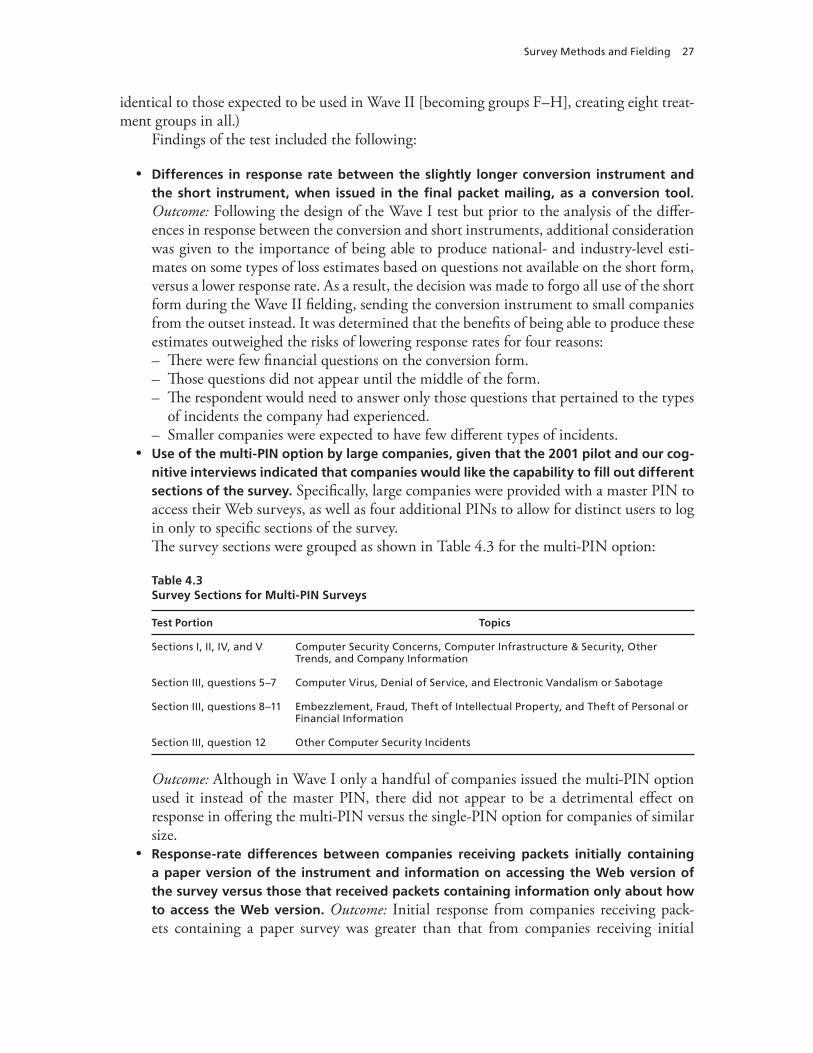
Survey Methods and Fielding 27
identical to those expected to be used in Wave II [becoming groups F–H], creating eight treat-ment groups in all.)
Findings of the test included the following:
Differences in response rate between the slightly longer conversion instrument and the short instrument, when issued in the final packet mailing, as a conversion tool. Outcome: Following the design of the Wave I test but prior to the analysis of the differ-ences in response between the conversion and short instruments, additional consideration was given to the importance of being able to produce national- and industry-level esti-mates on some types of loss estimates based on questions not available on the short form, versus a lower response rate. As a result, the decision was made to forgo all use of the short form during the Wave II fielding, sending the conversion instrument to small companies from the outset instead. It was determined that the benefits of being able to produce these estimates outweighed the risks of lowering response rates for four reasons:
There were few financial questions on the conversion form. –Those questions did not appear until the middle of the form. –The respondent would need to answer only those questions that pertained to the types –of incidents the company had experienced.Smaller companies were expected to have few different types of incidents. –
Use of the multi-PIN option by large companies, given that the 2001 pilot and our cog-nitive interviews indicated that companies would like the capability to fill out different sections of the survey. Specifically, large companies were provided with a master PIN to access their Web surveys, as well as four additional PINs to allow for distinct users to log in only to specific sections of the survey.The survey sections were grouped as shown in Table 4.3 for the multi-PIN option:
Table 4.3Survey Sections for Multi-PIN Surveys
Test Portion Topics
Sections I, II, IV, and V Computer Security Concerns, Computer Infrastructure & Security, Other Trends, and Company Information
Section III, questions 5–7 Computer Virus, Denial of Service, and Electronic Vandalism or Sabotage
Section III, questions 8–11 Embezzlement, Fraud, Theft of Intellectual Property, and Theft of Personal or Financial Information
Section III, question 12 Other Computer Security Incidents
Outcome: Although in Wave I only a handful of companies issued the multi-PIN option used it instead of the master PIN, there did not appear to be a detrimental effect on response in offering the multi-PIN versus the single-PIN option for companies of similar size.Response-rate differences between companies receiving packets initially containing a paper version of the instrument and information on accessing the Web version of the survey versus those that received packets containing information only about how to access the Web version. Outcome: Initial response from companies receiving pack-ets containing a paper survey was greater than that from companies receiving initial
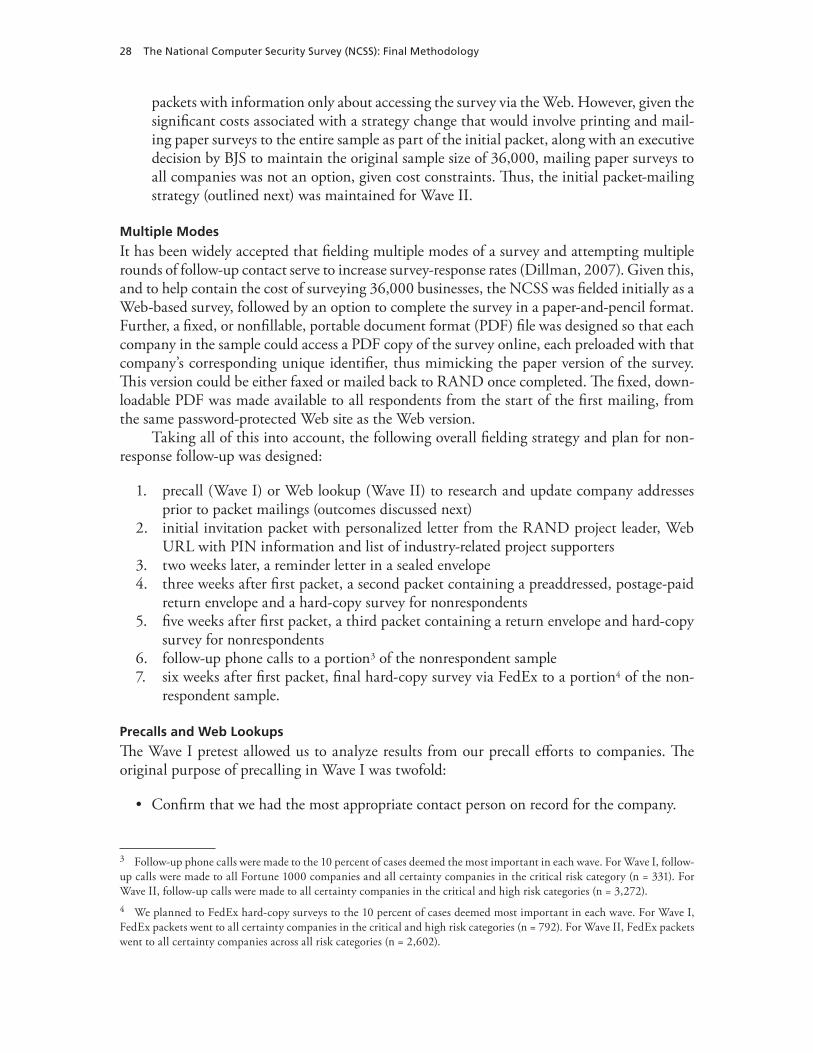
28 The National Computer Security Survey (NCSS): Final Methodology
packets with information only about accessing the survey via the Web. However, given the significant costs associated with a strategy change that would involve printing and mail-ing paper surveys to the entire sample as part of the initial packet, along with an executive decision by BJS to maintain the original sample size of 36,000, mailing paper surveys to all companies was not an option, given cost constraints. Thus, the initial packet-mailing strategy (outlined next) was maintained for Wave II.
Multiple Modes
It has been widely accepted that fielding multiple modes of a survey and attempting multiple rounds of follow-up contact serve to increase survey-response rates (Dillman, 2007). Given this, and to help contain the cost of surveying 36,000 businesses, the NCSS was fielded initially as a Web-based survey, followed by an option to complete the survey in a paper-and-pencil format. Further, a fixed, or nonfillable, portable document format (PDF) file was designed so that each company in the sample could access a PDF copy of the survey online, each preloaded with that company’s corresponding unique identifier, thus mimicking the paper version of the survey. This version could be either faxed or mailed back to RAND once completed. The fixed, down-loadable PDF was made available to all respondents from the start of the first mailing, from the same password-protected Web site as the Web version.
Taking all of this into account, the following overall fielding strategy and plan for non-response follow-up was designed:
precall (Wave I) or Web lookup (Wave II) to research and update company addresses 1. prior to packet mailings (outcomes discussed next)initial invitation packet with personalized letter from the RAND project leader, Web 2. URL with PIN information and list of industry-related project supporterstwo weeks later, a reminder letter in a sealed envelope3. three weeks after first packet, a second packet containing a preaddressed, postage-paid 4. return envelope and a hard-copy survey for nonrespondentsfive weeks after first packet, a third packet containing a return envelope and hard-copy 5. survey for nonrespondentsfollow-up phone calls to a portion6. 3 of the nonrespondent samplesix weeks after first packet, final hard-copy survey via FedEx to a portion7. 4 of the non-respondent sample.
Precalls and Web Lookups
The Wave I pretest allowed us to analyze results from our precall efforts to companies. The original purpose of precalling in Wave I was twofold:
Confirm that we had the most appropriate contact person on record for the company.
3 Follow-up phone calls were made to the 10 percent of cases deemed the most important in each wave. For Wave I, follow-up calls were made to all Fortune 1000 companies and all certainty companies in the critical risk category (n = 331). For Wave II, follow-up calls were made to all certainty companies in the critical and high risk categories (n = 3,272).4 We planned to FedEx hard-copy surveys to the 10 percent of cases deemed most important in each wave. For Wave I, FedEx packets went to all certainty companies in the critical and high risk categories (n = 792). For Wave II, FedEx packets went to all certainty companies across all risk categories (n = 2,602).
Survey Methods and Fielding 29
Confirm or update the mailing address in the database as the best mailing address for that contact and company.
The Wave I precalling effort made apparent that attempting to confirm or update the best contact person for the survey was a challenging task in advance of the survey mailing. Because the companies had not yet received any project materials and got only a very brief overview of the survey over the phone, the task of asking them to confirm the name of the appropriate contact person was complex and far more extensive than precalling activities would normally entail. As a result, the precalls ultimately focused on confirming and updating company mail-ing addresses. However, even obtaining this simple information for a number of cases took several rounds of routing through company phone systems, along with repeated explanations of the purpose of the mailing information. At the end of the Wave I precalling effort, 2 percent had confirmed their company’s name and address; 29 percent updated their name or address; and 2.5 percent were flagged for supervisor review (n = 853).
Since the Wave I precalls yielded only very basic information (mailing address) and even then were relatively inefficient (with an average of about 12 minutes per case), we switched to a Web lookup effort in place of the precalls to confirm and update mailing addresses for Wave II. Using this method, we saw the following improved results: 67 percent of the company names and addresses were confirmed through the Web lookup process, 29 percent were updated, and 4 percent were flagged for supervisor review (n = 3,951).
Incentive
All sampled companies were promised that they would be provided with a benchmark report for their company’s particular industry sector if they participated in the survey. While these benchmark reports have not yet been made available (because the release of the BJS report must precede them), the strategy by which the benchmark reports will be made available to companies follows. All companies that responded to the survey will be mailed a letter thank-ing them for their participation and directing them to a Web site from which their particular industry sector’s benchmark report can be downloaded. Each letter will contain a PIN to allow the company access to the report for its sector. These letters are to be mailed as soon as the BJS summary results for the NCSS are released.
Survey Implementation
Wave I. A total of 3,472 companies received surveys in the Wave I field period. The budget for fielding and printing of materials for Wave I was based on the assumptions that we would send the reminder letter to 100 percent of the sample; that we would have 15-percent response by the time of the second packet mailing; and that we would have 35-percent response by the time of the third packet mailing.
Two weeks following the first mailing, calls into the 800 number and activity on the Web survey began to spike. For a typical nonbusiness survey, this activity would have begun within a few days of the initial invitation being mailed, around the day that packets would arrive via U.S. Postal Service. For this business survey, although packets might have been received by the designated respondent in the same limited number of days for a small business with only a few employees, the routing of the survey packet through corporate mailrooms and into the hands of the designated respondent (and, in some cases, rerouted from there to a more appro-priate respondent) took far longer in large businesses with many employees. Consequently,
30 The National Computer Security Survey (NCSS): Final Methodology
many calls were received at the two-week mark indicating that respondents had just received the survey in their inboxes, some of whom were concerned about the two-week deadline men-tioned in the cover letter used for Wave I.
Given this issue, which explained the unexpectedly low response in the first two weeks, and given that two weeks after the initial mailing responses were still slowly increasing rather than decreasing, the RAND team and BJS decided to postpone the second packet mailing by one week while the last round of packets were evidently still “live” in the field. Best-practice survey-research methodology calls for projects to observe a peak and drop-off in response before fielding follow-up packets, and this decision was made with this in mind.
From a fielding-resource perspective and to avoid frustrating survey respondents by con-tinuing with the original fielding schedule, the NCSS fielding strategy was adjusted to allow for more time between mailings. The following revised fielding timeline was executed, with the last FedEx packet mailing taking place eight weeks following the first packet mailing:
two weeks after first packet mailed, reminder letter mailed1. three weeks after first packet, phone follow-up to certainty companies2. four weeks after first packet, second packet mailed to nonresponders3. seven weeks after first packet, third packet mailed4. eight weeks after first packet, fourth packet sent via FedEx to 10 percent of the 5. sample.
Based on the experiences in Wave I, two lessons emerged that informed changes to the fielding strategy for Wave II.
One, as noted, the use of precalls to update address information for companies was not deemed to be the most resource-efficient or effective method for achieving this goal. A Web lookup effort was devised as a replacement to the precalls to confirm or update mail-ing addresses for Wave II. During testing of the Web lookup task, an attempt was made to find contact names from the company’s Web site, but staff found that, like the phone calls, the Internet was not a useful tool for this type of search. Thus, this element of the prefielding updates to records was dropped. Instead, we asked that staff search for each business online and confirm or update the mailing address only. Under this model, the team was able to con-firm or update information for more than one case per minute (n=3,951).
Two, important lessons were learned from the Wave I follow-up calls that influenced our planning for Wave II follow-up calls. Most of the lessons influenced elements of interviewer training for Wave II, including informing calling staff that they needed to be particularly pre-pared to answer questions about confidentiality. Additionally, we learned that, often, contacts had seemingly not received the survey packet because of the complexities of corporate mail routing. This information was helpful for callers, since they needed to be prepared to explain the project to someone who likely had not yet seen any of the materials mailed to them.
In Wave II, changes were also made to the mailing packet. Two letters encouraging par-ticipation were added: a cover letter signed by BJS Director Jeffrey Sedgwick and a letter signed by Attorney General Alberto Gonzalez, and Secretary of Homeland Security Michael Cher-toff, describing the importance of the survey. And to better identify the official nature of the contents, the phrase “On behalf of the USDOJ and USDHS” was printed on the outside of the mailing envelope.
Survey Methods and Fielding 31
Wave II. A total of 32,517 cases received surveys in the Wave II fielding. Wave II was executed as listed here:
Web lookup for address confirmation and updatefirst packet mailed, PIN and Web-access information includedtwo weeks later, reminder letter mailed, PIN and Web-access information includedfive weeks after first packet mailed, second survey packet mailed, with paper survey included5
six weeks after first packet mailed, phone follow-up (lasted 10 days)10 weeks after first packet mailed, third survey packet mailed, with paper survey included6
12 weeks after first packet mailed, FedEx packet mailed, with paper survey included.
Download of Web Data. During the field period, data from MSI (the Web vendor host-ing the survey) was delivered to RAND through MSI’s product known as MSIClient™. Access to MSIClient required a secure certificate issued by MSI with an ID and password. All data files were encrypted using a public key issued by RAND using PGP and exchanged over a secure socket layer. Sample files were delivered to MSI using the same technology with encryp-tion using MSI’s public key.
Web Data Retrieval. Toward the end of Wave II fielding period, a programming error was uncovered in the standard Web version of the survey, which resulted in the first financial-loss question value in each computer-incident set (questions 5–12) of Section III being overwritten by the value for the second financial-loss question for each type of computer-security incident. For example, this affected questions where the respondent filled out both Q5j and Q5k and where the respondent left Q5k missing, making it impossible to distinguish between compa-nies that elected not to answer these items and companies whose responses were excluded. This programming error did not affect the Web conversion form, and the short form did not con-tain these questions. This particular problem was difficult to detect for several reasons: First, the questions in which the problem surfaced were the ones that we expected from the outset to be missing the most data, either because companies did not track this information and, thus, did not have the numbers available or because companies had confidentiality concerns about sharing this information. This meant that, in examining the distribution of missing data, the pattern looked as expected for these financial questions. Second, this programming error did not affect the Web conversion form. And third, when the data were downloaded, they appeared in the affected fields at the same rate as the other financial questions.
Once the source of the error was identified, the RAND team worked with the web vendor to correct the programming error and, after consulting with the HSPC, implemented the fol-
5 As we prepared the second packet mailing, we discovered that 14 percent of the responses that were deemed “good” by BJS were actually Web partials rather than fully completed forms. As a result, second packets were mailed to nonrespon-dents as well as to Web-survey respondents who were missing at least one complete section (89 percent of the sample). How-ever, second packets were not mailed to Web-survey respondents who answered at least part of each section but may have left some items missing or respondents who returned a paper survey, regardless of its completeness.6 Given that the partial cases had already had an opportunity to return to the survey and had not yet done so, and given that the packet mailing and instructions could not be tailored to indicate which portion of their survey was still outstand-ing, it was felt that the return on mailing this packet to partial responders would be marginal. Thus, the third packet was mailed strictly to nonrespondents (79 percent of the sample).
32 The National Computer Security Survey (NCSS): Final Methodology
lowing data-retrieval strategy: the RAND team recontacted by email (or by letter, if the email address was not available) the individuals who filled out the Web long survey form, explaining to them the issue and requesting that they return to an NCSS Web instrument to fill out the information for those few questions. The web vendor posted a revised Web survey that would direct the respondent immediately to only those financial questions in Section III for which they had answered the screener questions affirmatively. Follow up was done by email and by telephone for those who did not respond within two weeks.
In total, 1,391 companies were included in the data-retrieval effort, of which 557 (40.0 percent) responded with some data; 230 companies (16.5 percent) logged into the recontact form on the Web but did not report any data (blank rows); 604 (43.4 percent) of those con-tacted did not respond.
Fielding Respondent Inquiries. A toll-free number and a project email address were estab-lished for respondent questions. The use of both the 800 number and the email alias was higher than expected, and staff time was reallocated throughout the project to cover these tasks. A total of 1,480 incoming calls were received on the 800 number, and a total of 368 emails were received via the project address. The BJS Project Manager also reported receiving more than 130 direct calls.
Many respondents called in to check on the status of their survey or to report updated contact information (394 of 1,480 calls logged, or 26.6 percent). About 21 percent of the incoming calls were related to a request of some kind (e.g., request for a hard-copy version of the survey, confirmation that the survey had been received, need for a misplaced PIN). Approximately the same proportion (20.8 percent) called in about whether the survey was voluntary, what the deadline was for survey response, or similar questions. A total of 273 calls (18.4 percent) were related to issues with the survey (e.g., problems accessing the Web site, a company received multiple surveys). Finally, about 13 percent of incoming calls were to refuse participation in the survey.
Respondents also sent queries to the project’s email alias. As with the 800 number, most respondents contacted the project to check on the status of their survey or to report updated contact information (34.5 percent of all emails received). A total of 96 emails (26 percent) were related to issues with the survey. About 16.3 percent of the emails were related to a request of some kind. Emails to refuse participation accounted for 15.7 percent of email traffic, and 7.3 percent of emails were from respondents with questions about the survey.
Data Processing and Record Management. RAND’s SRG used a sophisticated record-management system (RMS) to trigger the appropriate follow-up task (reminder mailing versus reminder call). The RMS tracks the current status of each case in the sample, records the date of key events, and acts as inventory control to document the receipt of completed, partially completed, or blank self-administered questionnaires (SAQs). The RMS was used to track both the process status and the outcome of each case throughout the fielding period. Interim sta-tuses were used to inform operations while final statuses were provided to analysts.
Response-Rate Summary
Table 4.4 presents the final response rates by industry and by company size.
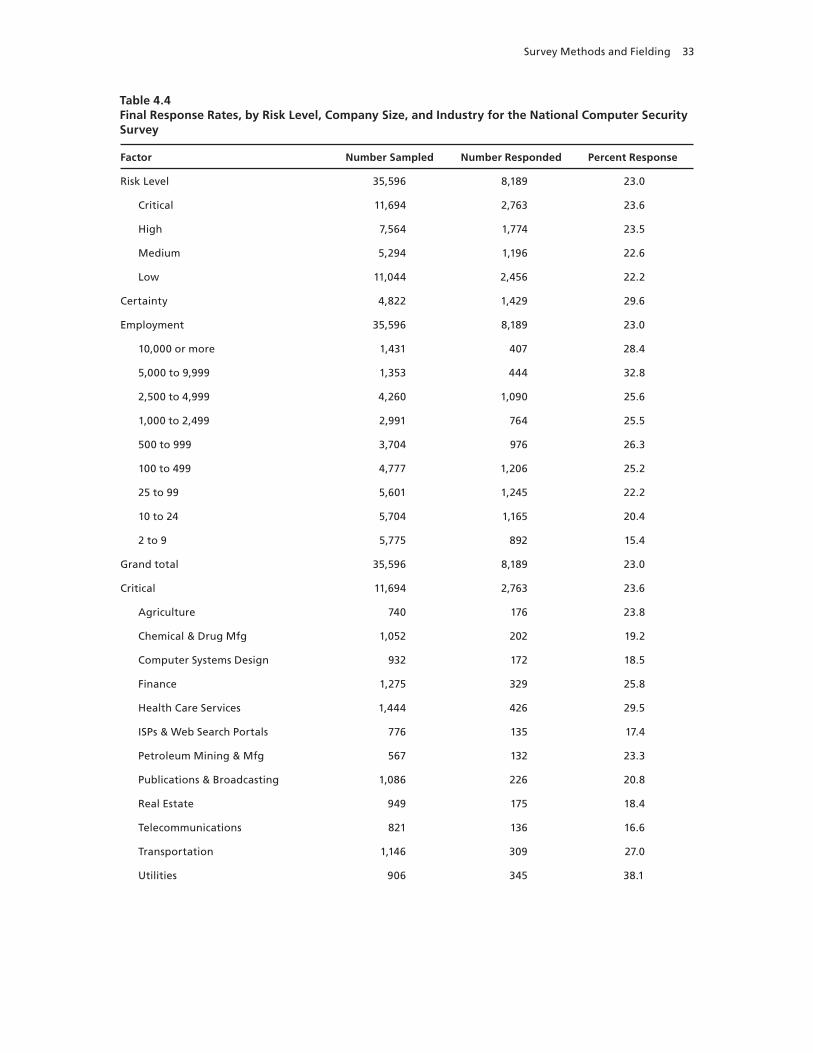
Survey Methods and Fielding 33
Table 4.4Final Response Rates, by Risk Level, Company Size, and Industry for the National Computer Security Survey
Factor Number Sampled Number Responded Percent Response
Risk Level 35,596 8,189 23.0
Critical 11,694 2,763 23.6
High 7,564 1,774 23.5
Medium 5,294 1,196 22.6
Low 11,044 2,456 22.2
Certainty 4,822 1,429 29.6
Employment 35,596 8,189 23.0
10,000 or more 1,431 407 28.4
5,000 to 9,999 1,353 444 32.8
2,500 to 4,999 4,260 1,090 25.6
1,000 to 2,499 2,991 764 25.5
500 to 999 3,704 976 26.3
100 to 499 4,777 1,206 25.2
25 to 99 5,601 1,245 22.2
10 to 24 5,704 1,165 20.4
2 to 9 5,775 892 15.4
Grand total 35,596 8,189 23.0
Critical 11,694 2,763 23.6
Agriculture 740 176 23.8
Chemical & Drug Mfg 1,052 202 19.2
Computer Systems Design 932 172 18.5
Finance 1,275 329 25.8
Health Care Services 1,444 426 29.5
ISPs & Web Search Portals 776 135 17.4
Petroleum Mining & Mfg 567 132 23.3
Publications & Broadcasting 1,086 226 20.8
Real Estate 949 175 18.4
Telecommunications 821 136 16.6
Transportation 1,146 309 27.0
Utilities 906 345 38.1
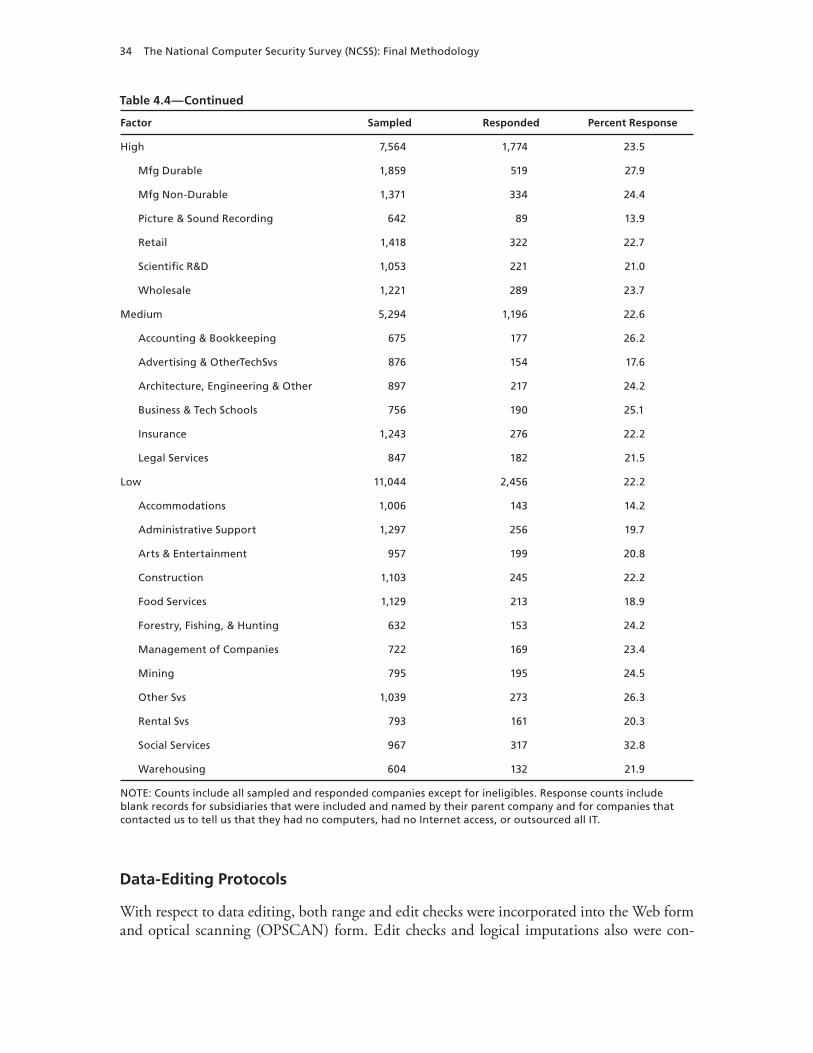
34 The National Computer Security Survey (NCSS): Final Methodology
Table 4.4—Continued
Factor Sampled Responded Percent Response
High 7,564 1,774 23.5
Mfg Durable 1,859 519 27.9
Mfg Non-Durable 1,371 334 24.4
Picture & Sound Recording 642 89 13.9
Retail 1,418 322 22.7
Scientific R&D 1,053 221 21.0
Wholesale 1,221 289 23.7
Medium 5,294 1,196 22.6
Accounting & Bookkeeping 675 177 26.2
Advertising & OtherTechSvs 876 154 17.6
Architecture, Engineering & Other 897 217 24.2
Business & Tech Schools 756 190 25.1
Insurance 1,243 276 22.2
Legal Services 847 182 21.5
Low 11,044 2,456 22.2
Accommodations 1,006 143 14.2
Administrative Support 1,297 256 19.7
Arts & Entertainment 957 199 20.8
Construction 1,103 245 22.2
Food Services 1,129 213 18.9
Forestry, Fishing, & Hunting 632 153 24.2
Management of Companies 722 169 23.4
Mining 795 195 24.5
Other Svs 1,039 273 26.3
Rental Svs 793 161 20.3
Social Services 967 317 32.8
Warehousing 604 132 21.9
NOTE: Counts include all sampled and responded companies except for ineligibles. Response counts include blank records for subsidiaries that were included and named by their parent company and for companies that contacted us to tell us that they had no computers, had no Internet access, or outsourced all IT.
Data-Editing Protocols
With respect to data editing, both range and edit checks were incorporated into the Web form and optical scanning (OPSCAN) form. Edit checks and logical imputations also were con-

Survey Methods and Fielding 35
ducted. Deduplication of survey responses was also done for companies that submitted mul-tiple surveys. We also summarize how the survey data were handled for companies that filled out the survey and included information about their subsidiary firms within their corporate structure. Appendix A presents a detailed summary of the data-editing protocols and checks done for the NCSS.

37
CHAPTER FIVE
Weighting Methodology and Nonresponse Analysis
Missing Data
In every survey, two types of missing data can arise: unit nonresponse and item nonresponse. Unit nonresponse occurs when the sampled unit either is not found or declines to participate. Item nonresponse occurs when a sampled unit responds to only some of the survey questions. It is customary to deal with the missing data arising from unit nonresponse with weights and with the missing data that arise from item nonresponse via imputation.
In agreement with the sponsor, we adopted this strategy, described further in Appendix A, limiting the imputation exercise only to logical imputation (as described next). Given the low unit-response rate and the nature of most of the questions in the survey instrument (i.e., questions that ask the respondent to “mark all that apply” of a list of possible answers), we decided not to perform imputations for certain types of item nonresponse. Similar to what was done for the pilot survey, we decided to perform logical imputation. For example, all the subsections in Section III of the survey instrument (types of computer-security incidents) start with a screener question asking whether that type of incident has been detected. If that item was missing but the respondent supplied a positive response to the financial-loss questions else-where in that subsection, then the screener question was imputed with a “yes.” Other similar logical imputations were implemented. See Appendix A for a detailed summary of the logical imputations done.
Nonresponse Analysis
Before describing in detail how we dealt with unit nonresponse, we briefly discuss the differ-ent typologies of missing data and their consequences on estimates. Rubin (1976) developed a typology or terminology for missing data, or, more precisely, for the distribution of miss-ingness. Such typology or terminology is widely used even though somewhat confusing and widely misunderstood. Rubin identified three different types of missing data: missing com-pletely at random (MCAR), missing at random (MAR), and missing not at random (MNAR). We describe these three types in very general terms.
MCAR means that the probability that a certain outcome is missing for a given subject does not depend either on the observed characteristics of the subject or on the outcome itself for this subject. If the MCAR assumption is correct, then the missing data do not bias esti-mates, but just have a consequence on the precision of the estimates due to the loss of sample size.
38 The National Computer Security Survey (NCSS): Final Methodology
MAR means that the probability that a certain outcome is missing for a given subject depends on some or all the observed characteristics of the subject but not on the outcome itself for this subject. If the MAR assumption holds and nothing is done to account for it, the estimates obtained using only the observed data are likely to be biased in addition to being less accurate. In the case of the NCSS, it is likely that larger companies have a lower response rate than smaller companies. It is also likely that the response rate varies by industry. Both the industry and company-size variables are observed or known both for the responders and for the nonresponders.
MNAR means that the probability that a certain outcome is missing for a given subject depends on the outcome itself. If the MNAR assumption holds, then the estimates obtained using the observed data will be biased (in addition to being less precise). In the case of the NCSS, it might be that the companies that have experienced a lot of cyberattacks tend to respond at a lower rate. However, if these differential response rates are explained by industry or company size, because only certain industries and companies of a certain size get attacked, the MNAR assumption will not hold after all and the MAR assumption is what we need.
MCAR, MAR, and MNAR are assumptions, and, as Schafer and Graham (2002) stressed, “there is no way to test whether MAR, for example, holds in a data set, except by obtaining follow-up data from non-respondents.” Schafer and Graham (2002) also argued that the MAR assumption is quite plausible in many situations. Even when the missing data have a distribution that does not satisfy the MAR assumption entirely, “Collins, Schafer and Kam (2001) demonstrate that in many realistic cases, an erroneous assumption of MAR may often have only a minor impact on estimates and standard errors.”
In what follows, we make the assumption that the missing data arising from unit nonre-sponse in NCSS follow the MAR assumption. This is the only feasible assumption to make for the NCSS data, given that all the techniques that deal with data that are assumed to be MNAR require the specification of a distribution for the missingness and of a model for the complete data. In other words, these methods require knowing beforehand what kind of analyses any potential analyst might want to do with the NCSS data. This, of course, is impossible, and we leave the freedom to make such an assumption to the potential users of the NCSS data.
However, we provide the general user of the NCSS data with nonresponse weights, built as a function of the interaction of the industry and company-size variables. In short, the weights derive from the probabilities of response, which we estimate from the data. Weight-ing can remove bias that is due to differential response rates associated with the variables used to estimate the response probabilities and nonresponse weights. Therefore, nonresponse weights work under the MAR assumption. Note that weights do not correct for biases related to unused or unobserved variables. In the NCSS case, the only variables that we observe for both the responders and nonresponders are industry and company size. Weighting has several advantages. In particular, it is nonparametric; therefore, it does not require assuming any par-ticular model for the complete data. In other words, it is a very versatile way to handle missing data. In addition, weights are easy to use, since modern statistical software packages allow the inclusion of weights.
Table 4.4 in Chapter Four presented a detailed summary of response rates for each indus-try sector, by risk category, employment size, and certainty companies. The nonresponse analy-ses were limited by the lack of information on the nonrespondents, which was restricted to the basic sampling frame data. We choose to look at nonresponse across industry, across employee size, and as an interaction of these two variables. Weighted tabulations of these showed highly
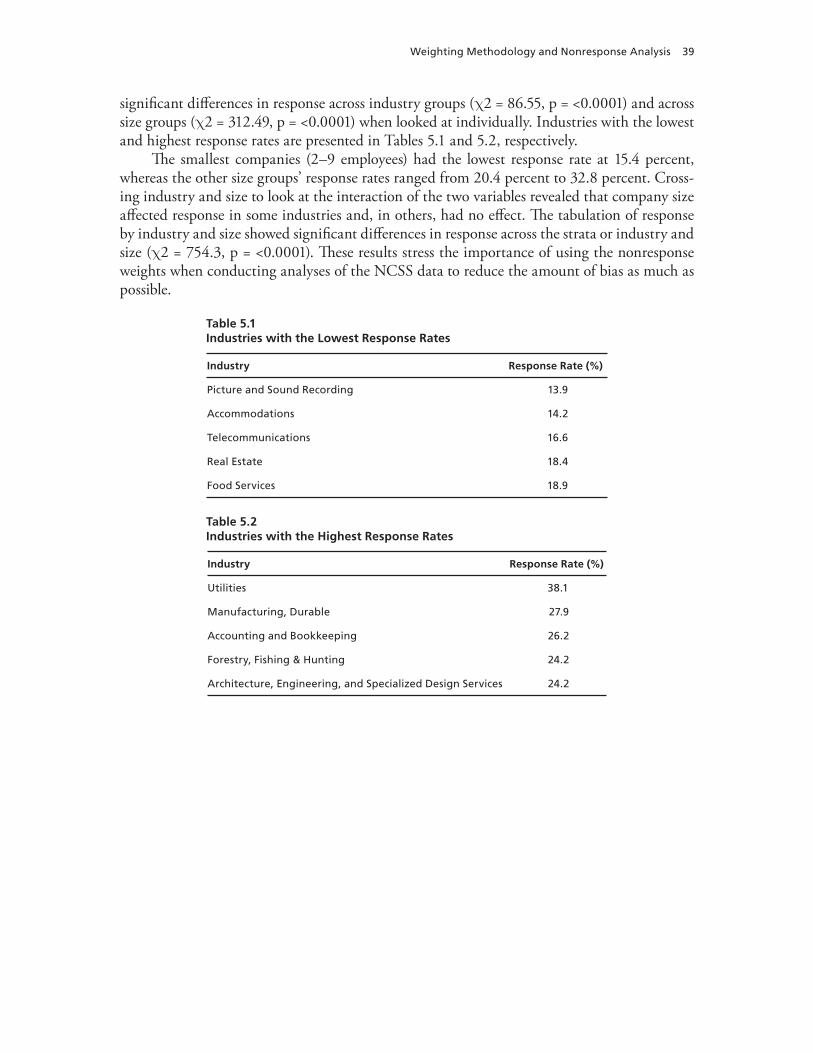
Weighting Methodology and Nonresponse Analysis 39
significant differences in response across industry groups ( 2 = 86.55, p = <0.0001) and across size groups ( 2 = 312.49, p = <0.0001) when looked at individually. Industries with the lowest and highest response rates are presented in Tables 5.1 and 5.2, respectively.
The smallest companies (2–9 employees) had the lowest response rate at 15.4 percent, whereas the other size groups’ response rates ranged from 20.4 percent to 32.8 percent. Cross-ing industry and size to look at the interaction of the two variables revealed that company size affected response in some industries and, in others, had no effect. The tabulation of response by industry and size showed significant differences in response across the strata or industry and size ( 2 = 754.3, p = <0.0001). These results stress the importance of using the nonresponse weights when conducting analyses of the NCSS data to reduce the amount of bias as much as possible.
Table 5.1Industries with the Lowest Response Rates
Industry Response Rate (%)
Picture and Sound Recording 13.9
Accommodations 14.2
Telecommunications 16.6
Real Estate 18.4
Food Services 18.9
Table 5.2Industries with the Highest Response Rates
Industry Response Rate (%)
Utilities 38.1
Manufacturing, Durable 27.9
Accounting and Bookkeeping 26.2
Forestry, Fishing & Hunting 24.2
Architecture, Engineering, and Specialized Design Services 24.2
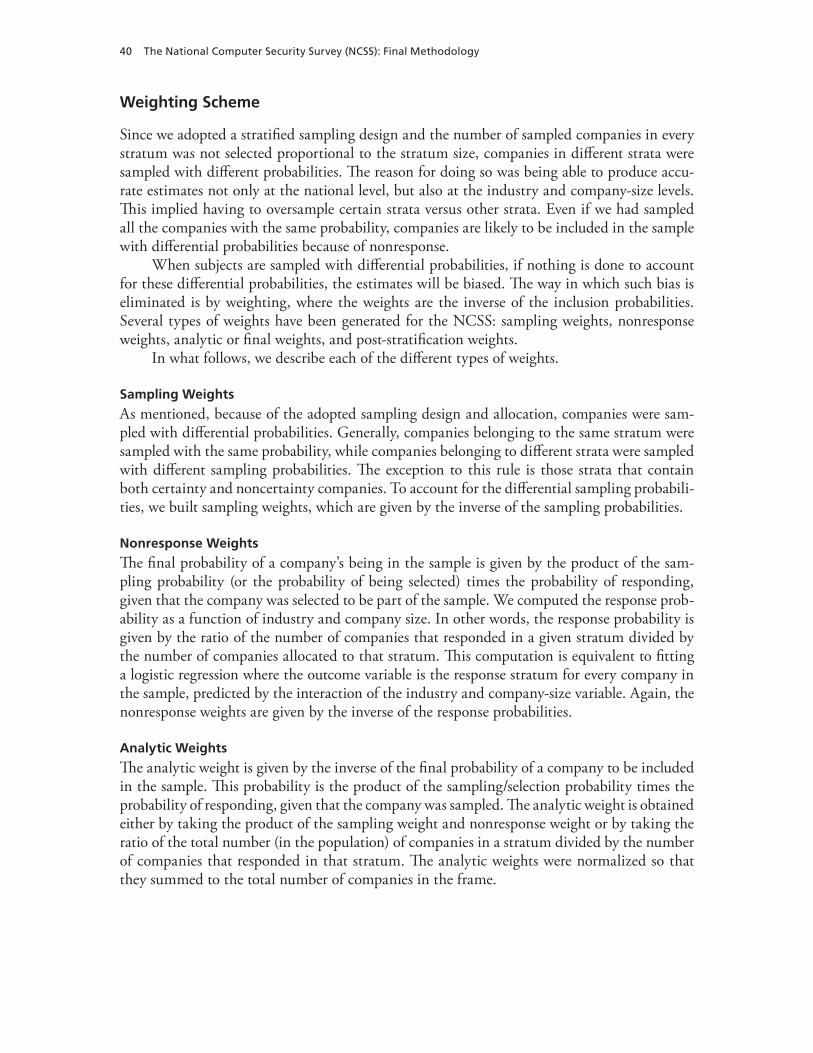
40 The National Computer Security Survey (NCSS): Final Methodology
Weighting Scheme
Since we adopted a stratified sampling design and the number of sampled companies in every stratum was not selected proportional to the stratum size, companies in different strata were sampled with different probabilities. The reason for doing so was being able to produce accu-rate estimates not only at the national level, but also at the industry and company-size levels. This implied having to oversample certain strata versus other strata. Even if we had sampled all the companies with the same probability, companies are likely to be included in the sample with differential probabilities because of nonresponse.
When subjects are sampled with differential probabilities, if nothing is done to account for these differential probabilities, the estimates will be biased. The way in which such bias is eliminated is by weighting, where the weights are the inverse of the inclusion probabilities. Several types of weights have been generated for the NCSS: sampling weights, nonresponse weights, analytic or final weights, and post-stratification weights.
In what follows, we describe each of the different types of weights.
Sampling Weights
As mentioned, because of the adopted sampling design and allocation, companies were sam-pled with differential probabilities. Generally, companies belonging to the same stratum were sampled with the same probability, while companies belonging to different strata were sampled with different sampling probabilities. The exception to this rule is those strata that contain both certainty and noncertainty companies. To account for the differential sampling probabili-ties, we built sampling weights, which are given by the inverse of the sampling probabilities.
Nonresponse Weights
The final probability of a company’s being in the sample is given by the product of the sam-pling probability (or the probability of being selected) times the probability of responding, given that the company was selected to be part of the sample. We computed the response prob-ability as a function of industry and company size. In other words, the response probability is given by the ratio of the number of companies that responded in a given stratum divided by the number of companies allocated to that stratum. This computation is equivalent to fitting a logistic regression where the outcome variable is the response stratum for every company in the sample, predicted by the interaction of the industry and company-size variable. Again, the nonresponse weights are given by the inverse of the response probabilities.
Analytic Weights
The analytic weight is given by the inverse of the final probability of a company to be included in the sample. This probability is the product of the sampling/selection probability times the probability of responding, given that the company was sampled. The analytic weight is obtained either by taking the product of the sampling weight and nonresponse weight or by taking the ratio of the total number (in the population) of companies in a stratum divided by the number of companies that responded in that stratum. The analytic weights were normalized so that they summed to the total number of companies in the frame.
Weighting Methodology and Nonresponse Analysis 41
Post-Stratification Weights
In addition to the sampling and nonresponse weights, we generated post-stratification weights.
As discussed previously, among the strata of our sampling design, we had created nine certainty strata: one for every company-size class. In other words, the certainty companies of a given size, independently of which industry to which they belong, were grouped together in the certainty stratum of that company-size class. This design decision was sensible, since it was thought that certainty companies had the same importance no matter which industry they belonged to, and, thus, it made sense to place the certainty companies in their own stra-tum. Also, this design decision was made under the assumption of attaining a 50 percent or higher response rate. Given the response pattern of the certainty companies, when computing the weighted frequencies by industry, these frequencies were not found to match the popula-tion counts. Therefore, we generated post-stratification weights to solve this problem. That is, post-stratification weights were needed to allow generation of industry-level counts that would match the industry counts in the frame.
From the strata of the original design, we eliminated the certainty strata, and we also col-lapsed the last three employment-size classes. This collapsing was necessary, because, for some of the large company-size classes and certain industries, no certainty company responded, leaving some strata (where these strata are defined by, for example, industry x and company-size class 9) with no respondents. This happened because certain strata, like the one described earlier, contained only certainty companies.
Therefore, the post-strata are defined by the interaction of the industry variable, with 36 levels, and a new employment-size variable with seven levels. This means that we are left with 252 strata or post-strata.
To compute the post-stratification weights, we first assigned the certainty companies to their own industry and size strata. Then we computed the percentage of companies in the population and the weighted (using the analytic weights) percentage of the companies in the sample falling into the post-strata. The post-stratification weights are given by the ratio of the first percentage divided by the second one.
When conducting analyses, the weight to be used is given by the product of the post-stratification weights times the analytic weights defined previously.
Examples of Weighted Estimates and Standard Errors
Presented here are three parts to an example on generating weighted estimates and standard errors using the SUDAAN software package. The parts include SUDAAN code, SUDAAN output, and a table presenting the data generated by the code and output.
The following SUDAAN code generates basic univariate statistics, such as estimates, sample sizes, and standard errors, for nine variables from the survey. The important details in the code are the design-specification options, which include the sample design method (design=strwor), the sampling stratification variable (nest stratnum), weighting variable (post_awt), and the total population counts (totcnt). These statements will be used with any of the SUDAAN procedures when analyzing the NCSS data.
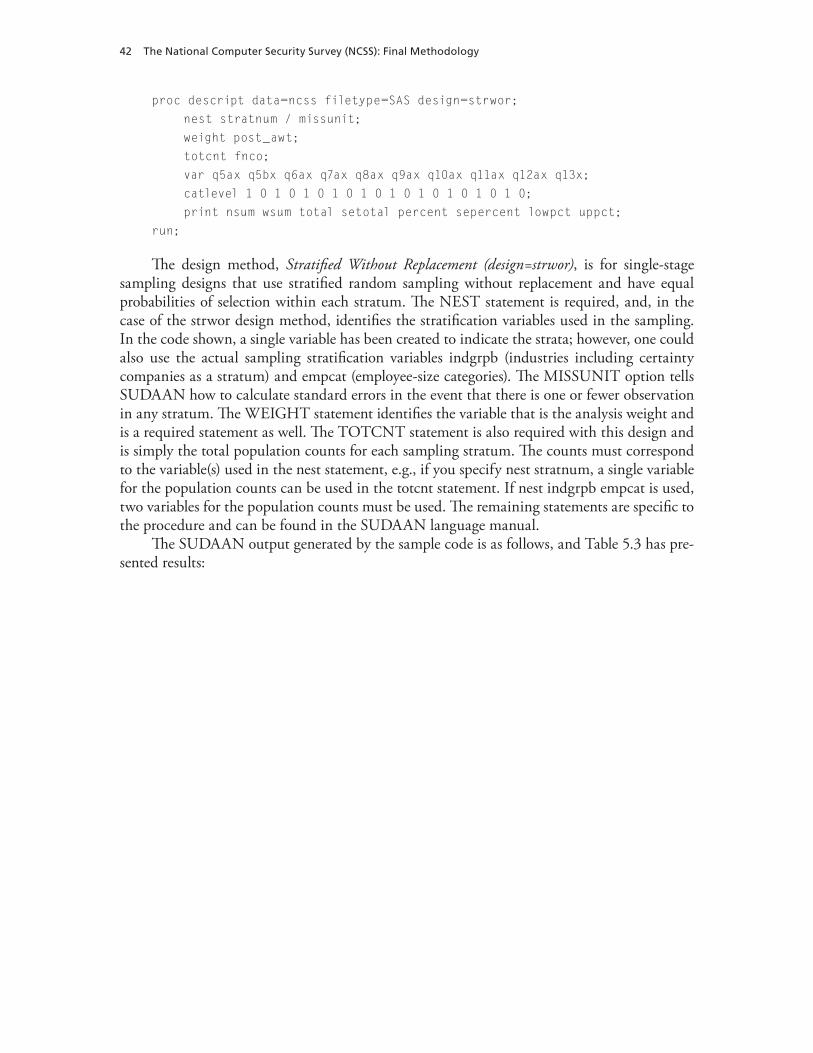
42 The National Computer Security Survey (NCSS): Final Methodology
proc descript data=ncss filetype=SAS design=strwor;
nest stratnum / missunit;
weight post_awt;
totcnt fnco;
var q5ax q5bx q6ax q7ax q8ax q9ax q10ax q11ax q12ax q13x;
catlevel 1 0 1 0 1 0 1 0 1 0 1 0 1 0 1 0 1 0 1 0;
print nsum wsum total setotal percent sepercent lowpct uppct;
run;
The design method, Stratified Without Replacement (design=strwor), is for single-stage sampling designs that use stratified random sampling without replacement and have equal probabilities of selection within each stratum. The NEST statement is required, and, in the case of the strwor design method, identifies the stratification variables used in the sampling. In the code shown, a single variable has been created to indicate the strata; however, one could also use the actual sampling stratification variables indgrpb (industries including certainty companies as a stratum) and empcat (employee-size categories). The MISSUNIT option tells SUDAAN how to calculate standard errors in the event that there is one or fewer observation in any stratum. The WEIGHT statement identifies the variable that is the analysis weight and is a required statement as well. The TOTCNT statement is also required with this design and is simply the total population counts for each sampling stratum. The counts must correspond to the variable(s) used in the nest statement, e.g., if you specify nest stratnum, a single variable for the population counts can be used in the totcnt statement. If nest indgrpb empcat is used, two variables for the population counts must be used. The remaining statements are specific to the procedure and can be found in the SUDAAN language manual.
The SUDAAN output generated by the sample code is as follows, and Table 5.3 has pre-sented results:
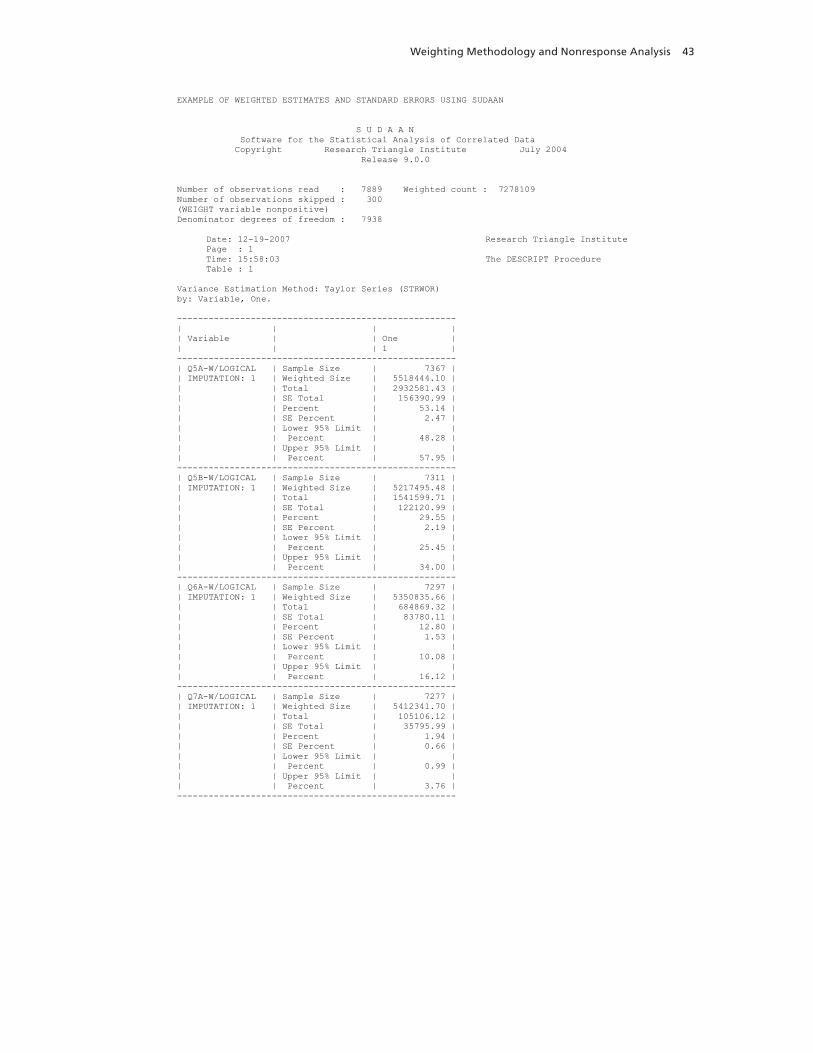
Weighting Methodology and Nonresponse Analysis 43
EXAMPLE OF WEIGHTED ESTIMATES AND STANDARD ERRORS USING SUDAAN
S U D A A N
Software for the Statistical Analysis of Correlated Data
Copyright Research Triangle Institute July 2004
Release 9.0.0
Number of observations read : 7889 Weighted count : 7278109
Number of observations skipped : 300
(WEIGHT variable nonpositive)
Denominator degrees of freedom : 7938
Date: 12-19-2007 Research Triangle Institute
Page : 1
Time: 15:58:03 The DESCRIPT Procedure
Table : 1
Variance Estimation Method: Taylor Series (STRWOR)
by: Variable, One.
-----------------------------------------------------
| | | |
| Variable | | One |
| | | 1 |
-----------------------------------------------------
| Q5A-W/LOGICAL | Sample Size | 7367 |
| IMPUTATION: 1 | Weighted Size | 5518444.10 |
| | Total | 2932581.43 |
| | SE Total | 156390.99 |
| | Percent | 53.14 |
| | SE Percent | 2.47 |
| | Lower 95% Limit | |
| | Percent | 48.28 |
| | Upper 95% Limit | |
| | Percent | 57.95 |
-----------------------------------------------------
| Q5B-W/LOGICAL | Sample Size | 7311 |
| IMPUTATION: 1 | Weighted Size | 5217495.48 |
| | Total | 1541599.71 |
| | SE Total | 122120.99 |
| | Percent | 29.55 |
| | SE Percent | 2.19 |
| | Lower 95% Limit | |
| | Percent | 25.45 |
| | Upper 95% Limit | |
| | Percent | 34.00 |
-----------------------------------------------------
| Q6A-W/LOGICAL | Sample Size | 7297 |
| IMPUTATION: 1 | Weighted Size | 5350835.66 |
| | Total | 684869.32 |
| | SE Total | 83780.11 |
| | Percent | 12.80 |
| | SE Percent | 1.53 |
| | Lower 95% Limit | |
| | Percent | 10.08 |
| | Upper 95% Limit | |
| | Percent | 16.12 |
-----------------------------------------------------
| Q7A-W/LOGICAL | Sample Size | 7277 |
| IMPUTATION: 1 | Weighted Size | 5412341.70 |
| | Total | 105106.12 |
| | SE Total | 35795.99 |
| | Percent | 1.94 |
| | SE Percent | 0.66 |
| | Lower 95% Limit | |
| | Percent | 0.99 |
| | Upper 95% Limit | |
| | Percent | 3.76 |
-----------------------------------------------------
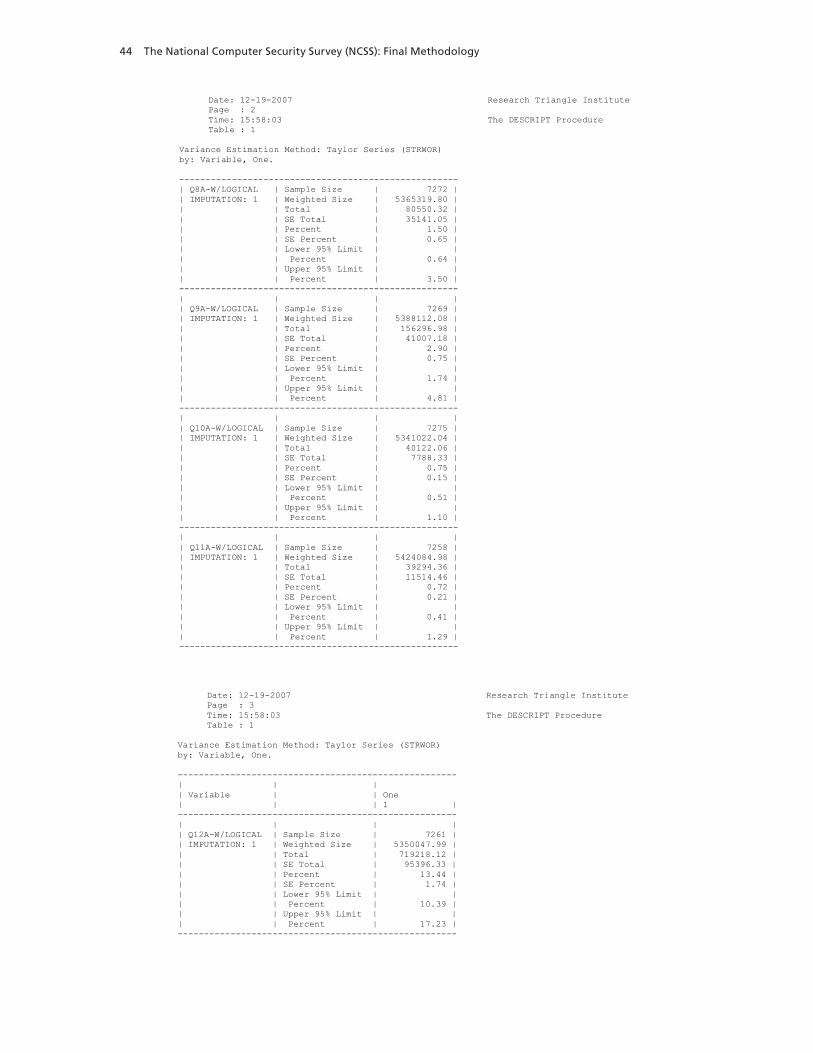
44 The National Computer Security Survey (NCSS): Final Methodology
Date: 12-19-2007 Research Triangle Institute
Page : 2
Time: 15:58:03 The DESCRIPT Procedure
Table : 1
Variance Estimation Method: Taylor Series (STRWOR)
by: Variable, One.
-----------------------------------------------------
| Q8A-W/LOGICAL | Sample Size | 7272 |
| IMPUTATION: 1 | Weighted Size | 5365319.80 |
| | Total | 80550.32 |
| | SE Total | 35141.05 |
| | Percent | 1.50 |
| | SE Percent | 0.65 |
| | Lower 95% Limit | |
| | Percent | 0.64 |
| | Upper 95% Limit | |
| | Percent | 3.50 |
-----------------------------------------------------
| | | |
| Q9A-W/LOGICAL | Sample Size | 7269 |
| IMPUTATION: 1 | Weighted Size | 5388112.08 |
| | Total | 156296.98 |
| | SE Total | 41007.18 |
| | Percent | 2.90 |
| | SE Percent | 0.75 |
| | Lower 95% Limit | |
| | Percent | 1.74 |
| | Upper 95% Limit | |
| | Percent | 4.81 |
-----------------------------------------------------
| | | |
| Q10A-W/LOGICAL | Sample Size | 7275 |
| IMPUTATION: 1 | Weighted Size | 5341022.04 |
| | Total | 40122.06 |
| | SE Total | 7788.33 |
| | Percent | 0.75 |
| | SE Percent | 0.15 |
| | Lower 95% Limit | |
| | Percent | 0.51 |
| | Upper 95% Limit | |
| | Percent | 1.10 |
-----------------------------------------------------
| | | |
| Q11A-W/LOGICAL | Sample Size | 7258 |
| IMPUTATION: 1 | Weighted Size | 5424084.98 |
| | Total | 39294.36 |
| | SE Total | 11514.46 |
| | Percent | 0.72 |
| | SE Percent | 0.21 |
| | Lower 95% Limit | |
| | Percent | 0.41 |
| | Upper 95% Limit | |
| | Percent | 1.29 |
-----------------------------------------------------
Date: 12-19-2007 Research Triangle Institute
Page : 3
Time: 15:58:03 The DESCRIPT Procedure
Table : 1
Variance Estimation Method: Taylor Series (STRWOR)
by: Variable, One.
-----------------------------------------------------
| | |
| Variable | | One
| | | 1 |
-----------------------------------------------------
| | | |
| Q12A-W/LOGICAL | Sample Size | 7261 |
| IMPUTATION: 1 | Weighted Size | 5350047.99 |
| | Total | 719218.12 |
| | SE Total | 95396.33 |
| | Percent | 13.44 |
| | SE Percent | 1.74 |
| | Lower 95% Limit | |
| | Percent | 10.39 |
| | Upper 95% Limit | |
| | Percent | 17.23 |
-----------------------------------------------------
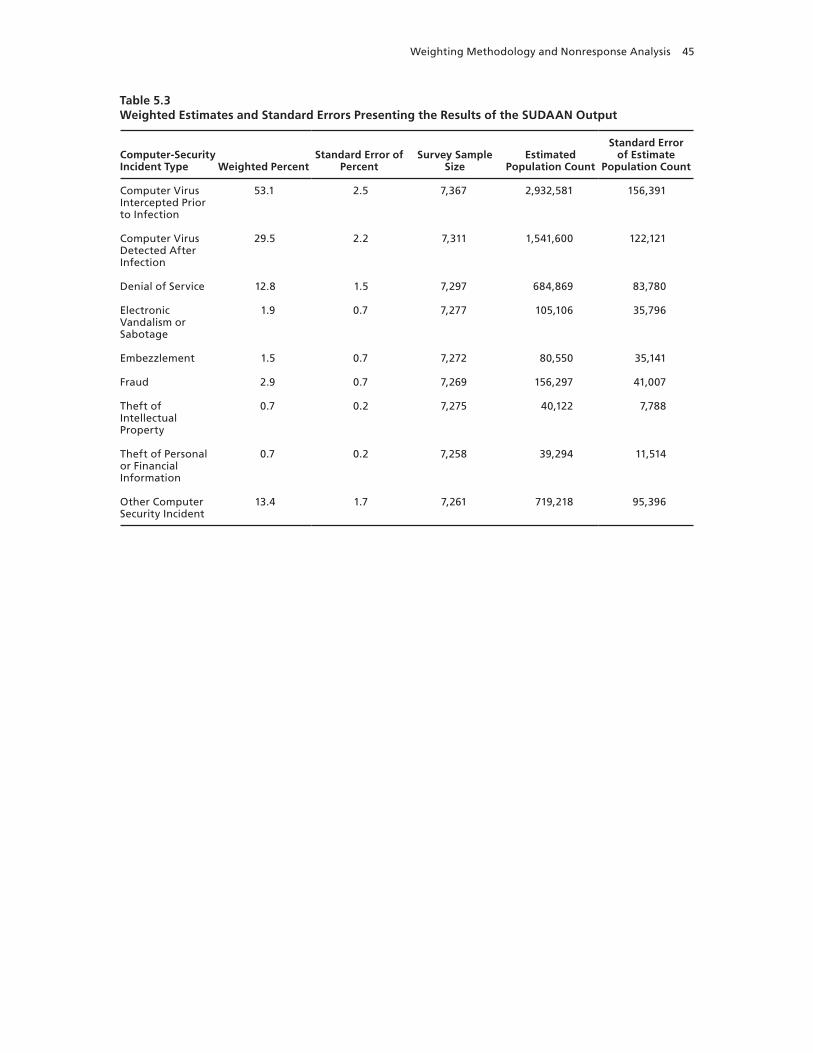
Weighting Methodology and Nonresponse Analysis 45
Table 5.3Weighted Estimates and Standard Errors Presenting the Results of the SUDAAN Output
Computer-Security Incident Type Weighted Percent
Standard Error of Percent
Survey Sample Size
Estimated Population Count
Standard Error of Estimate
Population Count
Computer Virus Intercepted Prior to Infection
53.1 2.5 7,367 2,932,581 156,391
Computer Virus Detected After Infection
29.5 2.2 7,311 1,541,600 122,121
Denial of Service 12.8 1.5 7,297 684,869 83,780
Electronic Vandalism or Sabotage
1.9 0.7 7,277 105,106 35,796
Embezzlement 1.5 0.7 7,272 80,550 35,141
Fraud 2.9 0.7 7,269 156,297 41,007
Theft of Intellectual Property
0.7 0.2 7,275 40,122 7,788
Theft of Personal or Financial Information
0.7 0.2 7,258 39,294 11,514
Other Computer Security Incident
13.4 1.7 7,261 719,218 95,396

47
APPENDIX A
Range and Edit Checks and Other Data Cleaning Procedures
48 The National Computer Security Survey (NCSS): Final Methodology
This appendix is organized in the following sections:
A. Range and edit checks incorporated into the web form and optical scanning
(OPSCAN) form.
B. Edit checks and logical imputations conducted for data cleaning and editing.
C. Survey responses that included subsidiaries.
D. De-duplication of survey responses for companies that submitted multiple
surveys.
RANGE AND EDIT CHECKS INCORPORATED INTO THE WEB FORM AND
OPSCAN.
1) Check Box Questions with a Limit.
The questions in this category are: 1a, 1b
For the OPSCAN, we recorded as data *all* boxes that were checked,
even if they exceed the stated limit. For the Web version, a maximum
of three checks was imposed. All fill-in-the-blank information was
retained, even if the corresponding check box was not checked.
The Web form has been programmed so that there is no limit to how much
“written” information a respondent can enter. On the paper/scannable form, if there
was a written response in the “Other�Specify” field—the person responsible for
verification would type in the response. Therefore, all of the written responses in
these fields would be captured.
2) Check Box Questions without a Limit.
The questions in this category are: 2a, 2b, 3a, 3d, 4a, 4b, 4c, 4d, 5c, 5d,
5e, 5g, 5h, 6b, 6c, 6d, 6f, 6g, 7b, 7c, 7d, 7f, 7g, 8b, 8c, 8d, 8f, 8g, 9b,
9c, 9d, 9f, 9g, 10b, 10c, 10d, 10e, 10g, 10h, 11b, 11c, 11d, 11e, 11g,
11h, 12b, 12c, 12d, 12e, 12g, 12h, 14, 15, 17, 21
• Record as data *all* boxes that were checked.
• Record as data any fill-in-the-blank information, even if the corresponding
check box isn't checked.
Range and Edit Checks and Other Data Cleaning Procedures 49
• Accept any character (except blank/space) as a valid check mark; it doesn't
have to be "x" or "X".
• If a "None" or "Not applicable" or "Never" or "Don't know" box is
checked in addition to other checkboxes,
� If the form is being filled in interactively, query the user about the
discrepancy
� If not interactive (paper), ignore the "None, etc." checkbox if there
is other valid information checked or written in
The Web form has been programmed so that there is no limit to how
much “written” information a respondent can enter.
3) Yes/No Type Questions.
Questions in this category are: 4e, 5a, 13, and 15
Edit checks programmed into the web form for these questions were:
• If one box is checked, record that information.
• If neither box is checked, but the (optional) numeric field is filled in, treat as
a "yes" and record that numeric data;
• If two or more of "yes" and "no" and (for certain questions) "don't know" are
checked and the form is being filled in interactively, query the user about the
discrepancy.
• For question 13, allow up to six digits for an integer response to "How many
incidents..."
4) Yes/No Screener Questions.
These questions are at the beginning of subsections, to determine if the
questions in the subsection are applicable.
Questions in this category are: 5b, 6a, 7a, 8a, 9a, 10a, 11a, and 12a.
Edit checks programmed into the Web Form for these questions were:
• If a “no” response is given to a screener question, the subsequent questions
in that sub-section are skipped.
• For the OPSCAN, this could not be automated, thus it was made part of the
data cleaning specifications.
50 The National Computer Security Survey (NCSS): Final Methodology
5) Percentage Questions.
Questions in this category are: 3c, 16, 18b
For these questions, a valid non-blank answer is an integer from 0 to 100
inclusive. Allow three digits for an integer response. Blank is treated as "no
response".
For the OPSCAN equipment, any additional marks such as a “period” will
come up as
“unrecognizable” by the OPSCAN equipment. These will be reviewed by the
verifier and corrected to ensure accurate capture of this data.
6) "Number of Incidents" Questions. (number of incidents were detected, number
that were reported, etc.)
Questions in this category are: 5f, 6e, 7e, 8e, 9e, 10f, 10k, 11f, and 12f.
Edit checks programmed into the Web Form for these questions were:
• For these questions, the response allows for six digits
• Only written zeroes should be treated as zero. Blanks should be treated as
missing.
In addition:
• the answer in 5f should be less than or equal to the answer in 5b
• the answer in 6e should be less than or equal to the answer in 6a
• the answer in 7e should be less than or equal to the answer in 7a
• the answer in 8e should be less than or equal to the answer in 8a
• the answer in 9e should be less than or equal to the answer in 9a
• the answers in 10f and 10k should each be less than or equal to the
answers in 10a
• the answer in 11f should be less than or equal to the answer in 11a
• the answer in 12f should be less than or equal to the answer in 12a
If any of the above conditions are not true, the response is flagged.
7) Number of Hours Questions.
Questions in this category are: 5i, 6h, 7h, and 12i.
• The answer should be a non-negative integer.
• Blank is treated as a non-response.
• Six digits are allowed for the response.
Range and Edit Checks and Other Data Cleaning Procedures 51
8) Dollar Value Questions.
These questions ask for a dollar value, separated into millions, thousands, and
hundreds (hard-coded on the form). Questions in this category are: 3b, 5j, 5k, 6i, 6j,
7i, 7j, 8h, 8i, 9h, 9i, 10i, 10j, 11i, 11j, 12j, 12k, 18a
• Divide all dollar value variables by 1000 to make consistent with the paper
data.11
• All of the "thousands" data should be an integer between 0 and 999.
• In question 18a, since there's a billions field, the "millions" integer should be
between 0 and 999.
• For the billions field, allow two digits.
• When there is no billions field, the millions field can be larger than 999; in
that case, allow 5 digits for the millions field.
For the 16 dollar values listed in the table below (5j thru 12k) all
values are allowed subject to the number of digits specified above.
Incident type Dollars spent to
recover
Other monetary
losses and costs
5 virus 5j 5k
6 denial of service 6i 6j
7 vandal/sabotage 7i 7j
8 embezzlement 8h (value taken) 8i
9 fraud 9h (value taken) 9i
10 theft of IP 10i (value taken) 10j
11 theft of personal
info
11i (value taken) 11j
12 other 12j 12k
9) Other Data Questions.
Question 19 (number of employees).
• Allow 9 digits for the response.
• Blank is treated as a non-response.
Question 20 has check boxes for calendar year 2005 or fiscal year 2005 (only
one should be checked). If box 20.02 is checked the month(s) should be an integer
11 Due to a programming error, the dollar values had to be divided by 1000 to
correct for the web vendor mistakenly multiplying these values by 1000.
52 The National Computer Security Survey (NCSS): Final Methodology
from 1 to 12, and the year should be either a 4-digit number from 2003 to 2006, or
else a two-digit number from 03 to 06 (which should be interpreted as 2003 to 2006,
respectively). The second date shouldn't exceed the current date. If the second date
is less than the first date, the response is flagged for human review.
Question 21 has two check boxes. Exactly one should be checked. If the
second box is checked, a 2-digit integer should appear in the "number of
subsidiaries" box.
EDIT CHECKS AND LOGICAL IMPUTATIONS CONDUCTED FOR DATA
CLEANING AND EDITING
General Edits:
1) All dollar value variables are expressed in thousands (1000s). Variables
affected are: q3b, q5j, q5k, q6i, q6j, q7i, q7j, q8h q8i, q9 h, q9i, q10i, q10j,
q11i, q11j, q12j, q12k, q18a.
2) All percentage variables have range checks. Values below 0 are set to 0;
values above 100 are set to 100. Variables affected are: q3c, q16, q18b.
3) Inconsistencies between Section III screener questions and the subsequent
non-trivial data are resolved. Data reported for at least one of the following
concepts: count of incidents, dollars spent to recover, or other monetary
losses or costs is considered a non-trivial response. (Example: if q5b not
equal 1 and data is provided in the follow-up questions q5bcnt or q5j or q5k,
then we logically impute q5b=1). Screener variables affected are: q5b, q6a,
q7a, q8a, q9a, q10a, q11a, q12a.
4) Logically checked that the number of incidents reported is less than or equal
to the number of incidents detected. (Example: q5f <= q5bcnt). If the
number reported is greater than the number detected, then the number
reported is capped at the value of the number detected. Variables affected:
q5f, q6e, q7e, q8e, q9e, q10f, q11f, and q12f.
Range and Edit Checks and Other Data Cleaning Procedures 53
5) If they do not report how many incidents were detected, however they do
report how many incidents were reported to agencies, then the number
detected is imputed to be equal to the number reported. Variables for
number detected are: q5bcnt, q6acnt, q7acnt, q8acnt, q9acnt, q10acnt,
q11acnt, q12acnt.
6) If the only response for which organization they reported the detected
incidents to is “None of the Above” (q5e9=1), then the number of incidents
reported is logically imputed to zero. Variables for number reported are:
q5f, q6e, q7e, q8e, q9e, q10f, q11f, q12f.
7) If any open-ended response question is completed, but its respective check
box is not checked we logically impute the check box =1.
8) If a "check-all-that-apply"" question has a response of none, not applicable,
or don’t know, as well as other boxes checked, then logically impute this
check box to zero. Variables affected are: q3d, q4b, q4c, q4d, q5c, q5d,
q5e, q6b, q6c, q6d, q7b, q7c, q7d, q8b, q8c, q8d, q9b, q9c, q9d, q10c, q10d,
q10e, q11c, q11d, q11e, q12c, q12d, and q12e.
Variable Specific Edits:
1) Question 4d: If the response to q4d indicates that a vulnerability/risk
assessment was conducted, but none are listed in questions q4a or q4b, then
we impute q4a to be consistent with q4d.
2) Question 4a: Anything reported in question q4b should also be reported in
q4a. Check boxes in q4a are imputed to reflect boxes checked in q4b.
3) Question 10k: A logic check was made to insure that the number of
incidents detected involving digital products is less than or equal to the
number of total incidents detected (q10k <= q10acnt). If the logic check
failed (q10k > q10acnt) then digital products incidents are capped at the total
number of incidents of theft of intellectual property (if q10k > q10acnt then
q10k=q10acnt).
54 The National Computer Security Survey (NCSS): Final Methodology
4) Question 13: If there was inconsistency between the dichotomous y/n
variable about stolen laptop incidents and number of incidents reported, then
the yes/no variable was imputed appropriately Example: If q13 is not equal
to 1 and q13cnt>0 then logically impute q13=1.
5) Question 20: If q20 is blank and dates are provided, then q20 is logically
imputed to be equal to “Fiscal year or other time period” (q20=2).
6) Question 20: Dates reported are edited to a consistent format. If they
indicated a reporting period other than calendar year then all dates reported
are logically imputed to a consistent format.
7) Question 21: If q21 is blank and the number of subsidiaries is non-zero
(q21a>0), then q21 is imputed to be yes. Example: if q21 is null and q21a
>=1 then q21=1.
SURVEY RESPONSES THAT INCLUDED SUBSIDIARIES
In some cases, companies filled out the survey including information for
subsidiary firms within their corporate structure. We determined this from the
response to question q21: “Information includes this company and some
subsidiaries.” We obtained a list of these subsidiaries and compared these to the
survey frame to determine if any of the subsidiaries were part of the NCSS sample.
If so, we included records for those subsidiaries in the database. We did not,
however, fill in any of the fields for these subsidiary records. This is because we
could not determine how to distribute the responses of the mother company down to
the level of their subsidiaries. Therefore, all the fields on the subsidiary records are
blank, except for the sampling strata variables.
To identify these records in the analytic dataset there are 2 variables added to
the file, sublink and subflag. Sublink links the subsidiary records to the responding
company (donor) that indicated their report also included data on those subsidiary
companies (donee). The donor and donee records all have the same value for sublink.
For example, sublink=105 links itself with three subsidiary records included in their
report. The variable subflag can be used to differentiate the donor and donee records.
Subflag=0 indicates the record represents the response donor and subflag=1 indicates
Range and Edit Checks and Other Data Cleaning Procedures 55
the donee record, which was added to the dataset. If subflag is missing then there are
no subsidiary records linked to it in the dataset.
Inclusion of sampled subsidiaries in the dataset was done by four methods each
with decreasing levels of reliability. The majority (68%) of subsidiaries were
included by matching of company names. This was done by matching the names of
subsidiaries that the parent companies indicated they included in their survey report to
the sampled companies for that parent.
For companies that indicated their report did include subsidiaries, however
failed to list those subsidiaries by name, we made count comparisons. The count
comparisons were made by using three criteria. The count of total number of
subsidiaries belonging to a parent company was calculated using the D&B sampling
frame data. If the D&B count was equal to the total number of subsidiaries a parent
company indicated including in the survey responses, then the sampled subsidiaries of
this parent were included in the database. This count match accounted for 6% of the
added subsidiaries. If the parent company’s total number of subsidiaries included in
the survey report was greater than the D&B total count of subsidiaries for that parent
the sampled subsidiaries were included in the database. Counts that differed by 20%
or less (5.7%) were distinguished from counts that differed by greater than 20%
(20.3%). The method used to select sampled subsidiaries for inclusion in the
database is indicated in the variable SUBMATCH (1 is name match, 2 is N
reported=N D&B, 3 is N reported <=20% greater than D&B Count, 4 is N reported
>20% greater than D&B Count).
Analysts will need to make their own decisions if and how to distribute the
information on the parent company record to the subsidiary records. Consider the
following simple example: A parent company has three blank subsidiary records
representing the companies in the sample frame for which the parent company
provided data. If one assumes that the information was evenly distributed across the
four companies (the parent company plus the three subsidiaries), then the counts of
incidents detected, incidents reported, the dollar costs of the incidents, etc, could be
apportioned out such that each company received 25% of the total. This is one very
simple example of how the information supplied on behalf of subsidiary companies
could be allocated to those companies.
56 The National Computer Security Survey (NCSS): Final Methodology
DE-DUPLICATION OF SURVEY RESPONSES FOR COMPANIES THAT
SUBMITTED MULTIPLE SURVEYS
In some cases, multiple responses were received from the same company. In
this situation, the multiple responses were consolidated into a single response. The
first response received was treated as the “main response row” and it was
supplemented with additional information from later responses to create a single
record for each firm that is as complete as possible. First response was determined
based on the time stamp on the completed web survey, or the date when a paper form
was received in the mail. One reason for choosing the “first” versus “last” response
is that we know in some cases, respondents eventually figure out that if they answer
“no” to all of the screener questions in Section III they can get to the end faster.

57
APPENDIX B
Questionnaire
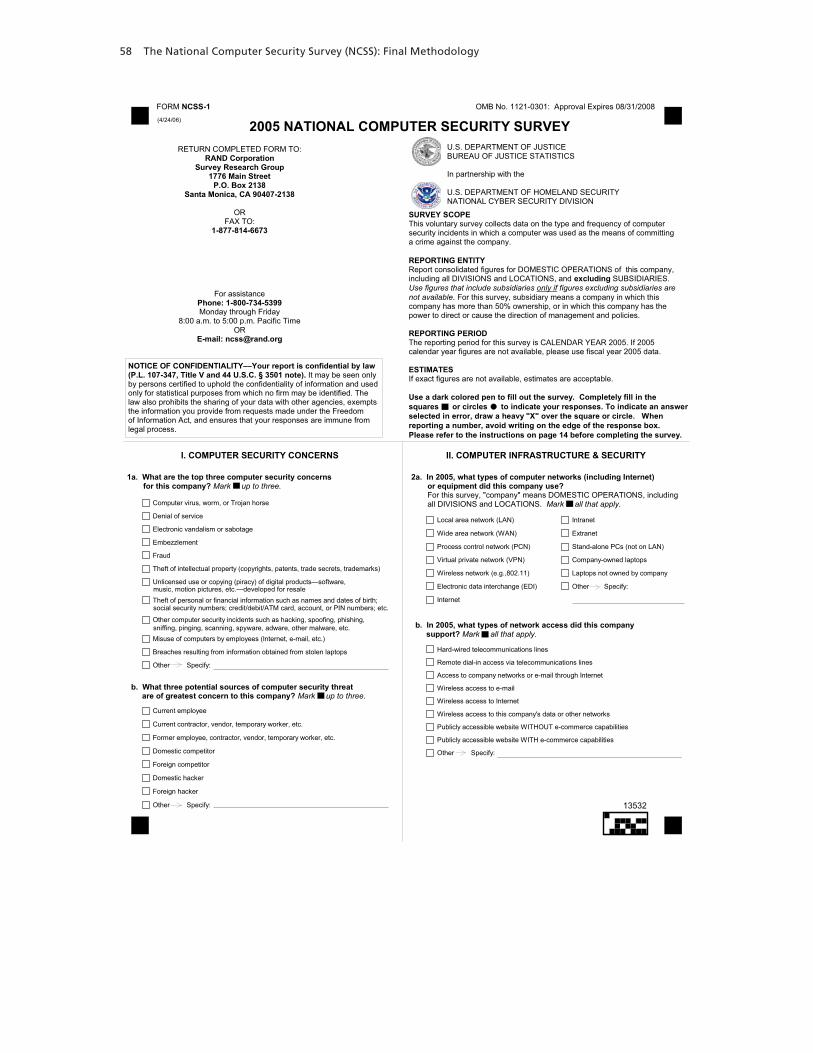
58 The National Computer Security Survey (NCSS): Final Methodology
SURVEY SCOPEThis voluntary survey collects data on the type and frequency of computer
security incidents in which a computer was used as the means of committing
a crime against the company.
REPORTING ENTITYReport consolidated figures for DOMESTIC OPERATIONS of this company,
including all DIVISIONS and LOCATIONS, and excluding SUBSIDIARIES.
Use figures that include subsidiaries only if figures excluding subsidiaries arenot available. For this survey, subsidiary means a company in which this
company has more than 50% ownership, or in which this company has the
power to direct or cause the direction of management and policies.
REPORTING PERIODThe reporting period for this survey is CALENDAR YEAR 2005. If 2005
calendar year figures are not available, please use fiscal year 2005 data.
ESTIMATESIf exact figures are not available, estimates are acceptable.
Use a dark colored pen to fill out the survey. Completely fill in thesquares or circles to indicate your responses. To indicate an answerselected in error, draw a heavy "X" over the square or circle. Whenreporting a number, avoid writing on the edge of the response box.Please refer to the instructions on page 14 before completing the survey.
Computer virus, worm, or Trojan horse
Denial of service
Electronic vandalism or sabotage
Embezzlement
Fraud
Theft of intellectual property (copyrights, patents, trade secrets, trademarks)
������������� ���������� ������������� ������������ ��
Theft of personal or financial information such as names and dates of birth;
Other computer security incidents such as hacking, spoofing, phishing,
Misuse of computers by employees (Internet, e-mail, etc.)
Breaches resulting from information obtained from stolen laptops
Other Specify:
����������������� ����������������� �����
social security numbers; credit/debit/ATM card, account, or PIN numbers; etc.
sniffing, pinging, scanning, spyware, adware, other malware, etc.
Current employee
Current contractor, vendor, temporary worker, etc.
Former employee, contractor, vendor, temporary worker, etc.
Domestic competitor
Foreign competitor
Domestic hacker
Foreign hacker
Other Specify:
I. COMPUTER SECURITY CONCERNS
b. What three potential sources of computer security threatare of greatest concern to this company? Mark up to three.
2005 NATIONAL COMPUTER SECURITY SURVEY
RETURN COMPLETED FORM TO:
RAND CorporationSurvey Research Group
1776 Main StreetP.O. Box 2138
Santa Monica, CA 90407-2138
OR
FAX TO:
1-877-814-6673
For assistance
Phone: 1-800-734-5399Monday through Friday
8:00 a.m. to 5:00 p.m. Pacific Time
OR
E-mail: [email protected]
OMB No. 1121-0301: Approval Expires 08/31/2008
Local area network (LAN)
Wide area network (WAN)
Process control network (PCN)
Virtual private network (VPN)
Wireless network (e.g.,802.11)
Electronic data interchange (EDI)
Internet
Intranet
Extranet
Stand-alone PCs (not on LAN)
Company-owned laptops
Laptops not owned by company
Other Specify:
II. COMPUTER INFRASTRUCTURE & SECURITY
2a. In 2005, what types of computer networks (including Internet)or equipment did this company use?For this survey, "company" means DOMESTIC OPERATIONS, including
all DIVISIONS and LOCATIONS. Mark all that apply.
b. In 2005, what types of network access did this companysupport? Mark all that apply.
Hard-wired telecommunications lines
Remote dial-in access via telecommunications lines
Access to company networks or e-mail through Internet
Wireless access to e-mail
Wireless access to Internet
Wireless access to this company's data or other networks
Publicly accessible website WITHOUT e-commerce capabilities
Publicly accessible website WITH e-commerce capabilities
Other Specify:
��������������������� �� ���������������������������������(P.L. 107-347, Title V and 44 U.S.C. § 3501 note). It may be seen only
by persons certified to uphold the confidentiality of information and used
only for statistical purposes from which no firm may be identified. The
law also prohibits the sharing of your data with other agencies, exempts
the information you provide from requests made under the Freedom
of Information Act, and ensures that your responses are immune from
legal process.
U.S. DEPARTMENT OF JUSTICE
BUREAU OF JUSTICE STATISTICS
In partnership with the
U.S. DEPARTMENT OF HOMELAND SECURITY
NATIONAL CYBER SECURITY DIVISION
1a. What are the top three computer security concernsfor this company? Mark up to three.
FORM NCSS-1
(4/24/06)
13532
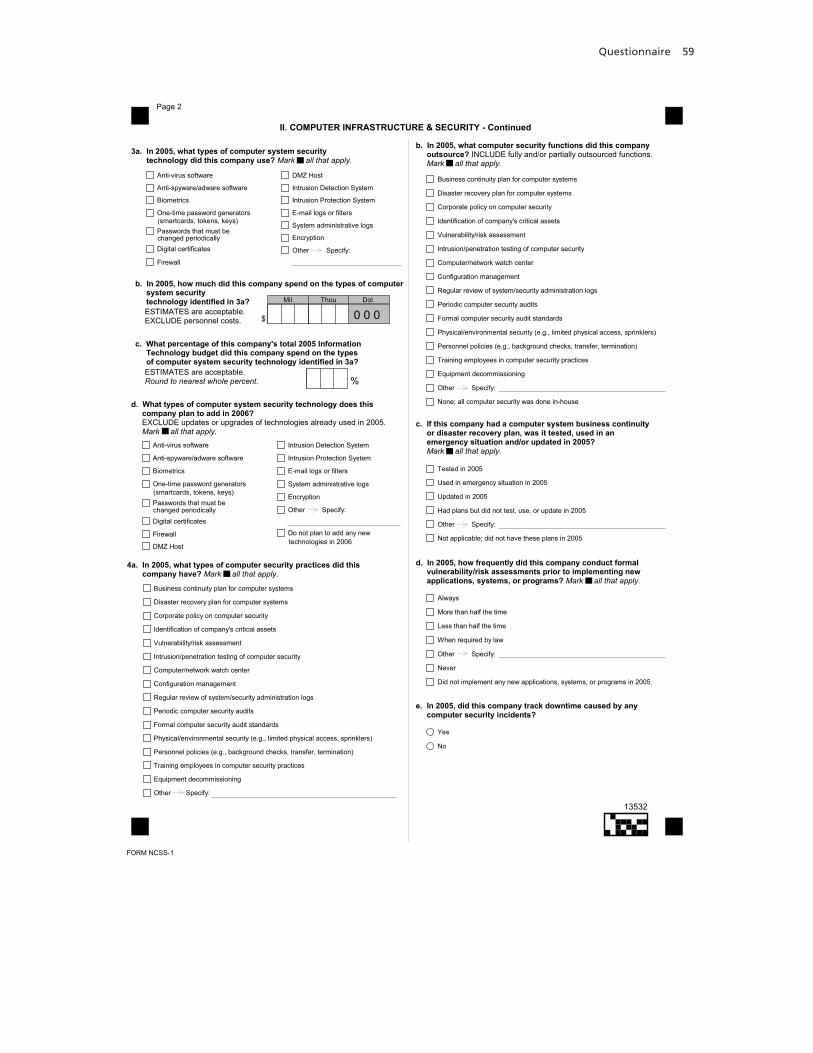
Questionnaire 59
II. COMPUTER INFRASTRUCTURE & SECURITY - Continued
Business continuity plan for computer systems
Disaster recovery plan for computer systems
Corporate policy on computer security
Identification of company's critical assets
Vulnerability/risk assessment
Intrusion/penetration testing of computer security
Computer/network watch center
Configuration management
Regular review of system/security administration logs
Periodic computer security audits
Formal computer security audit standards
Physical/environmental security (e.g., limited physical access, sprinklers)
Personnel policies (e.g., background checks, transfer, termination)
Training employees in computer security practices
Equipment decommissioning
Other Specify:
None; all computer security was done in-house
b. In 2005, what computer security functions did this companyoutsource? INCLUDE fully and/or partially outsourced functions.
Mark all that apply.
Tested in 2005
Used in emergency situation in 2005
Updated in 2005
Had plans but did not test, use, or update in 2005
Other Specify:
Not applicable; did not have these plans in 2005
d. In 2005, how frequently did this company conduct formalvulnerability/risk assessments prior to implementing newapplications, systems, or programs? Mark all that apply.
Always
More than half the time
Less than half the time
When required by law
Other Specify:
Never
Did not implement any new applications, systems, or programs in 2005.
e. In 2005, did this company track downtime caused by anycomputer security incidents?
Yes
No
Business continuity plan for computer systems
Disaster recovery plan for computer systems
Corporate policy on computer security
Identification of company's critical assets
Vulnerability/risk assessment
Intrusion/penetration testing of computer security
Computer/network watch center
Configuration management
Regular review of system/security administration logs
Periodic computer security audits
Formal computer security audit standards
Physical/environmental security (e.g., limited physical access, sprinklers)
Personnel policies (e.g., background checks, transfer, termination)
Training employees in computer security practices
Equipment decommissioning
Other Specify:
Page 2
4a. In 2005, what types of computer security practices did thiscompany have? Mark all that apply.
c. If this company had a computer system business continuityor disaster recovery plan, was it tested, used in anemergency situation and/or updated in 2005?Mark all that apply.
c. What percentage of this company's total 2005 InformationTechnology budget did this company spend on the typesof computer system security technology identified in 3a?ESTIMATES are acceptable.
Round to nearest whole percent. %
b. In 2005, how much did this company spend on the types of computersystem securitytechnology identified in 3a?ESTIMATES are acceptable.
EXCLUDE personnel costs. $
Mil. Thou. Dol.
Anti-virus software
Anti-spyware/adware software
Biometrics
One-time password generators
Passwords that must be
Digital certificates
Firewall
DMZ Host
Intrusion Detection System
Intrusion Protection System
E-mail logs or filters
System administrative logs
Encryption
Other Specify:
Do not plan to add any new
(smartcards, tokens, keys)
changed periodically
technologies in 2006
d. What types of computer system security technology does thiscompany plan to add in 2006?EXCLUDE updates or upgrades of technologies already used in 2005.
Mark all that apply.
FORM NCSS-1
0 0 0
Anti-virus software
Anti-spyware/adware software
Biometrics
One-time password generators
Passwords that must be
Digital certificates
Firewall
DMZ Host
Intrusion Detection System
Intrusion Protection System
E-mail logs or filters
System administrative logs
Encryption
Other Specify:
(smartcards, tokens, keys)
changed periodically
3a. In 2005, what types of computer system securitytechnology did this company use? Mark all that apply.
13532
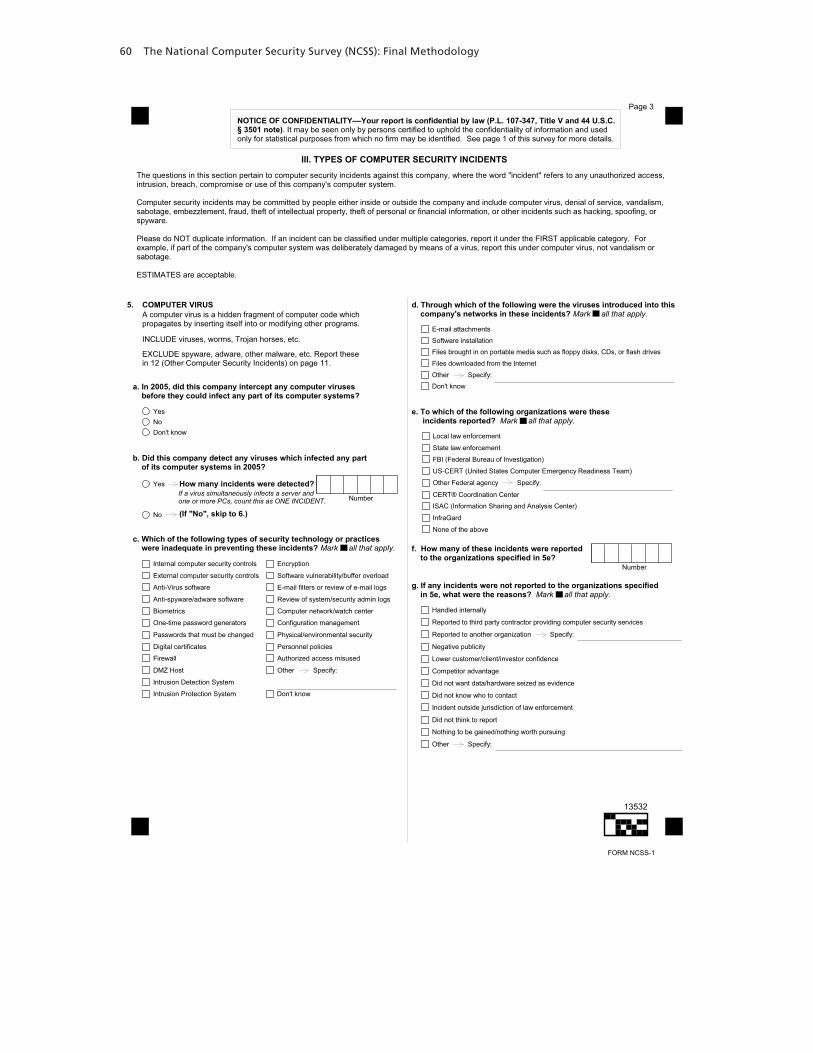
60 The National Computer Security Survey (NCSS): Final Methodology
III. TYPES OF COMPUTER SECURITY INCIDENTS
Page 3
��������������������� �� ���������������������������������� !"�"�#$%&'(%)�������*�����((�+","�"§ 3501 note). It may be seen only by persons certified to uphold the confidentiality of information and used
only for statistical purposes from which no firm may be identified. See page 1 of this survey for more details.
The questions in this section pertain to computer security incidents against this company, where the word "incident" refers to any unauthorized access,
intrusion, breach, compromise or use of this company's computer system.
Computer security incidents may be committed by people either inside or outside the company and include computer virus, denial of service, vandalism,
sabotage, embezzlement, fraud, theft of intellectual property, theft of personal or financial information, or other incidents such as hacking, spoofing, or
spyware.
Please do NOT duplicate information. If an incident can be classified under multiple categories, report it under the FIRST applicable category. For
example, if part of the company's computer system was deliberately damaged by means of a virus, report this under computer virus, not vandalism or
sabotage.
ESTIMATES are acceptable.
5. COMPUTER VIRUSA computer virus is a hidden fragment of computer code which
propagates by inserting itself into or modifying other programs.
INCLUDE viruses, worms, Trojan horses, etc.
EXCLUDE spyware, adware, other malware, etc. Report these
in 12 (Other Computer Security Incidents) on page 11.
a. In 2005, did this company intercept any computer virusesbefore they could infect any part of its computer systems?
Yes
No
Don't know
b. Did this company detect any viruses which infected any partof its computer systems in 2005?
Yes
No
If a virus simultaneously infects a server andone or more PCs, count this as ONE INCIDENT.
(If "No", skip to 6.)
c. Which of the following types of security technology or practiceswere inadequate in preventing these incidents? Mark all that apply.
Internal computer security controls
External computer security controls
Anti-Virus software
Anti-spyware/adware software
Biometrics
One-time password generators
Passwords that must be changed
Digital certificates
Firewall
DMZ Host
Intrusion Detection System
Intrusion Protection System
Encryption
Software vulnerability/buffer overload
E-mail filters or review of e-mail logs
Review of system/security admin logs
Computer network/watch center
Configuration management
Physical/environmental security
Personnel policies
Authorized access misused
Other Specify:
Don't know
How many incidents were detected?
Number
Local law enforcement
State law enforcement
FBI (Federal Bureau of Investigation)
US-CERT (United States Computer Emergency Readiness Team)
Other Federal agency Specify:
CERT® Coordination Center
ISAC (Information Sharing and Analysis Center)
InfraGard
None of the above
d. Through which of the following were the viruses introduced into thiscompany's networks in these incidents? Mark all that apply.
E-mail attachments
Software installation
Files brought in on portable media such as floppy disks, CDs, or flash drives
Files downloaded from the Internet
Other Specify:
Don't know
e. To which of the following organizations were theseincidents reported? Mark all that apply.
g. If any incidents were not reported to the organizations specifiedin 5e, what were the reasons? Mark all that apply.
f. How many of these incidents were reportedto the organizations specified in 5e?
Handled internally
Reported to third party contractor providing computer security services
Reported to another organization Specify:
Negative publicity
Lower customer/client/investor confidence
Competitor advantage
Did not want data/hardware seized as evidence
Did not know who to contact
Incident outside jurisdiction of law enforcement
Did not think to report
Nothing to be gained/nothing worth pursuing
Other Specify:
Number
FORM NCSS-1
13532
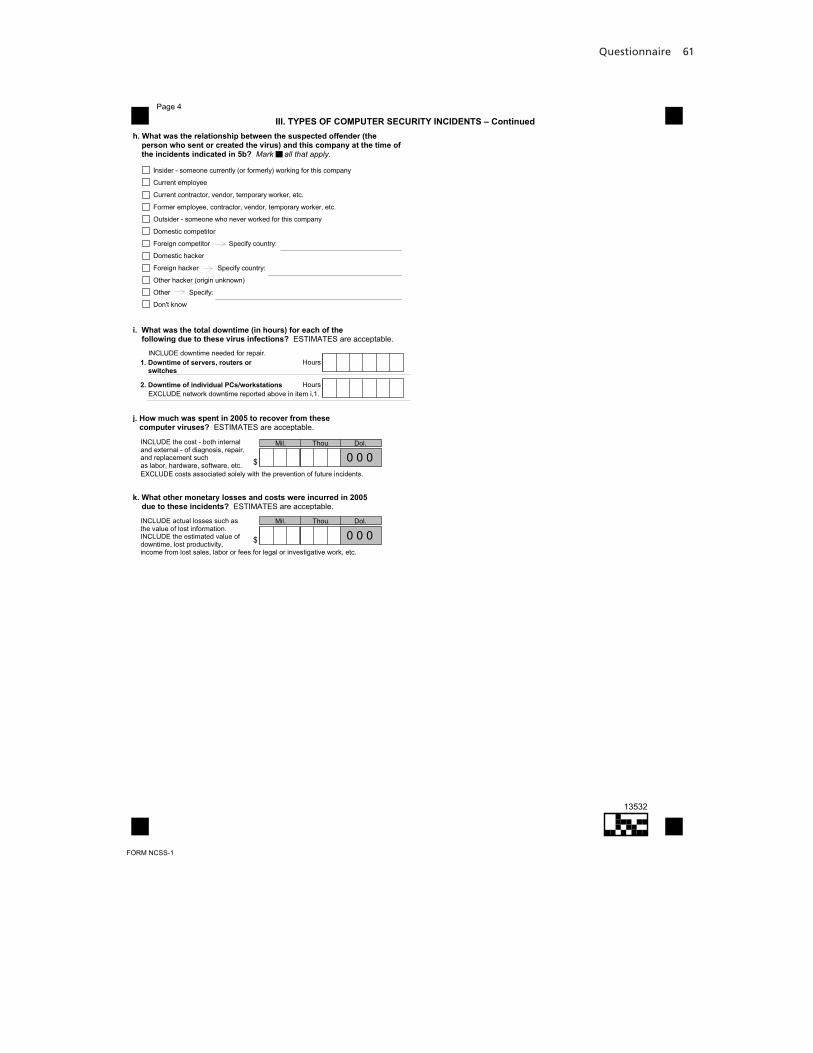
Questionnaire 61
���"�� !�,�����-!+��.�,��+.�� ��������,������������Page 4
h. What was the relationship between the suspected offender (theperson who sent or created the virus) and this company at the time ofthe incidents indicated in 5b? Mark all that apply.
Insider - someone currently (or formerly) working for this company
Current employee
Current contractor, vendor, temporary worker, etc.
Former employee, contractor, vendor, temporary worker, etc.
Outsider - someone who never worked for this company
Domestic competitor
Foreign competitor Specify country:
Domestic hacker
Foreign hacker Specify country:
Other hacker (origin unknown)
Other Specify:
Don't know
j. How much was spent in 2005 to recover from thesecomputer viruses? ESTIMATES are acceptable.
INCLUDE the cost - both internal
and external - of diagnosis, repair,
and replacement such
as labor, hardware, software, etc.
EXCLUDE costs associated solely with the prevention of future incidents.
i. What was the total downtime (in hours) for each of thefollowing due to these virus infections? ESTIMATES are acceptable.
k. What other monetary losses and costs were incurred in 2005due to these incidents? ESTIMATES are acceptable.
INCLUDE actual losses such as
the value of lost information.
INCLUDE the estimated value of
downtime, lost productivity,
income from lost sales, labor or fees for legal or investigative work, etc.
2. Downtime of individual PCs/workstationsEXCLUDE network downtime reported above in item i,1.
Hours
INCLUDE downtime needed for repair.
1. Downtime of servers, routers orswitches
Hours
$
Mil. Thou. Dol.
$
Mil. Thou. Dol.
FORM NCSS-1
0 0 0
0 0 0
13532
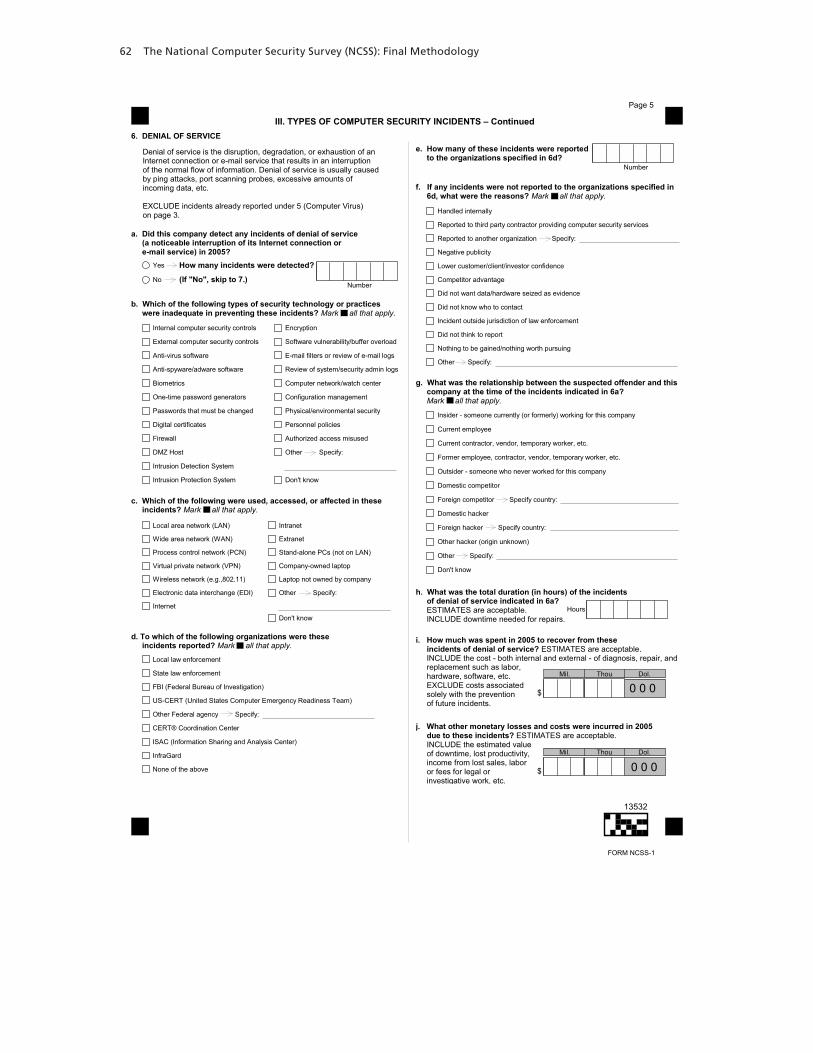
62 The National Computer Security Survey (NCSS): Final Methodology
Page 5
���"�� !�,�����-!+��.�,��+.�� ��������,������������
c. Which of the following were used, accessed, or affected in theseincidents? Mark all that apply.
6. DENIAL OF SERVICE
Denial of service is the disruption, degradation, or exhaustion of an
Internet connection or e-mail service that results in an interruption
of the normal flow of information. Denial of service is usually caused
by ping attacks, port scanning probes, excessive amounts of
incoming data, etc.
EXCLUDE incidents already reported under 5 (Computer Virus)
on page 3.
a. Did this company detect any incidents of denial of service(a noticeable interruption of its Internet connection ore-mail service) in 2005?
Local area network (LAN)
Wide area network (WAN)
Process control network (PCN)
Virtual private network (VPN)
Wireless network (e.g.,802.11)
Electronic data interchange (EDI)
Internet
Intranet
Extranet
Stand-alone PCs (not on LAN)
Company-owned laptop
Laptop not owned by company
Other Specify:
Don't know
d. To which of the following organizations were theseincidents reported? Mark all that apply.
Local law enforcement
State law enforcement
FBI (Federal Bureau of Investigation)
US-CERT (United States Computer Emergency Readiness Team)
Other Federal agency Specify:
CERT® Coordination Center
ISAC (Information Sharing and Analysis Center)
InfraGard
None of the above
Yes
No
Internal computer security controls
External computer security controls
Anti-virus software
Anti-spyware/adware software
Biometrics
One-time password generators
Passwords that must be changed
Digital certificates
Firewall
DMZ Host
Intrusion Detection System
Intrusion Protection System
Encryption
Software vulnerability/buffer overload
E-mail filters or review of e-mail logs
Review of system/security admin logs
Computer network/watch center
Configuration management
Physical/environmental security
Personnel policies
Authorized access misused
Other Specify:
Don't know
Number
b. Which of the following types of security technology or practiceswere inadequate in preventing these incidents? Mark all that apply.
e. How many of these incidents were reportedto the organizations specified in 6d?
Number
Handled internally
Reported to third party contractor providing computer security services
Reported to another organization Specify:
Negative publicity
Lower customer/client/investor confidence
Competitor advantage
Did not want data/hardware seized as evidence
Did not know who to contact
Incident outside jurisdiction of law enforcement
Did not think to report
Nothing to be gained/nothing worth pursuing
Other Specify:
g. What was the relationship between the suspected offender and thiscompany at the time of the incidents indicated in 6a?Mark all that apply.
Insider - someone currently (or formerly) working for this company
Current employee
Current contractor, vendor, temporary worker, etc.
Former employee, contractor, vendor, temporary worker, etc.
Outsider - someone who never worked for this company
Domestic competitor
Foreign competitor Specify country:
Domestic hacker
Foreign hacker Specify country:
Other hacker (origin unknown)
Other Specify:
Don't know
h. What was the total duration (in hours) of the incidentsof denial of service indicated in 6a?ESTIMATES are acceptable.
INCLUDE downtime needed for repairs.
Hours
i. How much was spent in 2005 to recover from theseincidents of denial of service? ESTIMATES are acceptable.
INCLUDE the cost - both internal and external - of diagnosis, repair, and
replacement such as labor,
hardware, software, etc.
EXCLUDE costs associated
solely with the prevention
of future incidents.
j. What other monetary losses and costs were incurred in 2005due to these incidents? ESTIMATES are acceptable.
INCLUDE the estimated value
of downtime, lost productivity,
income from lost sales, labor
or fees for legal or
investigative work, etc.
f. If any incidents were not reported to the organizations specified in6d, what were the reasons? Mark all that apply.
$
Mil. Thou. Dol.
$
Mil. Thou. Dol.
How many incidents were detected?
(If "No", skip to 7.)
FORM NCSS-1
0 0 0
0 0 0
13532
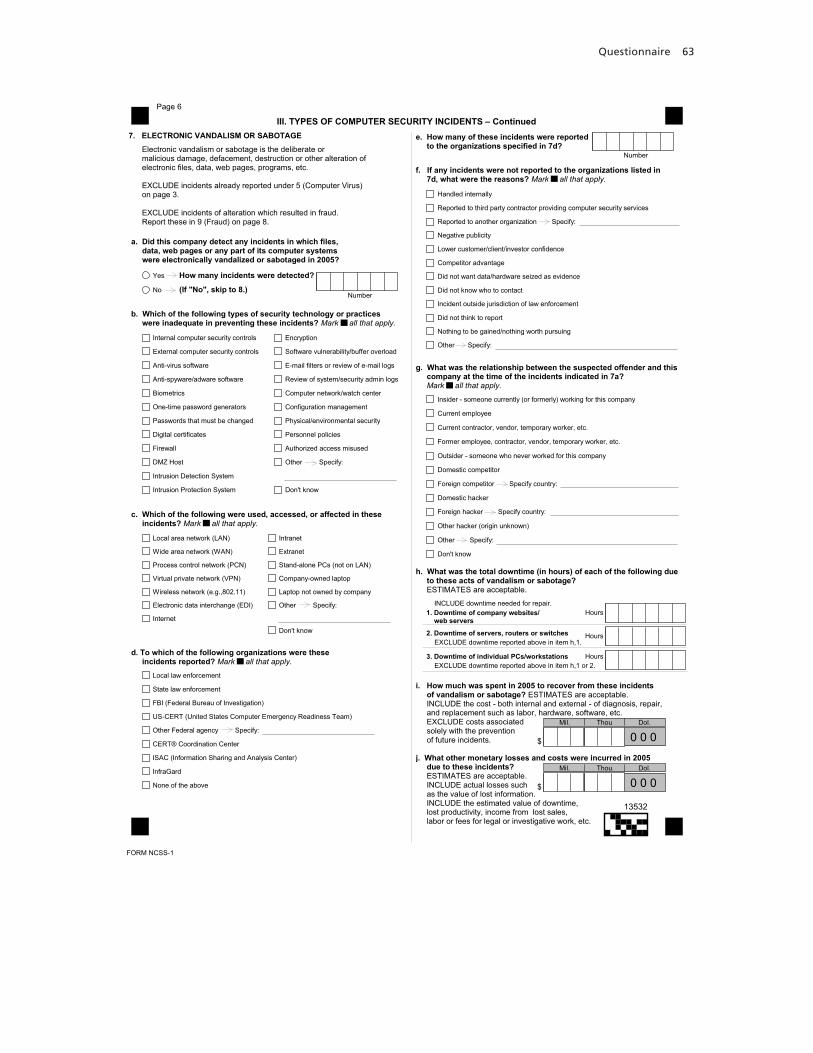
Questionnaire 63
���"�� !�,�����-!+��.�,��+.�� ��������,������������7. ELECTRONIC VANDALISM OR SABOTAGE
Electronic vandalism or sabotage is the deliberate or
malicious damage, defacement, destruction or other alteration of
electronic files, data, web pages, programs, etc.
EXCLUDE incidents already reported under 5 (Computer Virus)
on page 3.
EXCLUDE incidents of alteration which resulted in fraud.
Report these in 9 (Fraud) on page 8.
h. What was the total downtime (in hours) of each of the following dueto these acts of vandalism or sabotage?ESTIMATES are acceptable.
EXCLUDE downtime reported above in item h,1 or 2.
EXCLUDE downtime reported above in item h,1.
e. How many of these incidents were reportedto the organizations specified in 7d?
Number
Handled internally
Reported to third party contractor providing computer security services
Reported to another organization Specify:
Negative publicity
Lower customer/client/investor confidence
Competitor advantage
Did not want data/hardware seized as evidence
Did not know who to contact
Incident outside jurisdiction of law enforcement
Did not think to report
Nothing to be gained/nothing worth pursuing
Other Specify:
f. If any incidents were not reported to the organizations listed in7d, what were the reasons? Mark all that apply.
g. What was the relationship between the suspected offender and thiscompany at the time of the incidents indicated in 7a?Mark all that apply.
Insider - someone currently (or formerly) working for this company
Current employee
Current contractor, vendor, temporary worker, etc.
Former employee, contractor, vendor, temporary worker, etc.
Outsider - someone who never worked for this company
Domestic competitor
Foreign competitor Specify country:
Domestic hacker
Foreign hacker Specify country:
Other hacker (origin unknown)
Other Specify:
Don't know
i. How much was spent in 2005 to recover from these incidentsof vandalism or sabotage? ESTIMATES are acceptable.
INCLUDE the cost - both internal and external - of diagnosis, repair,
and replacement such as labor, hardware, software, etc.
EXCLUDE costs associated
solely with the prevention
of future incidents.
j. What other monetary losses and costs were incurred in 2005due to these incidents?ESTIMATES are acceptable.
INCLUDE actual losses such
as the value of lost information.
INCLUDE the estimated value of downtime,
lost productivity, income from lost sales,
labor or fees for legal or investigative work, etc.
a. Did this company detect any incidents in which files,data, web pages or any part of its computer systemswere electronically vandalized or sabotaged in 2005?
Yes
No
d. To which of the following organizations were theseincidents reported? Mark all that apply.
Local law enforcement
State law enforcement
FBI (Federal Bureau of Investigation)
US-CERT (United States Computer Emergency Readiness Team)
Other Federal agency Specify:
CERT® Coordination Center
ISAC (Information Sharing and Analysis Center)
InfraGard
None of the above
Local area network (LAN)
Wide area network (WAN)
Process control network (PCN)
Virtual private network (VPN)
Wireless network (e.g.,802.11)
Electronic data interchange (EDI)
Internet
Intranet
Extranet
Stand-alone PCs (not on LAN)
Company-owned laptop
Laptop not owned by company
Other Specify:
Don't know
c. Which of the following were used, accessed, or affected in theseincidents? Mark all that apply.
Internal computer security controls
External computer security controls
Anti-virus software
Anti-spyware/adware software
Biometrics
One-time password generators
Passwords that must be changed
Digital certificates
Firewall
DMZ Host
Intrusion Detection System
Intrusion Protection System
Encryption
Software vulnerability/buffer overload
E-mail filters or review of e-mail logs
Review of system/security admin logs
Computer network/watch center
Configuration management
Physical/environmental security
Personnel policies
Authorized access misused
Other Specify:
Don't know
b. Which of the following types of security technology or practiceswere inadequate in preventing these incidents? Mark all that apply.
Page 6
How many incidents were detected?
(If "No", skip to 8.)Number
Hours
Hours
Hours
INCLUDE downtime needed for repair.
1. Downtime of company websites/web servers
2. Downtime of servers, routers or switches
3. Downtime of individual PCs/workstations
$
Mil. Thou. Dol.
$
Mil. Thou. Dol.
FORM NCSS-1
0 0 0
0 0 0
13532
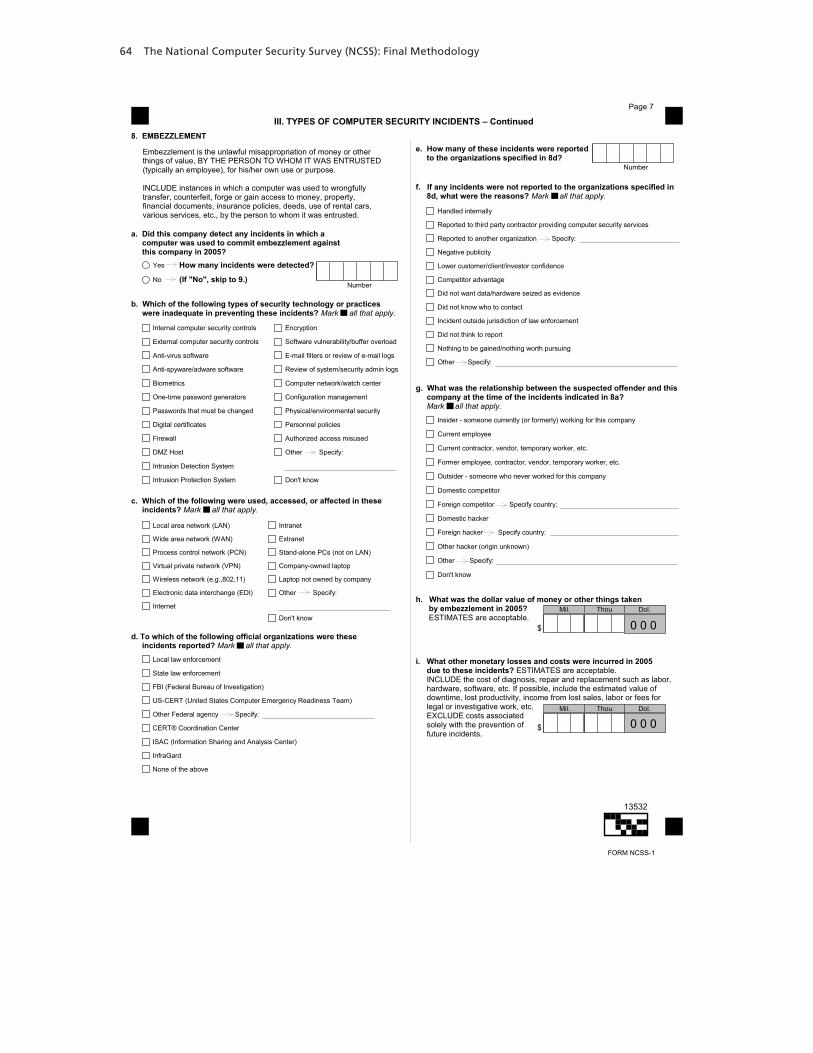
64 The National Computer Security Survey (NCSS): Final Methodology
���"�� !�,�����-!+��.�,��+.�� ��������,������������Page 7
c. Which of the following were used, accessed, or affected in theseincidents? Mark all that apply.
8. EMBEZZLEMENT
Embezzlement is the unlawful misappropriation of money or other
things of value, BY THE PERSON TO WHOM IT WAS ENTRUSTED
(typically an employee), for his/her own use or purpose.
INCLUDE instances in which a computer was used to wrongfully
transfer, counterfeit, forge or gain access to money, property,
financial documents, insurance policies, deeds, use of rental cars,
various services, etc., by the person to whom it was entrusted.
a. Did this company detect any incidents in which acomputer was used to commit embezzlement againstthis company in 2005?
Local area network (LAN)
Wide area network (WAN)
Process control network (PCN)
Virtual private network (VPN)
Wireless network (e.g.,802.11)
Electronic data interchange (EDI)
Internet
Intranet
Extranet
Stand-alone PCs (not on LAN)
Company-owned laptop
Laptop not owned by company
Other Specify:
Don't know
d. To which of the following official organizations were theseincidents reported? Mark all that apply.
Local law enforcement
State law enforcement
FBI (Federal Bureau of Investigation)
US-CERT (United States Computer Emergency Readiness Team)
Other Federal agency Specify:
CERT® Coordination Center
ISAC (Information Sharing and Analysis Center)
InfraGard
None of the above
Yes
No
Internal computer security controls
External computer security controls
Anti-virus software
Anti-spyware/adware software
Biometrics
One-time password generators
Passwords that must be changed
Digital certificates
Firewall
DMZ Host
Intrusion Detection System
Intrusion Protection System
Encryption
Software vulnerability/buffer overload
E-mail filters or review of e-mail logs
Review of system/security admin logs
Computer network/watch center
Configuration management
Physical/environmental security
Personnel policies
Authorized access misused
Other Specify:
Don't know
b. Which of the following types of security technology or practiceswere inadequate in preventing these incidents? Mark all that apply.
How many incidents were detected?
(If "No", skip to 9.)Number
e. How many of these incidents were reportedto the organizations specified in 8d?
Number
Handled internally
Reported to third party contractor providing computer security services
Reported to another organization Specify:
Negative publicity
Lower customer/client/investor confidence
Competitor advantage
Did not want data/hardware seized as evidence
Did not know who to contact
Incident outside jurisdiction of law enforcement
Did not think to report
Nothing to be gained/nothing worth pursuing
Other Specify:
f. If any incidents were not reported to the organizations specified in8d, what were the reasons? Mark all that apply.
h. What was the dollar value of money or other things takenby embezzlement in 2005?ESTIMATES are acceptable.
g. What was the relationship between the suspected offender and thiscompany at the time of the incidents indicated in 8a?Mark all that apply.
Insider - someone currently (or formerly) working for this company
Current employee
Current contractor, vendor, temporary worker, etc.
Former employee, contractor, vendor, temporary worker, etc.
Outsider - someone who never worked for this company
Domestic competitor
Foreign competitor Specify country:
Domestic hacker
Foreign hacker Specify country:
Other hacker (origin unknown)
Other Specify:
Don't know
i. What other monetary losses and costs were incurred in 2005due to these incidents? ESTIMATES are acceptable.
INCLUDE the cost of diagnosis, repair and replacement such as labor,
hardware, software, etc. If possible, include the estimated value of
downtime, lost productivity, income from lost sales, labor or fees for
legal or investigative work, etc.
EXCLUDE costs associated
solely with the prevention of
future incidents.
$
Mil. Thou. Dol.
$
Mil. Thou. Dol.
FORM NCSS-1
0 0 0
0 0 0
13532
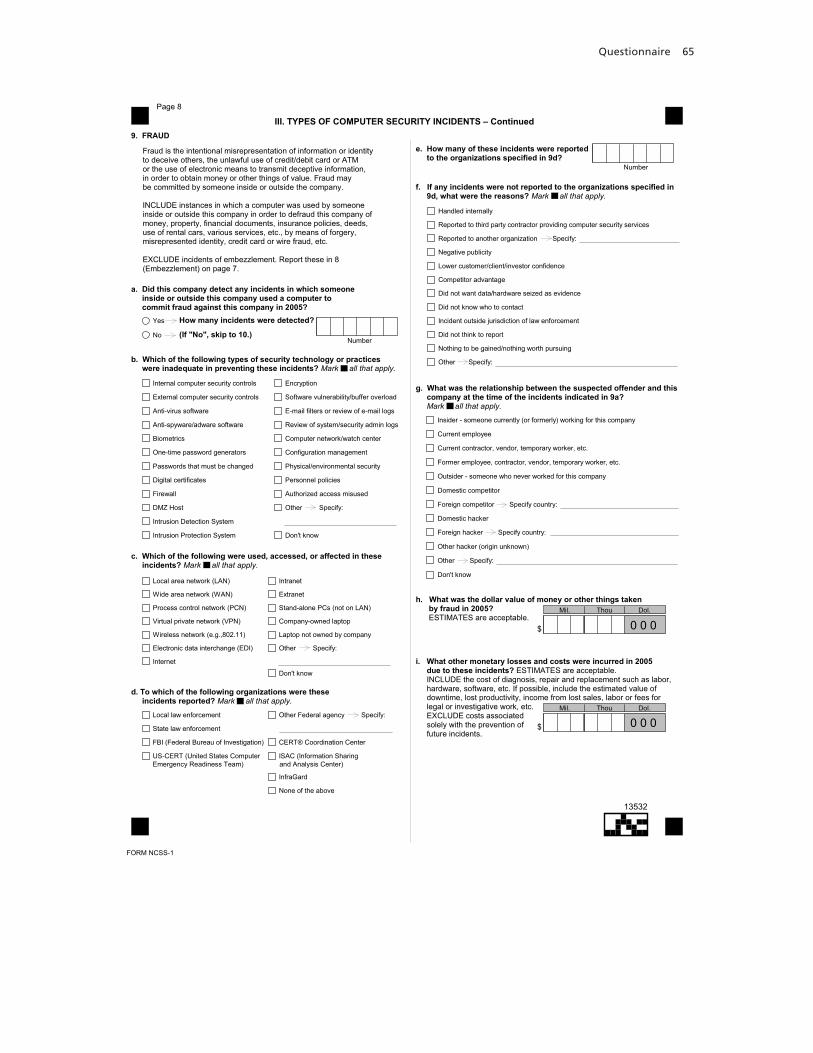
Questionnaire 65
���"�� !�,�����-!+��.�,��+.�� ��������,������������Page 8
c. Which of the following were used, accessed, or affected in theseincidents? Mark all that apply.
9. FRAUD
Fraud is the intentional misrepresentation of information or identity
to deceive others, the unlawful use of credit/debit card or ATM
or the use of electronic means to transmit deceptive information,
in order to obtain money or other things of value. Fraud may
be committed by someone inside or outside the company.
INCLUDE instances in which a computer was used by someone
inside or outside this company in order to defraud this company of
money, property, financial documents, insurance policies, deeds,
use of rental cars, various services, etc., by means of forgery,
misrepresented identity, credit card or wire fraud, etc.
EXCLUDE incidents of embezzlement. Report these in 8
(Embezzlement) on page 7.
a. Did this company detect any incidents in which someoneinside or outside this company used a computer tocommit fraud against this company in 2005?
Local area network (LAN)
Wide area network (WAN)
Process control network (PCN)
Virtual private network (VPN)
Wireless network (e.g.,802.11)
Electronic data interchange (EDI)
Internet
Intranet
Extranet
Stand-alone PCs (not on LAN)
Company-owned laptop
Laptop not owned by company
Other Specify:
Don't know
Yes
No
Internal computer security controls
External computer security controls
Anti-virus software
Anti-spyware/adware software
Biometrics
One-time password generators
Passwords that must be changed
Digital certificates
Firewall
DMZ Host
Intrusion Detection System
Intrusion Protection System
Encryption
Software vulnerability/buffer overload
E-mail filters or review of e-mail logs
Review of system/security admin logs
Computer network/watch center
Configuration management
Physical/environmental security
Personnel policies
Authorized access misused
Other Specify:
Don't know
d. To which of the following organizations were theseincidents reported? Mark all that apply.
Local law enforcement
State law enforcement
FBI (Federal Bureau of Investigation)
US-CERT (United States Computer
Other Federal agency Specify:
CERT® Coordination Center
ISAC (Information Sharing
InfraGard
None of the above
Emergency Readiness Team) and Analysis Center)
b. Which of the following types of security technology or practiceswere inadequate in preventing these incidents? Mark all that apply.
(If "No", skip to 10.)
How many incidents were detected?
Number
e. How many of these incidents were reportedto the organizations specified in 9d?
Number
Handled internally
Reported to third party contractor providing computer security services
Reported to another organization Specify:
Negative publicity
Lower customer/client/investor confidence
Competitor advantage
Did not want data/hardware seized as evidence
Did not know who to contact
Incident outside jurisdiction of law enforcement
Did not think to report
Nothing to be gained/nothing worth pursuing
Other Specify:
f. If any incidents were not reported to the organizations specified in9d, what were the reasons? Mark all that apply.
h. What was the dollar value of money or other things takenby fraud in 2005?ESTIMATES are acceptable.
g. What was the relationship between the suspected offender and thiscompany at the time of the incidents indicated in 9a?Mark all that apply.
Insider - someone currently (or formerly) working for this company
Current employee
Current contractor, vendor, temporary worker, etc.
Former employee, contractor, vendor, temporary worker, etc.
Outsider - someone who never worked for this company
Domestic competitor
Foreign competitor Specify country:
Domestic hacker
Foreign hacker Specify country:
Other hacker (origin unknown)
Other Specify:
Don't know
i. What other monetary losses and costs were incurred in 2005due to these incidents? ESTIMATES are acceptable.
INCLUDE the cost of diagnosis, repair and replacement such as labor,
hardware, software, etc. If possible, include the estimated value of
downtime, lost productivity, income from lost sales, labor or fees for
legal or investigative work, etc.
EXCLUDE costs associated
solely with the prevention of
future incidents.
$
Mil. Thou. Dol.
$
Mil. Thou. Dol.
FORM NCSS-1
0 0 0
0 0 0
13532
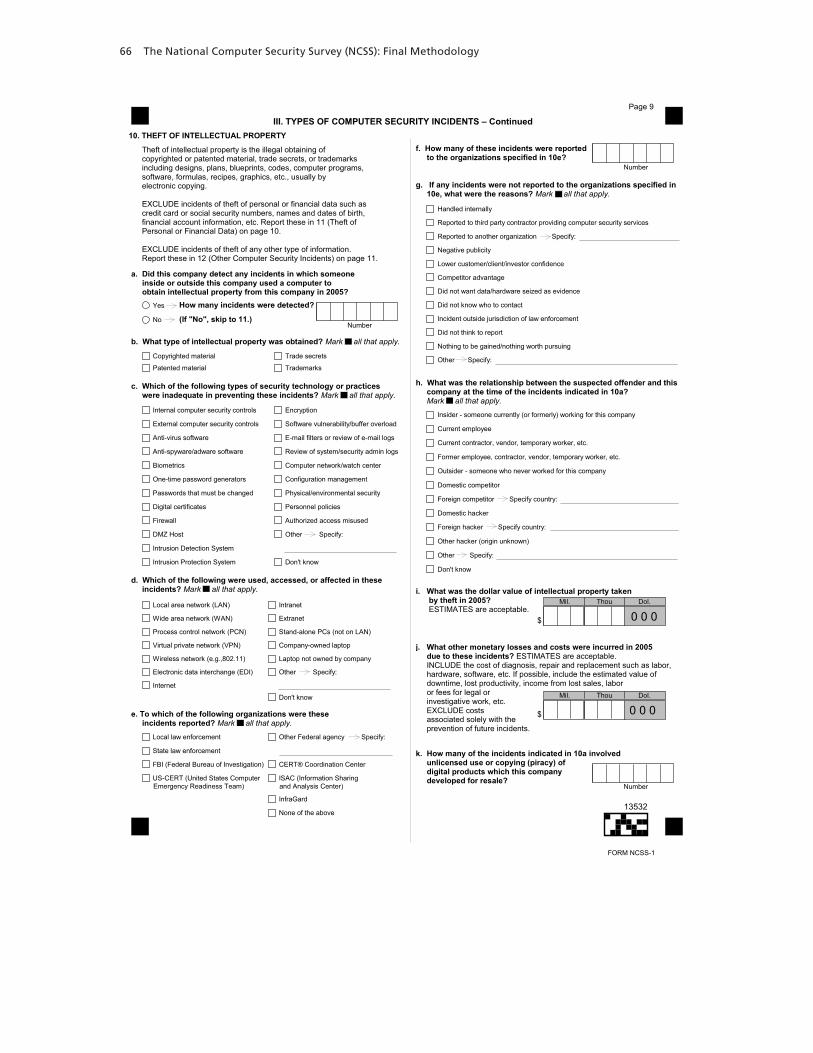
66 The National Computer Security Survey (NCSS): Final Methodology
���"�� !�,�����-!+��.�,��+.�� ��������,������������Page 9
b. What type of intellectual property was obtained? Mark all that apply.
10. THEFT OF INTELLECTUAL PROPERTY
Theft of intellectual property is the illegal obtaining of
copyrighted or patented material, trade secrets, or trademarks
including designs, plans, blueprints, codes, computer programs,
software, formulas, recipes, graphics, etc., usually by
electronic copying.
EXCLUDE incidents of theft of personal or financial data such as
credit card or social security numbers, names and dates of birth,
financial account information, etc. Report these in 11 (Theft of
Personal or Financial Data) on page 10.
EXCLUDE incidents of theft of any other type of information.
Report these in 12 (Other Computer Security Incidents) on page 11.
a. Did this company detect any incidents in which someoneinside or outside this company used a computer toobtain intellectual property from this company in 2005?
Yes
No
Internal computer security controls
External computer security controls
Anti-virus software
Anti-spyware/adware software
Biometrics
One-time password generators
Passwords that must be changed
Digital certificates
Firewall
DMZ Host
Intrusion Detection System
Intrusion Protection System
Encryption
Software vulnerability/buffer overload
E-mail filters or review of e-mail logs
Review of system/security admin logs
Computer network/watch center
Configuration management
Physical/environmental security
Personnel policies
Authorized access misused
Other Specify:
Don't know
d. Which of the following were used, accessed, or affected in theseincidents? Mark all that apply.
Local area network (LAN)
Wide area network (WAN)
Process control network (PCN)
Virtual private network (VPN)
Wireless network (e.g.,802.11)
Electronic data interchange (EDI)
Internet
Intranet
Extranet
Stand-alone PCs (not on LAN)
Company-owned laptop
Laptop not owned by company
Other Specify:
Don't know
k. How many of the incidents indicated in 10a involvedunlicensed use or copying (piracy) ofdigital products which this companydeveloped for resale?
Handled internally
Reported to third party contractor providing computer security services
Reported to another organization Specify:
Negative publicity
Lower customer/client/investor confidence
Competitor advantage
Did not want data/hardware seized as evidence
Did not know who to contact
Incident outside jurisdiction of law enforcement
Did not think to report
Nothing to be gained/nothing worth pursuing
Other Specify:
g. If any incidents were not reported to the organizations specified in10e, what were the reasons? Mark all that apply.
j. What other monetary losses and costs were incurred in 2005due to these incidents? ESTIMATES are acceptable.
INCLUDE the cost of diagnosis, repair and replacement such as labor,
hardware, software, etc. If possible, include the estimated value of
downtime, lost productivity, income from lost sales, labor
or fees for legal or
investigative work, etc.
EXCLUDE costs
associated solely with the
prevention of future incidents.
i. What was the dollar value of intellectual property takenby theft in 2005?ESTIMATES are acceptable.
h. What was the relationship between the suspected offender and thiscompany at the time of the incidents indicated in 10a?Mark all that apply.
Insider - someone currently (or formerly) working for this company
Current employee
Current contractor, vendor, temporary worker, etc.
Former employee, contractor, vendor, temporary worker, etc.
Outsider - someone who never worked for this company
Domestic competitor
Foreign competitor Specify country:
Domestic hacker
Foreign hacker Specify country:
Other hacker (origin unknown)
Other Specify:
Don't know
Number
e. To which of the following organizations were theseincidents reported? Mark all that apply.
Local law enforcement
State law enforcement
FBI (Federal Bureau of Investigation)
US-CERT (United States Computer
Other Federal agency Specify:
CERT® Coordination Center
ISAC (Information Sharing
InfraGard
None of the above
Emergency Readiness Team) and Analysis Center)
f. How many of these incidents were reportedto the organizations specified in 10e?
Number
Copyrighted material
Patented material
Trade secrets
Trademarks
How many incidents were detected?
(If "No", skip to 11.)
c. Which of the following types of security technology or practiceswere inadequate in preventing these incidents? Mark all that apply.
Number
$
Mil. Thou. Dol.
$
Mil. Thou. Dol.
FORM NCSS-1
0 0 0
0 0 0
13532
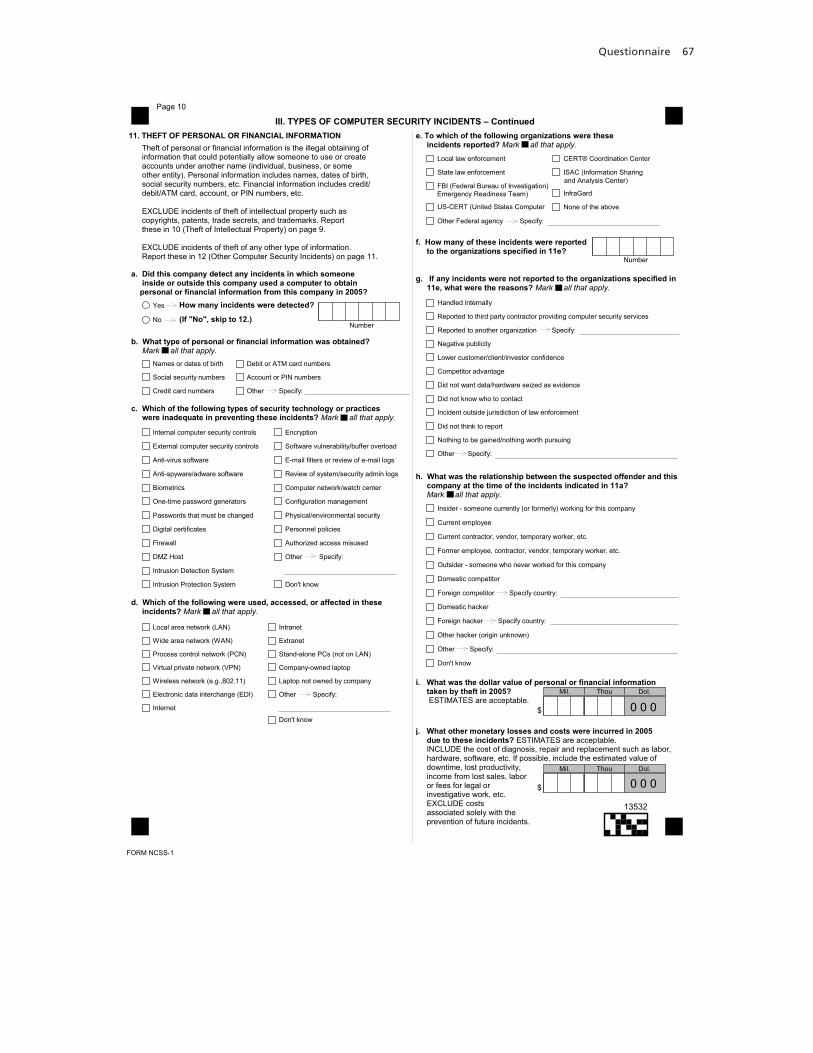
Questionnaire 67
���"�� !�,�����-!+��.�,��+.�� ��������,������������Page 10
11. THEFT OF PERSONAL OR FINANCIAL INFORMATION
a. Did this company detect any incidents in which someoneinside or outside this company used a computer to obtainpersonal or financial information from this company in 2005?
Yes
No
Theft of personal or financial information is the illegal obtaining of
information that could potentially allow someone to use or create
accounts under another name (individual, business, or some
other entity). Personal information includes names, dates of birth,
social security numbers, etc. Financial information includes credit/
debit/ATM card, account, or PIN numbers, etc.
EXCLUDE incidents of theft of intellectual property such as
copyrights, patents, trade secrets, and trademarks. Report
these in 10 (Theft of Intellectual Property) on page 9.
EXCLUDE incidents of theft of any other type of information.
Report these in 12 (Other Computer Security Incidents) on page 11.
b. What type of personal or financial information was obtained?Mark all that apply.
Names or dates of birth
Social security numbers
Credit card numbers
Debit or ATM card numbers
Account or PIN numbers
Other Specify:
Internal computer security controls
External computer security controls
Anti-virus software
Anti-spyware/adware software
Biometrics
One-time password generators
Passwords that must be changed
Digital certificates
Firewall
DMZ Host
Intrusion Detection System
Intrusion Protection System
Encryption
Software vulnerability/buffer overload
E-mail filters or review of e-mail logs
Review of system/security admin logs
Computer network/watch center
Configuration management
Physical/environmental security
Personnel policies
Authorized access misused
Other Specify:
Don't know
d. Which of the following were used, accessed, or affected in theseincidents? Mark all that apply.
Local area network (LAN)
Wide area network (WAN)
Process control network (PCN)
Virtual private network (VPN)
Wireless network (e.g.,802.11)
Electronic data interchange (EDI)
Internet
Intranet
Extranet
Stand-alone PCs (not on LAN)
Company-owned laptop
Laptop not owned by company
Other Specify:
Don't know
Handled internally
Reported to third party contractor providing computer security services
Reported to another organization Specify:
Negative publicity
Lower customer/client/investor confidence
Competitor advantage
Did not want data/hardware seized as evidence
Did not know who to contact
Incident outside jurisdiction of law enforcement
Did not think to report
Nothing to be gained/nothing worth pursuing
Other Specify:
g. If any incidents were not reported to the organizations specified in11e, what were the reasons? Mark all that apply.
h. What was the relationship between the suspected offender and thiscompany at the time of the incidents indicated in 11a?Mark all that apply.
Insider - someone currently (or formerly) working for this company
Current employee
Current contractor, vendor, temporary worker, etc.
Former employee, contractor, vendor, temporary worker, etc.
Outsider - someone who never worked for this company
Domestic competitor
Foreign competitor Specify country:
Domestic hacker
Foreign hacker Specify country:
Other hacker (origin unknown)
Other Specify:
Don't know
f. How many of these incidents were reportedto the organizations specified in 11e?
Number
e. To which of the following organizations were theseincidents reported? Mark all that apply.
Local law enforcement
State law enforcement
FBI (Federal Bureau of Investigation)
US-CERT (United States Computer
Other Federal agency Specify:
CERT® Coordination Center
ISAC (Information Sharing
InfraGard
None of the above
Emergency Readiness Team)
and Analysis Center)
How many incidents were detected?
(If "No", skip to 12.)
c. Which of the following types of security technology or practiceswere inadequate in preventing these incidents? Mark all that apply.
Number
j. What other monetary losses and costs were incurred in 2005due to these incidents? ESTIMATES are acceptable.
INCLUDE the cost of diagnosis, repair and replacement such as labor,
hardware, software, etc. If possible, include the estimated value of
downtime, lost productivity,
income from lost sales, labor
or fees for legal or
investigative work, etc.
EXCLUDE costs
associated solely with the
prevention of future incidents.
i. What was the dollar value of personal or financial informationtaken by theft in 2005?ESTIMATES are acceptable.
$
Mil. Thou. Dol.
$
Mil. Thou. Dol.
FORM NCSS-1
0 0 0
0 0 0
13532
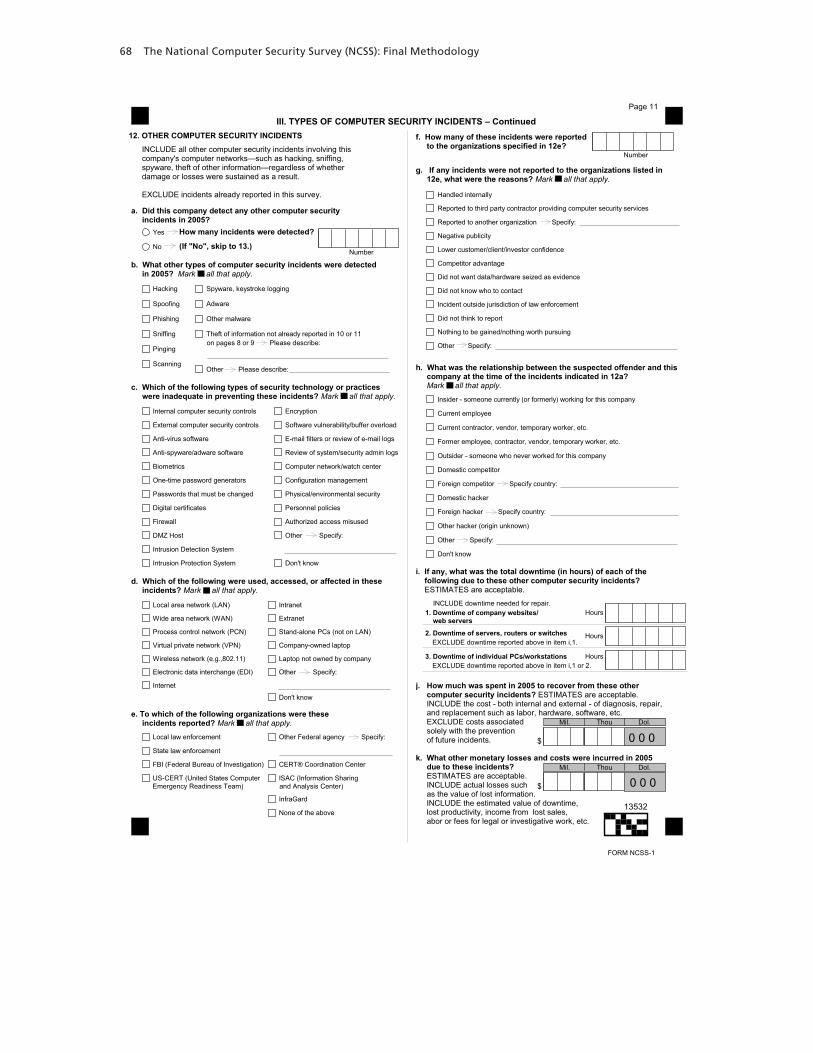
68 The National Computer Security Survey (NCSS): Final Methodology
k. What other monetary losses and costs were incurred in 2005due to these incidents?ESTIMATES are acceptable.
INCLUDE actual losses such
as the value of lost information.
INCLUDE the estimated value of downtime,
lost productivity, income from lost sales,
abor or fees for legal or investigative work, etc.
b. What other types of computer security incidents were detectedin 2005? Mark all that apply.
���"�� !�,�����-!+��.�,��+.�� ��������,������������12. OTHER COMPUTER SECURITY INCIDENTS
Local area network (LAN)
Wide area network (WAN)
Process control network (PCN)
Virtual private network (VPN)
Wireless network (e.g.,802.11)
Electronic data interchange (EDI)
Internet
Intranet
Extranet
Stand-alone PCs (not on LAN)
Company-owned laptop
Laptop not owned by company
Other Specify:
Don't know
e. To which of the following organizations were theseincidents reported? Mark all that apply.
Local law enforcement
State law enforcement
FBI (Federal Bureau of Investigation)
US-CERT (United States Computer
Other Federal agency Specify:
CERT® Coordination Center
ISAC (Information Sharing
InfraGard
None of the above
Emergency Readiness Team) and Analysis Center)
INCLUDE all other computer security incidents involving this
���������������� ����� ������������������������������� ������������� ���� ������� ��� ������������ damage or losses were sustained as a result.
EXCLUDE incidents already reported in this survey.
a. Did this company detect any other computer securityincidents in 2005?
Yes
No
Hacking
Spoofing
Phishing
Sniffing
Pinging
Scanning
Spyware, keystroke logging
Adware
Other malware
Theft of information not already reported in 10 or 11
Other Please describe:
on pages 8 or 9 Please describe:
Internal computer security controls
External computer security controls
Anti-virus software
Anti-spyware/adware software
Biometrics
One-time password generators
Passwords that must be changed
Digital certificates
Firewall
DMZ Host
Intrusion Detection System
Intrusion Protection System
Encryption
Software vulnerability/buffer overload
E-mail filters or review of e-mail logs
Review of system/security admin logs
Computer network/watch center
Configuration management
Physical/environmental security
Personnel policies
Authorized access misused
Other Specify:
Don't know
d. Which of the following were used, accessed, or affected in theseincidents? Mark all that apply.
i. If any, what was the total downtime (in hours) of each of thefollowing due to these other computer security incidents?ESTIMATES are acceptable.
EXCLUDE downtime reported above in item i,1 or 2.
EXCLUDE downtime reported above in item i,1.
f. How many of these incidents were reportedto the organizations specified in 12e?
Number
Handled internally
Reported to third party contractor providing computer security services
Reported to another organization Specify:
Negative publicity
Lower customer/client/investor confidence
Competitor advantage
Did not want data/hardware seized as evidence
Did not know who to contact
Incident outside jurisdiction of law enforcement
Did not think to report
Nothing to be gained/nothing worth pursuing
Other Specify:
g. If any incidents were not reported to the organizations listed in12e, what were the reasons? Mark all that apply.
h. What was the relationship between the suspected offender and thiscompany at the time of the incidents indicated in 12a?Mark all that apply.
Insider - someone currently (or formerly) working for this company
Current employee
Current contractor, vendor, temporary worker, etc.
Former employee, contractor, vendor, temporary worker, etc.
Outsider - someone who never worked for this company
Domestic competitor
Foreign competitor Specify country:
Domestic hacker
Foreign hacker Specify country:
Other hacker (origin unknown)
Other Specify:
Don't know
j. How much was spent in 2005 to recover from these othercomputer security incidents? ESTIMATES are acceptable.
INCLUDE the cost - both internal and external - of diagnosis, repair,
and replacement such as labor, hardware, software, etc.
EXCLUDE costs associated
solely with the prevention
of future incidents.
Page 11
How many incidents were detected?
(If "No", skip to 13.)
c. Which of the following types of security technology or practiceswere inadequate in preventing these incidents? Mark all that apply.
Number
Hours
Hours
Hours
INCLUDE downtime needed for repair.
1. Downtime of company websites/web servers
2. Downtime of servers, routers or switches
3. Downtime of individual PCs/workstations
Mil. Thou. Dol.
$
$
Mil. Thou. Dol.
FORM NCSS-1
0 0 0
0 0 0
13532
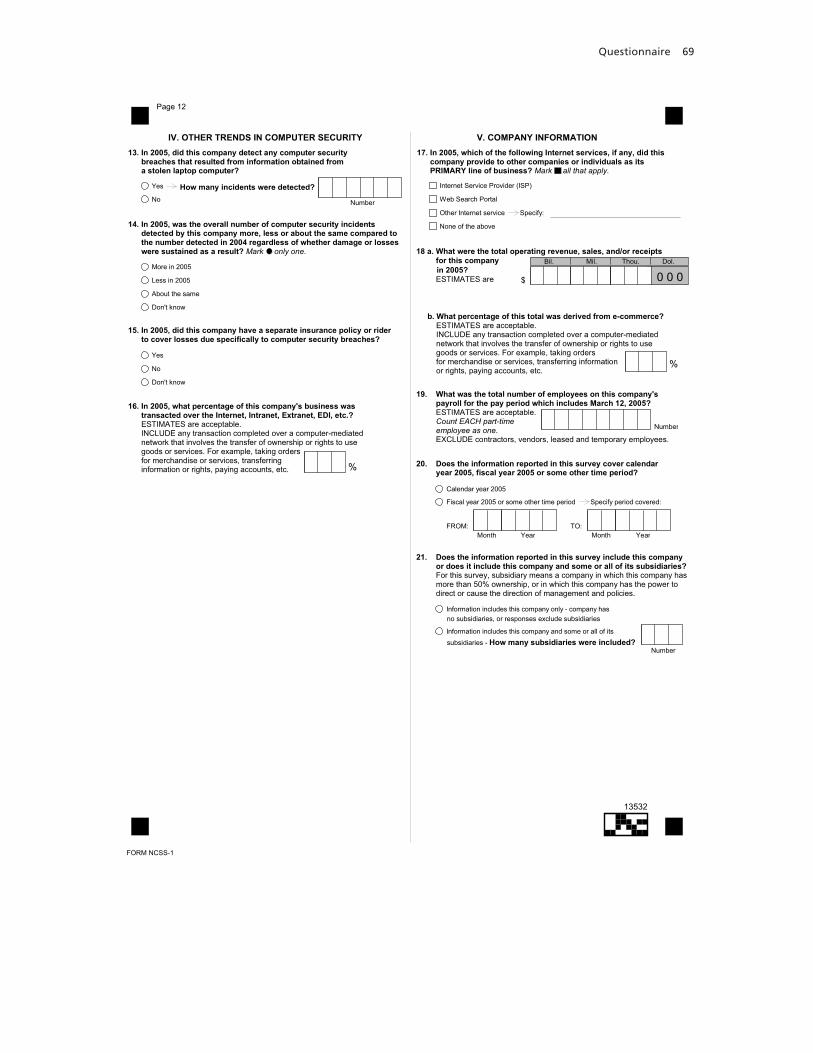
Questionnaire 69
Page 12
IV. OTHER TRENDS IN COMPUTER SECURITY
13. In 2005, did this company detect any computer securitybreaches that resulted from information obtained froma stolen laptop computer?
Yes
No
How many incidents were detected?
Number
14. In 2005, was the overall number of computer security incidentsdetected by this company more, less or about the same compared tothe number detected in 2004 regardless of whether damage or losseswere sustained as a result? Mark only one.
More in 2005
Less in 2005
About the same
Don't know
15. In 2005, did this company have a separate insurance policy or riderto cover losses due specifically to computer security breaches?
Yes
No
Don't know
16. In 2005, what percentage of this company's business wastransacted over the Internet, Intranet, Extranet, EDI, etc.?ESTIMATES are acceptable.
INCLUDE any transaction completed over a computer-mediated
network that involves the transfer of ownership or rights to use
goods or services. For example, taking orders
for merchandise or services, transferring
information or rights, paying accounts, etc. %
V. COMPANY INFORMATION
18 a. What were the total operating revenue, sales, and/or receiptsfor this companyin 2005?ESTIMATES are
b. What percentage of this total was derived from e-commerce?ESTIMATES are acceptable.
INCLUDE any transaction completed over a computer-mediated
network that involves the transfer of ownership or rights to use
goods or services. For example, taking orders
for merchandise or services, transferring information
or rights, paying accounts, etc.
19. What was the total number of employees on this company'spayroll for the pay period which includes March 12, 2005?ESTIMATES are acceptable.
Count EACH part-timeemployee as one.EXCLUDE contractors, vendors, leased and temporary employees.
Number
20. Does the information reported in this survey cover calendaryear 2005, fiscal year 2005 or some other time period?
Calendar year 2005
Fiscal year 2005 or some other time period Specify period covered:
%
Month
TO:
21. Does the information reported in this survey include this companyor does it include this company and some or all of its subsidiaries?For this survey, subsidiary means a company in which this company has
more than 50% ownership, or in which this company has the power to
direct or cause the direction of management and policies.
Information includes this company only - company has
Information includes this company and some or all of its
no subsidiaries, or responses exclude subsidiaries
subsidiaries - How many subsidiaries were included?Number
$
Mil. Thou. Dol.Bil.
YearMonth
FROM:
Year
FORM NCSS-1
0 0 0
Internet Service Provider (ISP)
Web Search Portal
Other Internet service Specify:
None of the above
17. In 2005, which of the following Internet services, if any, did thiscompany provide to other companies or individuals as itsPRIMARY line of business? Mark all that apply.
13532
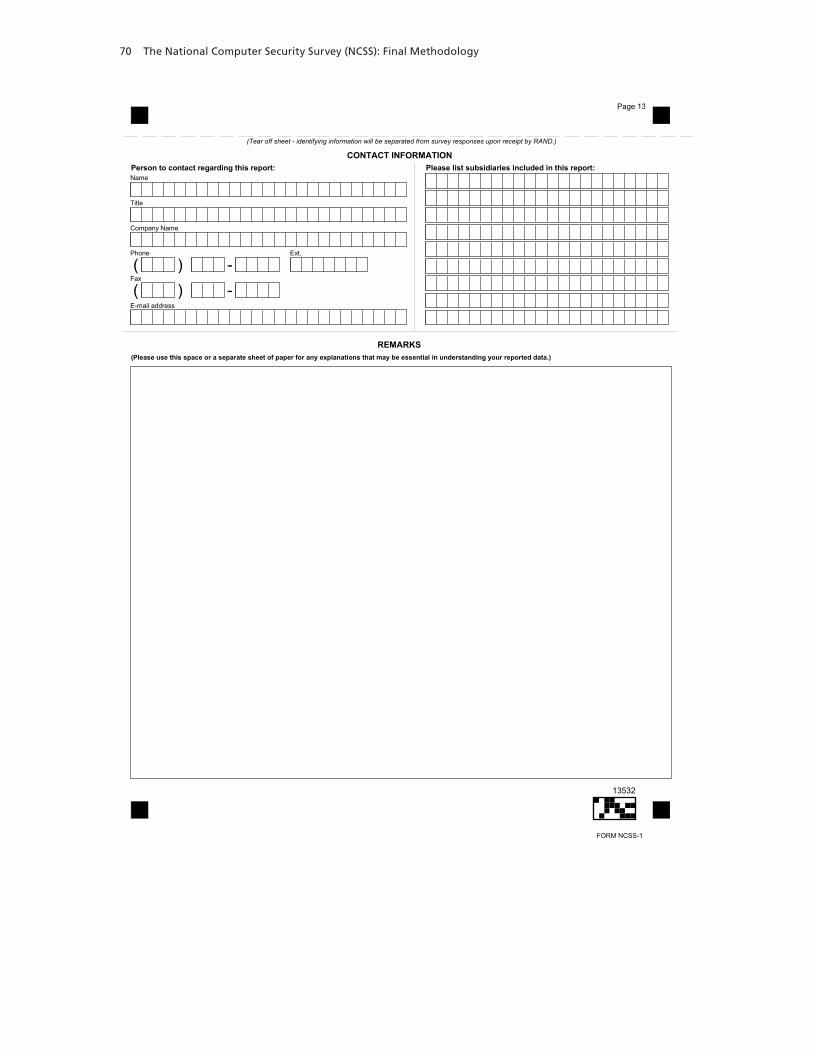
70 The National Computer Security Survey (NCSS): Final Methodology
(Tear off sheet - identifying information will be separated from survey responses upon receipt by RAND.)
CONTACT INFORMATIONPerson to contact regarding this report:Name
Title
Company Name
Fax
( ) -E-mail address
Ext.Phone
( ) -
Please list subsidiaries included in this report:
REMARKS(Please use this space or a separate sheet of paper for any explanations that may be essential in understanding your reported data.)
Page 13
FORM NCSS-1
13532
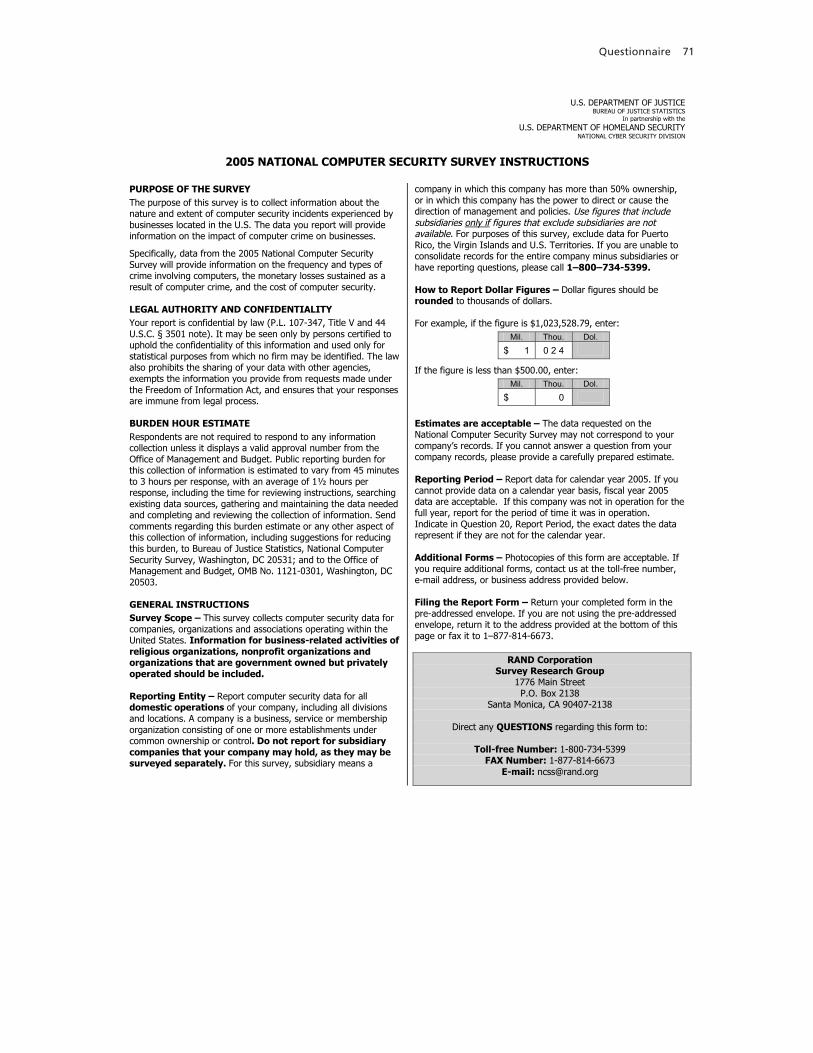
Questionnaire 71
U.S. DEPARTMENT OF JUSTICEBUREAU OF JUSTICE STATISTICS
In partnership with theU.S. DEPARTMENT OF HOMELAND SECURITY
NATIONAL CYBER SECURITY DIVISION
2005 NATIONAL COMPUTER SECURITY SURVEY INSTRUCTIONS
PURPOSE OF THE SURVEYThe purpose of this survey is to collect information about thenature and extent of computer security incidents experienced bybusinesses located in the U.S. The data you report will provideinformation on the impact of computer crime on businesses.
Specifically, data from the 2005 National Computer SecuritySurvey will provide information on the frequency and types ofcrime involving computers, the monetary losses sustained as aresult of computer crime, and the cost of computer security.
LEGAL AUTHORITY AND CONFIDENTIALITYYour report is confidential by law (P.L. 107-347, Title V and 44U.S.C. § 3501 note). It may be seen only by persons certified touphold the confidentiality of this information and used only forstatistical purposes from which no firm may be identified. The lawalso prohibits the sharing of your data with other agencies,exempts the information you provide from requests made underthe Freedom of Information Act, and ensures that your responsesare immune from legal process.
BURDEN HOUR ESTIMATERespondents are not required to respond to any informationcollection unless it displays a valid approval number from theOffice of Management and Budget. Public reporting burden forthis collection of information is estimated to vary from 45 minutesto 3 hours per response, with an average of 1½ hours perresponse, including the time for reviewing instructions, searchingexisting data sources, gathering and maintaining the data neededand completing and reviewing the collection of information. Sendcomments regarding this burden estimate or any other aspect ofthis collection of information, including suggestions for reducingthis burden, to Bureau of Justice Statistics, National ComputerSecurity Survey, Washington, DC 20531; and to the Office ofManagement and Budget, OMB No. 1121-0301, Washington, DC20503.
GENERAL INSTRUCTIONSSurvey Scope � This survey collects computer security data forcompanies, organizations and associations operating within theUnited States. Information for business-related activities ofreligious organizations, nonprofit organizations andorganizations that are government owned but privatelyoperated should be included.
Reporting Entity � Report computer security data for alldomestic operations of your company, including all divisionsand locations. A company is a business, service or membershiporganization consisting of one or more establishments undercommon ownership or control. Do not report for subsidiarycompanies that your company may hold, as they may besurveyed separately. For this survey, subsidiary means a
company in which this company has more than 50% ownership,or in which this company has the power to direct or cause thedirection of management and policies. Use figures that includesubsidiaries only if figures that exclude subsidiaries are notavailable. For purposes of this survey, exclude data for PuertoRico, the Virgin Islands and U.S. Territories. If you are unable toconsolidate records for the entire company minus subsidiaries orhave reporting questions, please call 1�800�734-5399.
How to Report Dollar Figures � Dollar figures should berounded to thousands of dollars.
For example, if the figure is $1,023,528.79, enter:
If the figure is less than $500.00, enter:
Estimates are acceptable � The data requested on theNational Computer Security Survey may not correspond to your��������� ����������������������� ������ ���������������company records, please provide a carefully prepared estimate.
Reporting Period � Report data for calendar year 2005. If youcannot provide data on a calendar year basis, fiscal year 2005data are acceptable. If this company was not in operation for thefull year, report for the period of time it was in operation.Indicate in Question 20, Report Period, the exact dates the datarepresent if they are not for the calendar year.
Additional Forms � Photocopies of this form are acceptable. Ifyou require additional forms, contact us at the toll-free number,e-mail address, or business address provided below.
Filing the Report Form � Return your completed form in thepre-addressed envelope. If you are not using the pre-addressedenvelope, return it to the address provided at the bottom of thispage or fax it to 1�877-814-6673.
RAND CorporationSurvey Research Group
1776 Main StreetP.O. Box 2138
Santa Monica, CA 90407-2138
Direct any QUESTIONS regarding this form to:
Toll-free Number: 1-800-734-5399FAX Number: 1-877-814-6673E-mail: [email protected]
Mil. Thou. Dol.
$ 1 0 2 4
Mil. Thou. Dol.
$ 0
72 The National Computer Security Survey (NCSS): Final Methodology
GLOSSARY OF TERMSAdware � A software application that automatically displays advertisements,typically in the form of pop-up windows. Adware sometimes includes spyware.
Anti-spyware/adware software � A utility that looks for spyware and/oradware and alerts the user to any that are found.
Anti-virus software � A utility that looks for viruses and alerts the user toany that are found.
Biometrics � Methods of generating authentication information for a personby digitizing measurements of a physical characteristic, such as a fingerprint,a hand shape, a retinal pattern, a speech pattern (voice print), orhandwriting.
Business continuity plan for computer systems � The procedure anorganization uses to maintain essential functions during and after a disaster,such as a dual back-up system at a separate physical location. It seeks toensure the uninterrupted provision of mission-critical functions. It oftenincludes a disaster recovery plan.
Company laptops � Any laptop computer issued by this company, whetherowned or leased.
Computer/network watch center � The location from which control isexercised over a communications network, usually either telephony orInternet, though sometimes also that of a public utility. It is sometimes alsothe location containing many or all of the primary servers and otherequipment that runs an internet service provider. This center is also wherethe technicians that maintain the servers, develop new software, andtroubleshoot outages are located.
Configuration management � The management of security features andassurances through control of changes made to hardware, software,firmware, documentation, test fixtures, and test documentation of anautomated information system, throughout the development and operationallife of a system. Includes Source Code Management or revision control. Thecontrol of changes�including the recording thereof�that are made to thehardware, software, firmware, and documentation throughout the systemlifecycle.
Corporate policy on computer security � A defined set of practices andguidelines established by the organization to deal with issues involvingcomputer security. Such practices and guidelines can encompass theresponsibilities of both the organization and its employees. Employees havebeen made aware of this policy.
Digital certificates � An attachment to an electronic message used forsecurity purposes. The most common use of a digital certificate is to verifythat a user sending a message is who he or she claims to be, and to providethe receiver with the means to encode a reply.
Disaster recovery plan for computer systems � A procedure to restore���������������������-critical functions after, and to minimize the effectsof, a major interruption of computer services. It includes procedures forreporting specific types of problems to designated personnel, repairing orreplacing damaged systems, etc.
DMZ Host � A ������ ��������������������� ��������� ��� �� ��������������� ������ ������������� xternal network such as the Internet. ADMZ host is usually inserted behind or between firewalls.
Electronic Data Interchange (EDI) � A proprietary electronic system usedfor exchanging business data over a computer network.
E-mail logs or filters � E-mail logs keep track of incoming/outgoingmessages, including the sender and the recipient. Filters are an automatedmethod of searching the content of e-mail for words, viruses, or misuse ofcomputer resources.
Encryption � The translation of data into a format that requires a code torestore it to the original format. To read an encrypted file, you must haveaccess to a secret key or password that allows you to decrypt it.
Equipment decommissioning � A procedure used for removing computerequipment from active use within an information system or network. Thisinvolves changing settings within the system to reflect their absence, and theremoval of all sensitive information from the computer equipment, particularlyfrom hard drives and other media.
External computer security controls � Hardware, software, and/orcompany policies and practices limiting the access of outsiders to the�������������� ���� ������� �������
Extranet � A network that uses Internet/Intranet technology to makeinformation available to authorized outsiders. It allows businesses to securelyshare information with selected suppliers, partners, customers, or otherbusinesses.
Firewall � Hardware and/or software designed to prevent unauthorizedaccess to or from a private network, particularly networks with Internet orIntranet connectivity.
Formal computer security audit standards � An established orauthoritative set of criteria used to review computer security systems.
Hacker � An unauthorized person who cracks a computer system or exceedsauthorized access for malicious intent or for the thrill of the challenge.
Hard-wired telecommunication lines � Telecommunication lines that arecopper or fiber-optic and stationary, as opposed to wireless.
������������ � �������� ��tical assets � Determining the criticalfunctions that the organization performs, and the assets (such as informationand telecommunication systems) upon which those functions are vitallydependent. Those critical assets are ones for which special security andreliability measures should be focused.
Insurance covering computer security breaches � This type ofinsurance specifically covers losses due to computer break-in exposures,usually in a separate policy or rider. The coverage is typically called networksecurity liability, e-commerce liability, Internet security liability, or hackerinsurance.
Internal computer security controls � Hardware, software, and/orcompany policies and practices limiting the access of insiders�employees,contractors, vendors, etc.������ ��������������� ���� ������ �������These controls may vary by department and/or employee function.
Internet � Inter-connected networks linking millions of computers globally.Users can access information and applications from other computers andcommunicate with other users.
Intranet � An internal network similar to the Internet but surrounded by afirewall to prevent access from users outside the company, organization, orfacility.
Intrusion detection system � An intrusion detection system examines allinbound and outbound network activity and identifies suspicious patterns thatmay signal a network or system attack from someone attempting to breakinto or compromise a system.
Intrusion/penetration testing of computer security � A method ofevaluating the security of a computer system and identifying its vulnerabilitiesby attempting to circumvent or override system security through thesimulation of an attack by a malicious actor.
Intrusion protection system � A suite of access control tools used toprotect computers from exploitation. Intrusion protection systems may alsoact at the host level to deny potentially malicious activity.
Local area network (LAN) � A computer network that spans a small areasuch as a single building or group of buildings.
Malware � Malicious software or code developed to serve a harmful purpose.Specific types of malware include viruses, worms, Trojan horses, spyware,and adware.
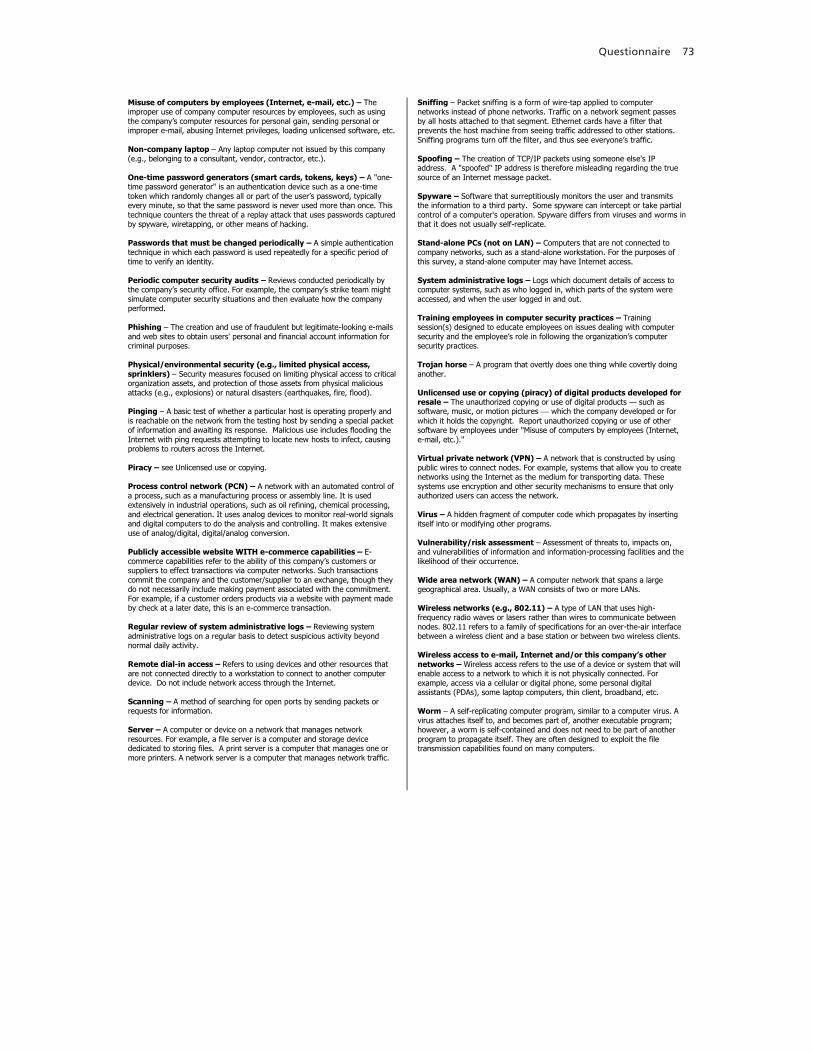
Questionnaire 73
Misuse of computers by employees (Internet, e-mail, etc.) � Theimproper use of company computer resources by employees, such as using�� ��������������� ��� ���� ������ ���������� � ������� ���������improper e-mail, abusing Internet privileges, loading unlicensed software, etc.
Non-company laptop � Any laptop computer not issued by this company(e.g., belonging to a consultant, vendor, contractor, etc.).
One-time password generators (smart cards, tokens, keys) � A "one-time password generator" is an authentication device such as a one-timetoken which randomly ch��� ������������������ �� �������� �����������every minute, so that the same password is never used more than once. Thistechnique counters the threat of a replay attack that uses passwords capturedby spyware, wiretapping, or other means of hacking.
Passwords that must be changed periodically � A simple authenticationtechnique in which each password is used repeatedly for a specific period oftime to verify an identity.
Periodic computer security audits � Reviews conducted periodically bythe comp���� ������������ ��!��� #���� ��� ������������� �� ���������simulate computer security situations and then evaluate how the companyperformed.
Phishing � The creation and use of fraudulent but legitimate-looking e-mailsand web sites to obtain users' personal and financial account information forcriminal purposes.
Physical/environmental security (e.g., limited physical access,sprinklers) � Security measures focused on limiting physical access to criticalorganization assets, and protection of those assets from physical maliciousattacks (e.g., explosions) or natural disasters (earthquakes, fire, flood).
Pinging � A basic test of whether a particular host is operating properly andis reachable on the network from the testing host by sending a special packetof information and awaiting its response. Malicious use includes flooding theInternet with ping requests attempting to locate new hosts to infect, causingproblems to routers across the Internet.
Piracy � see Unlicensed use or copying.
Process control network (PCN) � A network with an automated control ofa process, such as a manufacturing process or assembly line. It is usedextensively in industrial operations, such as oil refining, chemical processing,and electrical generation. It uses analog devices to monitor real-world signalsand digital computers to do the analysis and controlling. It makes extensiveuse of analog/digital, digital/analog conversion.
Publicly accessible website WITH e-commerce capabilities � E-���� �� ����������� �� � ������� ����������������������������� �����suppliers to effect transactions via computer networks. Such transactionscommit the company and the customer/supplier to an exchange, though theydo not necessarily include making payment associated with the commitment.For example, if a customer orders products via a website with payment madeby check at a later date, this is an e-commerce transaction.
Regular review of system administrative logs � Reviewing systemadministrative logs on a regular basis to detect suspicious activity beyondnormal daily activity.
Remote dial-in access � Refers to using devices and other resources thatare not connected directly to a workstation to connect to another computerdevice. Do not include network access through the Internet.
Scanning � A method of searching for open ports by sending packets orrequests for information.
Server � A computer or device on a network that manages networkresources. For example, a file server is a computer and storage devicededicated to storing files. A print server is a computer that manages one ormore printers. A network server is a computer that manages network traffic.
Sniffing � Packet sniffing is a form of wire-tap applied to computernetworks instead of phone networks. Traffic on a network segment passesby all hosts attached to that segment. Ethernet cards have a filter thatprevents the host machine from seeing traffic addressed to other stations.&��������������������������� ����� � ��������� � * ���� ���������
Spoofing � The creation of TCP/IP packets using someone else's IPaddress. A "spoofed" IP address is therefore misleading regarding the truesource of an Internet message packet.
Spyware � Software that surreptitiously monitors the user and transmitsthe information to a third party. Some spyware can intercept or take partialcontrol of a computer's operation. Spyware differs from viruses and worms inthat it does not usually self-replicate.
Stand-alone PCs (not on LAN) � Computers that are not connected tocompany networks, such as a stand-alone workstation. For the purposes ofthis survey, a stand-alone computer may have Internet access.
System administrative logs � Logs which document details of access tocomputer systems, such as who logged in, which parts of the system wereaccessed, and when the user logged in and out.
Training employees in computer security practices � Trainingsession(s) designed to educate employees on issues dealing with computer ������������� � ����� ���� ���������������� �������������������� ��security practices.
Trojan horse � A program that overtly does one thing while covertly doinganother.
Unlicensed use or copying (piracy) of digital products developed forresale � The unauthorized copying or use of digital products + such assoftware, music, or motion pictures � which the company developed or forwhich it holds the copyright. Report unauthorized copying or use of othersoftware by employees under "Misuse of computers by employees (Internet,e-mail, etc.)."
Virtual private network (VPN) � A network that is constructed by usingpublic wires to connect nodes. For example, systems that allow you to createnetworks using the Internet as the medium for transporting data. Thesesystems use encryption and other security mechanisms to ensure that onlyauthorized users can access the network.
Virus � A hidden fragment of computer code which propagates by insertingitself into or modifying other programs.
Vulnerability/risk assessment � Assessment of threats to, impacts on,and vulnerabilities of information and information-processing facilities and thelikelihood of their occurrence.
Wide area network (WAN) � A computer network that spans a largegeographical area. Usually, a WAN consists of two or more LANs.
Wireless networks (e.g., 802.11) � A type of LAN that uses high-frequency radio waves or lasers rather than wires to communicate betweennodes. 802.11 refers to a family of specifications for an over-the-air interfacebetween a wireless client and a base station or between two wireless clients.
Wireless access to e-mail, Internet and/or this com������ ����� networks � Wireless access refers to the use of a device or system that willenable access to a network to which it is not physically connected. Forexample, access via a cellular or digital phone, some personal digitalassistants (PDAs), some laptop computers, thin client, broadband, etc.
Worm � A self-replicating computer program, similar to a computer virus. Avirus attaches itself to, and becomes part of, another executable program;however, a worm is self-contained and does not need to be part of anotherprogram to propagate itself. They are often designed to exploit the filetransmission capabilities found on many computers.

75
Bibliography
Collins, Linda M., Joseph L. Schafer, and Chi-Ming Kam, “A Comparison of Inclusive and Restrictive Strategies in Modern Missing Data Procedures,” Psychological Methods, Vol. 6, No. 4, December 2001, pp. 330–351.
Dillman, Don A., Mail and Internet Surveys: The Tailored Design Method, 2nd ed., Hoboken, N.J.: Wiley, 2007.
Dun and Bradstreet, The DUNSRight Process: The Power Behind Quality Information, presentation to the RAND Corporation, May 2004.
International Organization for Standards, “Information Technology: Security Techniques—Code of Practice for Information Security Management,” standard 17799:2005.
ISO—see International Organization for Standards.
National Science Foundation, Division of Science Resources Statistics, Information Technology Innovation Survey: Fall 2001, Arlington, Va., 2004. As of March 18, 2008: http://www.nsf.gov/statistics/nsf04305/
NSF—see National Science Foundation.
Rantala, Ramona R., Cybercrime Against Businesses, Washington, D.C.: U.S. Department of Justice, Office of Justice Programs, NCJ200639, March 2004. As of March 23, 2008: http://purl.access.gpo.gov/GPO/LPS77521
Rubin, Donald B., “Inference and Missing Data,” Biometrika, Vol. 63, No. 3, December 1976, pp. 581–592.
Sand, Kelly L., Sarah K. Cotton, Robert H. Anderson, Daniela Golinelli, Rosalind Lewis, and Lois M. Davis, The National Computer Security Survey Cognitive Interviewing Report, Santa Monica, Calif.: RAND Corporation, 2005. Not cleared for open publication.
Schafer, Joseph L., and John W. Graham, “Missing Data: Our View of the State of the Art,” Psychological Methods, Vol. 7, No. 2, June 2002, pp. 147–177.