Embed Size (px)
Citation preview
"THE CHEMICAL CHARACTERISTICS OF V I C T O R I A N BROMN COAL"
G . .I. Perry, 0. J. A l l a r d i c e and L. T. K iss*
V i c t o r i a n Brown Coal Counc i l , 151 F l i n d e r s S t r e e t , Melbourne, 3000 A u s t r a l i a , 'State E l e c t r i c i t y Commission o f V i c t o r i a , Herman Research Laboratory , Howard
S t r e e t , Richmond, 3121 A u s t r a l i a .
1. INTRODUCTION
Extens ive depos i t s o f s o f t brown c o a l e x i s t i n T e r t i a r y age sediments i n a number o f areas i n V i c t o r i a and t h e l a r g e s t s i n g l e depos i t occurs i n t h e La t robe Valley, about i50 k i l o m e t e r s eas t o f i k i b o u r n e . i n t h i s r e g i o n the c o a l seams of ten exceed 150 metres i n th i ckness , wi th an overburden t o c o a l r a t i o u s u a l l y b e t t e r than 1:2 making t h e c o a l i d e a l l y s u i t e d f o r l a r g e - s c a l e open-cut min ing.
A recen t s tudy (1) has es t ima ted t h e S t a t e ' s brown c o a l resources t o be almost 200,000 m i l l i o n tonnes w i t h approx imate ly 52,000 m i l l i o n tonnes de f i ned as usable reserves.
Since 1920 Lat robe Va l l ey brown c o a l has been developed f o r power generat ion. The S t a t e E l e c t r i c i t y Commission o f V i c t o r i a (SECV) wins c o a l from two major open cu ts a t Ya l l ou rn and Morwel l and operates c o a l f i r e d power s t a t i o n s which p resen t l y consume approx imate ly 35 m i l l i o n tonnes pe r annum. I n a d d i t i o n t o power generation, sma l l q u a n t i t i e s o f brown c o a l a r e used fo r b r i q u e t t e manufacture and char product ion.
Brown coa l accounts f o r about 95% o f V i c t o r i a ' s non-renewable energy reserves and i t i s now recognized t h a t w i t h s u i t a b l e up-grading, p r i m a r i l y d ry ing , i t has the p o t e n t i a l t o become t h e b a s i s o f t h e supply o f energy i n a v a r i e t y o f forms. C u r r e n t l y va r ious s t u d i e s f o r major convers ion p r o j e c t s proposed by Aus t ra l i an , Japanese and German i n t e r e s t s a r e be ing undertaken w i t h t h e co-operat ion o f the V i c t o r i a n Brown Coal Counci l , t h e most advanced p r o j e c t be ing a 50 tonne per day hydrogenation p i l o t p l a n t c u r r e n t l y under c o n s t r u c t i o n a t Morwell funded by New Energy Development Organ iza t i on (NEOO) o f Japan.
The chemical c h a r a c t e r i s t i c s o f La t robe Va l l ey brown c o a l s have been ex tens i ve l y s t u d i e d over t h e l a s t t w e n t y - f i v e years, p r i m a r i l y i n r e l a t i o n t o t h e e f f e c t o f c o a l q u a l i t y on combustion f o r power generat ion. More r e c e n t l y a research p r o j e c t was i n i t i a t e d wi th t h e o b j e c t i v e o f de te rm in ing t h e c h a r a c t e r i s t i c s and s u i t a b i l i t y o f t h e S t a t e ' s brown c o a l resources f o r uses o t h e r than power generat ion, p r i m a r i l y convers ion t o l i q u i d f u e l s .
Th is paper o u t l i n e s t h e chemical c h a r a c t e r i s t i c s o f V i c t o r i a n brown c o a l and d iscusses t h e v a r i a b i l i t y o f t h e c o a l b o t h between f i e l d s and within a seam. The importance o f chemical p r o p e r t i e s i n r e l a t i o n t o c o a l q u a l i t y and t h e i m p l i c a t i o n s fo r u t i l i z a t i o n a re a l s o b r i e f l y addressed.
2 . PROPERTIES OF VICTORIAN BROWN COAL
The development and adap ta t i on o f modern a n a l y t i c a l techniques f o r a n a l y s i s o f V i c t o r i a n brown c o a l was p ioneered j o i n t l y i n t h e 1960's by t h e Commonwealth S c i e n t i f i c and I n d u s t r i a l Research Organ iza t i on and t h e S t a t e E l e c t r i c i t y Commission o f V i c t o r i a . As a r e s u l t t he t o t a l c o a l a n a l y s i s t ime was ha lved and t h e de te rm ina t ion o f t h e ash forming c o n s t i t u e n t s d i r e c t l y on t h e c o a l t ook one s i x t h o f t h e t ime o f conven t iona l ash ana lys i s . More i m p o r t a n t l y brown c o a l a n a l y s i s was p u t onto a r a t i o n a l b a s i s t a k i n g i t s unique p r o p e r t i e s i n t o account; and p r o v i d i n g more p e r t i n e n t i n f o r m a t i o n concern ing t h e genesis, occurrence and use of V i c t o r i a n brown coa l .
About 85% o f th is c o a l i s l o c a t e d i n t h e La t robe Val ley.
2
Moisture
One O f t h e most impor tan t chemical measurements made on brown c o a l i s t h e mois ture content which i s a l s o a good measure o f p h y s i c a l rank; t h e g r e a t e r the degree o f compaction of t h e c o a l and i t s degree o f c o a l i f i c a t i o n , t h e lower i s the mois ture content . To o b t a i n meaningfu l r e s u l t s the sampling and sample prepara- t i o n have t o be c a r r i e d ou t q u i c k l y t o avo id mo is tu re loss. The choice of the method of de te rm ina t ion is impor tan t as thermal decomposit ion o f f u n c t i o n a l groups can r e s u l t i n l o s s o f C02 as w e l l as H20. The p r e f e r r e d methods the re fo re i n v o l v e d i r e c t measurement o f t h e water re leased e i t h e r by azeo t rop i c d i s t i l l a t i o n or adsorpt ion from an i n t e r t c a r r i e r gas r a t h e r than by weight l o s s of t h e coa l .
I t i s impor tant t o r e a l i z e t h a t t h e bed mo is tu re con ten t o f s o f t brown c o a l s 1s s i g n i f i c a n t l y h ighe r than t h e e q u i l i b r i u m moisture h o l d i n g capac i t y , a parameter which i s used t o c h a r a c t e r i z e h ighe r ranks coals . Th is i s i l l u s t r a t e d i n Table 1 fo r a range o f V i c t o r i a n brown coals .
I n terms o f mo is tu re t h e economic va lue of h i g h rank c o a l s i s bes t i n d i c a t e d by the mois ture h o l d i n g c a p a c i t y because i t r e f l e c t s the c o n d i t i o n o f t h e c o a l f o r u t i l i z a t i o n . I n t h e case o f V i c t o r i a n brown c o a l t h e bed mois ture content i s the c r i t i c a l value, s i n c e t h e c o a l i s used d i r e c t l y from t h e open c u t .
iJ 1 i '{
Minera l and Ino rqan ic Content
Ash content has been t r a d i t i o n a l l y used t o assess t h e magnitude o f combustion res idue and t o d e r i v e t h e so c a l l e d "coa l substance" by d i f f e r e n c e which a l l ows meaningful comparisons o f d i f f e r e n t coals . I n t h i s con tex t t h e ash i s used as an approximation o f t h e m ine ra l ma t te r content . The t a c i t assumption made, of course, i s t h a t t h e ash i s de r i ved s o l e l y from c o a l minera ls , and t h i s i s c e r t a i n l y n o t t he case f o r V i c t o r i a n brown c o a l where the b u l k o f t h e ash forming m a t e r i a l occurs as i nhe ren t i n o r g a n i c ma t te r i n t h e form o f exchangeable ca t i ons , assoc iated wi th oxygen c o n t a i n i n g f u n c t i o n a l groups. This i s a l s o t h e case wi th many o t h e r low rank coals .
Using a combination o f X-Ray f luorescence (XRF) on c o a l p e l l e t s and Atomic abso rp t i on ( A A ) techniques on a c i d e x t r a c t s , d i r e c t chemical analyses o f t he ash forming elements i n V i c t o r i a n brown coa l has been performed. A r i s i n g from t h i s , a method o f express ion o f r e s u l t s has been developed (2 ) which i s based on c l a s s i f y i n g t h e m ine ra l ma t te r i n brown c o a l i n t o m i n e r a l and i n o r g a n i c ma t te r f r a c t i o n s and express ing each i n a way which r e f l e c t s t h e i r occurrence i n t h e coal .
The Inorganics a re a group of exchangeable c a t i o n s and water s o l u b l e s a l t s , analysed by AA on d i l u t e a c i d e x t r a c t s from t h e c o a l and expressed i n terms o f chemical a n a l y s i s on a c o a l bas i s as -
Ino rgan ics = Na + Ca + Mg + Fe + ( A l ) + ( S i ) + NaCl
where Fe r e f e r s t o the n o n - p y r i t i c i r o n and ( A I ) and ( S i ) t o the a c i d s o l u b l e aluminium and s i l i c o n r e s p e c t i v e l y . Th i s express ion i s compl icated by t h e f a c t t h a t some i r o n and aluminium can be present as a c i d s o l u b l e hydroxides, b u t these a re n o t u s u a l l y s i g n i f i c a n t .
The group named M ine ra l s , which occurs as d i s c r e t e p a r t i c l e s p r i n c i p a l l y o f quar tz , k a o l i n i t e and py r i t e /marcas i te i s expressed i n terms of chemical a n a l y s i s as -
Mine ra l s = S i 0 2 + A 1 ? O J + T i O , + K20 + FeS,
This express ion i gno res t h e water o f c o n s t i t u t i o n of c l a y s which i s u s u a l l y o f n e g l i g i b l e magnitude f o r V i c t o r i a n brown coa ls .
3
The t o t a l weight o f M ine ra l s and I n o r g a n i c s expressed on a d r y c o a l b a s i s g i ves t h e bes t est imate corresponding t o "m ine ra l ma t te r " i n h i g h rank c o a l technology. I n the case o f Lat robe Va l l ey c o a l s t h e Ino rgan ics a r e f a r more impor tan t than M i n e r a l s b a t h i n q u a n t i t y and from a u t i l i z a t i o n p o i n t o f view.
From a knowledge o f t h e chemical c o n s t i t u t i o n o f t h e m i n e r a l ma t te r i t i s poss ib le t o c a l c u l a t e and p r e d i c t t h e compos i t i on o f t he ash or i n o r g a n i c res idue remain ing a f t e r most t e c h n o l o g i c a l processes. Table 2 i l l u s t r a t e s the comparison between m i n e r a l ma t te r content and ash con ten t and the success fu l c a l c u l a t i o n o f ash con- t e n t from mine ra l ma t te r da ta f o r a number o f t y p i c a l V i c t o r i a n brown coa ls . Table 3 i l l u s t r a t e s the f u t i l i t y o f p r e d i c t i n g t h e q u a n t i t i e s o f ash produced i n modern, p u l v e r i z e d f u e l f i r e d power s t a t i o n s from t h e e m p i r i c a l ash t e s t r e s u l t s . I t i l l u s t r a t e s for Morwel l and Y a l l o u r n c o a l s t h e q u a n t i t i e s o f ash produced i n a b o i l e r as opposed t o t h e ash t e s t ; and i t compares t h e l a b o r a t o r y ash composi t ion w i th t h e p r e c i p i t a t o r ash a c t u a l l y produced. The m i n e r a l ma t te r composi t ion i s a l s o g i ven as a gu ide. Bo th t h e l a b o r a t o r y and p r e c i p i t a t o r ash composi t ions can be c a l c u l a t e d from t h e composi t ion o f t he m ine ra l ma t te r by a l l o w i n g f o r t he d i f - ference i n t h e degree o f s u l p h a t i o n o f t he Ino rgan ics . By extending t h i s approach i t shou ld a l s o be p o s s i b l e t o c a l c u l a t e t h e composi t ion o f the i n o r g a n i c res idue ob ta ined i n hydrogenat ion processes.
I t shou ld a l s o be no ted t h a t oxygen can o n l y be est imated by d i f f e r e n c e i f the m i n e r a l ma t te r i s known; u s i n g t h e ash va lue w i l l y i e l d m is lead ing r e s u l t s .
Oxyqen f u n c t i o n a l Groups
Oxygen i s one o f t h e major elements p resen t i n t h e o rgan ic substance o f V i c t o r i a n brown coa l . For La t robe V a l l e y brown c o a l s oxygen g e n e r a l l y comprises over 25% on a d r y m ine ra l and i n o r g a n i c f ree ( d m i f ) b a s i s and about h a l f o f t h i s oxygen can be accounted for i n t h e a c i d i c f u n c t i o n a l groups -phenol ic hyd roxy l , f r e e c a r b o x y l i c a c i d and carboxy late. The 40-50% o f t h e oxygen n o t accounted f o r as a c i d i c oxygen i s p r i m a r i l y conta ined i n ca rbony l groups, e t h e r l i n k a g e s and h e t e r o c y c l i c r i n g s t r u c t u r e s .
3. VARIATION OF CHEMICAL PROPERTIES WITHIN A SEAM
The v a r i a t i o n o f chemical p r o p e r t i e s i n a brown c o a l seam i s a t t r i b u t a b l e t o the i n f l u e n c e o f t w o independent v a r i a b l e s , namely c o a l rank and c o a l type. Rank v a r i a t i o n s a r e due t o t h e b u r i a l h i s t o r y o f t he coa l , t h a t i s t he t ime, temperature and pressure i t has undergone s i n c e i t s depos i t i on . However, t y p e ( o r l i t h o t y p e ) v a r i a t i o n s a l s o s i g n i f i c a n t l y i n f l u e n c e brown c o a l p roper t i es . L i t h o t y p e s a r i s e from v a r i a t i o n s i n t h e p r e v a i l i n g b o t a n i c a l communities, i n t h e depth and na tu re o f t he swamp water and i n t h e c o n d i t i o n s o f decay and decomposit ion o f p l a n t m a t e r i a l . I n V i c t o r i a n brown c o a l these l i t h o t y p e s a r e macroscopica l ly recogn izab le bands o r l a y e r s wi th in a c o a l seam which become r e a d i l y apparent on p a r t i a l l y d r i e d and weathered faces of open c u t s . The b a s i c f a c t o r s on which l i t h o t y p e s a r e c l a s s i - f i e d a r e c o l o u r and t e x t u r e i n a i r d r i e d c o a l , w i t h degree o f g e l i f i c a t i o n , weathering p a t t e r n and p h y s i c a l p r o p e r t i e s used as supplementary c h a r a c t e r i s t i c s which v a r i e s from p a l e t o dark brown. I n t h e case o f Lat robe Va l l ey coals , the c o l o u r o f t h e a i r d r i e d c o a l as measured by i t s d i f f u s e r e f l e c t a n c e and expressed as a Colour Index g i ves a numer i ca l va lue r e l a t e d t o l i t h o t y p e .
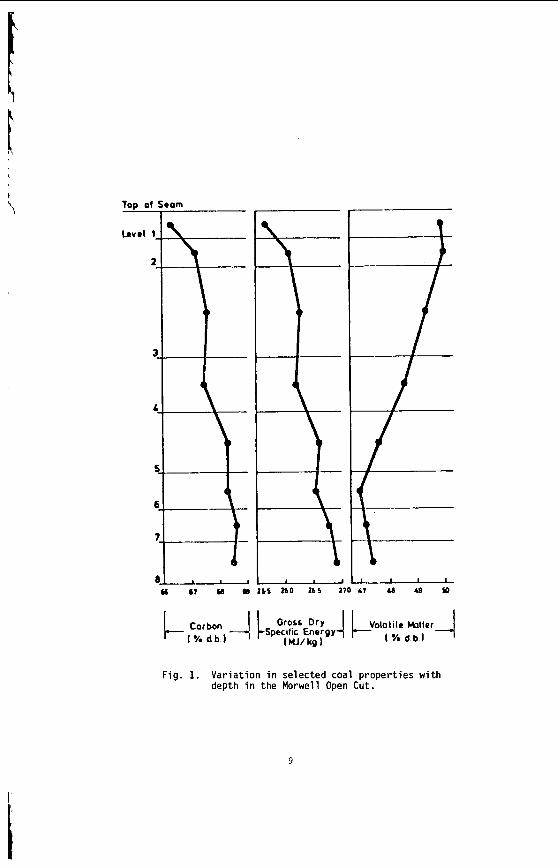
The v a r i a t i o n i n rank w i t h depth i n t h e Morwell Open Cut i s i l l u s t r a t e d by the y e a r l y weighted averages f o r each o p e r a t i n g l e v e l . The g rada t ion i n rank i s c l e a r l y i l l u s t r a t e d i n f i g u r e 1 by t h e i nc rease i n carbon content , and t h e associ- a ted i nc rease i n gross d r y s p e c i f i c energy; t h e v o l a t i l e mat ter a l s o decreases s l i g h t l y with depth. These samples were n o t s e l e c t e d on a l i t h o t y p e b a s i s and the gradual changes i n these c o a l p r o p e r t i e s a re presumed t o a r i s e p r i m a r i l y from the i nc rease in rank w i t h depth.
4
The v a r i a t i o n of c o a l p r o p e r t i e s w i t h l i t h o t y p e has been examined w i t h i n continuous sequences of samples taken from f i v e Lat robe Va l l ey c o a l f i e l d s ( 3 ) . The r e s u l t s i n d i c a t e t h a t t h e c o a l p r o p e r t i e s r e l a t e d t o t h e o rgan ic c o a l substance, eg: vola- t i l e mat ter , hydrogen, carbon, oxygen and s p e c i f i c energy vary w i t h l i t h o t y p e l a y e r s i n the c o a l seam. The dependence o f carbon and hydrogen on l i t h o t y p e (as measured by c o l o u r i ndex ) i s i l l u s t r a t e d i n F igu re 2 for a t y p i c a l bore. A l l the major c o n s t i t u e n t s of t h e o rgan ic c o a l substance a r e l i t h o t y p e dependent and t h e i r v a r i a t i o n w i t h i n a seam i s a d i r e c t consequence o f t h e changes i n depos i t i ona l environment which occu r red d u r i n g fo rma t ion o f t h e seam.
The occurrence o f o rgan ic su lphur and o rgan ic n i t r o g e n i s independent o f l i t h o t y p e a l though the concen t ra t i on o f n i t r o g e n i s i n f l u e n c e d by the presence o f wood i n the coa l .
Genera l ly speaking, t h e concen t ra t i on o f m ine ra l s i n t h e c o a l i s h i g h e s t near the overburden and t h e in terseam sediment l aye rs . Because o f t h e d i s c r e t e na tu re of t h e minera ls t h e i r sporadic d i s t r i b u t i o n i n a seam cannot be accu ra te l y assessed from a s i n g l e t r a v e r s e o f sampling through t h e seam.
The concen t ra t i on of i no rgan ics , p a r t i c u l a r l y sodium, magnesjum, ca l c ium and non- p y r i t i c i r o n show no r e l a t i o n s h i p t o l i t h o t y p e (F igu re 2 ) a l though some depth r e l a t e d concen t ra t i on g r a d i e n t s a re apparent. Sodium and magnesium o f t e n show a concen t ra t i on increase near t h e top o f a bore w h i l s t t h e aluminium concen t ra t i on tends t o increase near the bottom. Th is i s b e l i e v e d t o be due t o d i f f u s i o n of aluminium i n t o t h e c o a l from t h e c lay c o n t a i n i n g sediments below t h e c o a l seam. On t h e o the r hand ca lc ium i n t h e Morwell open c u t has t h e h i g h e s t concen t ra t i on near the middle o f t h e p r o f i l e .
The l a c k o f c o r r e l a t i o n between these i n o r g a n i c species and l i t h o t y p e i n d i c a t e s t h a t t h e i no rgan ics a r e probably pos t -depos i t i ona l i n o r i g i n . This i s cons i s ten t wi th t h e i r d i f f u s i o n through t h e water o f t h e c o a l g i v i n g r i s e t o concen t ra t i on gradients .
i
4. V A R I A T I O N IN CHEMICAL PROPERTIES BETWEEN COALFIELDS
In a d d i t i o n t o t h e v a r i a t i o n o f chemical p r o p e r t i e s wi th in c o a l seams, s i g n i f i c a n t v a r i a t i o n a l s o occurs between d i f f e r e n t c o a l f i e l d s i n V i c t o r i a . A n ex tens i ve re- search programme i n which t h i s v a r i a t i o n was i n v e s t i g a t e d has been conducted by t h e S ta te E l e c t r i c i t y Commission o f V i c t o r i a on b e h a l f o f t h e V i c t o r i a n Brown Coal Counci l .
I n t h i s Brown Coal E v a l u a t i o n Programme a sampling phi losophy was adopted t h a t would h i g h l i g h t t h e n a t u r a l v a r i a b i l i t y o f t h e c o a l and i n d i c a t e t h e range o f coal q u a l i t i e s which may be encountered d u r i n g m in ing and u t i l i z a t i o n o f t he deposi ts .
;he programme commenced i n t h e Lat robe Va l l ey c o a l f i e l d s by sampling open-cut faces and 220 mm diameter bore cores and was l a t e r extended t o i n c l u d e major c o a l depo- s i t s i n V i c t o r i a . L i t h o t y p e l o g s were prepared u s i n g q u a r t e r co re sec t i ons l a i d ou t t o d ry , and s e l e c t e d l i t h o t y p e samples from each co re were analysed f o r a v a r i e t y o f chemical, p h y s i c a l and pe t rog raph ic c h a r a c t e r i s t i c s and u t i l i z a t i o n parameters; 144 parameters i n a l l . To date, a t o t a l o f 219 c o a l samples have been analysed from t h r e e open c u t faces and twenty 220 mm diameter bore cores, rep resen t ing 11 c o a l f i e l d s throughout V i c t o r i a . Coal samples from a f u r t h e r s i x bores a r e p r e s e n t l y be ing character ized.
The da ta generated from these analyses and t e s t s was evaluated by s t a t i s t i c a l methods and c o r r e l a t i o n c o e f f i c i e n t s have been determined between a l l p a i r s o f va r iab les . Ana lys i s o f t h i s da ta has revealed s i g n i f i c a n t d i f f e r e n c e s i n t h e che- m ica l p r o p e r t i e s o f t h e coa l from d i f f e r e n t f i e l d s and enables t h e s e l e c t i o n o f c o a l w i t h s p e c i f i c p r o p e r t i e s f o r p a r t i c u l a r a p p l i c a t i o n s . Table 4 i l l u s t r a t e s
5
some of these d i f f e r e n c e s by showing t h e range of values determined f o r se lec ted c o a l p r o p e r t i e s f rom 219 samples (11 c o a l f i e l d s ) . T y p i c a l va lues from the two open c u t mines c u r r e n t l y o p e r a t i n g i n t h e Latrobe Va l ley are shown f o r comparison. These d i f f e r e n c e s i n chemical p r o p e r t i e s between t h e d i f f e r e n t c o a l f i e l d s are g e n e r a l l y more s i g n i f i c a n t than l a t e r a l v a r i a t i o n s w i t h i n a p a r t i c u l a r f i e l d ( i e : between d i f f e r e n t bores w i t h i n a f i e l d ) and they are p r i m a r i l y r e l a t e d t o rank.
5. EFFECT OF CHEMICAL PROPERTIES ON UTILIZATION
As a r e s u l t o f t h e Brown Coal E v a l u a t i o n Programme, t h e understanding o f the v a r i a b i l i t y o f V i c t o r i a n brown coa ls and i t s i m p l i c a t i o n s f o r u t i l i z a t i o n have improved s u b s t a n t i a l l y . I t has become apparent t h a t c e r t a i n chemical p r o p e r t i e s can have important consequences f o r u t i l i z a t i o n o f t h e c o a l f o r power generat ion, l i q u e f a c t i o n and o ther a p p l i c a t i o n s .
A number o f examples w i l l be b r i e f l y descr ibed - Carbonate Format ion Dur ing Hydrogenation
The fo rmat ion of carbonate m i n e r a l s d u r i n g hydrogenat ion o f low rank c o a l s can cause ser ious o p e r a t i o n a l d i f f i c u l t i e s i n t h e r e a c t o r systems. A good c o r r e l a t i o n has been found between t h e ca lc ium conten t o f a number o f V i c t o r i a n brown c o a l s and t h e carbonate formed d u r i n g hydrogenat ion. However, the r e s u l t s i n d i c a t e d t h a t c a t i o n s o ther than calc ium were i n v o l v e d i n t h e format ion o f carbonate.
XRD a n a l y s i s has revea led t h e presence o f severa l d i f f e r e n t types o f carbonate m i n e r a l s i n res idues from a number o f coa ls . M inera ls i d e n t i f i e d i n c l u d e d v a t e r i t e and c a l c i t e (two polymorphs o f CaCO,) do lomi te (CaMg[CO,],) and i n t h e res idue f rom a h i g h sulphur (2 .26% db) c o a l anhydr i te , The types o f m i n e r a l depos i ts formed depend no t o n l y on the c o a l bu t a l s o on the r e a c t i o n c o n d i t i o n s . Our data i n d i c a t e s t h a t w h i l s t v a t e r i t e forms a t low temperatures (380OC) as the temperature inc reases t h e v a t e r i t e becomes p r o g r e s s i v e l y converted t o c a l c i t e , t h e more s t a b l e form. A f t e r f u r t h e r inc reases i n temperature, p a r t i c u l a r l y a t l o n g r e a c t i o n t imes, do lomi te begins t o form.
(CaS04) was i d e n t i f i e d .
The r e a c t i o n t o form anhydr i te , i n t h e case of the h i g h sulphur coal , must compete f o r calc ium with t h e fo rmat ion o f ca lc ium carbonate, and t h i s may have a b e n e f i c i a l e f f e c t .
C l e a r l y the types o f i n o r g a n i c p r e c i p i t a t e s which form d u r i n g hydrogenat ion o f V i c t o r i a n brown c o a l a r e dependent on t h e n a t u r e o f t h e exchangeable c a t i o n s and t o some ex ten t the a v a i l a b l e c o a l su lphur .
Sodium and B o i l e r F o u l i n q
The concent ra t ion o f sodium i n c o a l i s regarded as t h e most s i g n i f i c a n t f a c t o r i n t h e fo rmat ion o f troublesome ash d e p o s i t s d u r i n g combustion. Although V i c t o r i a n brown coa ls are g e n e r a l l y low i n ash forming c o n s t i t u e n t s , coa ls w i t h a h i g h pro- p o r t i o n of sodium can form ashes which c o n t a i n o f l a r g e amounts o f low m e l t i n g p o i n t , sodium su lphate compounds. These a r e formed d u r i n g combustion from the i n o r g a n i c sodium and organ ic su lphur i n the coa l .
The sodium su lphate condenses on the sur face o f b o i l e r tubes and together w i t h f l y - ash p a r t i c l e s forms s t i c k y depos i ts , which can conso l ida te on heat ing and l e a d t o ext remely dense hard-to-remove depos i ts . The presence of h i g h sodium su lphate conten t ash thus r e q u i r e s s p e c i a l c o n s i d e r a t i o n d u r i n g the design and o p e r a t i o n o f b o i l e r s .
6
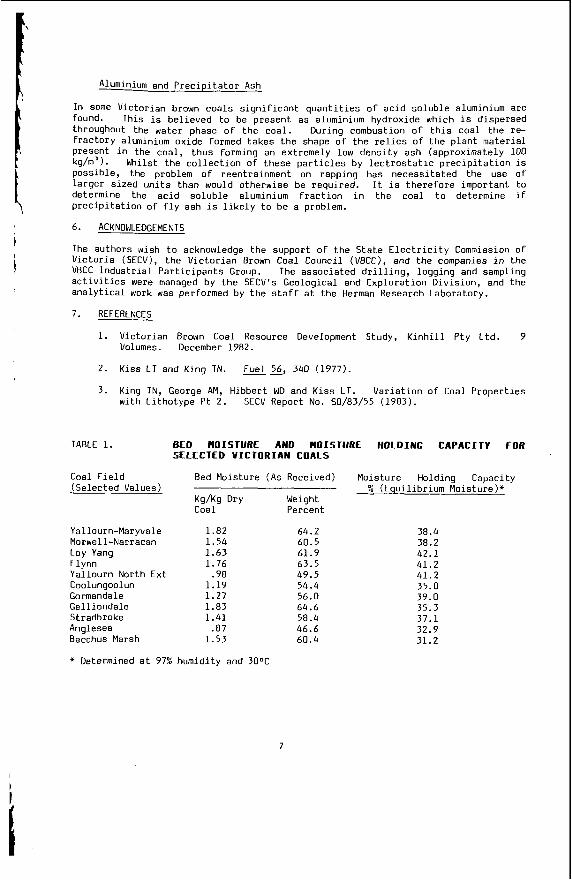
I n Some V i c t o r i a n brown c o a l s s i g n i f i c a n t q u a n t i t i e s o f a c i d s o l u b l e aluminium a re found. This i s b e l i e v e d t o be present as aluminium hydrox ide which i s d ispersed throughout the water phase o f t h e coa l . Dur ing combustion o f t h i s c o a l t h e re- f r a c t o r y aluminium ox ide formed takes t h e shape o f t h e r e l i c s of t h e p l a n t m a t e r i a l Present i n the coa l , t hus forming an ext remely low d e n s i t y ash (approx imate ly 100 kg/m'). Wh i l s t t h e c o l l e c t i o n o f these p a r t i c l e s by l e c t r o s t a t i c p r e c i p i t a t i o n i s poss ib le , the problem o f reentra inment on rapp ing has necess i ta ted the use of l a r g e r s i zed units than would o the rw ise be requ i red . I t i s the re fo re impor tan t t o determine the a c i d s o l u b l e aluminium f r a c t i o n i n t h e c o a l t o determine if P r e c i p i t a t i o n o f f l y ash i s l i k e l y t o be a problem.
6. ACKNOWLEDGEMENTS
The authors wish t o acknowledge t h e suppor t o f t h e S t a t e E l e c t r i c i t y Commission of V i c t o r i a (SECV), t h e V i c t o r i a n Brown Coal Counc i l (VBCC), and t h e companies i n t h e VBCC I n d u s t r i a l P a r t i c i p a n t s Group. The associated d r i l l i n g , l o g g i n g and sampling a c t i v i t i e s were managed by t h e SECV's Geologica l and E x p l o r a t i o n D i v i s i o n , and t h e a n a l y t i c a l work was performed by t h e s t a f f a t t h e Herman Research Laboratory .
I
7. REFERENCES
,
1. V i c t o r i a n Brown Coal Resource Development Study, K i n h i l l P ty L t d . 9 Volumes. December 1982.
2. K i s s L T and K i n g TN. Fuel 56, 340 (1977).
3. K ing TN, George AM, H ibbe r t WD and K i s s LT. V a r i a t i o n o f Coal P r o p e r t i e s w i t h L i t h o t y p e P t 2. SECV Report No. 50/83/55 (1983).
TABLE 1. BED WOISTURE AND MOISTURE HOLDING CAPACITY FOR SELECTED VICTORIAN COALS
Coal F i e l d Bed Mo is tu re (As Received) Mo is tu re Ho ld ing Capacity (Selected Values) X ( E q u i l i b r i u m Mo is tu re ) "
Kg/Kg Dry Weiaht Coal
Yal lourn-Maryvale 1.82 Morwell-Narracan 1.54 Loy Yang 1.63 F l ynn 1.76 Ya l l ou rn Nor th E x t .98 Coolungoolun 1.19 Gormandale 1.27 Ge l l i onda le 1.83 Stradbroke 1.41
Bacchus Marsh 1.53
* Determined a t 97% h u m i d i t y and O°C
Anglesea .87
Percent
64.2 60.5 61.9 63.5 49.5 54.4 56.0 64.6 58.4 46.6 60.4
38.4 38.2 42.1 41.2 41.2 35.0 39.0 35.3 37.1 32.9 31.2
7
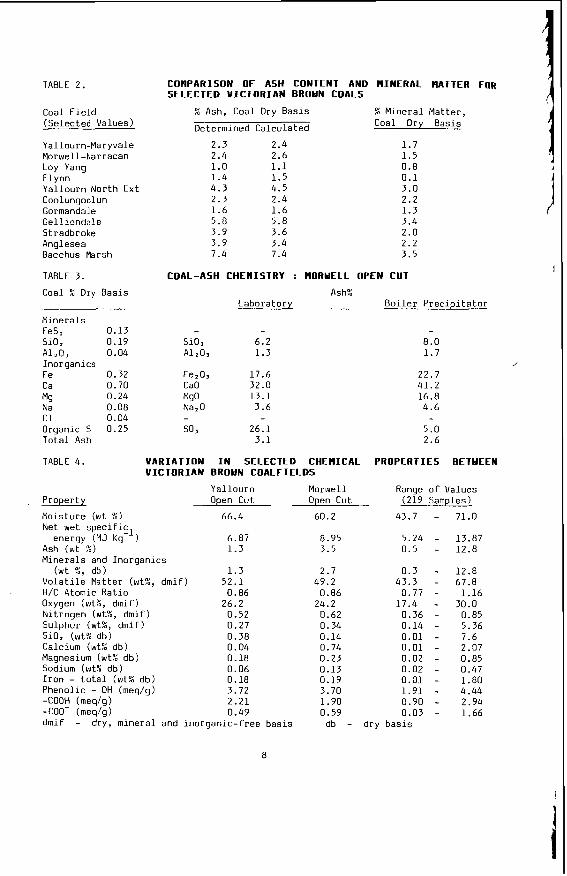
TABLE 2.
Coal F i e l d (Selected Values)
Yallourn-Mar yvale Morwell-Narracan Loy Yang F l y n n Y a l l o u r n Nor th E x t Coolungoolun Gormandale Ge l l i onda le Stradbroke Anglesea Bacchus Marsh
TABLE 3.
Coal 5 Dry Bas is
M ine ra l s FeS, 0.13 S i O , 0.19 A1203 0.04 Inorganics Fe 0.32 Ca 0.70 M9 0.24 Na 0.08 c1 0.04 Organic S 0.25 T o t a l Ash
CoflPARISON O F ASH CONTENT AN0 MINERAL HATTER Fog SELECTED V ICTORIAN BROYN COALS
% Ash, Coal Dry Bas is E M i n e r a l Ma t te r ,
Determined Ca lcu la ted Coal Dry Basis
2.3 2.4 1.0 1.4 4.3 2.3 1.6 5.0 3.9 3.9 7.4
2.4 2.6 1.1 1.5 4.5 2.4 1.6 5.8 3.6 3.4 7.4
1.7 1.5 0.8 0.1 3.0 2.2 1.3 3.4 2.0 2.2 3.5
COAL-ASH CHEPIISTRY : MORWELL OPEN CUT
Ash% Laboratory - B o i l e r P r e c i p i t a t o r
- S i02 6.2 A1203 1.3
Fe203 17.6 CaO 32.0 MgO 13.1 Na,O 3.6
8.0 1.7
22.7 41.2 16.8 4.6
5.0 2.6
TABLE 4. VARIATION I N SELECTED CHEMICAL PROPERTIES BETYEEN V ICTORIAN BROWN COALFIELDS
Y a l l o u r n Morwel l Range o f Values P roper t y Open Cut Open Cut (219 Samples)
Mo is tu re (wt %) 66.4 Net wet spec i f i c l
Ash ( w t %) 1.3 M ine ra l s and Ino rgan ics
( w t I, db) 1.3 V o l a t i l e Mat ter ( w t X , d m i f ) 52.1 H/C Atomic R a t i o 0.86 Oxygen ( w t X , drnif) 26.2 N i t r o g e n (wtX, dmi f ) 0.52 Sulphur ( w t % , dm i f ) 0.27 SiO, (w t% db) 0.38 Calcium ( w t X db) 0.04 Magnesium (wt% db) 0.18 Sodium ( w t A db) 0.06 I r o n - t o t a l (wtX db) 0.18 Phenol ic - OH (rneq/g) 3.72 -COOH (rneq/g) 2.21 -COO- (meq/g) 0.49 drnif - dry, m i n e r a l and i n o r g a n i c - f r e e bas i s
energy ( M J Kg- ) 6.87
60.2
8.95 3.5
2.7 49.2
0.86 24.2
0.62 0.34 0.14 0.74 0.23 0.13 0.19 3.70 1.90 0.59
db
43.7 - 5.24 - 0.5 -
0.3 - 43.3 -
0.77 - 17.4 -
0.36 - 0.14 - 0.01 - 0.01 - 0.02 - 0.02 - 0.01 - 1.91 - 0.90 - 0.03 -
d r y bas i s
71.0
13.87 12.8
12.8 67.8
30.0 1.16
0.85 5.36 7.6 2.07 0.85 0.47 1.80 4.46 2.94 1.66
8
Volotile Molter I % d b.1
L : o r b o n 4 1 Specific Gross Energy Dry 4 % d b ) IMJ/kg)
F ig . 1. V a r i a t i o n i n se lected coal propert ies w i t h depth i n the Morwell Open Cut.
9
I

. I I I
4.1 4-5 5.0 5.5 6.0 6.3 HYDROGEN ./o (d.m.i.f.1 -
6 1 I I
64 66 68 70 7 2 CARBON 74 (drni.fJ
* 1 1 I
0 0.1 0.2 0 -3 0 4 0.5
SODIUM ----- Yo d b
F i g . 2 . V a r i a t i o n of Hydrogen, CALCIUM ----- MAGNESIUM --- ---- IRON (NON PYRITIC) -e--
Carbon & Inorganic Constituents w i t h Depth & Colour Index
10
Correlations between petrographical properties, chemical structure and technological behaviour
of Rhenish brown coal
E. A. Wolfrum
Rheinische Braunkohlenwerke AG Stuttgenweg 2 5000 Koln 41
Federal i3euiibli.c o f Oerrnany
1. Introduction
The Brown coal reserves in the Federal Republic of Germany amount to approx. 56 billion metric tons, 55 billion metric tons of which are in the Rhenish brown coal district located west of Cologne (Fig. 1). About 35 billion metric tons of that reserve are considered to be technologically and economically mineable today what, in terms of energetics, equals the overall oil reserves of Iran (1).
Rhenish brown coal is mined in five opencast mines (Fig. 2) with an average depth of about 280 m. Modern mining equipment having a daily capacity of some 240,000 m3 of brown coal and high-speed belt conveyor systems are used. About 119 million metric tons of brown coal were mined in 1981.
84.5 6 of that output was used for power generation, 7.9 6 for briquette production in 4 briquetting plants of the Rheinische Braunkohlenwerke and b.2 6 for powdered brown coal production in two grinding m i l l s . A low portion, viz. 0.3 % was used in a Salem-Lurgi rotary hearth furnace to produce about 9 6 , 0 0 0 metric tons of fine coke in 1981. 2.7 % of the brown coal o u t p u t was used for other purposes, inter alia in test plants for processes, like gasification and hydrogenation (Fig. 3 ) .
Longt-term mining plans ensure that this source of energy will be available in sufficient quantities well beyond the turn of the millennium. 11
2.
T h i s c a l l s f o r opening up t h e deep-seated seam h o r i z o n s a s i t i s be ing done f o r t h e f i r s t t ime w i t h d e p t h s of 240 t o 450 m a t t h e Hambach mine which i s now developed. Today ' s technology a l l o w s opencas t mines w i t h a maximum d e p t h of 600 m t o be o p e r a t e d .
Mining i n g r e a t e r d e p t h s l e a d s t o a change of t h e g e o t e c t o n i c c o n d i t i o n s and hence a n a t u r a l change i n t h e brown c o a l q u a l i t y c h a r a c t e r i s t i c s .
T h i s has vary ing and g r a d u a t e d e f f e c t s on t h e i n d i v i d u a l r e f i n i n g p r o c e s s e s ( 2 ) .
The p e t r o g r a p h i c a l and chemica l i n v e s t i g a t i o n s p r e s e n t e d i n t h e f o l l o w i n g were c a r r i e d out i n o r d e r t o d e s c r i b e t h e behaviour of t h e c o a l t y p e s c h a r a c t e r i s t i c s of t h e Rhenish brown c o a l a r e a d u r i n g r e f i n i n g p r o c e s s e s .
As a n i n t r o d u c t i o n , a s h o r t survey of t h e g e o l o g i c a l c o n d i t i o n s of t h e Rhenish brown c o a l d e p o s i t i s g iven .
G e o l o g i c a l c o n d i t i o n s i n t h e Rhenish brown c o a l d i s t r i c t
I n g e o l o g i c a l te rms , t h e d e p o s i t i s p a r t of t h e Lower Rhine B a s i n e x t e n d i n g over about 2 ,500 km2 which was formed by a subs idence i n t h e E a r l y T e r t i a r y . Brown c o a l i t s e l f was formed about 15 t o 20 m i l l i o n y e a r s ago i n t h e Miocene; d u r i n g m i l l i o n s of y e a r s i t was r e p e a t e d l y f l o o d e d w i t h sea o r r i v e r w a t e r and covered w i t h sands , c l a y s and g r a v e l s .
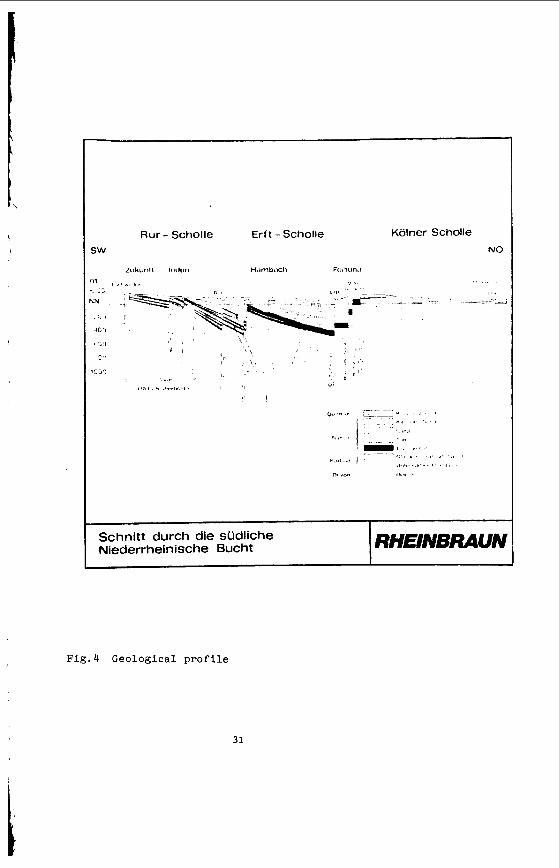
The g e o l o g i c a l p r o f i l e from NE t o SW a c r o s s t h e s o u t h e r n p a r t of t h e Lower Rhine Bas in (Fig. 4 ) shows t h a t t h e brown c o a l seams sank down t o e v e r growing depths towards t h e southwest and t h e n r o s e a g a i n from t h e i r d e e p e s t
p o i n t below t h e E r f t r i v e r towards t h e west. T e c t o n i c e v e n t s caused f a u l t s and f r a c t u r e s of s e v e r a l hundred meters .
12
3 .
Accounttng t h e s e g e o l o g i c a l c o n d t t i o n s , t h e opencas t mines - f o l l o w i n g t h e seam - have t o o p e r a t e i n ever growing d e p t h s .
Therefore s e l e c t i v e mining f o r r e f i n i n g purposes is g e t t i n g more and more expens ive .
S t r u c t u r e and composi t ion of Rhenish brown c o a l
Rhenish brown c o a l c o n s i s t s of a v a r i e t y of l i t h o t y p e s which a r e d i s c e r n i b l e i n t h e c o a l seam a l r e a d y b y b r i g h t n e s s v a r a t i o n s ( F i g . 5 ) . Recent p o l l e n a n a l y t i c a l i n v e s t i g a t i o n s proved t h a t t h e b r i g h t and d a r k l a y e r s r e s u l t mainly from changing convers ion and decomposi t ion c o n d i t i o n s . The bog f a c i e s h a s only a l i m i t e d i n f l u e n c e .
The g r a d a t i o n from dark t o b r i g h t layers r e f l e c t s t h e degree of brown c o a l d e s t r u c t i o n ( 3 . 4 ) .
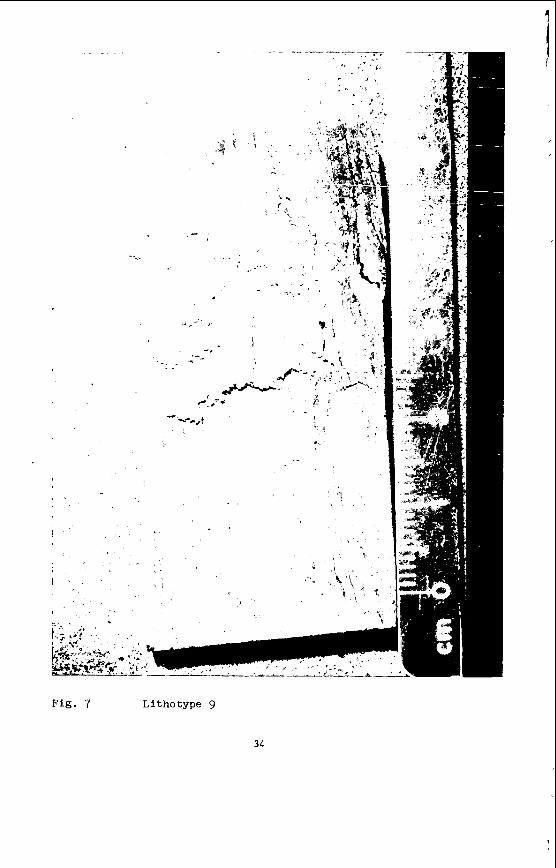
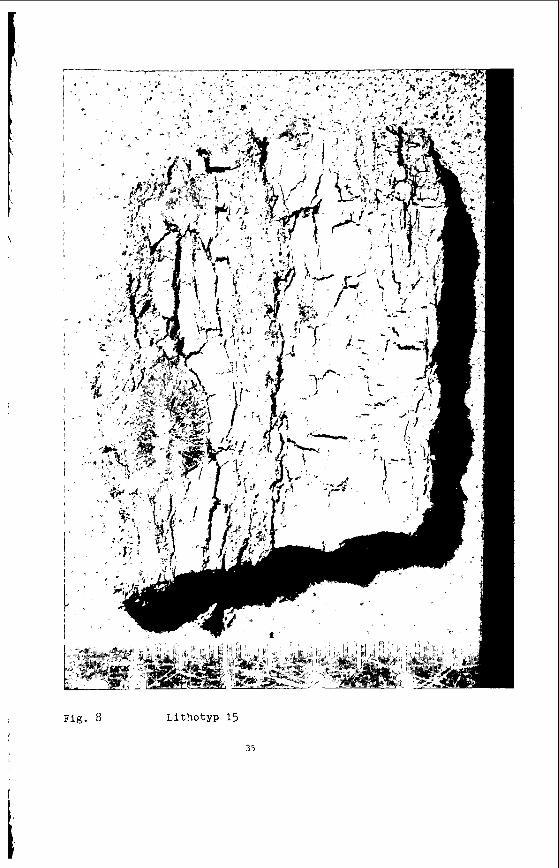
F i g u r e s 6 t o 8 show t h r e e d i f f e r e n t t y p e s of c o a l , v i z . a b r i g h t u n s t r a t i f i e d c o a l , a medium-dark s t r a t i f i e d c o a l and a dark h e a v i l y s t r a t i f i e d c o a l . The h igh degree of decomposi t ion of t he l i t h o t y p e r e p r e s e n t e d i n F i g u r e 6 i n d i c a t e s a n a e r o b i c format ion whi le t h e h i g h - t e x t u r e f i b r o u s c o a l ( F i g . 8) i s an I n d i c a t o r of a n a n a e r o b i c format lon .
The d i s c o v e r e d t e x t u r e s a r e above a l l gymnosperms r e p r e s e n t e d by h i g h l y r e s i s t e n t c o n i f e r o u s woods which account f o r a q u a n t i t y o v e r p r o p o r t i o n a t e t o t h e i r s h a r e of t h e mainly anigospermous v e g e t a t i o n which formed brown c o a l .
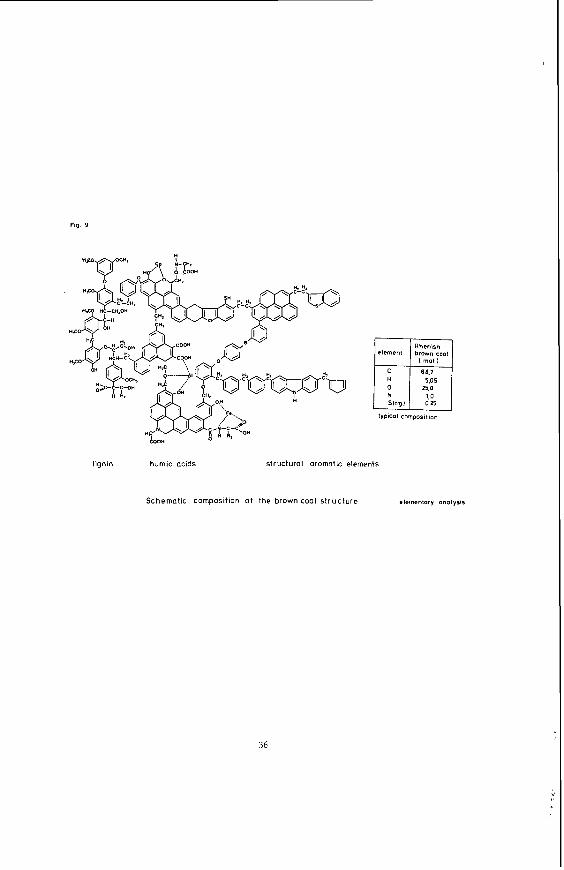
Only a model can e s t a b l i s h t h e complex, heterogeneous s t r u c t u r e of brown c o a l .
F i g u r e 9 shows a model t h a t i n t e r connec ts t h e v a r i o u s s t r u c t u r a l components, namely l i g n i n , humic a c i d and
13
aromatlc structural elements. High content of functional groups causes high reactivity. Figure 10 shows how oxygen-containing functional groups are distributed in the Rhenish brown coal.
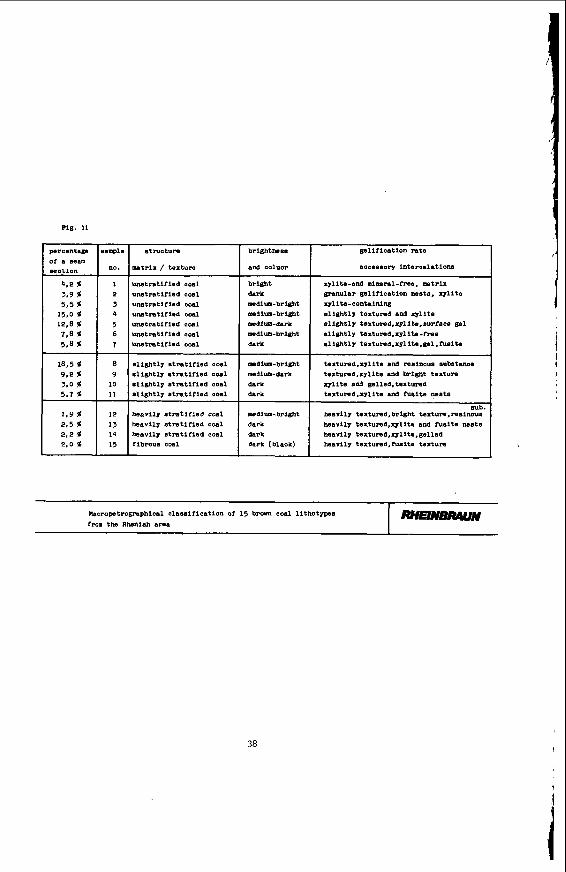
3.1- Macropetrographical characterization
Based on macropetrographical criterias 15 brown coal lithotypes were selected f o r the investigations described in the following; they represent more than 90 % of the main seam.
Figure 11 shows these 15 brown coal lithotypes arranged according to stratification an t e x t u r e .
The coal can be subdiveded into 3 groups depending on the mode of stratification: unstratified, slightly stratified and heavily stratified.
The brightness tends to abate from unstratified to heavily stratifled coals.
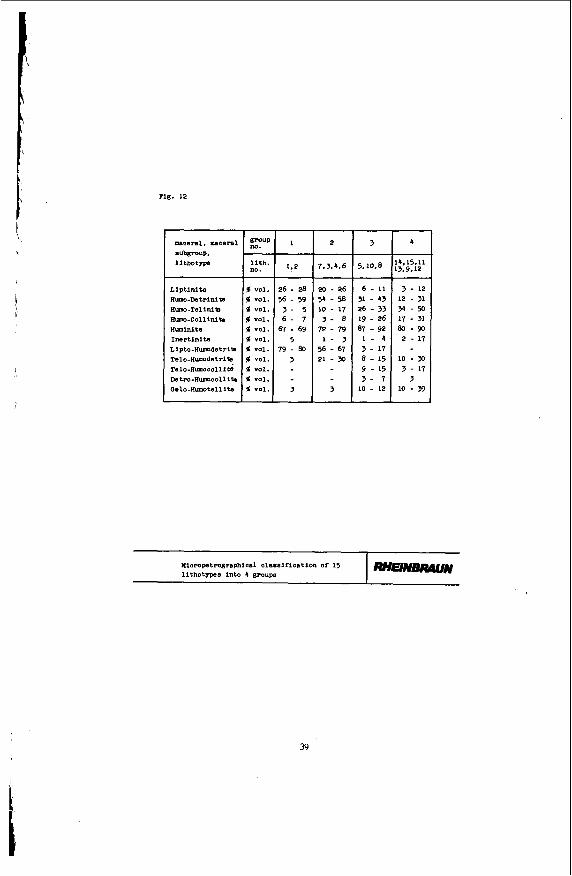
3.2 Micropetrographical characterization
Micropetrography evaluates the coal components ascer- tainable by microscopy. Figure 12 shows an extract of the results obtained f rom the combination analysis of the 15 brown coal lithotypes.*
Obviously the investigated brown coal lithotypes differ in micropetrographic respect.
*We thank H.W. Hagemann, PhD., member of the faculty of geology, geochemistry and oil and coal deposits of the Aachen technical university f o r having carried out the Investigations.
14
I(
3.3
Based on the qualitative assignment of the individual coal components, rhenish brown coal can be divided into four groups having similar petrographical properties which, correspond with the macropetrographical features (principle of classification: stratification and texture). This classification into 4 groups differs only negligibly from the macropetrographical division into three main groups.
The classificatlon into four main groups results In the correlations shown in the following Figures. Figure 13 shows the liptinite content as a function of the group classifications 1 to 4. With rising group number, corresponding to stronger stratification and texture, the liptinite content declines. Figure 14 which shows the huminite as a function of the group numbers indicates that the huminite content rises with increasing strati- fication and texture.
These two correlations stand for a variety of functions of technological relevance between brown coal maceral groups.
Chemical and physical composition
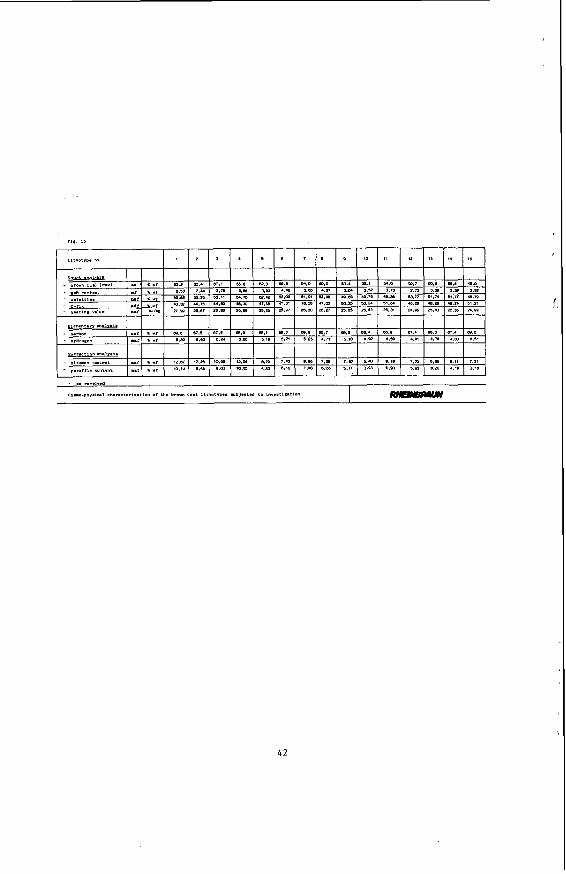
Subsequent to the petrographical coal analysis, both a chemical and a cherno-physical investigation were carried out. Figure 15 shows the chemical and physical properties of the investigated brown coal lithotypes.
Rhenish brown coal has an average ash content of about 4 % (wf), a volatile matter of about 52 % (Waf) and a lower heating value of 11.000 Btu/lb of coal (Waf). The final analysis of the coal under Waf conditions shows the following average composition:
15
i
4 .
69 % carbon, 5 % hydrogen, 1 % n J t r o g e n and approx. 25 % oxygen; t h e s u l p h u r c o n t e n t amounts t o about 0.35 % (Waf) about 50 t o 70 % of which i s bound t o t h e ash d u r i n g t h e combustion p r o c e s s s i n c e approx . ha l f of t h e m i n e r a l components of Rhenish brown c o a l c o n s i s t of b a s i c a l k a l i and a l k a l i n e e a r t h compounds - p r i m a r i l y those of calcium.
The f o l l o w i n g i n v e s t i g a t i o n s were aimed a t r e v e a l i n g c o r r e l a t i o n s between t h e chemical and chemo-physical c o a l da ta and t h e p e t r o g r a p h i c a l a n a l y s i s t h a t may h e l p assess t h e c o a l q u a l i t y p r i o r t o i t s use as a f e e d s t o c k i n v a r i o u s r e f i n i n g p r o c e s s e s .
C o r r e l a t i o n s between p e t r o a r a p h i c a l s t r u c t u r e , chemical composi t ion and r e f i n i n g behaviour of Rhenish brown c o a l
The c o r r e l a t i o n s between t h e chemical brown c o a l d a t a , p e t r o g r a p h i c a l p a r a m e t e r s and the r e f i n i n g behaviour a r e d e s c r i b e d i n t h e f o l l o w i n g complex r e g r e s s i o n ca lcu- l a t i o n s t h e r e f o r e were c a r r i e d o u t . S t a t i s t i c c a l c u l a t i o n
methods were a p p l i e d as an o b j e c t i v e c r i t e r i o n t o prove such c o r r e l a t i o n s .
To n e a r l y a l l brown c o a l r e f i n i n g p r o c e s s e s i s a p p l i c a b l e t h a t
- t h e q u a l i t y o f t h e d e s i r e d re f inement products - t h e r e f i n i n g c o s t - t h e q u a l i t y of t h e raw m a t e r i a l
have a d i r e c t c o r r e l a t i o n . Hence, it is i n d i s p e n s i b l e f o r any r e f i n i n g o p e r a t i o n t o know and assess t h e composi t ion of t h e raw m a t e r i a l and i t s behaviour dur ing the r e f i n i n g p r o c e s s .
The u s a b i l i t y of t h e r e s u l t s o b t a i n e d from t h e raw m a t e r i a l c h a r a c t e r i z a t i o n i n everyday p r a c t i c e depends on
' I ~
16
- the spacing of drillings usuable for quality assessment - the level of geological knowledge of the coal forming
- a representative sampling in the opencast mine, taking into account the cutting geometry of the excavator (position of the excavator cuts to the deposit), the fast mining advance and the high mass flow involved.
conditions
4.1 Correlations between chemical and petrographical para- meters
4.1.1 Heating value
Figure 16 shows that the heating value declines with increasing coal stratification. A comparison of the heating value of coal and its hydrogen content in Figure 17 indicates that according to expectation the heating value of the coal rises parallel to an increase in its hydrogen content. This again is due to the portion of hydrogen-rich minerals, such as liptinite, declining in the said order - a correlation clearly evident in Figure 18. The heating value of the coal obviously rises in proportion to its liptinite share. The oxygen-rich lignitic Coal components, such as huminite, have the opposite effect on the heating value: Figure 19 shows that the heating value of the coal is down sharply with an increase in the portion of this maceral group.
4.1.2 Volatile content
The individual coal constituents contribute different shares to the volatile matter of the coals ( 5 ) . With increased stratification, the volatile matter decreases, caused by the respective distribution of the various maceral groups. Figure 20 gives an example how the content of volatile matters and that of the hydrogen-rich liptinite maceral correlate. It i s obvious that this constituent contributes a lot to the volatile matters.
17

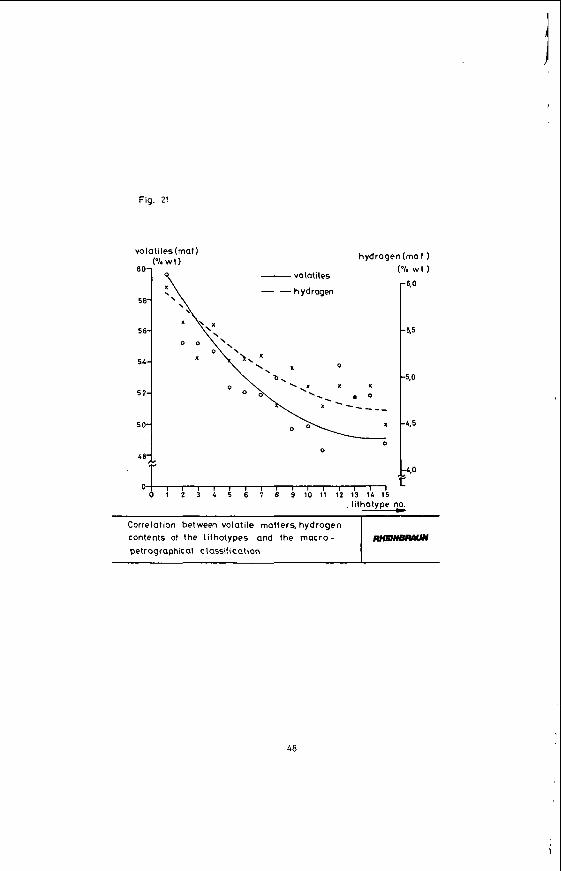
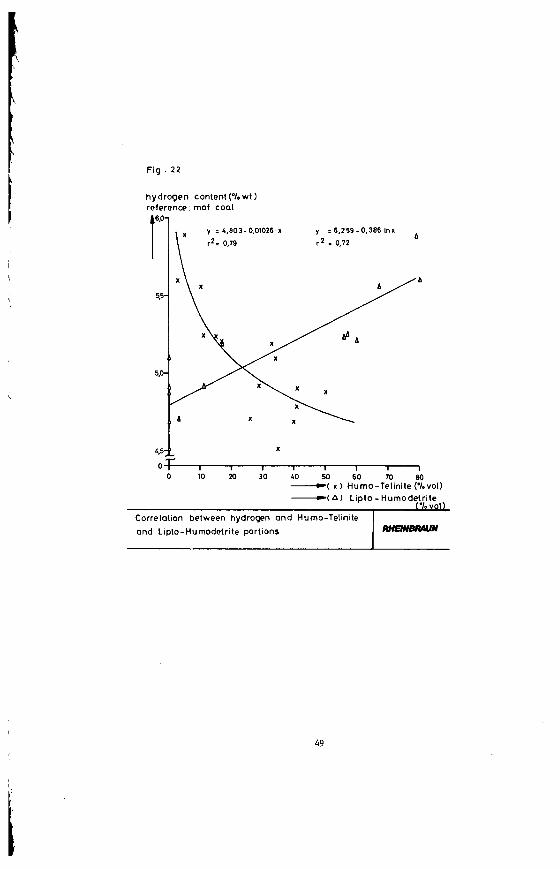
4.1.3 Hydrogen content
Figure 21 shows that also the hydrogen content is closely corresponding to the petrographical brown coal proper- ties. Figure 22 shows the correlation between the hydrogen content and the Lipto-Humodetrite and/or the Humo-Telinite content of the investigated lithotypes. A
higher amound of Lipto-Humodetrite leads to an increased hydrogen content. The content of the Humo-Telinite maceral, however, has a totally different effect: This component has a high portion of oxygen-rich molecular groups what causes the hydrogen content of the brown coal to drop.
4.2 Correlations between coal quality and refininp, behaviour
4.2.1 BriquettinR and coking,
There are many investigations and publications available on the briquetting behaviour of brown coals, both from the GDR and the Rhenish area ( 6 to 9).
In order to establish statistically usable data on the briquetting behaviour of Rhenish brown coals, the 15 brown coal lithotypes were briquetted under identical conditions with a laboratory press (water content, grain size distribution and mould pressure).
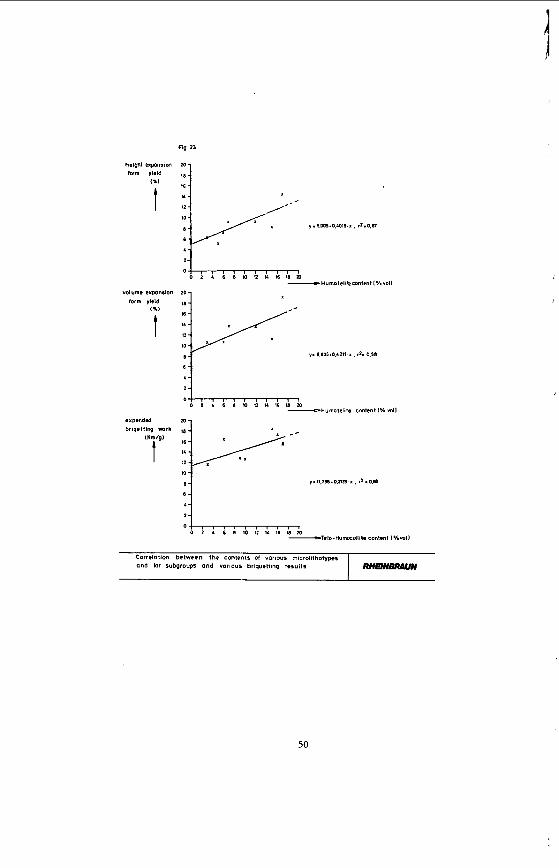
For assessing the briquettability of these coals, a number of briquetting parameters were correlated with the petrographical properties of the brown coal types. A
statistic evaluation of these briquetting parameters and the micropetrographical composition of the coals reveal only a minimal degree of interdepence. Figure 23 clearly shows that the Humo-Telinite content stands f o r the height and volume expansion of the briquettes.
18

The briquetting expenditure is related to the Telo- Humocollite content. The definition factor (r2) varies between 0.58 and 0.67; and is comparatively low. A l l the other correlations between the briquetting parameters (e.g. diametrical expansion) and the petrographical coal composition turned out to be rather insignificant so that they need not to be taken into consideration.
These investigations on correlations established between the raw material properties and briquettability of Rhenish brown coal fed to the following results:
1. A macro- and micropetrographical analysis with a view to technological problems involved in the briquetting process allows at the most to Judge the briquettabi- lity of Rhenish brown coal on the basis of trend data.
2. A correlation analysis of the chemo-physical para- meters of Rhenish brown coal and its briquettability gives only trend data as well.
Therefore generaly an anticipated quality assessment of the briquettes is restricted to the following points:
1. Macropetrographical assessment of the coal seam and evaluation of the briquettability on the basis of values gained by experience.
2. Laboratory production of briquettes and determination of their pressure resistance.
3. Determination of the ash content as an essential factor f o r the assessment of brown coal briquettabi- lity. Ash contents exceeding 3 to 4 I result both in a reduction of the resistance to pressure and a high wear of the molds of the briquetting presses, and are not suited to be processed into briquettes. Gelled coals, unsuitable for briquetting purpose as well, are used as steam coal.
19
Coking
Numerous publications (10 to 1 2 ) have been made above all in the GDR on the required quality properties of brown coal and their influence on the quality characteristics of formed coke. Since the Rheinische Braunkohlenwerke AG
does not consider formed coke production at present, raw material quality and coking behaviour are of interest Only f o r the production of fine coke using the rotary hearth furnace principle (13, 1 4 ) (Fig. 2 4 ) .
This technology is dependent only to a low extent on the specific raw material composition. The petrographical factors of the feedstock have an impact above all on grain size and grain size distribution. It i s not the final coke strength that i s crucial f o r this process but the grain spectrum caused by grain decomposition.
Correlations so far unkown may lie in the petrographical composition of brown coal (in connection wlth the mineral composition) and the reactivity of fine coke to oxygen. Therefore, an anticipated quality assessment of feed coals corresponds to that used for briquetting coal.
4.2.2 Gasification
Two gasification processes under development, namely gasification using oxygen (HTW) and hydrogasification, ( H K V ) , helped to study the gasification behaviour of various brown coal lithotypes ( 1 5 ) .
The reactivity of the residual char i s the speed-con- trolling factor f o r brown coal hydrogasification (16). Laboratory-scale investigations on the gasification behaviour of various types of brown coal coke showed that the mode of pretreatment has a greater influence on the gasification process than the raw material properties. To give an example, helium flushing of the coke under gasification temmperature has a very favourable effect on gasification.
\
I
I_
With one exception only, gasification rates close to 100 % were achieved.
Differences in gasifaction speeds are due to the hetero- geneous pore structure and the inhomogeneous iron distribution in the coal matrix.
Irregularly localized iron groupings contained in cokes of the lithotypes 1 and 8 show a varying reactivity behaviour.
Cokes of the lithotypes 4 , 5, 9, 11, 13 and 15 with similar gasification behaviours have a comparatively homogeneous distribution of all ash components (Fig. 25). No correlation was established between the maceral composition and the reactivity behaviour of the cokes ( 1 7 ) .
As it was the case with the mentioned hydrogasification process, the results obtained with HTW gasification did not show any statistically significant correlations between the petrographical composition of the lithotypes and their gasification behaviour.
4.2.3 Liquefaction
To determine potential raw material impacts on brown coal hydroliquefaction, the 15 lithotypes were converted into liquid products using various techniques (18).
1. moderate indirect hydrogenation with tetralin as a hydrogen-transferring solvent
2. direct hydrogenation with hydrogen and different catalysts similar to operational conditions.
2 1
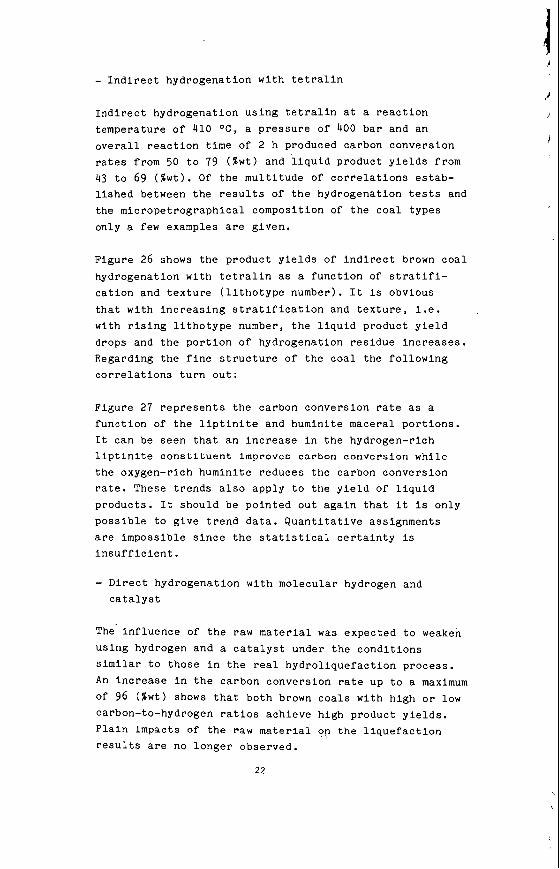
- Indirect hydrogenation with tetralin
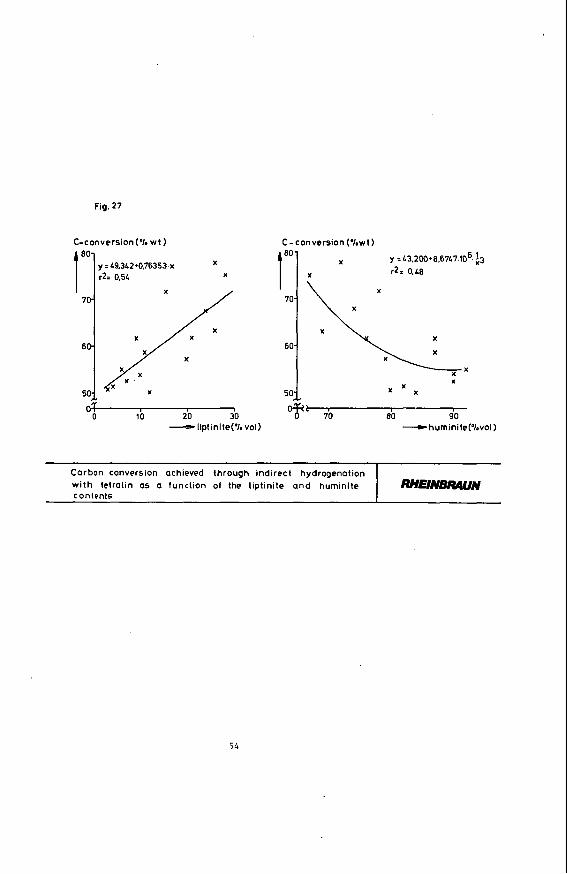
Indirect hydrogenation using tetralin at a reaction temperature of 410 OC, a pressure of 400 bar and an overall reaction time of 2 h produced carbon conversion rates from 50 to 79 (%wt) and liquid product yields from 43 to 69 (%wt). Of the multitude of correlations estab- lished between the results of the hydrogenation tests and the micropetrographical composition of the coal types only a few examples are given.
Figure 26 shows the product yields of indirect brown coal hydrogenation with tetralin as a function of stratifi- cation and texture (lithotype number). It is obvious that with increasing stratification and texture, 1.e. with rising lithotype number, the liquid product yield drops and the portion of hydrogenation residue increases. Regarding the fine structure of the coal the following correlations turn out :
Figure 27 represents the carbon conversion rate as a function of the liptinite and huminite maceral portions. It can be seen that an increase in the hydrogen-rich llptinite constituent improves carbon conversion while the oxygen-rich huminite reduces the carbon conversion rate. These trends also apply to the yield of liquid products. It should be pointed out again that it is only possible to give trend data. Quantitative assignments are impossible since the statistical certainty is insufficient.
- Direct hydrogenation with molecular hydrogen and catalyst
The. influence of the raw material was expected to weaken using hydrogen and a catalyst under the conditions similar to those in the real hydroliquefaction process. An increase in the carbon conversion rate up to a maximum of 96 (%wt) shows that both brown coals with high or low carbon-to-hydrogen ratios achieve high product yields. Plain impacts of the raw material of the liquefaction results are no longer observed.
2 2
Resuming it can be said that the hydrogenation degree from indirect to direct hydrogenation rises parallel to an increase in carbon conversion. The result is that nearly all brown coal types mineable in the Rhenish area can be converted into liquid products with high yields. Hydrogenation process engineering, 1.e. the optimization of the reaction conditions (temperature, pressure, residence time, catalyst type), is considered with priority over the raw material propertles.
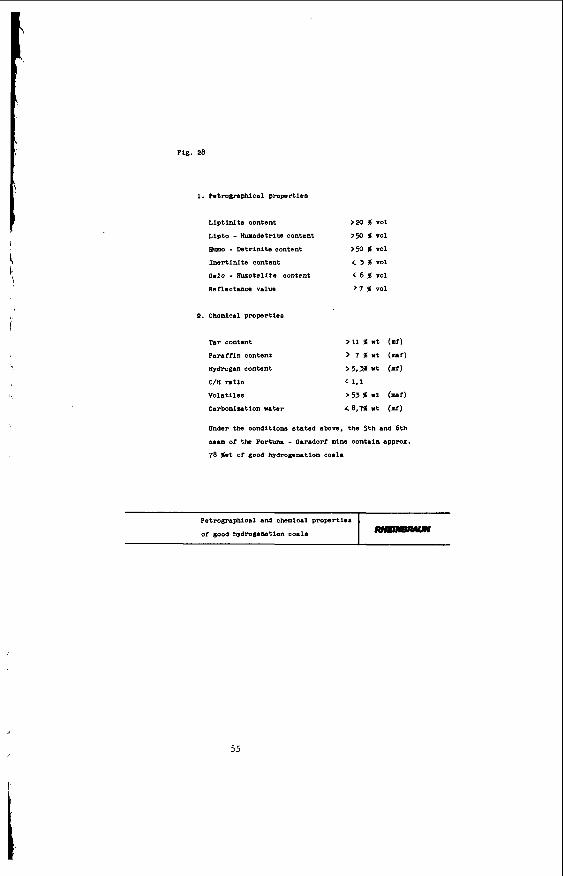
The investigations showed that in general practice no importance is attributed to a micropetrographical assessment of the coal types as a criterion for selecting specific brown coals from the Rhenish area. Tar content and/or low-temperature carbonization product yield and paraffin content suffice as parameters to assess the hydrogenatability of Rhenish brown coals. For exploratory drilling programmes, these parameters are determined separately. In general, brown coals from various areas that meet the quality parameters given in Figure 28 have satisfactory hydrogenation properties.
5. Summary
For the purpose of an assessement with a view to refi- ning, the petrographical, chemical and physical pro- perties of lithotypes of Rhenish brown coal were esta- blished and compared with one another.
The investigated coal typs cover more than 90 % of the coal types proved in the Rhenish deposit. A correlation of the results shows a describable, sometimes multidimension a1 dependancy.
A comparison of raw material properties and the results of the technical experiments quickly reveals the limits set to such an approach.
23
Out of all the refining processes subjected to investi- gation briquetting places the highest requirements on the raw material properties. The major part of the esta- blished parameters leads only to qualitative indications of the briquetting properties of the coals. Parameters of greater significance can hardly be utilized in pratice. What remains in the experience gained by coal techno- logists, is the determination of the classical coal pro- perties and indications from laboratory briquetting.
For the gasification process no usuable quantitative relations were established between the petrographical coal properties and the gasification behaviour. It is possible without any material problems to convert nearly all the rhenish coal types into gaseous hydrocarbons or synthesis gas.
This statement applies without any restriction to coal liquefaction as well. Apart from a few comparatively rare coal types, all brown coals from the Rhenish area can be converted into liquid hydrocarbons with high product
yields. Hence, hydrogenation process engineering, i.e. the optimization of the reaction conditions, has priority over the raw material properties.
Under the given conditions of the Rhenish brown coal deposit, an opencast mining operation, a high output and the large feed quantities required for future refining plants brown coal petrography is one out of many tesseraes f o r quality assessement.
The development of appropriate modes of determining the quality characteristics of raw brown coal is a task indispensable for the future.
24
I' I'
I'
I
6 ) References
1) P. Speich: "Technische und wirtschaftliche Gesichtspunkte der Braun- kohlenveredlungql Brennstoff-Warme-Kraft 2 ( 1 9 8 0 ) Nr. 8, 307-312
2) E. Wolfrum, J. Wawrzinek: "Beziehungen zwischen petrographischen und chemischen Eigenschaften Rheinischer Braunkohle" Braunkohle Heft 11/81, 381-386
3) G. von der Brelie, M. Wolf: "Zur Petrographie und Palynologie heller und dunkler Schichten im rheinischen Hauptbraunkohlenfloz" - Fortschr. Geol. Rheinld. u. Westf. (1981) 9; 95-163
4 ) H. W. Hagemann, A . Hollerbach "Relationship between the macropetrographic and organic geochemical composition of lignites" - Advances in organic Geochemistry 1979, A . G. Douglas, J. R. Maxwell (Editors) Pergamon Press Oxford, New York, Frankfurt
5 ) R. Kurtz, E. Wolfrum, W. Assmann: "Die Verkokungseigenschaften chemischer Stoffgruppen in einigen Braunkohlentypen des rheinischen Reviers" Comm. Eur. Communities, Rep EUR 1977 EUR 6075, Round Table Meet. Chem. Phys. Valorication Coal, 125-150
6 ) E. Sontag, M. Siiss: IIBeispiel petrologischer Untersuchungen zur Klarung roh- stoffabhangiger verfahrenstechnischer Probleme der Braun- kohlenveredlung" Bergbautechnik 19 ( 1 9 6 9 ) 5. 255-260:7. 376-381
25
7) R. Kurtz: "Zusammenhang zwischen mikropetrographischem Aufbau der Weichbraunkohlen und ihrer Brikettierbarkeit" Dissertation, RWTH Aachen, Fakultlt fiir Bergbau und Hiit- tenwesen (1970)
8 ) E. Rammler: "Zur Kenntnis der Brikettierbarkeit von Braunkohle" Freiberger Forschungshefte A99 (19581, 8 1 - i o 4
9 ) H. Jakob: "Neuere Ergebnisse der angewandten Braunkohlenpetrologie" Berg- und Hiittenmlnnische Monatshefte 105, Heft 2 (1960) ,
21 -29.
10) E. Rammler, G. Bilkenroth: "Zur technischen Entwicklung der Braunkohlenkokerei"+ Freiberger Forschungshefte A 184 (1961) 85 - 113
11) E. Rammler, W. Fischer, G. Hlnseroth:
der Verkokung bis 1000 oc" Freiberger Forschungshefte A453 (19681, 121-145
lISchrumpfverhalten von Braunkohlen Feinstkornbriketts bei
12) W. Mlrz: "Untersuchungen zum Verlauf der Verkokung von Braunkoh- lenbriketts, insbesondere bei der Spulgasverkokung" Freiberger Forschungshefte A375 (19661, 79-99
13) R. Kurtz: "Koksherstellung aus Braunkohle" Braunkohle Heft 11, Nov. 1975, 352-356.
14) E. Scherrer: "Herstellung von Braunkohlenkoks im Salem-Lurgi-Herdofen" Braunkohle Heft 7, Juli 1981, 242-246.
26
15) H. Teggers, K.A. Theis, L. Schrader: "Synthesegase und synthetisches Erdgas aus Braunkohlel' Erdol und Kohle-Erdgas ver. mit Brennstoff-Chemie Bd.35, Heft 4, April 1982, 178-184
16) L. Schrader, H. Teggers, K.A. Theis: "Hydrierende Vergasung von Kohlett Chem.-1ng.-Tech. 52 (1980) Nr. 10, 794-802
17) M. Ghodsi, J.P. Lempereur, E. Wolfrum: "Etude cinetique de l'hydrog6nation directe des cokes de differents lithotypes de lignite" Vortrag gehalten auf der Internationalen Kohlenwissen- schaftlichen Tagung, Dilsseldorf 07. - 09.09.81
18) E. Wolfrum, J. Wawrzinek, W. Dolkemeyer: "EinfluB der Rohstoffeigenschaften auf die Verfliissigung Rheinischer Braunkohlen" Vortrag gehalten auf der Internationalen Kohlenwissen- schaftlichen Tagung, Diisseldorf 07.-09.09.81
2 7
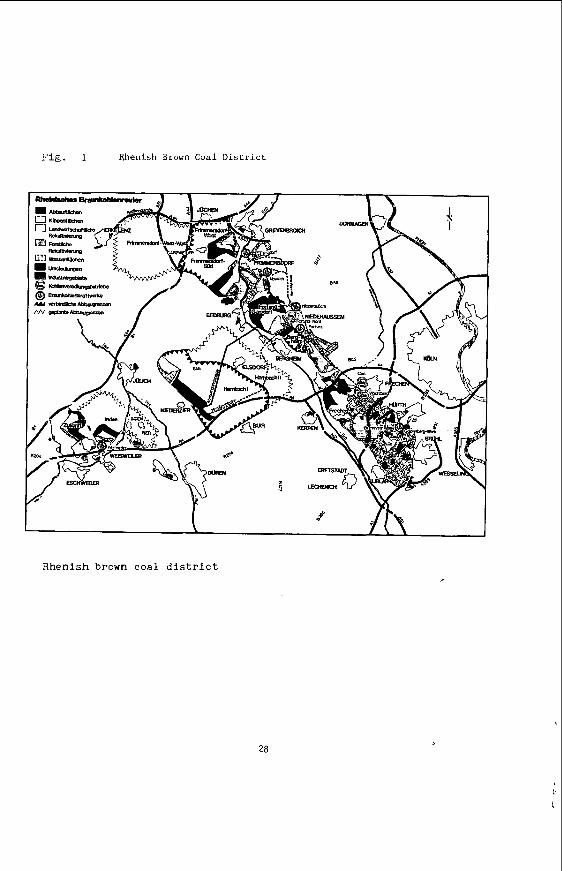
!.le. I Rhenish Brown Coal D i s t r i c t
Rhenish brown c o a l d i s t r i c t
28
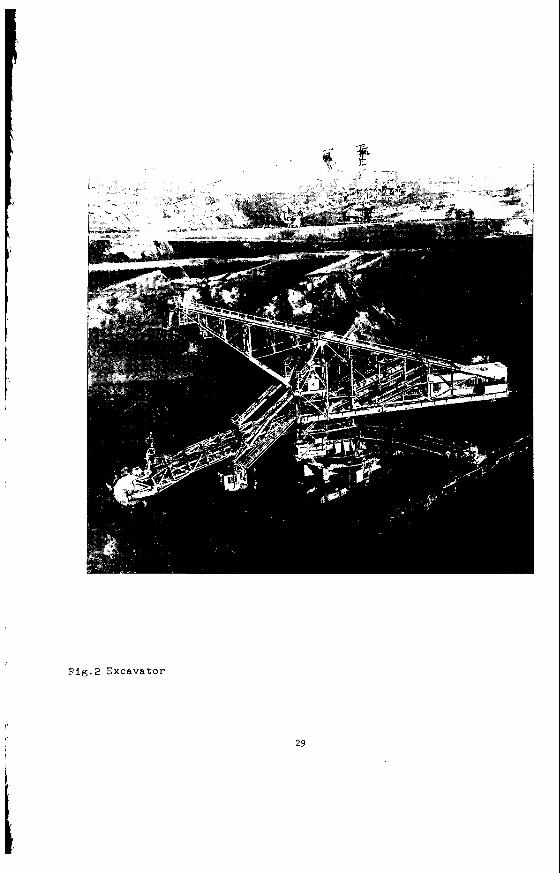
Fig.2 Excavator
29

In aJ
aJ 3 CT
CI *
.- L n
I
4 !!
a, 5 aJ
s 0 0 U
I
30
6 In 3
13 C 0
3 Q 3 0
0 0 V
C
c
c
d
3 e n 3 2
Rur - Scholle Erft - Scholle Kolner Scholle sw NO
zuk~mfl lriden n.~mmCh Fwlund
I L , " l , *h , I.
--* -4
Schnitt durch die sudliche Miederrheinische Bucht
Fig.4 Geological profile
31
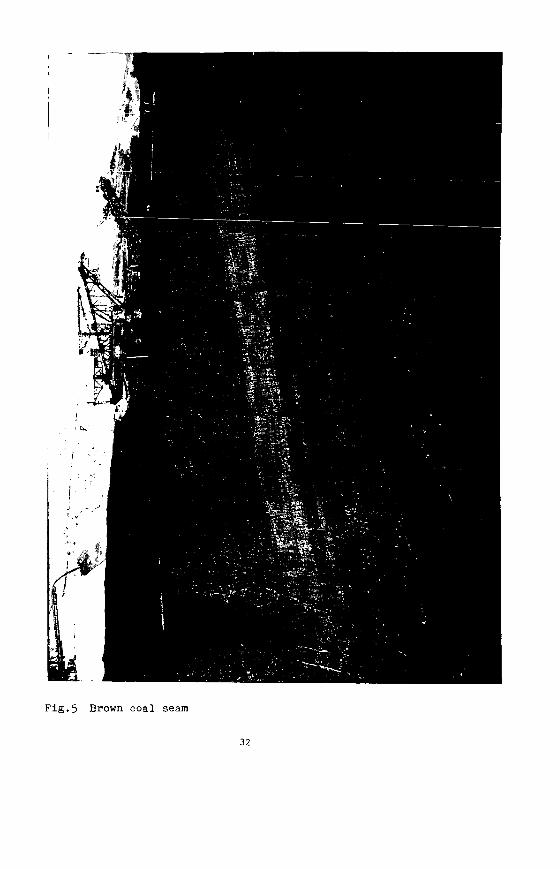
Flg.5 Brown coa l seam
32

Fig. 6 L i t h o t y p e I
33
I
i
I-
?
Fig. 7 Lithotype 9
34
\
F i g . 8 Lithotyp 15
35
l ignin humic acids structural aromatic elements
Schematic cornDosition of the brown coal s t ructure elementary analysns
36
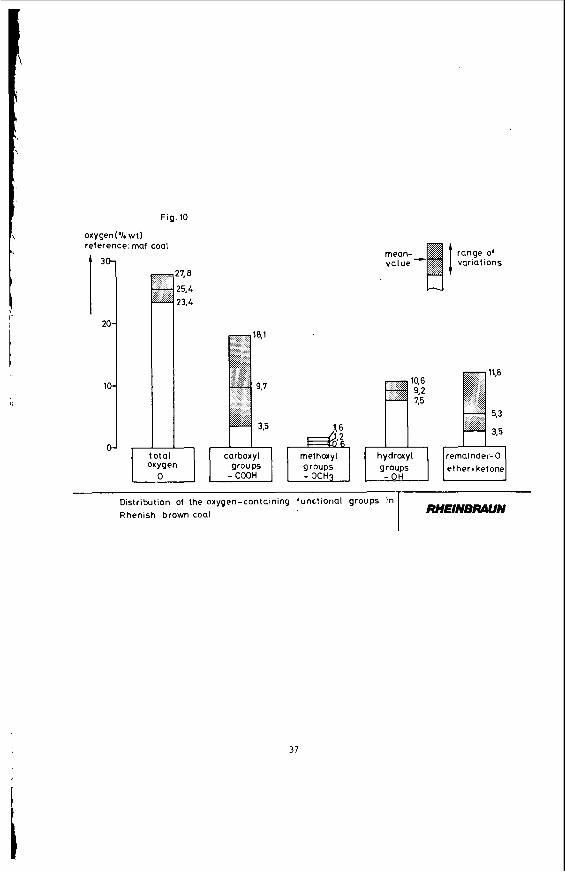
Fig. 10
Distribution of the oxygen-containing functional groups in Rhenish brown coal
oxygen(% WI) reference: rnaf coal
RHEINBWN
30-
20-
10.
0.
7.8
15.4 13.4
total oxygen
methoxyl groups
range ot variations
hydroxyl groups
37
pig. 11
percentage I sample I s t m c t u m I br ightness ' of a seam , saot ion
4.2 % 3.9 % 5.5 %
15.0 % 12.8 % 7.8 % 5.8 %
18,5 % 9.2 % 3.0 % 5.7 %
1.9 0 2,5 % 2.2 % 2.0 0
no.
1 2 3 4 5 6 I
8 9
10 11
12
1 3 14 15
matrix / t ex turn 1 and coluor
u m t r a t i f i s d coal u m t r a t i f i s d foal u m t m t l f i s d coal Ul l s tmt i f ied oca1 u m t r a t i r i e d 00.1
u m t n t i f i s d coal u m t m t i f i a d 00.1
s l i g h t l y a t r a t i f i e d coa l s l i g h t l y s t r a t i f i e d coal s l i g h t l y s t r n t i f i a d coa l s l i g h t l y s t r a t i f i e d ooal
heavi ly a t m t i i l s d coal heavi ly s t r a t i f i e d coa l heavi ly s t r a t i f i e d ooal f ib rous coal
b r i g h t dark m a l m - b r i g h t medium-bright mdium-dark madim-bright dark
medim-bright medium-dark dark dark
msdlm-bright dark dark dark (blaok)
g e l i f l o a t i o n r a t e
aacsssow in te roa la t iona
q l l t e - a n d mimral - fme, uetril granular g s l i f i c a t l o n m s t a , ql i ts q l i t e - c o n t a i n i n g s l i g h t l y tex tumd and qlits s l i g h t l y t e x t u m d , x y l i b , s u r r a o . gal s l i g h t l y t e x t u m d , q l i b - f n e a l i g h t l y t s x t u m d , q l i t e , ~ l , f u s i t e
t e x t u m d , x y l i t s and msinoua subatanoe t e x t u m d , q l i t s and br ight t e x t u r e q l i t e and gellsd,tsxtUmd t e x t u m d , x y l i t e and f u s i t e nea ts
sub. heavily tex tuma,br ight tex tum,msinous
heavily t e x t u m d , q l i t ~ , g e l l e d heavily teXtund, fuDi te t e x t u n
hOaVilY t % x t u m d , q l l t e and fUSit0 M S t a
I
RHplvBRAulv UacropetrOpraphifal classification of 1 5 b m coal 1ithotp.pss rmm the Rhenish a n a
38 I
Pig. 12
macsm1, macen1 subgroup, 11 t h o t m
Lipt in i te Kuno-Detrlnltn limo-Tellnim limo-Colllnlte Humlnite Inert ln i te Lipto-Humodetrita Tslo-Humodetrite Telo-Humoeollitd Detro-Kumooollit. aeio-Humotmire
z V O l .
z V O l .
% vo1. % V01. z V O l .
I I
~
RHElNtUUWN Niempetmgraphicsl c lass i f icat ion of 15 l i t h o t m s into 4 gnupa
/
39
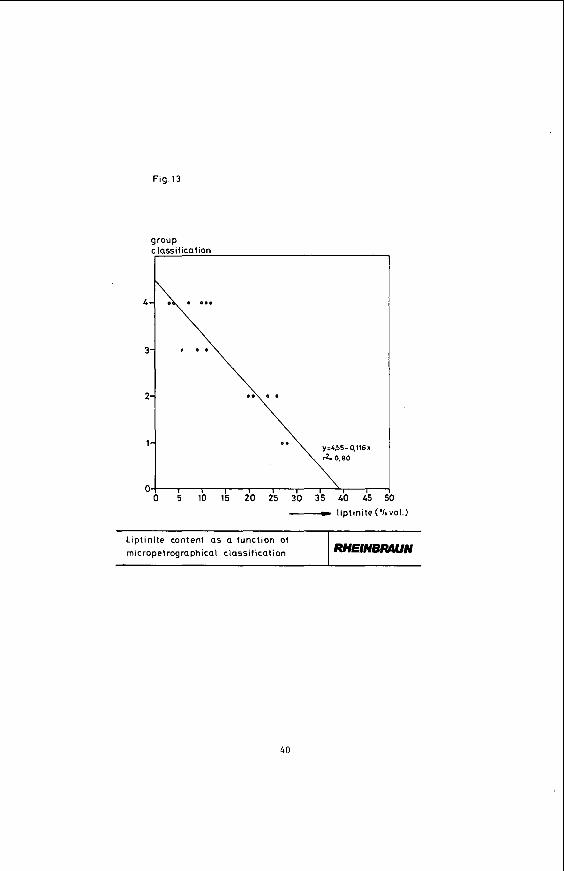
Fig.13
OUP assif icat ion
~ ~ 1 . 5 5 - 0,1161
, I I I I I I I I I 5 10 15 20 25 30 35 40 -55 ! I
Liptinite content as a function of micropetrographical classification I RHEINBMUN
40
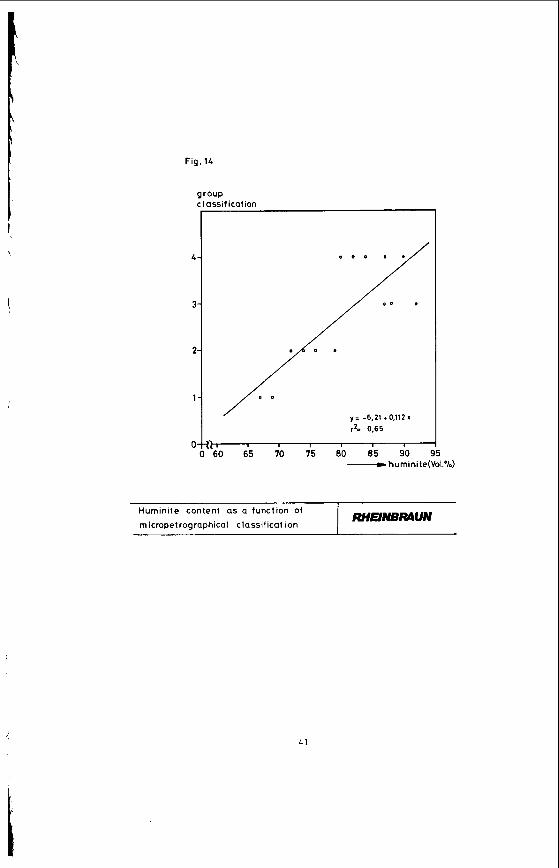
Fig. 14
0
OUP sssification
, n u 1 I
y s -6.21 .O.llZx r& 0.65
I RHEINBMUN Huminite content as a function of
micropetrographical classilicat ion
, 4 1
4 2
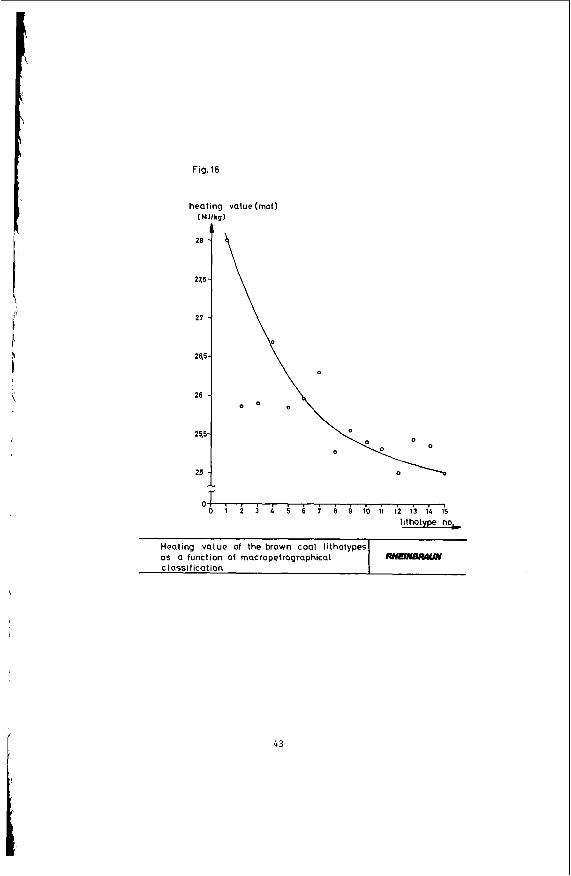
Fig. 16
heating value (mat)
Heating value of the brown coal lithotypes
c lassif ical ion as a function of macropetrographical
(t.
28
27:
27
26!
26
25:
25
a
WlclrNsRLUllv
I 1 2 3 4 5 6 7 8 9 1 0 1 1 1 2 1 3 1 4 1 5
lithotype noh
4 3
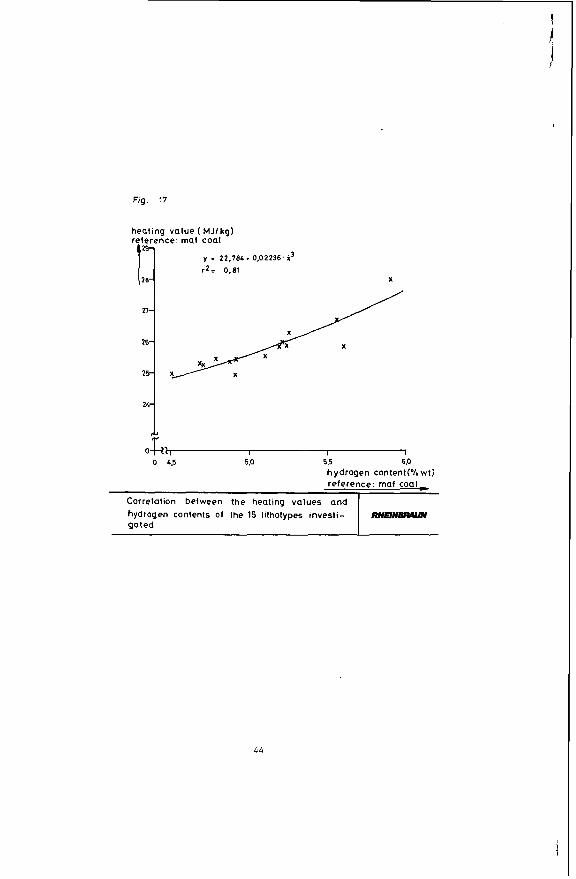
Fig. 17
Correlation between the heating values and hydrogen contents of the 15 lithotypes investi- gated
heating value ( MJlkg) reference: maf coal
y = 2 2 . 7 8 4 . 0,02236. a3
RHHNBWhW
X
44
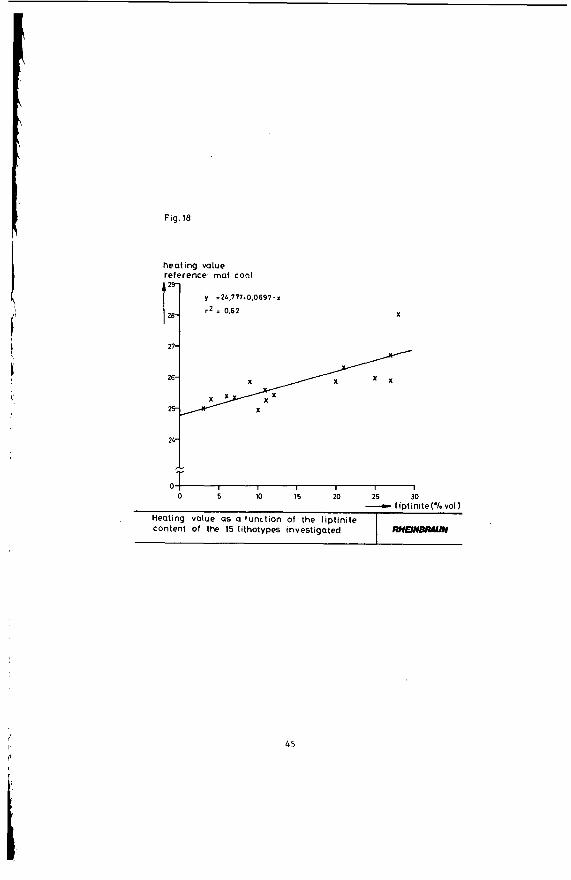
Fig. 18
Heating value as a function of the liptinite content Of the 15 lithotypes investigated
heating value reference: maf coal
RHEIN-
y =2L.777+0.0697.x
r 2 = 0.62 X
45
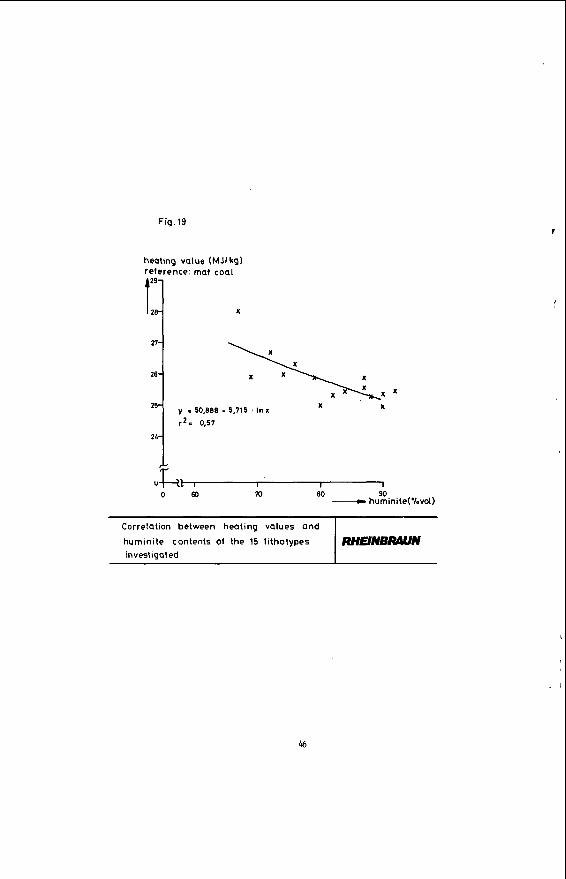
Fig. 19
heating value (MJlkg) reference: mat coal
Correlation between heating values and
huminile contents of the 15 lithotypes invest igated
29
25
T
R H H N W N
X
y i 50.888 - 5,715 ' In x
r 2 = 0.57
X X
I I I m 80 90
4-a I
o m - huminite(%vol)
46
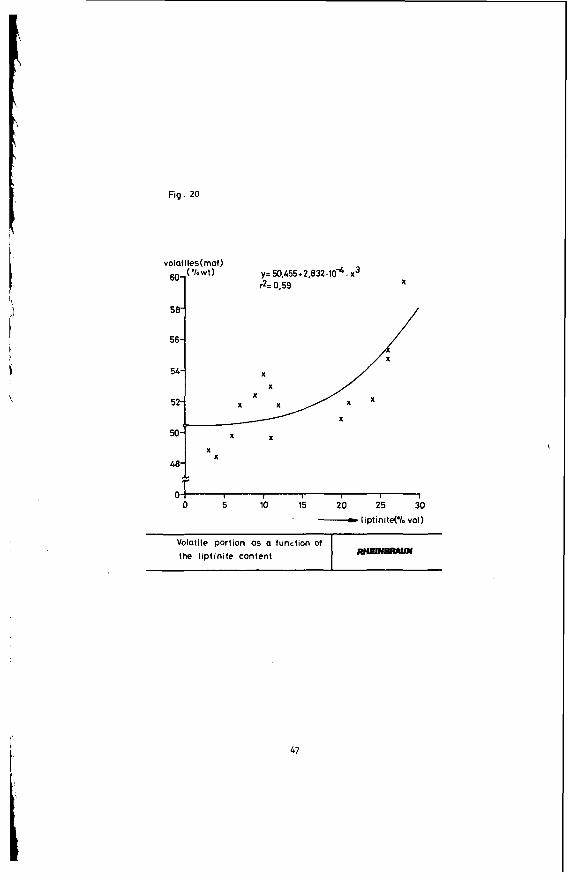
Fig. 20
volatiles(rnaf) YE 50,455+2,832.lO4. x3 &?= 0.59 X
581
50 "W x x A X X
x x
O X 0 5 10 15 20 25 30
' - IiptinitePl. vol) ~~ ~
Volatile portion as a function of the liptinite content
I
47
volatiles (maf 1 ?/owl)
60-
5 8-
5 6-
54-
5 2-
5 0-
4 0-
hydrogen(maf 1
Y
-6.0
- 5 3
-5.0
-4.5
-4,0
- volatiles
- -hydrogen
x x
0 0
Correlation between volatile matters, hydrogen
petrographicat classification contents of the lithotypes and the macro-
0 0 1 2 3 4 5 6 7 8 9 1 0 1 1 1 2 1 3 1 4 1 5
RnElNBRlWv
48
\
Correlation between hydrogen and Hurno-Telinite and Lipto - Hu modet ri te portions
Fig . 2 2
RuEJlvBlWlly
hydrogen content Pie wt reference: maf coal
d , y = 1.803.0.01026~a y = 6.259-0.386 Inx
r 2 = 0.79 r = 0.72
.
49
Fip 25
expended
50
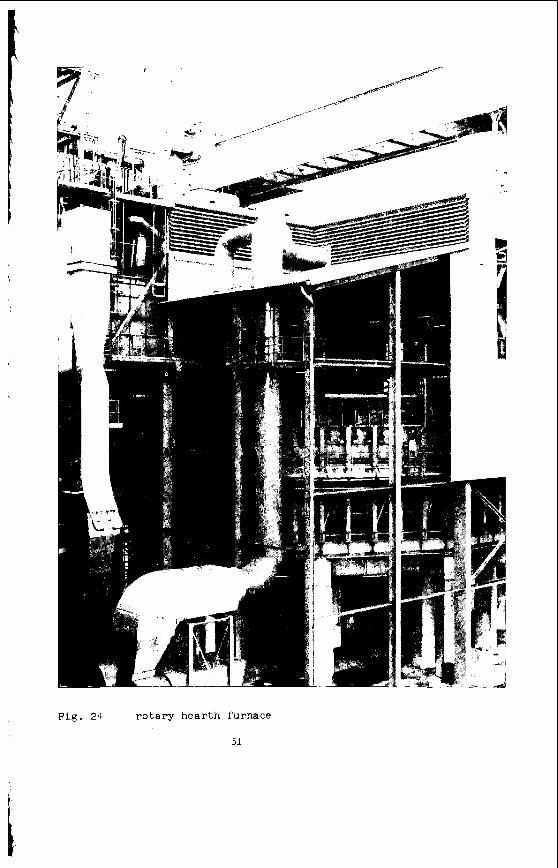
Fig . 24 r o t a r y h e a r t h furnace
51
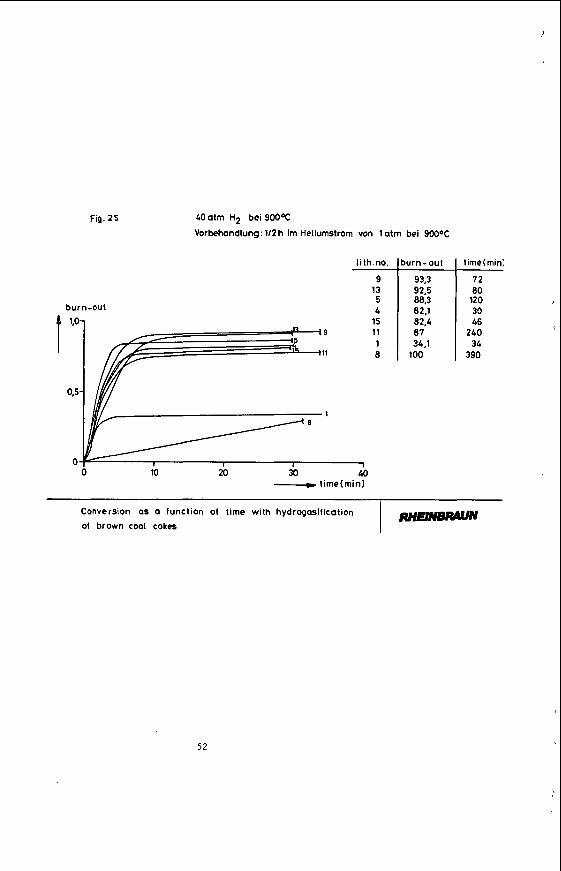
Fig. 2 5 40atm H2 bei 900T
Vorbehandlung: 112 h im Heliumstrom von 1 atm bei 9000C
burn-out A 1.07
9
11
82.1 82.4
34.1 11 87
100
1
0 1
0 10 20 30 40 - time(min1
t irne (min:
72 80 120 30 46
240 34
390
Conversion as a function of time with hydrogasification
01 brown coal cokes
52
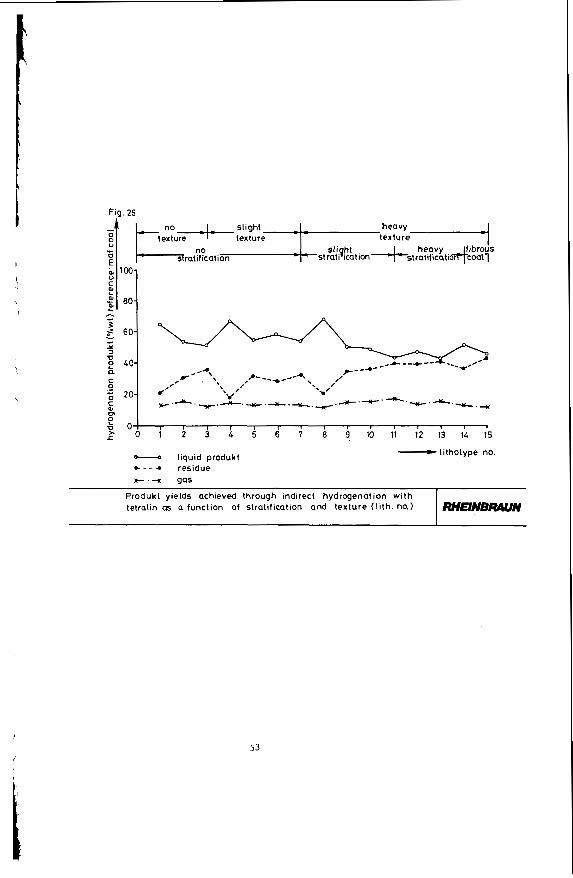
Fig. 26
Produkt yields achieved through indirect hydrogenation with tetralin as a function of stratification and texture (l ith. no.)
i
M E I N B M N
heavy
sliqht , 4 hqavy ,&;tb strati cation stratificati
texture no
53
I
1'": 70
60-
Fig. 27
C-conversion(% w t )
Carbon conversion achieved through indirect hydrogenation
contents with letralin as a function of the liptinite and hurninite
X '
X
RHEINBRwN
0 10 20 30 - liptinite(% vol)
C - conversion (%wl)
501 \ x x
X
x x x
80 90 - hurninile(%vol)
5 4
1. Petmgmphlca l p m p s r t l e a
Petrographical and chemical PMpsr t lea
Of BOOd hydWg4MtlOn O D a l S
L i p t i n l t e oontsnt > x ) z V O l
L lp to - Mlmodetrlta content 750 $ V O l
Mlmo - DBtrinite content ?50 z so1
I n e r t i n i t s content < 3 z vo1
O s l o - Humotsllte content < 6 I vol
Rense tance value ? 7 z vo1
wswlkllly
Tar content ,11 Z w t ( m f )
P a r a f f i n content > 7 z w t (iMr) Kydrogen oontant > 5,B w t (mr)
C/H n t l o 4 1 , l
Vola t i les >53 z w t (mar) Carlmnixntlon water 4 8.7Z w t (mr)
Under tha oondl t lom a t a w d above. the 5 t h and 6 t h
aeam of tha Port- - Oarsdorf mlne oontaln approx.
78 Z i t of good h x a r o p r u t l o n ~011s
55
SOME ASPECTS OF THE STRUCTURE AND REACTIONS OF NORTHERN GREAT PLAINS LIGNITES
W.R. Kube', H.H. Schober t2 , S.A. Bensonz, and F.R. Karner2
'Department of Chemical Engineer ing , Un ive r s i ty of North Dakota, Grand Forks, North Dakota
*Grand Forks Energy Technology Center , USDOE, Grand Forks, North Dakota
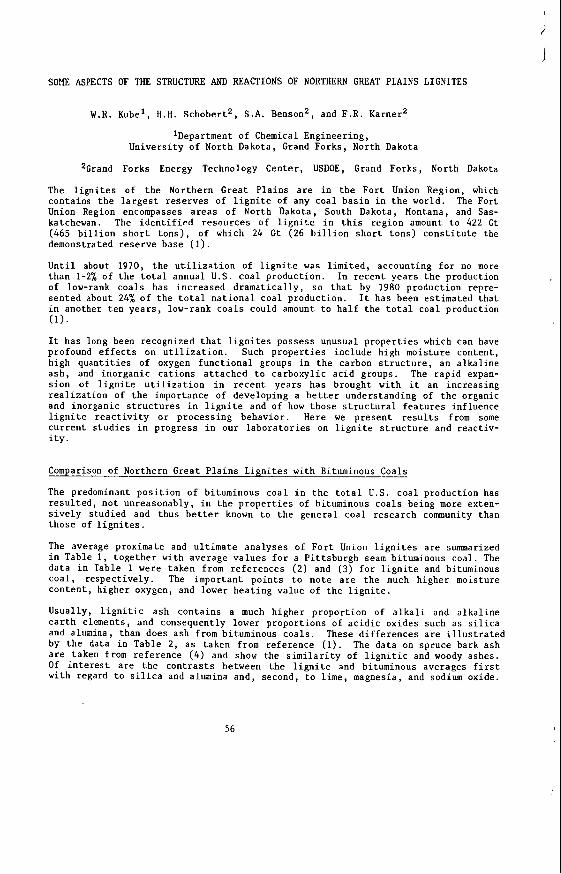
The l i g n i t e s of t h e Northern Great P l a i n s a r e i n t h e F o r t Union Region, which contains t h e l a r g e s t r e se rves of l i g n i t e of any coa l b a s i n i n t h e world. The Fort Union Region encompasses a r e a s of North Dakota, South Dakota, Montana, and Sas- katchewan. The i d e n t i f i e d r e snurces of l i g n i t c i n t h i s reg ion amount t o 422 G t (465 b i l l i o n s h o r t t o n s ) , of which 24 G t ( 2 6 b i l l i o n s h o r t t ons ) c o n s t i t u t e the demonstrated r e se rve base (1).
U n t i l about 1970, t he u t i l i z a t i o n of l i g n i t e was l i m i t e d , account ing f o r no more than 1-2% of t h e t o t a l annual U.S. coa l product ion . I n r ecen t y e a r s t h e production of low-rank coa l s has inc reased d r a m a t i c a l l y , s o t h a t by 1980 product ion repre- s en ted about 24% of t h e t o t a l n a t i o n a l coa l product ion . I t has been es t imated t h a t i n another t e n y e a r s , low-rank c o a l s could amount t o h a l f t h e t o t a l coa l production ( 1 ) .
I t has long been recognized t h a t l i g n i t e s possess unusual p r o p e r t i e s which can have profound e f f e c t s on u t i l i z a t i o n . Such p r o p e r t i e s i nc lude h igh mois ture content , h igh q u a n t i t i e s of oxygen f u n c t i o n a l groups i n t h e carbon s t r u c t u r e , an a l k a l i n e a s h , and ino rgan ic c a t i o n s a t t a c h e d t o ca rboxy l i c a c i d groups. The r ap id expan- s i o n of l i g n i t e u t i l i z a t i o n i n r e c e n t yea r s has brought wi th it an inc reas ing r e a l i z a t i o n of t h e importance of deve loping a b e t t e r unders tanding of t h e organic and ino rgan ic s t r u c t u r e s i n l i g n i t e and of how those s t r u c t u r a l f e a t u r e s inf luence l i g n i t e r e a c t i v i t y o r p rocess ing behav io r . Here we p r e s e n t r e s u l t s from some c u r r e n t s t u d i e s i n p rogres s i n our l a b o r a t o r i e s on l i g n i t e s t r u c t u r e and r eac t iv - i t y .
Comparison of Northern Grea t P l a i n s L i g n i t e s wi th Bituminous Coals
The predominant p o s i t i o n of bituminous coa l i n t h e t o t a l U.S. coa l product ion has r e s u l t e d , n o t unreasonably, i n t h e p r o p e r t i e s of bituminous coa l s be ing more exten- s i v e l y s tud ied and thus b e t t e r known t o t h e gene ra l coa l r e sea rch community than those of l i g n i t e s .
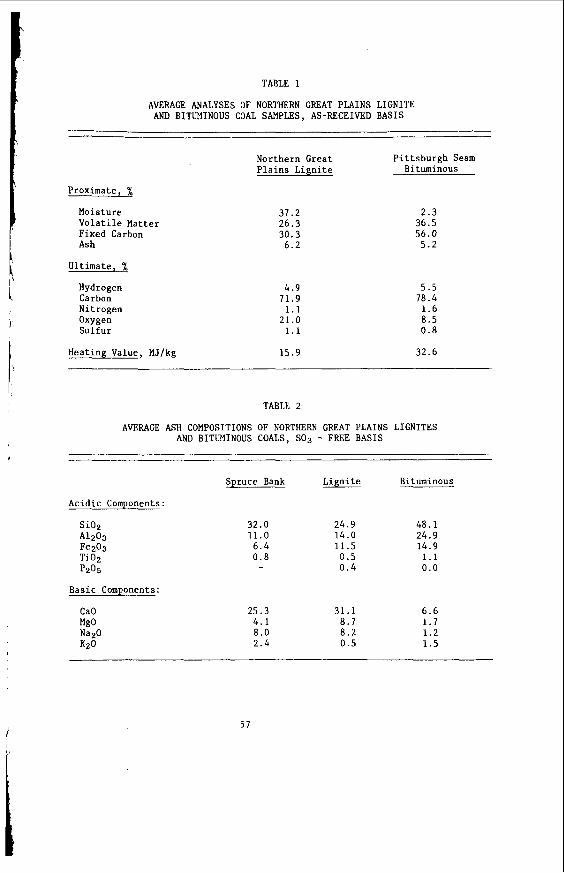
The average proximate and u l t i m a t e ana lyses of F o r t Union l i g n i t e s a r e summarized i n Table 1, t o g e t h e r with average va lues f o r a P i t t s b u r g h seam bituminous coa l . The d a t a i n Table 1 were taken from re fe rences ( 2 ) and (3) f o r l i g n i t e and bituminous c o a l , r e spec t ive ly . The impor tan t p o i n t s t o no te a r e the much h ighe r moisture c o n t e n t , h ighe r oxygen, and lower hea t ing va lue of t h e l i g n i t e .
Usual ly , l i g n i t i c a s h con ta ins a much h ighe r p ropor t ion of a l k a l i and a l k a l i n e e a r t h e lements , and consequent ly lower p ropor t ions of a c i d i c oxides such as s i l i c a and alumina, than does ash from bituminous coa l s . These d i f f e r e n c e s a r e i l l u s t r a t e d by t h e data i n Table 2 , a s taken from re fe rence (1). The da ta on spruce bark a sh a r e taken from re fe rence ( 4 ) and show the s i m i l a r i t y of l i g n i t i c and woody ashes. Of i n t e r e s t a r e t h e c o n t r a s t s between t h e l i g n i t e and bituminous averages f i r s t w i th regard t o s i l i c a and alumina and, second, t o l ime, magnesia, and sodium oxide.
56
i
i’
TABLE 1
AVERAGE ANALYSES OF NORTHERN GREAT PLAINS LIGNITE AND BITUMINOUS COAL SAMPLES, AS-RECEIVED BASIS
Northern Great Pittsburgh Seam Plains Lignite Bituminous
Proximate, %
Moisture Volatile Matter Fixed Carbon Ash
Ultimate, %
Hydrogen Carbon Nitrogen Oxygen Sulfur
37.2 26.3 30.3
6.2
4.9 11.9 1.1
21.0 1.1
2.3 36.5 56.0
5.2
5.5 18.4
1 .6 8.5 0.8
Heating Value, MJ/kg 15.9 32.6
TABLE 2
AVERAGE ASH COMPOSITIONS OF NORTHERN GREAT PLAINS LIGNITES AND BITUMINOUS COALS, SO3 - FREE BASIS
Acidic Components:
Si02 A1203 !e203 Ti02 p205
Basic Components:
CaO MgO Na2O K20
Spruce Bank
32.0 11.0
6 .4 0.8
25.3 4 .1 8.0 2.4
Lignite
24.9 14.0 11.5 0.5 0.4
31.1 8.7 8.2 0.5
Bituminous
48 .1 24.9 14.9 1.1 0.0
6.6 1.7 1.2 1.5
5 7
Organic s t r u c t u r a l Re la t ionsh ips
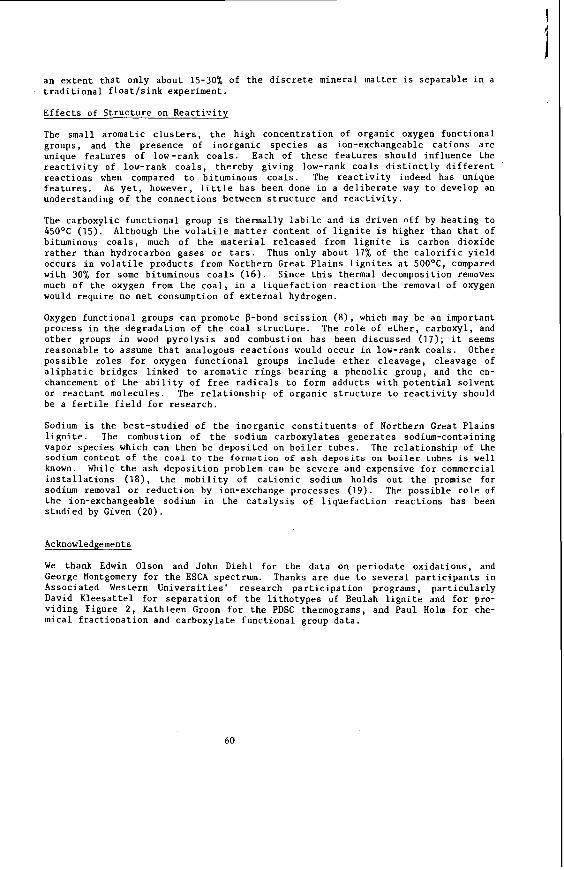
L i g n i t e i s an e a r l y s t a g e i n t h e c o a l i f i c a t i o n process and thus could be expected t o r e t a i n some c h a r a c t e r i s t i c s o f wood. This r e l a t i o n s h i p i s i l l u s t r a t e d by the e l e c t r o n micrographs shown a s F igu res 1 and 2 . Pieces of p l a n t d e b r i s , presumably twigs o r r o o t l e t s , can be seen i n F igu re 1. Remains of t h e c e l l u l a r s t r u c t u r e a re v i s i b l e i n F igure 2; the c l o s e s i m i l a r i t y t o t h e s t r u c t u r e of softwood may be seen by comparing r e fe rence (5) f o r example.
On t h e molecular l e v e l , t h e d i s t i n g u i s h i n g f e a t u r e s of t h e o rgan ic s t r u c t u r e of l i g n i t e are t h e lower a r o m a t i c i t y (o r f r a c t i o n of t o t a l carbon i n a romat ic s t ruc - t u r e s ] , compared t o bituminous c o a l s ; a romat ic c l u s t e r s con ta in ing on ly one o r two r i n g s ; and t h e preva lence of oxygen-containing func t iona l groups. A proposed s t r u c t u r a l r e p r e s e n t a t i o n , modified s l i g h t l y from t h e o r i g i n a l v e r s i o n ( 6 ) , i s g iven i n F igure 3 . We do no t c la im t h a t t h i s r ep resen t s the s t r u c t u r e of Northern Great P l a ins l i g n i t e , b u t r a t h e r use it as an i l l u s t r a t i o n o f major s t r u c t u r a l f e a t u r e s .
The a romat i c i ty has been s t u d i e d by p r e s s u r e d i f f e r e n t i a l scanning ca lor imet ry (PDSC). The d e t a i l s of t h e exper imenta l t echnique and of t h e methods f o r ca l cu la - t i n g a romat i c i ty from a PDSC thermogram have been publ i shed elsewhere ( 7 ) . t h e PDSC experiment provides f o r c o n t r o l l e d combustion of a 1-1.5 mg sample of -100 mesh coa l i n a 3 .5 MPa atmosphere of oxygen. The sample i s hea ted a t 20°C/min i n t h e range 150° t o 600OC. The in s t rumen t response i s a thermogram p l o t t i n g heat f l u x , A q , versus tempera ture , t h e i n t e g r a t e d va lue thus be ing t h e h e a t of com- b u s t i o n . For most c o a l s , and many o rgan ic compounds and polymers, t he thermogram i n t h i s region c o n s i s t s of two peaks , which, from comparison t o t h e behavior of model compounds, a r i s e p r i m a r i l y from combustion of t h e a l i p h a t i c and aromat ic p o r t i o n s of t he sample. The a r o m a t i c i t y may be deduced from a comparison of peak h e i g h t s .
The a romat i c i ty f o r s e v e r a l samples o f Northern Grea t P l a i n s l i g n i t e s , a s measured on run-of-mine m a t e r i a l , l i e s i n t h e range of 0.61 t o 0.66. For comparison, a sample of Aus t r a l i an brown coa l a v a i l a b l e t o us was found t o have a romat i c i ty of 0.56; a sample of Minnesota p e a t had a n a r o m a t i c i t y of 0.50. Samples of v i t r i n i t e concen t r a t e s from t h e Northern Grea t P l a i n s l i g n i t e s were more a romat ic , wi th va lues i n t h e range of 0.72 t o 0 .74.
The temperature a t which t h e maximum of t h e a romat ic peak occurs has been shown t o be a func t ion of t h e e x t e n t of r i n g condensation ( 7 ) , t h e maximum s h i f t i n g t o h ighe r temperatures wi th i n c r e a s i n g condensa t ion . I n suppor t of t h e s t u d i e s on coa l s t r u c t u r e , we have measured t h e PDSC behavior of over 30 organic compounds (most of which have been sugges ted a s coa l models o r have been i d e n t i f i e d i n the products of coal process ing) and abou t 50 polymers. The maxima of t h e a romat ic peaks i n the thermograms of Northern Grea t P l a i n s l i g n i t e s gene ra l ly f a l l i n t o t h e same temperature range (375°-4000C) a s t hose f o r compounds o r polymers baving benzene or naphtha lene r i n g s . One example i s given i n F igure 4 , i n which t b e PDSC thermograms of Gascoyne (N.D.) l i g n i t e and poly(4-methoxystyrene) a r e compared. We conclude t h a t t h e a romat ic r i n g systems t h e r e f o r e a r e mostly one- o r two-ring systems.
Much less i s known about t h e hydroaromatic s t r u c t u r e s o r a l i p h a t i c b r idges between r i n g systems. A methylene b r idge i s o f t e n suggested a s a t y p i c a l a l i p h a t i c b r idg - i n g group, and was o r i g i n a l l y shown i n t h e proposed s t r u c t u r a l r e p r e s e n t a t i o n ( 6 ) . However, cons ide ra t ions based on thermochemical k i n e t i c s p r e d i c t a h a l f - l i f e of l o 6 yea r s f o r bond c leavage of diphenylmethane i n , t e t r a l i n a t 4OOOC (8). Exhaustive ana lyses Of the products from l i q u e f a c t i o n of Northern Great P l a ins l i g n i t e a t 400°C and h ighe r i n t h e presence of t e t r a l i n , ( s ee (9) f o r example) have never i d e n t i f i e d diphenylmethane o r r e l a t e d compounds. t u t e s s t rong c i r c u m s t a n t i a l ev idence f o r t h e r e l a t i v e unimportance of methylene l i nkages between aromat ic c l u s t e r s .
B r i e f l y ,
Absense o f diphenylmethane c o n s t i -
58
I'
J
Oxygen is distributed among carboxylate, phenol, and ether functional groups. The carboxylate concentration has been measured by reaction of demineralized coal with calcium acetate following the precedure of van Krevelen and co-workers (10). A study of the carboxylate concentrations is still in progress; preliminary data for the Northern Great Plains lignites indicate carboxylate concentrations ranging from 1.75 to 1.93 meq/g on a dry basis. Concentrations of phenolic or ether functional groups have not yet been measured. Electron spectroscopy for chemical analysis (ESCA) provides a means for discriminating between carbon atoms incorporated in C=O and c-0 structures by a Gaussian-Lorentzian decomposition of the carbon 1s spectrum (11). Figure 5 provides a comparison of the decomposed carbon 1s spectra of Beulah (N.D.1 lignite and polyethylene terephthalate. At present, the ESCA data cannot be resolved into phenolic and etheric carbons. However, it can be shown that the ratio of carbon in carboxylate groups to that in (phenol plus ether) groups is about 0.62 (11). The presence of methoxy groups has been qualitatively confirmed; as-yet unpublished work by E.S. Olson and J.W. Diehl demonstrates the production of meth- anol from sodium periodate oxidation of Beulah lignite.
Little consideration has yet been given to the three-dimensional structure. A Preliminary examination of lithotypes of Beulah lignite has been conducted by laser Raman spectroscopy (11). The lithotype having a higher concentration of carboxylic acid groups has a weaker band at 1600 cm l . If this band is assigned as a graphite mode (121, results suggest that the relatively bulky carboxylate groups, with their associated counterions, may disrupt, or preclude, three-dimensional ordering.
Distribution of Inorganic Constituents
I n lignites the inorganic constituents are incorporated not only as discrete min- eral phases, but also as relatively mobile ions, presumably associated with the carboxylic acid functional groups. The distribution of inorganic constituents has been studied principally by the chemical fractionation procedure developed by Miller and Given (13).
Extraction of the coal with 1M ammonium acetate removes those elements present on ion exchange sites, which are presumed to be carboxylic acid functional groups. Sodium and magnesium are incorporated almost exclusively as ion-exchangeable ca- tions. For a suite of Northern Great Plains lignites tested, 84 to 100% of the sodium originally in the coal and 88 to 90% of the magnesium are removed by ammonium acetate extraction. Figure 6 is an electron micrograph showing an electron back- scatter image due to the presence of sodium intimately associated with the organic material. Calcium is largely present in cationic form, 48 to 76% being extracted. Some potassium is also extracted in this step, in amounts ranging from 20 to 57%.
Further treatment with 1M hydrochloric acid then removes elements present as acid- soluble minerals or possibly as acid-decomposable coordination compounds. This acid extraction removes essentially all of the calcium and magnesium not removed by ammonium acetate. This finding is suggestive of the presence of calcite or dol- omite minerals, which are known to be present in Northern Great Plains lignites (14). The hydrochloric acid extraction behavior of other major metallic elements is quite variable, which suggests significant differences in the mineralogy of the samples. Of those elements not extracted at all by ammonium acetate, some iron, aluminum, and titanium are removed by hydrochloric acid.
The portions of elements which are not removed by either reagent are considered to be incorporated in acid-insoluble minerals, particularly clays, pyrite, and quartz. This group includes all of the silicon, the remaining sodium and potassium, and the residual iron, aluminum and titanium. The acid-insoluble minerals are present as discrete phases. Frequently the mineral particles are quite small (see Figure 7, for example) and very highly dispersed through the carbonaceous material, to such
59
a n e x t e n t t h a t on ly about 15-30% of t h e d i s c r e t e minera l mat te r i s separable i n a t r a d i t i o n a l f l o a t / s i n k experiment .
E f f e c t s of S t r u c t u r e on R e a c t i v i t y
The small aromatic c l u s t e r s , t h e high concent ra t ion of organic oxygen f u n c t i o n a l groups, and t h e presence of i n o r g a n i c s p e c i e s a s ion-exchangeable c a t i o n s a r e unique f e a t u r e s of low-rank c o a l s . Each of t h e s e f e a t u r e s should inf luence t h e r e a c t i v i t y of low-rank c o a l s , thereby g iv ing low-rank c o a l s d i s t i n c t l y d i f f e r e n t r e a c t i o n s when compared t o bi tuminous c o a l s . The r e a c t i v i t y indeed has unique f e a t u r e s . As y e t , however, l i t t l e has been done i n a d e l i b e r a t e way t o develop an understanding of t h e connect ions between s t r u c t u r e and r e a c t i v i t y .
The carboxyl ic f u n c t i o n a l group i s thermal ly l a b i l c acd i s d r i v e n o f f by hea t ing t o 45OOC (15). Although t h e v o l a t i l e m a t t e r conten t of l i g n i t e i s h igher than t h a t of bituminous c o a l s , much of t h e m a t e r i a l r e l e a s e d from l i g n i t e i s carbon d ioxide r a t h e r than hydrocarbon gases o r t a r s . Thus only about 17% of t h e c a l o r i f i c y i e l d occurs i n v o l a t i l e products from Northern Great P l a i n s l i g n i t e s a t 5OO0C, compared wi th 30% f o r some bituminous c o a l s ( 1 6 ) . Since t h i s thermal decomposition removes much of the oxygen from t h e c o a l , i n a l i q u e f a c t i o n r e a c t i o n t h e removal of oxygen would requi re no n e t consumption of e x t e r n a l hydrogen.
Oxygen func t iona l groups can promote p-bond s c i s s i o n (8), which may be an important process i n t h e degrada t ion of t h e coa l s t r u c t u r e . The r o l e of e t h e r , carboxyl , and o t h e r groups i n wood p y r o l y s i s and combustion has been d iscussed (17); it seems reasonable t o assume t h a t analogous r e a c t i o n s would occur i n low-rank c o a l s . Other p o s s i b l e r o l e s f o r oxygen f u n c t i o n a l groups i n c l u d e e t h e r c leavage, c leavage of a l i p h a t i c br idges l i n k e d t o a romat ic r i n g s bear ing a phenol ic group, and t h e en- chancement of t h e a b i l i t y of f r e e r a d i c a l s t o form adducts wi th p o t e n t i a l so lvent o r r e a c t a n t molecules . The r e l a t i o n s h i p of organic s t r u c t u r e t o r e a c t i v i t y should be a f e r t i l e f i e l d f o r research .
Sodium i s the b e s t - s t u d i e d of t h e inorganic c o n s t i t u e n t s of Northern Great P l a i n s l i g n i t e . The combustion of t h e sodium carboxyla tes genera tes sodium-containing vapor spec ies which can then be depos i ted on b o i l e r tubes . The r e l a t i o n s h i p of the sodium content of t h e c o a l t o t h e formation of ash d e p o s i t s on b o i l e r tubes i s w e l l known. While t h e ash d e p o s i t i o n problem can be severe and expensive f o r commercial i n s t a l l a t i o n s (18), t h e m o b i l i t y of c a t i o n i c sodium holds out t h e promise f o r sodium removal o r reduct ion by ion-exchange processes (19). The p o s s i b l e r o l e of t h e ion-exchangeable sodium i n t h e c a t a l y s i s of l i q u e f a c t i o n r e a c t i o n s has been s t u d i e d by Given (20) .
Acknowledgements
We thank Edwin Olson and John Diehl f o r t h e d a t a on per ioda te o x i d a t i o n s , and George Montgomery f o r t h e ESCA spectrum. Thanks a r e due t o s e v e r a l p a r t i c i p a n t s i n Associated Western U n i v e r s i t i e s ' r e s e a r c h p a r t i c i p a t i o n programs, p a r t i c u l a r l y David K l e e s a t t e l f o r s e p a r a t i o n of t h e l i t h o t y p e s of Beulah l i g n i t e and f o r pro- v i d i n g Figure 2 , Kathleeii Groon f o r t h e PDSC thermograms, and Paul Holm f o r che- mica l f r a c t i o n a t i o n and carboxyla te f u n c t i o n a l group d a t a .
60
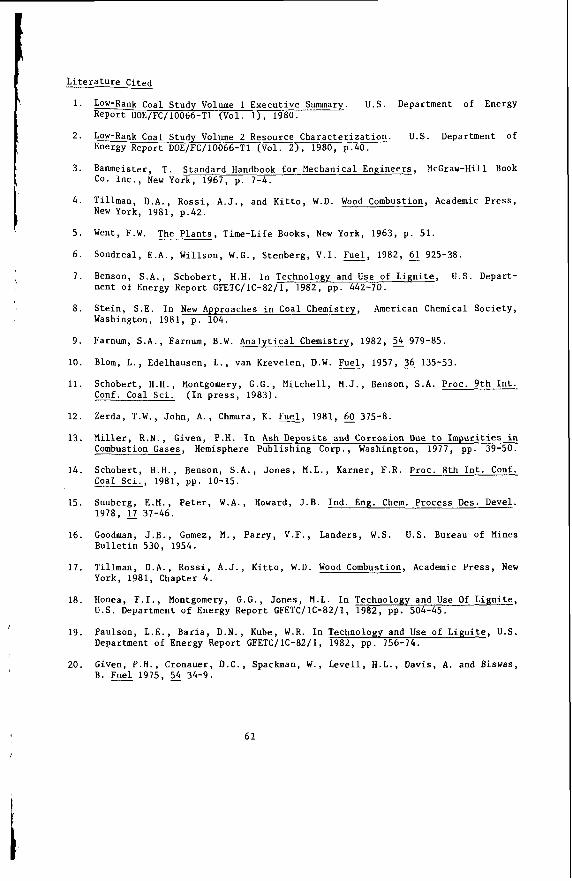
i
L i t e r a t u r e Cited
1.
2.
3 .
4 . i 5 .
6 .
7 .
t
I 8.
9.
10.
11.
12.
13.
14.
15.
16.
1 7 .
18.
I 19.
20.
Low-Rank Coal Study Volume 1 Execut ive Summary. U.S. Department of Energy Report DOE/FC/10066-T1 (Vol. I), 1980.
LOW-Rank Coal Stud Volume 2 Resource C h a r a c t e r i z a t i o n . Energy Report DOE/h/10066-T1 (Vol. 2 ) , 1980, p .40.
U.S. Department of
Banmeister, T . Standard Handbook f o r Mechanical Engineers , McGraw-Hill Book CO. InC., New York, 1967, p . 7-4.
Ti l lman, D . A . , Ross i , A . J . , and K i t t o , W . D . Wood Combustion, Academic P r e s s , New York, 1981, p .42 .
Went, F.W. The P l a n t s , Time-Life Books, New York, 1963, p . 51.
Sondreal , E . A . , Wil lson, W . G . , S tenberg , V . I . Fuel, 1982, 61 925-38.
Benson, S.A. , Schober t , H . H . In Technology and Use of L i g n i t e , U.S. Depart- ment of Energy Report GFETC/lC-82/1, 1982, pp. 442-70.
S t e i n , S.E. In New Approaches i n Coal Chemistry, American Chemical Soc ie ty , Washington, 1981, p . 104.
Farnum, S.A., Farnum, B.W. A n a l y t i c a l Chemistry, 1982, 54 979-85.
Blom, L . , Edelhausen, L., van Krevelen, D.W. Fue l , 1957, 3 135-53.
Schobert , H . H . , Montgomery, G.G., M i t c h e l l , M . J . , Benson, S.A. PKOC. 9 t h I n t . Conf. Coal S c i . ( I n p r e s s , 1983) .
Zerda, T.W., John, A . , Chmura, K . Fuel, 1981, 60 375-8.
Miller, R . N . , Given, P.H. I n Ash Deposi ts and Corros ion Due t o I m p u r i t i e s i n Combustion Gases, Hemisphere Publ i sh ing Corp. , Washington, 1977, pp. 39-50.
Schobert , H . H . , Benson, S.A. , Jones , M.L., Karner , F.R. PKOC. 8 t h I n t . Conf. Coal S c i . , 1981, pp. 10-15.
Suuberg, E .M. , P e t e r , W . A . , Howard, J . B . Ind . Eng. Chem. Process Des. Devel. 1978, 37-46.
Goodman, J . B . , Gomez, M . , P a r r y , V.F., Landers, W.S. U.S. Bureau of Mines B u l l e t i n 530, 1954.
Ti l lman, D . A . , Ross i , A . J . , K i t t o , W . D . Wood Combustion, Academic P r e s s , New York, 1981, Chapter 4 .
Honea, F . I . , Montgomery, G . G . , Jones , M.L. I n Technology and Use Of L i g n i t e , U.S. Department of Energy Report GFETC/lC-82/1, 1982, pp. 504-45.
Paulson, L . E . , Bar ia , D . N . , Kube, W.R. I n Technology and Use of L i g n i t e , U.S. Department of Energy Report GFETC/lC-82/1, 1982, pp. 756-74.
Given, P.H., Cronauer, D . C . , Spackman, W . , L e v e l l , H . L . , Davis , A. and Biswas, B. F& 1975, 54 34-9.
6 1
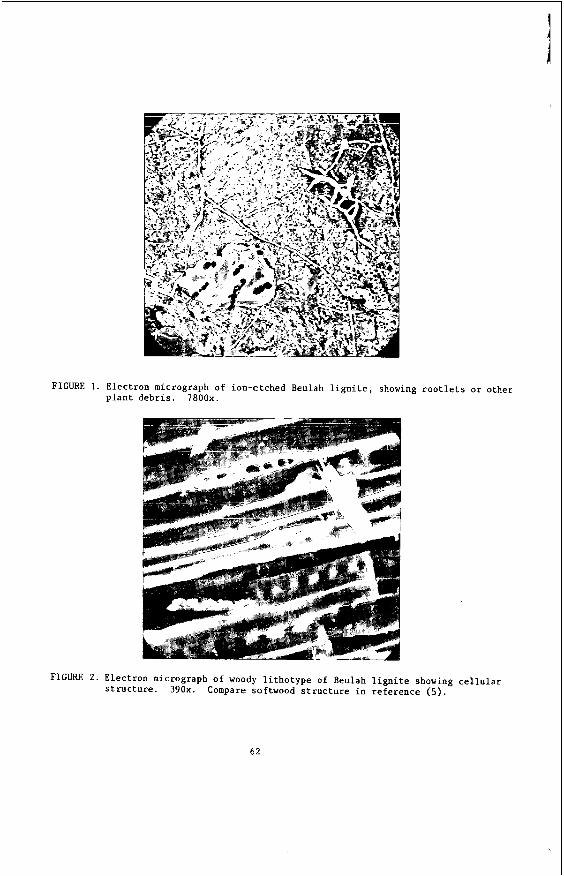
FIGURE 1. Electron micrograph o f ion-etched Beulah l i g n i t e , showing r o o t l e t s or other p lant debr i s . 7800x.
FIGURE 2. Electron micrograph o f woody l i tho type of Beulah l i g n i t e showing c e l l u l a r s tructure . 390x. Compare softwood s tructure i n reference (5) .
62
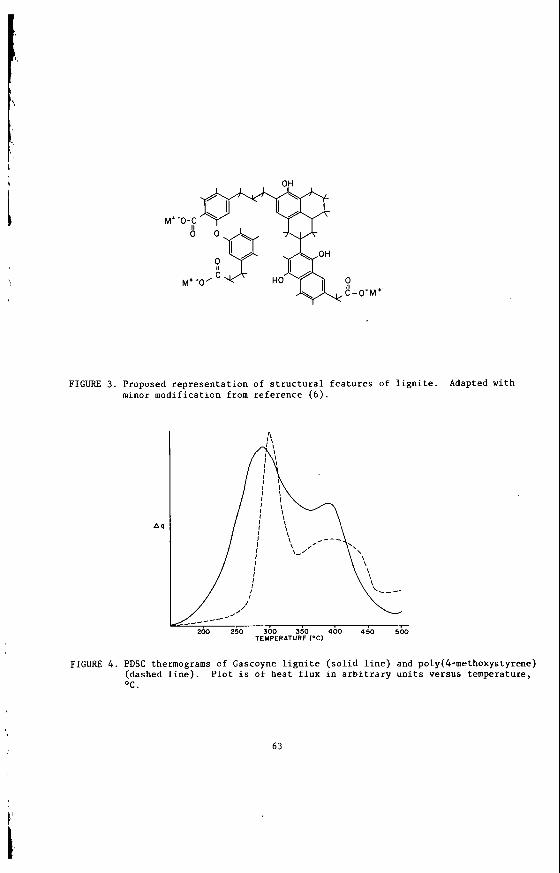
FIGURE 3. Proposed representation of structural features of lignite. minor modification from reference (6).
Adapted with
FIGURE 4. PDSC thermograms of Gascoyne lignite (solid line) and poly(4-methoxystyrene) (dashed line). Plot is of heat flux in arbitrary units versus temperature, O C .
63
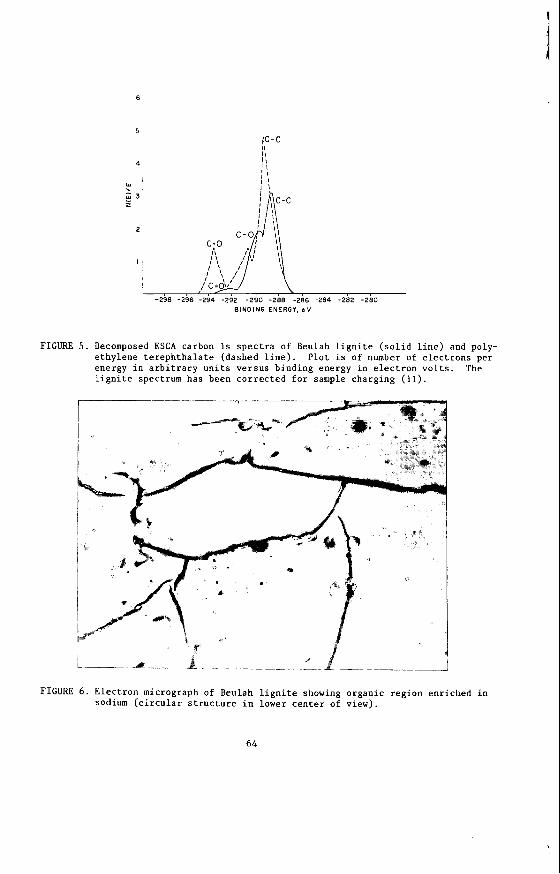
jc-c 11 I1 ,
, . -298 -296 -294 -292 -290 -288 -286 -284 -282 -280
BINDING ENERGY, t V
FIGURE 5 . Decomposed ESCA carbon I s s p e c t r a of Beulah l i g n i t e ( s o l i d l i n e ) and poly- e thylene t e r e p h t h a l a t e (dashed l i n e ) . P l o t i s of number of e l e c t r o n s per energy i n a r b i t r a r y u n i t s v e r s u s b inding energy i n e l e c t r o n v o l t s . l i g n i t e spectrum has been c o r r e c t e d f o r sample charg ing (11).
The
FIGURE 6. E l e c t r o n micrograph of Beulah l i g n i t e showing organic reg ion enr iched i n sodium ( c i r c u l a r s t r u c t u r e i n lower c e n t e r of view).
64
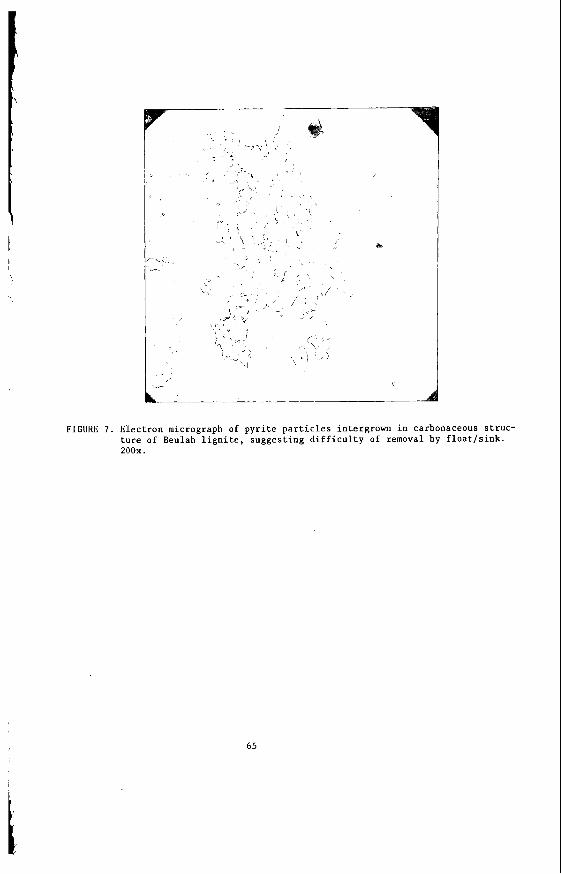
FIGURE 7
i I_.- \
Electron micrograph of pyr i t e p a r t i c l e s intergrown i n carbonaceous struc- ture of Beulah l i g n i t e , suggesting d i f f i c u l t y of removal by f l o a t / s i n k . 2oox.
65
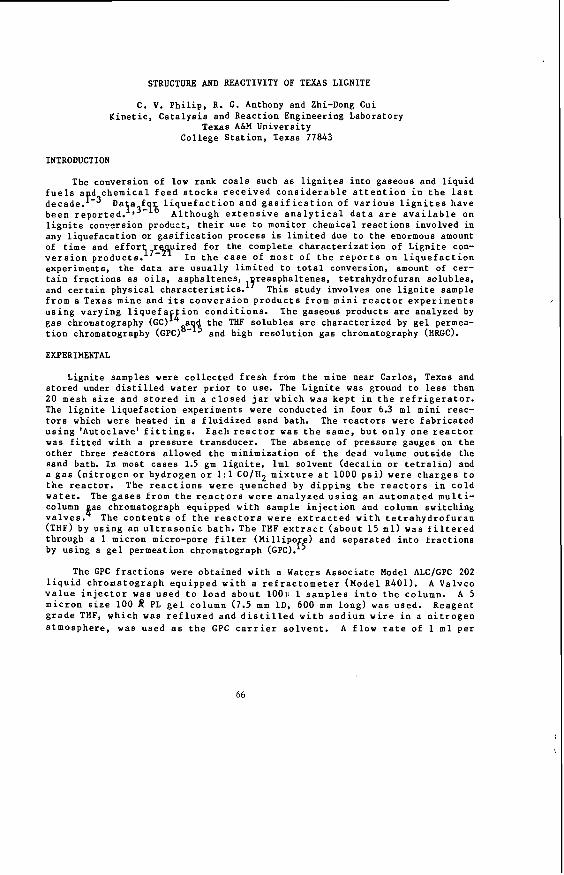
STRUCTURE AND REACTIVITY OF TEXAS LIGNITE
C. V. P h i l i p , R. G. Anthony and Zhi-Dong Cui
Texas A&M Univers i ty Col lege S t a t i o n , Texas 77843
K i n e t i c , C a t a l y s i s and React ion Engineer ing Laboratory
INTRODUCTION
The conversion of low rank c o a l s such a s l i g n i t e s i n t o gaseous and l i q u i d f u e l s a d c h e m i c a l f e e d s t o c k s r e c e i v e d c o n s i d e r a b l e a t t e n t i o n i n t h e l a s t
Daif3tq% l i q u e f a c t i o n a n d g a s i f i c a t i o n of v a r i o u s l i g n i t e s have b e e n r e p o r t e d . A l t h o u g h e x t e n s i v e a n a l y t i c a l d a t a a r e a v a i l a b l e on l i g n i t e conversioc product , t h e i r use t o monitor chemicai r e a c t i o n s involved i n any l i q u e f a c a t i o n or g a s i f i c a t i o n process i s l i m i t e d due t o t h e enormous amount of t i m e and e f f o r l i 7 r 5 j u i r e d f o r the complete c h a r a c t e r i z a t i o n of L i g n i t e con- v e r s i o n p r o d u c t s . - I n t h e c a s e of most o f t h e r e p o r t s on l i q u e f a c t i o n experiments , t h e d a t a a r e u s u a l l y l i m i t e d t o t o t a l conversion, amount of cer- t a i n f r a c t i o n s a s o i l s , asphaltenes,lqreasphaltenes, t e t rahydrofuran so lubles , and c e r t a i n phys ica l c h a r a c t e r i s t i c s . This s tudy involves one l i g n i t e sample f r o m a Texas mine and i t s c o n v e r s i o n p r o d u c t s f r o m m i n i r e a c t o r e x p e r i m e n t s u s i n g v a r y i n g l i q u e f a f t i o n c o n d i t i o n s . The gaseous products a r e analyzed by gas chromatography (GC) t h e THF s o l u b l e s a r e c h a r a c t e r i z e d by g e l permea- t i o n chromatography (GPC)"" and high r e s o l u t i o n gas chromatography (HRGC).
EXPERIMENTAL
Ligni te samples were c o l l e c t e d f r e s h from t h e mine near Carlos , Texas and s t o r e d under d i s t i l l e d water p r i o r t o use. The L i g n i t e was ground t o less than 20 mesh s i z e and s t o r e d i n a c l o s e d j a r which was k e p t in t h e r e f r i g e r a t o r . The l i g n i t e l i q u e f a c t i o n experiments were conducted i n f o u r 6.3 m l m i n i reac- t o r s which were heated i n a f l u i d i z e d sand bath. The r e a c t o r s were f a b r i c a t e d u s i n g 'Autoc lave ' f i t t i n g s . Each r e a c t o r was t h e same, b u t o n l y o n e r e a c t o r was f i t t e d w i t h a p r e s s u r e t ransducer . The absence of pressure gauges on t h e o t h e r th ree r e a c t o r s a l lowed t h e minimiza t ion of t h e dead volume o u t s i d e t h e sand bath. I n most c a s e s 1.5 gm l i g n i t e , l m l so lvent ( d e c a l i n or t e t r a l i n ) and a g a s ( n i t r o g e n or hydrogen o r 1:l C O / H 2 m i x t u r e a t 1000 p s i ) w e r e c h a r g e s t o t h e r e a c t o r . The r e a c t i o n s w e r e quenched by d i p p i n g t h e r e a c t o r s i n c o l d w a t e r . The g a s e s f r o m t h e r e a c t o r s w e r e a n a l y z e d u s i n g a n a u t o m a t e d m u l t i - column 4 6 s chromatograph equipped w i t h sample i n j e c t i o n and column swi tch ing v a l v e s . The c o n t e n t s o f t h e r e a c t o r s w e r e e x t r a c t e d w i t h t e t r a h y d r o f u r a n (THF) by u s i n g a n u l t r a s o n i c b a t h . The THF e x t r a c t ( a b o u t 1 5 m l ) was f i l t e r e d through a 1 micron micro-pore f i l t e r (Mi l l ipof f ) and separa ted i n t o f r a c t i o n s by us ing a g e l permeat ion chromatograph (GPC).
The GPC f r a c t i o n s were obta ined w i t h a Waters Assoc ia te Model ALC/GPC 202 l i q u i d chromatograph e q u i p p e d w i t h a r e f r a c t o m e t e r (Model R401). A Valvco v a l u e i n j e c t o r w a s u s e d t o l o a d a b o u t 1 0 0 ~ 1 1 s a m p l e s i n t o t h e column. A 5 m i c r o n s i z e 100 R PL g e l column (7.5 m m I D , 600 mm long) w s s used. Reagent g r a d e THF, which was r e f l u x e d and d i s t i l l e d w i t h sodium wi re i n a n i t r o g e n a t m o s p h e r e , was used as t h e GPC c a r r i e r s o l v e n t . A f l o w r a t e of 1 m l p e r
66
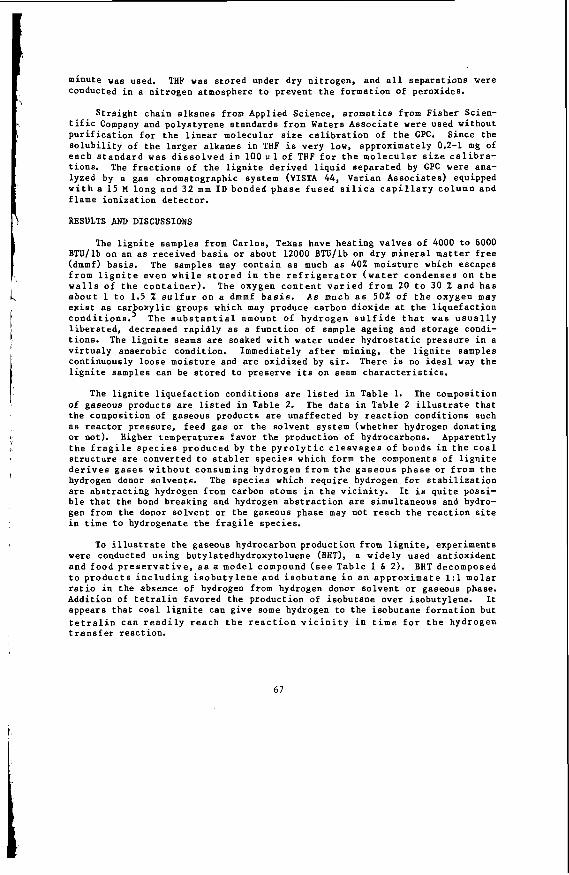
minute was used. THF was s tored under dry n i t rogen , and a l l s e p a r a t i o n s were conducted i n a n i t r o g e n atmosphere t o prevent t h e format ion of peroxides.
S t r a i g h t cha in a lkanes from Applied Science, a r o m a t i c s from F i s h e r Scien- t i f i c Company and polys tyrene s tandards from Waters Assoc ia te were used wi thout p u r i f i c a t i o n f o r t h e l i n e a r molecular s i z e c a l i b r a t i o n of t h e GPC. S ince t h e s o l u b i l i t y of t h e l a r g e r a lkanes i n THF i s very low, approximately 0.2-1 mg of e a c h s t a n d a r d was d i s s o l v e d i n 100 p 1 of THF f o r t h e m o l e c u l a r s i z e c a l i b r a - t ions . The f r a c t i o n s of t h e l i g n i t e der ived l i q u i d separa ted by GPC were ana- lyzed by a gas chromatographic system (VISTA 44, Varian Assoc ia tes ) equipped w i t h a 1 5 M l o n g a n d 3 2 m m I D bonded p h a s e f u s e d s i l i c a c a p i l l a r y co lumn and f lame i o n i z a t i o n de tec tor .
RESULTS AND DISCUSSIONS
The l i g n i t e samples from Carlos , Texas have h e a t i n g v a l v e s of 4000 t o 6000 BTU/lb on an a s rece ived b a s i s or about 12000 BTU/lb on dry m i n e r a l m a t t e r f r e e (dmmf) bas i s . The samples may conta in a s much as 40% mois ture which escapes f r o m l i g n i t e even w h i l e s t o r e d i n t h e r e f r i g e r a t o r ( w a t e r c o n d e n s e s on t h e w a l l s of t h e c o n t a i n e r ) . The oxygen c o n t e n t v a r i e d f r o m 20 t o 30 % a n d h a s a b o u t 1 t o 1.5 X s u l f u r on a dmmf b a s i s . A s much a s 50% o f t h e oxygen may e x i s t a s car o x y l i c groups which may produce carbon d ioxide a t t h e l i q u e f a c t i o n condi t ions . ’ The s u b s t a n t i a l amount of hydrogen s u l f i d e t h a t was u s u a l l y l i b e r a t e d , decreased r a p i d l y a s a f u n c t i o n of sample ageing and s t o r a g e condi- t i o n s . The l i g n i t e seams a r e soaked w i t h water under h y d r o s t a t i c pressure i n a v i r t u a l y anaerobic condi t ion. Immediately a f t e r mining, t h e l i g n i t e samples cont inuously loose mois ture and a r e oxid ized by a i r . There i s no i d e a l way t h e l i g n i t e samples can be s t o r e d t o preserve i t s on seam c h a r a c t e r i s t i c s .
The l i g n i t e l i q u e f a c t i o n condi t ions a r e l i s t e d i n Table 1. The composi t ion of gaseous products a r e l i s t e d in Table 2. The d a t a i n Table 2 i l l u s t r a t e t h a t the composi t ion of gaseous products a r e unaf fec ted by r e a c t i o n condi t ions such a s r e a c t o r pressure, feed gas or t h e so lvent system (whether hydrogen donat ing or not). Higher tempera tures favor t h e product ion of hydrocarbons. Apparently t h e f r a g i l e s p e c i e s produced by t h e p y r o l y t i c c l e a v a g e s o f bonds i n t h e c o a l s t r u c t u r e a r e converted t o s t a b l e r s p e c i e s which form t h e components of l i g n i t e d e r i v e s g a s e s w i t h o u t consuming hydrogen f r o m t h e g a s e o u s p h a s e or f rom t h e hydrogen donor solvents . The s p e c i e s which r e q u i r e hydrogen f o r s t a b i l i z a t i o n a r e a b s t r a c t i n g hydrogen from carbon atoms i n t h e v i c i n i t y . It i s q u i t e possi- b l e t h a t the bond breaking and hydrogen a b s t r a c t i o n are s imul taneous and hydro- gen from the donor so lvent or t h e gaseous phase may not reach t h e r e a c t i o n s i te i n t i m e t o hydrogenate t h e f r a g i l e spec ies .
To i l l u s t r a t e t h e gaseous hydrocarbon product ion from l i g n i t e , experiments were conducted using butylatedhydroxytoluene (BHT), a wide ly used a n t i o x i d e n t and f o o d p r e s e r v a t i v e , a 8 a model compound ( s e e T a b l e 1 6 2). BHT decomposed t o p r o d u c t s i n c l u d i n g i s o b u t y l e n e a n d i s o b u t a n e i n a n a p p r o x i m a t e 1:l m o l a r r a t i o i n t h e absence of hydrogen from hydrogen donor s o l v e n t or gaseous phase. Addit ion of t e t r a l i n favored t h e product ion of i sobutane over isobutylene. It appears t h a t coa l l i g n i t e can g i v e some hydrogen t o the i sobutane format ion but t e t r a l i n can r e a d i l y r e a c h t h e r e a c t i o n v i c i n i t y i n t i m e f o r t h e hydrogen t r a n s f er r e a c t ion.
67
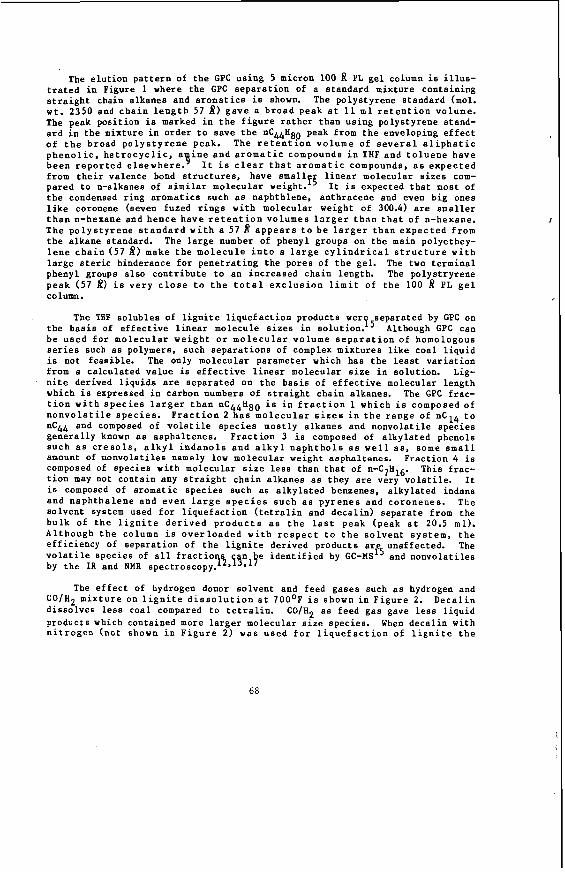
The e l u t i o n p a t t e r n of t h e GPC u s i n g 5 micron 100 PL g e l column is i l l u s - t r a t e d i n Figure 1 where t h e GPC s e p a r a t i o n of a s tandard mixture conta in ing s t r a i g h t chain a lkanes and aromat ics i s shown. The polys tyrene s tandard (mol. W t . 2350 and c h a i n l e n g t h 57 8 ) g a v e s b r o a d peak a t 11 m l r e t e n t i o n volume. The peak p o s i t i o n is marked i n t h e f i g u r e r a t h e r than u s i n g polys tyrene s tand- a r d i n t h e mixture i n order t o save t h e nC44H8p peak from t h e enveloping e f f e c t o f t h e broad p o l y s t y r e n e peak. The r e t e n t i o n volume of s e v e r a l a l i p h a t i c p h e n o l i c , h e t r o c y c l i c , a i n e a n d a r o m a t i c compounds i n THF and t o l u e n e h a v e b e e n r e p o r t e d e l s e w h e r e ? I t i s c l e a r t h a t a r o m a t i c compounds, a s e x p e c t e d from t h e i r valence bond s t r u c t u r e s , have s m a l l f f l i n e a r molecular s i z e s com- pared t o n-alkanes of s imilar molecular weight. I t is expected t h a t most of t h e condensed r i n g a romat ics such a8 naphthlene, an thracene and even b i g ones l i k e coronene (seven fuzed r i n g s w i t h molecular weight of 300.4) are s m a l l e r t h a n n - h e x a n e s n d h e n c e h a v e r e t e n t i o n v o l u m e s l a r g e r t h a n t h a t of n-hexane. The p o l y s t y r e n e s t a n d a r d w i t h a 57 8 a p p e a r s t o b e l a r g e r t h a n e x p e c t e d f r o m t h e a lkane s tandard. The l a r g e number of phenyl groups on t h e main polyethey- l e n e c h a i n (57 8) make t h e m o l e c u l e i n t o a l a r g e c y l i n d r i c a l s t r u c t u r e w i t h l a r g e s t e r i c hinderance f o r p e n e t r a t i n g t h e pores of t h e gel . The two t e r m i n a l phenyl groups a l s o c o n t r i b u t e t o an increased cha in length. The polys t ryrene p e a k (57 8) i s v e r y c l o s e t o t h e t o t a l e x c l u s i o n l i m i t of t h e 100 8 PL g e l column .
The THF s o l u b l e s of l i g n i t e l i q u e f a c t i o n products werf5separated by GPC on t h e b a s i s of e f f e c t i v e l i n e a r molecule s i z e s i n so lu t ion . Although GPC can be u s e d f o r m o l e c u l a r w e i g h t o r m o l e c u l a r vo lume s e p a r a t i o n o f homologous s e r i e s such a s polymers. such s e p a r a t i o n s of complex m i x t u r e s l i k e c o a l l i q u i d i s not feas ib le . The only molecular parameter which has t h e l e a s t v a r i a t i o n from a ca lcu la ted v a l u e is e f f e c t i v e l i n e a r molecular s i z e i n so lu t ion . Lig- n i t e der ived l i q u i d s are separa ted on t h e b a s i s of e f f e c t i v e molecular length which i s expressed i n carbon numbers of s t r a i g h t c h a i n alkanes. The GPC f rac- t i o n w i t h s p e c i e s l a r g e r t h a n nC44H80 i s i n f r a c t i o n 1 which i s composed of n o n v o l a t i l e s p e c i e s . F r a c t i o n 2 h a s m o l e c u l a r s i z e s i n t h e r a n g e of nC14 t o nC44 and composed of v o l a t i l e s p e c i e s most ly a lkanes and n o n v o l a t i l e s p e c i e s g e n e r a l l y known a s asphal tenes . F r a c t i o n 3 i s composed of a l k y l a t e d phenols s u c h as c r e s o l s , a l k y l i n d a n o l s a n d a l k y l n a p h t h o l s a s w e l l as, some s m a l l amount of n o n v o l a t i l e s namely low molecular weight asphal tenes . F r a c t i o n 4 i s composed of spec ies w i t h molecular s i z e l e s s than t h a t of n-C7H16. This f rac- t i o n may not conta in any s t r a i g h t c h a i n a lkanes as they a r e very v o l a t i l e . I t i s composed of a romat ic s p e c i e s such a s a l k y l a t e d benzenes, a l k y l a t e d indans and n a p h t h a l e n e and even l a r g e s p e c i e s s u c h a s p y r e n e s and coronenes . The so lvent system used f o r l i q u e f a c t i o n ( t e t r a l i n and d e c a l i n ) separa te from t h e b u l k of t h e l i g n i t e d e r i v e d p r o d u c t s as t h e l a s t peak (peak a t 20.5 ml). A l t h o u g h t h e column i s o v e r l o a d e d w i t h r e s p e c t t o t h e s o l v e n t s y s t e m , t h e e f f i c i e n c y of s e p a r a t i o n of t h e l i g n i t e der ived products a r unaffected. The v o l a t i l e spec ies of all f r a c t i o y2,(iytlve s i d e n t i f i e d by GC-MS' and n o n v o l a t i l e s by t h e I R and NHR spectroscopy.
The e f f e c t of hydrogen donor s o l v e n t and feed gases such a s hydrogen and C O / H z m i x t u r e on l i g n i t e d i s s o l u t i o n a t 700°F i s shown i n F i g u r e 2. D e c a l i n d i s s o l v e s l e s s coa l compared t o t e t r a l i n . CO/H2 a s feed gas gave l e s s l i q u i d products which contained more l a r g e r molecular s i z e species . When d e c a l i n w i t h n i t r o g e n ( n o t shown i n F i g u r e 2) was u s e d f o r l i q u e f a c t i o n of l i g n i t e t h e
68

I
!'
s p e c i e s a p p e a r i n g a t t o t a l s i z e e x c l u s s i o n l i m i t o f 100 1 g e l column were t o t a l l y a b s e n t . F i g u r e 3 shows G C s o f f r a c t i o n 2 s o f two l i g n i t e d e r i v e d l i q u i d s t o i l l u s t r a t e t h e r o l e of t h e h y d r o g e n donor s o l v e n t on a l k a n e pro- d u c t i o n . If t h e a l k a n e s a r e formed by b r e a k i n g of a l k y l c h a i n s f r o m o t h e r groups , t h e y a r e e x p e c t e d t o c o n t a i n more o l e f i n i c s p e c i e s i n t h e a b s e n c e of hydrogen donor s o l v e n t s such as t e t r a l i n . S ince t h e s p e c i e s i n f i g u r e 4 a and b are v e r y s imi la r , t h e r o l e hydrogen or hydrogen donor s o l v e n t p l a y s i n t h e product ion of a lkanes are l imi ted . Simple p y r o l y s i s can l i b e r a t e them from t h e coa l matrix. The a lkane may be e x i s t i n g a s f r e e w h i l e t rapped i n s i d e t h e pores or t h e i r p r e c u r s e r s a r e e i t h e r c a r b o x y l i c a c i d s or s p e c i e s w h i c h decompose during hea t ing t o produce a lkanes e a s i l y .
Figure 4 i l l u s t r a t e s t h e e f f e c t of r e a c t i o n t i m e on l iquefac t ion . F igures 5 and 6 show t h e l i q u e f a c t i o n o f l i g n i t e a t 750°F a n d 8OO0F u s i n g d i f f e r e n t f e e d g a s e s . Hydrogen t e n d s t o g i v e more p h e n o l s a n d a r o m a t i c s compared t o nitrogen. CO/HZ tends t o produce higher molecular s i z e s p e c i e s a t t h e expense of phenols and aromatics . A q u a l i t a t i v e e s t i m a t i o n of t h e so lvent systems can be obtained e s t i m a t i n g t h e wid th of t h e so lvent peak, and t h e a r e a of t h e rest of t h e GPC may g i v e t h e d i s s o l v e d p r o d u c t f rom l i g n i t e . The u s e of CO/Hz d i d n o t i n c r e a s e t h e t o t a l l i q u e f a c t i o n y i e l d w h i l e i t h a s d e c r e a s e d t h e t o t a l y i e l d of l i q u i d p r o d u c t s . The e x p e r i m e n t s u s i n g C O / H 2 g a v e l i q u i d p r o d u c t which a r e d i f f i c u l t t o f i l t e r through micro pore f i l t e r s compare t o t h e pro- duc ts obtained from experiments using e i t h e r n i t rogen o r hydrogen a s t h e feed gas. It could be assumed t h a t CO/H2 w i l l g ive a product which contained more l a r g e s i z e asphal tenes .
Based on our d a t a on l i g n i t e l i q u e f a c t i o n products y d v a r i o u s coa l l i q u i d s and t h e i r d i s t i l l a t e s , w e proposed a s t r u c t u r e f o r c o a l a s shown i n f i g u r e 7. The major s t r u c t u r a l c o n s t i t u e n t s of c o a l a r e der ived from t h r e e sources namely c e l l u l o s e , l i g n i n and o t h e r p l a n t components d i s p e r s e d i n t h e p l a n t t i s s u e s . The f i r s t two a r e polymers. The c o a l i f i c a t i o n process which i s most ly a deoxy- g e n a t i o n p r o c e s s , m i g h t n o t c r e a t e a s u f f i c i e n t l y l a r g e number of t e r t i a r y bonds needed f o r b i n d i n g v a r i o u s c o n s t i t u e n t s o f c o a l t o g e t h e r t o a s t r o n g t h r e e d iment iona l s t r u c t u r e . The coa ls inc luding l i g n i t e may have loose s t r u c - tures . The c e l l u l o s e der ived s t r u c t u r e s may have l a r g e pores i n which s p e c i e s s u c h a s l a r g e a l k a n e s c o u l d be t r a p p e d . A l t h o u g h low t e m p e r a t u r e (less t h a n 3OO0F) e x t r a c ions can e x t r a c t some s o l u b l e components of coa l , t h e a lkanes a r e
oxida t ion s t u d i e s do n o t d e t e c t l a r g e alkanes. The h igher tempera tures (above 650°F) can e i t h e r break t h e pore s t r u c t u r e s or t h e a lkanes can d i s t i l l o u t of t h e pores.
ACKNOWLEDGEMENTS
not l i b e r a t e d 5 except as s m a l l amount of carboxyl ic ac ids . The low tempera ture
The f i n a n c i a l s u p p o r t o f The Texas E n g i n e e r i n g E x p e r i m e n t S t a t i o n , The Texas A&M U n i v e r s i t y C e n t e r f o r Energy and M i n e r a l R e s o u r c e s , i s v e r y much appreciated. The l i g n i t e was suppl ied by TMPA, Carlos , Texas.
I'
69
I'
REFERENCES
1. S o n d r e a l , E. A., W i l s o n , W. G. and S t e r n b e r g , V. I. Puel 1982 61, 925.
2. Proceedings of Low-Rank Coal Technology Development Workshop, San Antonio,
3.
Texas June 17-18, 1981. P r o c e e d i n g s of t h e B a s i c C o a l S c i e n c e Workshop Hous ton , Texas , Dec. 8-9, 1981.
4. P h i l i p , C. V., B u l l i n , J. A. a n d Anthony, R. G., J- Chromatonr . Sci., 1979,= , 523.
5. 6.
7.
8.
9.
10.
11.
12.
P h i l i p , C. V., and Anthony, R. G., Fuel P r o c e s s i n g Technology, 1980.
P h i l i p , C. V., and Anthony, R. G., P r o c e e d i n g s Coal T e c h n o l o g y - 78, 2, ?In, P h i l i p , C. V., and Anthony, R. G., P r e p r i n t s ACS Org. Coat C Polvm. Div., 20 August (1980).
Z i n g a r o , R. A., P h i l i p , C. V., Anthony, R. G., and V i n d i o l a , A., Puel Processing Technolom (1981) 169.
P h i l i p , C. V. and Anthony, R. G., Am. Chem. SOC. Div. F u e l Chem. P r e p r i n t s 1979. 24(3) , 204.
P h i l i p , C. V., Z i n g a r o , R. A. a n d Anthony, R. G., Am. Chem. SOC. F u e l Chem. P r e p r i n t s 1980, 47.
P h i l i p , C. V., Z i n g a r o , R. A. a n d Anthony, R. G., ,"Upgrading of C o a l Liquids: ' (Ed. R. F. S u l l i v a n ) Am. Chem. SOC. Symp. Ser.. 1981, 1 5 6 , 239.
P h i l i p , C. V. and Anthony, R. G., Am. Chem. SOC. Div. F u e l Chem. P r e p r i n t s 1977, 22(5) 31.
13. P h i l i p , C. V. and Anthony, R. G., ."Organic C h e m i s t r y of Coal,," Am. Chem. - SOC. 1978, p. 258.
14. P h i l i p , C. V. and Anthony R. G., F u e l 1982, 61,351.
15. P h i l i p , C. V. and Anthony, R. G.. F u e l 1982. 6 1 357.
16. Farnum, S. A., Olson , E. S., Farnum, B. W., Wi lson , W. G., Am. Chem. SOC. --- Div. Fuel Chem. P r e p r i n t s 1980 25 245.
17. A c z e l , T., W i l l i a m s , R. B., P a n c i r o v , R. J. a n d K a r c h m e r , J. H., "Chemica l P r o p e r t i e s of Synthoi l Products and Feeds", Report prepared for US Enegry Research and Development Adminis t ra t ion , FE8007. 1976.
S a i t o , K. and S u k a l s k i , W., Am. Chem. SOC. Div. F u e l Chem. P r e p r i n t s 1977, - 22(5) , 84.
18. B a l t i s b e r g e r , R. J., Klabunde. K. J., S t e r n b e r g , V. I., Woolsey, N. F.,
19. Whi te , C. M., S u l z , J. L. and S h a r k e y , Jr. A. C., N a t u r e 1970, 268, 620.
20. Pugmire , R. J., G r a n t , D. M., Z i l m , K. W., Anderson , L. L.. Oblad, A. G.
21.
a n d Wood, R. E. Fuel 1878, x ( 4 ) .
S e s h a d r i , K. S., Albangh, E. W. a n d Bacha, J. D., Fuel 1982, 61, 336.
70
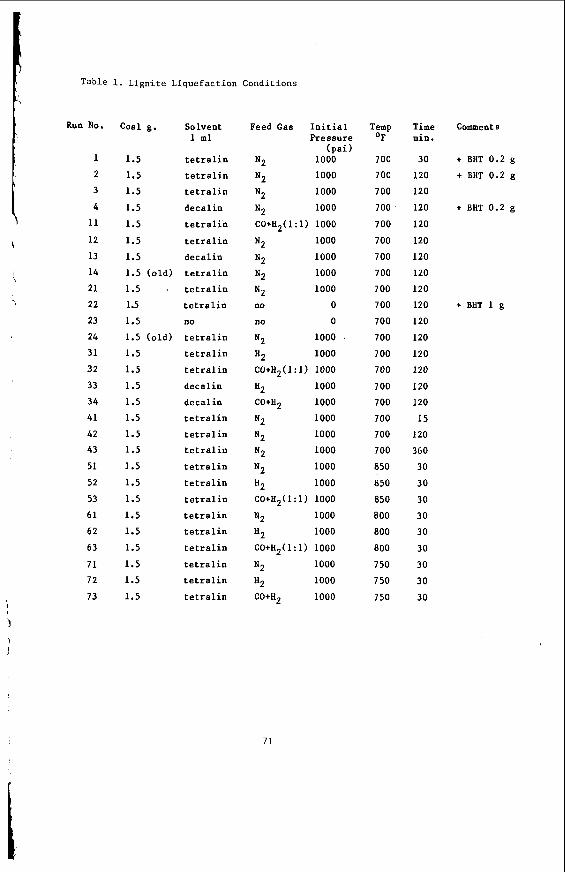
I
1 , i
Table 1. Lignite Liquefaction Conditions
Run No.
1 2 3
4 11 12 13 14 21 22 23 24 31 32 33 34 41 42 43 51 52 53 61 62 63
71 72 73
Coal g. Solvent 1 ml
1.5 t e t ral in 1.5 tetralin 1.5 tetralin 1.5 decalin 1.5 t e tral in 1.5 tetralin 1.5 decalin 1.5 (old) tetralin 1.5 4 tetralin 1.5 tetra 1 in 1.5 no 1.5 (old) tetralin 1.5 t e tral in 1.5 te t ralin 1.5 decalin 1.5 decalin 1.5 tetralin 1.5 tetral in 1.5 tetra 1 in 1.5 tetra 1 in 1.5 tetralin 1.5 tetral in 1.5 tetralin 1.5 tetralin 1.5 t e tralin 1.5 tetralin 1.5 tetralin 1.5 tetralin
Feed Gas Initial Pressure
(psi) N2 1000 N2 1000 N2 1000 N2 1000
N2 1000 N2 1000 N2 1000 N2 1000
CO+H2(1:1) 1000
no 0 no 0
N2 1000 '
H2 1000 cotn2(i:i) 1000
82 1000
N2 1000 N2 1000 N2 1000 N2 1000 H2 1000
N2 1000 H2 1000
N2 1000 H2 1000
COtH2 1000
COtH2(1:1) 1000
CO+H2(1:1) 1000
CO+H2 1000
Temp OF
700 7 00 700 700 7 00 700 700 700 700 700 700 700 700 700 700 700 700 700 700 850 850 850 800 800 800
750 7 50 7 50
Time min . 30 120 120 120 120 120 120 120
120 120 120 120 120 120 120 120 15 120 360
30 30 30 30 30 30 30 30 30
Comment 8
+ BHT 0.2 g
t BHT 0.2 g
+ BHT 0.2 g
+ BHT 1 g
\ 1
7 1
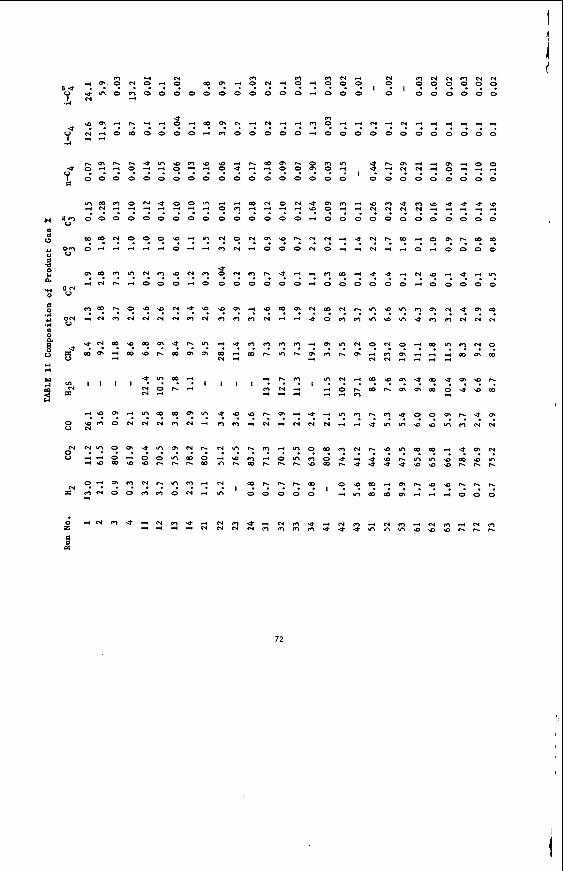
O - I N I? I? I ? - - N n r i ~ m N N 1 ? . ? ? ? 1 ? ? ? 1 ? ? ? ? ? ? ? ? 1 ? , ? ? ? ? ? ?
u u * * Y I O ~ O O O O O O o O O O O ~ O O O I N 0 0 0 0 0 0 0 .rl
I
I
72
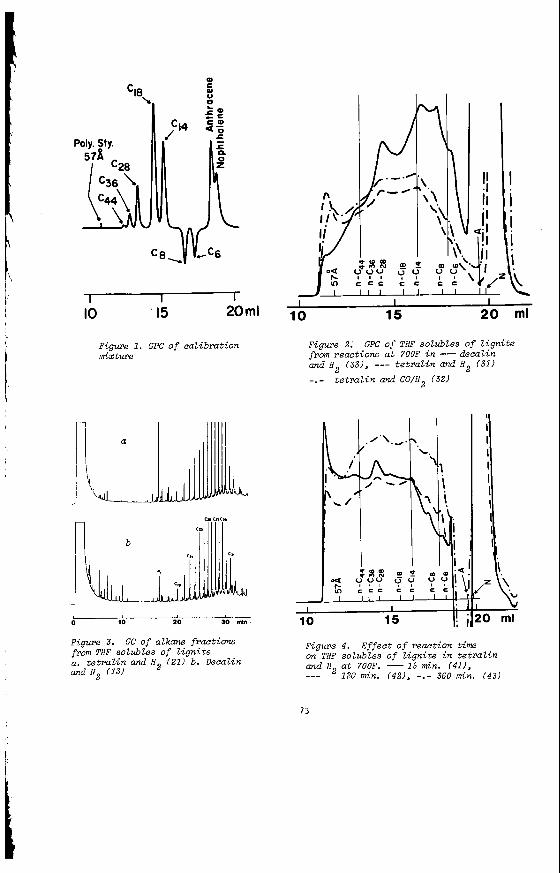
- 10 15 20ml
Figure 1. GPC o f cat ibmtion mixture
0 10 20 30 mln
Figure 3. from THF solubles o f l igni te a. t e t m l i n and H2 (21 ) b. Decalin and N 2 (13)
GC of alkane fractions
I' ll . I
I I I 10 15 20 ml
Figure 2: from reactions a t 700F i n - decatin and H (331, --- t e t ra l in and H2 (31) -.- t e t m l i n and CO/H2 (321
GPC of THF solubles of l igni te
2
I I I: I 10 15 1; I 20 ml
Figure 4 . on THF solubles of l igni te i n t e t ra t in and H2 a t 700F. - IS min. (411, _ _ _ 120 min. (42/ , -.- 360 min. (431
Effect of reaction time
73
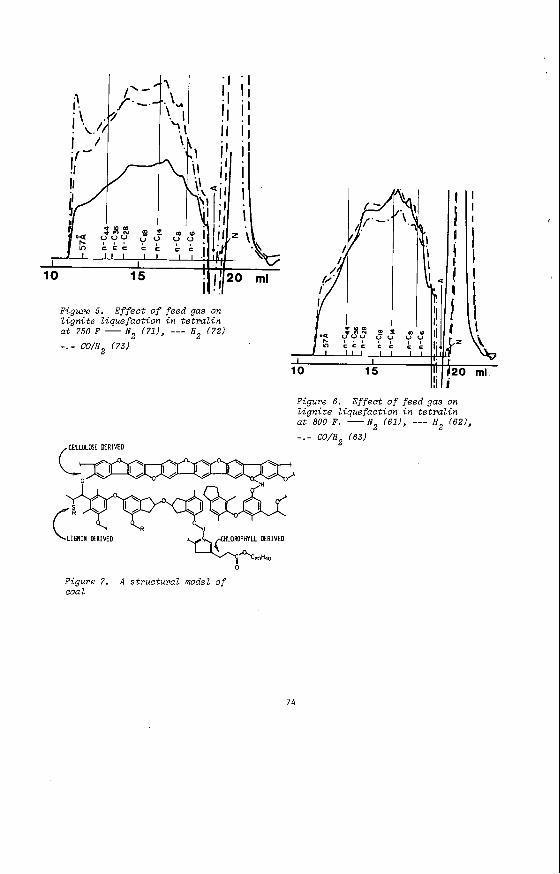
Figure 5. Ef fect o f feed gas on l igni te liquefaction i n te t ra l in a t 750 F - N e (71), --- H 2 ( 7 2 )
-.- CO/H2 173) I I l l I 1 ( I
I 10
!i
I I I I
I I
k Figure 6 . Effect of feed gas on l ign i te liquefaction in t e t ra l in a t 800 F. - N2 (611, --- H Z (621,
-.- CO/H2 (63) ELLULME DERIVED
0
Figure 7. coa 1
A structural model of
74
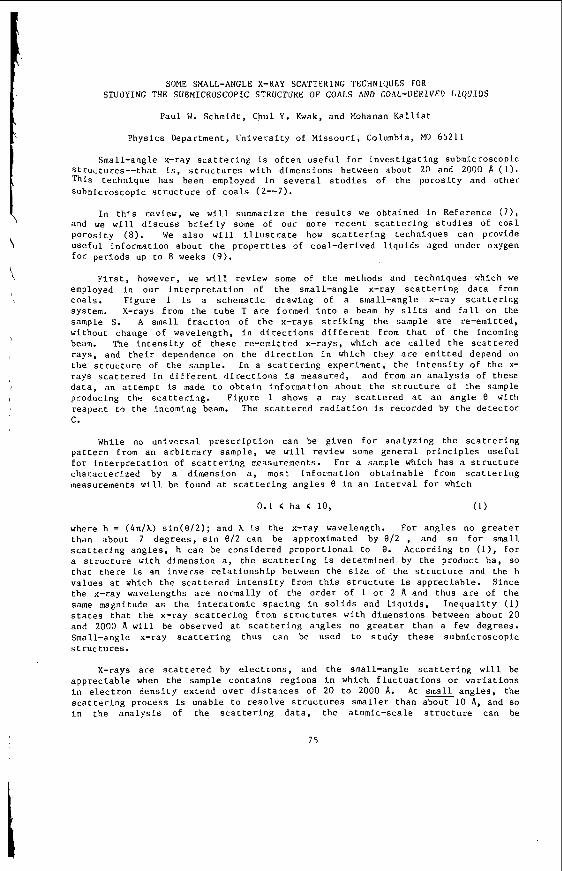
SOME SINALL-ANGLE X-RAY SCATTEKING TECHNIQUES FOR STUDYING THE SUBMICROSCOPIC STRUCTUKW OF COALS AND COAL-DEKIVED LIQUIDS
Paul W. Schmidt, Chul Y. Kwak, and Mohanan K a l l i a t
Phys ics Department, U n i v e r s i t y of H i s s o u r i , Columbia, MO 65211
Small-angle x-ray s c a t t e r i n g is o f t e n u s e f u l f o r i n v e s t i g a t i n g subatcroscopic s t r u c t u r e s - - t h a t 1s. s t r u c t u r e s w i t h dimensions between about 20 and 2000 A ( 1 ) . This technique has been employed in s e v e r a l s t u d i e s of t h e p o r o s i t y and o t h e r submicroscopic s t r u c t u r e of c o a l s ( 2 - - 7 ) .
In t h i s review, w e w i l l summarize t h e r e s u l t s we obta ined i n Reference (71, and we w i l l d i s c u s s b r i e f l y some of our more r e c e n t s c a t t e r i n g s t u d i e s of c o a l p o r o s i t y (8) . We a l s o w i l l i l l u s t r a t e how s c a t t e r i n g techniques can provide u s e f u l i n f o r m a t i o n about t h e p r o p e r t i e s of coa l -der lved l i q u i d s aged under oxygen f o r p e r i o d s up t o 8 weeks (9 ) .
F i r s t , however, w e w i l l r ev iew some of t h e methods and techniques which w e employed i n o u r i n t e r p r e t a t i o n of t h e small-angle x-ray s c a t t e r i n g d a t a from c o a l s . F igure 1 is a schemat tc drawing of a small-angle x-ray s c a t t e r i n g system. X-rays from t h e tube T a r e formed i n t o a beam by s l i t s and f a l l on the sample S. A s m a l l f r a c t t o n of t h e x-rays s t r i k i n g t h e sample a r e re-emitted, wi thout change of wavelength , i n d i r e c t i o n s d i f f e r e n t from t h a t of t h e incoming beam. The i n t e n s i t y of t h e s e re -emi t ted x-rays, which a r e c a l l e d t h e s c a t t e r e d rays , and t h e i r dependence on t h e d i r e c t i o n in which they are e m i t t e d depend on tlie s t r u c t u r e of t h e sample. I n a s c a t t e r i n g exper iment , t h e i n t e n s i t y of t h e x- rays s c a t t e r e d i n d i F f e r e n t d i r e c t i o n s is measured, and from a n a n a l y s i s of these d a t a , an a t tempt is made t o o b t a i n i n f o r m a t i o n about t h e s t r u c t u r e of t h e sample producing t h e s c a t t e r i n g . F i g u r e 1 shows a ray s c a t t e r e d a t a n a n g l e 8 with r e s p e c t t o t h e incomtng beam. The s c a t t e r e d r a d i a t i o n i s recorded by t h e d e t e c t o r C.
While no u n i v e r s a l p r e s c r i p t i o n can be g iven f o r a n a l y z i n g t h e s c a t t e r i n g p a t t e r n from an a r b i t r a r y sample, we w i l l review some g e n e r a l p r i n c i p l e s u s e f u l f o r i n t e r p r e t a t i o n of s c a t t e r i n g measurements. For a sample which has a s t r u c t u r e c h a r a c t e r t z e d by a dimension a , most i n f o r m a t i o n o b t a i n a b l e from s c a t t e r i n g measurements w i l l be found a t s c a t t e r i n g a n g l e s 8 i n a n i n t e r v a l f o r which
0.1 < ha < 10, (1)
where h = (4n/A) s i n ( 8 / 2 ) ; and A 1s t h e x-ray wavelength. For a n g l e s no g r e a t e r t h a n about 7 d e g r e e s , s i n 8/2 can be approximated by 8/2 , and s o f o r small s c a t t e r l n g a n g l e s , h can be cons idered p r o p o r t i o n a l t o 8. According t o ( l ) , f o r a s t r u c t u r e wi th dimension a , t h e s c a t t e r i n g i s determined by t h e product h a , so t h a t t h e r e is an i n v e r s e r e l a t i o n s h i p hetween t h e s i z e of t h e s t r u c t u r e and the h v a l u e s a t which t h e s c a t t e r e d i n t e n s i t y from t h i s S t r u c t u r e 1s a p p r e c i a b l e . S ince t h e x-ray wavelengths a r e normally of t h e o r d e r of 1 o r 2 A and thus are of t h e same magnitude as t h e i n t e r a t o m i c spac ing i n s o l i d s and l i q u i d s , I n e q u a l i t y (1) s t a t e s t h a t t h e x-ray s c a t t e r i n g from s t r i i c t u r e s wi th dimensions between about 20 and 2000 A w i l l be observed a t s c a t t e r i n g a n g l e s no g r e a t e r than a few degrees . Small-angle x-ray s c a t t e r i n g thus can be used t o s t u d y t h e s e submicroscopic s t r u c t u r e s .
X-rays are s c a t t e r e d by e l e c t r o n s , and t h e small-angle s c a t t e r i n g w i l l be a p p r e c i a b l e when t h e sample c o n t a i n s r e g i o n s i n which f l u c t u a t i o n s o r v a r i a t i o n s i n e l e c t r o n d e n s i t y ex tend o v e r d i s t a n c e s of 20 t o 2000 A. A t a n g l e s , t h e s c a t t e r i n g process is unable t o r e s o l v e s t r u c t u r e s smaller than about 10 A, and so i n t h e a n a l y s i s of t h e s c a t t e r i n g d a t a , t h e a tomic-sca le s t r u c t u r e can be
7 5
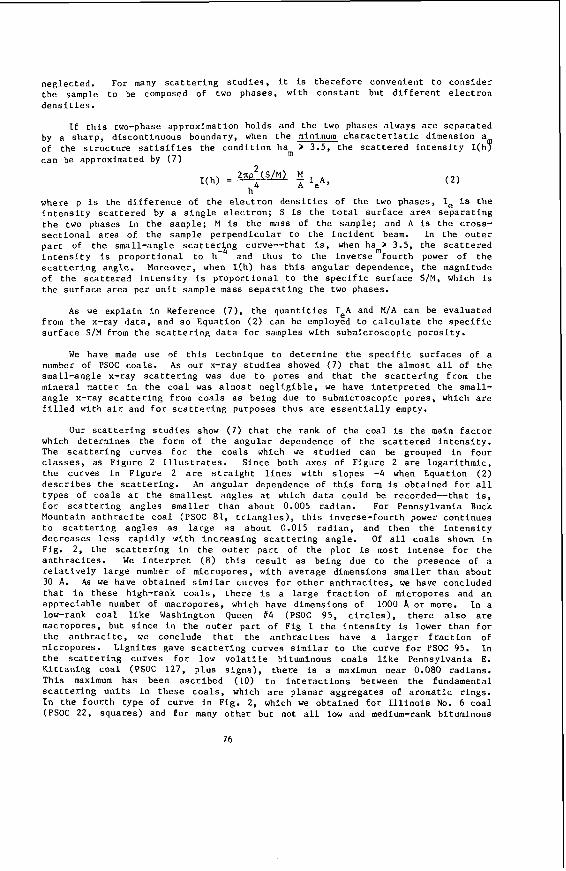
neg lec t ed . For many s c a t t e r i n g s t u d i e s , it i s t h e r e f o r e convenient t o c o n s i d e r t h e sample t o be composed of two phases , with c o n s t a n t but d i f f e r e n t e l e c t r o n d e n s i t i e s .
I f t h i s two-phase approximation h o l d s and t h e two phases always are s e p a r a t e d
> 3.5, t h e s c a t t e r e d i n t e n s i t y I ( h 7 by a s h a r p , d i scon t inuous boundary, when t h e minimum c h a r a c t e r i s t i c dimension a of the s t r u c t u r e s a t i s f f i e s t h e c o n d i t i o n ha c a n be approximated by ( 7 )
where p i s the d i f f e r e n c e of t h e e l e c t r o n d e n s i t i e s of t h e two phases , I, is t h e i n t e n s i t y s c a t t e r e d by a s i n g l e e l e c t r o n ; S is t h e t o t d l s u r f a c e a r e a s e p a r a t i n g t h e two phases i n t h e sample; M i s t h e mass of the sample; and A i s t h e c ros s - s e c t i o n a l a rea of t h e sample p e r p e n d i c u l a r t o t h e i n c i d e n t beam. In the o u t e r p a r t of t h e small-angle s c a t t e r ng cu rve - - tha t i s , when ha > 3.5, t h e s c a t t e r e d i n t e n s i t y i s p r o p o r t i o n a l t o h-' and t h u s t o t h e i n v e r s e m f o u r t h power of t h e s c a t t e r i n g ang le . Horeover , when I ( h ) h a s t h i s angu la r dependence, the magnitude of t h e s c a t t e r e d i n t e n s i t y i s p r o p o r t i o n a l t o t h e s p e c i f i c s u r f a c e S/M, which i s t h e s u r f a c e a r e a pe r u n i t sample mass s e p a r a t i n g the two phases .
A s we exp la in in Reference ( 7 ) , t h e q u a n t i t i e s I e A and M/A can be e v a l u a t e d from t h e x-ray d a t a , and s o Equat ion ( 2 ) can be employed t o c a l c u l a t e t h e s p e c i f i c s u r f a c e S/M from t h e s c a t t e r i n g d a t a For samples wi th submicroscopic p o r o s l t y .
We have made use of t h i s t echn ique t o de t e rmine t h e s p e c i f i c s u r f a c e s of a number of PSOC c o a l s . As our x-ray s t u d i e s showed ( 7 ) t h a t t h e almost a l l of t h e small-angle x-ray s c a t t e r i n g was due t o po res and t h a t t h e s c a t t e r i n g from t h e mine ra l m a t t e r i n t h e c o a l w a s a lmos t n e g l l g i b l e , we have i n t e r p r e t e d t h e small- a n g l e x-ray s c a t t e r i n g from c o a l s a s be ing due t o submicroscopic po res , which a r e f i l l e d w i t h a i r and f o r s c a t t e r i n g purposes t h u s a r e e s s e n t i a l l y empty.
Our s c a t t e r i n g s t u d i e s show ( 7 ) t h a t t h e rank of the c o a l is the main f a c t o r which determines t h e form of t h e a n g u l a r dependence of t h e s c a t t e r e d i n t e n s i t y . The s c a t t e r i n g c u r v e s f o r t h e c o a l s which we s t u d i e d can be grouped i n f o u r c l a s s e s , as F i g u r e 2 i l l u s t r a t e s . S ince both axes of F igu re 2 a r e l o g a r i t h m i c , t h e curves in F i g u r e 2 a r e 5 t r a l g h t l i n e s wi th s l o p e s -4 when Equat ion ( 2 ) d e s c r i b e s t h e s c a t t e r i n g . An a n g u l a r dependence of t h i s form i s ob ta ined f o r a l l types of c o a l s a t t h e s m a l l e s t a n g l e s a t which d a t a could be recorded--that i s , f o r s c a t t e r i n g a n g l e s s m a l l e r t han about 0.005 r a d i a n . For Pennsylvania Buck Mountain a n t h r a c i t e c o a l (PSOC 81, t r i a n g l e s ) , t h i s i n v e r s e - f o u r t h power c o n t i n u e s t o s c a t t e r i n g a n g l e s as l a r g e as about 0.015 r a d i a n , and then t h e i n t e n s i t y d e c r e a s e s less r a p i d l y wi th i n c r e a s i n g s c a t t e r i n g ang le . Of a l l c o a l s shown i n Fig. 2 , t h e s c a t t e r i n g i n t h e o u t e r p a r t of t h e p l o t is most i n t e n s e f o r t h e a n t h r a c i t e s . W e i n t e r p r e t ( 8 ) t h i s r e s u l t a s be ing due t o the p re sence of a r e l a t t v e l y l a r g e number of mic ropores , w i th ave rage dimensions s m a l l e r t han about 30 A. As we have o b t a i n e d similar cu rves f o r o t h e r a n t h r a c i t e s , we have concluded t h a t i n t h e s e high-rank c o a l s , t h e r e i s a l a r g e f r a c t i o n of micropores and an a p p r e c l a b l e number of macropores. which have dimensions of 1000 A o r more. In a low-rank coal l i k e Washington Queen t 4 (PSOC 95, c i r c l e s ) , t h e r e a l s o a r e macropores, but s i n c e in t h e o u t e r p a r t of Fig 1 t h e i n t e n s i t y is lower than f o r t h e a n t h r a c i t e , we conc lude t h a t t h e a n t h r a c l t e s have a l a r g e r f r a c t i o n of micropores . L i g n i t e s gave s c a t t e r i n g c u r v e s s i m i l a r t o t h e cu rve f o r PSOC 95. In t h e s c a t t e r i n g c u r v e s f o r low v o l a t i l e bi tuminous c o a l s l i k e Pennsylvania E. K i t t a n i n g c o a l (PSOC 1 2 7 , p l u s signs), t h e r e i s a maximum nea r 0.080 r a d i a n s . Th i s maximum h a s been a s c r i b e d ( 1 0 ) t o i n t e r a c t i o n s between t h e fundamental s c a t t e r i n g u n i t s i n t h e s e c o a l s , which a r e p l a n a r a g g r e g a t e s of a romat i c r i n g s . I n t h e f o u r t h type of curve in Fig. 2 , which we ob ta ined f o r I l l i n o i s No. 6 c o a l (PSOC 22, s q u a r e s ) and f o r many o t h e r b u t not a l l low and medium-rank bi tuminous
76
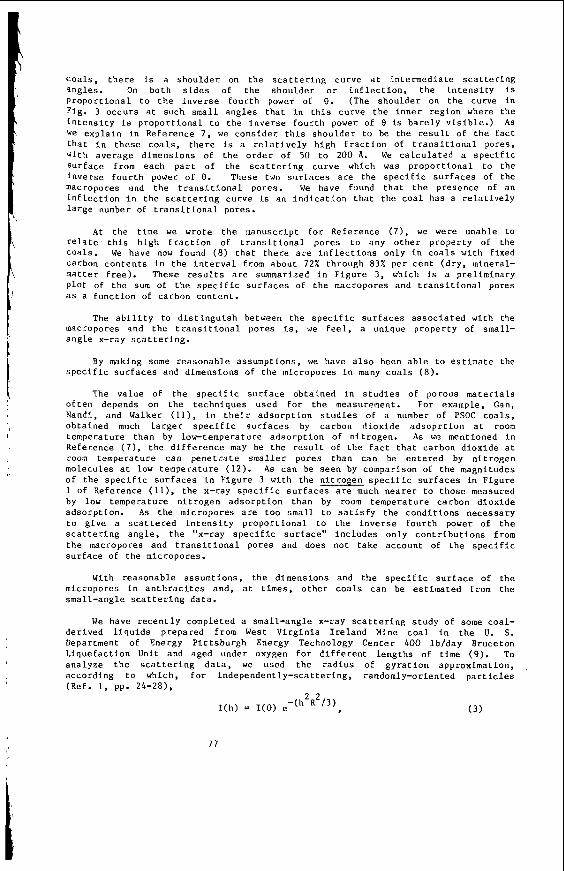
Coals , t h e r e is a s h o u l d e r on t h e s c a t t e r i n g curve a t h t e r m e d i a t e s c a t t e r i n g angles . On b o t h s i d e s of t h e s h o u l d e r or i n f l e c t i o n , t h e l n t e n s i t y is p r o p o r t i o n a l t o t h e i n v e r s e f o u r t h power of 8. (The s h o u l d e r on t h e curve i n Fig. 3 o c c u r s a t such small a n g l e s t h a t i n t h i s curve t h e i n n e r r e g i o n where t h e i n t e n s i t y i s p r o p o r t i o n a l t o t h e i n v e r s e f o u r t h power of 8 is b a r e l y v i s i b l e . ) A s we e x p l a i n in Reference 7 , we c o n s i d e r th . ls s h o u l d e r t o be the r e s u l t of t h e fact t h a t i n t h e s e c o a l s , t h e r e is a r e l a t i v e l y h i g h E r a c t l o n of t r a n s i t i o n a l pores , With average dimensions of t h e o r d e r of 50 t o 200 A . We c a l c u l a t e d a s p e c i f i c Sur face from each p a r t of the s c a t t e r i n g curve which was p r o p o r t i o n a l t o t h e i n v e r s e f o u r t h power of 8. These two s u r f a c e s a r e t h e s p e c i f i c s u r f a c e s of t h e macropores and t h e t r a n s i t i o n a l pores. We have found t h a t t h e presence of an i n f l e c t i o n in t h e s c a t t e r i n g curve is an i n d i c a t i o n t h a t t h e c o a l has a r e l a t i v e l y l a r g e number of t r a n s i t i o n a l pores .
A t t h e t i m e we wrote t h e manuscr ip t f o r Reference (7 ) , we were unable t o r e l a t e t h i s h igh f r a c t i o n of t r a n s i t i o n a l pores t o any o t h e r p r o p e r t y of the c o a l s . We have now found ( 8 ) t h a t t h e r e a r e i n f l e c t i o n s o n l y i n c o a l s w i t h f ixed carbon c o n t e n t s -In t h e i n t e r v a l from about 72% through 83% p e r c e n t ( d r y , mineral- m a t t e r f r e e ) . These resul ts a r e summarized i n F i g u r e 3, whlch is a p r e l i m i n a r y p l o t of t h e sum of t h e s p e c i f l c s u r f a c e s of t h e maccopores and t r a n s i t i o n a l pores a s a f u n c t i o n of carbon c o n t e n t .
The a b i l i t y t o d i s t l n g u i s h between t h e s p e c i f i c s u r f a c e s a s s o c i a t e d wi th the maccopores and t h e t r a n s i t i o n a l pores is , we f e e l , a unique p r o p e r t y of small- a n g l e x-ray s c a t t e r i n g .
By making some r e a s o n a b l e assumpt ions , we have a l s o been a b l e t o e s t i m a t e the s p e c i f i c s u r f a c e s and dimensions o f t h e micropores i n many c o a l s ( 8 ) .
The va lue of t h e s p e c i f i c s u r f a c e o b t a i n e d i n s t u d i e s of porous m a t e r i a l s o f t e n depends on t h e t e c h n i q u e s used f o r t h e measurement. For example, Gan, Nandi, and Walker ( l l ) , in t h e i r a d s o r p t i o n s t u d i e s of a number of PSOC c o a l s , o b t a i n e d much l a r g e r s p e c i f i c s u r f a c e s by carbon d i o x i d e a d s o p r t i o n a t room tempera ture t h a n by low-temperature a d s o r p t i o n of n i t r o g e n . A s w e mentioned in Reference (7), t h e d i E f e r e n c e may be t h e r e s u l t of t h e f a c t t h a t carbon d i o x i d e a t room t empera ture c a n p e n e t r a t e s m a l l e r pores than can be e n t e r e d by n i t r o g e n molecules a t low tempera ture (12) . A s can be seen by comparison of t h e magnitudes of t h e s p e c i f i c s u r f a c e s I n F i g u r e 3 with t h e n i t r o g e n s p e c i f i c s u r f a c e s i n F i g u r e 1 of Reference ( I I ) , t h e x-ray s p e c i f i c s u r f a c e s a r e much n e a r e r t o t h o s e measured by low tempera ture n i t r o g e n a d s o r p t i o n than by room tempera ture carbon d i o x i d e a d s o r p t i o n . As t h e micropores are t o o small t o s a t i s f y t h e c o n d i t i o n s n e c e s s a r y t o g i v e a s c a t t e r e d L n t e n s i t y p r o p o r t i o n a l t o t h e i n v e r s e f o u r t h power of t h e s c a t t e r i n g a n g l e , t h e "x-ray s p e c i f i c s u r f a c e " i n c l u d e s o n l y c o n t r i b u t i o n s from t h e macropores and t r a n s i t i o n a l pores and does not t a k e account OE t h e s p e c i f i c s u r f a c e of t h e micropores .
With reasonable assumt ions , t h e dimensions and t h e s p e c i f i c s u r f a c e of t h e micropores i n a n t h r a c f t e s and, a t times, o t h e r c o a l s can be e s t i m a t e d from t h e smal l -angle s c a t t e r i n g d a t a .
We have r e c e n t l y completed a small-angle x-ray s c a t t e r i n g s t u d y of some coa l - d e r i v e d l i q u i d s prepared from West V i r g i n i a I r e l a n d Mine c o a l in t h e U. S. Department of Energy P i t t s b u r g h Energy Technology C e n t e r 400 l b / d a y Bruceton L i q u e f a c t i o n Unit and aged under oxygen f o r d i f f e r e n t l e n g t h s of time (9). To a n a l y z e t h e s c a t t e r i n g d a t a , we used t h e r a d i u s of g y r a t i o n approximat ion , accord ing t o which, f o r i n d e p e n d e n t l y - s c a t t e r i n g , randomly-oriented p a r t i c l e s (Ref. 1, pp. 24-28),
2 2 I ( h ) = I(0) e-(h '3), ( 3 )
77
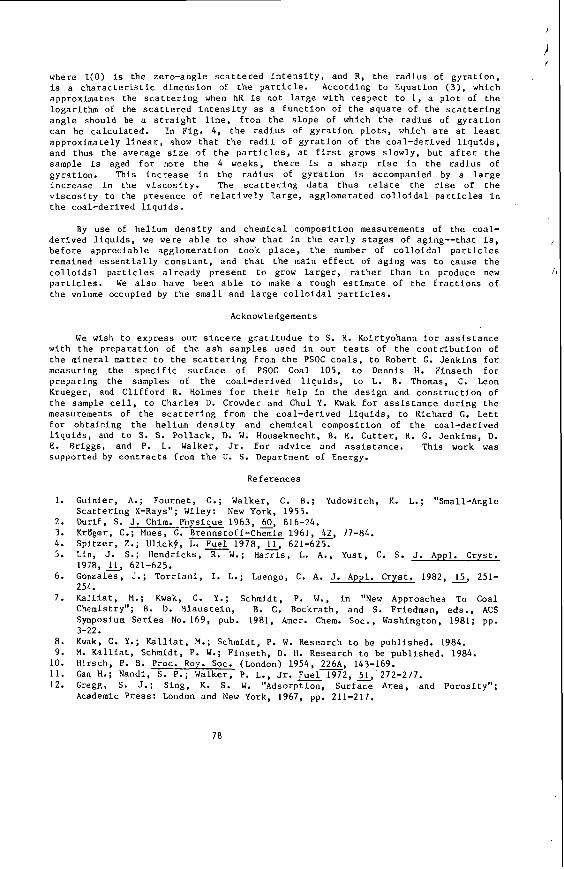
where T(0) is t h e zero-angle s c a t t e r e d i n t e n s i t y , and R, t h e r a d i u s oE g y r a t i o n , i s a c h a r a c t e r i s t i c dimension of t h e p a r t i c l e . According t o Equat ion ( 3 ) , which approximates the s c a t t e r i n g when hR i s not l a r g e wi th r e s p e c t t o 1, a p l o t of t h e logar i thm of t h e s c a t t e r e d i n t e n s i t y a s a f u n c t i o n of t h e s q u a r e of t h e s c a t t e r i n g a n g l e should be a s t r a i g h t l l n e , from t h e s l o p e of which t h e radLus of gyratLon can be c a l c u l a t e d . I n F ig . 4 , t h e r a d i u s of g y r a t i o n p l o t s , which a r e a t l e a s t approximate ly l i n e a r , show t h a t t h e r a d i i of g y r a t i o n of t h e coal-derived l i q u i d s , and thus t h e a v e r a g e s i z e of t h e p a r t i c l e s , a t f i r s t grows s l o w l y , bu t a f t e r t h e sample i s aged f o r more t h e 4 weeks, t h e r e is a s h a r p r i s e i n t h e r a d i u s of g y r a t i o n . This Lncrease i n t h e r a d i u s of g y r a t i o n i s accompanied by d l a r g e :=crease i n t h e v i s c o s i t y . The s c a t t e r i n g d a t a t h u s r e l a t e the rise of t h e v i s c o s i t y t o t h e presence of r e l a t i v e l y l a r g e , agglomerated c o l l o i d a l p a r t i c l e s i n t h e coal-derived l i q u i d s .
By use of helium d e n s i t y and chemica l composi t ion measurements of t h e c o a l - d e r i v e d l i q u i d s , w e were a b l e t o show t h a t i n t h e e a r l y s t a g e s of aging--that i s , b e f o r e d p p r e L l a b k agglomera t ion took p l a c e , t h e number of c o l l o i d a l p a r t i c l e s remained e s s e n t i a l l y c o n s t a n t , and t h a t t h e main e l f e c t of a g i n g was t o cause t h e c o l l o i d a l p a r t i c l e s a l r e a d y p r e s e n t t o grow l a r g e r , r a t h e r t h a n t o produce new p a r t i c l e s . We a l s o have been a b l e t o make a rough e s t i m a t e of t h e f r a c t i o n s of t h e volume occupied by t h e small and l a r g e c o l l o i d a l p a r t i L l e s .
Acknowledgements
We w i s h t o e x p r e s s our s i n c e r e g r a t i t u d u e t o S . R. Koirtyohann f o r a s s i s t a n c e wi th t h e p r e p a r a t i o n of t h e a s h samples used in our tests of t h e c o n t r i b u t i o n of t h e minera l matter to t h e s c a t t e r i n g from t h e PSOC c o a l s , to Robert G. J e n k i n s f o r measuring t h e s p e c i f i c s u r f a c e of PSOC Coal 105, t o Dennis H. F i n s e t h f o r p r e p a r i n g t h e samples of t h e coa l -der ived l i q u i d s , t o L. B. Thomas, C. Leon Krueger, and C l i f f o r d R. Holmes f o r t h e i r h e l p in t h e d e s i g n and c o n s t r u c t i o n of t h e sample c e l l , t o Char les D. Crowder and Chul Y. Kwak f o r a s s i s t a n c e d u r i n g t h e measurements of the s c a t t e r i n g from t h e coa l -der ived l i q u i d s , t o Richard G. L e t t f o r o h t a i n i n g t h e he l ium d e n s i t y and chemica l composi t ion of t h e coa l -der ived l i q u i d s , and t o S . S . P o l l a c k . D. W. Houseknecht, B. E. C u t t e r , R. G. J e n k i n s , D. E. Briggs , and P. L. Walker, Jr. fo r a d v i c e and a s s i s t a n c e . This work was suppor ted by c o n t r a c t s f rom t h e U. S. Department of Energy.
1.
2 . 3 . 4. 5.
6.
7.
8. 9.
10. 11. 12 .
References
G u i d e r , A.; Fourne t , G. ; Walker, C. B.; Yudowitch, K. L.; "Small-Angle S c a t t e r i n g X-Rays"; Wiley: New York, 1955. Durif. S. J. Chim. Physique 1963, 60, 816-24. KrMger, C . m r B r e n n s t o f f - C h G i e 1961, 2, 77-84. S p i t z e r , Z.; U l i c k f , L. 3 1978, &, 621-625. Lin, J. S.; Hendricks, R. W. ; Harris, L. A., Yus t , C. S . J. Appl. Crys t . 1978, L, 621-625. Gonzales, J . ; T o r r i a n i , I. L.; Luengo, C. A. J. Appl. Crys t . 1982, 15, 251- 254. Kalliat, M.; Kwak, C. Y . ; Schmidt, P. W., i n "New Approaches To Coal Chemistry"; 6. D. R l a u s t e i n , B. C. Bockrath, and S. Friedman, e d s . , ACS Symposium S e r i e s No. 169, pub. 1981, Amer. Chem. SOC., Washington, 1981; pp. 3-22. Kwak, C. Y.; Kalliat, M.; Schmidt, P. W. Research t o be publ i shed . 1984. M. Kall iat . Schmidt, P. W.; F i n s e t h , D. H. Research t o be publ i shed . 1984. Hirsch, P. 6. Proc. Roy. SOC. (London) 1954, 2268, 143-169. Can H.; Nandi, S. e . ; Walker, P. L., Jr. s m 2 , & 272-277. Gregg, S. J.; Sing , K. S. W. "Adsorption, S u r f a c e Area, and Poros i ty" ; Academic P r e s s : London and New York, 1967, pp. 211-217.
78
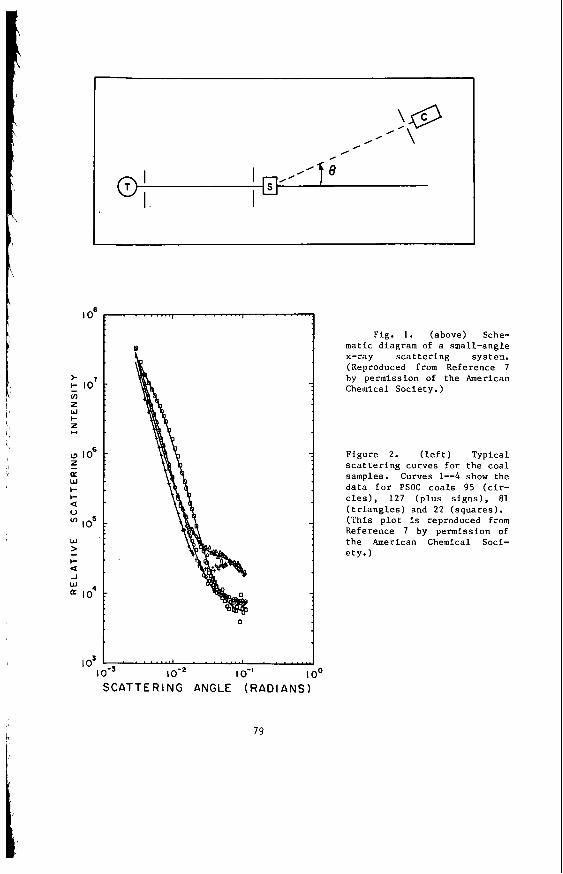
E IO' In z W I- z I
0 IO" j z a W I- I-
V a
~ lo5
W > I-
J W
- a
IO' j
I o3 I . . . . . . . ., . . . . . . IO-^ lo-' IO0
SCATTERING ANGLE (RADIANS)
Fig. 1 . (above) Sche- m a t i c diagram of a small-angle x-ray s c a t t e r i n g system. (Reproduced from Reference 7 by permissLon of t h e American Chemical S o c i e t y . )
F i g u r e 2 . ( l e f t ) Typ ica l s c a t t e r i n g cu rves f o r t h e c o a l samples . Curves 1--4 show the d a t a f o r PSOC c o a l s 95 ( c i r - c l e s ) , 1 2 7 ( p l u s s i g n s ) , 81 ( t r i a n g l e s ) and 2 2 ( s q u a r e s ) . ( T h i s p l o t is reproduced from Refe rence 7 by pe rmis s ion of t h e American Chemical Soci- e t y . 1
79
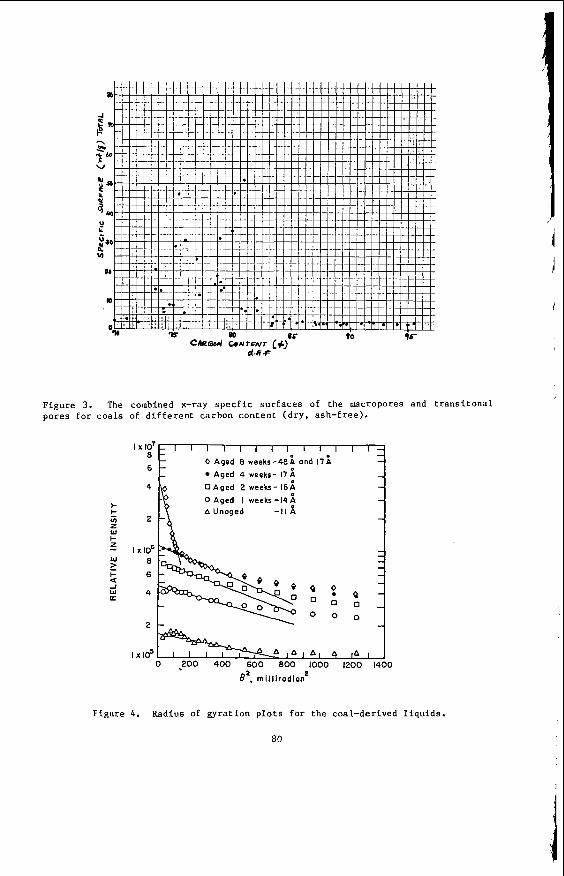
Figure 3 . The pores f o r c o a l s
combined x-ray s p e c f i c sur faces of the macropores and trans i tona l of d i f f e r e n t carbon content (dry , ash-Lree).
8 - 6 - - 0 Aged 8 weeks-48; and 17;
Aged 4 weeks- 17A - O A g e d 2 weeks- 16A
0 Aged I weeks -145 AUnaged - 1 1 A ' R 2
I X106
8
6
4
2
I X I O ~ 0 -200 400 600 800 1000 1200 1400
8'. milliradion'
Figure 4 . Radius of gyrat ion p l o t s f o r the coal-derived l i q u i d s .
80
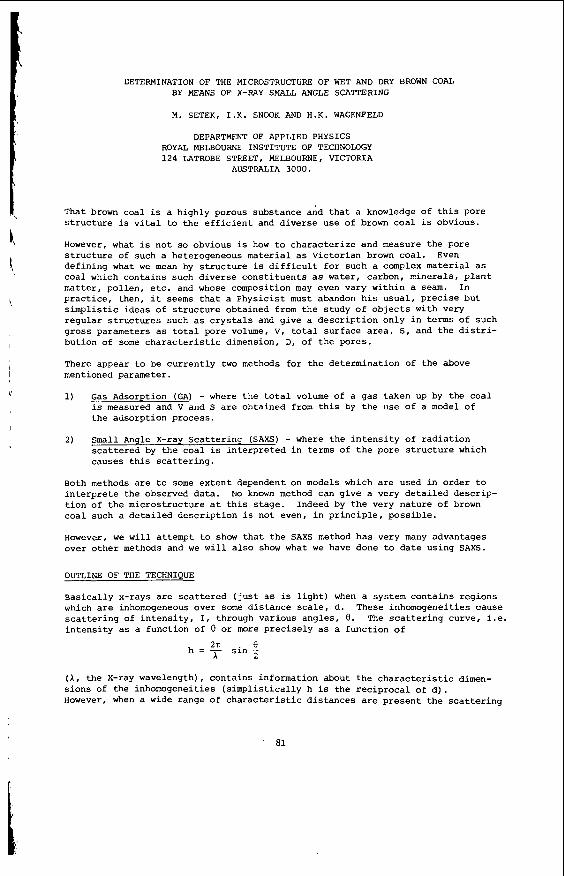
DETERMINATION OF THE MICROSTRUCTURE OF WET AND DRY BROWN COAL BY MEANS OF X-RAY SMALL ANGLE SCATTERING
M. SCTEK, I.K. SNOOK AND H.K. WAGENFELD
DEPARTMENT OF APPLIED PHYSICS ROYAL MELBOURNE INSTITUTE OF TECHNOLOGY 124 LATROBE STREET, MELBOURNE, VICTORIA
AUSTRALIA 3000.
That brown coal is a highly porous substance aAd that a knowledge of this pore structure is vital to the efficient and diverse use of brown coal is obvious.
However, what is not so obvious is how to characterize and measure the pore structure of such a heterogeneous material as Victorian brown coal. defining what we mean by structure is difficult for such a complex material as coal which contains such diverse constituents as water, carbon, minerals, plant matter, pollen, etc. and whose composition may even vary within a seam. In practice, then, it seems that a Physicist must abandon his usual, precise but simplistic ideas of structure obtained from the study of objects with very regular structures such as crystals and give a description only in terms of such gross parameters as total pore volume, V, total surface area, S , and the distri- bution of some characteristic dimension, D, of the pores.
There appear to be currently two methods for the determination of the above mentioned parameter.
1)
Even
Gas Adsorption (GA) - where the total volume of a gas taken up by the coal is measured and V and S are obtained from this by the use of a model of the adsorption process.
2) Small Angle X-ray Scattering (SAXS) - where the intensity of radiation scattered by the coal is interpreted in terms of the pore structure which causes this scattering.
Both methods are to some extent dependent on models which are used in order to interprete the observed data. tion of the microstructure at this stage. Indeed by the very nature of brown coal such a detailed description is not even, in principle, possible.
However, we will attempt to show that the SAXS method has very many advantages over other methods and we will also show what we have done to date using SAXS.
ho known method can give a very detailed descrip-
OUTLINE OF THE TECHNIQUE
Basically x-rays are scattered (just as is light) when a system contains regions which are inhomogeneous over some distance scale, d. These inhomogeneities cause scattering of intensity, I, through various angles, 8. The scattering curve, i.e. intensity as a function of 0 or more precisely as a function of
(1, the x-ray wavelength), contains information about the characteristic dimen- sions of the inhomogeneities (simplistically h is the reciprocal of a). However, when a wide range of characteristic distances are present the scattering
81
I
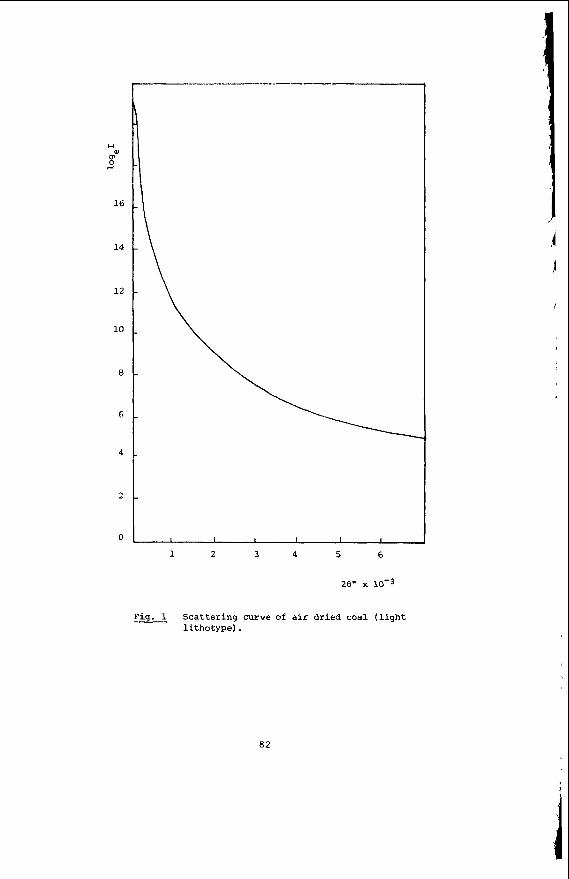
U
8 4
16
14
12
10
8
6
4
2
0
1 2 3 4 5 6
2eii x 10-3
F i g . 1 Scattering curve of a i r dried coal ( l i g h t l ithotype) .
82
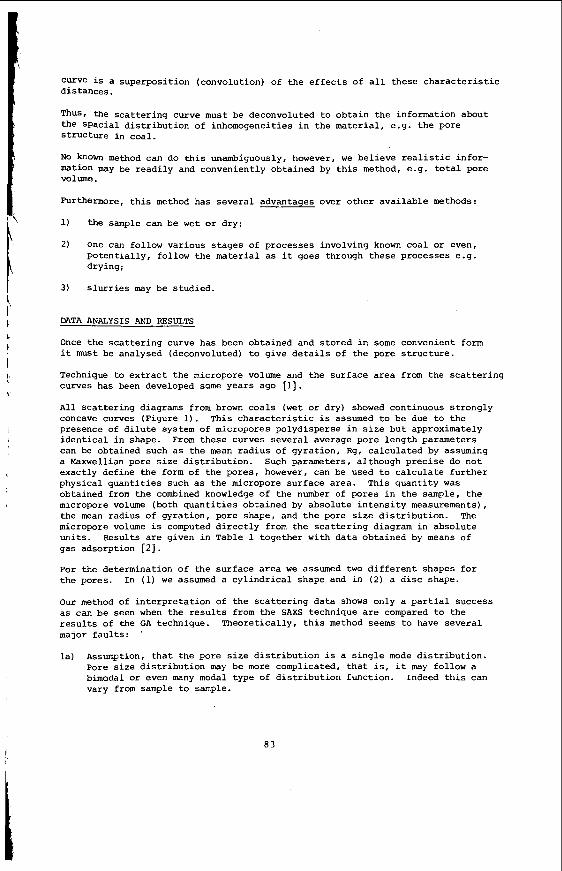
\
Curve is a superposition (convolution) of the effects of all these characteristic distances.
Thus, the scattering curve must be deconvoluted to obtain the information about the spacial distribution of inhomogeneities in the material, e.g. the pore structure in coal.
No known method can do this unambiguously, however, we believe realistic infor- mation may be readily and conveniently obtained by this method, e.9. total pore volume.
Furthennore, this method has several advantages over other available methods:
1)
2 )
the sample can be wet or dry;
one can follow various stages of processes involving known coal or even, Potentially, follow the material as it goes through these processes e.g. drying;
3) slurries may be studied.
DATA ANALYSIS AND RESULTS
Once the scattering curve has been obtained and stored in some convenient form it must be analysed (deconvoluted) to give details of the pore structure.
Technique to extract the micropore volume and the surface area from the scattering curves has been developed some years ago [l].
All scattering diagrams from brown coals (wet or dry) showed continuous strongly concave curves (Figure 1). This characteristic is assumed to be due to the presence of dilute system of micropores polydisperse in size but approximately identical in shape. From these curves several average pore length parameters can be obtained such as the mean radius of gyration, Rg, calculated by assuming a Maxwellian pore size distribution. Such parameters, although precise do not exactly define the form of the pores, however, can be used to calculate further physical quantities such as the micropore surface area. This quantity was obtained from the combined knowledge of the numher of pores in the sample, the micropore volume (both quantities obtained by absolute intensity measurements), the mean radius of gyration, pore shape, and the pore size distribution. The micropore volume is computed directly from the scattering diagram in absolute units. Results are given in Table 1 together with data obtained by means of gas adsorption [2] .
For the determination of the surface area we assumed two different shapes for the pores. In (1) we assumed a cylindrical shape and in ( 2 ) a disc shape.
our method of interpretation of the scattering data shows only a partial Success as can be seen when the results from the SAXS technique are compared to the results of the GA technique. Theoretically, this method seems to have several major faults: '
la) Assumption, that the pore size distribution is a single mode distribution. Pore size distribution may be more complicated, that is, it may follow a bimodal or even many modal type of distribution function. Indeed this can vary from sample to sample.
83
lh) Estimation of i n t e n s i t y s c a t t e r e d a t zero angle . This p o i n t i s n o t reachable experimental ly and hence must be est imated, usua l ly by some form of ex t rapola t ion . This i s a very important q u a n t i t y s i n c e it i s d i r e c t l y propor t iona l t o t h e number of micropores wi th in t h e i r r a d i a t e d volume *
IC) Assumption, t h a t t h e shape of t h e micropores i s i d e n t i c a l . This i s only an approximation t h a t s i g n i f i c a n t l y s i m p l i f i e s t h e t h e o r e t i c a l equat ions. I t i s q u i t e p o s s i b l e t h a t t h e micropores a r e not on ly polydispersed i n s i z e b u t a l s o i n shape.
MICROPORE VOLUME ml/g
TABLE 1 Comparison o f micros t ruc ture parameters determined by gas adsorp t ion (GA) and s m a l l angle X-ray s c a t t e r i n g methods.
SURFACE AREA RAD. OF GYR. m2/g nm I
SAXS
1) (2)
30 210
90 1100
40 390
70 830
LITHOTYPE
WET 1 1 SAXS 1 G-A
DRY 0.079 0.095 298
0.100 DARK
158
83
136
72
WET 0.110
DRY 1 0.058 1 0.060 I 2I6 LIGHT
REFERENCES
[ I ] Kratky, 0.. 1940, Z s . E l . Chem., 46, 550.
Porod, G. , 1951, K o l l . Z s . , 124, 83.
Guinier , A. , and Fournet, G . , John Wiley & Sons, 1955, Chapter 2 , New York.
i
[2] Wagenfeld, H.K. , Setek, M . , K i s s , L. and Stacy, W.O. (1981) , Determination of p o r o s i t y and pore s i z e d i s t r i b u t i o n of brown coa l . Proceedings of I n t e r n a t i o n a l Conference on Coal Science, Dusseldorf.
a 4
I \
melnical Variation as a Function of Lithotype and Depth i n Victorian Brown Coal
R. B. Johns, A. L. Chaffee and T. V. Verheyen
Department of Organic Chemistry, University of Melbourne, Parkville, Victoria, Australia, 3052.
Introduction
Victorian brown coal occurs i n randomly sequenced s t r a t i f i e d layers, known as lithotypes, which a re distinguishable by t h e i r a i r -d r i ed colour, maceral composition and many physical and chemical properties. t o generalized paleoenvironments of deposition and are known to influence many coal u t i l i za t ion parameters (1-3). Across the thick coal i n t e rva l s which occur (up t o 300 m) there is a small increase i n coal r ank observable v i a parameters such as % carbon and % vo la t i l e s (1). i n the organic chemical nature of the coal occurring a s a function of depth for a s e r i e s of (nearly) ident ical l i thotypes with that occurring as a function of l i thotype. We have employed techniques giving both precise molecular level information (e.g. , the d i s t r ibu t ion of extractable l i p i d classes) and average s t ructural characterization of the whole coal (e.g. , parameters derived from I R , so l id state 13C-NMR, e tc . ) . A l l of these techniques have been able t o provide much deeper insights i n to the varying nature of the coal than the conventional elemental and functional group type analyses which have been carr ied out extensively in the past .
Materials and Methods
The f i v e major l i thotypes can be related
The purpose of t h i s paper i s t o contrast the var ia t ion
Coal samples were taken from a single bore core (LY 1276) from the Flynn f i e l d i n the Loy Yang region of t he Latrobe Valley, Victoria, Australia. consists of > 100 m of continuous coal, but penetrates two coal seams, v i z . Morwell lA and Morwell 1B. These seams range from l a t e Oligocene to Miocene i n age. I t i s estimated tha t deposition of the 100 m of coal would have taken approximately 1 million years. Samples were chosen by visual examination of the air -dr ied colour of the coal. Lithotype classif icat ions on t h i s basis a r e usually, but not always correct; it was therefore found necessary t o modify sone of the i n i t i a l c l a s s i f i - cations a f t e r a consideration of a l l the available petrographic and chemical data. This correction has notbcenincorporated i n previous publications from our group (4) . Further d e t a i l s r e l a t ing to these samples, methods of fractionation and experimental techniques can be found elsewhere (5-6).
Characterization of Whole Coals
The core
Before considering the r e su l t s of other more sophisticated analyses it is
laen elemental analyt ical data are expressed i n bond useful t o demonstrate the divergent chemical nature of the coal l i thotypes by a more classical approach. equivalence form it can be seen (Figure 1) that there i s some inherent spread i n the plotted points fo r the su i t e of li h t l i thotype samples. types are, however, readily d i s t i n g u h l e due t o the much greater variance in the i r analyt ical f igures. The distinguishing features are especially exhibited at the extremes of the l i thotype c l a s s i f i ca t ion as an increase i n the number of bonds associated with carbon at the expense of hydrogen f o r the dark l i thotype and visa versa f o r the For the light samples the b o z q u i v a l e n t data are most consistent% carbon, with the mean values f o r hydrogen and oxygen exhibiting higher proportional standard deviations. implies that the difference between the l i thotypes resides i n the type of chemical s t ructure(s) that t he elements form.
The different l i tho-
a l e l i thotype.
The bond equivalence data
85

There are only a few so l id - s t a t e techniques capable of providing s t ructural information on "whole" coals. exhibi t significant f i ne s t ructure including phenolic and carboxylic resonance envelopes which are consistent w i t h t h e i r low aromaticity and rank. The proportion of aromatic carbon atoms, f ( a ) , i n the coal can be determined from the spectra and the variation i n t h i s parameter across the sample s u i t e is i l l u s t r a t e d i n Figure 2 . While there is some spread i n the f ( a ) values amongst the light samples (K = 0.52, a = 0.03) there is no obvious trend with depth. l i thotype transcends obvious increase in Only the medium li h t sample cannot be adequately distinguished within the sample su i t e by d u e . In addition t o t h e i r higher aromaticit ies the spectra of the medium-dark and dark l i thotypes exhibi t prominent phenolic and methoxyl carbon absorptions similar m e spectra o f degraded lignins. f ( a ) as a function of l i thotype var ia t ion in the or iginal organic input and i n the r e l a t ive preservation of various biopolymeric materials within the corresponding depositional paleoenvironments. Although aromaticity is known t o co r re l a t e with coal rank over a wider regime, there is no suggestion of a regular increase i n f ( a ) over the depth interval examined. The small var ia t ion i n f ( a ) fo r t he several llght samples is probably a ref lect ion of minor changes i n the deposit ional paleoenvironments.
The CP-MAS 13C-NMR spectra o f Victorian brown coals
The var ia t ion as a function of and there is an t o darker l i thotypes
Hence the var ia t ion i n i s considered to be predominantly the r e su l t of
Absorption mode I R spectroscopy provides greater s ens i t i v i ty f o r the observ- a t ion of specif ic functional groups. K2920 (aliphatic C-H s t re tch) and K 710 (carbonyl, carboxyl s t re tch) across the s u i t e of samples is i l l u s t r a t e d i n higure 3. var ia t ion as a function of l i thotype exceeds the spread inherent i n the set of light samples. The proportional spread for the li h t samples i s s ignif icant ly more intense for K2920 (x = 14.1 an mg-1, a = 2.&an for K1710 (R = 36.2, a = 2.2), but i n neither case is there any def inat ive trend with depth. negative correlation ( r = -0.95) e x i s t s between K1710 and f ( a ) fo r a l l samples examined. The correlation between f ( a ) and Kzg20 is s ignif icant ly lower ( r = -0.84) as would be expected from the higher proportional spread i n the K2920 values. c lear , but t he IR da ta provide a f u r t h e r c l ea r indication of the e f f e c t of the depositional paleoenvironment upon the coal s t ructure(s) which a re ultimately preserved.
applied to petroleum source rocks i n which the level of evolved carbon dioxide and hydrocarbon-like material are quant i ta t ively measured via oxygen (01) and hydrogen (HI) indices. material i s evolved (Tmm) is a l so recorded, and t h i s can be related to the rank of t he organic substrate. The average Tmax values fo r the samples under consider- a t ion was observed t o be 397OC (a = 2.6), a value which corresponds to a v i t r i n i t e reflectance of - 0.30. No s ign i f i can t regular var ia t ion i n Tmax was observed with e i t h e r depth o r l i thotype and t h i s method, a l so , does not provide any indication of the s l i gh t increase i n rank over the 100 m coal interval . 01 (Figure 4 ) , however, provides a fur ther method f o r dist inguishing the lithotypes. Although there is a s ignif icant spread i n t h e H I values f o r the l i g h t samples, the 01 data enable be t t e r discrimination between the different litho-. observation supports the N4R and I R da t a i n suggesting tha t l i thotype is a coal property especially influenced by the nature and concentration of oxygen containing species. strongly (r = +0.94) with the percentage o f extractable material (see l a t e r ) ; it is a parameter which has substantial significance fo r coal- to-oi l conversion. I t can be seen that the l i gh te r l i thotypes and especially the pa& sample provide greater potent ia l i n t h i s respect.
The var ia t ion i n the absorption coefficients
I t is again obvious t h a t the
A strong
The s t ruc tu ra l implications of these relationships are not en t i r e ly
Rock-Eva1 analysis i s a form of temperature programmed pyrolysis often
The temperature a t which the maximum amount of vo la t i l e
A p l o t of HI versus
This
H I i s a measure of the hydrocarbon production potent ia l and correlates
86
Characterization of Coal Fractions
The variation i n the weight percentage of t o t a l solvent extractable (TSE) material (extraction with chloroform/methanol/toluene) and solvent extractable humic acid (SEHA) f o r the coal samples is i l l u s t r a t ed i n Figure 5. There is a substantial reduction in the weight % of these fract ions i n the progression from paler to darker l i thotypes. I t can a l so be seen tha t the var ia t ion with l i thotype is Significantly more extreme than the var ia t ion within the s u i t e of Q& l i t ho - types. Within the lat ter s u i t e there i s a notably large difference i n the weight Percentages between the two adjacent samples from 59 m and 78 m depth i n the core. The Jump across t h i s interval can be related t o the Morwell lA/Morwell 1 B seam boundary which occurs a t the 7 3 m depth. the data are consistent with an increase i n extractable material as a function of depth (for samples within a pa r t i cu la r l i thotype c l a s s i f i ca t ion and seam). increase across the in t e rva l from 78 t o 119 m depth is q u i t e marked by comparison w i t h the increase in extractable material which accompanies increasing rank within the subbituminous rank regime (7) . There have been, however, no previous system- atic studies giving any indication of what t o expect within t h i s lower rank interval . could s ignif icant ly enhance our understanding of coal forming processes.
i l l u s t r a t ed in Figure 6. odd carbon chain length homologues and i n t h i s respect a l l are s imilar t o the dis t r ibut ion of n-alkanes which occur i n l iving higher plant waxes. In other respects, however, the dis t r ibut ions d i f f e r markedly. l i thotype exhibits a primary maximum a t C2g and a secondary one a t C25. %medium - dark and pale l i thotypes exhibi t only primary maxima a t C3l and Czg, respecti- By contrast , a l l the l i gh t samples exhibit primary maxima a t C2g and secondary maxima a t C37. These-maxima appear t o be a d i s t inc t ive feature of the l i gh t samples and have almost cer ta inly resul ted from the input of some f a i r l y s p a c taxon which was viable only i n association with the paleoenvironment of deposit ion for t h i s l i thotype. The dis t r ibut ion can be fur ther characterized by Carbon Preference Indices (CPIs), a parameter which is effect ively the r a t i o of the abundance of odd r e l a t ive t o even carbon chain lengths. I t can be seen (Figure 7) t ha t there is considerable spread i n the CPI values fo r the light samples and that only the CPI value for the dark l i thotype l i e s s ignif icant ly outside t h i s margin. There is no apparent change= the dis t r ibut ion of n-alkanes as a function of depth and it would appear t ha t the dis t r ibut ions remain substant ia l ly represent- a t ive of those contributed by the higher plant progenitors of the coal.
A consideration of the extractable n-fat ty acid dis t r ibut ions gives a comp- limentary characterization of the sample su i t e . ref lect ion of those observed i n the higher plant precursors t o the coal. dis t r ibut ional differences between li thotypes and the s i m i l a r i t i e s within a s ingle l i thotype c l a s s i f i ca t ion areless obvious than i n the case of the n-alkanes, but a s t a t i s t i c a l approach involving the determination of covariance between sample pairs was able t o effect ively d i f f e ren t i a t e the divergent nature of the dis t r ibut ional variations as a function of depth and l i thotype (5). CPI values fo r the n-fat ty acid dis t r ibut ions a re plot ted in Figure 8 (CPl, i n t h i s case, is effect ively the r a t i o of even r e l a t ive to odd chain lengths). difference i n the values f o r the various l i thotypes, but the spread'of values within the li h t sample s u i t e i s r e l a t ive ly small. it is possi&o discern a general reduction in the CPI values with depth. There is again a discontinuity across the seam boundary. There is a corresponding general reduction i n the level of extractable n - f a t ty acids over t h i s depth interval and the consistent var ia t ion i n these two parameters is believed t o indicate that progressive diagenetic removal and a l t e r a t ion of the f a t t y acids is occurring with depth within t h i s coal sequence.
Taking in to account t h i s abberation
The
A more intense study of rank dependent phenomena within t h i s interval
The dis t r ibut ions of extractable n-alkanes from the d i f f e ren t l i thotypes are A l l the dis t r ibut ions exhibit a marked predominance of
For example, the dark
The d i s t r ibu t ions a re again a The
Again there is a considerable
Within t h i s spread, however,
The discontinuity across the seam
i'
i 87
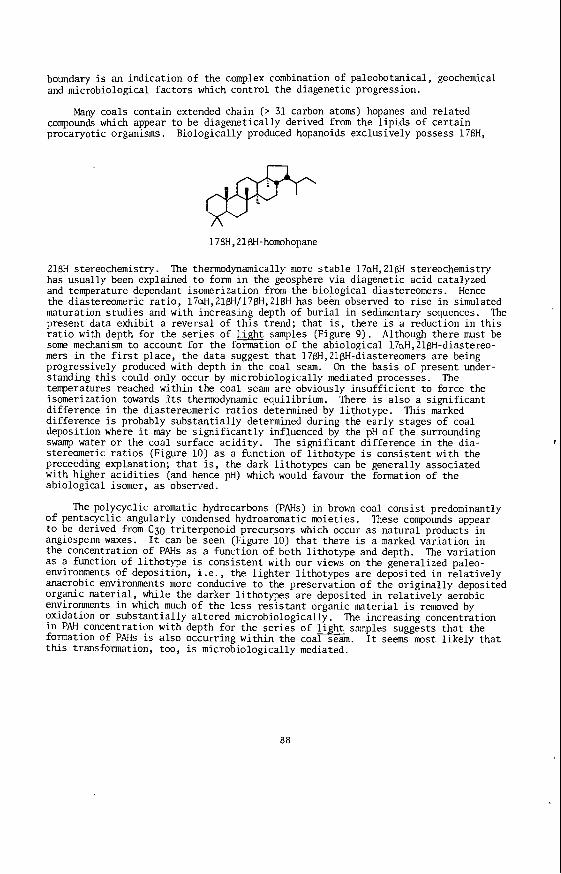
boundary i s an indication of the complex combination of paleobotanical, geochemical and microbiological factors which control the diagenetic progression.
Many coals contain extended chain (> 31 carbon atoms) hopanes and related compounds which appear t o be diagenetically derived from the l i p ids of ce r t a in procaryotic organisms. Biologically produced hopanoids exclusively possess 1 7 B H ,
17BH, 2 1 @I-homohopane
21BH stereochemistry. has usually been explained to form i n the geosphere via diagenetic acid catalyzed and temperature dependant isomerization from the biological diastereomers. Hence the diastereomeric r a t i o , 17aH,ZlfiH/l7fiH,21fiH has been observed to r i s e i n simulated maturation s tudies and with increasing depth of burial i n sedimentary sequences. present data exhibit a reversal of t h i s trend; that is , there is a reduction i n th i s r a t i o with depth for the series of samples (Figure 9 ) . Although there must be some mechanism t o account f o r the formation of the abiological 17crH,2lgH-diastereo- mers i n the first place, the data suggest t ha t 17fiH,2lBH-diastereomers are being progressively produced with depth i n the coal seam. On the basis of present under- standing t h i s could only occur by microbiologically mediated processes. temperatures reached within the coal seam are obviously insuff ic ient t o force the isomerization towards Its thermodynamic equilibrium. There is a l so a s ignif icant difference i n the diastereomeric r a t i o s determined by l i thotype. difference is probably substant ia l ly determined during the ea r ly stages of coal deposition where it may be s ign i f i can t ly influenced by the pH of the surrounding swamp water o r the coal surface ac id i ty . The s ignif icant difference i n the dia- stereomeric r a t i o s (Figure 10) as a function of l i thotype is consistent with the preceeding explanation; t ha t i s , the dark l i thotypes can be generally associated with higher ac id i t i e s (and hence pH) which would favour the formation of the abiological isomer, as observed.
of pentacyclic angularly condensed hydroaromatic moieties. t o be derived from C30 t r i terpenoid precursors which occur as natural products i n angiosperm waxes. I t can be seen (Figure 10) that there is a marked var ia t ion i n the concentration of PAHs as a function of both l i thotype and depth. as a function of l i thotype is consistent with our views on the generalized paleo- environments of deposition, i . e . , the l i gh te r l i thotypes a re deposited i n re la t ively anaerobic environments more conducive t o the preservation o f the or iginal ly deposited organic material, while the darker l i thotypes a re deposited i n r e l a t ive ly aerobic environments i n which much of the l e s s r e s i s t an t organic material is removed by oxidation or substant ia l ly a l t e r ed microbiologically. i n PAH Concentration with depth for t h e series of light samples suggests t ha t the formation of PAHs is a l so occurring within the coal seam. t h i s transformation, too, is microbiologically mediated.
The thermodynamically more s t ab le l7aH,21BH stereochemistry
The
The
This marked
The polycyclic aromatic hydrocarbons (PAHs) i n brown coal consis t predominantly These compounds appear
The var ia t ion
The increasing concentration
I t seems most l ike ly tha t
aa
Conclusions
The organic chemical nature of Victorian brown coal has been shown t o vary a s a function of both depth and l i thotype. I n the l a t t e r case the s t ruc tu ra l differences occur predominantly as a r e su l t of the differ ing nature of the depositional paleoenvironments and are readi ly distinguishable by both gross and molecular level parameters. and were observed only by specif ic molecular techniques; e .g . , the level of PAHs, the diastereomeric r a t i o of hopanoids and the CPIs of the n - f a t ty acid d i s t r ibu t - 10x5. a Small proportion of t he t o t a l coal substrate (parts per thousand level) i t is hardly surprising tha t they are not manifested a t the gross s t ruc tu ra l level. Although mild increases i n temperature cer ta inly occur across the sampled coal interval , the spec i f i c nature of the chemical changes observed with depth suggests t ha t microbiological processes ra ther than geochemical (temperature dependent) processes are chief ly responsible. I t may be that the warmer conditions deeper i n the seam favour the v i a b i l i t y of anaerobic microorganisms which can modify the coal substrate i n the required manner, o r more probably t h a t the closer proximity of the dcepersamples to underground a y i f e r s (and potentai l sources of oxygen and inorganic nutrients) favour the v i a b i l i t y of aerobic microorganisms.
Acknowledgements
Electr ic i ty Commission of Victoria fo r the provision o f coal samples. is thanked for technical assistance.
References
The differences with depth a re considerably more subtle
Since the observed s t ruc tu ra l differences a t the molecular level involve only
The authors acknowledge the Victorian Brown Coal Council and the State Mr S. Bombaci
\
Allardice D. J., George A. M., Hausser D . , Neubert K . H. and Smith G. C . , S ta te E lec t r i c i ty Conmission of Victoria, Research and Development Department, Report No. 342 (1977).
Blackbum D. T., presented at "Cainozoic Evolution of Continental South-Eastem Australia" conference, Canberra, Nov. 1980.
George A. M., S t a t e E lec t r i c i ty Conmission of Victor ia , Petrographic Report No. 1 7 (1975).
Johns R. B. , Verheyen T. V. and Chaffee A. L . , "Proceedings of the International Conference on Coal Science, Diisseldorf, 1981", Verlag Gluckauf, Essen,
Chaffee A. L. , "The Organic Geochemistry of Australian Coals", Ph.D. disser- ta t ion, University of Melbourne (1981).
Verheyen T. V., "Structural Characterization of Selected Australian Coals", Ph.D. disser ta t ion, University of Melbourne (1982).
pp. 863-868 (1981).
Radke M . , Schaefer R . G . , Leythauser D. and TeichmXler M . , Geochim. Cosmochim. Acta, 44, 1787-1800 (1980).
I
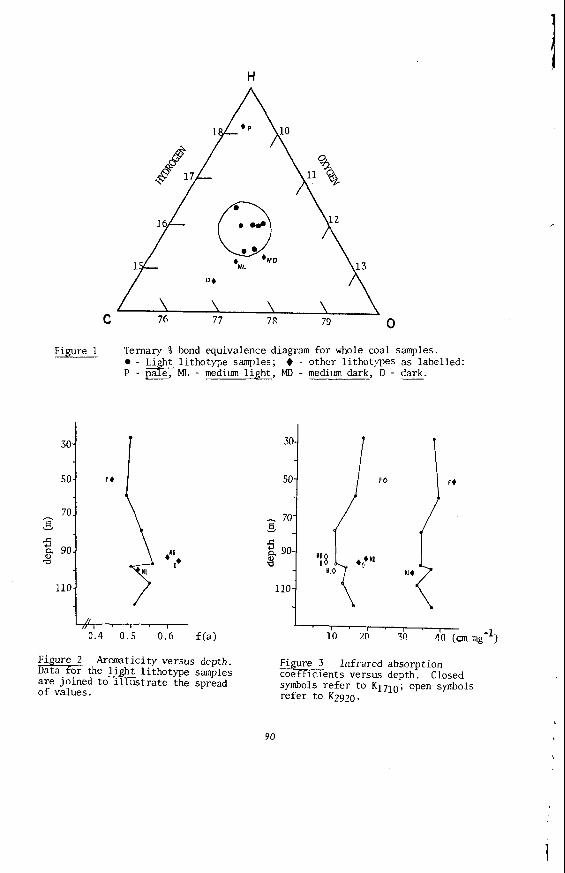
H
79 0 c 76 77 7s
30-
50-
- 70- E v
Figure 1 Ternary % bond equivalence diagram f o r whole coal samples. - Light l i thotype samples;
P - G M L - medium l i g h t , MD - medium dark, D - dark. - other l i t h o t y p s as labelled:
a
110-
30 -
50-
70. h e 5 -8 a 90.
110-
0.4 0 .5 0.6 f ( a )
Figure 2 Aromaticity versus depth. Data f o r the llght l i thotype samples are joined t o i l l u s t r a t e the spread of values.
‘ I
90
\
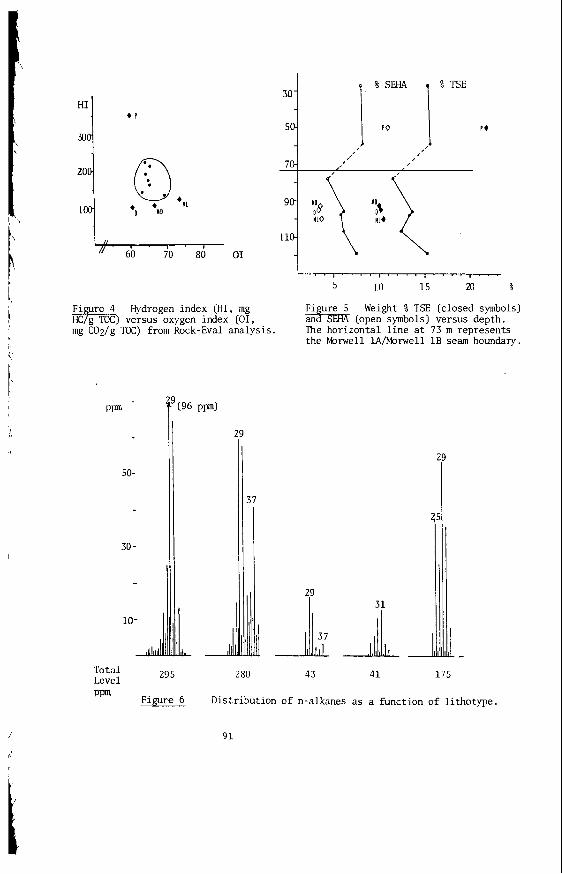
/ I
" 60 70 80 01 V . I . 1
4 Hydrogen index (HI, mg
versus oxygen index (01, mg C02/g TOC) from Rock-Eva1 analysis.
i
i
, Ppm
50-
30 -
10-
5 10 1 s m %
F i re 5 Weight % TSE (closed symbols) + EHA (open symbols) versus depth. The horizontal l i n e a t 73 m represents the Morwell lA/Morwell 1 B seam boundary.
37
29
295 280 43 4 1 175 Total Level ppm Figure 6 Distribution of n-alkanes as a function of l i thotype.
91
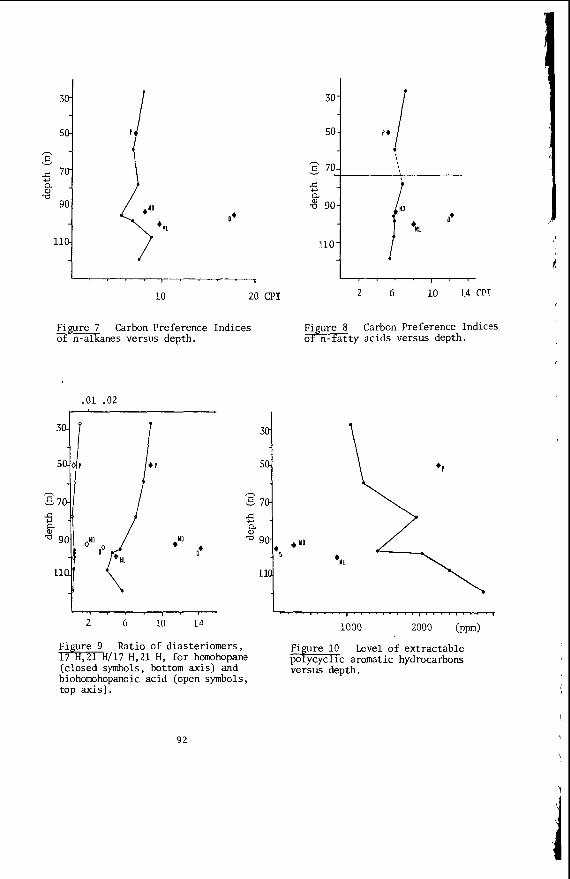
O*
10 20 CPI 2 6 i o 1 4 crI
Fi ure 8 Carbon Preference Indices T & f ’ o n- a t t y acids versus depth. Figure Carbon Preference Indices o n-a1 anes versus depth.
.01 .02
2 6 10 14
* P
Figure 9 Ratio of diasteriomers, Figure 10 Level of extractable 17 H , Z 1 H/17 H , 2 1 H, f o r homohopane polycyclic aromatic hydrocarbons (closed symbols, bottom axis) and versus depth. biohomohopanoic acid (open symbols, top axis).
92
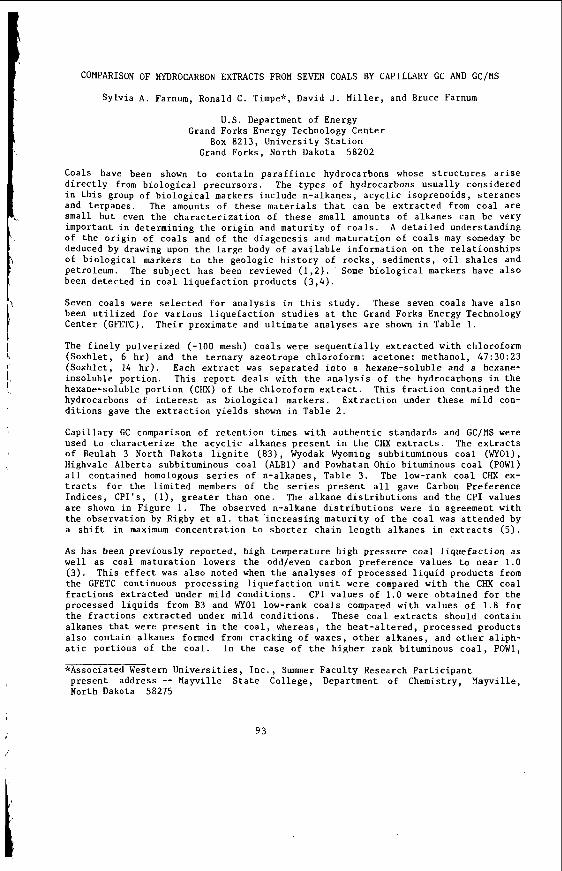
COMPARISON OF HYDROCARBON EXTRACTS FROM SEVEN COALS BY CAPILLARY GC AND GC/MS
Sylvia A. Farnum, Ronald C . Timpe”, David J . Miller, and Bruce Farnum
U.S. Department of Energy Grand Forks Energy Technology Center
Box 8213, U n i v e r s i t y S t a t i o n Grand Forks, North Dakota 58202
Coals have been shown t o conta in p a r a f f i n i c hydrocarbons whose S t K U C t U K e S a r i s e d i r e c t l y from b i o l o g i c a l pKeCUKSOKS. The types o f hydrocarbons u s u a l l y considered i n t h i s group of b i o l o g i c a l markers inc lude n-a lkanes , a c y c l i c i soprenoids , s t e r a n e s and te rpanes . The amounts of these m a t e r i a l s t h a t can be e x t r a c t e d from c o a l a r e Small b u t even t h e c h a r a c t e r i z a t i o n of t h e s e small amounts of a lkanes can be very important i n determining t h e o r i g i n and matur i ty of c o a l s . A d e t a i l e d understanding of t h e o r i g i n of c o a l s and of t h e d iagenes is and matura t ion of c o a l s may someday be deduced by drawing upon t h e l a r g e body of a v a i l a b l e informat ion on t h e r e l a t i o n s h i p s of b i o l o g i c a l markers t o t h e geologic h i s t o r y of r o c k s , sediments , o i l s h a l e s and petroleum. The s u b j e c t has been reviewed ( 1 , 2 ) . Some b i o l o g i c a l markers have a l s o been de tec ted i n coa l l i q u e f a c t i o n products ( 3 , 4 ) .
Seven coa ls were s e l e c t e d f o r a n a l y s i s i n t h i s s tudy . These seven coa ls have a l s o been u t i l i z e d f o r var ious l i q u e f a c t i o n s t u d i e s a t t h e Grand Forks Energy Technology Center (GFETC).
The f i n e l y pulver ized (-100 mesh) c o a l s were s e q u e n t i a l l y e x t r a c t e d wi th ChlorofOKm (Soxhlet , 6 h r ) and t h e t e r n a r y azeot rope chloroform: acetone: methanol, 47:30:23 (Soxhlet , 14 h r ) . Each e x t r a c t was s e p a r a t e d i n t o a hexane-soluble and a hexane- i n s o l u b l e por t ion . This r e p o r t d e a l s wi th t h e a n a l y s i s o f t h e hydrocarbons i n t h e hexane-soluble p o r t i o n (CHX) of t h e chloroform e x t r a c t . This f r a c t i o n contained t h e hydrocarbons of i n t e r e s t a s b i o l o g i c a l markers . E x t r a c t i o n under t h e s e mild con- d i t i o n s gave t h e e x t r a c t i o n y i e l d s shown i n Table 2 .
C a p i l l a r y GC comparison of r e t e n t i o n t imes wi th a u t h e n t i c s tandards and GC/MS were used t o c h a r a c t e r i z e t h e a c y c l i c a lkanes p r e s e n t i n t h e CHX e x t r a c t s . The e x t r a c t s of Beulah 3 North Dakota l i g n i t e (B3), Wyodak Wyoming subbituminous c o a l (WYOl), Highvale Alberta subbituminous coa l (ALB1) and Powhatan Ohio bituminous c o a l (POW1) a l l contained homologous s e r i e s of n-a lkanes , Table 3. The low-rank c o a l CHX ex- t r a c t s f o r t h e l i m i t e d members of t h e series p r e s e n t a l l gave Carbon Preference Indices , CPI’s , ( l ) , g r e a t e r than one. The a lkane d i s t r i b u t i o n s and t h e CPI va lues a r e shown i n F igure 1. The observed n-alkane d i s t r i b u t i o n s were i n agreement wi th t h e observa t ion by Rigby e t a l . t h a t ‘ increas ing m a t u r i t y of t h e c o a l was a t tended by a s h i f t i n maximum concent ra t ion t o s h o r t e r cha in l e n g t h a lkanes i n e x t r a c t s (5) .
As has been previous ly repor ted , high temperature h igh p r e s s u r e c o a l l i q u e f a c t i o n a s wel l a s coal matura t ion lowers t h e oddleven carbon preference va lues t o n e a r 1 .0 ( 3 ) . This e f f e c t was a l s o noted when t h e a n a l y s e s of processed l i q u i d products from t h e GFETC cont inuous process ing l i q u e f a c t i o n u n i t were compared wi th t h e CHX coa l f r a c t i o n s e x t r a c t e d under mild c o n d i t i o n s . CPI v a l u e s of 1.0 were obta ined f o r t h e processed l i q u i d s from B3 and WYOl low-rank c o a l s compared wi th v a l u e s o f 1 .8 f o r t h e f r a c t i o n s e x t r a c t e d under mild c o n d i t i o n s . These c o a l e x t r a c t s should conta in alkanes t h a t were p r e s e n t i n t h e c o a l , whereas, t h e h e a t - a l t e r e d , processed products a l s o conta in a lkanes formed from cracking of waxes, o t h e r a lkanes , and o t h e r a l i p h - a t i c por t ions of t h e c o a l . I n t h e case o f t h e h i g h e r rank bituminous c o a l , POW1,
^Associated Western U n i v e r s i t i e s , I n c . , Summer F a c u l t y Research P a r t i c i p a n t
Thei r proximate and u l t i m a t e ana lyses a r e shown i n Table 1.
p r e s e n t address -- Mayville S t a t e Col lege, Department of Chemistry, Mayville, North Dakota 58275
9 3
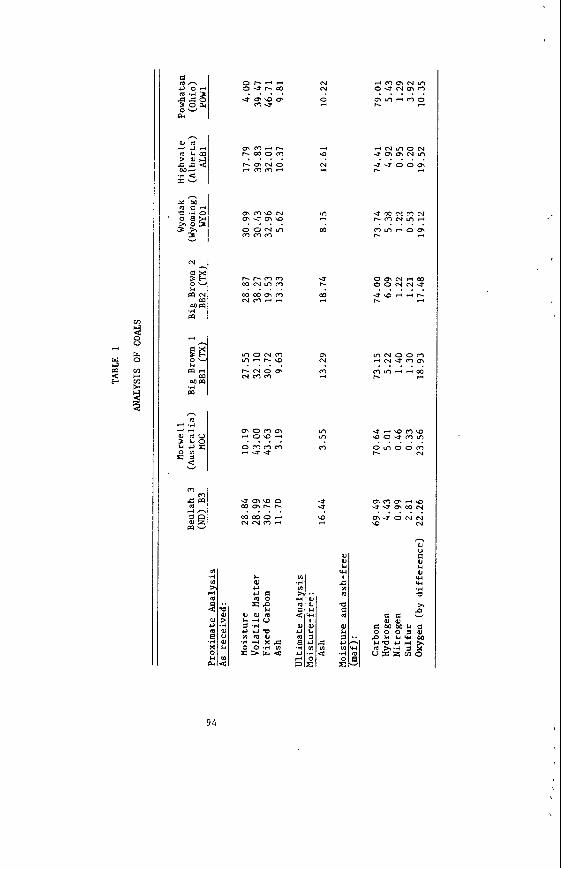
or . - - ? -??? u m w m m u
m m + - - m o m
4 m m - . . . .
r . m c \ ~ o
m M a N
OOOIln m m m
m u m w . . . .
r.r.mm w c r l n m m m m m NrnF4- I
. . . .
I n O N r n m 3 - w
m m m . . . .
r . c u o m
u m w o W Q I h r .
N N m -
. . . . m m o -
* C J v ) O N U m T N v ) u u o o m . . . . l. 3
UmC-lmN l.mOIL03
l.
. . . . . m m - 0 2
0 m N 3 0 0
u w 3 - r . 9 9 N N - f l. 3
q 3 w r n . n w o * m v )
N
. . . . . ~ m o o m
' I
9 4
\
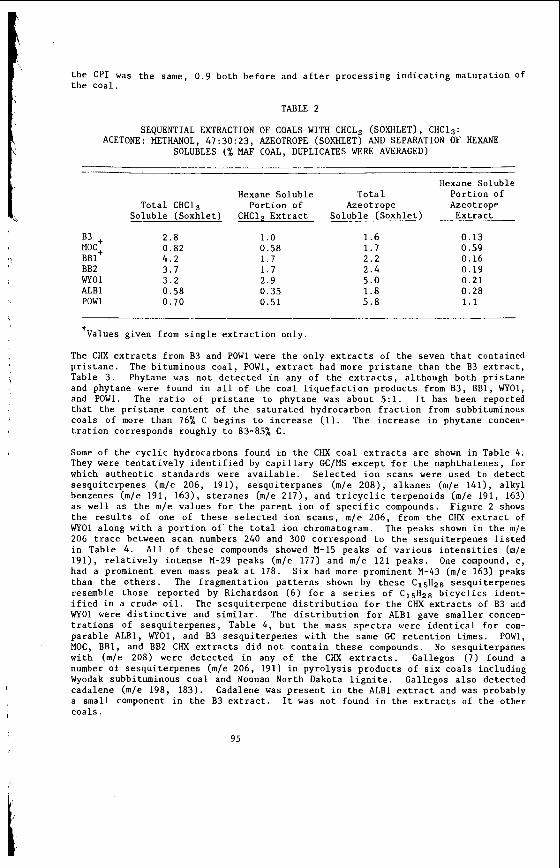
t h e CPI was t h e same, 0 . 9 both before and a f t e r process ing i n d i c a t i n g matura t ion Of t h e coa l .
TABLE 2
SEQUENTIAL EXTRACTION OF COALS WITH CHCL:, (SOXHLET) , C H C 1 3 : ACETONE: METHANOL, 47:30:23, AZEOTROPE (SOXHLET) AND SEPARATION OF HEXANE
SOLUBLES (% MAF COAL, DUPLICATES WERE AVERAGED)
Hexane Soluble Hexane Soluble T o t a l P o r t i o n of
Tota l CHC13 Por t ion of Azeotrope Azeotrope Soluble (Soxhlet) CHC1, E x t r a c t Soluble (Soxhle t ) E x t r a c t
B3 2 . 8 1.0 MOC' 0 .82 0.58 B B ~ + 4.2 1 . 7 BB2 3 .7 1 . 7 WYO 1 3 . 2 2.9 A L B l 0.58 0.35 POW1 0 .70 0.51
1 . 6 1 .7 2 .2 2 . 4 5.0 1.8 5.8
0 .13 0.59 0.16 0.19 0 .21 0.28 1.1
+Values given from s i n g l e e x t r a c t i o n only .
The CHX e x t r a c t s from B3 and POW1 were t h e only e x t r a c t s of t h e seven t h a t contained p r i s t a n e . The bituminous c o a l , POW1, e x t r a c t had more p r i s t a n e than t h e B3 e x t r a c t , Table 3. Phytane was not d e t e c t e d i n any of t h e e x t r a c t s , a l though both p r i s t a n e and phytane were found i n a l l of the coa l l i q u e f a c t i o n products from B3, BB1, WYOl, and POW1. The r a t i o of p r i s t a n e t o phytane was about 5 : l . I t has been reported t h a t t h e p r i s t a n e conten t of t h e s a t u r a t e d hydrocarbon f r a c t i o n from subbituminous c o a l s of more than 76% C begins t o i n c r e a s e ( 1 ) . The i n c r e a s e i n phytane concen- t r a t i o n corresponds roughly t o 83-85X C .
Some of t h e c y c l i c hydrocarbons found i n t h e CHX c o a l e x t r a c t s a r e shown i n Table 4 . They were t e n t a t i v e l y i d e n t i f i e d by c a p i l l a r y GC/MS e x c e p t f o r t h e naphthalenes, f o r which a u t h e n t i c s tandards were a v a i l a b l e . Se lec ted i o n scans were used t o d e t e c t sesqui te rpenes (m/e 206, 191) , sesqui te rpanes (m/e 208) , a lkanes (m/e 141), a lkyl benzenes (m/e 191, 163) , s t e r a n e s (m/e 2171, and t r i c y c l i c te rpenoids (m/e 191, 163) a s w e l l a s t h e m / e va lues f o r t h e p a r e n t ion of s p e c i f i c compounds. F igure 2 shows t h e r e s u l t s of one o f t h e s e s e l e c t e d i o n s c a n s , m/e 206, from t h e CHX e x t r a c t of WYOl a long wi th a p o r t i o n of ' t h e t o t a l i o n chromatogram. The peaks shown i n t h e m/e 206 t r a c e between scan numbers 240 and 300 correspond t o t h e sesqui te rpenes l i s t e d i n Table 4. A l l of t h e s e compounds showed M-15 peaks of v a r i o u s i n t e n s i t i e s (m/e 191) , r e l a t i v e l y i n t e n s e M-29 peaks (m/e 177) and m / e 121 peaks. One compound, c , had a prominent even mass peak a t 178. S ix had more prominent M-43 (m/e 163) peaks than t h e o t h e r s . The fragmentat ion p a t t e r n s shown by t h e s e C15H26 sesqui te rpenes resemble those reported by Richardson (6) f o r a series of C15H28 b i c y c l i c s ident - i f i e d i n a crude o i l . The sesqui te rpene d i s t r i b u t i o n f o r t h e CHX e x t r a c t s of B3 and WYOl were d i s t i n c t i v e and s i m i l a r . The d i s t r i b u t i o n f o r ALBl gave smal le r concen- t r a t i o n s of sesqui te rpenes , Table 4 , b u t t h e mass s p e c t r a were i d e n t i c a l f o r com- parable ALB1, WYO1, and B3 sesqui te rpenes wi th t h e same GC r e t e n t i o n times. POW1, MOC, BB1, and BB2 CHX e x t r a c t s d i d n o t conta in t h e s e compounds. No sesqui te rpanes wi th (m/e 208) were de tec ted i n any of t h e CHX e x t r a c t s . Gallegos ( 7 ) found a number of sesqui te rpenes (m/e 206, 191) i n p y r o l y s i s products of s i x coa ls inc luding Wyodak subbituminous c o a l and Noonan North Dakota l i g n i t e . Gal legos a l s o de tec ted cadalene (m/e 198, 183). Cadalene was p r e s e n t i n t h e ALBl e x t r a c t and was probably a small component i n t h e B3 e x t r a c t . I t was n o t found i n t h e e x t r a c t s of t h e o ther c o a l s .
95
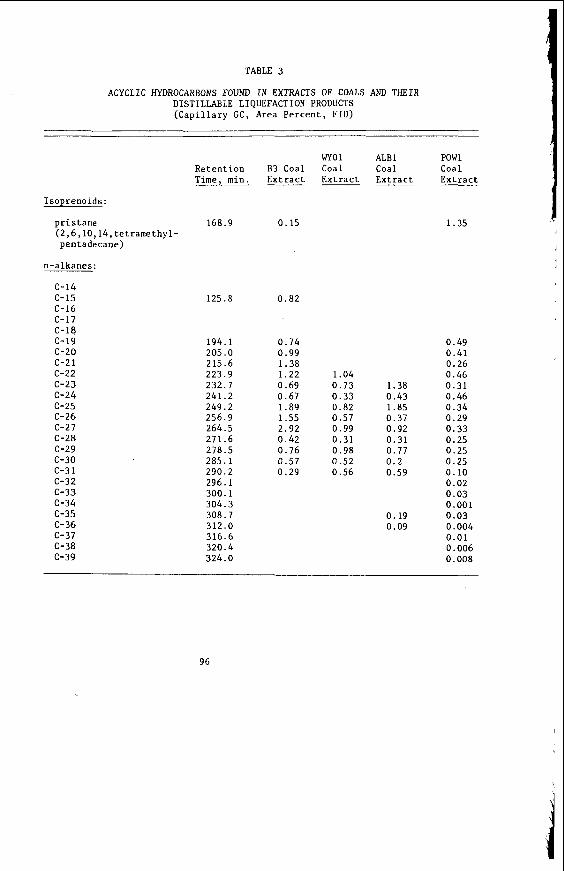
TABLE 3
ACYCLIC HYDROCARBONS FOUND IN EXTRACTS OF COALS AND THEIR DISTILLABLE LIQUEFACTION PRODUCTS (Capillary GC, Area Percent, FID)
WYOl ALBl p0w1 Retention B3 Coal Coal Coal Coal Time, min. Extract Extract Extract Extract
Isoprenoids:
pristane 168.9 0.15 (2,6,10,14,tetramethyl- pentadecane)
n-alkanes:
C-14 C-15 C-16 C-17 C-18 c-19 c-20 c-21 c-22 C-23 C-24 C-25 C-26 C-27 C-28 C-29 C-30 C-31 C-32 c-33 c-34 c-35 C-36 c-37 C-38 c-39
125.8
194.1 205.0 215.6 223.9 232.7 241.2 249.2 256.9 264.5 271.6 278.5 285.1 290.2 296.1 300.1 304.3 308.7 312.0 316.6 320.4 324.0
0.82
0.74 0.99 1.38 1.22 1.04 0.69 0.73 1.38 0.67 0.33 0.43 1.89 0.82 1.85 1.55 0.57 0.37 2.92 0.99 0.92 0.42 0.31 0.31 0.76 0.98 0 . 7 7 0.57 0.52 0.2 0.29 0.56 0.59
0.19 0.09
1.35
0.49 0.41 0.26 0.46 0.31 0.46 0.34 0.29 0.33 0.25 0.25 0.25 0.10 0.02 0.03 0.001 0.03 0.004 0.01 0.006 0.008
96
i
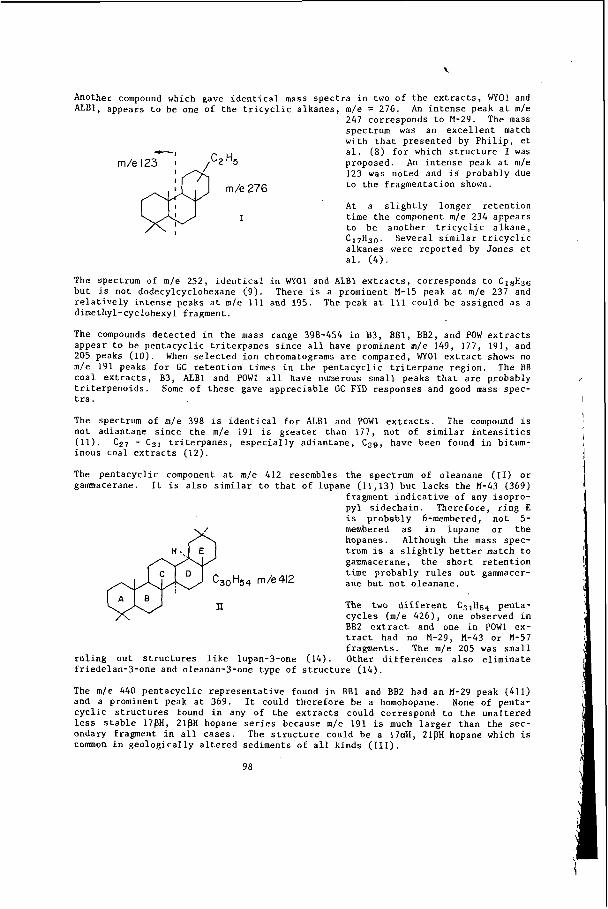
Another compound which gave identical mass spectra i n two of the extracts, WYOl and ALBl, appears to be one of the tricyclic alkanes, m/e = 276. An intense peak at m/e
247 corresponds to M-29. The mass spectrum was an excellent match with that presented by Philip, et
-1 al. (8) for which structure I was proposed. An intense peak at m/e 123 was noted and is' probably due
m/e 123
to the fragmentation shown.
At a slightly longer retention time the component m/e 234 appears to be another tricyclic alkane, CI7H3,,. Several similar tricyclic alkanes were reported by Jones et al. (4).
The spectrum of m/e 252, identical in WYOl and ALBl extracts, corresponds to C18H36 but is not dodecylcyclohexane (9). There is a prominent M-15 peak at m/e 237 and relatively intense peaks at m/e 111 and 195. The peak at 111 could be assigned as a dimethyl-cyclohexyl fragment.
The compounds detected in the mass range 398-454 in B3, BB1, BB2, and POW extracts appear to be pentacyclic triterpanes since all have prominent m/e 149, 177, 191, and 205 peaks (10). When selected ion chromatograms are compared, WYOl extract shows no m/e 191 peaks for GC retention times in the pentacyclic triterpane region. The BB coal extracts, B3, ALBl and POWl all have numerous small peaks that are probably triterpenoids. Some of these gave appreciable GC FID responses and good mass spec- tra.
The spectrum of m/e 398 is identical for ALBl and POWl extracts. The compound is not adiantane since the m/e 191 is greater than 177, not of similar intensities (11). C27 - C g l triterpanes, especially adiantane, C29, have been found in bitum- inous coal extracts (12).
The pentacyclic component at m/e 412 resembles the spectrum of oleanane (11) or gammacerane. It is also similar to that of lupane (11,13) but lacks the M-43 (369)
fragment indicative of any isopro- pyl sidechain. Therefore, ring E i s probably fi-membered, not 5- membered as in lupane or the hopanes. Although the mass spec- trum is a slightly better match to gammacerane, the short retention time probably rules out gammacer- ane but not oleanane.
The two different C3,H5., penta- cycles (m/e 426), one observed in 992 extract and one in POWl ex- tract had no M-29, M-43 or M-57 fragments. The m/e 205 was small
ruling out structures like lupan-3-one (14). Other differences also eliminate friedelan-3-one and oleanan-3-one type of structure (14).
The m/e 440 pentacyclic representative found i n BB1 and BB2 had an M-29 peak (411) and a prominent peak at 369. It could therefore be a homohopane. None of penta- cyclic structures found in any of the extracts could correspond to the unaltered less stable 17pH, 21BH hopane series because m/e 191 is much larger than the sec- ondary fragment in all cases. The structure could be a 17crH, 21pH hopane which is common in geologically altered sediments of all kinds (111).
&!o H5, m/e 412
98
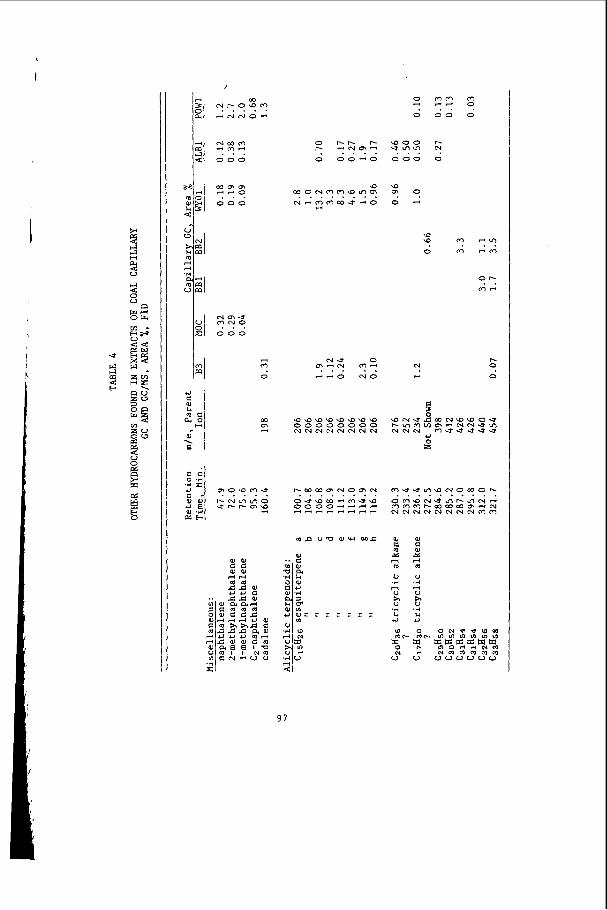
/
m Nr-O\DT . . . . 3 N N O n
N m m 3 m 3 000 . . .
m m m 3 3 0
000 . . .
mu m N o . . . 0 0 0
W W
E E
0 PI- h
0 O O d O I- - ~ m - . . . . .
\o
c . J 3 m m m u * o a o N m m a m m . . . . . . . .
3
N U 0 m - y m - -do N O . . . .
\ o \ o w \ o \ o \ o \ o \ o 00000000 W N N N e 4 N N N
ntP Urn O W MC
0 3
0
-00 - J m m 000 . . .
\D
0 . - 0 ' 9
m m m "7 9 00 0
r-
0 N
\o \o
0
N
,-
1 "v! m - m
O h
m n . .
b 0
0
97
Y
The mfe 454 p e n t a c y c l i c t r i t e r p e n e (BB1, BB2 e x t r a c t s ) i s a l s o uni - d e n t i f i e d .
A number of hydrocarbon f r a c t i o n s from l i q u e f a c t i o n products produced a t GFETC from t h e c o a l s s tud ied here were i n v e s t i g a t e d using s e l e c t e d ion scans of t h e c a p i l - l a r y GC/MS ana lyses . None of t h e
n=0,1,2 ...... hydrocarbon b i o l o g i c a l markers o t h e r than t h e a c y c l i c a lkanes a l r e a d y d iscussed were d e t e c t e d . There were no s e s q u i t e r p e n e s , s e s q u i t e r p a n e s , s t e r a n e s , t r i t e r - panes O K o t h e r c y c l i c te rpenoids found.
8 (CH,), ;H3 CH3
m '.
Clfx e x t r a c t s of t h e seven coa ls were p r o f i l e d us ing c a p i l l a r y GC. The b e s t r e s u l t s were obtained using a J.& W. DB5 60 N fused s i l i c a c a p i l l a r y column wi th H2 c a r r i e r and flame i o n i z a t i o n d e t e c t o r . Temperature programming from 50' t o 125OC a t 0.5'C/ min, from 125' t o 25OOC a t l.O'C/min and from 250' t o 350'C a t 1.5'C/min, then an isothermal p l a t e a u a t 350'C was used.
There were some s t r i k i n g s i m i l a r i t i e s and d i f f e r e n c e s between p r o f i l e s f o r t h e c o a l CHX e x t r a c t s . The p r o f i l e s f o r CHX e x t r a c t s of MOC, BB1 and BB2 were very s i m i l a r . They show no d e t e c t a b l e a lkanes and very few peaks u n t i l 230 min when t h e maximum temperature was reached. Between 230 min. and 320 min. a l a r g e group o f peaks form a dense envelope.
The c a p i l l a r y GC p r o f i l e s f o r B3 and WYOl e x t r a c t s a r e a l s o s t r i k i n g l y s i m i l a r , with near ly every major GC peak having a counterpar t i n each chromatogram. ALBl e x t r a c t shows some s i m i l a r i t y t o t h e WYOl t r a c e b u t d i f f e r s , t h e POWl e x t r a c t p r o f i l e i s a l s o d i f f e r e n t . A l l of t h e GC p r o f i l e s f o r 83 , WO1, ALBl and POWl CHX e x t r a c t s have cont inuous b a s e l i n e reso lved peak d i s t r i b u t i o n s from about 50 t o 350 minutes with var ious recognizable p a t t e r n s . From d u p l i c a t e e x t r a c t i o n s of t h e same coa l and by comparing BBI and BB2 e x t r a c t s , i t may be seen t h a t t h e p r o f i l i n g of t h e hydro- carbon e x t r a c t s i s reproducib le and may be used t o i d e n t i f y and group c o a l s .
Each of t h e CHX e x t r a c t s a l s o contained some oxygen compounds. The elemental an- a l y s e s showed 5-6% oxygen p r e s e n t . Although t h e c h a r a c t e r i z a t i o n of these compounds i s not complete, it may be noted t h a t a l l of t h e e x t r a c t s contained some 60-70 carbon n o n v o l a t i l e waxes ( long cha in f a t t y a c i d es ters) . The presence of these e s t e r s was demonstrated by methanolfBF3 t r a n s e s t e r i f i c a t i o n fol lowed by c a p i l l a r y GC and 200 MHz 'H NMR analyses .
SUMMARY
The chloroform e x t r a c t i o n of seven c o a l s y i e l d e d e x t r a c t s t h a t gave unique c a p i l l a r y GC p r o f i l e s . Severa l groups of hydrocarbon b i o l o g i c a l markers were d e t e c t e d i n t h e coa l e x t r a c t s by mass spectrometry us ing s e l e c t e d ion scans . n-Alkanes, p r i s t a n e , sesqui te rpenes , s e v e r a l t r i c y c l e a lkanes and p e n t a c y c l i c t r i t e r p a n e s wi th molecular weights from 398 t o 454 were de tec ted . The coa l e x t r a c t p r o f i l e s f e l l i n t o four groups: 1) BB1, BB2 (Texas l i g n i t e s ) and MOC (Aus t ra l ian l i g n i t e ) ; 2) B3 (North Dakota l i g n i t e ) and W Y O l (Wyoming, subbi tuminous) ; 3) A L B l (Alber ta , Canandian subbituminous), and 4) POWl (Ohio, bituminous). P r o f i l e s were c h a r a c t e r i s t i c and reproducib le f o r each coa l .
99
ACKNOWLEDGEMENTS
The au thors would l i k e t o thank Art Ruud f o r t h e e x t e n s i v e coa l ana lyses he and h i s group c a r r i e d o u t . Thanks a l s o t o John Diehl f o r running t h e c a p i l l a r y GC p r o f i l e s of t h e seven coa l e x t r a c t s .
REFERENCES
1. B a r t l e , K . D . , Jones , D.W. , Pakdel , H. "Analy t ica l Methods f o r Coal and Coal Products ," Academic P r e s s , New York, San Franc isco , London, 1978; P a r t 11, 209-262.
2 . B a r t l e , K . D . , Jones , D.W. , Pakdel , €I. "Coal and Coal Products : Analy t ica l Charac te r iza t ion Techniques," American Chem. Socie ty Symp. S e r . , American Chemical S o c i e t y , Washington, D . C . , Volume 205, 1982, 27-45.
3. White, C .M. , S h u l t z , J.L., Sharkey, A . G . , J r . Nature , 1977, 268, 620-622.
4 . Jones, D.W., Pakdel , H . , and B a r t l e , K . D . F&, 1982, 61, 44-52.
5 . Rigby, D . , B a t t s , B . D . , and Smith, J.W. Org. Geochem., 1981, 3, 29-36.
6. Richardson, J.S. and M i l l e r , D.E. Anal. Chem., 1982, 54, 765-768.
7. Gallegos, E . J . J- Chromatog. -, 1981, 19, 156-160.
8 . P h i l i p , R.P, G i l b e r t , T . D . , and F r i e d r i c h , J . Geochim Cosmochim A*, 1981, 45, 1173-1180.
9 . Rubinstein, I . and S t r a u s z , O.P. Geochim. Cosmochim Acta, 1979, 1387-1392.
10. Kimble, B . J . , Maxwell, J.R., P h i l i p , R.P, E g l i n t o n , G . , Albrecht , P . , Ens- minger, A . , Arpino, P . , and Ourisson, G . Geochim. Cosmichim. A*, 1974, 38, 1165-1181.
11. Henderson, W . , Wollrab, V . , E g l i n t o n , G . Advan. Org. Geochem. , Proc. I n t . Meet., 4th, 1968, (1969), 181-207.
12. Allan, J., Bjorory , M . , Douglas, A.G. Advan. Org. Geochem., Proc. I n s t . Meet., 7 t h , 1975, (1977), 633-654.
13. Ekweozor, C.M. , Okogun, J . I . , Ekong, D . E . U . , and Maxwell, J . R . Chem. Geol. !.- - 1979, 27, 11-28.
14. Budzikiewicz, H . , Wilson, J.M., D j e r a s s i , C . D . J . Am. Chem. S O C . , 1963, 85, 3688-3699.
15. Ensminger, A . , Van D o r s s e l a e r , A . , S p y c k e r e l l e , Ch. , Albrecht , P . , Ourr ison, G . Adv. Org. Geochem., Proc . I n t . Meet., 6 t h , 1974, (1976), 245-260.
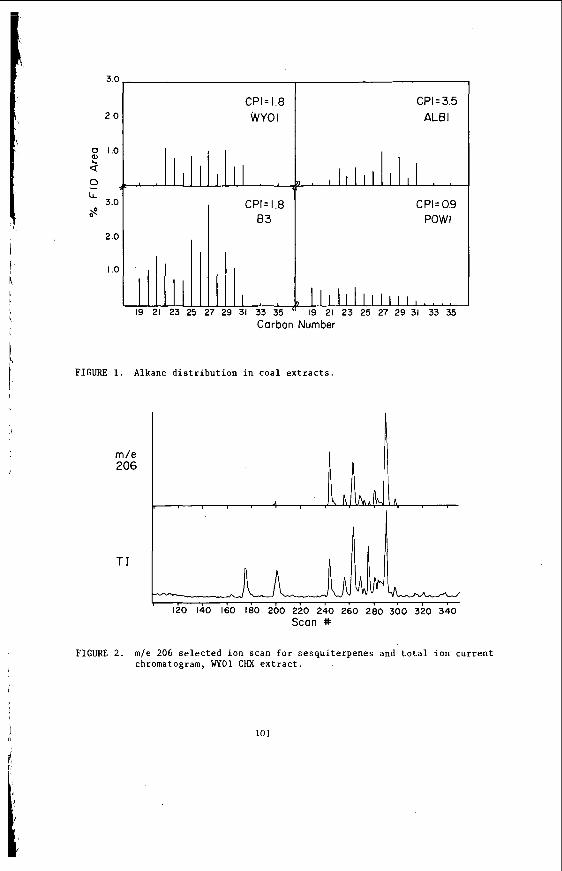
3.0
2 .o
2.0
I .o lll 19 21 \
CPI= 1.8 WYOI
CPI = I .8 83
L 7 29 31 33 35
CPI= 3.5 ALBl
-ALlALL CPI=O.9
POW1
IIIJIIIIIIIIIII.I 19 21 23 25 27 29 31 33 35
wl 23 25
Carbon Number
FIGURE 1. Alkane d i s t r i b u t i o n i n c o a l e x t r a c t s . I
m/e 206
T I
120 140 160 180 200 220 240 260 200 300 320 340 Scan *
FIGURE 2. m/e 206 s e l e c t e d i o n scan f o r sesqui te rpenes and t o t a l i o n c u r r e n t chromatogram, MY01 CHX e x t r a c t .
101
THE ORGANIC CONSTITUTION OF WILCOX LIGNITE
N. Mallya, !.A. Zingaro, R . D . Macfarlane and J.H. Zoel le r , J r .
Department of Chemistry, Texas AEM University, College S ta t ion , Texas 77843
The d is t r ibu t ion of functional groups in low rank coals has been
the subjec t of a body of inves t iga t ions [summarized by Meyers (1982) and
Spiro and Kosky (1982)l o r ien ted towards a description of the k ine t ics and
mechanism of thermal conversion processes.
Californium-252 Plasma Desorption Mass Spectrometry (CFPDMS) as a probe t o
the s t ruc tura l fea tures o f coal have been described by Lyt le , Tingey and
Macfarlane (1982). The in t e rp re t a t ion o f CFPDMS spec t r a has necess i ta ted
a functional group charac te r iza t ion of the coal subs t r a t e by conventional
spectroscopic and chemical techniques. CFPDMS requires the use o f organic
soluble f rac t ions , and we have u t i l i z e d DMSO ex t r ac t s as they seem qu i t e
representative o f the organic func t iona l i t i e s present.
( W L ) and some of i t s s o l u b i l i t y f r ac t ions have been so characterized,
including i t s DMSO so lubles (SD), DMSO insolubles ( ID) , humic ac ids (HA),
a sample demineralized ( D M ) by the method o f Bishop and Ward (1958), the
DMSO ext rac t of t h i s (SOM), and t h e inso luble residue ( I D M ) .
sample used was obtained from a d r i l l core near Rockdale, Texas.
Use o f the new technique o f
Dry Wilcox Lignite
The coal
Extraction of W L w i t h DMSO f o r 24 hours a t room temperature gives
a 20% yie ld of ex t r ac t .
ex t rac t ion and p rec ip i t a t ion with HC1. Removal of residual DMSO in the
solubles and insolubles can be accomplished by HI treatment with subsequent
removal of dimethyl su l f ide and HI, but a t the cos t of some iodine incorpora-
t i on , e ther cleavage, a n d mineral matter l o s s .
Humic ac ids were obtained by aqueous NaOH
102
' ,
\
Acidic Group Ti t ra t ion
Ti t ra t ion for carboxylic ac id content, ( C O O H ) , were car r ied out on
WL, SD, OM, and SDM according t o the methods o f Schafer .(1970a, 1970b);
to ta l ac id i ty was determined on SDM and IDM. The r e s u l t s are reported
on a daf basis in Table 1 .
Of Wilcox l i g n i t e and the demineralized l i g n i t e amounts t o 0.16 and 0 .4
Wg(COOM)/g respectively.
estimated from
An enrichment in ( C O O H ) i n the DMSO ex t r ac t s
Carboxylate bound cation content (COOM) i s
m q ( COOM)/g = ( C O O H ) Oemi neral i zed - ( C o o H ) D r y
Thus the bound cation content o f WL and SD i s some 1.5 and 1 .8 meq(COOM)/g
respectively. From the to t a l ac id i ty da ta , the concentration of hydroxyl
and pyrrole hydrogen (OH,> N H ) i s estimated from
(OH,> N H ) = t o t a l ac id i ty - ( C O O H )
For the demineralized samples, DM and SDM, t h i s amounts t o 4.9 and 5 . 0
mq(OH, > NH)/g.
Nuclear Magnetic Resonance
. Solid s t a t e C 13 NFIRCPMS spec t ra f o r se lec ted s o l u b i l i t y f rac t ions were
obtained by the NMR Center a t Colorado S ta t e University.
derived from the spectra shown in Figure 1 for WL, I D , SD, and HA a re 0.53
0.55, 0.52, and 0.72.
enhanced height of the 123 ppm absorption due t o the t r u l y aromatic carbons,
and to the profusion of carboxylates and aromatic oxygen functions in the
s k i r t downfield of 150 ppm.
Aromaticities
The higher aromaticity of HA i s due t o both the
Proton NMR of SD i n d6-DMSO exh ib i t s t he proton populations shown in
The chemical s h i f t of hydrogen attached t o , o r alpha t o , oxygen Table 2 .
atoms i s n o t a t a l l c l ea r . What i s apparent i s t h a t the high oxygen content
103
,
i
o f t h i s f r a c t i o n g i ves r i s e t o peaks i n t h e 3.0-4.0 ppm r e g i o n o f t he
p r o t o n NMR spectrum.
Oxygen bound carbon a l s o accounts f o r abso rp t i on i n t h e d o w n f i e l d
f l a n k s o f both a romat i c and a l i p h a t i c peaks i n t h e carbon 13 NMR spec t ra .
Use o f s h i f t r e a g e n t s (Shue and Yen (1983) ) i s under s tudy i n i d e n t i f y i n g
t h e f u n c t i o n a l i t i e s i n v o l v e d .
FOURIER TRANSFORM INFRARED SPECTROSCOPY ( FTIR)
FTIR spec t ra of WL, I D , SD and HA were ob ta ined on a O i g i l a b 20C
s p e c t r o w t e r i n KBr d i s c s . A l though g r o s s l y s i m i l a r i n appearance, the
s p e c t r a reveal some no tab le d i f f e r e n c e s . A l i p h a t i c abso rp t i ons a t 2825
and 2920 cm-’ appear i n a l l the spec t ra , b u t t h e 2825 cm-l peak i s much
more in tense i n WL and ID.
absent i n the o the rs .
a shou lde r i n WL and I D , b u t i s n e a r l y as i n tense as t h e coa l band (1600 cm-’)
1 i n SD and HA.
t e n t a t i v e l y ass igned t o t h e a s y m t r i c and symmetric a r y l a l k y l e t h e r
C-0-C s t r e t c h . Both bands a r e sma l l i n HA.
abso rp t i on i s smal l , and t h e 1010 cm-’ abso rp t i on i s masked by t h e k a o l i n i t e
d o u b l e t d t 1010 and 1035 cm-’. O f t h e aromat ic o u t o f p lane bending modes,
o n l y t h e 860 cm-’ band ( i s o l a t e d hydrogen) i s p resen t i n a l l t he f r a c t i o n s .
The d i m i n u i t i v e aromat ic C-H s t r e t c h i n g band (3000-3100 cm- ) i n a l l t h e
f rac t i ons , and the low p o p u l a t i o n o f aromat ic protons (15.3%) seen i n t h e
’H-NMR spectrum o f SD, suggests t h a t t he aromat ic m o i e t i e s a r e sparse and
h i g h l y s u b s t i t u t e d . An u n i d e n t i f i e d abso rp t i on a t 800 cm-’ appears i n a l l
t h e spect ra, b u t i s q u i t e i n t e n s e i n SD.
SD e x h i b i t s a prominent band a t 2970 cm-’,
The carbonyl abso rp t i on a t 1700 cm-’ appears as
SD shows a p a i r o f ’ i n t e n s e bands a t 1260 and 1010 cm- ,
I n WL and I D , t h e 1260 cm-l
1
104
\
P e r t r i fl uoroacet i c Aci d Oxi d a t i o n (PTFA)
The PTFA r e a c t i o n descr ibed by Oeno (1979) has been r e i n v e s t i g a t e d
by Hessley e t a1 (1982) i n the a n a l y s i s o f Wyodak coa l .
t h a t procedure has l e d t o low and v a r i a b l e p roduc t y i e l d s when a p p l i e d t o
Wi lcox l i g n i t e .
t he degradat ion of a l i p h a t i c r e a c t i o n products . Th i s m o d i f i c a t i o n
was developed by Lawrence Shadle a t Pennsylvania S t a t e U n i v e r s i t y .
l i g n i t e y i e l d s one hundred methy l e s t e r s , as de tec ted by GC/MS, o f which
f i f t y comprise ove r 90% o f t h e p roduc t . Fragmentation p a t t e r n s i n d i c a t e
t h a t the m a j o r i t y o f t he products a r e methy l e s t e r s o f branched and. nap then ic
hydrocarbons i n the mo lecu la r we igh t range o f 200 t o 400. Methy l l a u r a t e
i s prominent among t h e s t r a i g h t cha in e s t e r s present .
o x i rane ca rboxy la tes have n o t been de tec ted among the p roduc ts .
NMR o f t he crude ac ids o f WL, SD, I O and HA d i s c l o s e s t h e presence of
v a r i a b l e amounts o f C2 t o C5 mono- and d i c a r b o x y l i c a c i d s .
abso rp t i ons a r e seen i n these spec t ra , w i t h t h e n o t a b l e excep t ion o f a 7.3 ppm
absorp t i on f rom SD.
C a l i f o r n i u m Plasma Desorpt ion Mass Spectrometry (CFPDMS)
I n o u r l a b o r a t o r y ,
Using a ch loroform coso lven t d u r i n g t h e o x i d a t i o n moderates
w i l c o x
Aromat ic e s t e r s and
Proton
No a romat i c
I n the CFPDMS exper iment desc r ibed by Macfar lane and Torgerson (1976),
a f i s s i o n fragment o f Cf-252 impinges on a t h i n f i l m o f s u b s t r a t e , f o rm ing
h i g h mo lecu la r weight i o n s whose mass i s measured b y a TOF mass spect rometer .
C o l l i s i o n r e s u l t s i n a l o c a l i z e d h o t spo t f o r one picosecond, reach ing temperatures
o f some lo4 E x t r a c t s of Wi lcox l i g n i t e t y p i c a l l y show p o s i t i v e and
nega t i ve i o n s i n c l u s t e r s i n t h e mass range of m/z 400 t o 800. I s o l a t e d
c l u s t e r s of peaks a re seen a t low s i g n a l i n t e n s i t y up t o m/z 2000.
i d e n t i f i c a t i o n of these peaks i s o n l y t e n t a t i v e a t t h i s t ime , one o f t h e
K.
Although
10 5
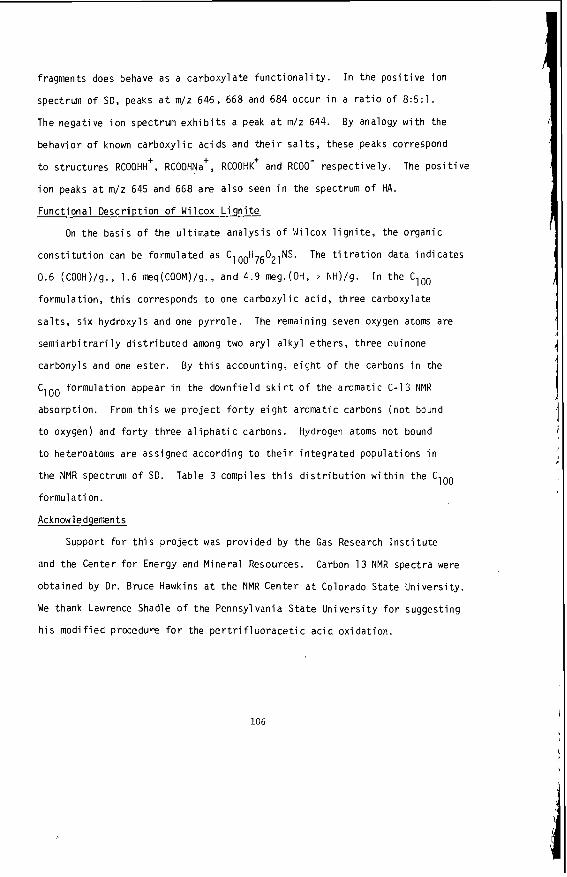
fragments does behave as a c a r b o x y l a t e f u n c t i o n a l i t y .
spectrum o f SD, peaks a t m/z 646, 668 and 684 occu r i n a r a t i o o f 8:5: . The nega t i ve i o n spect rum e x h i b i t s a peak a t m/z 644. By analogy w i t h the
behav io r o f known c a r b o x y l i c a c i d s and t h e i r s a l t s , these peaks correspond
t o s t r u c t u r e s RCOOHH', RCOOHNa', RCOOHK' and RCOO- r e s p e c t i v e l y .
i o n peaks a t m/z 645 and 668 a r e a l s o seen i n the spectrum o f HA.
Func t i ona l D e s c r i p t i o n o f Wi lcox L i g n i t e
I n t h e p o s i t i v e i o n
The p o s i t i v e
On t h e b a s i s o f t h e u l t i m a t e a n a l y s i s o f W i l cox l i g n i t e , t he o rgan ic
c o n s t i t u t i o n can be fo rmu la ted as C100H76021NS.
0.6 (COOH)/g., 1.6 meq(COOM)/g., and 4.9 meg.(OH, > I iH)/g. I n t h e Cloo
f o rmu la t i on , t h i s corresponds t o one c a r b o x y l i c a c i d , t h r e e ca rboxy la te
s a l t s , s i x hyd roxy l s and one p y r r o l e .
s e m i a r b i t r a r i l y d i s t r i b u t e d among two a r y l a l k y l e t h e r s , t h r e e quinone
carbonyls and one e s t e r . By t h i s accoun t ing , e i g h t o f the carbons i n the
Cloo f o r m u l a t i o n appear i n the d o w n f i e l d s k i r t o f t h e a romat i c C-13 NMR
abso rp t i on .
t o oxygen) and f o r t y t h r e e a l i p h a t i c carbons.
t o heteroatoms a r e ass igned acco rd ing t o t h e i r i n t e g r a t e d popu la t i ons i n
t h e NMR spectrum o f SD.
formula t i on.
Acknowledgements
The t i t r a t i o n data i n d i c a t e s
The remain ing seven oxygen atoms a re
From t h i s we p r o j e c t f o r t y e i g h t a romat i c carbons ( n o t bound
Hydrogen atoms n o t bound
Table 3 compi les t h i s d i s t r i b u t i o n w i t h i n t h e Cloo
Suppor t f o r t h i s p r o j e c t was p r o v i d e d by t h e Gas Research I n s t i t u t e
and the Center f o r Energy and M i n e r a l Resources. Carbon 13 NMR spec t ra were
o b t a i n e d by D r . Bruce Hawkins a t t h e NMR Cen te r a t Colorado S t a t e U n i v e r s i t y .
We thank Lawrence S h a d e o f t h e Pennsylvania S t a t e U n i v e r s i t y f o r suggest ing
h i s m o d i f i e d procedure f o r the p e r t r i f l u o r a c e t i c a c i d o x i d a t i o n .
106
I'
Reference 5
Bishop, M. and Ward, D.L. (1958) "The I l i r e c t Determinat ion o f M i n e r a l Ma t te r i n Coal": Fuel 2, 191.
Deno, N.C., Gr iegger, B.A., Jones, A.D., Rak i tsky , N.G. and St roud, S.G. (1979) "Coal S t r u c t u r e and Coal L ique fac t i on " ; F i n a l Report t o E l e c t r i c Power Research I n s t i t u t e from Pennsylvania S t a t e U n i v e r s i t y , AF-960, RP-779- 16.
Hess l l y , R.K., Benjamin, B.M. and Larsen, J.W. (1982) "Deno O x i d a t i o n . I s o l a t i o n o f High Mo lecu la r Weight A l i p h a t i c M a t e r i a l f rom Coals and F u r t h e r Model Compound S t u d i e s " ; Fuel 61, 1085.
L y t l e , J.M. Tingey, G.L. and Macfar lane, R.D. (1982) "Cal i fornium-252 Plasma Desorp t ion Mass Spectrometry o f S o l i d Coal" : Anal. Chem. 54, 1881.
Macfarlane, R.D. and Torgerson, D.F. (1976) "252Ca l i f o rn ium Plasma Desorp t ion Time o f F l i g h t Mass Spectrometry": I n t . J. o f Mass Spec. and Ion Physics.
Meyers, R.A. (1982) "Coal S t r u c t u r e " : Academic Press, New York.
Schafer, H.N.S. (1970a) "Carboxyl Groups and I o n Exchange i n Low Rank Coals": Fuel 9, 197.
Schafer, H.N.S. (1970b) " Determinat ion o f T o t a l A c i d i t y o f Low Rank Coals": Fuel 49, 271.
Spiro, C.L. and Kosky, P.G. (1982) "Space F i l l i n g Models f o r Coal. 2 Extension t o Coals o f Var ious Ranks": Fuel 61, 1080.
Shue, F.F. and Yen, T.F. (1983) " A p p l i c a t i o n o f Lanthanid:, NMR S t i i f t Reagents f o r Func t iona l Group Stud ies o f Shale Bitumen Asphaltenes Fuel 62, 127.
107
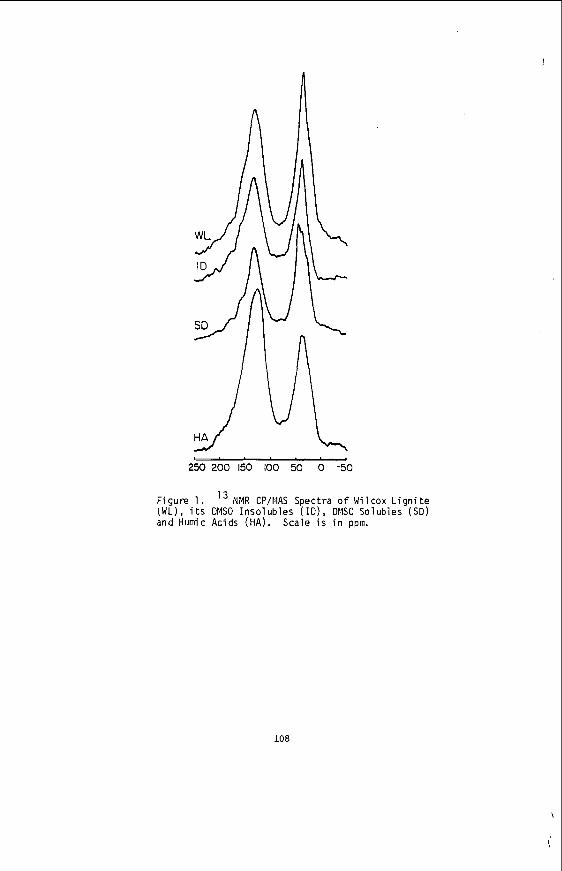
u , I
250 ZOO 150 100 50 0 -50
Figure 1 . l 3 NMR CP/WAS Spectra o f Wilcox Lignite (WL), i t s DMSO Insolubles (ID), DMSO Solubles ( S D ) and Humic Acids (HA) . Scale i s in ppm.
108
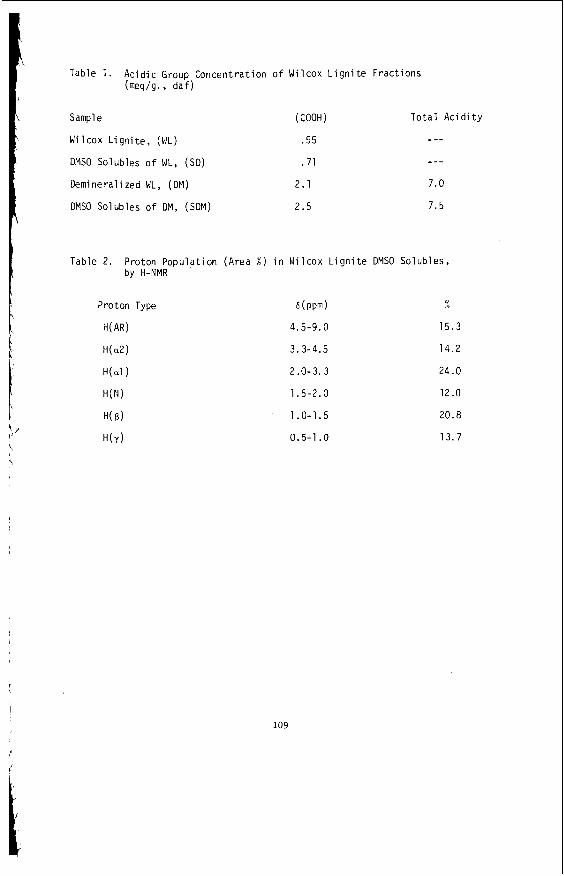
Table 1. Ac id i c Group Concentrat ion o f Wi lcox L i g n i t e F rac t i ons (meq/g., daf )
Sample
Wi lcox L i g n i t e , (WL)
DMSO Solubles o f WL, ( S O )
Deminera l ized WL, (DM)
DMSO Solubles o f DM, (SDM)
( COOH )
.55
.71
2.1
2.5
T o t a l A c i d i t y
--- ---
7.0
7.5
Table 2. Proton Popu la t i on (Area % ) i n Wi lcox L i g n i t e DMSO Solubles, by H-NMR
6(ppm)
4.5-9.0
3.3-4.5
2 .O -3 .3
1.5-2.0
1.0-1.5
0.5-1 .O
N
15.3
14.2
24.0
12.0
20.8
13.7
109

Table 3. Account ing of Func t i ona l Groups and Atoms i n the C1 oH7 021NSM3 Formulat ion o f Wi lcox L i g n i t e Organic Ma t te r . M = Ra, Ea, e t c .
Group Popu la t i on i n t h e Atoms Present i n S p e c i f i e d Groups Cloo Fo rmu la t i on C H 0 N S M
-COOH 1
-coox 3
-OH 6
>N-H 1
R-0-Ar 2
>c=o 3
RCOOR 1
Aromatic C 49
A l i p h a t i c C 43
H(AR) 10.4
H(a2) 9.9
16.3
H(N) a. 2
H(6) 14.1
H ( Y ) 9.3
Thiophene( ? )
1 1 2
3 6
6 6
1 1
2
3 3
1
49
43
10
10
16
a 14
10
2
3
110
I
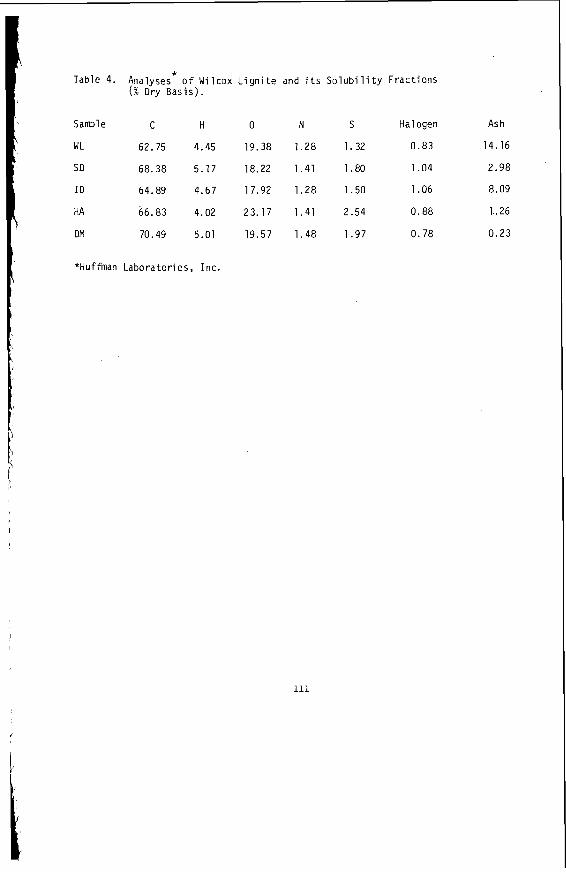
Table 4. Analyses* o f W i l c o x L i g n i t e and i t s S o l u b i l i t y F rac t i ons ( % Dry Bas is ) .
Sample C H
WL 62.75 4.45
SD 68.38 5.17
I D 64.89 4.67
HA 66.83 4.02
DM 70.49 5.01
*Huffman Labora tor ies , I nc.
0
19.38
18.22
17.92
23.17
19.57
N
1.28
1.41
1.28
1.41
1 .48
S Halogen Ash
1.32 0.83 14.16
1.80 1.04 2.98
1.50 1.06 8.09
2.54 0.88 1.26
1.97 0.78 0.23
111
ANALYSIS OF THE INORGANIC CONSTITUENTS I N LOW-RANK COALS
G . P . Huffman and F. E . Hugqins
U . S . S t e e l C o r p o r a t i o n , Research Labora to ry 125 Jamison Lane, Monroev i l l e , PA 15146
Introduction
I n r e c e n t y e a r s , numerous modern a n a l y t i c a l t e c h n i q u e s have been a p p l i e d t o t h e a n a l y s i s o f t h e i n o r g a n i c c o n s t i t u e n t s i n c o a l . A t t h e U.S. S t e e l Research L a b o r a t o r y , Mossbauer spec t roscopy and compute r - con t ro l l ed s c a n n i n g e l e c t r o n microscopy have been empha- s i z e d ( 1 - 5 ) . With t h e a d v e n t o f v e r y i n t e n s e s y n c h r o t r o n r a d i a t i o n s o u r c e s , t h e t e c h n i q u e o f e x t e n d e d X-ray a b s o r p t i o n f i n e s t r u c t u r e (EXAFS) spec t roscopy has been a p p l i e d i n many a r e a s of m a t e r i a l s s c i e n c e , and s e v e r a l v e r y r e c e n t a r t ic les on EXAFS s t u d i e s o f t h e i n o r g a n i c c o n s t i t u e n t s of c o a l have a p p e a r e d ( 6 - 8 ) . For t h e most p a r t , p r e v i o u s l y pub l i shed work h a s r e p o r t e d i n v e s t i g a t i o n s o f b i tuminous coals by t h e s e t h r e e t e c h n i q u e s . I n t h e c u r r e n t a r t i c l e , w e p r e s e n t s o m e examples o f t h e a n a l y s i s o f t h e i n o r g a n i c c o n s t i t u e n t s o f l o w e r - r ank c o a l s , p r i n c i p a l l y l i g n i t e s , by t h e s e methods. Although t h e s u i t e of lov- rank c o a l s i n v e s t i g a t e d i s r a t h e r l i m i t e d , some d i s t i n c t d i f f e r e n c e s between t h e i n o r g a n i c phase d i s t r i b u t i o n s i n t h e s e c o a l s and t h o s e i n b i tuminous c o a l s are a p p a r e n t .
Experimental
e m i s s i o n and a b s o r p t i o n of low-energy n u c l e a r gamma r a y s . n u c l e u s e x h i b i t s t h e b e s t Mossbauer p r o p e r t i e s of a l l i s o t o p e s f o r which t h e Mossbauer e f f e c t h a s been o b s e r v e d , and 57Fe Mossbauer spec- t r o s c o p y i s perhaps t h e b e s t method a v a i l a b l e f o r q u a n t i t a t i v e a n a l - y s i s of t h e i r o n - b e a r i n g p h a s e s i n complex, m u l t i p h a s e samples . A s d i s c u s s e d i n r e c e n t rev iew a r t i c l e s ( 2 , 9 , 1 0 ) e v e r y i r o n - b e a r i n g com- pound e x h i b i t s a c h a r a c t e r i s t i c I lossbauer a b s o r p t i o n spec t rum, and t h e pe rcen tage o f t h e t o t a l i r o n c o n t a i n e d i n each phase c a n b e de- t e rmined from a b s o r p t i o n peak areas. D e t a i l e d d e s c r i p t i o n s of t h e Mossbauer s p e c t r o m e t e r and d a t a a n a l y s i s programs used i n t h i s l a b - o r a t o r y , and d i s c u s s i o n of t h e p h y s i c a l b a s i s o f t h e 'Mossbauer t ech - n i q u e a r e g iven e l s e w h e r e ( l 0 ) .
deve loped i n t h i s l a b o r a t o r y c o n s i s t s o f a n SEM i n t e r f a c e d by mini - computer t o a beam-cont ro l u n i t and an energy d i s p e r s i v e X-ray ana l - y s i s system. D e t a i l e d d e s c r i p t i o n s of t h i s i n s t r u m e n t and i t s u s e i n t h e d e t e r m i n a t i o n o f c o a l mine ra logy and o t h e r a p p l i c a t i o n s a r e g i v e n e l s e w h e r e ( 3 , l l ) . B r i e f l y , t h e beam i s s t e p p e d a c r o s s t h e sample i n a c o a r s e g r i d p a t t e r n , w i t h t y p i c a l l y 300 x 300 g r i d p o i n t s cover - i n g t h e f i e l d o f view. A t e ach p o i n t , t h e b a c k s c a t t e r e d e l e c t r o n i n - t e n s i t y is sampled, and t h e minicomputer d e c i d e s whether o r n o t t h e beam i s on a p a r t i c l e . Once a p a r t i c l e i s i d e n t i f i e d , t h e g r i d den- s i t y i s i n c r e a s e d t o 2 0 4 8 x 2 0 4 8 and t h e a r e a o f t h e p a r t i c l e i s measured . The beam-cont ro l u n i t t h e n p l a c e s t h e electron beam back
Mossbauer s p e c t r o s c o p y i s a s p e c t r o s c o p y based on t h e r e s o n a n t The 57Fe
The compute r - con t ro l l ed s c a n n i n g e l e c t r o n microscope (CCSEM)
112
\ I
a t t h e c e n t e r o f t h e p a r t i c l e and an energy d i s p e r s i v e X-ray spec t rum i s c o l l e c t e d . Each p a r t i c l e is t h e n p l a c e d i n t o one of up t o 30 Cate- g o r i e s ( m i n e r a l s , compounds, e tc . ) on t h e b a s i s o f t h e c h e m i s t r y i n d i - c a t e d by i t s X-ray emiss ion spec t rum, and approximate we igh t p e r c e n t - a g e s Of a l l c a t e g o r i e s a r e c a l c u l a t e d . CCSEM i s c a p a b l e o f measur ing t h e s i z e and chemica l composi t ion o f up t o 1 0 0 0 p a r t i c l e s p e r hour f o r many k inds o f p a r t i c u l a t e samples .
EXAFS spec t roscopy examines t h e o s c i l l a t o r y f i n e s t r u c t u r e above t h e a b s o r p t i o n edge i n t h e X-ray a b s o r p t i o n spec t rum o f a p a r t i c u l a r e lement . These o s c i l l a t i o n s a r i se from i n t e r f e r e n c e between t h e o u t - go ing p h o t o e l e c t r o n wave and s c a t t e r e d waves produced by i n t e r a c t i o n Of t h e p h o t o e l e c t r o n s w i t h ne ighbor ing a toms. A s d i s c u s s e d e l sewhere (12 ,131 , F o u r i e r t r a n s f o r m t e c h n i q u e s can be used t o e x t r a c t from t h e s e o s c i l l a t i o n s i n f o r m a t i o n a b o u t t h e bond d i s t a n c e s , c o o r d i n a t i o n numbers, and t y p e s o f l i g a n d s s u r r o u n d i n g t h e a b s o r b i n g e l emen t . Addi- t i o n a l i n f o r m a t i o n abou t t h e v a l e n c e or e l e c t r o n i c s t a t e o f t h e ab- s o r b i n g i o n and t h e l i g a n d symmetry can be o b t a i n e d from examining t h e X-ray a b s o r p t i o n near-edge s p e c t r a , o r XANES, i n t h e energy r e g i o n very c l o s e t o t h e a b s o r p t i o n edge ( w i t h i n approx ima te ly 520-30 e V ) . Such XANES s p e c t r a f r e q u e n t l y p rov ide c h a r a c t e r i s t i c f i n g e r p r i n t s f o r d i f f e r e n t t y p e s o f l i g a n d bonding t o a n a b s o r b i n g i o n ( 6 , ? , 1 4 , 1 5 ) .
r e f e r e n c e compounds d i s c u s s e d i n t h i s pape r w e r e r eco rded a t t h e S t a n f o r d Synchro t ron R a d i a t i o n Labora to ry (SSRL) d u r i n g a d e d i c a t e d run o f t h e S t a n f o r d P o s i t r o n - E l e c t r o n A c c e l e r a t i o n Ring a t an e l e c t r o n energy o f 3 .0 GeV. The ca l c ium K-edge o c c u r s a t 4038 e V and d a t a were c o l l e c t e d from 3800 t o 5000 e V , u s i n g a doub le S i (111) monochromator and a f l u o r e s c e n c e d e t e c t o r s i m i l a r t o t h a t o f S t e a r n and H e a l d ( l 6 ) . A more d e t a i l e d d i s c u s s i o n o f t h i s work w i l l a p p e a r e l s e w h e r e ( l 7 ) .
The samples examined were predominant ly l i g n i t e s f r o m t h e P u s t s e a m i n Montana. However, d a t a f o r two Nor th Dakota l i g n i t e s , f o r s l a g g i n g and f o u l i n g d e p o s i t s produced by t h o s e l i g n i t e s , and f o r s e v e r a l subbi tuminous c o a l s a r e a l s o i n c l u d e d .
Results and Discussion
The X-ray a b s o r p t i o n s p e c t r a o f ca l c ium-con ta in ing c o a l s and
Mossbauer spec t roscopy r e s u l t s f o r a l l samples i n v e s t i g a t e d a r e summarized i n Tab le I . The p e r c e n t a g e s o f t h e t o t a l sample i r o n con- t a i n e d i n each o f t h e i r o n - b e a r i n g m i n e r a l s i d e n t i f i e d a r e g i v e n i n columns 1 t o 4 , and t h e we igh t p e r c e n t a g e o f p y r i t i c s u l f u r , d e t e r - mined from t h e p y r i t e a b s o r p t i o n peak a r e a s a s d i s c u s s e d e l s e w h e r e ( l ) , a r e g i v e n i n column 5 . I t i s s e e n t h a t p y r i t e and m i n e r a l s ( i r o n s u l f a t e s and i r o n oxyhydroxide) t h a t are p robab ly d e r i v e d from p y r i t e by wea the r ing are t h e o n l y i r o n - b e a r i n g s p e c i e s i n t h e s e low-rank coals. Notably a b s e n t are c o n t r i b u t i o n s from i r o n - b e a r i n g c l a y s and s i d e r i t e which a re common c o n s t i t u e n t s of b i tuminous c o a l s ( l , 2 ) . P y r i t e and i r o n oxyhydroxide a r e d i f f i c u l t t o s e p a r a t e w i t h room tempera tu re Mossbauer s p e c t r o s c o p y ( l 8 ) . F o r example, i n F i g u r e 1 a r e shown t h e room t e m p e r a t u r e and 77 K s p e c t r a o b t a i n e d from t h e Dus t seam, C, l i g n i t e , which had been s t o r e d f o r several y e a r s p r i o r t o measurement. Although it i s q u i t e d i f f i c u l t t o d e t e r m i n e t h e rela- t ive amounts of p y r i t e and oxyhydroxide from t h e r o o m t empera tu re Mossbauer spec t rum, t h e s p e c t r a l c o n t r i b u t i o n s o f t h e two phases are
113
r e a d i l y r e s o l v e d a t 77 I;.
i n o r g a n i c phases are g i v e n i n Tab le 11. Perhaps t h e most i n t e r e s t i n g a s p e c t of t h e CCSEM r e s u l t s f o r t h e s e low-rank c o a l s a s compared wi th s i m i l a r d a t a f o r b i tuminous c o a l s i s t h e abundance o f Ca- r ich phases . I n m o s t cases, t h e s e phases a r e n o t c a l c i t e , b u t are Ca-enriched macera ls i n which t h e Ca i s un i fo rmly d i s p e r s e d th roughou t t h e c o a l , a s i l l u s t r a t e d by t h e SEM micrograph i n F i g u r e 2 . The Ca-enr iched macerals a p p e a r g r a y i n t h i s i n v e r t e d b a c k s c a t t e r e d e l e c t r o n image. An energy d i s p e r s i v e X-ray spec t rum o b t a i n e d from a n i n d i v i d u a l mace- ra l is shown on t h e r i g h t . A s d i s c u s s e d below, EXAFS d a t a i n d i c a t e t h a t t h i s ca l c ium is d i s p e r s e d as s a l t s o f c a r b o x y l i c a c i d s .
The b a c k s c a t t e r e d e l e c t r o n i n t e n s i t y o f t h e Ca-enriched macer- a l s i s s i g n i f i c a n t l y s m a l l e r t h a n t h a t o f c a l c i t e , and CCSEM c a n make a d i s t i n c t i o n , a l b e i t somewhat i m p r e c i s e l y , between Ca-enr iched mac- e ra l s and c a l c i t e o r o t h e r Ca- r i ch m i n e r a l s on t h i s b a s i s . However, t h e CCSEM programs have n o t been p r o p e r l y c a l i b r a t e d t o d e a l w i t h t h e case o f macerals e n r i c h e d i n a n i n o r g a n i c component such a s C a a t t h i s p o i n t . Consequent ly , t h e p e r c e n t a g e s i n d i c a t e d i n Tab le I1 f o r t h e Ca-r ich c a t e g o r y a re o n l y a q u a l i t a t i v e i n d i c a t i o n o f t h e rela- t i v e amounts of t h i s s p e c i e s i n t h e v a r i o u s low-rank coals examined. On t h e b a s i s o f t h e b a c k s c a t t e r e d e l e c t r o n i n t e n s i t y , i t appea r s t h a t calcium is d i s p e r s e d th roughou t t h e m a c e r a l s o f t h e l i g n i t e s t h a t have been examined, and i s p r e s e n t p a r t i a l l y i n d i s p e r s e d form and p a r t i a l l y a s ca lc i te i n t h e subb i tuminous c o a l s . I n f r e s h b i tuminous c o a l s , ca l c ium is p r e s e n t a l m o s t e x c l u s i v e l y as c a l c i t e ( 3 - 5 ) .
and t y p i c a l v a l u e s o f t h e m i n e r a l d i s t r i b u t i o n s obse rved i n b i tumi - nous c o a l s by t h e CCSEM and Mossbauer t e c h n i q u e s , d e r i v e d from s t u d i e s of perhaps a hundred d i f f e r e n t b i tuminous c o a l samples i n t h i s l a b o r a - t o r y . Some obvious d i f f e r e n c e s i n mine ra logy are a p p a r e n t . I n addi - t i o n t o t h e d i f f e r e n c e i n c a l c i u m d i s p e r s i o n and abundance a l r e a d y n o t e d , it i s seen t h a t c e r t a i n m i n e r a l s common i n b i tuminous c o a l s , such a s Fe-bearing. c l a y s ( i l l i t e and c h l o r i t e ) and s i d e r i t e , are v i r - t u a l l y a b s e n t i n t h e low-rank samples of Tab le s I and 11. Conver se ly , mine ra l s s u c h as b a r i t e (BaS04) , a p a t i t e (Cag(P04)30H) , and o t h e r Ca, S r phospha te s , a r e r a t h e r uncommon i n b i tuminous c o a l s .
l i g n i t e c a n be b r i e f l y summarized by r e f e r e n c e t o F i g u r e s 3 and 4 . F i g u r e 3 shows t h e XANES o f t h e l i g n i t e , C a a c e t a t e , and a f r e s h b i t u - minious coal from t h e P i t t s b u r g h s e a m r i c h i n c a l c i t e . The s t r o n g s i m i l a r i t y between t h e l i g n i t e and c a l c i u m a c e t a t e s p e c t r a i s a p p a r e n t S i m i l a r l y , a c l o s e s i m i l a r i t y i s a l s o obse rved f o r t h e XANES of t h e f r e s h b i tuminous c o a l and t h a t o f a c a l c i t e s t a n d a r d . Examinat ion of t h e XANES o f s e v e r a l o t h e r s t a n d a r d compounds ( C a O , Ca(OH)2, and CaS04.2H20) showed t h a t none of t h e s e phases w e r e p r e s e n t i n d e t e c t - a b l e amounts i n e i t h e r c o a l . The s t r o n g s i m i l a r i t y o f t h e XANES o f ca l c ium a c e t a t e and t h a t o f t h e l i g n i t e i s d i r e c t ev idence t h a t t h e ca l c ium i n t h i s c o a l i s a s s o c i a t e d w i t h c a r b o x y l groups i n t h e macer- a l s and i s n o t c o n t a i n e d i n v e r y f i n e (~0.1 pm) m i n e r a l mat ter .
Mathematical a n a l y s i s o f t h e EXAFS a s s o c i a t e d w i t h t h e n e a r e s t - ne ighbor oxygen s h e l l s u r r o u n d i n g t h e C a i o n s i n t h e l i g n i t e w a s
cCSEM r e s u l t s f o r t h e approx ima te we igh t p e r c e n t a g e s o f a l l
For comparison w i t h T a b l e s I and 11, Tab le I11 g i v e s t h e range
EXAFS and XANES d a t a f o r a Ca-r ich sample o f t h e P u s t seam, A ,
114
\
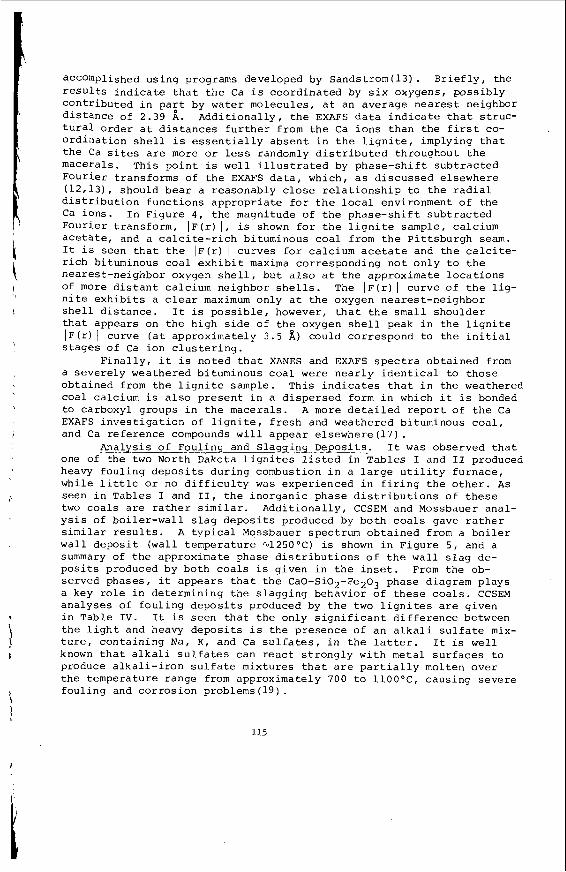
accomplished u s i n g programs developed by S a n d s t r o m ( l 3 ) . B r i e f l y , t h e r e s u l t s i n d i c a t e t h a t t h e C a i s c o o r d i n a t e d by s i x oxygens, p o s s i b l y Con t r ibu ted i n p a r t by wa te r molecu le s , a t an a v e r a g e n e a r e s t ne ighbor d i s t a n c e of 2.39 A. A d d i t i o n a l l y , t h e EXAFS d a t a i n d i c a t e t h a t S t ruc - t u r a l o r d e r a t d i s t a n c e s f u r t h e r from t h e C a i o n s t h a n t h e f i r s t co- o r d i n a t i o n s h e l l i s e s s e n t i a l l y a b s e n t i n t h e l i g n i t e , imply ing t h a t t h e Ca si tes are more o r less randomly d i s t r i b u t e d th roughou t t h e mace ra l s . Th i s p o i n t i s w e l l i l l u s t r a t e d by p h a s e - s h i f t s u b t r a c t e d F o u r i e r t r a n s f o r m s of t h e EXAFS d a t a , which , a s d i s c u s s e d e l sewhere ( 1 2 , 1 3 ) , shou ld b e a r a r easonab ly close r e l a t i o n s h i p t o t h e r a d i a l d i s t r i b u t i o n f u n c t i o n s a p p r o p r i a t e f o r t h e local envi ronment o f t h e C a i o n s . I n F i g u r e 4 , t h e magnitude of t h e p h a s e - s h i f t s u b t r a c t e d F o u r i e r t r a n s f o r m , I F ( r ) I , is shown f o r t h e l i g n i t e sample , ca l c ium a c e t a t e , and a c a l c i t e - r i c h b i tuminous coal from t h e P i t t s b u r g h seam. I t i s seen t h a t t h e I F ( r ) I curves f o r ca l c ium a c e t a t e and t h e calci te- r i c h b i tuminous c o a l e x h i b i t maxima co r re spond ing n o t o n l y t o t h e nea res t -ne ighbor oxygen s h e l l , b u t a l s o a t t h e approx ima te l o c a t i o n s Of more d i s t a n t ca l c ium ne ighbor s h e l l s . The I F ( r ) 1 c u r v e o f t h e l i g - n i t e e x h i b i t s a c lear maximum o n l y a t t h e oxygen n e a r e s t - n e i g h b o r s h e l l d i s t a n c e . I t i s p o s s i b l e , however, t h a t t h e s m a l l s h o u l d e r t h a t appea r s on t h e h i g h s i d e o f t h e oxygen s h e l l peak i n t h e l i g n i t e I F ( r ) I curve ( a t approx ima te ly 3 .5 A ) cou ld co r re spond t o t h e i n i t i a l s t a g e s o f C a i o n c l u s t e r i n g .
F i n a l l y , it i s no ted t h a t XANES and EXAFS s p e c t r a o b t a i n e d from a s e v e r e l y wea the red b i tuminous c o a l w e r e n e a r l y i d e n t i c a l t o t h o s e o b t a i n e d from t h e l i g n i t e sample. T h i s i n d i c a t e s t h a t i n t h e weathered c o a l ca l c ium i s a lso p r e s e n t i n a d i s p e r s e d form i n which i t i s bonded t o carboxyl groups i n t h e mace ra l s . A more d e t a i l e d r e p o r t o f t h e Ca EXAFS i n v e s t i g a t i o n of l i g n i t e , f r e s h and wea the red b i tuminous c o a l , and Ca r e f e r e n c e compounds w i l l a p p e a r e l s e w h e r e ( l 7 ) .
one of t h e t w o North Dakota l i g n i t e s l i s t e d i n T a b l e s I and I1 produced heavy f o u l i n g d e p o s i t s d u r i n g combustion i n a l a r g e u t i l i t y f u r n a c e , wh i l e l i t t l e or no d i f f i c u l t y was expe r i enced i n f i r i n g t h e o t h e r . As seen i n Tab les I and 11, t h e i n o r g a n i c phase d i s t r i b u t i o n s o f t h e s e two c o a l s a r e r a t h e r s i m i l a r . A d d i t i o n a l l y , CCSEM and Mossbauer ana l - y s i s o f b o i l e r - w a l l s l a g d e p o s i t s produced by b o t h coals gave r a t h e r s imi l a r r e s u l t s . A t y p i c a l Mossbauer spec t rum o b t a i n e d from a b o i l e r w a l l d e p o s i t ( w a l l t e m p e r a t u r e 'I.125OoC) i s shown i n F i g u r e 5 , and a summary of t h e approximate phase d i s t r i b u t i o n s o f t h e w a l l s l a g de- p o s i t s produced by bo th c o a l s is g i v e n i n t h e i n s e t . From t h e ob- se rved phases , it a p p e a r s t h a t t h e Ca0-Si02-Fe203 phase d iagram p l a y s a key r o l e i n d e t e r m i n i n g t h e s l a g g i n g behav io r o f t h e s e coals. CCSEM a n a l y s e s of f o u l i n g d e p o s i t s produced by t h e two l i g n i t e s are g iven i n Tab le I V . I t i s s e e n t h a t t h e on ly s i g n i f i c a n t d i f f e r e n c e between t h e l i g h t and heavy d e p o s i t s i s t h e p r e s e n c e of a n a l k a l i s u l f a t e mix- t u r e , c o n t a i n i n g N a , K , and C a s u l f a t e s , i n t h e l a t t e r . I t i s w e l l known t h a t a l k a l i s u l f a t e s can r e a c t s t r o n g l y w i t h me ta l s u r f a c e s t o produce a l k a l i - i r o n s u l f a t e mix tu res t h a t a r e p a r t i a l l y mol ten o v e r t h e t empera tu re r ange from approx ima te ly 700 t o l l O O ° C , c a u s i n g s e v e r e f o u l i n g and c o r r o s i o n problems (19) .
Analys i s o f Fou l ing and S laqg ing Depos i t s . I t was obse rved t h a t
115
C o n c l u s i o n s
n e s s of t h r e e t e c h n i q u e s , Mosshauer spec%roscopy , CCSEM, and EXAFS i n t h e a n a l y s i s o f low-rank coals and combustion p r o d u c t s of ].ow-rank coals. p o i n t s of i n t e r e s t r e q a r d i n g t h e i n o r g a n i c c o n s t i t u e n t s o f . t h e s e coals i n c l i l d e t h e h i g h abundance of c a l c i u m bonded t o ca rboxy l g roups and d i s p e r s e d t h r o u g h o u t t h e macerals, t h e low abundance of i l l i t e , s i d e r i t e , and ca l c i t e , and the p r e s e n c e o f s i q n i f i c a n t amounts o f a c c e s s o r y minerals such as bar i te , a p a t i t e , and o the r p h o s p h a t e s . A r e a s t h a t m e r i t f u r t h e r i n v e s t i g a t i o n by t h e s e t e c h n i q u e s i n c l u d e t he a n a l y s i s of f o u l i n g and s l a q g i n g d e p o s i t s , and s t r u c t u r a l s t u d i e s of i n o r g a n i c e l emen t s such as calcium t h a t are d i s p e r s e d through and bonded t o t h e coal macerals.
A c k n o w l e d g m e n t s I
I I n t h i s p a p e r , w e nave p r e s e n t e d some examnles of t h e u s e f u l -
The EXAFS expe r imen t s d i s c u s s e d i n t h i s pape r w e r e conduc ted i n c o l l a b o r a t i o n w i t h F.W. L y t l e and R.B. Greeqor of t h e Boeing Company a t t h e S t a n f o r d Synchro t ron R a d i a t i o n L a b o r a t o r y , which is suppor t ed by t h e N a t i o n a l S c i e n c e Foundat ion and t h e Department o f
‘ I Energy.
R e f e r e n c e s
1. Huffman, G.P., Huggins, F.E., Fuel, 1978, 57 , 592-604. 2. Huqqins, F.E., Huffman, G.P., Anal. Methods f o r Coal and Coal
P r o d u c t s , Clarence Karr, Jr . , E d . ; Academic: New York, 1979,
3 . Huggins, F.E., Kosmack, D . A . , Huffman, G . P . , - L e e , R . J . , SEM/ 1980/ I , 531-540, SEM I n c . , AMF O ’ H a r e ( C h i c a g o ) , I L ( 1 9 8 0 ) .
4. Huffman, G.P., Huqqins, F.E., Lee , R.J., P r o c . I n t . Conference on Coal S c i e n c e , D u s s e l d o r f , 1981, 835-840, Ver l aq Gluckauf GmbH, E s s e n , Germany ( 1 9 8 1 ) .
5. Hugqins, F.E., Huffman, G.P., Lee, R . J . , Coal and C o a l P r o d u c t s : A n a l y t i c a l C h a r a c t e r i z a t i o n Techn iques , E.L. F u l l e r , Jr . , Ed.; ACS Symposium S e r i e s N o . 205, 1982, 239-258, Amer. Chem. SOC., Washington, D.C.
Greegor, R . B . , S c i e n c e , 1981, 214, 554.
1982, 61, 195.
A c t i v i t y R e p o r t , May 1 9 8 1 , A. Bienens tock and H . Winick, Eds. ;
V o l . 3 , 371-423.
6 . Maylo t te , D.H., Wonq, J., S t . P e t e r s , R.L., L y t l e , F.W.,
7. Sandstrom, D . R . , F i l b y , R . H . , L y t l e , F.W., Greeqor , R . B . , Fuel,
8 . Hussa in , Z., B a r t o n , J.J., Umbach, E . , S h i r l e y , D.A., SSRZ,
p . VII-102. 9 . Huffman, G.P., Huqqins, F.E., Mossbauer Spec t roscopy and Its
Chemical A p p l i c a t i o n s , J . G . S t e v e n s and G . K . Shenoy, Eds . ; Advances i n Chemis t ry S e r i e s N o . 1 9 4 , 1981, 265-301, Amer. Chem. SOC., Washington, D.C.
F.C. Schwerer , Ed.; AIP Conf. Proc . N o . 84 , Amer. I n s t . P h y s i c s , 1 0 . Huffman, G.P., Huqqins, F.E., P h y s i c s i n t h e S t e e l I n d u s t r y ,
1982, 149-201.
116
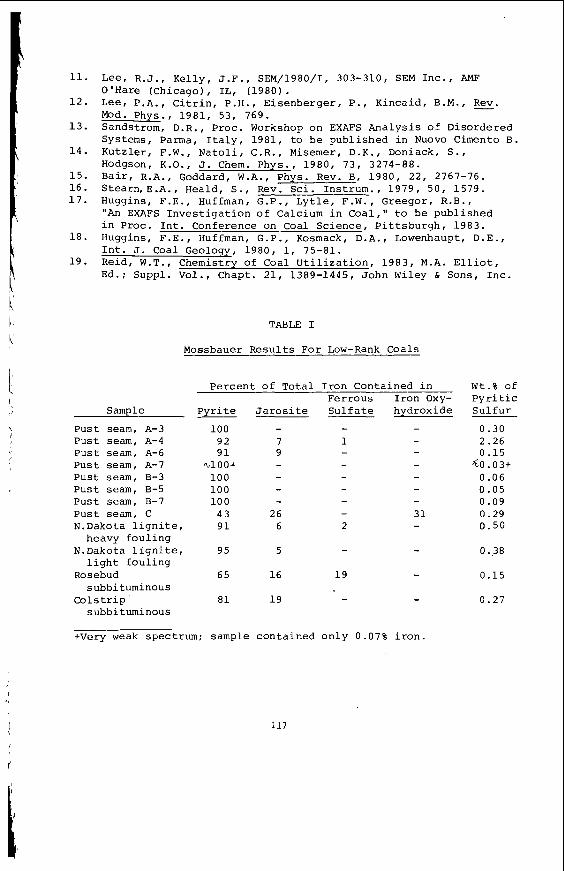
11.
1 2 .
1 3 .
1 4 .
15 . 16 . 1 7 .
18.
19 .
Lee , R . J . , K e l l y , J.F., ~ ~ ~ / 1 9 8 0 / 1 , 303-310, SEM I n c . , AMF O ' H a r e (Ch icago) , IL, (1980) . Lee , P.A., C i t r i n , P.H., E i s e n b e r g e r , P . , K inca id , B .M. , e. Mod. Phys. , 1981, 53, 769. Sandstrom, D . R . , P roc . Workshop o n EXAF'S A n a l y s i s o f D i so rde red Systems, Parma, I t a l y , 1981, t o b e p u b l i s h e d i n Nuovo Cimento B . K u t z l e r , F.W., N a t o l i , C . R . , M i s e m e r , D.K. , Doniack, S . , Hodgson, K.O. , J. Chem. Phys . , 1980, 73 , 3274-88. B a i r , R.A., Goddard, W.A., Phys. Rev. B, 1980, 22, 2767-76. S tearn ,E .A. , Heald, S . , Rev. S c i . In s t rum. , 1979 , 50 , 1579. Huggins, F . E . , Huffman, G.P., L y t l e , F.W., Greegor , R . B . , "An EXAFS I n v e s t i g a t i o n o f Calcium i n Coal , " t o b e p u b l i s h e d i n Proc . I n t . Conference on Coal S c i e n c e , P i t t s b u r g h , 1983. Huggins, F.E., Huffman, G.P., Kosmack, D.A. , Lowenhaupt, D.E. , I n t . J. C o a l Geology, 1980, 1, 75-81. Reid , W.T., Chemis t ry o f Coal U t i l i z a t i o n , 1983, M.A. E l l i o t , Ed.; Suppl. V o l . , Chapt. 21 , 1389-1445, John Wiley & Sons, I n c .
~
TABLE I
Mossbauer R e s u l t s Fo r Low-Rank Coals
P e r c e n t o f T o t a l I r o n Con ta ined i n F e r r o u s I r o n Oxy-
Sample P y r i t e J a r o s i t e
P u s t seam, A-3 1 0 0 - P u s t seam, A-4 92 7 P u s t seam, A-6 9 1 9 P u s t seam, A-7 % l o o + - P u s t seam, B-3 1 0 0 - P u s t seam, B-5 100 - P u s t seam, B-7 1 0 0 - P u s t seam, C 43 2 6 N.Dakota l i g n i t e , 9 1 6
heavy f o u l i n g
l i g h t f o u l i n g
subbi tuminous
subbi tuminous
N.Dakota l i g n i t e , 95 5
Rosebud 65 16
Co Is t r i p 8 1 19
+Very weak spec t rum: sample c o n t a i n e d
19 -
o n l y 0 .07% i r o n .
W t . % o f P y r i t i c S u l f u r
0.30 2.26 0.15
60.03+ 0.06 0 .05 0.09 0.29 0 .50
0.38
0.15
0.27
117
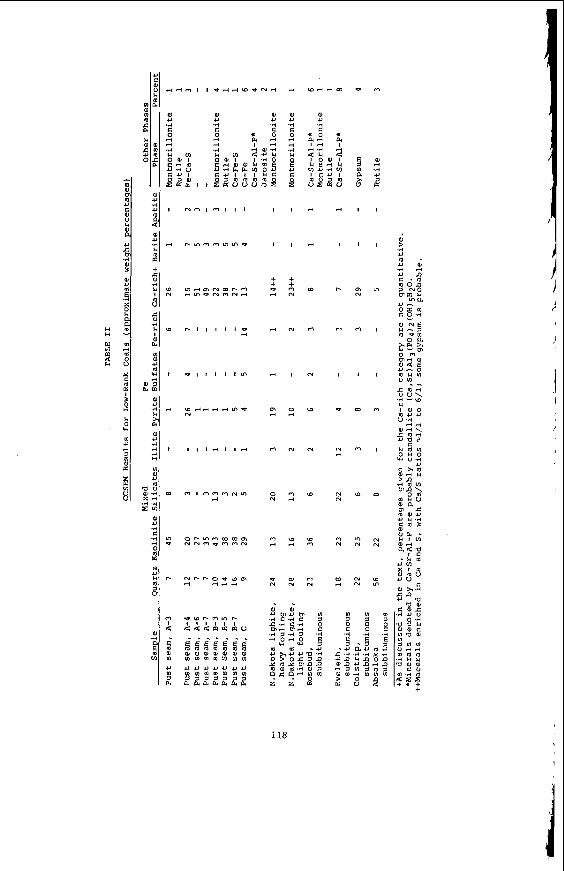
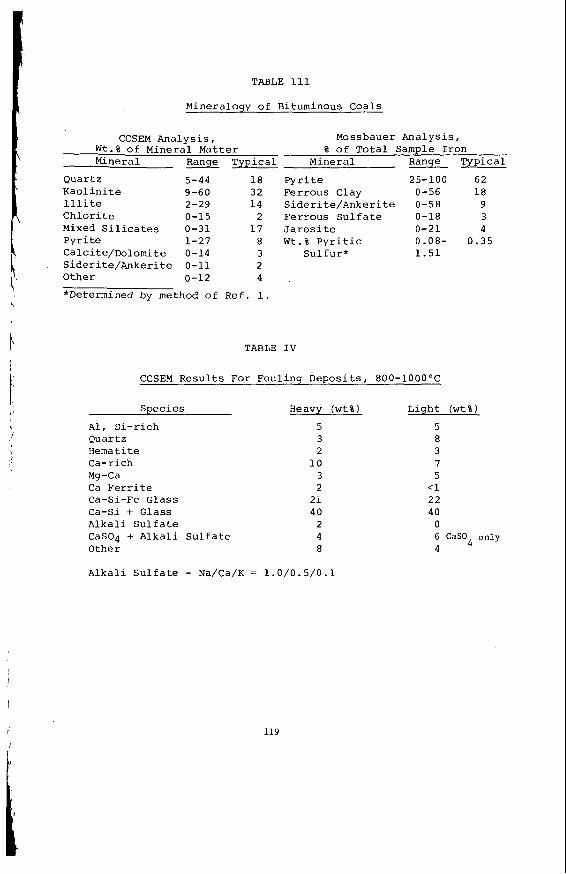
TABLE I11
Mineralogy o f Bituminous Coals
CCSEM A n a l y s i s , W t . % of Mine ra l Matter Mineral Range T y p i c a l
Q u a r t z 5-44 18 K a o l i n i t e 9-60 32 I l l i t e 2-29 1 4 C h l o r i t e 0-15 2 Mixed S i l i c a t e s 0 - 3 1 1 7 P y r i t e 1 - 2 7 8 Calcite/Dolomite 0-14 3 S i d e r i t e / A n k e r i t e 0-11 2 Other 0-12 4
*Determined by method of R e f . 1.
Mossbauer A n a l y s i s , 8 of T o t a l Sample I r o n
Mine ra l Range T y p i c a l
P y r i t e 25-100 6 2 F e r r o u s Clay 0-56 1 8 S i d e r i t e / A n k e r i t e 0-58 9 F e r r o u s S u l f a t e 0-18 3 J a r o s i t e 0-21 4 W t . % P y r i t i c 0.08- 0.35
S u l f u r * 1 . 5 1
TABLE I V
CCSEM R e s u l t s For Fou l ing D e p o s i t s , 800-10OO0C
S p e c i e s
Al, S i - r i c h Q u a r t z Hematite Ca-r ich Mg-Ca C a F e r r i t e Ca-Si-Fe G l a s s Ca-Si + Glass A l k a l i S u l f a t e Cas04 + A l k a l i S u l f a t e Other
Heavy (wt%)
5 3 2
10 3 2
21 4 0
2 4 8
L i g h t ( w t % )
5 8 3 7 5
<1 22 40
0 6 CaSO only 4 4
A l k a l i S u l f a t e - N a / C a / K = 1.0/0.5/0.1
119
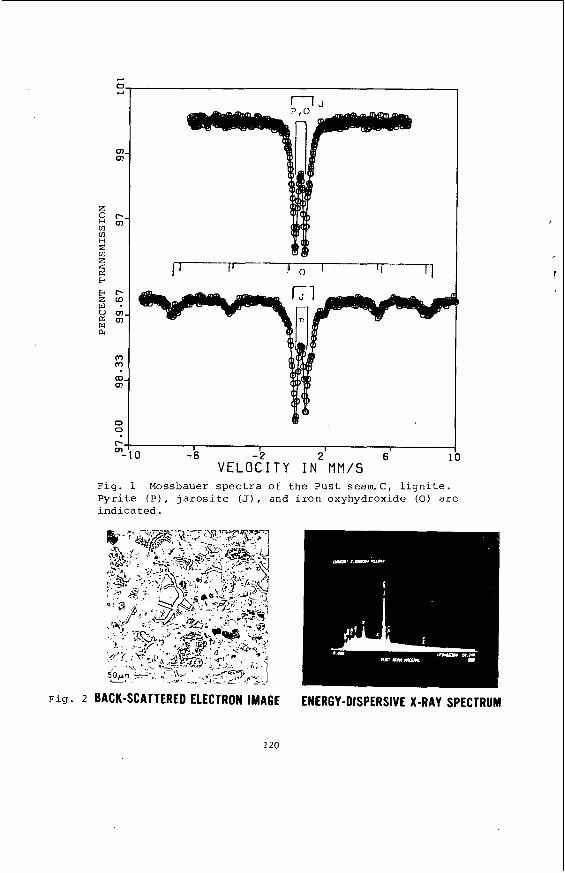
l - I I 1 I I m-i o -6 -2 2 6 1
V E L O C I T Y I N M M / S F i g . 1 Mossbauer s p e c t r a of t h e Pust seam.C, l i g n i t e . P y r i t e (P), j a r o s i t e (J), and i r o n oxyhydroxide ( 0 ) a r e i n d i c a t e d .
I
F i g . 2 BACK-SCATTERED ELECTRON IMAGE ENERGY-DISPERSIVE X-RAY SPECTRUM
120
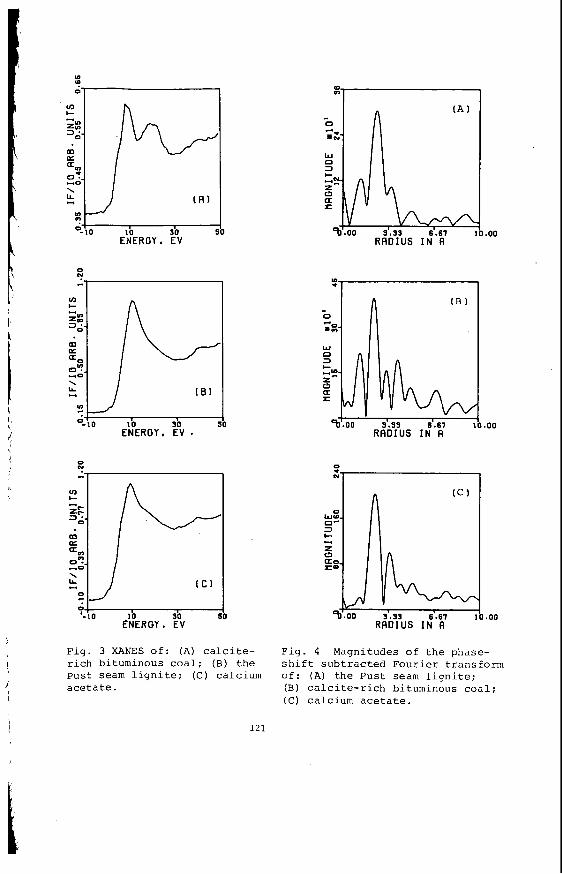
0 N
e
I
i
F i g . 3 XANES of: ( A ) c a l c i t e - r i c h b i tuminous c o a l ; ( B ) t h e Pus t s e a m l i g n i t e ; ( C ) ca lc ium a c e t a t e .
.oo
.oo
1 .oo
F i g . 4 Magnitudes of t h e phase- s h i f t s u b t r a c t e d F o u r i e r t r a n s f o r m o f : (A) t h e P u s t seam l i g n i t e ; (B) c a l c i t e - r i c h b i tuminous c o a l ; ( C ) ca lc ium a c e t a t e .
121
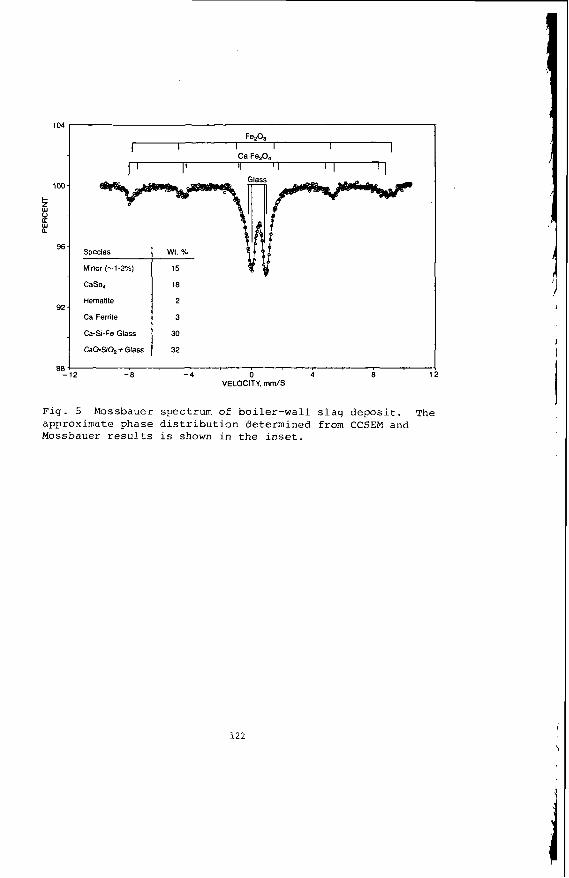
104
1M:
I-
w P a
9E
92
8e
Fe.0.
Species
Minor (-1 -2%)
CaSo,
Hematite
Ca Ferrite
Ca-Si-Fe Glass
CaO-SiO, i Glass
wt. %
-8 - 4 0 4 8 VELOCITY mm/S
F i g . 5 Mossbauer spec t rum of b o i l e r - w a l l s l a g d e p o s i t . The approximate phase d i s t r i b u t i o n de te rmined from CCSEM and Mossbauer r e s u l t s i s shown i n t h e i n s e t .
122
!
GEOCHEMICAL VARIATION OF INORGANIC CONSTITUENTS I N A NORTH DAKOTA LIGNITE
Frank R . Karner, S teven A. Benson, Harold H. Schober t , and Robin G. Roaldson
U.S. Department of Energy Grand Forks Energy Technology Center
Box 8213, Univers i ty S t a t i o n Grand Forks , North Dakota 58202
INTRODUCTION
This paper summarizes informat ion on t h e d i s t r i b u t i o n of major and t r a c e elements i n a S t r a t i g r a p h i c sequence of sedimentary m a t e r i a l s i n a major l i g n i t e producing por- t i o n of the F o r t Union reg ion of t h e Northern Great P l a i n s . Previous s tudy of the geochemical v a r i a t i o n i n t h e s e sediments i s summarized i n t h e l i t e r a t u r e ( 1 , 2 ) . Major p a t t e r n s of e lementa l v a r i a t i o n s i n l i g n i t e a r e r e l a t e d t o f a c t o r s a f f e c t i n g accumulation of both organic and inorganic components dur ing d e p o s i t i o n and aqueous p r e c i p i t a t i o n , d i s s o l u t i o n , and ion-exchange processes a f t e r d e p o s i t i o n . Var ia t ions i n overburden and underclay a r e dependent upon s p e c i f i c c l a y minera l v a r i a t i o n and r e l a t i v e abundances of quar tz - and f e l d s p a r - r i c h s i l t f r a c t i o n s versus c l a y mineral- r i c h f r a c t i o n s of t h e sediment , a s w e l l a s upon l o c a l v a r i a t i o n i n carbonates and o t h e r elements.
GEOLOGIC RELATIONSHIPS
The Center mine, Ol iver County, North Dakota i s i n t h e F o r t Union Coal Region, which i s one of t h e l a r g e s t r e s e r v e s of l i g n i t e i n t h e world. The F o r t Union Coal Region l i e s wi th in t h e North Great P l a i n s Coal Province and encompasses p o r t i o n s of north- c e n t r a l United S t a t e s and south-cent ra l Canada, i n c l u d i n g both t h e subbituminous coals of t h e nor thern Powder River Basin and t h e l i g n i t e s of t h e W i l l i s t o n Basin (21, a broad s t r u c t u r a l and sedimentary i n t r a c r a t o n i c b a s i n t h a t ex tends over an a r e a of about 40,000 km2. Over 4600 m of sedimentary rocks o v e r l i e t h e W i l l i s t o n Basin i n i t s deepest p o r t i o n s of McKenzie County, North Dakota.
Important l i g n i t e beds of t h e F o r t Union Region occur wi th in Ludlow, S lope , Bul l ion Creek, and S e n t i n e l But te Formations of t h e Paleocene F o r t Union Group.
The S e n t i n e l But te Formation has been descr ibed a s a " l i g n i t e - b e a r i n g , nonmarine, Paleocene u n i t whose outcrops a r e somber gray and brown" ( 3 ) . Rock types include sandstone, s i l t s t o n e , c l a y s t o n e , l i g n i t e , and l imes tone . The l i g n i t e beds t y p i c a l l y vary from l e s s than 1 meter t o 3-5 meters i n th ickness ( 4 ) . The Oliver-Mercer County d i s t r i c t i s l o c a t e d i n e a s t e r n Mercer and n o r t h e a s t e r n O l i v e r Counties wi th the p r i n c i p a l bed, t h e Hagel bed, ranging i n th ickness from 3 t o 4 meters a t t h e Center Mine ( 4 ) .
The sampling program (5 ) was designed t o o b t a i n s t r a t i g r a p h i c a l l y c o n t r o l l e d spec i - mens f o r a s tudy of t h e c h a r a c t e r , d i s t r i b u t i o n , and o r i g i n of t h e inorganic con- s t i t u e n t s i n l i g n i t e .
1. Incremental samples of underc lay , l i g n i t e , and overburden a t each mine.
2 . Duplicate v e r t i c a l s e c t i o n s and l a t e r a l samples t o t e s t v a r i a t i o n .
3 . Samples of s p e c i f i c beds, l e n s e s , f a u l t zones, minera l concent ra t ions , o r o ther
The o b j e c t i v e s of t h e f i e l d sampling were t o o b t a i n :
a r e a s of unusual a s p e c t .
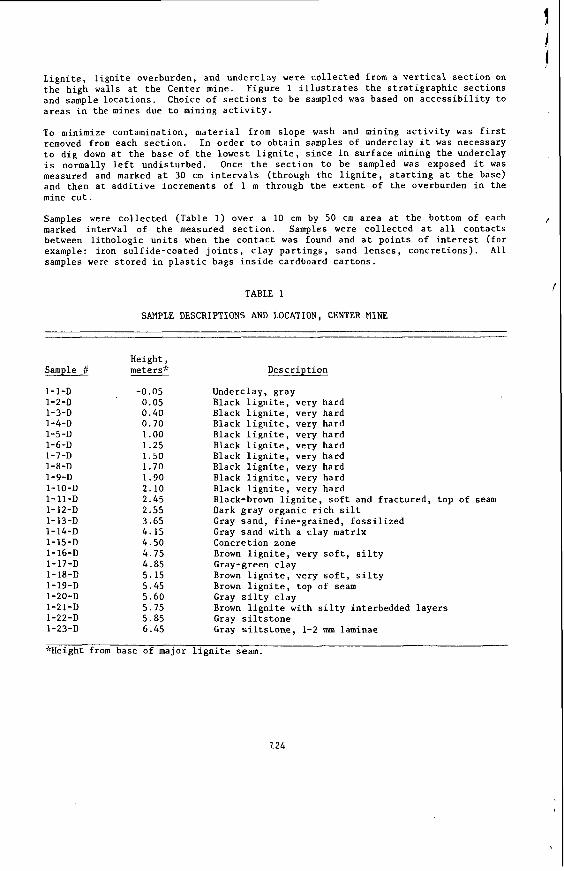
L i g n i t e , l i g n i t e overburden, and underc lay were c o l l e c t e d from a v e r t i c a l s e c t i o n on t h e high walls a t t h e Center mine. F i g u r e 1 i l l u s t r a t e s t h e s t r a t i g r a p h i c s e c t i o n s and sample l o c a t i o n s . Choice of s e c t i o n s t o be sampled was based on a c c e s s i b i l i t y t o a r e a s i n the mines due t o mining a c t i v i t y .
To minimize contaminat ion, m a t e r i a l from s l o p e wash and mining a c t i v i t y was f i r s t removed from each s e c t i o n . I n o r d e r t o o b t a i n samples of underclay it was necessary t o d i g down a t t h e base of t h e lowest l i g n i t e , s i n c e i n s u r f a c e mining t h e underclay i s normally l e f t undis turbed . Once t h e s e c t i o n t o be sampled was exposed it was measured and marked a t 30 cm i n t e r v a l s ( through t h e l i g n i t e , s t a r t i n g a t t h e base) and then a t a d d i t i v e increments of 1 m through t h e e x t e n t of t h e overburden i n the mine c u t .
Samples were c o l l e c t e d (Table 1) over a 10 cm by 50 cm a r e a a t t h e bottom of each /
marked i n t e r v a l of t h e measured s e c t i o n . Samples were c o l l e c t e d a t a l l contac ts between l i t h o l o g i c u n i t s when t h e c o n t a c t was found and a t p o i n t s of i n t e r e s t ( f o r example: i ron su l f ide-coa ted j o i n t s , c l a y p a r t i n g s , sand l e n s e s , c o n c r e t i o n s ) . A l l samples were s t o r e d i n p l a s t i c bags i n s i d e cardboard c a r t o n s .
TABLE 1 I
SAMPLE DESCRIPTIONS AND LOCATION, CENTER MINE
Height , Sample B met e r s.9~
1-1-D 1-2-D 1 - 3 - D 1-4-D 1-5-D 1-6-D 1-7-D 1-8-D 1-9-D 1-10-D 1-11-D 1-12-D 1-13-D 1-14-D 1-15-D 1-16-D 1-17-D
1-19-D 1-20-D 1-21-D 1-22-D 1-23-D
1-18-D
-0.05 0.05 0.40 0.70 1.00 1.25 1.50 1.70 1.90 2.10 2.45 2.55 3.65 4.15 4.50 4.15 4.85 5.15 5.45 5 .60 5.75
6.45 5.85
Descr ip t ion
Underclay, g ray Black l i g n i t e , very hard Black l i g n i t e , very hard Black l i g n i t e , very hard Black l i g n i t e , very hard Black l i g n i t e , very hard Black l i g n i t e , very hard Black l i g n i t e , very hard Black l i g n i t e , very hard Black l i g n i t e , very hard Black-brown l i g n i t e , s o f t and f r a c t u r e d , top of seam Dark g r a y organic r i c h s i l t Gray sand , f i n e - g r a i n e d , f o s s i l i z e d Gray sand w i t h a c l a y mat r ix Concret ion zone Brown l i g n i t e , very s o f t , s i l t y Gray-green c l a y Brown l i g n i t e , very s o f t , s i l t y Brown l i g n i t e , top of seam Gray s i l t y c l a y Brown l i g n i t e wi th s i l t y in te rbedded l a y e r s Gray s i l t s t o n e Gray s i l t s t o n e , 1-2 mm laminae
*Height from base of major l i g n i t e seam.
124
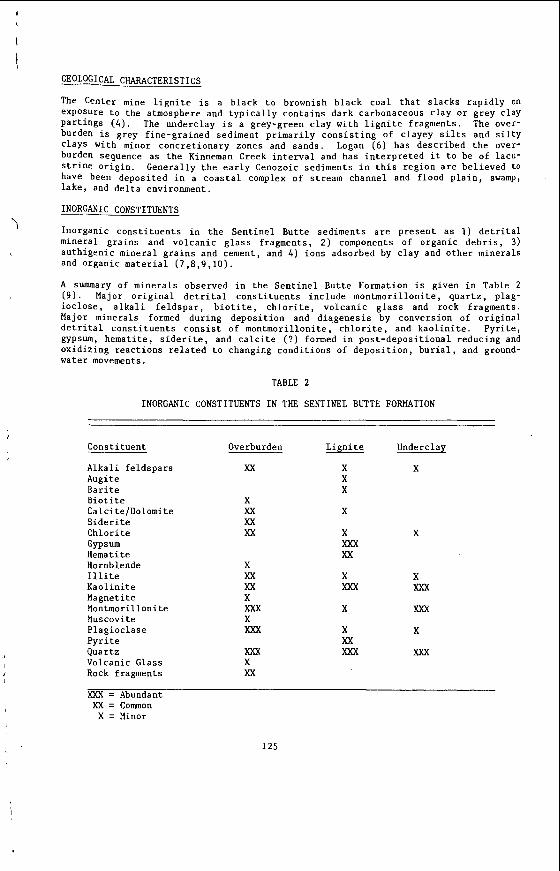
!
GEOLOGICAL CHARACTERISTICS
The Center mine lignite is a black to brownish black coal that slacks rapidly on exposure to the atmosphere and typically contains dark carbonaceous clay or grey clay Partings ( 4 ) . The underclay is a grey-green clay with lignite fragments. The over- burden is grey fine-grained sediment primarily consisting of clayey silts and silty clays with minor concretionary zones and sands. Logan ( 6 ) has described the over- burden sequence as the Kinneman Creek interval and has interpreted it to be of lacu- strine origin. Generally the early Cenozoic sediments in this region are believed to have been deposited in a coastal complex of stream channel and flood plain, swamp, lake, and delta environment.
INORGANIC CONSTITUENTS
Inorganic constituents in the Sentinel Butte sediments are present as 1 ) detrital mineral grains and volcanic glass fragments, 2 ) components of organic debris, 3) authigenic mineral grains and cement, and 4 ) ions adsorbed by clay and other minerals and organic material (7,8,9,10).
A summary of minerals observed in the Sentinel Butte Formation is given in Table 2 (9 ) . Major original detrital constituents include montmorillonite, quartz, plag- ioclose, alkali feldspar, biotite, chlorite, volcanic glass and rock fragments. Major minerals formed during deposition and diagenesis by conversion of original detrital constituents consist of montmorillonite, chlorite, and kaolinite. Pyrite, gypsyl hematite, siderite, and calcite (?) formed in post-depositional. reducing and oxldlzing reactions related to changing conditions of deposition, burial, and ground- water movements.
7
TABLE 2
INORGANIC CONSTITUENTS IN THE SENTINEL BUTTE FORMATION
Constituent Overburden Lignite Underclay
Alkali feldspars Augite Barite Biotite Calcite/Dolomite Siderite Chlorite Gypsum Hemati te Hornblende Illite Kaolinite Magnetite Montmorillonite Muscovite Plagioclase Pyrite Quartz Volcanic Glass Rock fragments
xx
X xx xx xx
X xx xx X xxx X xxx xxx X xx
X X X X
X
X X xxx xx X X xxx xxx X xxx X X xx xxx xxx
XXX = Abundant XX = Common X = Minor
1 2 5
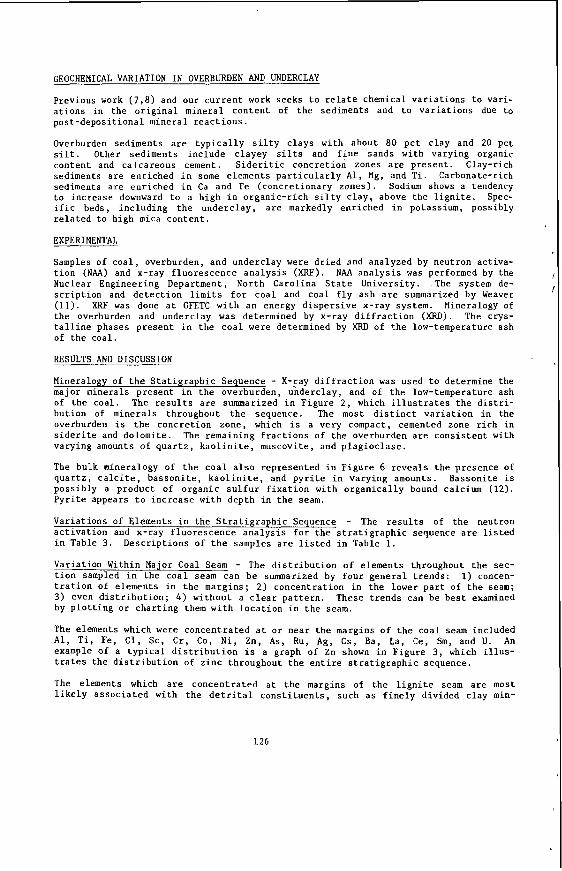
GEOCHEMICAL VARIATION IN OVERBURDEN AND UNDERCLAY
Previous work (7,8) and our c u r r e n t work seeks t o r e l a t e chemical v a r i a t i o n s t o v a r i - a t i o n s i n t h e o r i g i n a l minera l c o n t e n t of t h e sediments and t o v a r i a t i o n s due t o pos t -depos i t iona l minera l r e a c t i o n s .
Overburden sediments a r e t y p i c a l l y s i l t y c l a y s wi th about 80 p c t c l a y and 20 pct s i l t . Other sediments inc lude clayey s i l t s and f i n e sands wi th varying organic conten t and ca lcareous cement. S i d e r i t i c concre t ion zones a r e p r e s e n t . Clay-rich sediments a r e enr iched i n some elements p a r t i c u l a r l y A l , Mg, and T i . Carbonate-rich sediments a r e enr iched i n Ca and Fe (concre t ionary zones) . Sodium shows a tendency t o increase downward t o a high i n o r g a n i c - r i c h s i l t y c l a y , above t h e l i g n i t e . Spec- i f i c beds, inc luding t h e underc lay , a r e markedly enr iched i n potassium, possibly r e l a t e d t o h igh mica c o n t e n t .
EXPERIMENTAL
Samples of c o a l , overburden, and underclay were d r i e d and analyzed by neutron ac t iva- t i o n (NAA) and x-ray f luorescence a n a l y s i s (XRF). NAA a n a l y s i s was performed by the Nuclear Engineer ing Department, North Caro l ina S t a t e Univers i ty . .The system de- s c r i p t i o n and d e t e c t i o n l imits f o r c o a l and coa l f l y a s h a r e summarized by Weaver (11). XRF was done a t GFETC w i t h an energy d i s p e r s i v e x-ray system. Mineralogy o f t h e overburden and underclay was determined by x-ray d i f f r a c t i o n (XRD). The crys- t a l l i n e phases p r e s e n t i n t h e c o a l were determined by XRD of t h e low-temperature ash o f t h e coa l .
RESULTS AND DISCUSSION
Mineralogy of t h e S t a t i g r a p h i c Sequence - X-ray d i f f r a c t i o n was used t o determine the major minerals p r e s e n t i n t h e overburden, underclay, and of t h e low-temperature ash of t h e coa l . The r e s u l t s a r e summarized i n F i g u r e 2 , which i l l u s t r a t e s t h e d i s t r i - bu t ion o f minera ls throughout t h e sequence. The most d i s t i n c t v a r i a t i o n i n the overburden i s t h e concre t ion zone, which i s a very compact, cemented zone r i c h i n s i d e r i t e and dolomite . The remaining f r a c t i o n s of t h e overburden a r e c o n s i s t e n t with varying amounts of q u a r t z , k a o l i n i t e , muscovite, and p l a g i o c l a s e .
The bulk mineralogy of t h e c o a l a l so represented i n F i g u r e 6 r e v e a l s t h e presence of q u a r t z , c a l c i t e , b a s s o n i t e , k a o l i n i t e , and p y r i t e i n vary ing amounts. Bassoni te i s poss ib ly a product of organic s u l f u r f i x a t i o n wi th o r g a n i c a l l y bound calcium ( 1 2 ) . P y r i t e appears t o i n c r e a s e wi th depth i n t h e seam.
Var ia t ions of Elements i n t h e S t r a t i g r a p h i c Sequence - The r e s u l t s of t h e neutron a c t i v a t i o n and x-ray f luorescence a n a l y s i s f o r t h e s t r a t i g r a p h i c sequence a r e l i s t e d i n Table 3.
Varia t ion Within'Major Coal Seam - The d i s t r i b u t i o n of e lements throughout t h e sec- t i o n sampled i n t h e c o a l seam can be summarized by f o u r g e n e r a l t rends : 1) concen- t r a t i o n of e lements i n t h e margins; 2) concent ra t ion i n t h e lower p a r t of t h e seam; 3) even d i s t r i b u t i o n ; 4 ) without a c l e a r p a t t e r n . These t r e n d s can be b e s t examined by p l o t t i n g or c h a r t i n g them w i t h l o c a t i o n i n t h e seam.
The elements which were concent ra ted a t o r near t h e margins of t h e c o a l seam included A l , T i , Fe, C 1 , Sc, C r , Co, N i , Zn, A s , Ru, Ag, C s , Ba, La, Ce, Sm, and U. An example of a t y p i c a l d i s t r i b u t i o n i s a graph of Zn shown i n F igure 3, which i l l u s - t r a t e s t h e d i s t r i b u t i o n of z i n c throughout t h e e n t i r e s t r a t i g r a p h i c sequence.
The elements which a r e concent ra ted a t t h e margins of t h e l i g n i t e seam a r e most l i k e l y a s s o c i a t e d wi th t h e d e t r i t a l c o n s t i t u e n t s , such a s f i n e l y d iv ided c l a y min-
Descr ip t ions of t h e samples a r e l i s t e d i n Table 1.
126
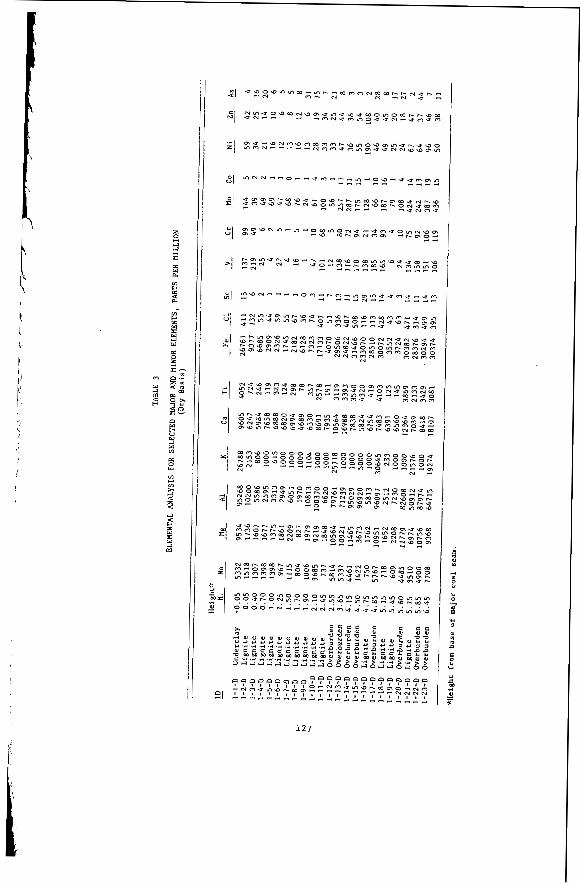
127
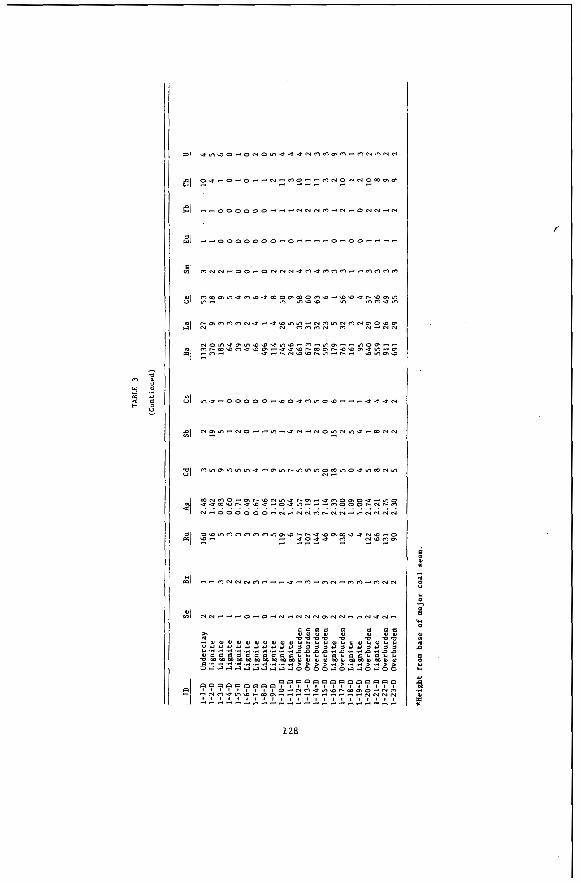
128
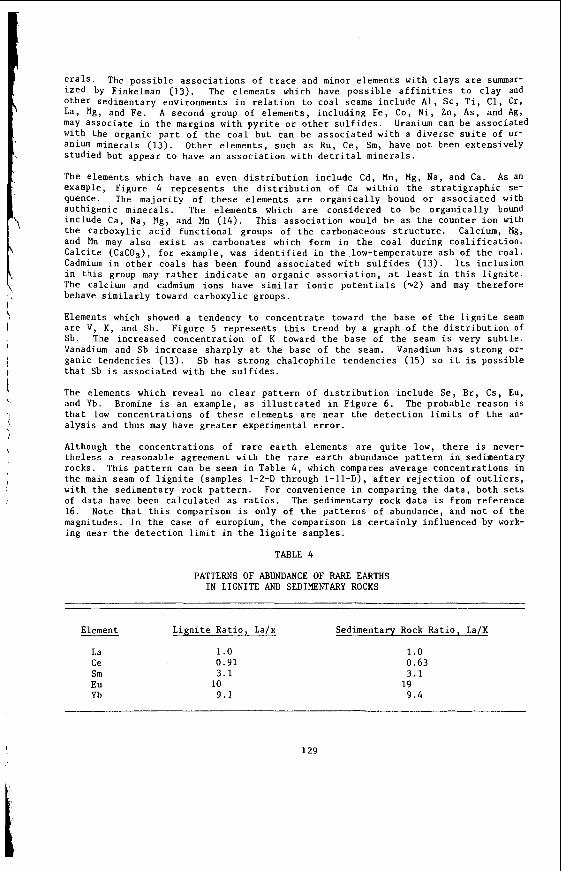
e r a l s . The p o s s i b l e a s s o c i a t i o n s of t r a c e and minor e lements wi th c lays a r e summar- ized by Finkelman (13). The elements which have p o s s i b l e a f f i n i t i e s t o c l a y and o t h e r sedimentary environments i n r e l a t i o n t o coa l seams i n c l u d e A l , S C , T i , C 1 , Cr, La, Mg, and Fe. A second group of e lements , inc luding Fe, Co, N i , Zn, A s , and Ag, may a s s o c i a t e i n t h e margins wi th p y r i t e o r o t h e r s u l f i d e s . with t h e organic p a r t of t h e c o a l bu t can be a s s o c i a t e d wi th a d i v e r s e s u i t e of ur- anium minerals (13). Other e lements , such a s Ru, Ce, Sm, have not been ex tens ive ly s tud ied b u t appear t o have an a s s o c i a t i o n wi th d e t r i t a l minera ls .
The elements which have an even d i s t r i b u t i o n inc lude Cd, tln, Mg, Na, and Ca. A s an example, Figure 4 r e p r e s e n t s t h e d i s t r i b u t i o n of Ca w i t h i n t h e s t r a t i g r a p h i c se- quence. The major i ty of t h e s e elements a r e o r g a n i c a l l y hound o r a s s o c i a t e d with au th igenic minera ls . The elements which a r e considered t o be o r g a n i c a l l y bound include Ca, Na, Mg, and Mn (14). This a s s o c i a t i o n would be a s t h e counter i o n with t h e carboxyl ic a c i d f u n c t i o n a l groups of t h e carbonaceous s t r u c t u r e . Calcium, Mg, and Mn may a l s o e x i s t a s carbonates which form i n t h e coa l during c o a l i f i c a t i o n . C a l c i t e ( C a C 0 3 ) , f o r example, was i d e n t i f i e d i n t h e low-temperature a s h of t h e coal . Cadmium i n o t h e r c o a l s has been found a s s o c i a t e d wi th s u l f i d e s (13). Its inc lus ion i n t h i s group may r a t h e r i n d i c a t e an organic a s s o c i a t i o n , a t l e a s t i n t h i s l i g n i t e . The calcium and cadmium ions have s i m i l a r i o n i c p o t e n t i a l s (2.2) and may therefore behave s i m i l a r l y toward carboxyl ic groups.
Elements which showed a tendency t o concent ra te toward t h e base of t h e l i g n i t e seam a r e V , K , and Sb. F igure 5 represents t h i s t rend by a graph of t h e d i s t r i b u t i o n of Sb. The increased concent ra t ion of K toward t h e base of t h e seam i s very s u b t l e . Vanadium and Sb i n c r e a s e s h a r p l y a t t h e base of t h e seam. Vanadium has s t r o n g or- ganic tendencies (13). Sb has s t r o n g cha lcophi le tendencies (15) so it is poss ib le t h a t Sb i s a s s o c i a t e d wi th t h e s u l f i d e s .
The elements which r e v e a l no c l e a r p a t t e r n of d i s t r i b u t i o n inc lude Se , B r , C s , Eu, and Yb. Bromine i s an example, a s i l l u s t r a t e d i n F igure 6. The probable reason is t h a t low concent ra t ions of t h e s e elements a r e near t h e d e t e c t i o n l i m i t s of t h e an- a l y s i s and thus may have g r e a t e r experimental e r r o r .
Although t h e concent ra t ions of r a r e e a r t h elements a r e q u i t e low, t h e r e i s never- t h e l e s s a reasonable agreement with t h e r a r e e a r t h abundance p a t t e r n i n sedimentary rocks. This p a t t e r n can be seen i n Table 4 , which compares average concent ra t ions i n t h e main seam of l i g n i t e (samples 1-2-D through 1-11-D), a f t e r r e j e c t i o n of o u t l i e r s , wi th t h e sedimentary rock p a t t e r n . For convenience i n comparing t h e d a t a , bo th sets of data have been c a l c u l a t e d a s r a t i o s . The sedimentary rock d a t a i s from reference 16. Note t h a t t h i s comparison i s only of t h e p a t t e r n s of abundance, and n o t of the magnitudes. I n t h e case of europium, t h e comparison i s c e r t a i n l y inf luenced by work- ing near t h e d e t e c t i o n l i m i t i n t h e l i g n i t e samples.
Uranium can he assoc ia ted
TABLE 4
PATTERNS OF ABUNDANCE OF RARE EARTHS IN LIGNITE AND SEDIMENTARY ROCKS
Element L i g n i t e R a t i o , La/x Sedimentary Rock R a t i o , La/X
La C e Sm Eu Yb
1.0 0.91 3.1
9.1 10
1.0 0.63 3.1
9 . 4 19
129
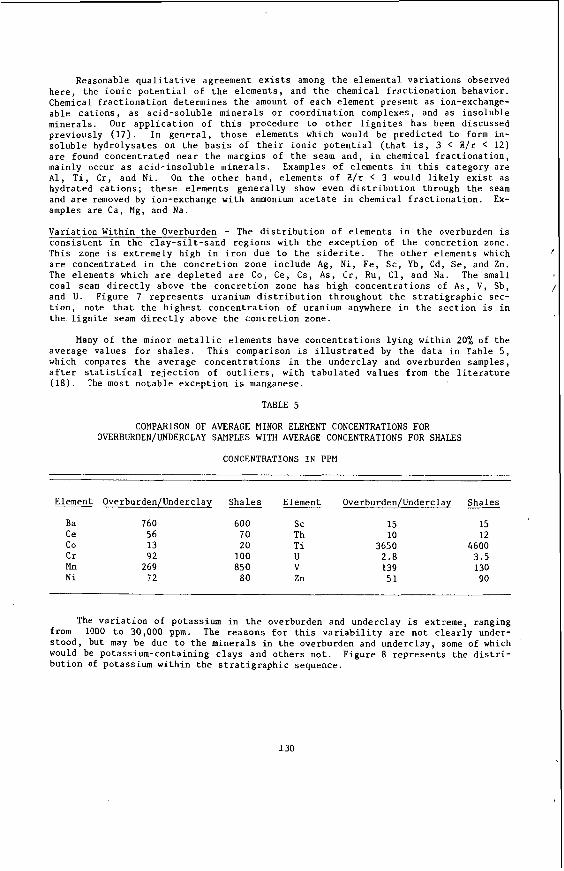
Reasonable q u a l i t a t i v e agreement e x i s t s among t h e e lementa l v a r i a t i o n s observed here , t h e i o n i c p o t e n t i a l of t h e e lements , and t h e chemical f r a c t i o n a t i o n behavior . Chemical f r a c t i o n a t i o n determines the amount of each element p r e s e n t a s ion-exchange- a b l e c a t i o n s , a s ac id-so luble minera ls or coord ina t ion complexes, and a s inso luble minera ls . Our a p p l i c a t i o n of t h i s procedure t o o t h e r l i g n i t e s has been discussed previously (17) . I n g e n e r a l , those elements which would be p r e d i c t e d t o form in- s o l u b l e hydrolysates on t h e b a s i s of t h e i r i o n i c p o t e n t i a l ( t h a t i s , 3 < Z/r < 12) a r e found concent ra ted near t h e margins of t h e seam and, i n chemical f r a c t i o n a t i o n , mainly occur a s a c i d - i n s o l u b l e minera ls . Examples of elements i n t h i s ca tegory a r e A l , T i , Cr, and N i . On t h e o t h e r hand, e lements of Z / r < 3 would l i k e l y e x i s t as hydrated c a t i o n s ; t h e s e elements g e n e r a l l y show even d i s t r i b u t i o n through t h e seam and a r e removed by ion-exchange wi th ammonium a c e t a t e i n chemical f r a c t i o n a t i o n . Ex- amples are Ca, Mg, and Na.
Var ia t ion Within t h e Overburden - The d i s t r i b u t i o n of e lements i n t h e overburden i s cons is ten t i n t h e c l a y - s i l t - s a n d reg ions wi th t h e except ion of t h e concre t ion zone. This zone i s extremely high i n i r o n due t o t h e s i d e r i t e . The o t h e r elements which a r e concentrated i n t h e c o n c r e t i o n zone inc lude Ag, N i , Fe , Sc , Yb, Cd, S e , and Zn. The elements which a r e deple ted a r e Co, Ce, Cs, A s , Cr, Ru, C 1 , and Na. The small c o a l seam d i r e c t l y above t h e c o n c r e t i o n zone has high concent ra t ions o f A s , V , Sb, and U. Figure 7 r e p r e s e n t s uranium d i s t r i b u t i o n throughout t h e s t r a t i g r a p h i c sec- t i o n , note t h a t t h e h i g h e s t c o n c e n t r a t i o n of uranium anywhere i n t h e s e c t i o n i s i n t h e . l i g n i t e seam d i r e c t l y above t h e concre t ion zone.
Many of t h e minor m e t a l l i c e lements have concent ra t ions l y i n g wi th in 20% of t h e average values f o r s h a l e s . This comparison i s i l l u s t r a t e d by t h e da ta i n Table 5 , which compares t h e average concent ra t ions i n t h e underclay and overburden samples, a f t e r s t a t i s t i c a l r e j e c t i o n of o u t l i e r s , wi th t a b u l a t e d va lues from t h e l i t e r a t u r e (18) . The most no tab le except ion i s manganese.
TABLE 5
COMPARISON OF AVERAGE MINOR ELEMENT CONCENTRATIONS FOR OVERBURDEN/UNDERCLAY SAMPLES WITH AVERAGE CONCENTRATIONS FOR SHALES
CONCENTRATIONS IN PPM
Element Overburden/Underclay S h a l e s Element Overburden/Underclay Shales
Ba 760 Ce 56 co 13 C r 92 Mn 269 N i 1 2
600 s c 15 70 Th 10 20 T i 3650
100 U 2.8 850 V 139
80 Zn 51
15 12
4600 3.5 130 90
The v a r i a t i o n of potassium i n t h e overburden and underc lay i s extreme, ranging from 1000 t o 30,000 ppm. The reasons f o r t h i s v a r i a b i l i t y a r e n o t c l e a r l y under- s tood , but may be due t o t h e m i n e r a l s i n t h e overburden and underclay, some of which would be potassium-containing c l a y s and o t h e r s n o t . F igure 8 represents t h e d i s t r i - b u t i o n of potassium w i t h i n t h e s t r a t i g r a p h i c sequence.
130
INTERPETATION OF PATTERNS OF ELEMENT DISTRIBUTION
The observed p a t t e r n s of element d i s t r i b u t i o n i n t h e l i g n i t e seam may be expla ined by both changes i n d e p o s i t i o n a l condi t ions dur ing accumulat ion and subsequent chemical changes during d iagenes is and pos t -d iagenet ic processes . Depos i t iona l f a c t o r s in- vo lv ing a d d i t i o n of g r e a t e r f r a c t i o n s of d e t r i t a l c l a y and s i l t a t t h e beginning and end of p e a t depos i t ion would increase S i , A l , Mg, Ca, Na, K , and p o s s i b l y o ther elements i n the margins of t h e l i g n i t e . Other p o s s i b l e d e p o s i t i o n a l f a c t o r s include changing of Eh o r pH, i n f l u x of a s h , o r changing b o t a n i c a l f a c t o r s a t t h e beginning and end of p e a t depos i t ion . Pos t -depos i t iona l f a c t o r s r e l a t e d t o t h e flow of meteoric water ( i . e . , water der ived from t h e atmosphere) through t h e l i g n i t e l a t - e r a l l y might s e l e c t i v e l y concent ra te e lements i n t h e margins of t h e seam o r a t i t s c e n t e r . V e r t i c a l flow might concent ra te e lements a t e i t h e r t h e upper o r lower mar- g i n , depending on flow d i r e c t i o n and on t h e n a t u r e of t h e a d j o i n i n g sediments . Other pos t -depos i t iona l f a c t o r s might be r e l a t e d t o t h e changing geochemistry of t h e l i g - ni te-forming environment, such a s Eh and pH changes, b o t a n i c a l changes due t o break- down of p l a n t m a t e r i a l , and geologica l f a c t o r s such a s depth of b u r i a l , temperature , compaction, o r changes i n groundwater chef i i s t ry . The e x i s t e n c e of s e v e r a l types of p a t t e r n s suggests t h a t s e v e r a l p rocesses have been o p e r a t i v e dur ing t h e geologica l h i s t o r y of t h i s sequence.
Future work w i l l inc lude a very d e t a i l e d sampling of s e v e r a l v e r t i c a l s e c t i o n s of a mine t o descr ibe groundwater in f luences on t h e formation of a u t h i g e n i c minera ls and on t h e d i s t r i b u t i o n o r o r g a n i c a l l y a s s o c i a t e d elements .
ACKNOWLEDGEMENTS
The au thors would l i k e t o thank Diane K . Rindt f o r t h e x-ray d i f f r a c t i o n work and Arthur L . Severson f o r x-ray f luorescence a n a l y s i s . Mr. Roaldson acknowledges suppor t from Associated Western U n i v e r s i t i e s , I n c . a s a p a r t of t h e i r summer under- graduate research p a r t i c i p a t i o n program.
131
REFERENCES CITED
1.
2.
3.
4.
5.
6.
7.
8.
9 .
10.
11.
12.
13.
14.
Sondreal , E.A. , W.R. Kube, and J . L . E l d e r . Analysis of t h e Northern Great P la ins Province L i g n i t e s and T h e i r Ash: A Study of V a r i a b i l i t y . U.S. Bureau of Mines Report R I 7158 (1968).
Energy Resources Co. I n c . , Walnut Creek, CA 94596. Low-rank Coal Study, Na- t i o n a l Need f o r Resaurce Development-Resource C h a r a c t e r i z a t i o n . DOE/FC/10066-TI (Vol. 2) Nov. 1980.
Jacob, A.F. Geology of t h e upper p a r t of t h e F o r t Union Group (Paleocene) , W i l l i s t o n Basin, wi th r e f e r e n c e t o uranium: North Dakota Geol. Survey Report of I n v e s t i g a t i o n No. 58, 1976, 49 p .
Groenewold, G . H . , L.A. Hemish, J . A . Cherry, B.W. Rehm, G . N . Meyer, and L.M. Winczewski. Geology and geohydrology of t h e Knife River Basin and adjacent a reas of wes t -cent ra l North Dakota: North Dakota Geol. Survey Report of In- v e s t i g a t i o n No. 6 4 , 1979, 402 p .
Karner, F .R. , S.F. White, D.W. Brekke, and H . H . Schobert . Geologic Sampling of Ligni te Mines i n Mercer and O l i v e r Count ies , North Dakota. DOE/FC/FE-1, 1983, ( i n p r e p a r a t i o n ) .
Logan, Kather ine J. The Geology and Environment of Deposi t ion of t h e Kinneman Creek I n t e r v a l S e n t i n e l But te Formation (Pa leocene) , North Dakota. Unpublished Masters Thes is , U n i v e r s i t y of North Dakota (1981).
Karner, F.R. , W . Beckering, D . K . Rindt , and H . H . Schobert . Inorganic Cons t i t - uents i n Ligni te : Overview and Some E f f e c t s on Coal U t i l i z a t i o n s . Geological Soc ie ty of America A b s t r a c t s w i t h Programs 11 454 (1979).
Karner, F.R., G. Winbourn, S .F . White, and A . K . Gather idge. Sodium and calcium i n overburden, l i g n i t e and underc lay a t t h e Beulah and Baukol-Noonan Mines, Mercer and O l i v e r Count ies , North Dakota [ a b s . ] : North Dakota Academy of Science Proceedings, v o l . 33, p t . 1, 1979, p . 70.
Schobert , H . H . , S.A. Benson, M.L. J o n e s , and F.R. Karner. S t u d i e s i n t h e Char- a c t e r i z a t i o n of United S t a t e s Low-rank Coals . Proceedings, I n t e r n a t i o n a l Conference on Coal Sc ience , Dusse ldor f , Sept . 1981, p . 10-15.
Karner , F.R., S.A. Benson, H . H . Schober t , R . G . Roaldson, and Cir tchlow. Organic and Inorganic Components of L i g n i t e : A Scanning Elec t ron Microscope and Micro- probe Study. Geological S o c i e t y of America Programs wi th A b s t r a c t s , ( A b s t r a c t ) , v . 1 4 , 1982.
Weaver, J . N . i n A n a l y t i c a l Methods f o r Coal and Coal Products , Vol. I , p . 377-401, Karr , C . , Jr . (Ed. ) , Academic P r e s s , I n c . , N e w York (1978).
M i l l e r , R . N . and P.H. Given. A geochemical s tudy of t h e inorganic c o n s t i t u e n t s i n some low-rank c o a l . U.S. DOE r e p o r t FE-2494-TR-1 (1979).
Finkelman, R . B . Modes of Occurrence of Trace Elements i n Coal. Univers i ty of Maryland. Ph.D. d i s s e r t a t i o n (1980) , 301 p .
Holm, P.L. D i s t r i b u t i o n of Inorganics i n S e l e c t e d Low-rank Coals . GFETC IR-5, 1982.
132
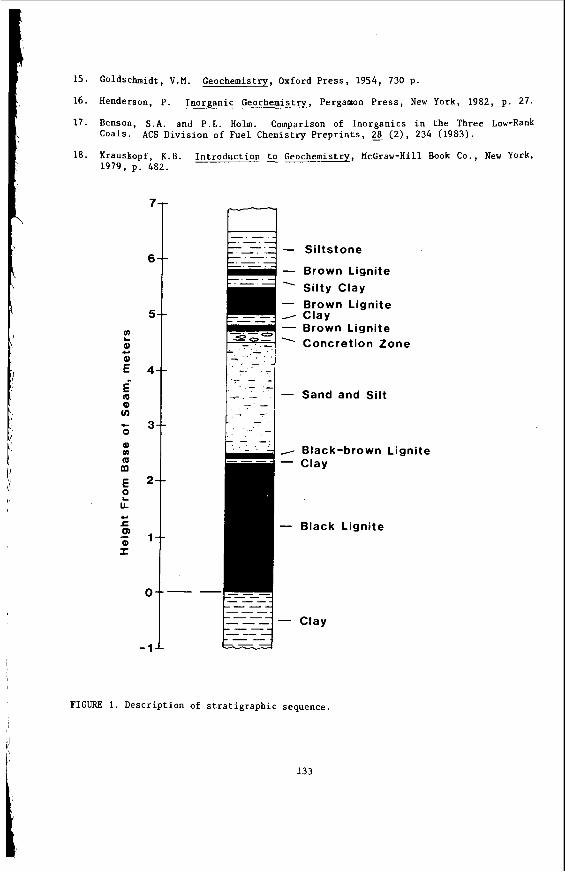
,
15. Goldschmidt, V . M . Geochemistry, Oxford Press, 1954, 730 p.
16. Henderson, P. Inorganic Geochemistry, Pergamon Press, New York, 1982, p. 27.
17. Benson, S . A . and P.L. Holm. Comparison of Inorganics in the Three Low-Rank Coals. ACS Division of Fuel Chemistry Preprints, &3 (21, 234 (1983).
18. Krauskopf, K.B 1979, p. 482.
- 1
Introduction 2 Geochemistry, McGraw-Hill Book Co., New York,
- Siltstone
- Brown Lignite . _ .
. Silty Clay - Brown Lignite -. - Brown Lignite
Concretion Zone
- - - I-I-1 - Sand and Silt
-
- -I A -- Black-brown Lignite - Clay
- Black Lignite
FIGURE 1. Description of stratigraphic sequence.
133
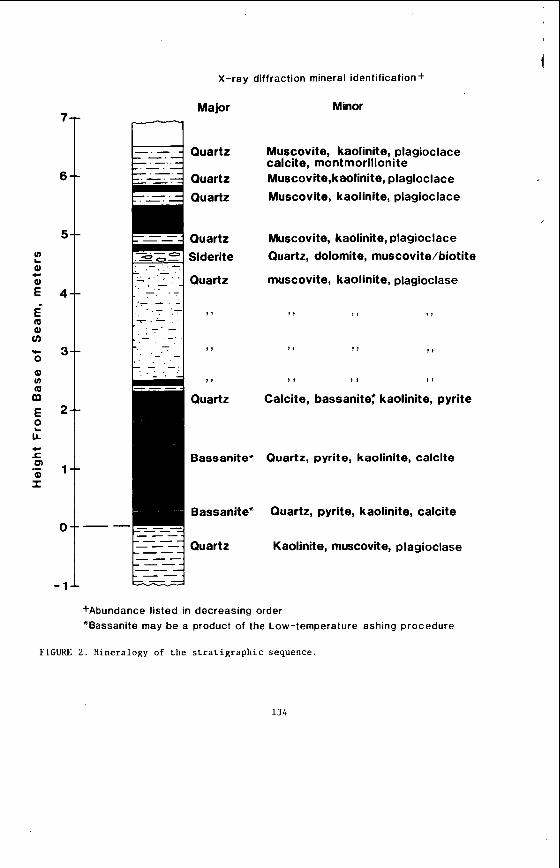
7
6
5
4
3
2
1
0
- 1
X-ray diffraction mineral identification +
Major a Quartz
Quartz Quartz
Quartz Slderlte - . . - r-: 4 Quartz
- _ _
9 1
Quartz
Bassanite'
Bassanite*
Quartz
- -- --
Minor
Muscovite, kaolinite, plagioclace calcite, montmorillonite Muscovite,kaolinite, plagioclace Muscovite, kaolinite, plagioclace
Muscovite, kaolinite, plagioclace Quartz, dolomite, muscovite/biotite
muscovite, kaolinite, plagioclase
I , I , 3 ,
I , I , ,!
I , 1 9 I ,
Calcite, bassanite: kaolinite, pyrite
Quartz, pyrite, kaolinite, calcite
Quartz, pyrite, kaolinite, calcite
Kaolinite, muscovite, plagioclase
+Abundance listed in decreasing order *Bassanite may b e a product of the Low-temperature ashing procedure
FIGURE 2. Mineralogy of the stratigraphic sequence
134
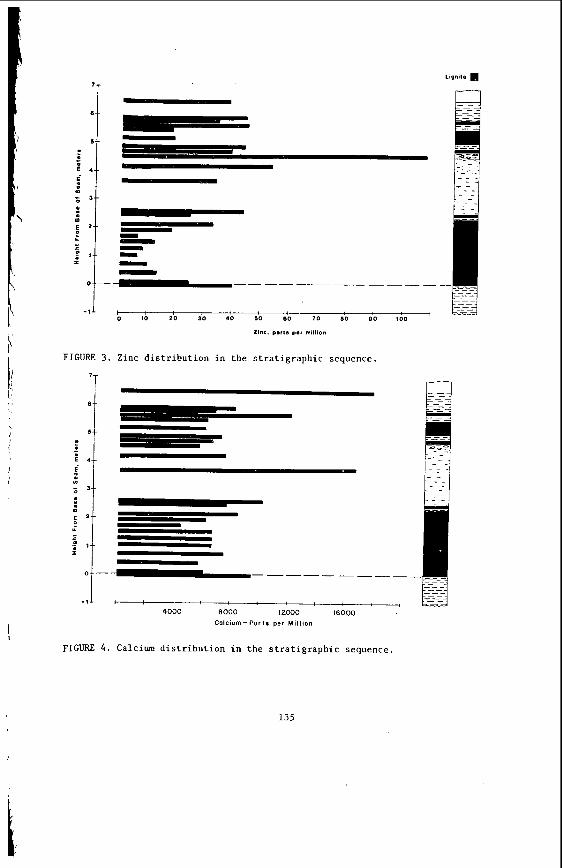
'T Lignite
!=I
I
, ~1 b I O 2b 30 40 50 60 7 0 I
Zlns. pa,:* pa, million
FIGURE 3. Zinc distribution in the stratigraphic sequence.
'T - ? 1-
4000 8000 12000 16000 Colcium- Por ts per Mill8on
FIGURE 4 . Calcium distribution in the stratigraphic sequence.
135
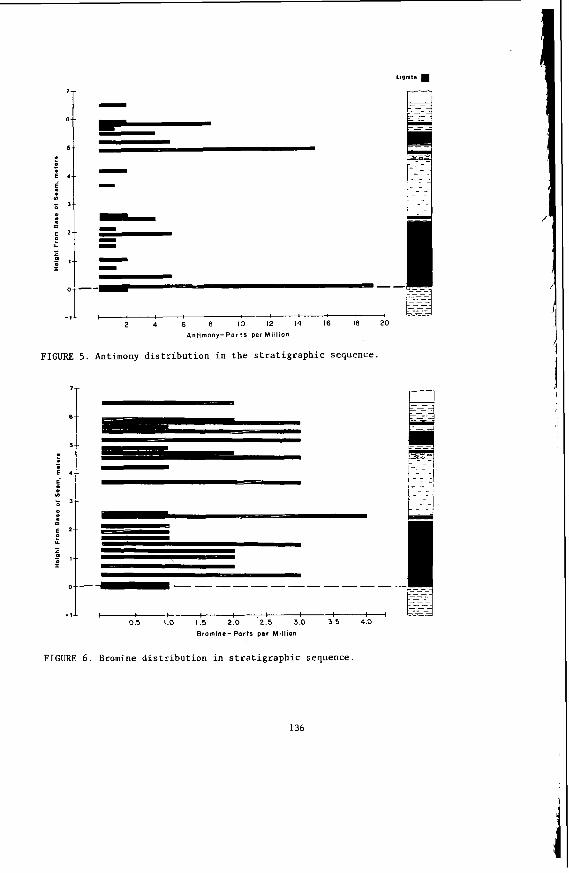
t , 2 4 6 8 I O 12 14 16 18 20
Ant imony-Par ts Per Million
FIGURE 5. Antimony distribution in the stratigraphic sequence.
e- I--- l
Bromine- Parts per Million
FIGURE 6. Bromine distribution in stratigraphic sequence
136
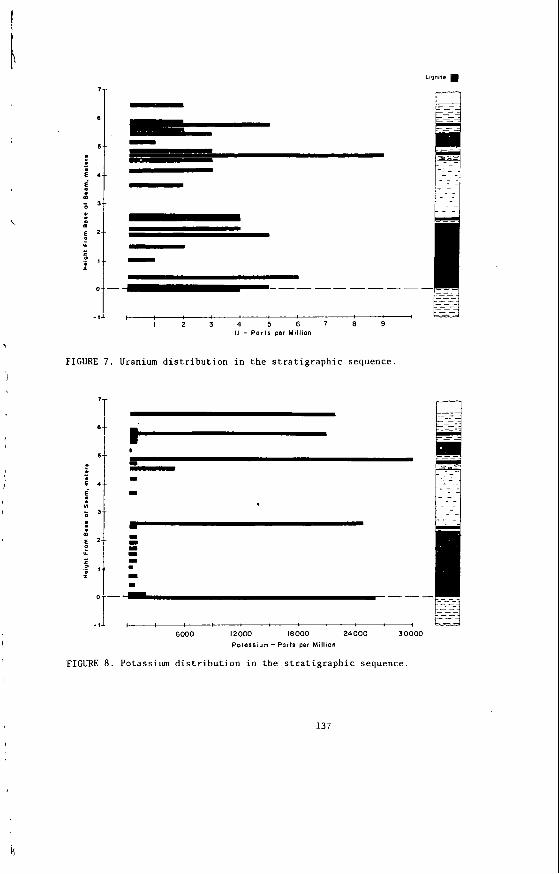
I
I
I , 1 2 3 4 5 6 7 8 9
u - Par ts ~ e r Million
FIGURE 7 . Uranium d i s t r i b u t i o n i n t h e s t r a t i g r a p h i c sequence.
* I
I - I
I
6000 12000 l8000 2 4 0 0 0 30000 Polassium - Parts per Million
FIGURE 8. Potassium d i s t r i b u t i o n i n t h e s t r a t i g r a p h i c sequence
137
ROLE OF EXCHANGEABLE CATIONS ON THE RAPID PYROLYSIS OF LIGNITES
Mark E. Morgan" and Robert G. J enk ins
Department of Materials Science and Engineer ing The Pennsylvania S t a t e Un ive r s i ty
Un ive r s i ty Park, PA 16802
INTRODUCTION
Recently, r e sea rch concerned w i t h u t i l i z a t i o n of t h e v a s t r e s e r v e s of American l i g n i t e s h a s expanded g r e a t l y . S t u d i e s have shown t h a t l i g n i t e s r e a c t q u i t e d i f f e r - e n t l y than c o a l s of h ighe r rank when sub jec t ed t o u t i l i z a t i o n and conversion schemes. The behavior of l i g n i t e s is be l i eved t o be g r e a t l y in f luenced by t h e ino rgan ic con- s t i t u e n t s p r e s e n t . The most s i g n i f i c a n t f e a t u r e of t h e ino rgan ic c o n s t i t u t e n t s of l i g n i t e s i s t h e l a r g e c o n c e n t r a t i o n of exchangeable metal-cat ions. These c a t i o n s a r e mainly a l k a l i and a l k a l i n e e a r t h metals a s s o c i a t e d with t h e carboxyl groups p r e s e n t in l i g n i t e s . Th i s r e s e a r c h is concerned wi th t h e e f f e c t of exchangeable c a t i o n s on r ap id p y r o l y s i s of a l i g n i t e .
EXPERIMENTAL
Pyro lys i s w a s c a r r i e d o u t i n a d i lu t e -phase entrained-f low r e a c t o r . The system i s a modified v e r s i o n (1) of t h a t u t i l i z e d by Sca ron i e t a l . ( 2 ) . The system a l lows p y r o l y s i s t o be s tud ied under h igh h e a t i n g and coo l ing r a t e s (104 - lo5 K / s ) . Under t h e s e cond i t ions , examination of p y r o l y s i s over r e s idence t imes from 0.03 t o 0.30 s and a t temperatures up to*1300 K is p o s s i b l e . P y r o l y s i s occur s i n a d i l u t e s t ream i n o r d e r to reduce t h e r o l e of secondary r e a c t i o n s r e s u l t i n g from c o n t a c t between t h e p y r o l y s i s p roduc t s .
A Montana l i g n i t e (Fort Union Seam) was u t i l i z e d i n t h i s s tudy . D e t a i l s of t h e organic and ino rgan ic ana lyses of t h i s c o a l can be found elsewhere (3 ) . I n t h i s s tudy , t h r e e types of samples were u t i l i z e d : raw l i g n i t e , acid-washed l i g n i t e and cat ion-loaded l i g n i t e . I n t h e acid-washed l i g n i t e t h e ca rboxy la t e c a t i o n s a r e in t h e hydrogen ( ac id ) form. In t h e a c i d washing procedure, 50 g of r a w l i g n i t e were mixed with 900 m l of 0 .1 N HC1 f o r 16-24 h , f i l t e r e d , mixed w i t h a new ba tch of H C 1 f o r an a d d i t i o n a l 4 h , f i l t e r e d , and washed r epea ted ly . I t was then re- f luxed i n 1000 m l of b o i l i n g d i s t i l l e d wa te r f o r 1 h t o remove excess H C 1 (3 ,4 ) .
Ca t ion load ing w a s always performed on t h e acid-washed samples because i t f a c i l i t a t e s t h e de t e rmina t ion of t h e e x t e n t of c a t i o n loading and e l i m i n a t e com- p l e x i t i e s caused by t h e presence of more than one c a t i o n . The c o n d i t i o n s u t i l i z e d f o r ion exchange can be seen i n Table 1. Fur the r d e t a i l s can be found elsewhere (5). t h e r e a r e four d i f f e r e n t l oad ings of calcium. Calcium was chosen as t h e c a t i o n t o be s tud ied most, because i t i s t h e predominant c a t i o n i n American l i g n i t e s (3).
A number of gauges of t h e e f f e c t s of p y r o l y s i s were u t i l i z e d , t h e most i n fo r - mat ive i s weight l o s s . Because of expe r imen ta l cond i t ions , weight l o s s was d e t e r - mined by using a sh a s a t r a c e r . T h i s technique has been used p rev ious ly by a num- be r of workers (2 ,6 ,7) .
I n add i t ion , t h e decomposition of t h e carboxyl groups w a s s tud ied by measuring t h e carboxylate concen t r a t ions i n t h e c h a r s a f t e r py ro lys i s . The technique t o de t e r - mine t h e carboxyl group con ten t i s o u t l i n e d i n d e t a i l elsewhere ( 3 ) , and is based on t h e work of Schafer (8 ) . There a r e t h r e e b a s i c s t e p s involved: a c i d washing, exchange with barium a c e r a t e and de te rmina t ion of t he e x t e n t of exchange.
Also shown i n Table 1 a r e t h e r e s u l t s of t h e c a t i o n loading. A s can be seen,
*Current address: A t l a n t i c Research Corporat ion, Alexandria , VA, 22314.
138
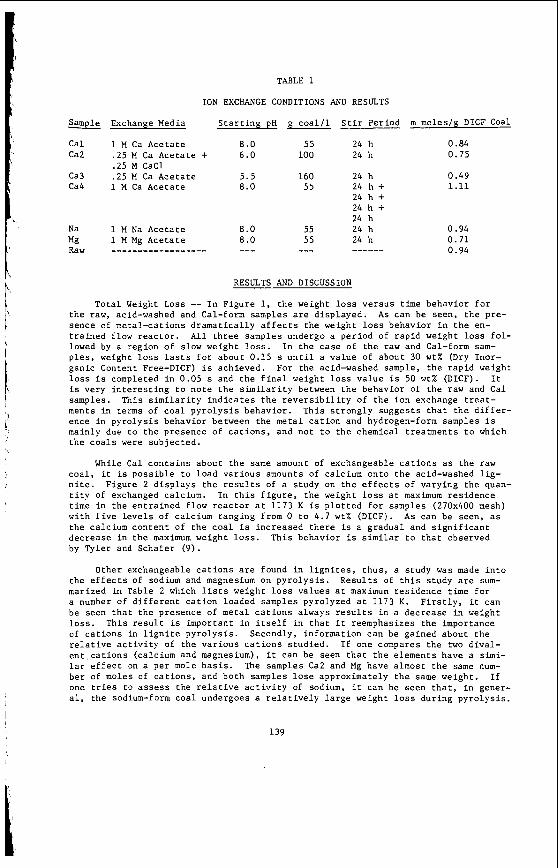
!
TABLE 1
I O N EXCHANGE CONDITIONS AND RESULTS
Sample Exchange Media S t a r t i n g pH g c o a l / l S t i r Period m moles/g DICF Coal
Ca4 1 H Ca Aceta te 8.0
Na 1 M Na Aceta te 8.0 Mg 1 M Mg Aceta te 8 .O Raw _ _ _ _ _ _ _ _ _ _ _ _ _ _ _ _ - _ ---
0 . 8 4 0.75
Cal 1 M Ca Aceta te 8.0 55 24 h Ca2 . 2 5 M Ca Aceta te + 6.0 100 24 h
Ca3 . 2 5 M C a Aceta te 5.5 160 24 h 0 . 4 9 55 24 h + 1.11
. 2 5 H C a C l
24 h + 24 h + 24 h
55 24 h 0 . 9 4 55 24 h 0 .71
0 . 9 4 ------
RESULTS AND DISCUSSION
To ta l Weight Loss -- In Figure 1, the weight l o s s ve r sus t ime behavior f o r t h e raw, acid-washed and Cal-form samples a r e d i sp l ayed . A s can be seen, t he pre- sence of meta l -ca t ions d rama t i ca l ly a f f e c t s t he weight l o s s behavior i n t h e en- t r a ined flow r e a c t o r . All t h r e e samples undergo a per iod of rap id weight loss f o l - lowed by a region of slow weight loss. I n the case of t he raw and Cal-form sam- p l e s , weight l o s s l a s t s f o r about 0.15 s u n t i l a value of about 30 w t % (Dry Inor- ganic Content Free-DICF) i s achieved . For t he acid-washed sample, t h e r ap id weight loss i s completed i n 0 . 0 5 s and t h e f i n a l weight loss va lue is 5 0 w t % (DICF). It i s very i n t e r e s t i n g to no te t h e s i m i l a r i t y between t h e behavior of t h e raw and Cal samples. This s i m i l a r i t y i n d i c a t e s t h e r e v e r s i b i l i t y of t h e ion exchange t r e a t - ments i n terms of coa l p y r o l y s i s behavior . Th i s s t r o n g l y sugges ts t h a t t he d i f f e r - ence i n py ro lys i s behavior between the metal c a t i o n and hydrogen-form samples i s mainly due t o t h e presence of c a t i o n s , and not to t h e chemical t r ea tmen t s to which t h e c o a l s were sub jec t ed .
While C a l con ta ins about t he same amount of exchangeable c a t i o n s a s t he raw c o a l , i t is p o s s i b l e to load va r ious amounts of calcium onto t h e acid-washed l i g - n i t e . Figure 2 d i sp lays the r e s u l t s of a s tudy on t h e e f f e c t s of vary ing the quan- t i t y of exchanged calcium. I n t h i s f i g u r e , t he weight l o s s a t maximum res idence time i n t h e en t r a ined flow r e a c t o r a t 1173 K is p l o t t e d f o r samples ( 2 7 0 x 4 0 0 mesh) with f i v e l e v e l s of calcium ranging from 0 t o 4 . 7 w t % (DICF). A s can be seen, a s t h e calcium con ten t of t h e coa l is increased the re i s a gradual and s i g n i f i c a n t decrease i n the maximum weight loss. This behavior is s i m i l a r t o t h a t observed by Tyler and Schafer ( 9 ) .
Other exchangeable c a t i o n s a r e found i n l i g n i t e s , t h u s , a s tudy was made i n t o the e f f e c t s of sodium and magnesium on py ro lys i s . Resu l t s of t h i s s tudy a r e sum- marized i n Table 2 which l i s ts weight l o s s va lues a t maximum res idence t ime f o r a number of d i f f e r e n t c a t i o n loaded samples pyrolyzed a t 1173 K. F i r s t l y , i t can be seen t h a t t h e presence of metal c a t i o n s always r e s u l t s i n a dec rease i n weight l o s s . Th i s r e s u l t is important i n i t s e l f i n t h a t i t reemphasizes the importance of c a t i o n s in l i g n i t e py ro lys i s . Secondly, in format ion can be gained about t he r e l a t i v e a c t i v i t y of t he va r ious c a t i o n s s tud ied . I f one compares the two d iva l - e n t , c a t i o n s (calcium and magnesium), i t can be seen t h a t t h e elements have a s i m i - l a r e f f e c t on a per mole b a s i s . The samples Ca2 and Mg have almost t he same num- be r of moles oE c a t i o n s , and both samples l o s e approximately t h e same weight. I f one tries t o a s s e s s the r e l a t i v e a c t i v i t y of sodium, i t can be seen t h a t , i n gener- a l , t he sodium-form coa l undergoes a r e l a t i v e l y l a r g e weight loss dur ing py ro lys i s .
139
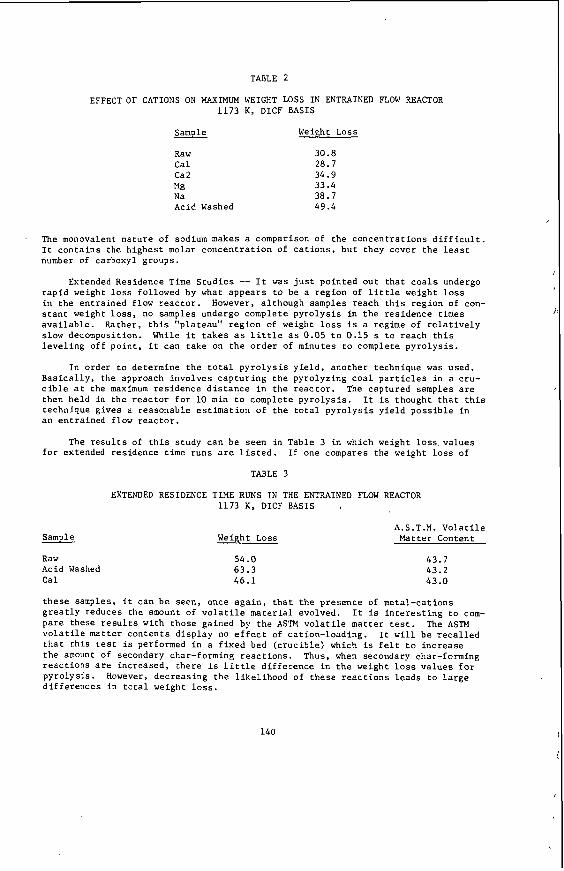
TABLE 2
EFFECT OF CATIONS ON MAXIMUM WEIGHT LOSS I N ENTRAINED FLOW REACTOR 1173 K , DICF BASIS
Sample Weight Loss
Raw 3 0 . 8 C a l 28 .7 Ca 2 3 4 . 9 Ma 3 3 . 4 N a 3 8 . 7 Acid Washed 4 9 . 4
The monovalent n a t u r e of sodium makes a comparison of the concen t r a t ions d i f f i c u l t . It c o n t a i n s t h e h ighes t molar concen t r a t ion of c a t i o n s , bu t they cover t h e l e a s t number of carboxyl groups.
Extended Residence T i m e S tud ie s -- It was j u s t po in ted o u t t h a t c o a l s undergo r ap id weight loss followed by what appea r s t o be a reg ion of l i t t l e weight loss i n the en t r a ined flow r e a c t o r . s t a n t weight loss, no samples undergo complete py ro lys i s i n t h e res idence times a v a i l a b l e . Rather, t h i s "p la teau" r eg ion of weight loss i s a regime of r e l a t i v e l y slow decomposition. While it t a k e s as l i t t l e a s 0.05 t o 0.15 s t o r each t h i s l e v e l i n g off p o i n t , i t can take on t h e o rde r of minutes t o complete py ro lys i s .
However, a l though samples reach t h i s reg ion of con-
I n order t o determine t h e t o t a l p y r o l y s i s y i e l d , another technique was used. B a s i c a l l y , the approach invo lves c a p t u r i n g t h e pyro lyz ing coa l p a r t i c l e s i n a c ru- c i b l e a t the maximum res idence d i s t a n c e i n t h e r e a c t o r . The captured samples are then he ld i n t h e r e a c t o r f o r 10 min t o complete py ro lys i s . It i s thought t h a t t h i s technique g ives a reasonable e s t ima t ion of t h e t o t a l p y r o l y s i s y i e l d p o s s i b l e in an en t r a ined flow r e a c t o r .
The r e s u l t s of t h i s s tudy can be seen in Table 3 i n which weight loss va lues f o r extended res idence time runs a r e l i s t e d . If one compares the weight l o s s of
TABLE 3
EXTENDED RESIDENCE TIME RUNS I N THE EFTRAINED FLOW REACTOR 1173 K. DICF BASIS
Sample
Raw Acid Washed Cal
5 4 . 0 6 3 . 3 46.1
A.S.T.M. V o l a t i l e Matter Content
4 3 . 7 4 3 . 2 4 3 . 0
t h e s e samples, i t can be seen , once a g a i n , t h a t t h e presence of meta l -ca t ions g r e a t l y reduces the amount of v o l a t i l e ma te r i a l evolved. pa re these r e s u l t s wi th those gained by the ASTM v o l a t i l e ma t t e r test. The ASTM v o l a t i l e matter con ten t s d i sp l ay no e f f e c t of ca t ion- loading . t h a t t h i s tes t i s performed i n a f i x e d bed ( c ruc ib l e ) which is f e l t t o inc rease t h e anount of secondary char-forming r e a c t i o n s . r eac t ions a r e increased , t he re i s l i t t l e d i f f e r e n c e i n t h e weight l o s s v a l u e s f o r py ro lys i s . However, decreas ing t h e l i ke l ihood of t hese r e a c t i o n s l eads t o l a r g e d i f f e r e n c e s i n t o t a l weight loss.
I t is i n t e r e s t i n g t o com-
I t w i l l be r e c a l l e d
Thus, when secondary char-forming
140
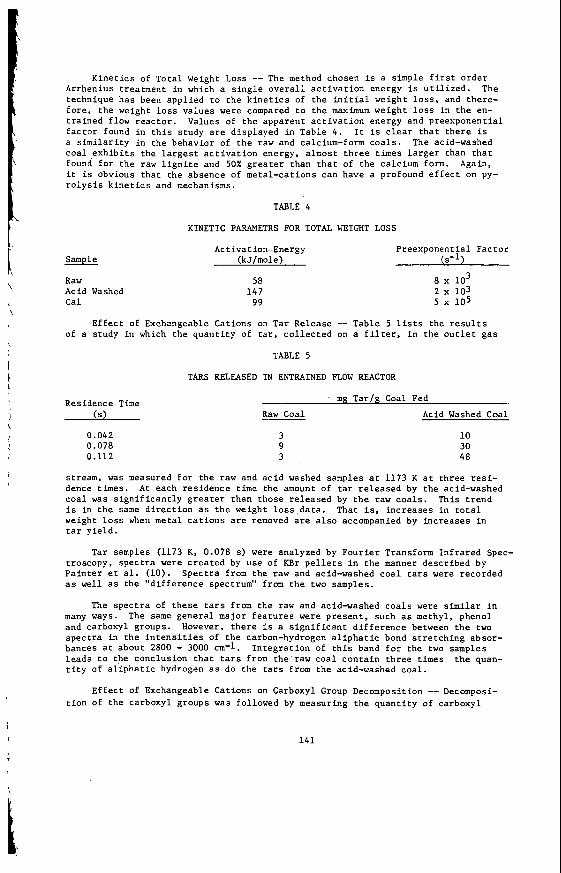
I
Kine t i c s of To ta l Weight Loss -- The method chosen i s a simple f i r s t o rde r Arrhenius t rea tment i n which a s i n g l e o v e r a l l a c t i v a t i o n energy is u t i l i z e d . The technique has been app l i ed t o t h e k i n e t i c s of t h e i n i t i a l weight l o s s , and there- f o r e , t he weight l o s s va lues were compared t o t h e ma..imum weight loss in t h e en- t r a ined flow r e a c t o r . f a c t o r found i n t h i s s tudy a r e d isp layed i n Table 4 . It is c l e a r t h a t t h e r e is a s i m i l a r i t y i n the behavior of t h e raw and calcium-form c o a l s . The acid-washed coa l e x h i b i t s the l a r g e s t a c t i v a t i o n energy, almost t h r e e times l a r g e r than t h a t found f o r t h e raw l i g n i t e and 50X g r e a t e r than t h a t of t h e calcium form. Again, i t is obvious t h a t t he absence of meta l -ca t ions can have a profound e f f e c t on py- r o l y s i s k i n e t i c s and mechanisms.
Values of t h e apparent a c t i v a t i o n energy and preexponent ia l
TABLE 4
KINETIC PARAMETRS FOR TOTAL. WEIGHT LOSS
Sample
Raw Acid Washed Cal
Activation-Energy (kJ/mole)
58 147
99
Preexponent ia l F a c t o r (S-1)
8 lo3 2 103 5 105
E f f e c t of Exchangeable Cat ions on Tar Release -- Table 5 l ists the r e s u l t s of a study i n which t h e q u a n t i t y of t a r , c o l l e c t e d on a f i l t e r , i n t h e o u t l e t gas
TABLE 5
TARS RELEASED I N ENTRAINED FLOW REACTOR
Residence Time (S)
0.042 0.078 0.112
- Raw Coal Acid Washed Coal
' mg Tar /g Coal Fed
-- 3 9 3
10 30 48
stream, was measured for t h e r a w and a c i d washed samples a t 1173 K a t t h ree r e s i - dence times. c o a l was s i g n i f i c a n t l y g r e a t e r than those r e l eased by t h e raw c o a l s . is in t h e same d i r e c t i o n as t h e weight l o s s , d a t a . That i s , inc reases i n t o t a l weight loss when meta l c a t i o n s a r e removed a r e a l s o accompanied by inc reases i n t a r y i e l d .
A t each r e s idence t ime the amount of tar r e l eased by the acid-washed Th i s t r end
Tar samples (1173 K, 0.078 s ) were analyzed by Four i e r Transform I n f r a r e d Spec- t roscopy, spec t r a were c r e a t e d by use of KBr p e l l e t s i n t h e manner descr ibed by P a i n t e r e t a l . (10). Spec t r a from the r a w and acid-washed c o a l t a r s were recorded as wel l a s t h e "d i f f e rence spectrum" from t h e two samples.
The spec t r a of t hese tars from the raw and acid-washed c o a l s were s i m i l a r i n many ways. The same gene ra l major f e a t u r e s were p resen t , such a s methyl, phenol and carboxyl groups. However, t h e r e i s a s i g n i f i c a n t d i f f e r e n c e between t h e two spec t r a in t h e i n t e n s i t i e s of t he carbon-hydrogen a l i p h a t i c bond s t r e t c h i n g absor - bances a t about 2800 - 3000 cm-1. l eads t o the conclus ion t h a t t a r s from the r a w coa l con ta in t h r e e times t h e quan- t i t y of a l i p h a t i c hydrogen a s do the t a r s from t h e acid-washed coa l .
I n t e g r a t i o n of t h i s band f o r t he two samples
Ef fec t of Exchangeable Cat ions on Carboxyl Group Decomposition -- Decomposi- t i o n of the carboxyl groups was followed by measuring the q u a n t i t y of carboxyl
141
t
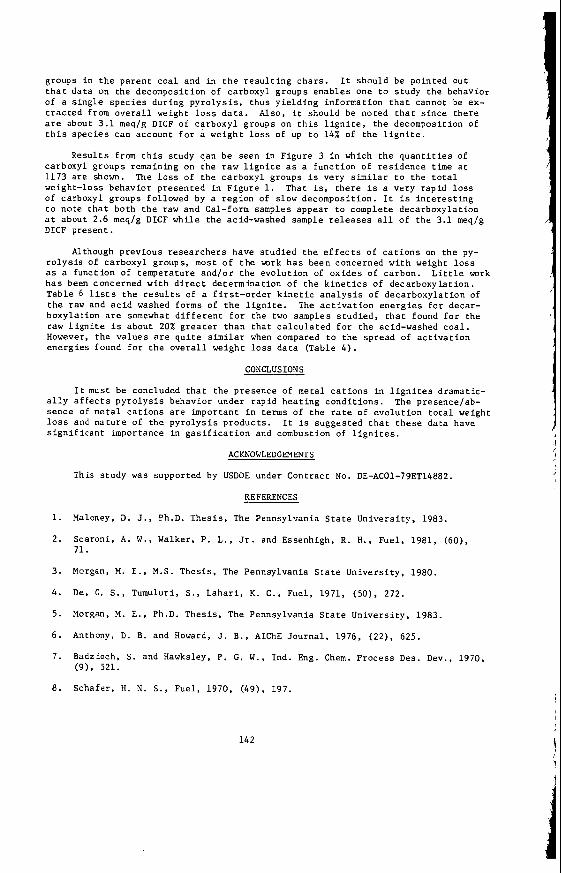
groups i n t h e pa ren t coa l and i n t h e r e s u l t i n g cha r s . It should be pointed out t h a t d a t a on the decomposition of carboxyl groups enab le s one t o s tudy the behavior of a s i n g l e spec ie s dur ing p y r o l y s i s , thus y i e l d i n g informat ion t h a t cannot be ex- t r a c t e d from o v e r a l l weight l o s s d a t a . Also, it should be noted t h a t s i n c e the re a r e about 3.1 meq/g DICF of carboxyl groups on t h i s l i g n i t e , t h e decomposition of t h i s spec ie s can account f o r a weight loss of up t o 14% of t h e l i g n i t e .
Resu l t s from t h i s s tudy can be seen i n F igure 3 i n which t h e q u a n t i t i e s of carboxyl groups remaining on the r a w l i g n i t e a s a func t ion of r e s idence time a t 1173 a r e shown. The l o s s of t he carboxyl groups is very s i m i l a r t o the t o t a l weight-loss behavior presented i n F igu re 1. That i s , t h e r e i s a very rap id loss of carboxyl groups followed by a reg ion of slow decomposition. It is i n t e r e s t i n g t o note t h a t both t h e raw and Cal-form samples appear t o complete decarboxyla t ion a t about 2.6 meq/g DICF whi le t he acid-washed sample r e l e a s e s a l l of t he 3.1 meq/g DICF present .
Although p rev ious r e sea rche r s have s tud ied t h e e f f e c t s of c a t i o n s on t h e py- r o l y s i s of carboxyl groups, most of t h e m r k h a s been concerned wi th weight loss a s a func t ion of temperature and /o r t h e evo lu t ion of ox ides of carbon. L i t t l e work h a s been concerned wi th d i r e c t de te rmina t ion of t h e k i n e t i c s of decarboxyla t ion . Table 6 l ists t h e r e s u l t s of a f i r s t - o r d e r k i n e t i c a n a l y s i s of decarboxyla t ion of t h e raw and a c i d washed forms of t h e l i g n i t e . The a c t i v a t i o n ene rg ie s f o r decar- boxyla t ion a r e somewhat d i f f e r e n t f o r the two samples s t u d i e d , t h a t found f o r the raw l i g n i t e i s about 20% g r e a t e r t han t h a t c a l c u l a t e d f o r t h e acid-washed c o a l . However, t h e va lues are q u i t e similar when compared t o the spread of a c t i v a t i o n ene rg ie s found f o r t h e o v e r a l l weight loss d a t a (Table 4 ) .
CONCLUSIONS
I t must be concluded t h a t t he presence of metal c a t i o n s i n l i g n i t e s dramatic- a l l y a f f e c t s p y r o l y s i s behavior under rap id hea t ing cond i t ions . The presence/ab- sence of meta l c a t i o n s a r e important i n terms of t he rate of evo lu t ion t o t a l weight l o s s and n a t u r e of t he p y r o l y s i s products . It is sugges ted t h a t t h e s e da t a have s i g n i f i c a n t importance i n g a s i f i c a t i o n and combustion of l i g n i t e s .
ACKNOWLDGEMENTS
This s tudy was supported by USDOE under Cont rac t No. DE-AC01-79ET14882.
REFERENCES
1. Maloney, D. J . , Ph.D. Thes i s , The Pennsylvania S t a t e Un ive r s i ty , 1983.
2 . Scaroni. A. W . , Walker, P. L., Jr . and Essenhigh, R. H . , Fue l , 1981, (60), 71.
3 . Morgan, M. E . , X.S. Thes i s , The Pennsylvania S t a t e Un ive r s i ty , 1980.
4. D e , G. S . , Tumuhr i , S . , Lahar i , K. C . , Fue l , 1971, (50), 2 7 2 .
5.
6. Anthony, D . B. and Howard, J. B . , AIChE Journa l , 1976, (22). 625.
7. Badzioch. S. and Hawksley, P. G. W . , Ind. Eng. Chem. Process Des. Dev., 1970,
Morgan, M . E . , Ph.D. Thes is , The Pennsylvania S t a t e Un ive r s i ty , 1983.
( 9 ) , 521.
8 . Schafer , H. N. S., Fue l , 1970, (49) , 197.
142
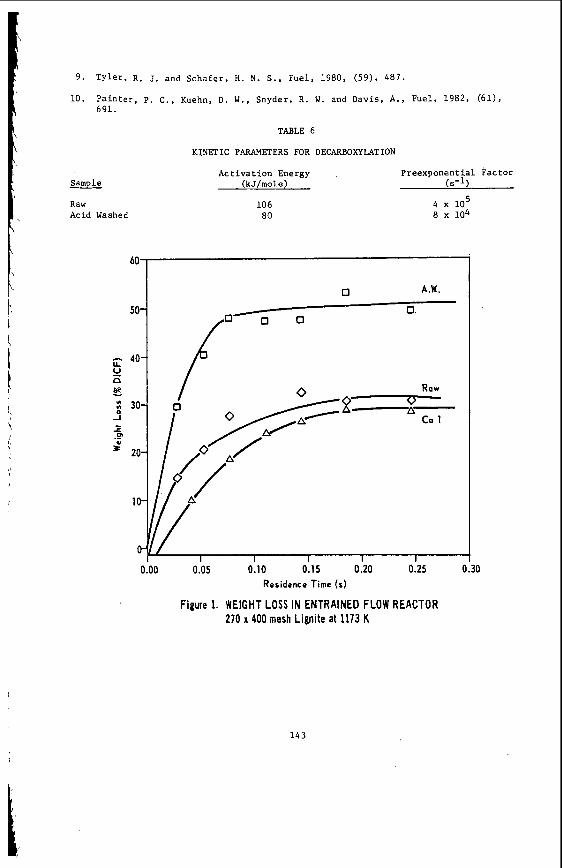
9 . Tyler, R . 3. and Schafer, H . N . S . , Fuel, 1980, ( 5 9 1 , 487.
10. Painter, P. C . , Kuehn, D. W., Snyder, R . W . and Davis, A., Fuel, 1982, (61), 691.
TABLE 6
KINETIC PARAMETERS FOR DECARBOXYLATION
Activation Energy Preexponential Factor Sample (kJ/mole) (S-1)
Raw 106 4 lo5 Acid Washed 80 8 x 10⁴
60
0 A.W.
I I I I I I 0.00 0.05 0.10 0.15 0.20 0.25 c
Residence Time ( 5 )
Figure 1. WEIGHT LOSS IN ENTRAINED FLOW REACTOR 270 x 400 mesh Lignite at 1173 K
30
143
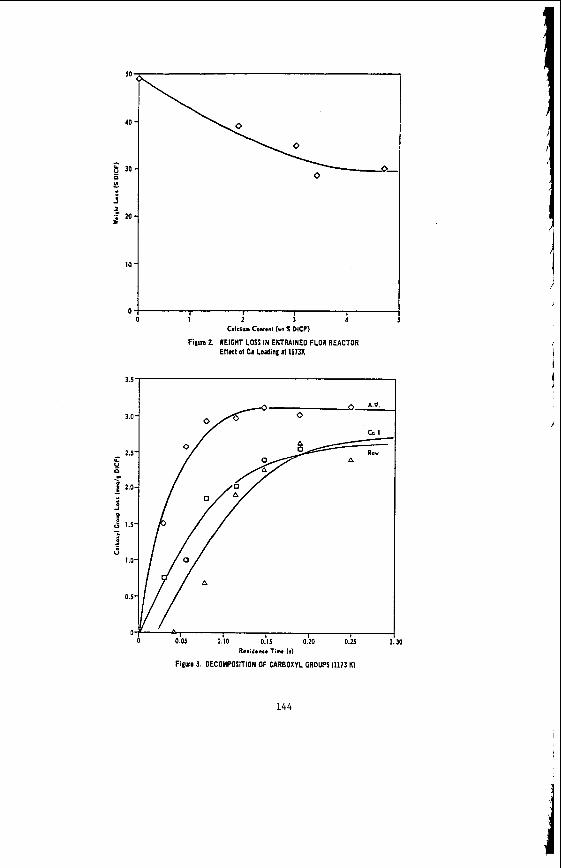
I I I I
Cdciu. G n t i n f (rt X DICF) i 1 2 1 1
Figurn 2. WElGKT LOSS IN ENTRAINED FLOW REACTOR Effect 01 Ca Loading at 1173K
1.1
3.0'
2.5' c - 0 0 . f 2.0. - : f 1.5. - - z
1 . 0
0.1'
0
0 . A 0
c. I
R.- 0
A
I
I I 1 1 0.0s 0.10 0.15 0.20 0.21 I
Figurn 3. OECOHPOSlTlON OF CARBOXYL GROUPS 11173 K)
Residence Tim (J 30
I
144
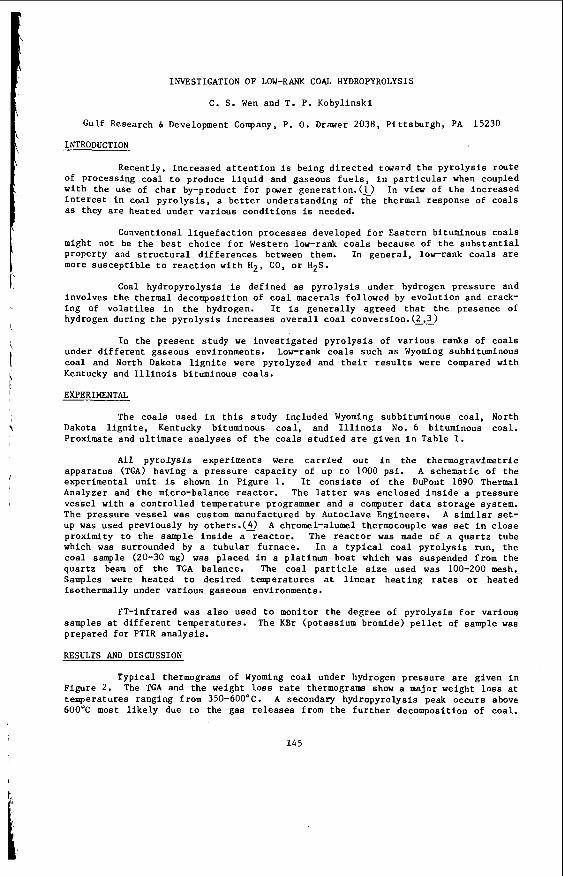
INVESTIGATION OF LOW-RANK COAL HYDROPYROLYSIS
C. S. Wen and T. P. Kobylinskf
Gulf Research 6 Development Company, P. 0. Drawer 2038, P i t t sburgh . PA 15230
INTRODUCTION
Recent ly , increased a t t e n t i o n is being d i r e c t e d toward t h e p y r o l y s i s rou te of processing coa l t o produce l i q u i d and gaseous f u e l s , i n p a r t i c u l a r when coupled wi th t h e use of char by-product f o r prwer genera t ion . (L) In view of t h e increased i n t e r e s t i n coa l p y r o l y s i s , a b e t t e r understanding of t h e thermal response of coa ls as they a r e heated under var ious condi t ions is needed.
Conventional l i q u e f a c t i o n processes developed f o r Eas te rn bituminous c o a l s might not be t h e bes t choice f o r Western low-rank c o a l s because of t h e s u b s t a n t i a l Property and s t r u c t u r a l d i f f e r e n c e s between them. In genera l , low-rank c o a l s a r e more s u s c e p t i b l e t o r e a c t i o n wi th H 2 , CO, o r H2S.
Coal hydropyrolysis is def ined as p y r o l y s i s under hydrogen p r e s s u r e and involves t h e thermal decomposition of c o a l macerals fol lowed by e v o l u t i o n and crack- i n g of v o l a t i l e s i n t h e hydrogen. It is g e n e r a l l y agreed t h a t t h e presence of hydrogen during t h e p y r o l y s i s i n c r e a s e s o v e r a l l c o a l conversion.(&A)
I n t h e present s tudy we i n v e s t i g a t e d p y r o l y s i s of var ious ranks of c o a l s under d i f f e r e n t gaseous environments. Low-rank c o a l s such as Wyoming subbituminous coa l and North Dakota l i g n i t e were pyrolyzed and t h e i r r e s u l t s were compared wi th Kentucky and I l l i n o i s bituminous coa ls .
EXPERIMENTAL
The coa ls used i n t h i s s tudy included Wyoming subbituminous coa l , North Dakota l i g n i t e , Kentucky bituminous c o a l , and I l l i n o i s No. 6 bituminous coal . Proximate and u l t i m a t e ana lyses of t h e coa ls s t u d i e d a r e given i n Table I.
A l l p y r o l y s i s experiments were c a r r i e d out i n t h e thermogravimetr ic appara tus (TGA) having a p r e s s u r e capac i ty of up t o 1000 ps i . A schematic of t h e experimental u n i t is shown i n F igure 1. It c o n s i s t s of t h e DuPont 1090 Thermal Analyzer and t h e micro-balance reac tor . The l a t t e r was enclosed i n s i d e a pressure ves'sel with a c o n t r o l l e d temperature programmer and a computer d a t a s t o r a g e system. The pressure v e s s e l was custom manufactured by Autoclave Engineers. A s i m i l a r set- up was used previously by o t h e r s . ( ) A chromel-alumel thermocouple was set in c l o s e proximity t o t h e sample i n s i d e a r e a c t o r . The r e a c t o r was made of a q u a r t z tube which was surrounded by a t u b u l a r furnace. I n a t y p i c a l c o a l p y r o l y s i s run, t h e c o a l sample (20-30 mg) was placed i n a plat inum boat which w a s suspended from t h e quar tz beam of t h e TGA balance. The coal p a r t i c l e s i z e used was 100-200 mesh. Samples were hea ted t o d e s i r e d temperatures at l i n e a r h e a t i n g rates o r heated i so thermal ly under var ious gaseous environments.
FT-infrared was a l s o used t o monitor t h e degree of p y r o l y s i s f o r var ious The K B r (potassium bromide) p e l l e t of sample was samples a t d i f f e r e n t temperatures .
prepared f o r FTIR a n a l y s i s .
RESULTS AND DISCUSSION
Typica l thermograms of Wyoming c o a l under hydrogen p r e s s u r e are given i n F igure 2 . The TGA and t h e weight l o s s rate thermograms show a major weight l o s s a t temperatures ranging from 35O-6OO0C. A secondary hydropyrolysis peak occurs above 600°C most l i k e l y due t o the gas releases from t h e f u r t h e r decomposition of coal .
145
i
Figure 3 shows a comparison of d e r i v a t i v e thermograms f o r f o u r d i f f e r e n t rank coals. The d i f f e r e n c e s of d e v o l a t i l i z a t i o n r a t e a r e not l a r g e a t temperatures up t o 500'c, however, above 5OO0C, t h e secondary hydropyrolysis . peak of low-rank coa l becones dominant.
The i n f l u e n c e of h e a t i n g rate on c o a l hydropyrolysis was s t u d i e d over a range of 5-IOO°C/min. As shown i n F igure 4 , t h e two peaks were observed, t h e f i r s t of which w e c a l l t h e primary v o l a t i l i z a t i o n , and t h e second, c h a r a c t e r i s t i c of loca l hydropyrolysis . The f i r s t peak increased r a p i d l y wi th t h e i n c r e a s e of t h e heat ing rate. The second c h a r a c t e r i s t i c peak becomes r e l a t i v e l y dominant a t lower heat ing rates. It seems t h a t t h e hydropyrolys is peak is favored by slow h e a t i n g r a t e s , i n d i c a t i n g a h e a t t r a n s f e r l i m i t a t i o n w i t h i n t h e secondary hydropyrolysis region. In c o n t r a s t , c o a l pyrolyzed under a n i n e r t n i t rogen atmosphere r e s u l t s in an i n c r e a s e of weight l o s s r a t e w i t h i n c r e a s i n g h e a t i n g r a t e s , but t h e shape of the curves remains t h e same (Figure 5 ) .
The e f f e c t of hydrogen on c o a l p y r o l y s i s can f u r t h e r be i l l u s t r a t e d by Figure 6, where we compared d e r i v a t i v e thermograms. of Wyoming c o a l pyrolyzed a t 200 psig of N2 and 200 p s i g of H2 a t t h e same h e a t i n g r a t e s (2O0C/min). The second- a ry hydropyrolysis peak observed a t 580°C in t h e HZ run was absent i n t h e N2 atmo- sphere.
FTIR s p e c t r a of t h e o r i g i n a l c o a l and char from pyro lyz ing Wyoming coal under H2 pressure a t va ious temperatures are shown in Figure 7 (only wave numbers between 1700 and 400 cm-' were shown h e r e f o r comparison). The s t r o n g e s t absorpt ion band loca ted a t 1600 cm-' begins t o decrease in i n t e n s i t y a t 470°C. This band has been assigned t o a romat ic r i n g C-C v i b r a t i o n a s s o c i a t e d wi th pheno ic/phenoxy groups.(?) S i m i l a r l y , t h e aromatic-oxygen v i b r a t i o n band near 1260 cm-' shows an equiva len t decrease. The a b s o r p t i o n bands between 720 t o 870 cm-' (which a r i s e from t h e out-of-plane aromatic CH v i b r a t i o n s ) i n c r e a s e markedly a t 470"C, i n d i c a t i n g a growth in s i z e of a romat ic c l u s t e r s in t h e r e a c t e d coa l . A t 65OoC, most organi absorp t ion bands were diminished except f o r a broad band ranging from 1000-1090 cm- due t o c lay minera l a b s o r p t i o n . ( l ) An i n c r e a s e in t h e s t r u c t u r e l e s s background absorp t ion is observed, s u g g e s t i n g a growth of g r a p h i t i z a t i o n in t h e r e s i d u e c o a l .
f
The k i n e t i c s of c o a l p y r o l y s i s are complicated because of t h e numerous components O K s p e c i e s which are s imul taneous ly pyrolyzed and decomposed. For measuring k i n e t i c parameters , w e t r e a t e d d a t a fo l lowing t h e procedure of Coats and Redfern (L) and Mickelson and E i n h o r n . 0 ) The k i n e t i c parameters f o r f o u r d i f f e r e n t c o a l s heated under H2 p r e s s u r e a r e presented in Table 11. A r e a c t i o n order equal 2.3 t o 2.9 was observed f o r t h e primary hydropyrolysis peaks. A high r e a c t i o n order w a s obtained f o r t h e secondary r e a c t i o n peak under hydrogen pressure. The k i n e t i c parameters f o r four d i f f e r e n t coa ls heated under N2 atmosphere compared wi th d a t a presented i n t h e l i t e r a t u r e a r e l i s t e d i n Table 111.
K i n e t i c parameters f o r n ( r e a c t i o n o r d e r ) and E ( a c t i v a t i o n energy) i n t h e l i t e r a t u r e show s i g n i f i c a n t v a r i a t i o n f o r d i f f e r e n t techniques and c o a l (Table 111). By cons ider ing t h e complexity of coa l thermal degrada t ion , many a u t h o r s have contented t h a t a s imple, f i r s t - o r d e r r e a c t i o n is inadequate . Wiser e t al . (10) found t h a t n=2 gave t h e b e s t f i t t o t h e i r d a t a , while Skylar et a l . (11) observed t h a t va lues of n above 2 were requi red t o f i t nonisothermal d e v o l a t i l i z a - t i o n da ta f o r d i f f e r e n t c o a l s . The k i n e t i c parameters obtained in t h i s s tudy a l s o show a non-integer r e a c t i o n order . The thermal decomposition of c o a l s are complex because of the numerous components o r s p e c i e s which a r e s imultaneously decomposed and recondensed.
F igure 8 demonstrates t h e i n f l u e n c e of CO on d e v o l a t i l i z a t i o n f o r d i f - f e r e n t ranks of coa l . For t h e h igher rank coa ls (i.e., Kentucky and I l l i n o i s bituminous c o a l s ) , pyKOlySiS in t h e presence of CO p l u s H2 o r H2 a l o n e fo l lows t h e
146
Same path. However, l i g n i t e showed a marked i n c r e a s e of p y r o l y s i s Kate in t h e run where CO was added. A h igher conten t of r e a c t i v e oxygenated bonds ( i . e . , ca rboxyl o r e t h e r l inkages) i n low-rank coa ls could be t h e reason f o r t h e h igh r e a c t i v i t y in t h e Presence of CO. The k i n e t i c parameters determined f o r c o a l pyrolyzed in syngas (CO/Hz mixture) are l i s t e d in Table I V . A s shown in t h e t a b l e , a high r e a c t i o n order was obtained f o r t h e H2 and CO/H2 runs, p a r t i c u l a r l y f o r t h e low-rank c o a l s which showed a secondary r e a c t i o n occurr ing a t temperatures above 500OC.
CONCLUSIONS
Laboratory microsca le s t u d i e s have demonstrated t h a t t h e c o a l p y r o l y s i s in a hydrogen atmosphere gave h igher degree of d e v o l a t i l i z a t i o n i n low-rank c o a l s than p y r o l y s i s i n an i n e r t atmosphere. I n hydrogen atmosphere two d i s t i n c t s t e p s i n c o a l d e v o l a t i l i z a t i o n were observed as shown by t h e double peak of t h e d e v o l a t i l i z a t i o n rate. Only one s t e p w a s observed under n i t r o g e n atmosphere. I n a comparison of k i n e t i c parameters, a high r e a c t i o n order and a low a c t i v a t i o n energy were a l s o obta ined i n t h e c o a l hydropyrolysis . Appl ica t ion of d a t a and observa t ions from t h i s s tudy could lead t o a b e t t e r understanding of chemical and p h y s i c a l changes dur ing t h e c o a l hydropyrolysis and seek a l t e r n a t i v e c o a l conversion routes .
REFERENCES
1. H. ' W . Parker , "Liquid Synfuels Via Pyro lys is of Coal i n ksSOCiatiOn w i t h Electric Power Generat ion," Energy Progress , 2(1), 4, 1982.
2. R. J. Belt and L. A. Bissett, "Assessment of F lash P y r o l y s i s and Hydro- p y r o l y s i s , " DOE Report METC/RI-79/2, 1978.
3. P. Arendt and K. H. Van Heek, Fuel , 6099), 779, 1981.
4. J. G. Speight , "Assessment of S t r u c t u r e s in Coal by Spec t roscopic Techniques," i n Analy t ica l Methods f o r Coal and Coal Products , (Ed. by C . Karr, JK.), Vol 11, Chapter 22, pp 75-101, Academic P r e s s , New York, 1978.
5. V. T. Ciury la , R. F. Weimer, D. A. Bivans, and S. A. Motika, Fuel, =(lo), 748, 1979.
6. P. C . P a i n t e r and M. M. Coleman, 'The Appl ica t ion of F o u r i e r Transform I n f r a r e d Spectroscopy t o t h e Charac te r iza t ion of Coal and Its Derived Products ," D I G I L A B FTS/IR Notes No. 31, January 1980.
7. A. W . Coats and J. P. Redfern, "Kinet ic Parameters from Thermogravimetric Data ," Nature , 201, 68, 1964.
R. W . Mickelson and I . N. Einhorn, Thermochim. Acta, 1, 147, 1970. 8.
9. W. H. Wiser, Fuel , 47, 475, 1968.
10. W . H. Wiser, G. R. H i l l , and N. J. Kertamus, IbEC Process Design and Develop., - 6(1), 133, 1967.
11. M. G. Skylar , V. I. Shust ikov, and I. V. Virozub, I n t e r n . Chem. Eng., 2, 595, 1969.
147
I
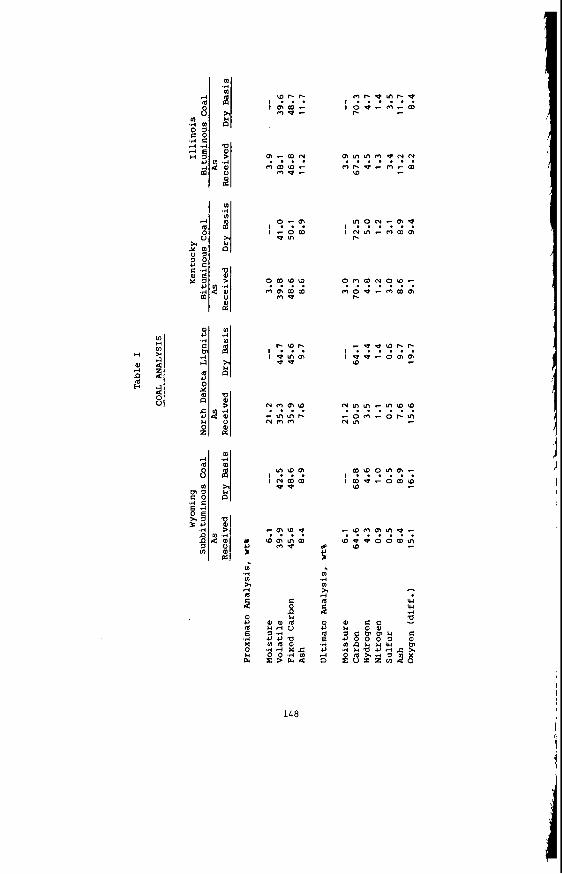
m r - o m " ' l p I o q - m - m I . . . .
r- - q - m ~ m m w -
. . . m P -
m m m 2 o y ~ m t - o - m - m . . . . . W c
, ? ' ; a ! I - o m
o m
9m.99 m m m m m P
I . - : ???? i ~ w - o r n m w c
p . w r - I . . . P P
I q m m U
a U
C
P W v(
a U 4
.-I
0 c
148
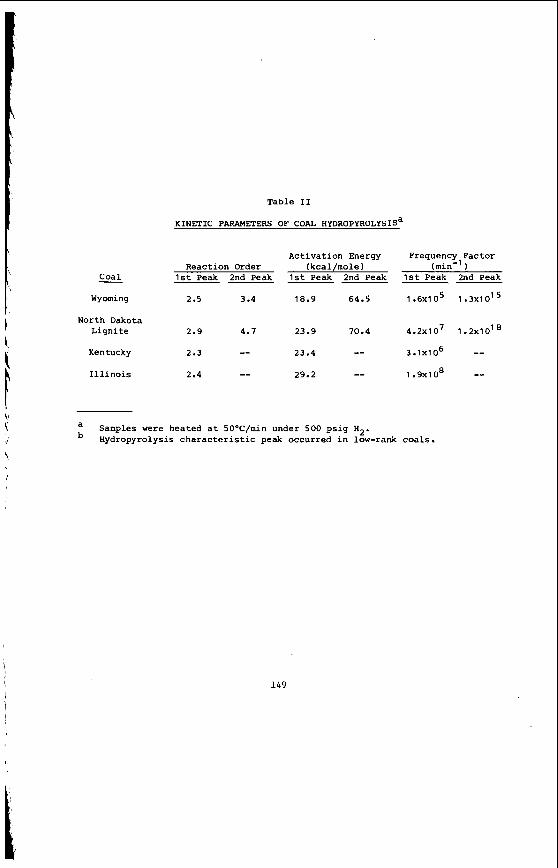
Table I1
KINETIC PARAMETERS OF COAL HYDROPYROLYSIS~
Act iva t ion Energy Frequency Fac tor React ion Order (kcal /mole) (min-1)
1 s t Peak 2nd Peak 1st Peak 2nd Peak 1st Peak 2nd Peak
Wyoming 2.5 3.4 18.9 64.5 1 . 6 ~ 1 0 ~ 1 . 3 ~ 1 0 ~ ~
~----- Coal -
North Dakota Ligni te 2.9 4.7 23.9 70.4 4 . 2 ~ 1 0 ~ 1 . 2 ~ 1 0 ~ ~
Kentucky 2.3 -- 23.4 -- 3 . 1 ~ 1 0 ~ -- I l l i n o i s 2.4 -- 29.2 -- 1.9x10⁸ --
a Samples were heated a t 50°C/min under 500 p s i g H2. Hydropyrolysis c h a r a c t e r i s t i c peak occurred i n low-rank c o a l s .
I,
149
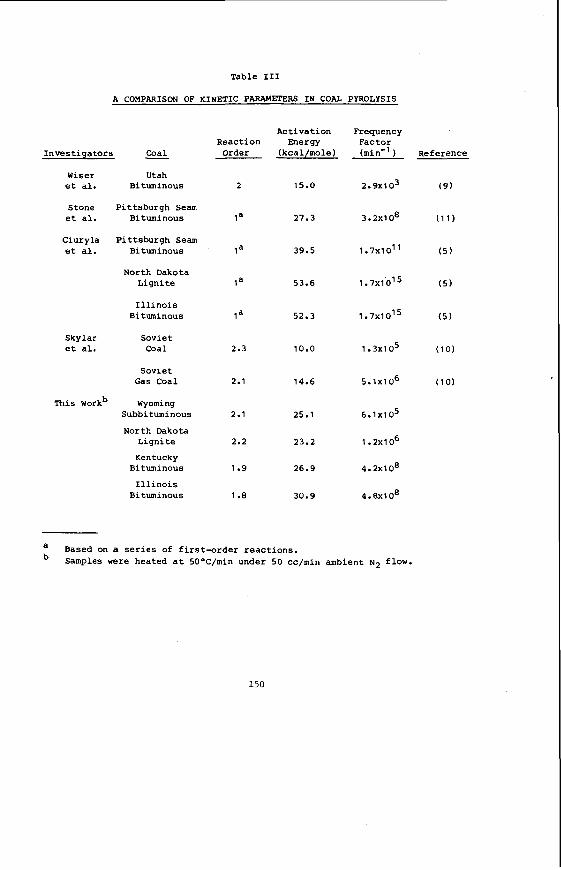
Table I11
A COMPARISON OF KINETIC PARAMETERS I N COAL PYROLYSIS
Act iva t ion Frequency React ion m e r g y Fac tor
I n v e s t i g a t o r s - Coal Order (kcal/rnole) (min-' ) Reference
Wiser Utah e t al. Bituminous 2 15.0 2 . 9 ~ 1 0 ~ ( 9 )
e t a l . Bituminous la 27.3 3.2X1O8 (11)
e t a l . Bituminous l a 39.5 1 . 7 ~ 1 O1 ( 5 )
L i g n i t e l a 53.6 1 . 7 ~ 1 ' 0 ~ ( 5 )
Bituminous l a 52.3 1 . 7 ~ 1 O1 ( 5 )
e t al. Coal 2.3 10.0 1 . 3 ~ 1 0 ~ (10)
G a s Coal 2.1 14.6 5 . 1 ~ 1 0 ~ (10)
Stone P i t t s b u r g h Seam
Ciuryla P i t t s b u r g h Seam
North Dakota
I l l i n o i s
Skylar Sovie t
Sovie t
This workb Wyoming Subbituminous 2.1 25.1 6 . 1 ~ 1 0 ~
North Dakota L i g n i t e 2.2 23.2 1.2x10⁶
Kentucky
I l l i n o i s
Bituminous 1.9 26.9 4.2~10'
Bituminous 1.8 30.9 4 . 8 ~ 1 0 ~
a Based on a s e r i e s of f i r s t - o r d e r r e a c t i o n s . Samples were heated a t 50°C/rnin under 50 cc/min ambient N2 flow.
150
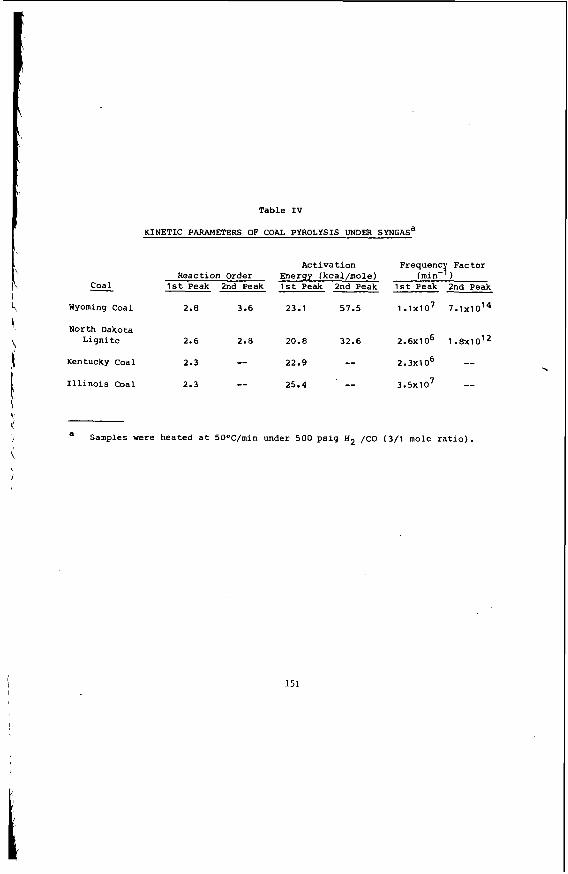
Table I V
KINETIC PARAMETERS OF COAL PYROLYSIS UNDER S Y N G A S ~
Coal - Act iva t ion Frequent Factor
React ion Order Energy (kcal /mole) (min-1) 1 s t Peak 2nd Peak 1st Peak 2nd Peak 1st Peak 2nd Peak ------
Wyoming c o a l 2.8
North Dakota L i g n i t e 2.6
Kentucky Coal 2.3
I l l i n o i s Coal 2.3
23.1 57.5 1 .1x107 7 . 1 ~ 1 0 ~ ~ 3.6
2.8 20.8 32.6 2 . 6 ~ 1 0 ~ 1 . 8 ~ 1 0 ~ ~
-- 22.9 -- 2 . 3 ~ 1 0 ~ -- -- 25.4 -- 3 . 5 ~ 1 0 ~ --
a Samples were heated a t 50°C/min under 500 p s i g H2 /CO (3/1 mole r a t i o ) .
151
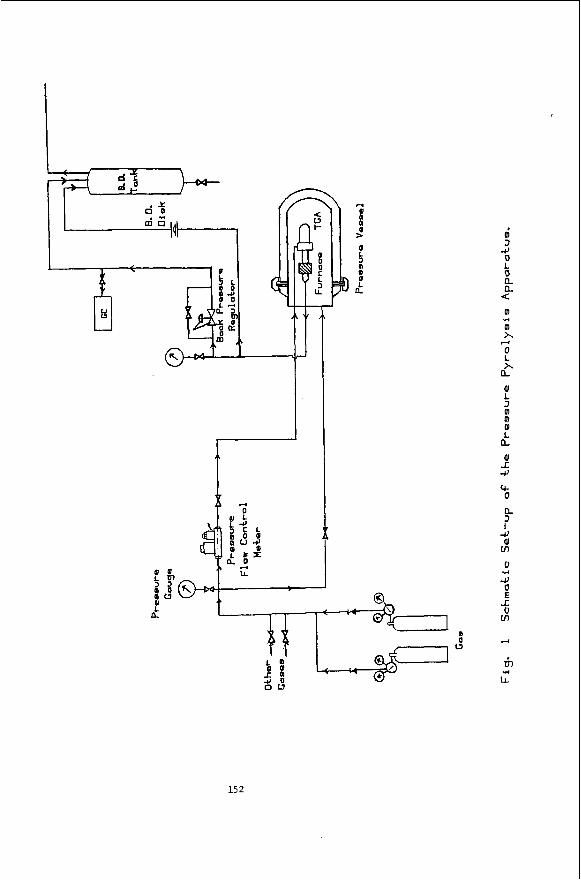
f 8 . l 7 3 mu L
LL
6 3
-0 0 L 0 a a < m m x 0 L x a a I. 3 m m 0 L a ar I -0
4- 0
LL 3 1
-0 a
v)
0
4 0 E I 0 cn
..-I
d
.d
4
rir .PI LL
15 2

I
Saoondory
Peak JHdropypo I yeie
- - d
/
Fig. 2 Typicol Pressure TGA Thermograms o f Wyoming Coal Heoted ot 5O0C/min ond 500 psi9 H2.
153
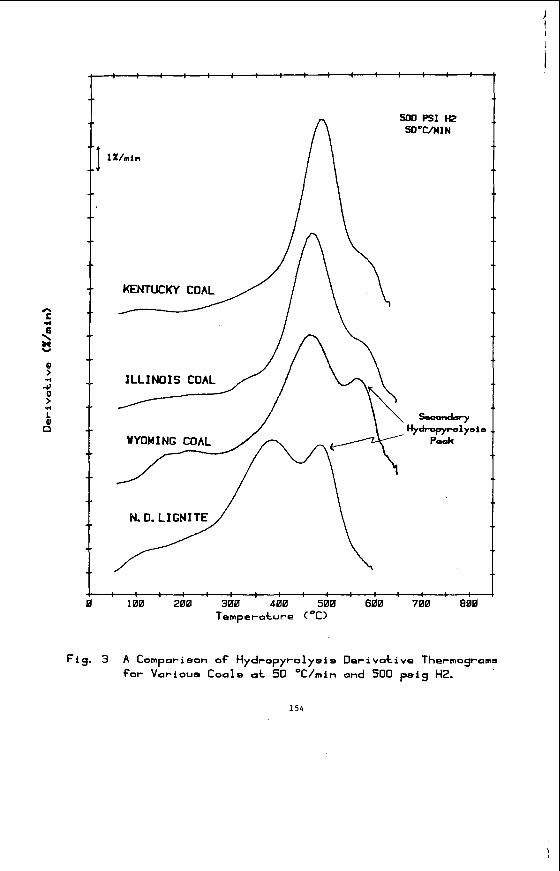
500 PSI H2 50°C/LIIN
4 : : : : : : : : : : : : : : : : 0 100 200 300 400 500 600 700 a00
Temperature <OC>
Fig. 3 A Comparison o f Hydropyrolysis Oerivakive Thermograms for Varioua Coals at 50 OC/rnin and 500 psi9 H2.
154
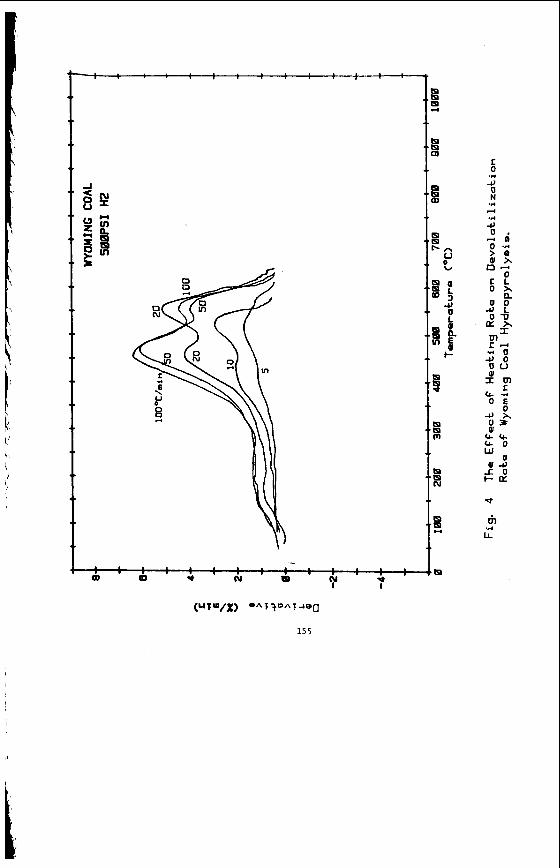
i - N * I I
* N 8
155
I
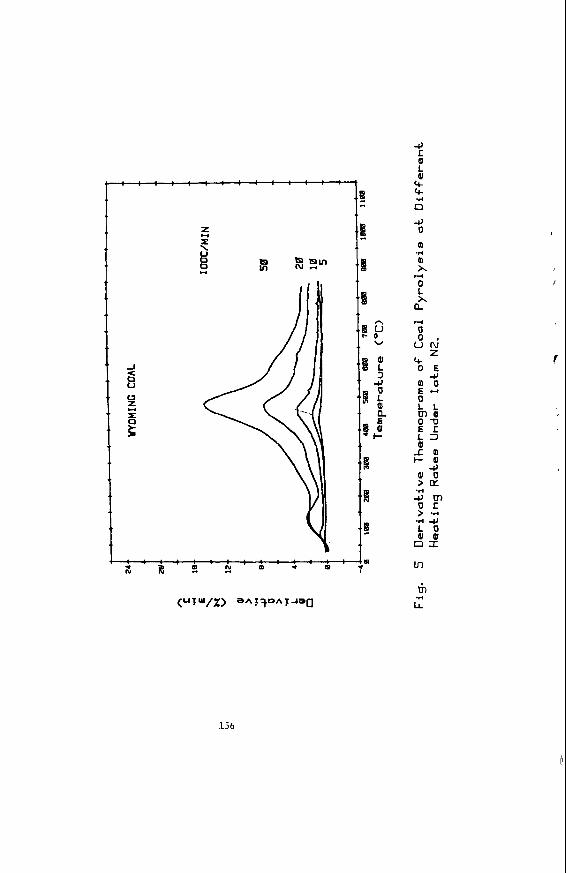
e : : : : : : : : : : : : : : +
4 I: or L e 4 4 ..-I
n 4 U
m m x 0 L x a
U 0
re
.r(
H
H
uni z O E
4
: 2 U L L mor O P E T 1 2 or
1 1 m i - d l
4 o r u > E
- o m u s > *d ** 4 L U o r e a x
Ln
..-I
6 ..-I
LL
I
/
156
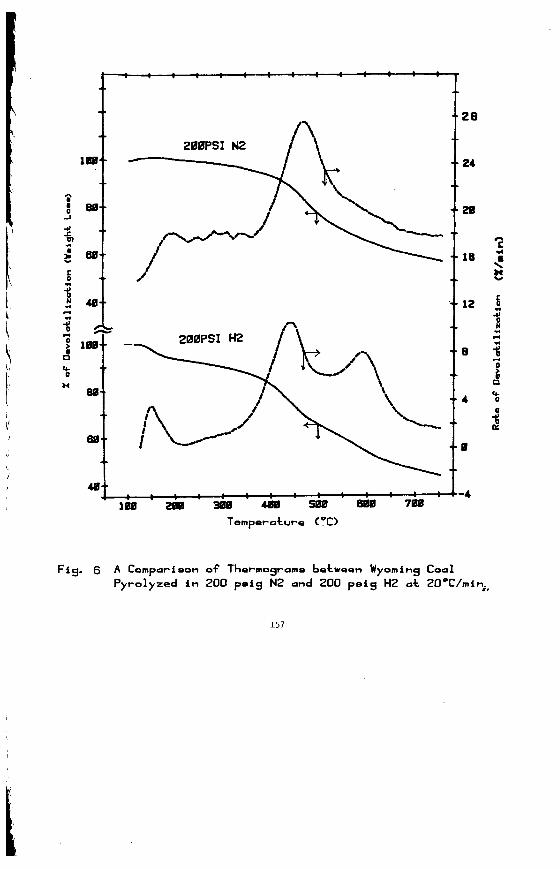
\
/
I
100
: 4-4 4a
l r n 8 2 8 8 3 8 8 4 8 8 5 8 8 7 7 8 8 Temperature <oC)
Fig. 6 A Comparison o f Thermograms between Wyoming C o a l Pyrolyzed in 200 pmig N2 and 200 p e i g H2 a t 20°C/min;,
157
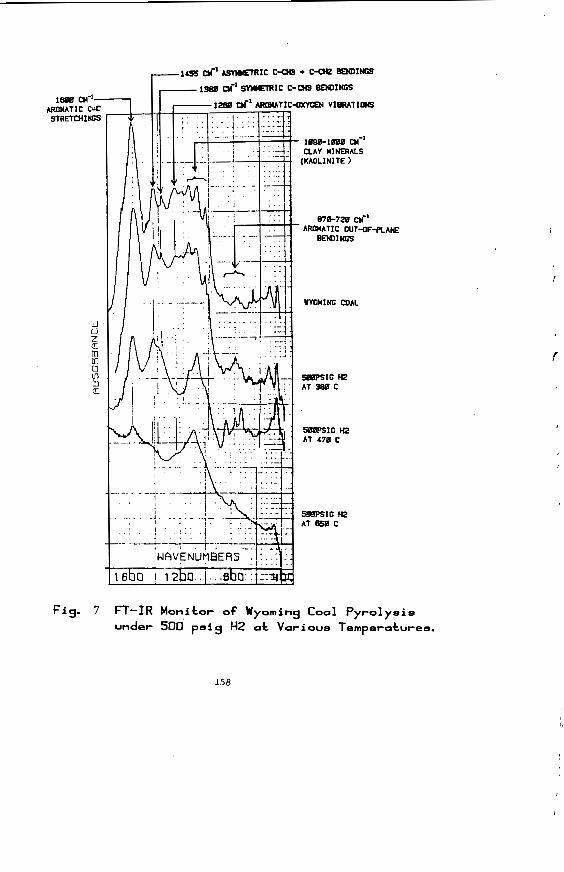
I
Fig. 7 FT-IR Monitor o f Wyoming Cool Pyrolysis under 500 p a i g H2 at Various Temperatures.
158
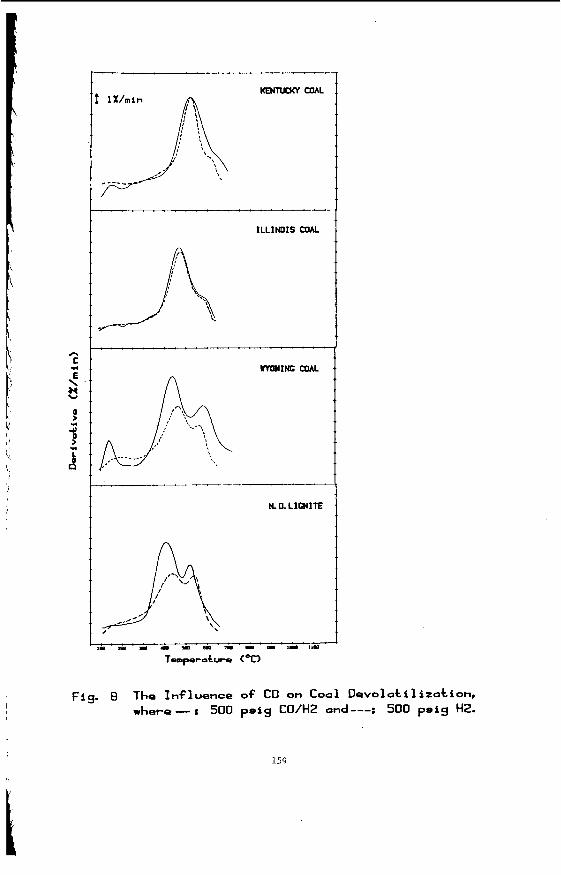
1
ILLINOIS mAL
Fig. 8 The Influence o f CO on Coal Devolatilizotiom, where - : 500 psi9 CO/H2 and---: 500 psig H2.
159
COMBUSTION REACTIVITY OF LOW RANK COAL CHARS
B.C. YOUNG
CSIRO Divis ion of F o s s i l Fue ls , PO Box 136, North Ryde, NSW 2113, A u s t r a l i a
In t roduct ion
For many y e a r s t h e CSIRO has been involved i n s t u d i e s on t h e combustion k i n e t i c s of c o a l chars and r e l a t e d m a t e r i a l s . Ear ly work inc luded s t u d i e s on a char produced from a V i c t o r i a n brown c o a l (1). More r e c e n t l y , t h e combustion k i n e t i c s of c h a r s produced dur ing t h e f l a s h p y r o l y s i s of sub-bituminous c o a l s have been determined (2,3).
I In t h i s paper d a t a are g iven f o r t h e combustion r e a c t i v i t i e s of f o u r f l a s h
pyro lys i s chars . Thei r r e a c t i v i t i e s are compared wi th t h e r e s u l t s f o r chars produced from low and high rank c o a l s , and petroleum coke. R e a c t i v i t y is expressed as t h e r a t e of combustion of carbon p e r u n i t e x t e r n a l s u r f a c e a r e a of t h e p a r t i c l e , wi th due c o r r e c t i o n being made f o r t h e e f f e c t of t h e mass t r a n s f e r of oxygen t o the p a r t i c l e .
Experiment and Theory
D e t a i l s of t h e method of producing t h e f l a s h p y r o l y s i s chars are a v a i l a b l e e lsewhere (4), as is informat ion on t h e procedure f o r measuring t h e i r combustion r a t e s (2 ,3 ,5 ) . In b r i e f , pu lver ized Millmerran and Wandoan c o a l s (Queensland, A u s t r a l i a ) were f l a s h pyrolysed a t var ious temperatures between 500 and 800'C. The r e s u l t i n g c h a r s were screened t o y i e l d a s i z e f r a c t i o n having a median mass s i z e around 80 mu. The p r o p e r t i e s of t h e c h a r s are presented i n Table 1.
TABLE 1 P r o p e r t i e s of t h e Chars
M i l l m e r ran Wandoan
P y r o l y s i s temperature , 'C 540 585 610 780 800 550 Median mass s i z e , wn 85 76 90 70 88 76 Size below which 90%
of m a t e r i a l l ies, um 100 95 118 92 98 96 Size below which 10%
of m a t e r i a l l i es , um 66 52 61 47 74 49 P a r t i c l e d e n s i t y , g/cm3 0.88 0.80 0.78 0.99 0.78 1.05 Chemical a n a l y s i s , X w/w ( a s rece ived)
Moisture 2.7 2.2 3.3 2.5 4.7 2.9 Ash 28.0 30.4 35.6 60.1 38.2 22.1
C 56.6 55.3 50.7 31.3 50.3 60.3 n 3.8 2.8 2.7 1.1 1.3 3.3 N + S + O 8.9 9.3 7.7 5.0 5.5 11.4
Elemental composi t ion
Rate measurements suspensions of p a r t i c l e s gas composition and gas burned per u n i t e x t e r n a l
were c a r r i e d o u t , u s i n g an entrainment r e a c t o r , on flowing i n prehea ted oxygenl l ' i t rogen. From progress ive changes i n
and w a l l t empera tures a long t h e r e a c t o r , t h e rate of carbon area of p a r t i c l e ( P ) was c a l c u l a t e d .
From P , t h e chemical r a t e c o e f f i c i e n t , Rc, was eva lua ted (6):
IJ = Rc [P, (1 - XI]" g/cm2s (1) 160
where p i s t h e p a r t i a l p r e s s u r e of oxygen i n t h e bulk g a s , n i s t h e o r d e r of r e a c t i d i n r e l a t i o n t o p and A is t h e r a t i o of P t o t h e maximum p o s s i b l e (i.e. mass t r a n s f e r l i m i t e d ) b u r i i n g ra te c a l c u l a t e d from known p h y s i c a l p r o p e r t i e s (6 ,7) .
mi s TP - Rc, a s w i l l be shown, i s s t r o n g l y dependent on p a r t i c l e tempera ture , temperature i s c a l c u l a t e d from a h e a t ba lance over t h e burning p a r t i c l e ( 6 ) .
Resul t s and Discussion
I
Combustion r a t e d a t a f o r Millmerran and Wandoan c h a r s a r e shown i n Arrhenius form i n Fig. 1. Data f o r Millmerran c h a r s produced a t 585 and 610°C were combined i n t o a s i n g l e se t , as were t h e d a t a f o r t h e c h a r s produced a t 780 and 800'C. Rate d a t a f o r o t h e r c h a r s (der ived from low and h igh rank c o a l s ) and a l s o f o r petroleum coke a r e a l s o included i n Fig. 1. To permit t h e comparison of r e s u l t s f o r d i f f e r e n t mater ia l s e x h i b i t i n g d i f f e r e n t va lues of n , t h e r a t e d a t a were c a l c u l a t e d from t h e r e l a t i o n :
Pc = Rc pgn g/crnZs
where p i s taken as 1 a t m . Values of t h e Arrhenius parameters , A (pre-exponent ia l f a c t o r ) g a n d E ( a c t i v a t i o n e n e r g y ) , t o g e t h e r wi th t h e magnitude of n f o r each m a t e r i a l r e f e r r e d t o i n Fig. 1 are l i s t e d i n Table 2.
TABLE 2 Kine t ic Data f o r t h e Combustion of Chars and Coke
\ Mater ia l A E n Reference g / k m 2 s (atm 021nJ kcal lmol
Millmerran char (54OOC) Millmerran char (585 and 610'C)
Wandoan char (550'C) Yallourn brown c o a l char New Zealand bituminous c o a l char Anthrac i tes and semi-anthrac i tes
I Millmerran char (780 and 800°C)
,
I Petroleum coke
15.6 22.3 73.3 39.1
9.3 8
20.4 7.0
17.5 18.8 21.7 18.3 16.2 16.0 19.0 19.7
0.5 2 0.5 3 0.5 3 0.5 3 0.5 1 1.0 7 1.0 8 0.5 5
The d a t a e x h i b i t s e v e r a l n o t a b l e f e a t u r e s :
(1) The combustion rates of a l l t h e m a t e r i a l s show a s t r o n g dependence on temperature , t h e va lues of t h e a c t i v a t i o n e n e r g i e s ranging from 16.0 t o 21.7 kcallmol.
(2) The a c t i v a t i o n energy i n c r e a s e s and t h e r e a c t i v i t y of Millmerran c h a r s decreases with i n c r e a s i n g p y r o l y s i s temperature .
(3) The most r e a c t i v e char is t h a t produced from Wandoan c o a l a t 55OOC. This m a t e r i a l i s about twice a s r e a c t i v e a s c h a r s produced from o t h e r low rank c o a l s (Millmerran and Yallourn) and high rank c o a l s (New Zealand bi tuminous, a n t h r a c i t e s and semi-anthrac i tes ) , and about t e n times a s r e a c t i v e as petroleum coke.
(4) The low rank c o a l c h a r s and petroleum coke show a n o r d e r of r e a c t i o n of 0.5. Earlier de termina t ions on c h a r s from high rank c o a l s i n d i c a t e a va lue of un i ty . However, a r e a n a l y s i s (5) of an e a r l i e r set of d a t a (9) showed, i n t h e case cons idered , l i t t l e t o choose between n e q u a l t o 0.5 o r 1.0.
161
The values of t h e a c t i v a t i o n energy f o r t h e Millmerran and Wandoan chars ( - 20 kcal /mol) , t o g e t h e r wi th those of t h e o t h e r m a t e r i a l s l i s t e d i n Table 2 , imply r e a c t i o n s under c i rcumstances where pore d i f f u s i o n a s w e l l a s chemical r e a c t i o n e x e r c i s e s s t rong r a t e c o n t r o l , i.e. regime I1 (10) condi t ions apply. Confirmatory evidence t h a t these m a t e r i a l s are indeed burning under regime 11 condi t ions i s provided by t h e s teady decrease in p a r t i c l e s i z e and s l i g h t reduct ion i n t h e p a r t i c l e d e n s i t y of the p a r t i c l e s as they burn away ( 6 ) . This behaviour i s i l l u s t r a t e d i n Fig. 2 by t h e d a t a on t h e lowest temperature c h a r s produced from Millmerran and Wandoan coal . Also shown a r e some t h e o r e t i c a l curves i n d i c a t i n g t h e changes i n p a r t i c l e s i z e and d e n s i t y t o be expected f o r combustion a t c o n s t a n t p a r t i c l e d e n s i t y o r a t cons tan t p a r t i c l e s i z e (6) .
Conclusions
It has been shown t h a t t h e r e a c t i v i t i e s t o oxygen of chars produced from Millmerran sub-bituminous c o a l decrease wi th i n c r e a s i n g p y r o l y s i s temperature but a r e s i m i l a r i n magnitude t o t h e r e a c t i v i t i e s of chars der ived from a brown and a bituminous c o a l and t o t h e r e a c t i v i t i e s of a n t h r a c i t e s and semi-anthrac i tes . However, Wandoan c h a r , a l s o of sub-bituminous o r i g i n , e x h i b i t s about twice the r e a c t i v i t y of Millmerran char and about ten times t h e r e a c t i v i t y of petroleum coke. On the b a s i s of observed a c t i v a t i o n energy v a l u e s , p a r t i c l e s i z e and p a r t i c l e d e n s i t y behaviour i t is concluded t h a t t h e combustion rates of Millmerran and Wandoan chars are c o n t r o l l e d by t h e combined e f f e c t s of pore d i f f u s i o n and chemical r e a c t i o n .
Acknowledgements
The au thor is g r a t e f u l t o R.J . Hamor f o r car ry ing o u t t h e experimental measurements and t o I.W. Smith f o r va luable d iscuss ions .
References
1. Hamor, R . J . , Smith, I . W . and T y l e r , R.J. Combustion and Flame, 11, 153-162 (1973).
2.
3.
4. 5 .
6.
7. 8. 9. 10.
. . Young, B.C. Proceedings of t h e I n t e r n a t i o n a l Coal Science Conference, G s s e l d o r f : Verlag Gluckauf, & s e n , pp. 260-265, 1981. Hamor, R.J. and Young, B.C. Proceedings of t h e I n t e r n a t i o n a l Science Conference, P i t t s b u r g h , i n p r e s s (1983). Edwards, J.H., Smith, I . W . and T y l e r , R.J . Fue l , 2, 681-686 (1980). Young, B.C. and Smith, I . W . E ighteenth Symposium ( I n t e r n a t i o n a l ) on Combustion, The Combustion I n s t i t u t e , P i t t s b u r g h , pp. 1249-1255 (1981). Smith, I . W . Nineteenth Symposium ( I n t e r n a t i o n a l ) on Combustion, The Combustion I n s t i t u t e , P i t t s b u r g h , i n p r e s s (1983). Smith, I.W. Combustion and Flame, 17, 303-314 (1971). Smith, I.W. Combustion and Flame, 17, 421-428 (1971). F ie ld , M.A. Combustion and Flame, 13, 237-252 (1969). Mulcahy, M.F.K. and Smith, I.W. Review of Pure and Applied C h e m i s t r y , E , 81-108 (1969).
162
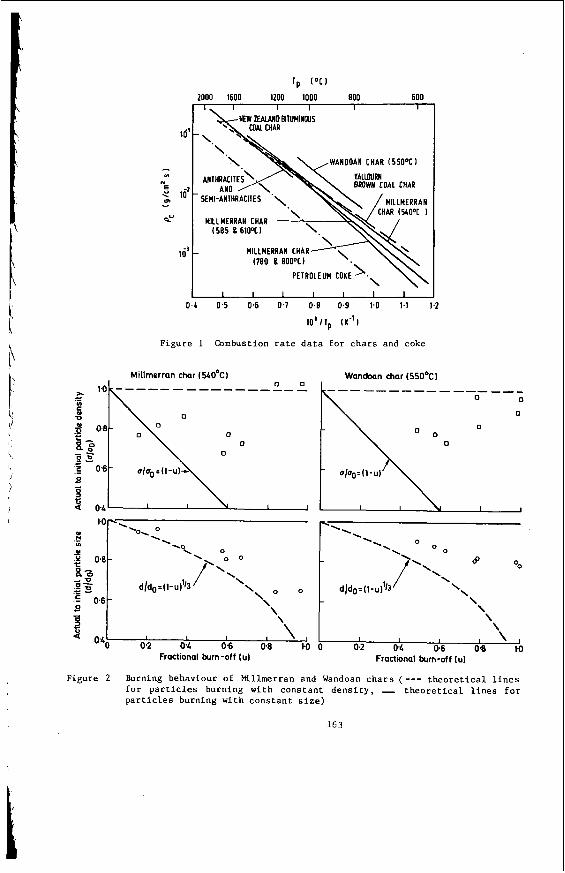
lp I O C I
2000 1600 1200 1000 800 600
WANOOAN CHAR 1550°Cl
4l
UI .- .
3 g-, 0 8 -
- v 3% .- .- 0 6 - s 3
0.4 0.5 0.6 0.7 0.8 0.9 1.0 1.1 1.2
10'llp I K - ' l
Figure 1 Combustion r a t e d a t a f o r chars and coke
lo-, -0. 0 .I--. '. 0
.\.o ' 0 " 0 - 00
I9
\ I'\\ \ i'<, O
\ ' 0 0 dJdg=(l-u)k \
d/do=(l-uf/3 \ \ '\
\ \
\\ , \ , I I I I I I , \ ,
0 0
0
Figure 2 Burning behaviour o f Elillmerran and Wandoan c h a r s (--- t h e o r e t i c a l l i n e s f o r p a r t i c l e s burning w i t h constant d e n s i t y , - t h e o r e t i c a l l i n e s f o r p a r t i c l e s burning with constant s i z e )
163
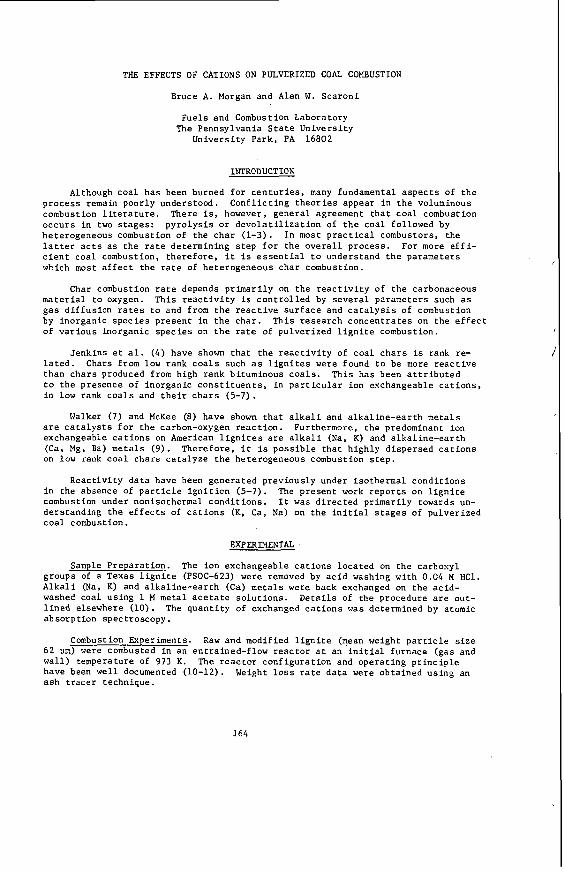
THE EFFECTS OF CATIONS ON PULVERIZED COAL COMBUSTION
Bruce A. Morgan and Alan W. Scaroni
Fuels and Combustion Laboratory The Pennsylvania S t a t e Universi ty
Universi ty Park, PA 16802
INTRODUCTION
Although coa l has been burned f o r c e n t u r i e s , many fundamental a s p e c t s of t h e process remain poorly understood. Conf l ic t ing t h e o r i e s appear i n t h e voluminous combustion l i t e r a t u r e . There is, however, genera l agreement t h a t c o a l combustion occurs i n two s tages : p y r o l y s i s o r d e v o l a t i l i z a t i o n of t h e coa l followed by heterogeneous combustion of the char (1-3). In most p r a c t i c a l combustors, the l a t t e r a c t s as t h e r a t e determining s t e p f o r t h e o v e r a l l p rocess . For more e f f i - c i e n t c o a l combustion, therefore , i t is e s s e n t i a l t o understand t h e parameters which most a f f e c t the r a t e of heterogeneous char combustion.
Char combustion r a t e depends pr imar i ly on the r e a c t i v i t y of the carbonaceous m a t e r i a l t o oxygen. This r e a c t i v i t y i s c o n t r o l l e d by s e v e r a l parameters such as gas d i f fus ion rates t o and from t h e r e a c t i v e s u r f a c e and c a t a l y s i s of combustion by inorganic s p e c i e s present i n t h e char . This research concent ra tes on the e f f e c t of var ious inorganic spec ies on t h e r a t e of pulver ized l i g n i t e combustion.
Jenkins e t a l . ( 4 ) have shown t h a t t h e r e a c t i v i t y of coa l c h a r s is rank re- l a t e d . Chars from low rank c o a l s such as l i g n i t e s were found t o be more r e a c t i v e than c h a r s produced from high rank bituminous c o a l s . This has been a t t r i b u t e d t o t h e presence of inorganic c o n s t i t u e n t s , i n p a r t i c u l a r ion exchangeable c a t i o n s , i n low rank c o a l s and t h e i r c h a r s (5-7).
Walker (7) and McKee (8) have shown t h a t a l k a l i and a l k a l i n e - e a r t h meta ls a r e c a t a l y s t s f o r the carbon-oxygen r e a c t i o n . Furthermore, the predominant ion exchangeable c a t i o n s on American l i g n i t e s a r e a l k a l i (Na, K) and a lka l ine-ear th (Ca, Mg, Ba) metals (9) . Therefore , it is p o s s i b l e t h a t highly d ispersed c a t i o n s on low rank c o a l chars ca ta lyze t h e heterogeneous combustion s t e p .
Reac t iv i ty da ta have been generated previously under isothermal condi t ions The present work r e p o r t s on l i g n i t e i n the absence of p a r t i c l e i g n i t i c n (5-7).
combustion under nonisothermal condi t ions . It w a s d i r e c t e d pr imar i ly towards un- ders tanding t h e e f f e c t s of c a t i o n s (K, Ca, N a ) on t h e i n i t i a l s t a g e s of pulver ized c o a l combustion.
EWERMENTAZ.
Sample Prepara t ion . The ion exchangeable c a t i o n s loca ted on t h e carboxyl groups of a Texas l i g n i t e (PSOC-623) were removed by a c i d washing with 0.04 M HC1. A l k a l i (Na, K) and a l k a l i n e - e a r t h (Ca) meta ls w e r e back exchanged on the ac id- washed coal using 1 M metal a c e t a t e s o l u t i o n s . D e t a i l s of the procedure a r e out- l i n e d elsewhere (10). The q u a n t i t y of exchanged c a t i o n s was determined by atomic absorpt ion spectroscopy.
Combustion Experiments. Raw and modified l i g n i t e (mean weight p a r t i c l e s i z e 6 2 pm) were combusted i n an entrained-f low r e a c t o r a t an i n i t i a l furnace (gas and wal l ) temperature of 973 K. have been w e l l documented (10-12). a s h t r a c e r technique.
The r e a c t o r conf igura t ion and opera t ing p r i n c i p l e Weight l o s s r a t e d a t a were obtained using an
164
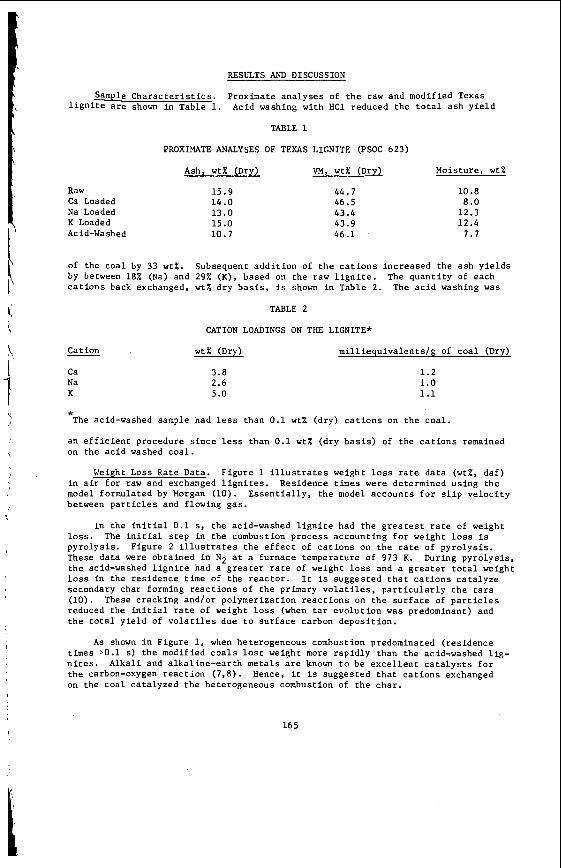
RESULTS AND DISCUSSION
Sample C h a r a c t e r i s t i c s . Proximate ana lyses of t h e raw and modified Texas l i g n i t e a r e shown i n Table 1. Acid washing with H C 1 reduced the t o t a l ash y i e l d
TABLE 1
PROXIMATE ANALYSES OF TEXAS LIGNITE (PSOC 623)
Ash, w t % (Dry) VM, w t % (Dry) Moisture , w t %
Raw 15.9 44.7 10.8 Ca Loaded 14.0 46.5 8 .O Na Loaded 13.0 43.4 12.3 K Loaded 15 .O 43.9 12.4 Ac id-Wa shed 10.7 46.1 7.7
of the coa l by 33 w t % . Subsequent a d d i t i o n of t h e c a t i o n s increased the ash y i e l d s by between 18% (Na) and 29% (K) , based on the raw l i g n i t e . The q u a n t i t y of each c a t i o n s back exchanged, w t % dry b a s i s , is shown i n Table 2. The a c i d washing was
TABLE 2
CATION LOADINGS ON THE LIGNITE*
Cat ion w t % (Dry) m i l l i e q u i v a l e n t s / g of coa l (Dry)
Ca Na K
3.8 2.6 5.0
1.2 1.0 1.1
* The acid-washed sample had less than 0.1 w t % (dry) c a t i o n s on t h e c o a l .
an e f f i c i e n t procedure s i n c e less than 0.1 w t % (dry b a s i s ) of t h e c a t i o n s remained on the a c i d washed coa l .
Weight Loss Rate Data. F igure 1 i l l u s t r a t e s weight loss r a t e da ta (wt%, daf ) i n a i r f o r raw and exchanged l i g n i t e s . model formulated by Morgan (10). E s s e n t i a l l y , the model accounts f o r s l i p v e l o c i t y between p a r t i c l e s and flowing gas .
Residence times were determined using the
In the i n i t i a l 0 .1 s, the acid-washed l i g n i t e had t h e g r e a t e s t r a t e of weight l o s s . The i n i t i a l s t e p i n the combustion process account ing f o r weight l o s s is pyro lys is . These da ta were obtained i n N 2 a t a furnace temperature of 973 K. During pyro lys i s , t h e acid-washed l i g n i t e had a g r e a t e r r a t e of weight l o s s and a g r e a t e r t o t a l weight loss in the residence time of the r e a c t o r . It is suggested t h a t c a t i o n s ca ta lyze secondary char forming r e a c t i o n s of t h e primary v o l a t i l e s , p a r t i c u l a r l y t h e t a r s (10). These cracking and/or polymerizat ion r e a c t i o n s on t h e sur face of p a r t i c l e s reduced the i n i t i a l r a t e of weight loss (when t a r evolu t ion was predominant) and t h e t o t a l y i e l d of v o l a t i l e s due t o sur face carbon depos i t ion .
Figure 2 i l l u s t r a t e s t h e e f f e c t of c a t i o n s on the r a t e of pyro lys i s .
As shown i n Figure 1, when heterogeneous combustion predominated ( res idence times >0.1 s) the modified c o a l s l o s t weight more r a p i d l y than the acid-washed l i g - n i t e s . Alka l i and a lka l ine-ear th meta ls a r e known t o be e x c e l l e n t c a t a l y s t s f o r the carbon-oxygen r e a c t i o n (7 ,8 ) . Hence, i t i s suggested t h a t c a t i o n s exchanged on the coa l ca ta lyzed t h e heterogeneous combustion of t h e char .
165
The Na and K loaded l i g n i t e s underwent g r e a t e r t o t a l weight loss (by about 20 wt%) than t h e calcium loaded l i g n i t e i n the t o t a l res idence time of t h e furnace. Isothermal r e a c t i v i t y d a t a have shown t h a t K and Na a r e b e t t e r c a t a l y s t s than Ca f o r the carbon-oxygen r e a c t i o n (5 ,7) . However, the low weight loss by t h e Ca load- ed coa l may be t h e r e s u l t of a combination of two f a c t o r s : c a t a l y s i s of secondary r e a c t i o n s and c a t a l y s i s of the carbon-oxygen r e a c t i o n .
SUMMARY
The e f f e c t of c a t i o n s on t h e combustion behavior of pulver ized l i g n i t e can be divided i n t o t h r e e main a r e a s : the r a t e of weight loss due t o pyro lys i s , t h e t o t a l weight loss due t o p y r o l y s i s and t h e r a t e of heterogeneous char combustion. The presence of c a t i o n s (Na, K, Ca) reduced t h e r a t e of p y r o l y s i s and t h e t o t a l weight loss due t o p y r o l y s i s b u t increased t h e char combustion r a t e .
REFERENCES
1.
2.
3.
4 .
5.
6.
7.
8.
9.
10.
11.
12.
F i e l d , M . A. , G i l l , D. W . , Morgan. B. E., Hawksley, P. G. W . , Combustion of Pulver ized Coal, The B r i t i s h Coal U t i l i z a t i o n Research Associat ion, Leather- head, 1967.
Smith, 1. W.. Combustion and Flame, 11, 303, 1971.
F i e l d , M. A. , Combustion and Flame, 2, 237, 1970.
Jenkins . R. G., Nandi, S. P. , and Walker, P. L., Jr., Fuel, 52, 288, 1973.
Hippo, E. J. and Walker, P. L . , J r . , Fuel, 2, 245, 1975.
Radovic, L., Ph.D. Thesis , The Pennsylvania S t a t e Univers i ty , 1982.
Walker, P . L., J r . , Fuel , 62, 1 4 0 , 1983.
McKee, D. W . , Fuel , 62, 170, 1983.
Morgan M. E., Jenkins , R. G., and Walker, P. L. , Jr. , Fuel , E, 189, 1981.
Morgan, M. E., Ph.D. Thesis , The Pennsylvania S t a t e Univers i ty , 1983.
Scaroni , A. W., Walker, P. L . , J r . , and Essenhigh, R . H . , Fuel, 60, 71, 1981.
Maloney, D. J . , Ph.D. Thes is , The Pennsylvania S t a t e Universi ty , 1983.
166
0 0.06 0.12 O . I R 0 . 2 h 0 . 3 0
167
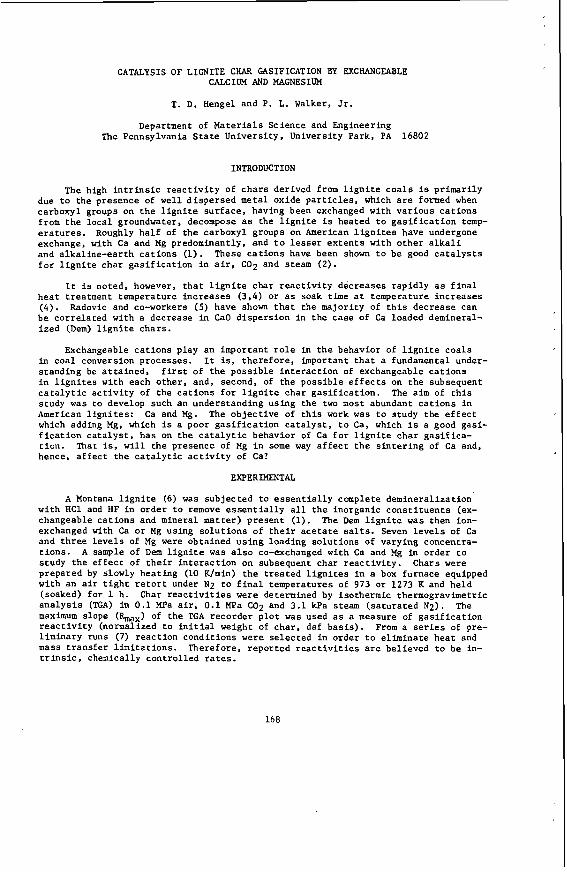
CATALYSIS OF LIGNITE CHAR GASIFICATION BY EXCHANGEABLE CALCIUM AND MAGNESIUM
T. D. Hengel and P. L. Walker, Jr.
Department of M a t e r i a l s Science and Engineering The Pennsylvania S t a t e Univers i ty , Universi ty Park, PA 16802
INTRODUCTION
The high i n t r i n s i c r e a c t i v i t y of c h a r s der ived from l i g n i t e c o a l s is pr imar i ly due t o the presence of w e l l d i s p e r s e d metal oxide p a r t i c l e s , which a r e formed when carboxyl groups on t h e l i g n i t e s u r f a c e , having been exchanged with v a r i o u s c a t i o n s from t h e l o c a l groundwater, decompose as the l i g n i t e is heated t o g a s i f i c a t i o n temp- e r a t u r e s . Roughly h a l f of t h e carboxyl groups on American l i g n i t e s have undergone exchange, w i t h C a and Mg predominantly. and t o lesser e x t e n t s wi th o t h e r a l k a l i and a lka l ine-ear th c a t i o n s (1). f o r l i g n i t e char g a s i f i c a t i o n in air. C02 and steam (2) .
These c a t i o n s have been shown t o be good c a t a l y s t s
It is noted, however, t h a t l i g n i t e char r e a c t i v i t y decreases r a p i d l y a s f i n a l h e a t t reatment temperature i n c r e a s e s (3.4) o r a s soak time a t temperature i n c r e a s e s ( 4 ) . Radovic and co-workers (5) have shown t h a t the major i ty of t h i s decrease can be c o r r e l a t e d with a decrease in C a O d i s p e r s i o n in t h e case of Ca loaded demineral- i zed (Dern) l i g n i t e chars .
Exchangeable c a t i o n s p lay an important r o l e in t h e behavior of l i g n i t e c o a l s in c o a l conversion processes . I t is, t h e r e f o r e , important t h a t a fundamental under- s tanding be a t t a i n e d , in l i g n i t e s wi th each o t h e r , and, second, of t h e p o s s i b l e e f f e c t s on t h e subsequent c a t a l y t i c a c t i v i t y of t h e c a t i o n s f o r l i g n i t e char g a s i f i c a t i o n . The aim of t h i s s tudy w a s t o develop such a n understanding using the two most abundant c a t i o n s in American l i g n i t e s : Ca and Mg. The o b j e c t i v e of t h i s work was t o s tudy the e f f e c t which adding Mg, which is a poor g a s i f i c a t i o n c a t a l y s t , t o Ca, which is a good gasi- f i c a t i o n c a t a l y s t , h a s on t h e c a t a l y t i c behavior of C a f o r l i g n i t e char g a s i f i c a - t i o n . That is, w i l l t h e presence of Mg i n some way a f f e c t t h e s i n t e r i n g of C a and, hence, a f f e c t t h e c a t a l y t i c a c t i v i t y of Ca?
f i r s t of t h e p o s s i b l e i n t e r a c t i o n of exchangeable c a t i o n s
EXPERIMENTAL
A Montana l i g n i t e (6) was subjec ted t o e s s e n t i a l l y complete deminera l iza t ion wi th RC1 and HF in order t o remove e s s e n t i a l l y a l l t h e inorganic c o n s t i t u e n t s (ex- changeable c a t i o n s and mineral matter) present (1). The Dem l i g n i t e was then ion- exchanged with Ca o r Mg using s o l u t i o n s of t h e i r a c e t a t e salts. Seven l e v e l s of Ca and t h r e e l e v e l s of Mg were obta ined u s i n g loading s o l u t i o n s of varying concentra- t i o n s . s tudy t h e e f f e c t of t h e i r i n t e r a c t i o n on subsequent char r e a c t i v i t y . prepared by slowly hea t ing (10 K / m i n ) t h e t r e a t e d lignites in a box furnace equipped with a n a i r t i g h t r e t o r t under N2 t o f i n a l temperatures of 973 o r 1273 K and he ld (soaked) f o r 1 h. Char r e a c t i v i t i e s were determined by isothermic thermogravimetric a n a l y s i s (TGA) in 0 . 1 MF'a a i r , 0 . 1 MPa COP and 3.1 kPa steam ( s a t u r a t e d Nz). The maximum slope ( b x ) of t h e TGA recorder p l o t was used a s a measure of g a s i f i c a t i o n r e a c t i v i t y (normalized t o i n i t i a l weight of char , daf b a s i s ) . From a series of pre- l iminary runs (7) reac t ion condi t ions were s e l e c t e d i n order t o e l imina te h e a t and mass t r a n s f e r l i m i t a t i o n s . t r i n s i c , chemically cont ro l led rates.
A sample of Dern l i g n i t e was a l s o co-exchanged with Ca and Mg in order t o Chars were
Therefore , repor ted r e a c t i v i t i e s are be l ieved t o be in-
168

Selected c h a r s were examined by x-ray d i f f r a c t i o n (XRD) t o i d e n t i f y Ca and Mg containing spec ies present in t h e chars . Species were determined using t h e line broadening concept and t h e Scherer equat ion
Average c r y s t a l l i t e diameters of s e l e c t e d
( 8 )
RESULTS AtTD DISCUSSION
Figures 1 and 2 show the r e a c t i v i t y r e s u l t s in 0.1 MPa a i r f o r t h e 973 and 1273 K chars , respec t ive ly . f i c a t i o n in air. while Mg is a poor c h a r g a s i f i c a t i o n c a t a l y s t ( 2 ) . For Ca loaded c h a r s a t both h e a t t reatment temperatures , i t is seen t h a t two d i s t i n c t reg ions of r e a c t i v i t y behavior a r e present . For loadings up t o -4 wtX Ca , t h e r e a c t i v i t y in- creases l i n e a r l y with increas ing C a conten t . For loadings g r e a t e r than -4 w t X Ca, however, r e a c t i v i t y remains e s s e n t i a l l y cons tan t with increas ing Ca conten t . This i s cont rary t o the behavior seen by Hippo e t a l . ( 9 ) . , who repor ted a l i n e a r in- crease in r e a c t i v i t y wi th increas ing C a conten t up t o a Texas l i g n i t e . Since mass t r a n s p o r t l i m i t a t i o n s a r e be l ieved t o be absent , the p la teau i s not due t o d i f f u s i o n a l e f f e c t s . This sugges ts t h a t t h e p l a t e a u is t h e r e s u l t of a c a t a l y s t " s a t u r a t i o n e f f e c t , " t h a t is, adding of c a t a l y s t beyond a cer- t a i n amount does not f u r t h e r increase t h e observed rate. range of Mg c o n t e n t s a similar s a t u r a t i o n e f f e c t appears t o be operat ing. Examina- t i o n of the c a t i o n exchanged 1273 K c h a r s by XRD revea led t h a t CaO and MgO were t h e major spec ies present in t h e Dem+Ca and DemkMg chars , r e s p e c t i v e l y .
A s seen previous ly , C a is a good c a t a l y s t f o r char gasl-
1 2 . 9 w t % in 0 .1 MPa steam f o r
For t h e r e l a t i v e l y small
Reac t iv i ty r e s u l t s f o r t h e 1273 K c h a r s reached in 0.1 MPa C02 and 3.1 kPa steam a t 1053 K are shown in Figures 3 and 4 . r e s p e c t i v e l y . The same t rends evident f o r the 1273 K c h a r s reac ted in 0.1 MPa a i r a r e a l s o seen in these r e a c t a n t gases . Two reg ions of r e a c t i v i t y behavior a r e present in both cases . Calcium is seen t o be a good char g a s i f i c a t i o n c a t a l y s t , whi le Mg h a s very l i t t l e c a t a l y t i c e f f e c t .
The purpose of t h i s work was t o s tudy t h e e f f e c t t h a t adding Mg t o Ca h a s on t h e subsequent c a t a l y t i c behavior of Ca f o r l i g n i t e c h a r g a s i f i c a t i o n . To s tudy t h i s e f f e c t , t h e c h a r s of the co-exchanged Dem l i g n i t e were used. It w a s reasoned t h a t the co-exchanged chars should have a Ca content which was in t h e region where r e a c t i v i t y increased with metal conten t , a s t o avoid t h e s a t u r a t i o n reg ion . Also, t h e char should conta in more Mg than C a on a molar b a s i s , s i n c e an e f f e c t is more l i k e l y t o be observed under these condi t ions . Metal c o n t e n t s of the co-exchanged c h a r s a r e presented in Table 1.
TABLE 1
METAL CONTENTS I N THE CO-EXCHANGED CHARS (DRY BASIS)
Calcium Magnesium w t X - mol/g - W t x ormol/g Char -
973 K 1273 K
0.54 0.56
2 . 2 2 . 2
0.91 0 . 9 4
2 . 2 2 . 3
To determine i f t h e r e was any e f f e c t , r e a c t i v i t y d a t a of t h e mono-exchanged c h a r s were used t o c a l c u l a t e an expected r e a c t i v i t y . Calcu la t ion of these expected r e a c t i v i t i e s w a s s t r a i g h t forward, which assumed t h a t t h e c a t a l y t i c a c t i v i t i e s of Ca and Mg were simply a d d i t i v e . From the metal c o n t e n t s i n Table 1, the contr ibu- t i o n s of Ca and Mg t o t h e c a l c u l a t e d r e a c t i v i t i e s could be determined from Figures 1-4 by reading the r e a c t i v i t y va lue corresponding t o t h a t amount of Ca o r Mg d i r e c t - l y from the appropr ia te f igure . The r e a c t i v i t y of the Dem-char is subt rac ted once because i t is included in both t h e Ca and Mg c o n t r i b u t i o n s , while i t is included only once i n the co-exchanged char . This s t e p is not necessary when t h e r a t e of t h e uncatalyzed (Dem) r e a c t i o n is low; but is necessary when t h e uncatalyzed r a t e is high, as is the case in C02 (Figure 3). For cons is tency , t h e Dem r e a c t i v i t y
169
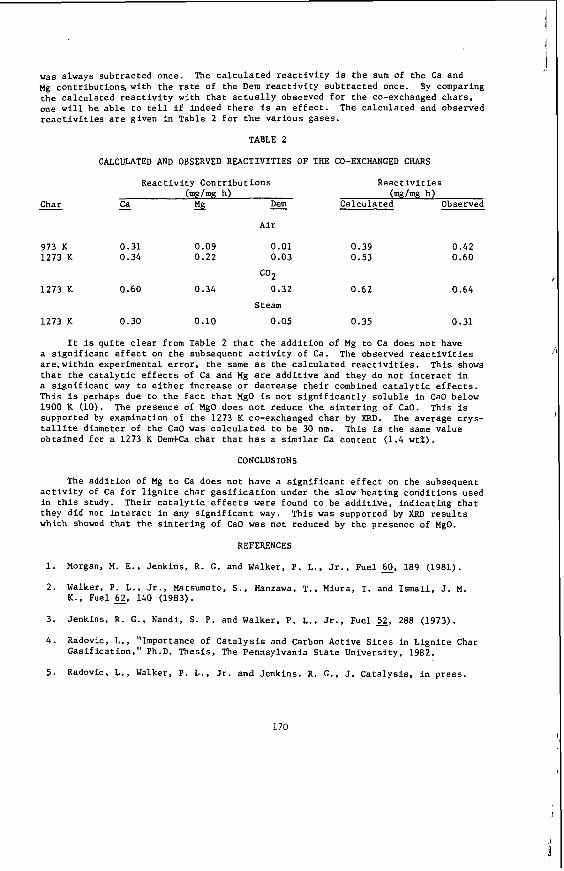
was always subt rac ted once. Mg contr ibut ions,with t h e r a t e of the D e m r e a c t i v i t y subt rac ted once. By comparing the Calculated r e a c t i v i t y with t h a t a c t u a l l y observed f o r t h e co-exchanged chars , one w i l l be a b l e t o te l l i f indeed t h e r e is an e f f e c t . The ca lcu la ted and observed r e a c t i v i t i e s are given in Table 2 f o r the var ious gases .
The c a l c u l a t e d r e a c t i v i t y is t h e sum of the Ca and
TABLE 2
CALCULATED AND OBSERVED REACTIVITIES OF THE CO-EXCHANGED CHARS
R e a c t i v i t y Cont r ibu t ions R e a c t i v i t i e s (me/mg h) (mg/mg h )
Char - Ca % - Dem Calculated Observed
A i r
973 K 0.31 0.09 0.01 0.39 0.42 1273 K 0.34 0.22 0.03 0.53 0.60
co2 1273 K 0.60 0.34 0.32 0.62 0.64
S t eam
1273 K 0.30 0.10 0.05 0.35 0.31
It is q u i t e c l e a r from Table 2 t h a t the a d d i t i o n of Mg t o Ca does not have a s i g n i f i c a n t e f f e c t on t h e subsequent a c t i v i t y of Ca. The observed r e a c t i v i t i e s a r e , w i t h i n experimental e r r o r , t h e same as the c a l c u l a t e d r e a c t i v i t i e s . This shows t h a t t h e c a t a l y t i c e f f e c t s of Ca and Mg are a d d i t i v e and they do not i n t e r a c t i n a s i g n i f i c a n t way t o e i t h e r increase or decrease t h e i r combined c a t a l y t i c e f f e c t s . This i s perhaps due t o t h e f a c t t h a t MgO is n o t s i g n i f i c a n t l y so luble i n CaO below 1900 K (10). supported by examination of t h e 1273 K co-exchanged char by XRD. t a l l i t e diameter of the C a O was c a l c u l a t e d t o be 30 nm. This i s t h e same value obtained f o r a 1273 K Demi-Ca char t h a t h a s a s i m i l a r Ca content (1.4 w t X ) .
The presence of MgO does n o t reduce the s i n t e r i n g of CaO. This is The average crys-
CONCLUSIONS
The addi t ion of Mg t o Ca does not have a s i g n i f i c a n t e f f e c t on t h e subsequent a c t i v i t y of Ca f o r l i g n i t e char g a s i f i c a t i o n under t h e slow hea t ing condi t ions used i n t h i s study. Their c a t a l y t i c e f f e c t s w e r e found t o be a d d i t i v e , i n d i c a t i n g t h a t they d i d not i n t e r a c t i n any s i g n i f i c a n t way. which showed t h a t t h e s i n t e r i n g of CaO was not reduced by t h e presence of MgO.
This w a s supported by XRD r e s u l t s
REFERENCES
Morgan, M . E. , Jenkins , R. G. and Walker, P. L.. Jr., F u e l g , 189 (1981). 1.
2. Walker, P. L., J r . , Matsumoto, S . , Hanzawa. T., Miura, T. and Ismail, J . M . K. . Fuel 62, 140 (1983).
3. Jenkins , R. G., Nandi, S. P. and Walker, P. L., Jr . , F u e l x , 288 (1973).
4. Radovic, L., "Importance of C a t a l y s i s and Carbon Act ive S i t e s i n L i g n i t e Char Gas i f ica t ion ," Ph.D. Thesis , The Pennsylvania S t a t e Universi ty , 1982.
5. Radovic, L., Walker, P. L.. Jr. and Jenkins . R. G . , J. C a t a l y s i s , i n press .
170
6. Penn State/DOE Coal Data Base, PSOC 833, Coal Research Sec t ion , The Pennsyl- vania S t a t e Univers i ty .
7. Hengel, T., "Cata lys i s of L i g n i t e Char G a s i f i c a t i o n by Exchangeable Cations: Calcium and Magnesium," M.S. Thesis , The Pennsylvania S t a t e Univers i ty , 1983.
8. Klug, H. P. and Alexander, L. E. , "X-ray D i f f r a c t i o n Procedures," 2nd Edi t ion , Wiley, NY, 1974.
9. Hippo, E. J . , Jenkins , R . G. and Walker, P . L., Jr., F u e l s , 338 (1979).
10. Doman, R. C . , Barr, J. B., McNally, R. N . and Alper, A. M.. J . h e r . Cer. SOC. - 46. 313 (1963).
171
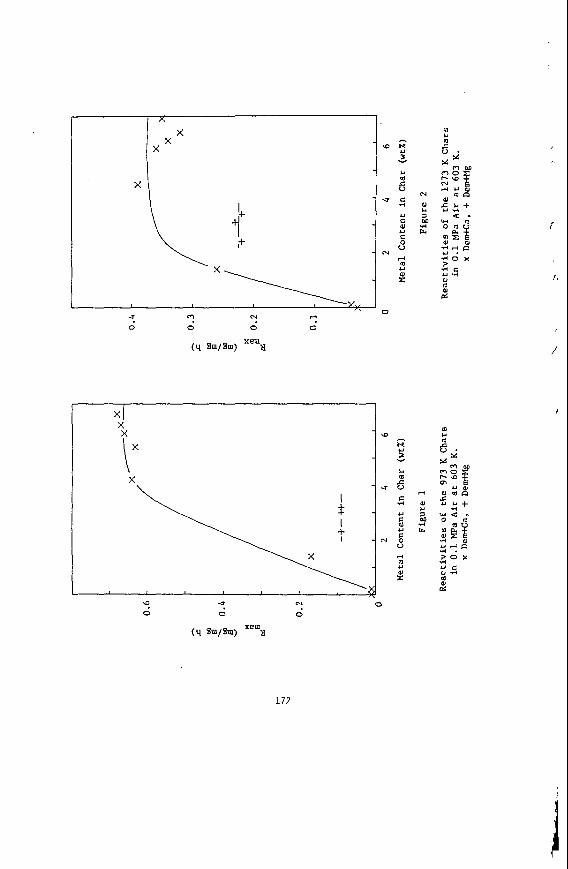
c
u v
H
3
I4 m c 0
c rl
U 5 U I=
V
4 U m r
rn N ,-I
0 0 0 0 -f
172
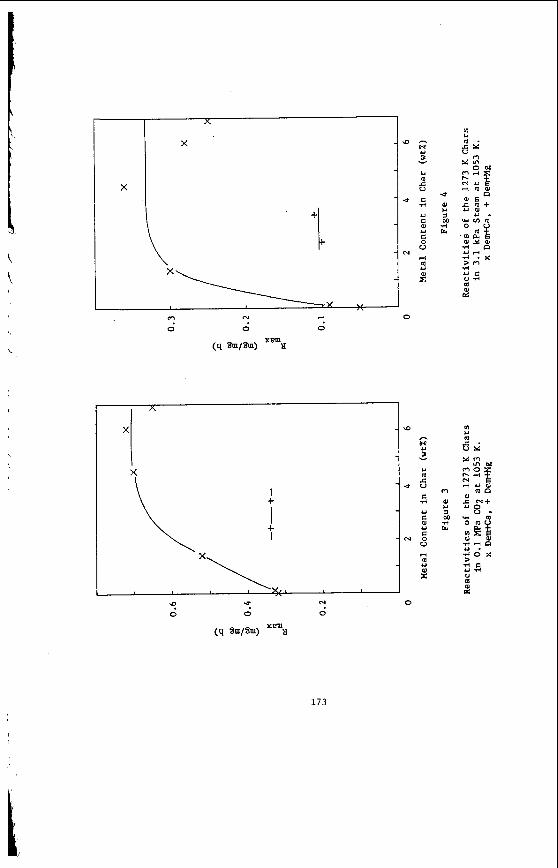
\
0
C d
U
m U
e N O U
0
173
Measurement and P r e d i c t i o n o f Low-Rank Coal S l a g V i s c o s i t y
Robert C . S t r e e t e r , ' E r l e K . D i e h l , z and Harold H . Schobe r t3
Bituminous Coal Resea rch , I n c . , Monroev i l l e , PA 15146 and
Grand Forks Energy Technology C e n t e r , Grand Forks , ND 58202
______---_-I---- ----------
INTRODUCTION _ - - - ~ Since 1980, Bituminous Coat R e s e a r c h , I n c . , (BCR) has been conduc t ing measure-
Th i s ments on the v i s c o s i t y of w e s t e r n U . s. low-rank c o a l s l a g s under a c o n t r a c t w i th t h e Grand Forks Energy Technology Cen te r (GFETC), U:S. Department o f Energy. work has been motivated by t h e r e a l i z a t i o n t h a t I ) v e r y few d a t a e x i s t i n t h e l i t e r - a t u r e on t he v i s c o s i t y of low-rank-coal s l a g s ; 2 ) p u b l i s h e d c o r r e l a t i o n s r e l a t i n g s l a g v i s c o s i t y t o c o a l a sh compos i t ion were d e r i v e d from work with bi tuminous-coal s l a g s , and a t t e m p t s t o a p p l y them t o d a t a from low-rank c o a l s l a g s g e n e r a l l y have been u n s u c c e s s f u l ; and , 3 ) from a p r a c t i c a l s t a n d p o i n t , d a t a on s l a g rheology a r e of c o n s i d e r a b l e i n t e r e s t i n suppor t o f t h e o p e r a t i o n o f a s t a g g i n g fixed-bed l i g n i t e g a s i f i e r a t GFETC. As a m a t t e r o f r e l a t e d i n t e r e s t , B C R ' s s l a g v i scomete r was o r i g i n a l l y put i n t o o p e r a t i o n i n 1976 t o o b t a i n d a t a on t h e s t a g g i n g p r o p e r t i e s of c o a l s intended fo r use i n t h e BI-GAS c o a l g a s i f i c a t i o n p i l o t p l a n t a t Homer C i t y , Pennsy lvan ia ; t h e BI-GAS p r o c e s s i n c o r p o r a t e s an en t r a ined -bed , s l a g g i n g g a s i f i e r .
F
/
/I Although t h e d a t a ob ra ined i n t h e s e s t u d i e s have been v a l u a b l e i n i n t e r p r e t i n g
t h e s t a g g i n g phenomena observed i n t h e Grand Forks g a s i f i e r t e s t s , a more fundamen- t a l o b j e c t i v e of t h e c u r r e n t work is t o deve lop c o r r e l a t i o n s t h a t can be used t o p r e d i c t a p r i o r i t h e v i s c o s i t y behav io r o f low-rank-coal s l a g s from a knowledge of t h e a sh or s l a g compos i t ion .
EXPERIMENTAL
The s l a g - v i s c o s i t y a p p a r a t u s was assembled f o r BCR by The ta I n d u s t r i e s , I n c . I t i nc ludes a Lindberg f u r n a c e wi th g l o b a r h e a t i n g e l emen t s of s i l i c o n c a r b i d e , r a t e d fo r o p e r a t i o n a t t e m p e r a t u r e s up t o 2732 F (1500 C ) . The r o t a t i n g bob viscom- e t e r i s a Haake RV-2 Ro tov i sco u n i t with a DMK 50/500 d u a l measuring head , which a l lows adjustment of t o r q u e by a f a c t o r o f 10 ( i . e . , r anges o f 0 t o 50 and 0 t o 500g-cm).* The to rque on t h e v i scomete r bob twists a s p i r a l s p r i n g i n s i d e t h e meas- u r i n g head; t h e angu la r d i sp l acemen t o f t h e s p r i n g is p r o p o r t i o n a l t o s h e a r s t regs , and is converted t o an e l e c t r i c a l s i g n a l t h a t is p l o t t e d on an X-Y r e c o r d e r a s a f u n c t i o n oE t h e r o t a t i o n a l speed of t h e bob ( s h e a r r a t e ) . A mic roprocesso r has been i n c o r p o r a t e d i n t o t h e o r i g i n a l system t o provide au tomat i c t empera tu re programming a t t h e r a t e of about I"F/min, and s t e p w i s e bob r o t a t i o n from 0 t o 64 rpm i n i nc re - ments of 4 rpm.
To s i m u l a t e c o n d i t i o n s e x i s t i n g i n t h e s t a g g i n g c o a l g a s i f i e r , a l l t e s t s a r e c a r r i e d o u t i n a r educ ing atmosphere c o n s i s t i n g o f 2 0 percen t hydrogen and
S u p e r v i s i n g S c i e n t i s t , Bituminous Coal Resea rch , I n c . Manager, Applied Research, Bituminous Coal Resea rch , I n c . P r o j e c t Manager, Coal Sc ience , Grand Forks Energy Technology Cen te r
* Reference t o a company or product name does no t imply endorsement o f t h e product t o the e x c l u s i o n of o t h e r s t h a t may be s u i t a b l e .
1 7 4
80 Percen t n i t r o g e n . The gas mix tu re i s i n j e c t e d i n t o t h e fu rnace at a f low r a t e Of 500 cc/min through an alumina t u b e t h a t ex tends t o w i t h i n 1 i nch o f t h e t o p o f t h e sample c r u c i b l e .
Although a plat inum/rhodium bob was employed i n i t i a l l y , some problems were encountered with a t t a c k on t h e bob by molten i r o n i n t h e s l a g . In a l l o f t h e t e s t s d i scussed h e r e i n , t h e bob was f a b r i c a t e d from 1 /2 - inch molybdenum ba r s t o c k ; t h e bob is approximately I - inch long wi th a 30'-angle t a p e r machined on bo th ends . The top o f t h e bob t e r m i n a t e s i n a 5/8- inch l o n g , 1/4-inch'-diameter s h a f t which is d r i l l e d and tapped to accommodate a 118-inch- d i ame te r x 16.5- inch long molybdenum stem. The bob stem i s covered by a t u b u l a r alumina s l e e v e t o minimize e r o s i o n d u r i n g a t e s t . AS o r i g i n a l l y des igned , t h e v i scomete r i n c o r p o r a t e d a u n i v e r s a l j o i n t i n the measuring head s h a f t and a Jacobs- type chuck t o hold t h e bob s t e m . However, t h i s arrangement a l lowed t o o much l a t e r a L motion of t h e ' b o b i n t h e s l a g , and t h e bob i s now a t t a c h e d t o t h e measuring head by a r i g i d s h a f t c o n t a i n i n g t h r e e set screws t o hold t h e stem. During a v i s c o s i t y t e s t , t h e bob is immersed u n t i l t h e s t a g j u s t cove r s i t s top ; t h e p o s i t i o n o f t h e bob can be determined a c c u r a t e l y us ing a depth gauge a t t a c h e d t o t h e measuring head.
In t h e e a r l i e r t e s t s , t h e s l a g was melted i n c r u c i b l e s o f v i t r e o u s ca rbon , 1-1/4- in . I . D . x 1-318-in. h igh (Atomergic Chemetals Co. ) . The ca rbon sample c r u c i - b l e was con ta ined i n a l a r g e r alumina guard c r u c i b l e (1-718-in. I . D . x 6 - i n . high) and t h e annu la r space between t h e two c r u c i b l e s was packed wi th 60-mesh alundum. The use o f carbon c r u c i b l e s was somewhat i n f luenced by t h e o b s e r v a t i o n t h a t s l a g from t h e g a s i f i e r f r e q u e n t l y con ta ined p a r t i c l e s o f d e v o l a t i l i z e d c o a l ( c h a r ) , which might be involved i n r e a c t i o n s with t h e molten s l a g . It soon became e v i d e n t t h a t i r o n ox ides i n t h e s l a g were being reduced by r e a c t i o n with t h e carbon c r u c i b l e , a s small poo l s of molten i r o n i n v a r i a b l y s e t t l e d from t h e s l a g d u r i n g t h e carbon- c r u c i b l e t e s t s . With c e r t a i n c o a l a shes c o n t a i n i n g compara t ive ly h igh amounts o f F e f l 3 , d e s t r u c t i o n of t h e ca rbon c r u c i b l e was so s e v e r e t h a t t h e p o r t i o n i n c o n t a c t with t h e s l a g v i r t u a l l y d i sappea red d u r i n g t h e v i s c o s i t y t e s t . Consequen t ly , t h e carbon c r u c i b l e s were e v e n t u a l l y r ep laced with h i g h - p u r i t y a lumina c r u c i b l e s (McDanel Ref rac to ry Co.) of t h e same d imens ions .
S ince t h e alumina c r u c i b l e s were put i n t o use , m e t a l l i c i r o n has o n l y r a r e l y been observed i n t h e s l a g ; i f formed a t a l l , t h e i r o n u s u a l l y t e n d s to c l i n g t o t h e t o p of t h e bob a t t h e g a s l l i q u i d i n t e r f a c e . On t h e o t h e r hand, v a r y i n g degrees o f a t t a c k on t h e alumina c r u c i b l e by t h e s l a g have been obse rved . G e n e r a l l y , d i s s o l u - t i o n of A1203 by t h e s l a g has been s l i g h t , but i n a few c a s e s n o t i c e a b l e t h i n n i n g of t h e c r u c i b l e walls has occur red . In a d d i t i o n , with t h e low-form alumina c r u c i b l e s , t h e r e was a tendency f o r t h e s l a g to ove r f low t h e sample c r u c i b l e and s e e p i n t o t h e alundum packing. In a few c a s e s , t h e s l a g managed to s e e p benea th t h e sample c r u c i - b l e , whereupon subsequent o u t g a s s i n g o f t h e s l a g a c t u a l l y r a i s e d and t i l t e d t h e sample c r u c i b l e . To a l l e v i a t e t h i s problem, high-form (3 - in . h i g h ) sample c r u c i b l e s have been employed s i n c e September , 1982.
'
Since m e a s u r e d ' v i s c o s i t i e s w i l l v a r y depending on t h e dimensions o f and t h e m a t e r i a l s employed fo r t h e sample c r u c i b l e and t h e r o t a t i n g bob, measured v a l u e s a r e r e l a t e d t o a b s o l u t e v i s c o s i t i e s by means o f an in s t rumen t f a c t o r . In t h e s e s t u d i e s , t h e in s t rumen t f a c t o r was determined by t e s t s w i th NBS g l a s s v i s c o s i t y s t a n d a r d s whose v i s c o s i t i e s are p r e c i s e l y d e f i n e d and similar t o t h o s e o f t h e s l a g s over t h e t empera tu re r ange o f i n t e r e s t . The in s t rumen t f a c t o r is r e l a t e d to v i s c o s i t y by the e q u a t i o n :
V i s c o s i t y = Ins t rumen t f a c t o r x t o rque r e a d i n g I bob speed (rpm)
I n p r e p a r a t i o n f o r a s l a g - v i s c o s i t y t e s t , t h e c o a l is pu lve r i zed t o minus-60 mesh and ashed i n BhW K-3000 i n s u l a t i n g f i r e b r i c k d i s h e s f o r 3 h o u r s a t 1850 F (1010 C) i n a l a r g e m u f f l e f u r n a c e . Th i s higher- than-normal a s h i n g t empera tu re was chosen a f t e r p r e l i m i n a r y work showed t h a t s u f f i c i e n t v o l a t i l e s remained i n t h e a s h prepared
1 7 5
at t h e s t anda rd "ASTM tempera tu re" o f 1382 F (750 C)* t o cause s e v e r e f r o t h i n g and foaming du r ing t h e ash m e l t i n g p r o c e s s . This d i f f i c u l t y i s s t i l l expe r i enced t o sane e x t e n t d u r i n g m e l t i n g o f t h e h igh - t empera tu re ash and i s be l i eved due t o decom- p o s i t i o n of r e s i d u a l s u l f a t e s and v o l a t i l i z a t i o n of a l k a l i - m e t a l ox ides i n t h e ash. The c o a l a sh i s s i eved a g a i n a t 60 mesh t o remove any f o r e i g n p a r t i c l e s of f i r e - b r i c k , then compressed i n t o p e l l e t s 5/8-inch i n d i ame te r weighing about 5 grams each . The ash p e l l e t s are dropped, one or two a t a time, i n t o t h e p r e v i o u s l y heated sample c r u c i b l e through a long q u a r t z t ube ; a t y p i c a l coa l - a sh cha rge i n t h e high- form alumina c r u c i b l e s i s about 60 t o 70 grams.
V i s c o s i t y measurements are norma l ly commenced a t t h e h i g h e s t t empera tu re a t which an on - sca l e r e a d i n g can be ob ta ined wi th a bob speed o f 64 rpm. The t empera tu re is t h e n dec reased s l o w l y (unde r mic roprocesso r c o n t r o l ) and v i s c o s i t y measurements are t aken a t approx ima te ly ha l f -hour i n t e r v a l s . Th i s "coo l ing cyc le" i s cont inued u n t i l t h e upper l i m i t o f t h e measuring head i s approached ( t y p i c a l l y abou t 3000 poises**), t hen t h e s l a g i s g r a d u a l l y r ehea ted t o obse rve changes i n v i s c o s i t y du r ing a "hea t ing c y c l e ."
Following each t e s t , samples of t h e s o l i d i f i e d s l a g and h igh - t empera tu re ash a r e submit ted t o GFETC f o r compos i t iona l a n a l y s e s by X-ray f l u o r e s c e n c e and X-ray r d i f f r a c t i o n t e c h n i q u e s . A Kevex Model 0700 e n e r g y d i s p e r s i v e X-ray spec t romete r is employed f o r X-ray f l u o r e s c e n c e a n a l y s i s . Samples a r e ground t o minus 60-mesh and p res sed i n t o a p e l l e t u s ing e i t h e r c e l l u l o s e or l i t h i u m t e t r a b o r a t e as a b i n d e r . The ins.trument is c a l i b r a t e d u s i n g m i x t u r e s o f r eagen t -g rade o x i d e s , blended t o approximate t h e r e l a t i v e amounts p r e s e n t i n t h e s l a g . X-ray d i f f r a c t i o n measure- ments a r e conducted on minus 325-mesh samples u s i n g a P h i l i p s 3600 automated X-ray d i f f r a c t o m e t e r . Compound i d e n t i f i c a t i o n i s accomplished with t h e a i d o f a computer- based index f i l e .
I
The s e l e c t i o n of low-rank c o a l s f o r t h e s e s t u d i e s was based t o some e x t e n t on t h o s e which had a c t u a l l y been t e s t e d or were c a n d i d a t e f e e d s t o c k s fo r t h e GFETC l i g n i t e g a s i f i e r ; i n a d d i t i o n , an e f f o r t was made t o choose samples t h a t would r e p r e s e n t a wide r ange of a sh compos i t ions and d i v e r s e g e o g r a p h i c a l l o c a t i o n s . The c o a l s s e l e c t e d f o r t h e s e v i s c o s i t y s t u d i e s a r e l i s t e d in Tab le I . *
RESULTS AND DISCUSSIS
V i s c o s i t y can be d e f i n e d as t h e r e s i s t a n c e to f low o f f e r e d by a f l u i d and i s c u s t o m a r i l y expres sed as t h e r a t i o of s h e a r s t r e s s t o s h e a r r a t e . The most commonly encountered regime of v i s c o u s f low i s termed "Newtonian" flow, i n which s h e a r s t r e s s is a l i n e a r f u n c t i o n o f s h e a r r a t e ( i . e . , v i s c o s i t y is c o n s t a n t a t any g i v e n shear r a t e ) . For Newtonian s u b s t a n c e s , t h e dependence o f v i s c o s i t y (q on
* ASTM Method D 3174-73, "Ash i n t h e Ana lys i s Sample of Coal and Coke."
**Throughout t h i s p a p e r , v i s c o s i t i e s a r e g iven i n t h e more f a m i l i a r u n i t s o f p o i s e s ; t h e accepted S I u n i t f o r v i s c o s i t y i s t h e Pascal-second, and t h e conve r s ion is p o i s e s x 0 .1 = P a - s e c .
P In view of t h e c o n s i d e r a b l e within-seam o r within-mine v a r i a b i l i t y o f low rank c o a l s , it should be understood t h a t t h e s e c o a l samples a r e not n e c e s s a r i l y r e p r e s e n t a t i v e of t h e t o t a l p roduc t ion of a p a r t i c u l a r mine.
176
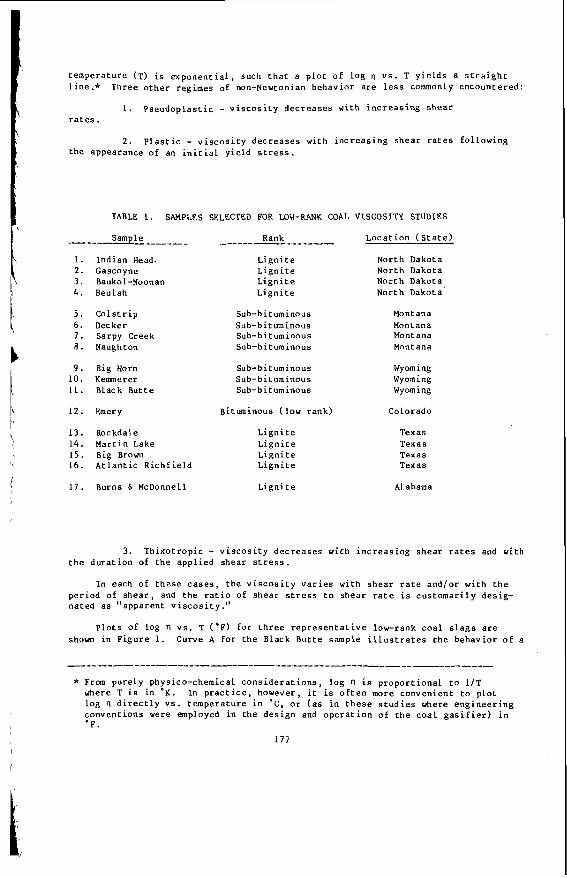
t empera tu re (T) i s e x p o n e n t i a l , such t h a t a p l o t of log 17 v s . T y i e l d s a s t r a i g h t l i n e . * Three o t h e r regimes of nowNewtonian behav io r a r e l e s s commonly encoun te red :
I . P s e u d o p l a s t i c - v i s c o s i t y d e c r e a s e s w i t h i n c r e a s i n g s h e a r r a t e s .
2 . P l a s t i c - v i s c o s i t y d e c r e a s e s with i n c r e a s i n g s h e a r r a t e s f o l l o w i n g the appearance of an i n i t i a l y i e l d s t r e s s .
TABLE 1. SAMPLES SELECTED FOR LOW-RANK COAL VISCOSITY STUDIES
Rank L o c a t i o n ( s t a t e ) _-_---- 1. Ind ian Head. 2. Gascoyne 3. Baukol-Noonan 4 . Beulah
5 . C o l s t r i p 6 . Decker 7 . Sarpy Creek 8 . Naughton
9. Big Horn 10. K e m e r e r 11. Black Butte
L i g n i t e L i g n i t e L i g n i t e L i g n i t e
Sub-b i t u n i n ous Sub- b it urn i no us Sub-b i t uminous Sub-bituminous
Sub- b i t um i n ous Sub-bituminous Sub-bi tuminous
North Dakota North Dakota North Dakota North Dakota
Montana Montana Montana Montana
Wyoming Wyoming Wyoming
1 2 . Emery Bituminous ( low rank) Colorado
13. Rockdale 14. Mar t in Lake 15. Big Brown 16. A t l a n t i c R i c h f i e l d
L i g n i t e L i g n i t e L i g n i t e L i g n i t e
Texas Texas Texas Texas
1 7 . Burns 6 McDonnell L i g n i t e Al.abama
3. T h i x o t r o p i c - v i s c o s i t y d e c r e a s e s wi th i n c r e a s i n g s h e a r r a t e s and w i t h t h e d u r a t i o n of t h e a p p l i e d shea r s t r e s s .
In each of t h e s e c a s e s , t h e v i s c o s i t y v a r i e s w i th s h e a r r a t e and /o r w i th t h e pe r iod of s h e a r , and t h e r a t i o of s h e a r s t r e s s to s h e a r r a t e is c u s t o m a r i l y des ig - nated a s “appa ren t v i s c o s i t y . ”
P l o t s o f log 17 V S . T (OF) f o r t h r e e r e p r e s e n t a t i v e low-rank c o a l s l a g s a r e shown i n F i g u r e 1 . Curve A f o r t h e Black Bu t t e sample i l l u s t r a t e s t h e behav io r of a
* From pure ly physico-chemical c o n s i d e r a t i o n s , log 11 i s p r o p o r t i o n a l t o 1/T where T i s in O K . In p r a c t i c e , however, i t i s o f t e n more conven ien t t o p l o t log n d i r e c t l y v s . t empera tu re i n ‘C, or ( a s i n t h e s e s t u d i e s where e n g i n e e r i n g conven t ions were employed i n t h e d e s i g n and o p e r a t i o n o f t h e c o a l g a s i f i e r ) i n O F .
177
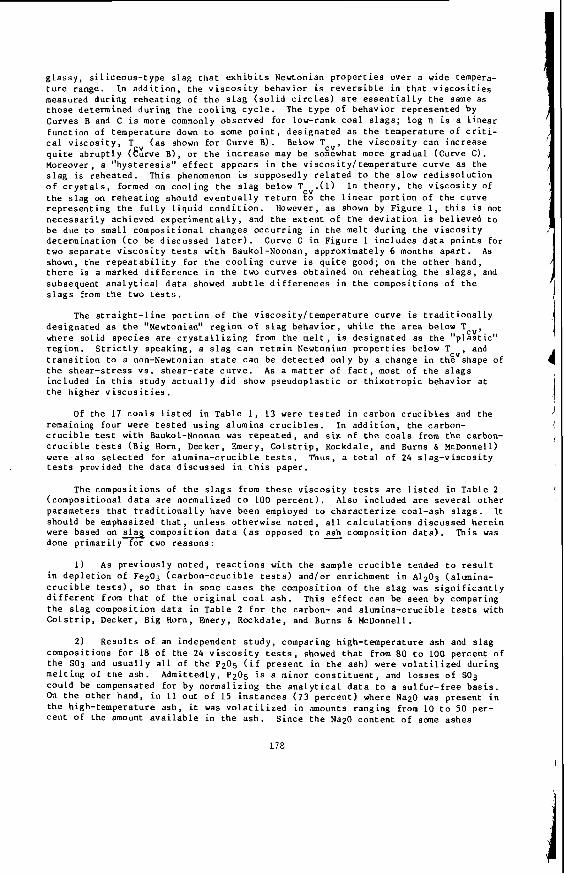
g l a s s y , s i l i c e o u s - t y p e s l a g t h a t e x h i b i t s Newtonian p r o p e r t i e s over a wide tempera- t u r e range. In a d d i t i o n , t h e v i s c o s i t y behav io r i s r e v e r s i b l e i n t h a t v i s c o s i t i e s measured d u r i n g r e h e a t i n g o f t h e s l a g ( s o l i d c i r c l e s ) a r e e s s e n t i a l l y t h e same as t h o s e determined d u r i n g t h e c o o l i n g c y c l e . The t y p e o f behav io r r e p r e s e n t e d by Curves B and C i s more commonly observed fo r low-rank c o a l s l a g s ; l o g rl i s a l i n e a r f u n c t i o n of t empera tu re down t o some p o i n t , d e s i g n a t e d as t h e t empera tu re o f c r i t i - c a l v i s c o s i t y , T ( a s shown f o r Curve B). Below T t h e v i s c o s i t y can i n c r e a s e q u i t e a b r u p t l y (&',,,e B), o r t h e i n c r e a s e may be sot%&hat more g radua l (Curve C ) . Moreover, a " h y s t e r e s i s " e f f e c t a p p e a r s i n t h e v i s c o s i t y / t e m p e r a t u r e c u r v e as the s l a g i s r e h e a t e d . Th i s phenomenon is supposed ly r e l a t e d t o t h e slow r e d i s s o l u t i o n o f c r y s t a l s , formed on c o o l i n g t h e s l a g below Tcv . ( l ) In t h e o r y , t h e v i s c o s i t y of t h e s l a g on r e h e a t i n g should e v e n t u a l l y r e t u r n t o t h e l i n e a r p o r t i o n o f t h e cu rve r e p r e s e n t i n g t h e f u l l y l i q u i d c o n d i t i o n . However, a s shown by F igure I , t h i s i s not n e c e s s a r i l y ach ieved e x p e r i m e n t a l l y , and t h e e x t e n t o f t h e d e v i a t i o n is be l i eved t o be due to small compos i t iona l changes o c c u r r i n g i n t h e m e l t d u r i n g t h e v i s c o s i t y d e t e r m i n a t i o n ( t o be d i s c u s s e d l a t e r ) . Curve C i n F i g u r e I i n c l u d e s d a t a p o i n t s for two s e p a r a t e v i s c o s i t y t e s t s w i th Baukol-Noonan, approx ima te ly 6 months a p a r t . As shown, t h e r e p e a t a b i l i t y f o r t h e c o o l i n g c u r v e i s q u i t e good; on t h e o t h e r hand, t h e r e i s a marked d i f f e r e n c e in t h e two c u r v e s o b t a i n e d on r e h e a t i n g t h e s l a g s , and subsequent a n a l y t i c a l d a t a showed s u b t l e d i f f e r e n c e s i n t h e compos i t ions of t h e s l a g s from t h e two t e s t s .
The s t r a i g h t - l i n e p o r t i o n o f t h e v i s c o s i t y / t e m p e r a t u r e c u r v e is t r a d i t i o n a l l y d e s i g n a t e d as t h e "Newtonian" r e g i o n of s l a g b e h a v i o r , wh i l e t h e a r e a below TcV,, where s o l i d s p e c i e s a r e c r y s t a l l i z i n g from t h e m e l t , i s d e s i g n a t e d as t h e " p l a s t i c " r e g i o n . S t r i c t l y speak ing , a s l a g c a n r e t a i n Newtonian p r o p e r t i e s below T and t r a n s i t i o n t o a nowNewtonian s t a t e can be d e t e c t e d o n l y by a change i n thEvAhape of t h e s h e a r - s t r e s s v s . s h e a r - r a t e c u r v e . A s a m a t t e r of f a c t , most o f t h e s l a g s inc luded i n t h i s s t u d y a c t u a l l y d i d show p s e u d o p l a s t i c o r t h i x o t r o p i c behav io r a t t h e h ighe r v i s c o s i t i e s .
Of t h e 1 7 c o a l s l i s t e d i n T a b l e 1, 13 were t e s t e d i n carbon c r u c i b l e s and the remaining fou r were t e s t e d us ing alumina c r u c i b l e s . In a d d i t i o n , t h e carbon- c r u c i b l e tes t wi th BaukoL-Noonan was r e p e a t e d , and s i x o f t h e c o a l s from t h e carbon- c r u c i b l e t e s t s (B ig Horn, Decker, Emery, C o l s t r i p , Rockdale , and Burns 6 McDonnell) were a l s o s e l e c t e d fo r a l u m i n a - c r u c i b l e t e s t s . Thus, a t o t a l o f 24 s l a g - v i s c o s i t y t e s t s provided t h e d a t a d i s c u s s e d i n t h i s pape r .
The compos i t ions of t h e s l a g s from t h e s e v i s c o s i t y t e s t s a r e l i s t e d i n Tab le 2 ( compos i t iona l d a t a a r e normalized t o 100 p e r c e n t ) . A l s o i nc luded a r e s e v e r a l o t h e r pa rame te r s t h a t t r a d i t i o n a l l y have been employed t o c h a r a c t e r i z e coa l - a sh s l a g s . It should be emphasized t h a t , u n l e s s o t h e r w i s e n o t e d , a l l c a l c u l a t i o n s d i s c u s s e d h e r e i n were based on slag compos i t ion d a t a ( a s opposed t o ash compos i t ion d a t a ) . done p r i m a r i l y fo r two r e a s o n s :
This was
I ) A s p r e v i o u s l y n o t e d , r e a c t i o n s wi th t h e sample c r u c i b l e tended t o r e s u l t i n d e p l e t i o n o f Fez03 ( c a r b o n - c r u c i b l e t e s t s ) and/or enr ichment i n A1203 (alumina- c r u c i b l e t e s t s ) , so t h a t i n some c a s e s t h e compos i t ion o f t h e s l a g was s i g n i f i c a n t l y d i f f e r e n t from t h a t of t h e o r i g i n a l c o a l a s h . t h e s l a g compos i t ion d a t a i n Tab le 2 f o r t h e carbon- and a lumina -c ruc ib l e t e s t s with C o l s t r i p , Decker, Big Horn, Emery, Rockdale , and Burns & McDonnell.
Th i s e f f e c t can be seen by comparing
2 ) compos i t ions f o r 18 o f t h e 24 v i s c o s i t y tests, showed t h a t from 80 t o 100 pe rcen t o f t h e SO3 and u s u a l l y a l l of t h e P2O5 ( i f p r e s e n t i n t h e a sh ) were v o l a t i l i z e d du r ing m e l t i n g O E t h e a s h . Admi t t ed ly , P2O5 is a minor c o n s t i t u e n t , and l o s s e s o f SO3 cou ld be compensated f o r by no rma l i z ing t h e a n a l y t i c a l d a t a t o a s u l f u r - f r e e b a s i s . On t h e o t h e r hand, i n I 1 o u t o f 15 i n s t a n c e s (73 p e r c e n t ) where NapO was p r e s e n t i n t h e h igh - t empera tu re a sh , i t was v o l a t i l i z e d i n amounts r ang ing from 10 t o 50 per- c e n t o f the amount a v a i l a b l e i n t h e a s h .
R e s u l t s o f an independent s t u d y , comparing h igh - t empera tu re ash and s l a g
S i n c e t h e NapO c o n t e n t o f sme a s h e s
178
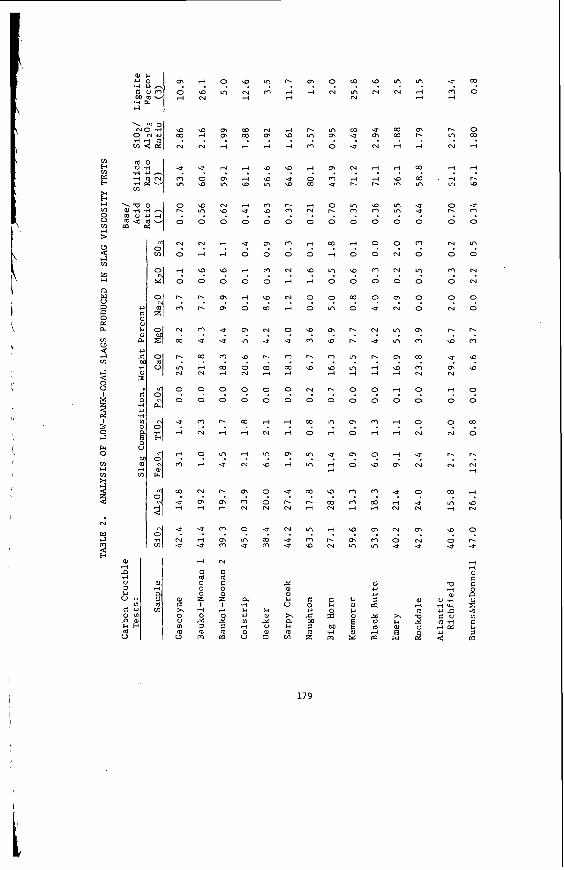
J N
w cl
3
L C
C !-
e L L
a
r s E C r e v C E c
4
v:
a r
W rl
.rl 0
u u .. Lo C Y
o m hi-4
V
e
e m
m 0 rl
.n W
N
U
m m
0 r.
0
N
0
rl
0
r. m
N
m
r.
m N
9 0
U
rl
-! m
m
U rl
U
N U
W
x 0 I
J
? .n N
\D rl
N
4 0 10
\D m 0
N
rl
\D
0
r.
r.
m U
m rl N
9 0
m N
9 rl
N
m rl
U
rl U
4
C C
f rl 0 3
m m
9 m
m m rl
? m m
N a 0
rl
rl
\D
0
m m
U
U
m W rl
0
0
r.
4
“1 U
r. m rl
m m m
N
C C 0 z 4 0 3
m m
\D
N rl
W
rl
m
rl
rl 10
rl U
0
U
0
4
0
rl
0
m m
10
0 N
9 0
m rl
rl
N
m m N
0
m U
a .rl
U
I rl
0 V
m m
N m rl
\D
10 &I
m -0
0
m 0
m 0
10
m
N
U
h
m rl
9 0
rl
N
m Lo
0
0 N
U
m m
u
$ a”
r.
rl rl
4 \D
rl
\D
U .n
r. m 0
W
0
N
rl
N
rl
9 U
m m rl
9 0
rl
d
m 4
U
r. N
N
U U
3 W
U
h a 4 v)
m rl
r. m m
rl
0 m
4 N
0
rl
0
\D
rl
0
0
10
m
r.
\D
N
0
m 0
m m
m r. rl
m 0 \D
C 0 U
.G a0
2
9 N
m
0
m
m r? U
0
0
r.
? rl
m 0
9 m
m 10
m \D rl
r.
0
m rl
2 rl rl
\D
m N
rl
r. N
C
2 bo .A m
m
m N
m U
U
N
rl r.
m
0
m
rl
0
10
0
m 0
r. r.
m m rl
0
0
m 0
m 0
m m rl
.n
In m
h u
I 2
\D
N
U
N
m
rl
rl r.
\D m
0
9 0
m 0
9 if
N
.Y
r.
rl rl
9 0
m rl
9
m m rl
m m rl
W U Y
3 Ea
2 rl W
ln N
m ?
!
rl
\D m
m m 0
9 N
N
0
m N
m In
m \D rl
rl
0
4
4
4
m
2 rl N
N
0 U
x
I w
m 4 74
m r. rl
m m m
U U
0
m 0
m 0
9 0
m m
m m N
0
0
9
‘J
N
N
9 U N
m N U
0 d
V s
H
v. m rl
h m N
rl
- 4 m
0 h
0
N
0
m 0
0 N
r.
\D
‘J m N
rl
0
9 N
r. N
W
m rl
ro 0 U
-a rl W
u .rl M u 4
u s c u 22 4
W
0
0
rl ?
rl
r. 10
U 0
0
m 0
N
N
0
0
r.
m
\D
a
9 0
m 0
r.
N rl
rl
\D N
9 r. -3
rl rl
C
5 5 C 1 m
179
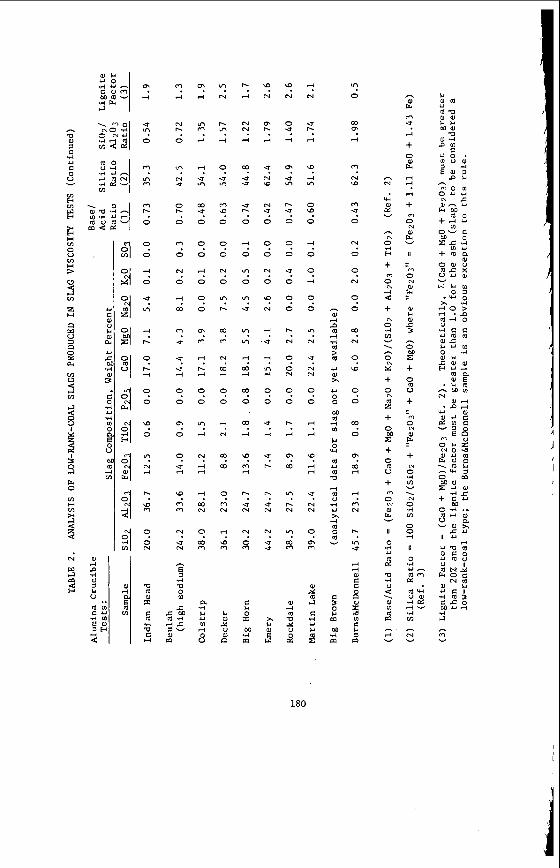
180
ranged UP t o 10 p e r c e n t , i t i s probable t h a t v o l a t i l i z a t i o n o f t h i s c o n s t i t u e n t would have an eLfec t on t h e s l a g v i s c o s i t y .
The d a t a i n Tab le 2 i l l u s t r a t e t h e wide v a r i a b i l i t y i n c o n c e n t r a t i o n s o f l o r rank-coal s l a g c o n s t i t u e n t s . where t h e ranges i n s l a g compos i t ions encoun te red d u r i n g t h e s e s t u d i e s ( T a b l e 2 ) a r e compared with t h e a sh compos i t ion of an "average" b i tuminous c o a l (SOg-free b a s i s ) .(4) and a l k a l i metal o x i d e s i n t h e low-rank c o a l s l a g s .
Th i s v a r i a b i l i t y is r e f l e c t e d f u r t h e r by Tab le 3,
E s p e c i a l l y noteworthy a r e t h e h i g h e r c o n c e n t r a t i o n s of a l k a l i n e - e a r t h
The expe r imen ta l v i s c o s i t y d a t a from t h e s e s t u d i e s are summarized i n T a b l e 4 . The t w o v i s c o s i t y v a l u e s shown f o r each sample, co r re spond ing t o s p e c i f i c me l t t empera tu res , are s u f f i c i e n t t o approximate t h e l i n e a r ("Newtonian") p o r t i o n o f t h e log 11 vs. T c u r v e ob ta ined d u r i n g t h e c o o l i n g c y c l e . In a d d i t i o n , v a l u e s f o r T (when obse rvab le ) and ash f u s i b i l i t y ( r e d u c i n g atmosphere) f o r t h e high-tempera€& a s h (HTA) a r e inc luded f o r comparison.
S l a g V i s c o s i t y l c o m p o s i t i o n C o r r e l a t i o n s
Seve ra l a t t e m p t s have been made i n t h e p a s t to deP ine t h e l i n e a r p o r t i o n of t h e v i s c o s i t y / t e m p e r a t u r e c u r v e based on t h e compos i t ion o f t h e c o a l a sh . 1960's, workers a t t h e B r i t i s h Coal U t i l i z a t i o n Research A s s o c i a t i o n (BCURA) deve l - oped two such c o r r e l a t i o n s based on work wi th B r i t i s h (b i tuminous ) c o a l s , now gener- a l l y r e f e r r e d t o as t h e Watt-Fereday(5) and "S2" (3 ) c o r r e l a t i o n s .* The Watt-Fereday c o r r e l a t i o n is based on r e s u l t s o f 276 d e t e r m i n a t i o n s o f s l a g v i s c o s i t y u s i n g 113 d i f f e r e n t ash compos i t ions prepared by b l end ing B r i t i s h c o a l a s h e s . Unfo r tuna te ly , a t t e m p t s t o app ly t h i s c o r r e l a t i o n t o low-rank c o a l s l a g s , u s i n g e i t h e r ash- or slag-composi t ion d a t a , have been g e n e r a l l y u n s u c c e s s f u l . This i s i l l u s t r a t e d by F i g u r e 2 , i n which t h e v i s c o s i t y / t e m p e r a t u r e c o o l i n g c u r v e s f o r t w o Texas l i g n i t e s , Big Brown and Mart in Lake, a r e p l o t t e d . The co r re spond ing Watt-Fereday c o r r e l a t i o n l i n e s a r e based on t h e ( 7 5 0 C ASTM) ash-composi t ion d a t a . As i n d i c a t e d by F igu re 2 , t h e ash compos i t ions and ash f u s i o n t empera tu res o f t h e s e two c o a l s a r e v e r y s i m i - lar . However, t h e v i s c o s i t y p r e d i c t e d by t h e Watt-Fereday c o r r e l a t i o n f o r Big Brown was h ighe r t han t h a t observed e x p e r i m e n t a l l y , wh i l e f o r Mart in Lake t h e Watt-Fereday e q u a t i o n under-predic ted t h e a c t u a l v i s c o s i t y .
In t h e mid-
Among t h e p o s s i b l e r easons why t h e s e p r e d i c t i v e e q u a t i o n s f a i l fo r l o r r a n k c o a l s a r e t h e fo l lowing :
1. Ash c o n s t i t u e n t s may f a l l o u t s i d e t h e r ange o f t h o s e i n most bi tuminous c o a l s (Tab le 3 ) .
2 . The BCURA p r e d i c t i v e e q u a t i o n s a r e based on a s h a n a l y s e s . A s d i scussed e a r l i e r , s i g n i f i c a n t l o s s e s of c e r t a i n e l emen t s may occur as t h e a sh from low-rank c o a l s i s heated t o t h e me l t ing p o i n t .
3. Su l fu r r e t e n t i o n i s more p r e v a l e n t i n l o r r a n k c o a l a s h e s , due to t h e g e n e r a l l y h ighe r ca l c ium c o n t e n t s . Some o f t h e s l a g s from t h e s e v i s c o s i t y s t u d i e s r e t a i n e d up t o 2 p e r c e n t SO3 (Tab le 2 ) , even a f t e r be ing hea ted above 2600 F ( 1 4 2 7 C) .
4 . In l i g n i t e s , some 30 t o 50 p e r c e n t o f t h e ash-forming c o n s t i t u e n t s can c o n s i s t o f c a t i o n s a t t a c h e d t o t h e o rgan ic m a t t e r i n ion-exchangeable form on ca r - boxyl groups or as c h e l a t e complexes, r a t h e r t h a n be ing p r e s e n t a s d i s t i n c t mineral- o g i c a l s p e c i e s . ( 6 )
'i
* D e t a i l s of t h e v i s c o s i t y / c o m p o s i t i o n c o r r e l a t i o n s a r e p re sen ted i n Appendix I .
181
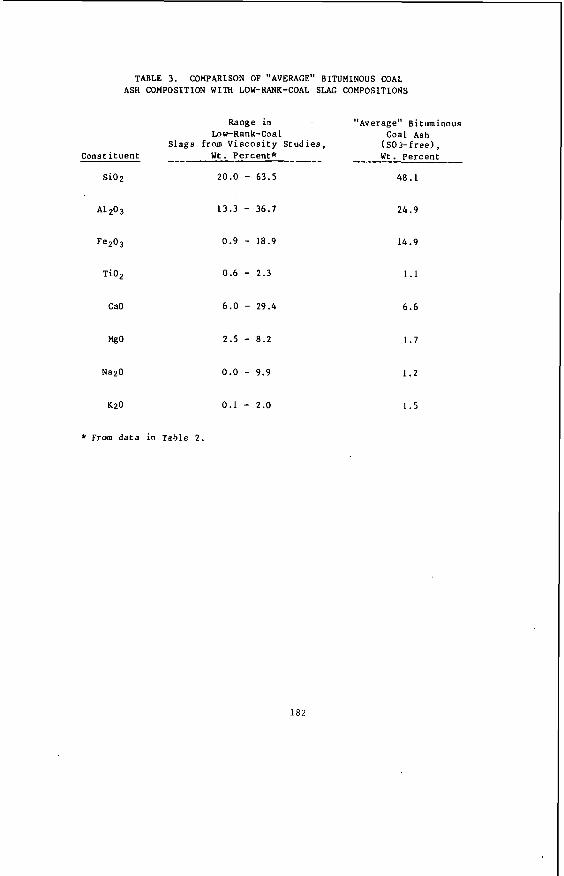
TABLE 3 . COMPARISON OF "AVERAGE" BITUMINOUS COAL ASH COMPOSITION WITH LOW-RANK-COAL SLAG COMPOSITIONS
Range i n Low-Rank-Coa 1
S l a g s from V i s c o s i t y S tud ies , Constituent ____ U t . Percent"
S i02
A1Z03
FeZ03
TiOZ
CaO
MgO
NazO
Kz0
2 0 . 0 - 6 3 . 5
1 3 . 3 - 3 6 . 7
0 . 9 - 1 8 . 9
0 . 6 - 2 . 3
6 . 0 - 2 9 . 4
2 . 5 - 8 . 2
0.0 - 9 . 9
0 . 1 - 2 . 0
"Average" Bituminous Coal Ash
(S03- free ) , -- U t . Percent -
4 8 . 1
2 4 . 9
1 4 . 9
1 . 1
6 . 6
1 . 7
1 . 2
1 . 5
* .om data i n Tat
1 8 2
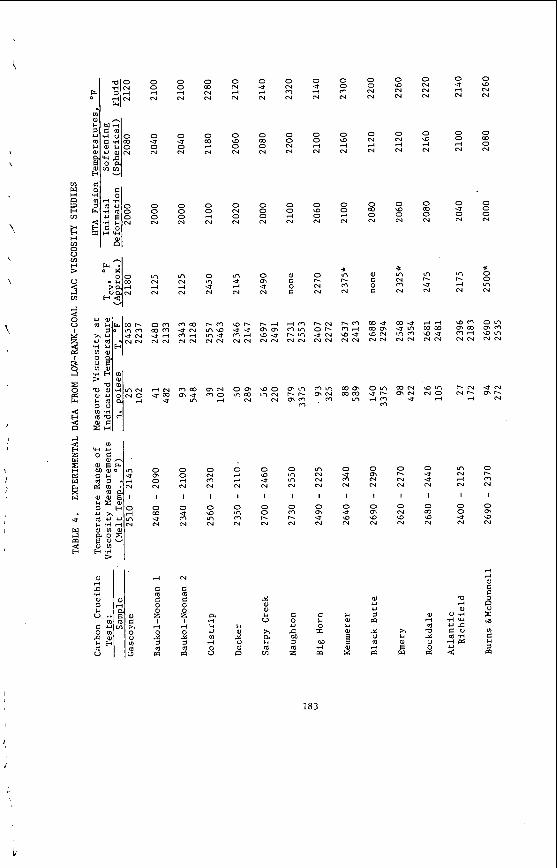
\
'\
0 0 d N
0 U 0 N
0 0
0 N
m N d N
0 0 d
N
0 G 0 N
0 0 0 N
m N
rl N
0 W N N
0
d N
m
0 0 rl N
0 m U N
0 N rl N
0 o 0 N
0 N 0 N
m U d
N
0 U rl N
0
0 N a
0 0 0 N
0
U N m
0 N
N n
0 0 N N
0 0 d N
m 0
0 U d N
0 0 ,-I N
0 o 0 N
0 r. N
N
0
0 N
I
0
U N
m
m
rl
C C 0 z d 0 Y
@ m
0 0 rl N
I
0 U m N
N
9 :: 2
0
4
nl m
0 N
N
I
0 o m N
n
a .d Y U
v) 4
0 U
0 d d N
I
0 m N n
Y
P
0 \D U N
I
0 0 r. N
3 0,
Y U
x a
nl m
0 m m N
I
0
r. N
n
C U
fi m z
In N N N
I
0
U N
m
C
2 M .rl m
0 0
N n
0 o d N
0 0 d N
c m r. m N
0 0 N N
0 N
d N
0
0 N a
m 0
0 o N
N
0 N d N
0 o 0 N
% m N
N n
0 0 0 N u a N d N N N N
0 0 0 a o m 4 - 4 0 N N N
0 0 0 a u o 0 0 0 N N N
c m m o r. r - 0 u r l m N N N
r . m m u m u drl o m o m m r l m m u m m a m m m n
a~ m n a u or( o m N N N N N N N N N N N N
a m o m m N a m r -N U N m m ur. m~ N O ~ r . m r .
m d n u rl r( N n
0 U m N
I
0 U \D N
Y m Y m
I d
0
N N
I
0
o N
m
m
m U U
1
3
m 4
m
m
0 0 m o r . u N P -
N N N N N U r l n
I 1 I 1
0 0 0 0 ~a o m a o u \ D N N N N
183

h P
9 .rl 4J
0 U
m v
R a
c
?-
m
m 0
m
3 m rl
d
9 rl
0 E d 8 d
5
cl
z 8 B
3 U
w cl
0 N N
N
0 -3 rl N
0 w 0 N
* 0
m N
m
0
N N m
0 m 4 N
0 0 3 N
-x 0 h
U N
0 N rl
N
0 0
::
0 N 0 N
m u rl N
0 -3 rl N
0 0 d N
0 a 0 N
VI h rl N
0 Lo N N
0 N d
N
0 u) 0 N
0 N
U N
0 N N
N
0 w rl N
0
0 N
m
m N
m N
0 0 0 o m w N d N N N N
0 0 0
r l r l o N N N
U N m
0 0 0
4 0 0 N N N
o m o
-x 0 0 0 N m 0 m m m N N N
b o m o w - rlh url h m m N o m m N m m m~ m u m h w u r l m h~ m a m o VI(? w m N d m r l m u \ o m a m m m w u N N N N N N N N N N N N N N N N N N
m o m u m h o m m u m o mv, urn O N m u r l m w m m m m r l ~ m - 3 m ~m u u
m N N r l w N
0 h
N N
I
0 U w N
- 2
.rl W 0
c S M
r lc 9- m .,-I
m
0 w 0 N
I
0 m w N
n .rl $4 U
0) 4 0 U
0 m z I
0 N N m
$4
3 8
0 4 r( N
I
0 m m N
e
2 M .rl m
0
N N
I
0 w L n N
m
x I4
w I
0 U U N
I
0 N u) N
aJ 4
W Y U
P
0 0 0 w o m N m 4 N N N
I 1 I
0 0 0
a m h .u N N N aJ
.rl
m m o
w aJ W
rl d
b
184
J
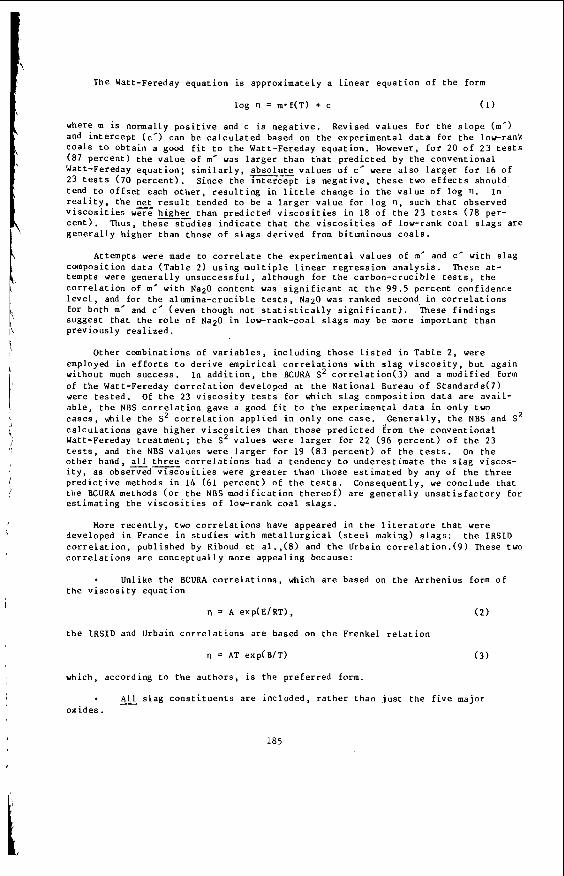
I
I
\ I
The Watt-Fereday e q u a t i o n i s approx ima te ly a l i n e a r e q u a t i o n o f t h e form
log r~ = m.f(T) + c (1)
where m is normally p o s i t i v e and c is n e g a t i v e . Revised v a l u e s f o r t h e s l o p e (m’) and i n t e r c e p t (c’) can be c a l c u l a t e d based on t h e expe r imen ta l d a t a f o r t h e l o r r a n k c o a l s t o o b t a i n a good f i t t o t h e Watt-Fereday e q u a t i o n . However, f o r 20 o f 2 3 t e s t s (87 p e r c e n t ) t h e v a l u e o f ma was l a r g e r t han t h a t p r e d i c t e d by t h e c o n v e n t i o n a l Watt-Fereday e q u a t i o n ; s i m i l a r l y , a b s o l u t e v a l u e s o f c c were a l s o l a r g e r f o r 16 o f 23 t e s t s ( 7 0 p e r c e n t ) . S ince t h e X r T e p t i s n e g a t i v e , t h e s e t w o e f f e c t s should tend to o f f s e t each o t h e r , r e s u l t i n g i n l i t t l e change i n t h e v a l u e o f log n. In r e a l i t y , t h e n e t r e s u l t tended t o be a l a r g e r v a l u e f o r l og n, such t h a t observed v i s c o s i t i e s w e r e h ighe r t han p r e d i c t e d v i s c o s i t i e s i n 18 o f t h e 23 tes ts ( 7 8 per- c e n t ) . Thus, t h e s e s t u d i e s i n d i c a t e t h a t t h e v i s c o s i t i e s of low-rank c o a l s l a g s a r e g e n e r a l l y h ighe r t han t h o s e of s l a g s d e r i v e d from bi tuminous c o a l s .
Attempts were made t o c o r r e l a t e t h e expe r imen ta l v a l u e s o f n’ and c * with s l a g composi t ion d a t a ( T a b l e 2 ) us ing m u l t i p l e l i n e a r r e g r e s s i o n a n a l y s i s . These a t - tempts were g e n e r a l l y u n s u c c e s s f u l , a l t hough f o r t h e c a r b o n - c r u c i b l e t e s t s , t h e c o r r e l a t i o n of rn’ wi th NaZO c n n t e n t was s i g n i f i c a n t a t t h e 99.5 pe rcen t c o n f i d e n c e l e v e l , and fo r t h e a lumina -c ruc ib l e t e s t s , Na2O was ranked second i n c o r r e l a t i o n s f o r bo th m’ and c c ( even though not s t a t i s t i c a l l y s i g n i f i c a n t ) . These f i n d i n g s sugges t t h a t t h e r o l e of N a Z O i n low-rank-coal s l a g s may be more impor t an t t h a n p rev ious ly r e a l i z e d .
Other combinat ions of v a r i a b l e s , i n c l u d i n g t h o s e l i s t e d i n T a b l e 2 , were employed i n e f f o r t s t o d e r i v e e m p i r i c a l c o r r e l a t i o n s with s l a g v i s c o s i t y , b u t a g a i n without much s u c c e s s . In a d d i t i o n , t h e BCURA S2 c o r r e l a t i o n ( 3 ) and a modif ied form of t h e Watt-Fereday c o r r e l a t i o n developed a t t h e N a t i o n a l Bureau o f S t a n d a r d s ( 7 ) were t e s t e d . Of t h e 23 v i s c o s i t y tes ts f o r which s l a g compos i t ion d a t a a r e a v a i l - a b l e , t h e NBS c o r r e l a t i o n gave a good f i t t o t h e expe r imen ta l d a t a i n only two c a s e s , wh i l e t h e S2 c o r r e l a t i o n a p p l i e d i n o n l y one c a s e . c a l c u l a t i o n s gave h i g h e r v i s c o s i t i e s t han t h o s e p r e d i c t e d Erom t h e conven t iona l Watt-Fereday t r e a t m e n t ; t h e S2 v a l u e s were l a r g e r fo r 22 (96 p e r c e n t ) o f t h e 23 t e s t s , and t h e NBS v a l u e s were l a r g e r f o r 19 ( 8 3 p e r c e n t ) of t h e t e s t s . On t h e o t h e r hand, a l l t h r e e c o r r e l a t i o n s had a t endency t o u n d e r e s t i m a t e t h e s l a g v i scos - i t y , a s observed v i s c o s i t i e s were g r e a t e r t han t h o s e e s t i m a t e d by any o f t h e t h r e e p r e d i c t i v e methods i n 14 (61 p e r c e n t ) of t h e t e s t s . Consequen t ly , w e conc lude t h a t t h e BCURA methods ( o r t h e NBS m o d i f i c a t i o n t h e r e o f ) a r e g e n e r a l l y u n s a t i s f a c t o r y fo r e s t i m a t i n g t h e v i s c o s i t i e s of low-rank c o a l s l a g s .
G e n e r a l l y , t h e NBS and S 2
More r e c e n t l y , two c o r r e l a t i o n s have appeared i n t h e l i t e r a t u r e t h a t were developed i n France in s t u d i e s with m e t a l l u r g i c a l ( s t e e l making) s l a g s : t h e IRSID c o r r e l a t i o n , pub l i shed by Riboud e t a 1 . , ( 8 ) and t h e Urbain c o r r e l a t i o n . ( 9 ) These two c o r r e l a t i o n s a r e c o n c e p t u a l l y more a p p e a l i n g because:
* Unlike t h e BCURA c o r r e l a t i o n s , which a r e based on t h e Ar rhen ius form of t h e v i s c o s i t y e q u a t i o n
n = A exp(E/RT), ( 2 )
t h e IRSID and Urbain c o r r e l a t i o n s a r e based on t h e Frenkel r e l a t i o n
n = AT exp(B/T) ( 3 )
which, acco rd ing t o t h e a u t h o r s , is t h e p r e f e r r e d form.
A l l s l a g c o n s t i t u e n t s a r e i n c l u d e d , r a t h e r t h a n j u s t t h e f i v e major - o x i d e s .
185
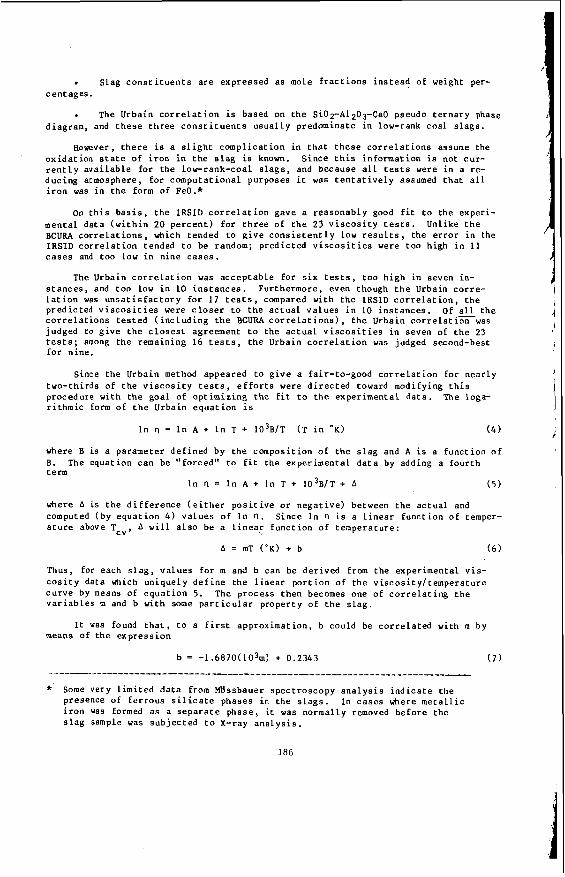
Slag c o n s t i t u e n t s a r e expres sed as mole f r a c t i o n s i n s t e a d o f weight per- cen tages .
. The Urbain c o r r e l a t i o n is based on t h e Si02-Al203-CaO pseudo t e r n a r y phase diagram, and t h e s e t h r e e c o n s t i t u e n t s u s u a l l y predominate i n low-rank c o a l s l a g s .
However, t h e r e i s a s l i g h t c o m p l i c a t i o n i n t h a t t h e s e c o r r e l a t i o n s assume the o x i d a t i o n s t a t e o f i r o n i n t h e s l a g is known. S i n c e t h i s i n f o r m a t i o n is no t cu r - r e n t l y a v a i l a b l e f o r t h e low-rank-coal s l a g s , and because a l l tes ts were i n a re- d u c i n g atmosphere, f o r c o m p u t a t i o n a l purposes i t was t e n t a t i v e l y assumed t h a t a l l i r o n was i n t h e form of FeO.*
O n t h i s b a s i s , t h e IRSID c o r r e l a t i o n gave a r easonab ly good f i t t o t h e experi- men ta l d a t a ( w i t h i n 20 p e r c e n t ) f o r t h r e e o f t h e 23 v i s c o s i t y t e s t s . Unlike t h e BCUW c o r r e l a t i o n s , which tended t o g i v e c o n s i s t e n t l y low r e s u l t s , t h e error i n the IRSID c o r r e l a t i o n tended t o be random; p red ic t ed v i s c o s i t i e s were too h igh i n 11 c a s e s and too low i n n i n e c a s e s .
The Urbain c o r r e l a t i o n was a c c e p t a b l e f o r s i x t e s t s , t o o h i g h i n seven in- s t a n c e s , and too low i n 10 i n s t a n c e s . Furthermore, even though t h e Urbain c o r r e - l a t i o n was u n s a t i s f a c t o r y f o r 17 t e s t s , compared with t h e IRSID c o r r e l a t i o n , t h e p red ic t ed v i s c o s i t i e s were c l o s e r to t h e a c t u a l v a l u e s i n 10 i n s t a n c e s . o f a l l t h e c o r r e l a t i o n s t e s t e d ( i n c l u d i n g t h e BCURA c o r r e l a t i o n s ) , t h e Urbain c o r r e l a t i r w a s judged to g i v e t h e c l o s e s t agreement t o the a c t u a l v i s c o s i t i e s i n seven of t h e 23 tes ts ; among t h e remaining 1 6 t es t s , t h e Urbain c o r r e l a t i o n was judged second-best f o r n ine . I
Since t h e Urbain method appea red t o g i v e a fair- to-good c o r r e l a t i o n f o r n e a r l y I
I two-thirds of t h e v i s c o s i t y tes ts , e f f o r t s were d i r e c t e d toward modifying t h i s procedure wi th t h e goal of o p t i m i z i n g t h e f i t t o t h e expe r imen ta l d a t a . The loga- r i t h m i c form o f t h e Urbain e q u a t i o n i s
i I n rl = In A + In T + 1 0 3 ~ 1 ~ ( T i n OK) ( 4 )
where B is a pa rame te r d e f i n e d by t h e composi t ion o f t h e s l a g and A is a f u n c t i o n o f B. The equa t ion can be " fo rced" t o f i t t h e expe r imen ta l d a t a by adding a f o u r t h term
I n rl = l n A + In T + 1 0 3 ~ 1 ~ + A ( 5 )
where A is t h e d i f f e r e n c e ( e i t h e r p o s i t i v e o r n e g a t i v e ) between t h e a c t u a l and computed ( b y e q u a t i o n 4 ) v a l u e s o f I n 0. a t u r e above TcV, A w i l l a l s o be a linea: f u n c t i o n of t empera tu re :
S ince I n rl is a l i n e a r f u n c t i o n o f temper-
A = mT ( O K ) + b ( 6 )
Thus, for each s l a g , v a l u e s f o r m and b can be d e r i v e d from t h e expe r imen ta l v i s - c o s i t y da t a which un ique ly d e f i n e t h e l i n e a r p o r t i o n o f t h e v i s c o s i t y l t e m p e r a t u r e c u r v e by means of e q u a t i o n 5. The p rocess then becomes one of c o r r e l a t i n g t h e v a r i a b l e s m and b wi th some p a r t i c u l a r p rope r ty o f t h e s l a g .
It was found t h a t , t o a f i r s t app rox ima t ion , b could be c o r r e l a t e d with m by means of t h e e x p r e s s i o n
b = -1 .6870(103m) + 0 .2343 (7)
* Some very l i m i t e d d a t a from W s s b a u e r spec t roscopy a n a l y s i s i n d i c a t e t h e presence of f e r r o u s s i l i c a t e phases i n t h e slags. I n c a s e s where m e t a l l i c i r o n was formed as a s e p a r a t e p h a s e , i t was normalLy removed beEore t h e s l a g sample was s u b j e c t e d t o X-ray a n a l y s i s .
186
i
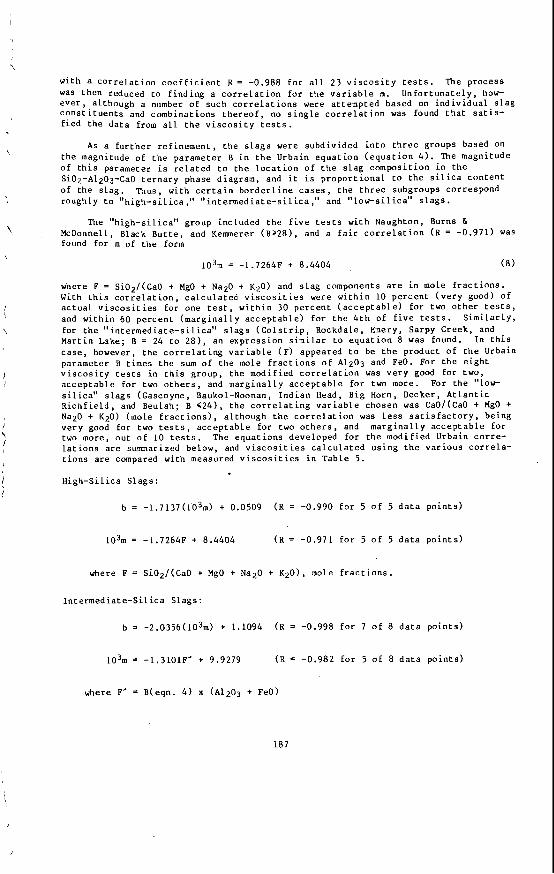
I
\
\
I
\
,
I \
\
I I
I \ I
I I
with a c o r r e l a t i o n c o e f f i c i e n t R = -0.988 f o r a l l 23 v i s c o s i t y t e s t s . The p rocess was then reduced t o f i n d i n g a c o r r e l a t i o n f o r t h e v a r i a b l e m. U n f o r t u n a t e l y , how- e v e r , a l t hough a number of such c o r r e l a t i o n s were a t t empted based on i n d i v i d u a l s l a g c o n s t i t u e n t s and combinat ions t h e r e o f , no s i n g l e c o r r e l a t i o n was found t h a t s a t i s - f i e d t h e d a t a from a l l t h e v i s c o s i t y t e s t s .
AS a f u r t h e r r e f i n e m e n t , t h e s l a g s were subd iv ided i n t o t h r e e groups based o n t h e magnitude o f t h e parameter B i n t h e Urbain e q u a t i o n ( e q u a t i o n 4 ) . The magnitude Of t h i s parameter i s r e l a t e d t o t h e Loca t ion o f t h e s l a g compos i t ion i n t h e SiO2-Atp03-CaO t e r n a r y phase diagram, and i t i s p r o p o r t i o n a l t o t h e s i l i c a c o n t e n t o f t h e s l a g . Thus, with c e r t a i n b o r d e r l i n e c a s e s , t h e t h r e e subgroups correspond roughly t o " h i g h - s i l i c a ," " i n t e r m e d i a t e - s i l i c a ," and " low-s i l i ca" s l a g s .
The " h i g h - s i l i c a " group inc luded t h e f i v e tes ts wi th Naughton, Burns 6 McDonnell, Black B u t t e , and Kemmerer (B>28), and a f a i r c o r r e l a t i o n ( R = -0.971) Was found f o r m of t h e form
IO3, = -1.72fi4F + 8.4404 (8)
where F = SiOp/(CaO + MgO + NaZO + K 2 0 ) and s l a g components a r e i n mole f r a c t i o n s . With t h i s c o r r e l a t i o n , c a l c u l a t e d v i s c o s i t i e s were w i t h i n 10 p e r c e n t ( v e r y good) O f a c t u a l v i s c o s i t i e s f o r one t e s t , w i t h i n 30 p e r c e n t ( a c c e p t a b l e ) f o r two o t h e r t e s t s , and w i t h i n 60 p e r c e n t ( m a r g i n a l l y a c c e p t a b l e ) f o r t h e 4 t h of f i v e t e s t s . S i m i l a r l y , fo r t h e " i n t e r m e d i a t e - s i l i c a " s l a g s ( C o t s t r i p , Rockdale , Emery, Sarpy Creek, and Mart in Lake; B = 24 t o 2 8 ) , an e x p r e s s i o n s i m i l a r t o e q u a t i o n 8 was found. c a s e , however, t h e c o r r e l a t i n g v a r i a b l e (F ) appeared t o be t h e product o f t h e Urbain parameter B t imes t h e sum o f t h e mole f r a c t i o n s o f A1203 and FeO. For t h e e i g h t v i s c o s i t y t e s t s i n t h i s group, t he modif ied c o r r e l a t i o n was v e r y good fo r t w o , a c c e p t a b l e f o r two o t h e r s , and m a r g i n a l l y a c c e p t a b l e f o r two more. For t h e "low- s i l i c a " s l a g s (Gascoyne, Baukol-Noonan, I n d i a n Head, Big Horn, Decker, A t l a n t i c R i c h f i e l d , and Beulah; B < 2 4 ) , t h e c o r r e l a t i n g v a r i a b l e chosen was CaO/(CaO + MgO + NaZO + Kz0) (mole f r a c t i o n s ) , a l t hough t h e c o r r e l a t i o n was l e s s s a t i s f a c t o r y , be ing ve ry good f o r two t e s t s , a c c e p t a b l e f o r two o t h e r s , and m a r g i n a l l y a c c e p t a b l e f o r two more, ou t o f 10 t e s t s . The e q u a t i o n s developed f o r t h e mod i f i ed Urbain c o r r e - l a t i o n s a r e summarized below, and v i s c o s i t i e s c a l c u l a t e d u s i n g t h e v a r i o u s c o r r e l a - t i o n s a r e compared with measured v i s c o s i t i e s in Tab le 5.
H igh-S i l i ca S l a g s :
In t h i s
b = -1.7137(103m) + 0.0509 (R = -0.990 f o r 5 o f 5 d a t a p o i n t s )
103m = -1.72641 + 8.4404 (R = -0.971 f o r 5 o f 5 d a t a p o i n t s )
where F = SiOp/(CaO + MgO + N a z O + KpO), moLe f r a c t i o n s .
I n t e r m e d i a t e - S i l i c a S l a g s :
b = -2.0356(103m) + 1.1094 (R = -0.998 f o r 7 of 8 d a t a p o i n t s )
103m = -1.3101F' + 9.9279 (R = -0.982 f o r 5 o f 8 d a t a p o i n t s )
where F' = B(eqn. 4 ) x (Alp03 + FeO)
1 8 7
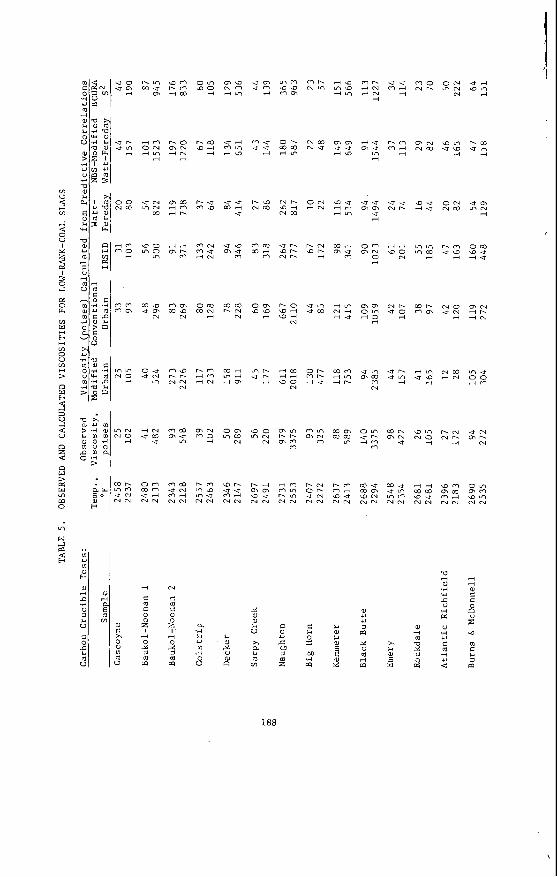
o m I O 0 rl
r . m 1 0 4 4
r.u -10
m r . N m
N w N u
O N i N
i 1 0 mIO r l m
m m u u 410
10.3 4 3 3 m
m r . 3 N 3 N
3
74.3
m rl m u
-3-3
U 4 m m
O N m N N
\ o m -10 rl
O N N m
i m r.0
r i m 4 N d r l
O N m N
m W
m el
0 U I
2 a
7 el a 0 w.
Lo W +- €- H
Lo 0 0
m I-
> 0 W €-
3 5 c! 2 U
n z 4
n W > a W m rn 0
m
W el m 3
100 rlrl m o m r -
m m
m a m m u m m a
N N
m N m u 3 N
o m CON i
P-m i m 4 f N
-3a m
m u
a m r . N
N
m i d m m i
m m m
m i
o m IOIO
rl
m P - ur. 3
Ur. IO- Nr.
r.0 a i a i N
r l m 4 4 100 N
m i m
m u
i m Nr- rlu
m m r l m dP-
o m m N 0 3
m m o m i o rl
u m m m m N
4 4 I O 0 N
Nr.
-30 rl
ur. u m rl
m m m m i
m r . m a
r l m u10 3
o m IOu 4-3
m a rlr. A N
m u 0 0 r l m
o u m a u N P-c
m N N N
m r . o m m m ~ - m or. r.rl r l m P I N r . m m u m u i d a m o m m m urn m a u u m m m m or- m 4 w m u m w m m w m m url m i m u m r l 1 0 0 r .0 u~ m u O N m m I O U m d \ o m N N N N N N N N N N N N N N N N N N N N N N N N N N
Lo 1; W h o 10
N
C e 0 4
i 0 3
m m
3 @J
!- V
h a Y m m
a .rl k U
m rl
0 U
C k 0
M .rl
I .- m
188
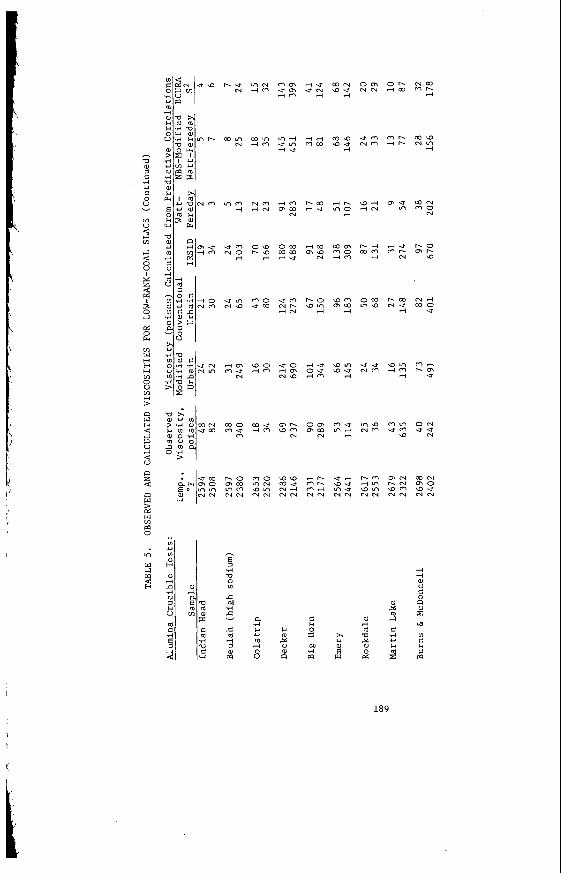
m m N
m m rl
m m 4 0
N m r l N
m r l urn 4.2
r l m N
m m
rlrl m m
r - m r lu
mID m u rl
rlr. m o rl
u m N m
ID4 r l N
m r - Fir-
m u m
d m o o u o rlu \ o r n - s u \ D m -4 m u r l m r l m o u m u ~m 4 - p - m
N N I D r l m rl 4 - 3
m o m u m r - o m m u m a m m O N m u r l m a m m m m r l N ? ? u m u u
m N N r l I D N
r -o m o \ D O rlr. url r - m m m m a m m r n ~ 00.3 O r - ID< r l r n r . N OIO m m ID0 N r l m r l rnu IDrn I D m IDu N N N N N N N N N N N N N N N N
189
Low-Sil ica S l a g s :
b = -1.8244(103m) + 0.9416 (R = -0.999 f o r 6 of 10 d a t a p o i n t s )
103m = -55.3649F" + 37.9186 (R = -0.970 f o r 7 of 10 d a t a p o i n t s )
where F" = CaO/(CaO + MgO + Na2O + K p O ) , mole f r a c t i o n s .
The n a t u r e o f t h e "F" terms i n t h e modif ied Urbain c o r r e l a t i o n s is of i n t e r e s t . Urbain c a t e g o r i z e s t h e c o n s t i t u e n t s o f s i l i c a t e me l t s as " g l a s s formers" (SiOp, P205) , "modif iers" (CaO, MgO, Na20, Kp0) and "amphoter ics" (AlpO3, Fe2O3) which can a c t e i t h e r a s g l a s s fo rmers or m o d i f i e r s . The c o r r e l a t i n g t e r n f o r h i g h - s i l i c a s l a g s is t h e r a t i o o f S i02 t o m o d i f i e r s , s u g g e s t i n g t h a t , for t h e s e s l a g s , t h e s i l i c a c o n t e n t of t h e s l a g is t h e dominat ing f a c t o r . On t h e o t h e r hand, fo r low- s i l i c a s l a g s t h e c o r r e l a t i n g term is t h e r a t i o of CaO t o m o d i f i e r s , which impl i e s t h a t t h e amount of CaO r e l a t i v e t o t o t a l m o d i f i e r s i n t h e s l a g i s a c r i t i c a l f a c t o r . For i n t e r m e d i a t e - s i l i c a s l a g s , t h e c o r r e l a t i n g term i n v o l v e s t h e "ampho te r i c s , " s u g g e s t i n g t h a t t h e r o l e o f these c o n s t i t u e n t s becomes more important when t h e n a t u r e of t h e s l a g canno t be well d e f i n e d by i ts s i l i c a c o n t e n t .
SUMMARY AND FUTURE WORK --- Data from 23 low-rank c o a l s l a g v i s c o s i t y d e t e r m i n a t i o n s have been employed i n
a t t e m p t s t o c o r r e l a t e t h e l i n e a r p o r t i o n of t h e log v i s c o s i t y v s . t empera tu re curve wi th f i v e publ ished e m p i r i c a l c o r r e l a t i o n s fo r s i l i c a t e s l a g s . Of t h e s e f i v e co r re - l a t i o n s , one developed by Urbain fo r m e t a l l u r g i c a l s l a g s appeared to g i v e a reason- a b l e f i t t o t h e expe r imen ta l d a t a f o r n e a r l y two- th i rds o f t h e v i s c o s i t y t e s t s . When t h e s l a g s were subd iv ided i n t o t h r e e g roups , based on a parameter o f t h e Urbain e q u a t i o n t h a t is roughly p r o p o r t i o n a l t o s i l i c a c o n t e n t , it was p o s s i b l e t o d e r i v e modiEied forms o f t h e Urbain e q u a t i o n t h a t gave a c c e p t a b l e c o r r e l a t i o n s ( w i t h i n 30 p e r c e n t ) f o r I1 of t h e v i s c o s i t y t e s t s . Of t h e r ema in ing 12 t e s t s , t h e modif ied c o r r e l a t i o n s were m a r g i n a l l y a c c e p t a b l e ( w i t h i n 6 0 p e r c e n t ) i n f i v e c a s e s .
E f f o r t s a r e s t i l l be ing made t o r e f i n e t h e s e e m p i r i c a l c o r r e l a t i o n s and, i n p a r t i c u l a r , t o unde r s t and t h e r e a s o n s why c e r t a i n s l a g s f a i l to f i t t h e c o r r e l a - t i o n s . The u l t i m a t e o b j e c t i v e i s t o i n t e r p r e t s l a g r h e o l o g i c a l behav io r i n terms o f s p e c i f i c phases p r e s e n t i n t h e s l a g , t o t h e e x t e n t t h a t such phases can be i d e n t i - f i e d and q u a n t i f i e d .
ACKNOWLEDGS3
Th i s work was conducted wi th t h e s p o n s o r s h i p of t h e U. S . Department o f Energy under Contract No. DE-AC18-80FC10159. The a u t h o r s wish t o acknowledge t h e v a l u a b l e a s s i s t a n c e of S. Benson, D. R i n d t , and A. Severson (GFETC) i n o b t a i n i n g t h e a n a l y t - i c a l d a t a , and o f L. Delaney, T. Kuhlman, and C. Matone (BCR) i n conduc t ing t h e s l a g v i s c o s i t y measurements. Thanks a r e a l s o due t o J . Waldron o f Commonwealth Edison f o r p rov id ing t h e Black Bu t t e c o a l sample, and to Dr. K. Mills o f t h e B r i t i s h N a t i o n a l Phys ica l Labora to ry f o r f u r n i s h i n g in fo rma t ion on t h e IRSID and Urbain c o r r e l a t i o n s .
REFERENCES
1. Watt, J. D . and F. Fe reday , "The f low p r o p e r t i e s o f s l a g s formed from t h e a s h e s o f B r i t i s h c o a l s : P a r t 2 . The c r y s t a l l i z i n g behav iour of t h e s l a g s , " J . I n s t . Fuel 5, 131-4 (1969) .
Ba r r i ck , S. M. and G. F. Moore, "Empi r i ca l c o r r e l a t i o n o f c o a l a sh v i s c o s i t y wi th a sh chemical compos i t ion , " ASME Paper No. 76-Wa/Fu-3 (1976) .
2 .
190
\ I\
3. Hoy, H. R . , A. G. R o b e r t s , and D . M. Wilk ins , "Behavior o f mine ra l m a t t e r i n s l a g g i n g g a s i f i c a t i o n p r o c e s s e s , " P u b l i c a t i o n 672, I n s t n . Gas Engrs., NOV.
1964. 24 pp.
D ieh l , E. K . , " V i s c o s i t y of low-rank c o a l s l a g s , " p r o c . Low Rank Coal Technol- ogy Development Workshop, San Antonio, TX, June 1981. pp. 5-29 t o 5-32.
Watt , J . D . and F. Fereday, "The f low p r o p e r t i e s o f s l a g s formed from t h e ashes o f B r i t i s h c o a l s : P a r t 1. V i s c o s i t y o f homogeneous l i q u i d s l a g s i n r e l a t i o n t o s l a g compos i t ion , " J . I n s t . Fuel 42_, 99-103 (1969). Given, P. H . , D . Weldon and N. Suhr , " I n v e s t i g a t i o n of t h e d i s t r i b u t i o n o f m i n e r a l s i n c o a l s by normative a n a l y s i s , " The Pennsy lvan ia S t a t e U n i v e r s i t y ; u. S. DOE Report FE-2494-TR-2, Jan . 1980.
F r e d e r i k s e , H. P. R . , T . Negas, and S . J. Schne ide r , "Development, t e s t i n g , and e v a l u a t i o n of MHD m a t e r i a l s ," Cont rac t No. E(49-18)-1230, NBS Q u a r t e r l y Repor t s , Nos. I , 2, 3, 4 (1974) and 5 (1975).
Riboud, P . V., Y . Roux. L.-D. Lucas, and H. Gaye, "Improvement of c o n t i n u o u s c a s t i n g powdeis ," F a c h b e r i c h t e H u t t e n p r a x i s Meiai l w e i t e r v e r a r b e i t u n g 2 ( l o ) , 859-66 (1981 1 .
Urbain, G., F. Cambier, M. D e l e t t e r , and M . R. Anseau, " V i s c o s i t y of s i l i c a t e m e l t s , " T rans . J . B r . Ceram. SOC. so, 139-41 (1981).
19 1
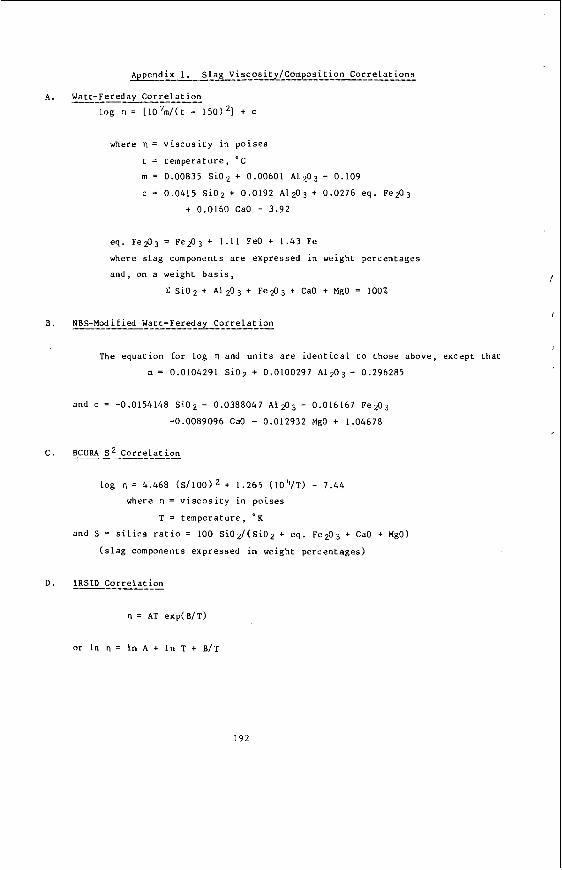
Appendix 1 . S l a g V i s c o s i t y / C o m p o s i t i o n C o r r e l a t i o n s
A . Watt-Fereday C o r r e l a t i o n -_-- __ log n = [107m/( t - 150)'l + c
where 1 1 = v i s c o s i t y i n p o i s e s
t = t e m p e r a t u r e , 'c m = 0.00835 SiOz + 0.00601 AI 203 - 0.109
c = 0.0415 S i 0 2 + 0.0192 A1203 + 0.0276 e q . Fez03
+ 0.0160 CaO - 3.92
eq . F e 9 3 = Fe203 + 1.11 FeO + 1.43 Fe
where s lag components a r e expressed in weight p e r c e n t a g e s
and , on a weight b a s i s ,
X S i 0 2 + A1 $ 3 + F e f l 3 + CaO + MgO = 100%
I 8 . NBS-Modified Watt-Fereday C o r r e l a t i o n
i The e q u a t i o n for log n and u n i t s are i d e n t i c a l t o t h o s e above, except t h a t
m = 0.0104291 S i 0 2 + 0.0100297 A1203 - 0.296285
and c = -0.0154148 S i 0 2 - 0.0388047 A1203 - 0.016167 Fe200g
-0.0089096 CaO - 0.012932 MgO + 1.04678
Log r\ = 4.468 (S /100)2 + 1.265 ( 1 0 4 / T ) - 7.44
where II = v i s c o s i t y i n p o i s e s
T = t e m p e r a t u r e , O K
and S = s i l i c a r a t i o = 100 SiO2/(SiO;! + eq . Fez03 + CaO + MgO)
(slag components e x p r e s s e d i n weight p e r c e n t a g e s )
D . IRSID C o r r e l a t i o n
n = AT exp(B/T)
or I n q = In A + l n T + BIT
192
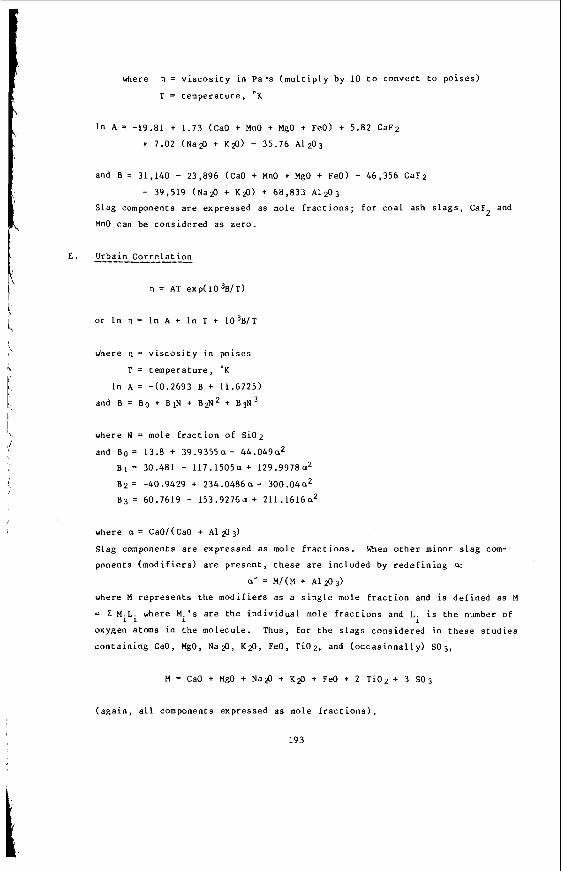
G
where 17 = v i s c o s i t y i n Pa ' s ( m u l t i p l y by 10 t o conve r t t o p o i s e s )
T = t e m p e r a t u r e , 'K
I n A = -19.81 + 1.73 (CaO + MnO + MgO + FeO) + 5.82 CaF2
+ 7.02 ( N a p + K $ ) - 35.76 At203
and B = 31,140 - 23,896 (CaO + MnO + MgO + FeO) - 46,356 CaF2
- 39,519 ( N a p + K f l ) + 68,833 A1203
S lag components a r e expres sed a s mole f r a c t i o n s ; f o r c o a l ash s l a g s , CaF and
MnO can be cons ide red a s ze ro . 2
E . Urbain C o r r e l a t i o n
rl = AT exp(103B/T)
or In = I n A + I n T + ~ O ~ B / T
where 11 = v i s c o s i t y i n po i ses
T = t empera tu re , 'K
I n A = - (0 .2693 B + 11.6725)
and B = B o + B1N + B 2 N 2 + B3N3
where N = mole f r a c t i o n o f S i 0 2
and B o = 13.8 + 3 9 . 9 3 5 5 ~ - 44 .049a2
B 1 = 30.481 - 117.1505a + 1 2 9 . 9 9 7 8 ~ ~
B p = -40.9429 + 234.0486a - 300.04a2
B3 = 60.7619 - 153.9276~1 + 211.1616a2
where u = CaO/(CaO + A 1 $ 3 )
Slag components a r e expres sed a s mole f r a c t i o n s . When o t h e r minor s l a g com-
ponents ( m o d i f i e r s ) a r e p r e s e n t , t h e s e a r e inc luded by r e d e f i n i n g a
ac = M / ( M + ~l 9 3 )
where M r e p r e s e n t s t h e m o d i f i e r s a s a s i n g l e mote f r a c t i o n and is d e f i n e d a s M
= L M.L. where M . ' s a r e t h e i n d i v i d u a l mole f r a c t i o n s and L . i s t h e number of
oxygen atoms i n t h e molecule . Thus, for t h e s l a g s cons ide red i n t h e s e s t u d i e s
c o n t a i n i n g CaO, MgO, Na$, K f l , FeO, T i O 2 , and ( o c c a s i o n a l l y ) SO3,
1 1
M = CaO + MgO + N a p + K&I + FeO + 2 T i 0 2 + 3 S O 3
( a g a i n , a l l components expressed a s mole f r a c t i o n s ) .
19 3
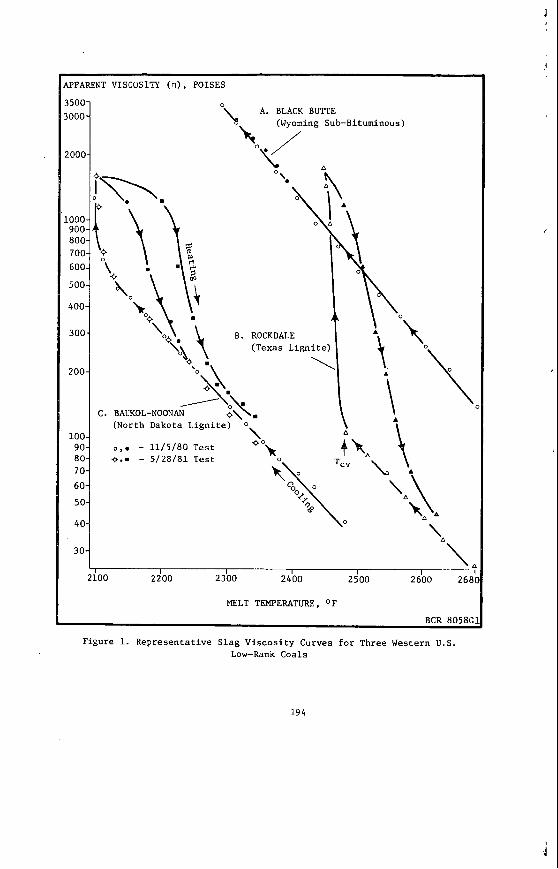
SPARENT VISCUSITY (n), POISES
A. BLACK BUTTE (Wyoming Sub-Bituminous)
A
MELT TEMPERATURE, OF
BCR 8058G
Figure 1. Representative Slag Viscosity Curves f o r Three Western U . S . Low-Rank Coals
1 9 4
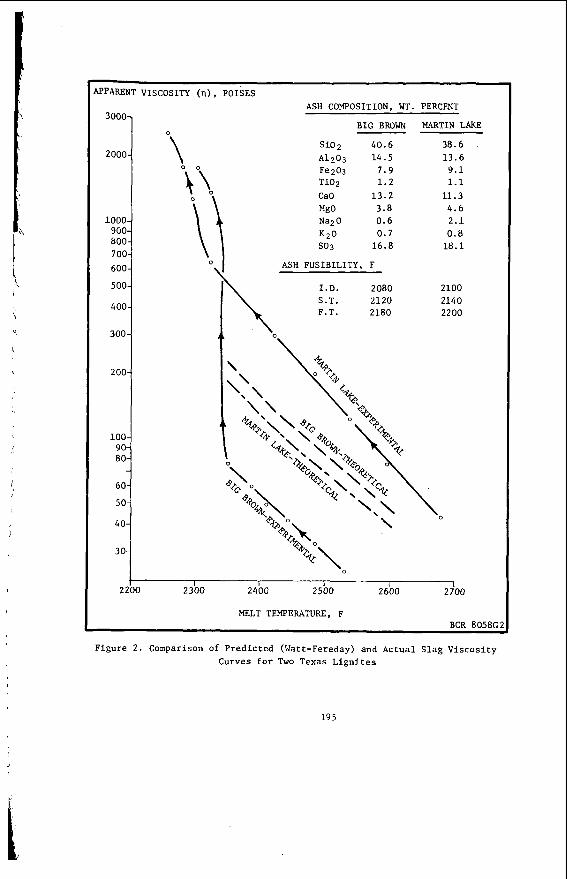
\
I
',
/
PARENT VISCOSITY (n), POISES
3000
200c
1000 9GC 80C 70C 60C
50C
40C
300
200
100 90 80
60
50
40
30
2.
ASH COMPOSITION, WT. PERCENT
BIG BROWN MARTIN LAKE
Si02 40.6 38.6 . Alp03 14.5 13.6 FepO3 7.9 9.1 Ti02 1.2 1.1 CaO 13.2 11.3 M%O 3.8 4.6 Na2 0 0.6 2.1 K 2 0 0.7 0.8 so3 16.8 18.1
ASH FUSIBILITY, F
I . D . 2080 2100 S.T. 2120 2140 F.T. 2180 2200
1 1 - ~~
1 23b0 24b0 25b0 2600 2700
MELT TEMPERATURE, F BCR 8058G2
Figure 2. Comparison o f Predicted (Watt-Fereday) and Actual Slag Viscosity Curves for Two Texas Lignites
19 5
MECHANISTIC STUDIES ON THE HYDROLIQUEFACTION OF VICTORIAN BROWN COAL AND OF COAL DERIVED PRODUCTS
F.P. Larkins*, W.R. Jackson, P.A. Hertan, P.J. Cassidy, M. Marshal l and D. Rash
Department of Chemistry, Monash Univers i ty , Clayton, V i c t o r i a , A u s t r a l i a 3168.
In t roduct ion
The o v e r a l l a i m of our r e c e n t s t u d i e s has been t o o b t a i n a more complete under- s t a n d i n g of t h e mechanisms f o r t h e p r i n c i p a l r e a c t i o n s which occur dur ing t h e c a t a l y s e d hydro l iquefac t ion of low rank , high oxygen conta in ing (ca. 25 w t % db) c o a l s . The r e s u l t s of 70 m l ba tch a u t o c l a v e s t u d i e s wi th and wi thout added c a t a l y s t s on V i c t o r i a n brown c o a l , on a number of d i f f e r e n t c o a l der ived products and on r e l a t e d model e t h e r compounds are d iscussed h e r e i n . of var ious a s p e c t s of t h i s work may b e found elsewhere (1-6). On t h e b a s i s of these i n v e s t i g a t i o n s a mechanism is proposed f o r t h e hydro l iquefac t ion process which emphasises t h e r o l e of c a t a l y s t s i n i n h i b i t i n g repolymer isa t ion r e a c t i o n s , t h e s i g n i f i c a n c e of i n t e r c o n v e r t i b i l i t y of c o a l der ived products and t h e importance of hydrogen donat ion from molecular hydrogen and t h e v e h i c l e t e t r a l i n .
Experimental
- Coals: Morwell seam w e r e used i n these experiments G., Drum 66 (1976 l O O t bulk sample) and Drum 289 (1979 l O O t bulk sample) . The chemical c h a r a c t e r i s t i c s of t h e c o a l s on a weight p e r c e n t d m f b a s i s are as fo l lows: Drum 66, C 69.3, H 5 . 0 , 0 (by d i f f . ) 24.5, N 0 . 6 , S 0.6. kg-1 d m f c o a l . Acidic 0 9.6 no1 kg-l d m f c o a l , non-acidic 0 5 . 3 mol kg-I d m f coa l . composition is t h e r e f o r e similar t o t h a t of a North Dakota l i g n i t e .
Elore complete d e t a i l s
Two samples of d r i e d (105OC, under Ng) Victor ian brown coa ls f r o n t h e
Acid ic 0 9 .7 mol k g - l d m f c o a l non-acidic 0 5.6 mol Drum 289, C 69.2, H 4.8, 0 (by d i f f . ) 25 2 , N 0.52, S 0.25.
The elemental
The coa ls (< 250 pm) were hydrogenated i n a 70 m l rocking au toc lave us ing a 1:l s l u r r y of t e t r a l i n : c o a l a t i n i t i a l hydrogen p r e s s u r e s of 1-10 mPa f o r 1 hour a t a r e a c t i o n temperature of 385OC. 345 - 46OoC were used a t 6 mF'a p r e s s u r e . systems were examined.
I n r e l a t e d s t u d i e s temperatures i n t h e range Both i r o n and tin-based c a t a l y s t
For the work repor ted h e r e i n t h e c a t a l y s t s were incorpora ted by t h e ion exchange technique (1) . I n o t h e r s t u d i e s we have shown t h a t impregnation us ing s o l u b l e metal s a l t s is a s e f f e c t i v e i n achiev ing a comparable l e v e l of c a t a l y t i c a c t i v i t y .
The products from t h e s e hydrogenat ions were separa ted i n t o gases (analysed by g . c . ) , water (analysed by a z e o t r o p i c d i s t i l l a t i o n ) , i n s o l u b l e s (CHZC12 i n s o l u b l e s ) , asphal tene (CHzC12 soluble/X4 i n s o l u b l e ) , o i l s (CH2C12 soluble/X4 s o l u b l e ) . Hydrogen t r a n s f e r r e d from t h e donor so lvent was determined by g.1.c . a n a l y s i s of t h e r a t i o of t e t r a l i n t o naphthalene i n t h e t o t a l hydrocarbon l i q u i d product .
Coal der ived m a t e r i a l s : r e a c t o r un i t (7) a s o i l s (X4 s o l u b l e ) a s p h a l t e n e s ( t e t r a l i n soluble/X4 i n s o l u b l e ) a s p h a l t o l s ( t e t r a l i n insolubles/tetrahydrofuran (THF) s o l u b l e s ) and THF i n s o l u b l e rka te r ia l s f o r subsequent r e a c t i v i t y s t u d i e s . Methylene c h l o r i d e was not used i n
These products were obta ined from our 1 kg h - l cont inuous
* Now a t Department of Chemistry, t h e U n i v e r s i t y of Tasmania, Hobart , Tasmania, A u s t r a l i a 7001.
196
\ the separation because of concern for its potential catalyst deactivation role in the subsequent series of experiments to be undertaken. Experimental continuous reactor conditions were a 3 : l slurry of tetra1in:coal to which an iron (278 t 30
had been added. 10 MPa and a residence time from 15 to 40 minutes.
\ m o l kg-' dc from FeS04.7H20) and tin (20 mmol kg-' dc from SnC12.2H20) catalyst The reaction temperature was 4OO0C with a developed pressure of
Samples of each of the coal derived materials were reacted separately in the Presence of several catalysts in a 70 ml batch autoclave using a 1:1 slurry of tetra1in:material at 425OC with an initial hydrogen pressure of 6 mPa for 1 h at reaction temperature. Oils, asphaltenes, asphaltols and THF insolubles.
Model ether systems: elucidation of the role of the iron and tin catalyst systems investigated. Hydrogenation conditions were 1-2 g ether, initial hydrogen pressure 6 mPa, reac- tion time 1 h with catalyst loadings similar to those used for coal hydroliquefac- tion studies. Full details are outlined elsewhere ( 2 , 5 ) .
Results
Reactions with coal
The products from these reactions were separated into
A series of ethers have been examined to assist in the
Total conversion yields for the temperature range 345-460°C at 6 mF'a hydrogen are summarized in figure 1. Absolute conversions are lower than for work with 1 L autoclaves and the continuous reactor unit because of different reactor temperature profiles and residence time; however, the qualitative conclusions are consistent. The effect of increasing the reaction temperature was to increase the total conversion of all reactions irrespective of the catalyst system.
The iron-tin catalyst system was the most temperature sensitive of the four coal-catalyst systems studied. Unlike the iron and tin treated coals which were only sensitive to temperature in the range 365-405OC, the iron-tin treated coal was also sensitive to temperature in the range 385O-425OC where the conversion rapidly increased from 66% to 85% (daf coal). Thus the iron-tin system was most efficient at the higher reaction temperatures up to 425OC while the iron and tin treated coals were most effective up to 405OC (see Table 1, reference 2 ) .
The initial hydrogen pressure dependent conversion results in the range 1-10 mPa are given in figure 2 for studies at 385OC. The tin catalysed reactions show most pressure dependence, consistent with previous findings that tin facilit- ates molecular hydrogen transfer during hydrogenation ( 4 ) . For the untreated coal and for other catalyst systems there is only a small pressure dependence of product yields beyond 4 mPa.
,
A detailed study of the chemical constitution of the products revealed that their composition is influenced by temperature but not by pressure or the nature of the catalyst. With increased reaction temperature there was a decrease in total and acidic oxygen concentrations in the asphaltenes and a corresponding increase in both aromatic content and C / H ratio. This observation is consistent with the l o s s of aliphatic side chains from the polycondensed ring systems
Reactions with coal derived products
Hydrogenation studies were undertaken on the parent iron-tin treated coal (Drum 289) as well as the THF insolubles, asphaltol, asphaltene and oil derived from a continuous reactor run as previously discussed. catalyst added (case A) and with the addition of a sulphided nickel molybdate catalyst supported on alumina (case B) were performed. in table 1. coal or the THF insolubles beyond that for case A because sufficient amounts of
Studies with no additional
The results are presented The Ni/Mo catalyst in case B did not increase the conversion of the
19 7
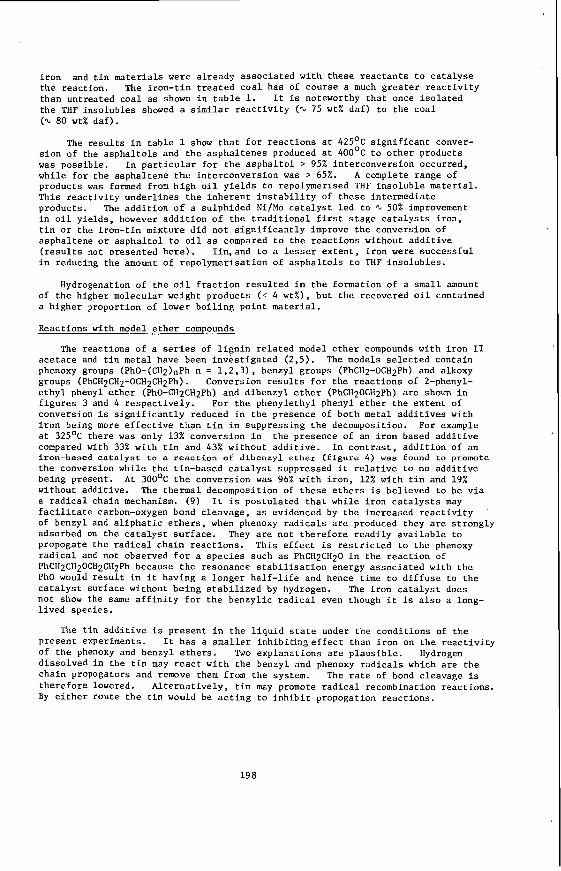
iron the reaction. than untreated coal as shown in table 1. It is noteworthy that once isolated the THF insolubles showed a similar reactivity (% 75 wt% daf) to the coal (% 80 wt% daf).
and tin materials were already associated with these reactants to catalyse The iron-tin treated coal has of course a much greater reactivity
The results in table 1 show that for reactions at 425OC significant conver- sion of the asphaltols and the asphaltenes produced at 4OO0C to other products was possible. while for the asphaltene the interconversion was > 65%. products was formed from high oil yields t o repolymerised THF insoluble material. This reactivity underlines the inherent instability of these intermediate products. in oil yields, however addition of the traditional first stage catalysts iron, tin or the iron-tin mixture did not significantly improve the conversion of asphaltene or asphaltol to oil as compared to the reactions without additive (results not Dresented here). Tin,and to a lesser extent, iron were successful in reducing the amount of repolymerisation of asphaltols to THF insolubles.
In particular for the asphaltol > 95% interconversion occurred, A complete range of
The addition of a sulphided Ni/Mo catalyst led to % 50% improvement
Hydrogenation of the oil fraction resulted in the formation of a small amount of the higher molecular weight products (< 4 wt%), but the recovered oil contained a higher proportion of lower boiling point material.
Reactions with model ether compounds
The reactions of a series of lignin related model ether compounds with iron I1 acetate and tin metal have been investigated (2,5). The models selected contain phenoxy groups (PhO-(CHz)nPh n = 1,2,3), benzyl groups (PhCH2-OCHzPh) and alkoxy groups (PhCH2CH2-OCHzCHzPh). Conversion results for the reactions of Z-phenyl- ethyl phenyl ether (PhO-CH2CHzPh) and dibenzyl ether (PhCH20CH2Ph) are shown in figures 3 and 4 respectively. For the phenylethyl phenyl ether the extent of conversion is significantly reduced in the presence of both metal additives with iron being more effective than tin in suppressing the decomposition. For example at 325OC there was only 13% conversion in the presence of an iron based additive compared with 33% with tin and 43% without additive. In contrast, addition of an iron-bascd catalyst to a reaction of dibenzyl ether (figure 4 ) w a s found to promote the conversion while the tin-based catalyst suppressed it relative to no additive being present. At 3OO0C the conversion was 96% with iron, 12% with tin and 19% without additive. a radical chain mechanism. (9) facilitate carbon-oxygen bond cleavage, as evidenced by the increased reactivity of benzyl and aliphatic ethers, when phenoxy radicals are produced they are strongly adsorbed on the catalyst surface. propogate the radical chain reactions. This effect is restricted to the phenoxy radical and not observed for a species such as PhCHzCHzO in the reaction of PhCH2CHzOCHzCH2Ph because the resonance stabilisation energy associated with the PhO would result in it having a longer half-life and hence time to diffuse to the catalyst surface without being stabilized by hydrogen. not show the same affinity for the benzylic radical even though it is also a long- lived species.
The thermal decomposition of these ethers is believed to be via It is postulated that while iron catalysts may
They are not therefore readily available to
The iron catalyst does
The tin additive is present in the liquid state under the conditions of the present experiments. of the phenoxy and benzyl ethers. dissolved in the tin may react with the benzyl and phenoxy radicals which are the chain propogators and remove them from the system. The rate of bond cleavage is therefore lowered. Alternatively, tin may promote radical recombination reactions. By either route the tin would be acting to inhibit propogation reactions.
It has a smaller inhibiting effect than iron on the reactivity Two explanations are plausible. Hydrogen
19 8
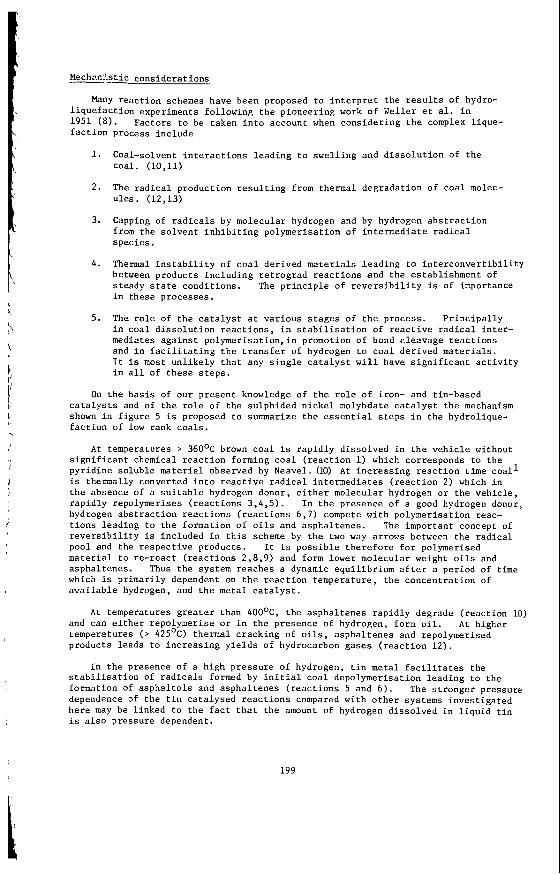
Mechai+tic considerations
Many reaction schemes have been proposed to interpret the results of hydro- liquefaction experiments following the pioneering work of Weller et al. in 1951 (8). faction process include
Factors to be taken into account when considering the complex lique-
1.
2 .
3.
4.
5.
Coal-solvent interactions leading to swelling and dissolution of the coal. (10,ll)
The radical production resulting from thermal degradation of coal molec- ules. (12,13)
Capping of radicals by molecular hydrogen and by hydrogen abstraction from the solvent inhibiting polymerisation of intermediate radical species.
Thermal instability of coal derived materials leading to interconvertibility between products including retrograd reactions and the establishment of steady state conditions. The principle of reversibility is of importance in these processes.
The role of the catalyst at various stages of the process. Principally in coal dissolution reactions, in stabilisation of reactive radical inter- mediates against polymerisation,in promotion of bond cleavage reactions and in facilitating the transfer of hydrogen to coal derived materials. It is most unlikely that any single catalyst will have significant activity in all of these steps.
On the basis of our present knowledge of the role of iron- and tin-based catalysts and of the role of the sulphided nickel molybdate catalyst the mechanism shown in figure 5 is proposed to summarize the essential steps in the hydrolique- faction of low rank coals.
At temperatures > 36OoC brown coal is rapidly dissolved in the vehicle without significant chemical reaction forming coal (reaction 1) which corresponds to the pyridine soluble material observed by Neavel. (lo) At increasing reaction time coal' is thermally converted into reactive radical intermediates (reaction 2) which in the absence of a suitable hydrogen donor, either molecular hydrogen or the vehicle, rapidly repolymerises (reactions 3,4,5). hydrogen abstraction reactions (reactions 6,7) compete with polymerisation reac- tions leading to the formation of oils and asphaltenes. The important concept of reversibility is included in this scheme by the two way arrows between the radical pool and the respective products. It is possible therefore for polymerised material to re-react (reactions 2,8,9) and form lower molecular weight oils and asphaltenes. Thus the system reaches a dynamic equilibrium after a period of time which is primarily dependent on the reaction temperature, the concentration of available hydrogen, and the metal catalyst.
At temperatures greater than 4OO0C, the asphaltenes rapidly degrade (reaction 10)
In the presence of a good hydrogen donor,
and can either repolymerise or in the presence of hydrogen, form oil. temperatures (> 425OC) thermal cracking of oils, asphaltenes and repolymerised products leads to increasing yields of hydrocarbon gases (reaction 12).
At higher
In the presence of a high pressure of hydrogen, tin metal facilitates the stabilisation of radicals formed by initial coal depolymerisation leading to the formation of asphaltols and asphaltenes (reactions 5 and 6). dependence of the tin catalysed reactions compared with other systems investigated here may be linked to the fact that the amount of hydrogen dissolved in liquid tin is also pressure dependent.
The stronger pressure
199
I
In the absence of tin less asphaltene is produced which.manifests itself as increased yields of THF insolbules and asphaltols. iron is not completely certain as no effects have been observed on the reactions of the coal derived products. the reactions of some ethers while suppressing propogation reactions of phenoxy radicals suggest that its major activity is probably restricted to the first minutes of reaction (reactions 1,2) and to the slow catalytic degradation of polymerised material. action between the catalytic and radical stabilisation activities of iron with the hydrogen utilisation and radical stabilisation activities of tin which allows the radical intermediates to be stabilised as oil and asphaltene.
At this time the activity of
However the proven ability of iron to both catalyse
The iron-tin synergism can be interpreted as a co-operative
The conversion of asphaltene to oil is not catalysed by either iron or tin but it is facilitated by increased reaction temperature and the availability of a good H-donor solvent. contains much less oxygen (especially acidic oxygen) and the conversion probably is the result of the loss of polar phenolic groups as well as cleavage of carbon- carbon bonds joining aromatic clusters together. Vernon (14) has shown that dibenzyl thermally decomposes above 40OoC.
The resulting oil formed at high temperatures (> 40OoC)
Formation of hydrocarbon gases principally results from thermal cracking although tin catalyses the formation of methane at temperatures > 425OC. Weller(15) has also shown that tin I1 chloride catalyses the formation of methane in the reaction of 1-methylnaphthalene with hydrogen.
The action of sulphided Ni/Mo catalyst was to dramatically increase the yield of oil from the reactions of asphalt01 and asphaltenes. It is believed that the mechanism of the Ni/Mo catalyst involves a more conventional dissociative adsorption of both hydrogen and reactant molecule to the catalyst surface followed by hydrogenolysis and hydrogenation reactions. from both iron and tin and is shown in figure 5 by reactions 13 and 14.
Acknowledgements
The mechanistic pathway thus differs
Financial support for this work was provided by the Victorian Brown Coal Council and the Australian Government Department of iJational Development and Energy under the National Energy, Research, Development and Demonstration Program. The view expressed herein are entirely those of the authors.
REFERENCES
1.
2 .
3.
4 .
5 .
6 .
7.
Marshall, M., Jackson, W.R., Larkins, F.P., Hatswell, M.R., and Rash, D. Fuel 61, 121 (1982).
Cassidy, P.J., Hertan, P.A., Jackson, W.R., Larkins, F.P., and Rash, D. Fuelg, 939 (1982).
Hatswell, M.R., Jackson, W.R., Larkins, F.P., Marshall, M., Rash, D., and Rogers, D.E. Fuel 62 (in press) (1983).
Cochran, S . J . , Hatswell, M., Jackson, W.R., and Larkins, F.P. Fuel 61. 831 (1982).
Cassidy, -P.J., Jackson, W.R., and Larkins, F.P. submitted to Fuel (1983).
Hertan, P.A., Jackson, W.R.; and Larkins, F.P. submitted to Fuel (1983).
Agnew, J.B., Hoad, W.G., Prasad, G.N., Rash, D. and Rogers, D.E., submitted to Fuel (1983); Rogers, D.E., Thewlis, P., and White, R. submitted to Fuel (1983).
Agnew, J.B., Jackson, W.R., Larkins, F.P., Rash, D.,
200
\ I
8. Weller, S . , Clark, E.L. , and P e l i p e t z , M.G., Ind. Eng. Chem. 9, 334 (1950)
I
[/
9. Schlosberg, R.H., Ashe, T.R. , P a r i c i r o i e , R.J., and Donaldson, M . , Fue l 60, 155 (1981).
10. Neavel, R.C., Coal Science 1, 1 (1982).
11. Whitehurst , D.D. and Mi tche l l , T . O . , Am. Chem. SOC. (Div. Fuel Chem.) P r e p r i n t s 6 ( 2 ) , 173 (1981).
12 . Curran, G.P., S t ruck , R.T. and Goun, F., Ind. Eng. Chen. Proc. Des. Dev. 5, 166 (1967).
13. Grandey, D.W., and P e t r a k i s , Fuel 58, 239 (1979).
1 4 . Vernon, L.W., Fuel 59, 102 (1980).
15. Weller, S . , personal communication.
201
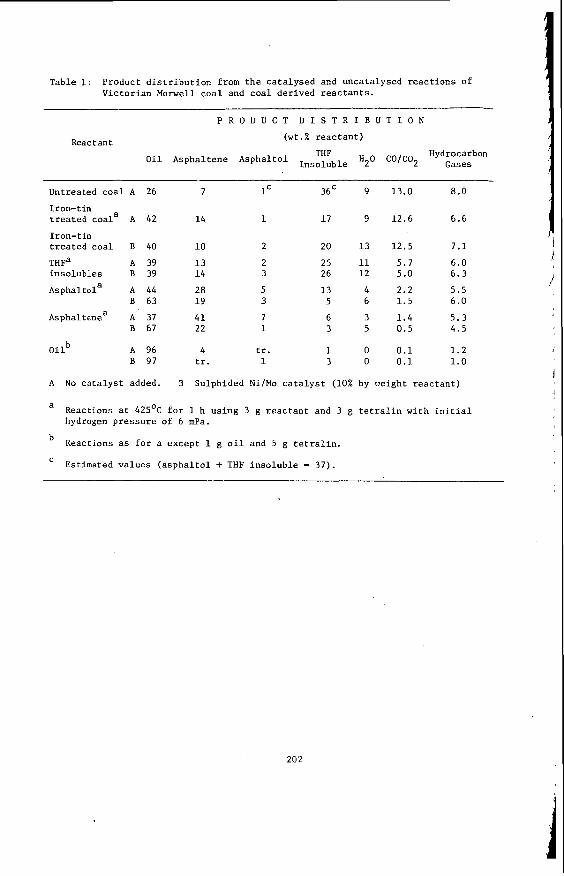
Table 1: Product d i s t r i b u t i o n from t h e c a t a l y s e d and uncatalysed r e a c t i o n s of V i c t o r i a n Morwell c o a l and c o a l der ived r e a c t a n t s .
___.-_
P R O D U C T D I S T R I B U T I O N
(wt.% r e a c t a n t ) Reactant THF H20 co,co2 Hydrocarbon
Gases O i l Asphal tene Asphal t01 Insoluble
Untreated c o a l A 26 7 1 C 36' 9 13.0 8.0
Iron- t i n t r e a t e d coala A 42 1 4 1 17 9 12.6 6 .6
I ron- t i n t r e a t e d c o a l B 40 10 2 20 1 3 12.5 7.1
T H F ~ A 39 1 3 2 25 11 5.7 6.0 i n s o l u b l e s B 39 14 3 26 1 2 5.0 6 .3
Asphal tola A 44 28 5 1 3 4 2 .2 5 .5
Asphaltenea A 37 4 1 7 6 3 1.4 5 .3
B 63 19 3 5 6 1 .5 6.0
8 67 22 1 3 5 0.5 4.5
A 96 4 tr. 1 0 0 .1 1 . 2 B 97 tr. 1 3 0 0 . 1 1 . 0
b O i l
A No c a t a l y s t added. B Sulphided Ni/Mo c a t a l y s t (10% by weight r e a c t a n t )
a Reactions a t 425OC f o r 1 h us ing 3 g r e a c t a n t and 3 g t e t r a l i n wi th i n i t i a l hydrogen p r e s s u r e of 6 mPa.
Reactions as f o r a except 1 g o i l and 5 g t e t r a l i n .
Estimated v a l u e s ( a s p h a l t 0 1 + THF i n s o l u b l e = 37).
202
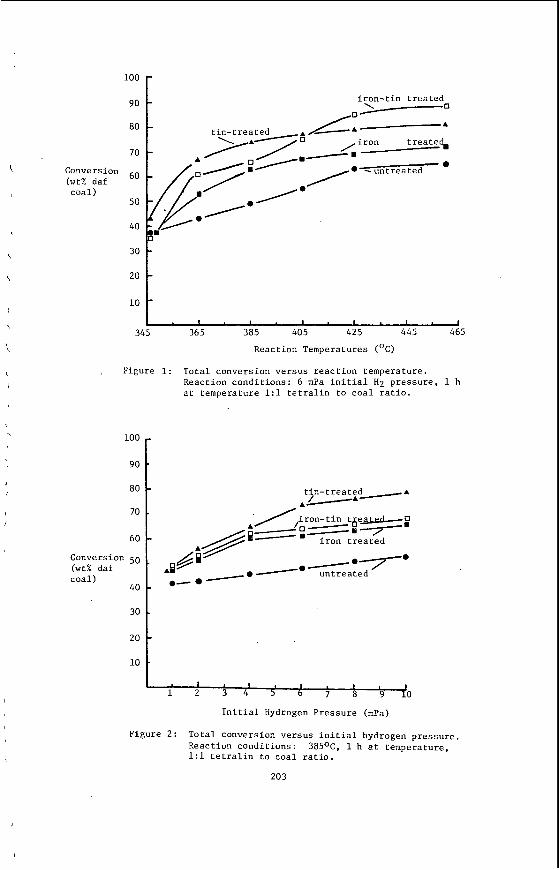
\
\
Conversion (vt% daf coal)
100
90
80
70
60
50
40
30
20
r iron-tin treated
0
iron treated,
e -<-
t I . 1 . 1 I , I I I
345 365 385 405 425 445 465
Reaction Temperatures (OC)
Figure 1: Total conversion versus reaction temperature. Reaction conditions: 6 mPa initial H 2 pressure, 1 h at temperature 1:l tetralin to coal ratio.
100
i 80 - 70 .
60 - Conversion 50 ( w t % daf coal)
40 -
tin-treated A-A
A L
e -e untreated A.
e-
I . I I I I 1 2 3 4 5 b 7 8 s i 0
Initial Hydrogen Pressure ( S a )
Figure 2 : Total conversion versus initial hydrogen pressure. Reaction conditions: 385OC, 1 h at temperature, 1:l tetralin to coal ratio.
203
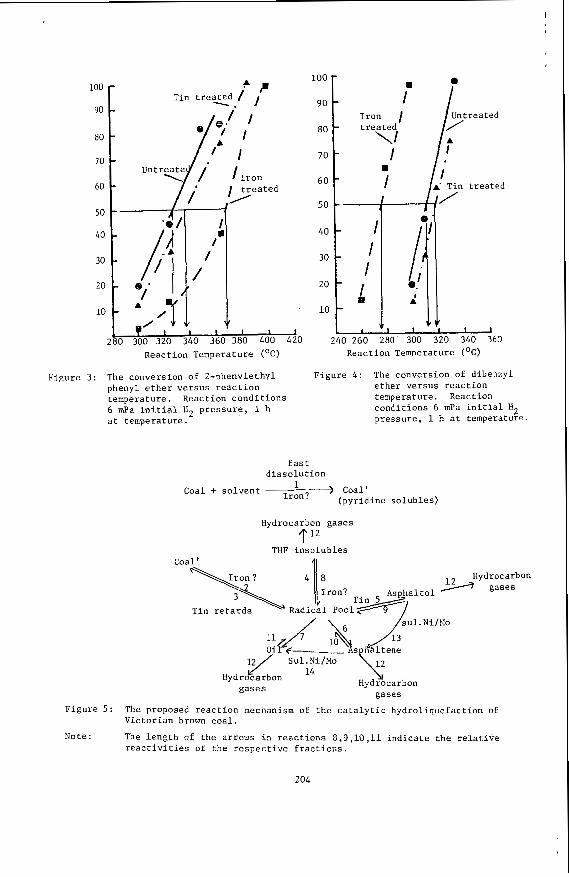
I
100 - 90 - 80 -
2bO 300 320 340 360 380 400 420 Reaction Temperature ('(2)
100
90
80
70
60
50
40
30
20
lo
i Iron I treated
\I I
I m
Untreated
A' Tin treated
I I I
' I B
A 0 260 280 300
/
2 320 340 360
Reaction Temperature (OC)
Figure 3: The conversion of 2-phenvlethvl Figure 4 : The conversion of dibeixyl phenyl ether versus reaction ether versus reaction temperature. Reaction conditions temperature. Reaction 6 mPa initial H2 pressure, 1 h at temperature. pressure, 1 h at temperature.
conditions 6 mPa initial H2
fast dissolution
1 Coal' (pyridine solubles) Iron? ) Coal + solvent
Coal'
Hydrocarbon gases
THF insolubles TI2
41
Hydrocarbor. % gases
sul. Xi/>!o
k IQ/ Suli;i/Mo
Hydrocarbon gases Hydrocarbon
gases Figure 5:
Note:
The proposed reaction nechanism of the catalytic hydroliquefaction of Victorian brown coal.
The length of the arrow in reactions 8,9,10,11 indicate the relative reactivities of the respective fractions.
204
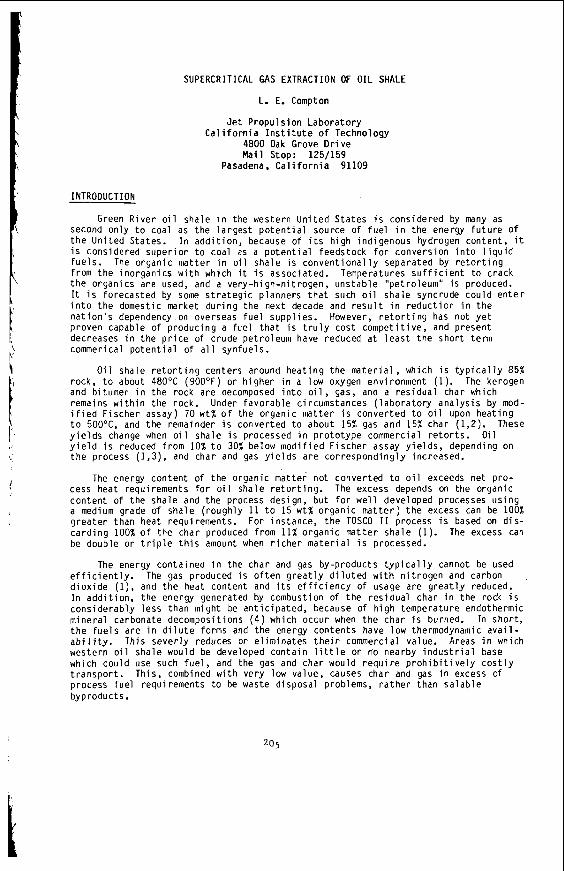
I
SUPERCRITICAL GAS EXTRACTION OF OIL SHALE
L. E. Compton
J e t P ropu ls ion Labora to ry C a l i f o r n i a I n s t i t u t e o f Technology
4800 Oak Grove D r i v e M a i l Stop: 125/159
Pasadena, C a l i f o r n i a 91109
INTRODUCTION
Green R ive r o i l shale i n the western U n i t e d S ta tes i s cons idered by many as second only t o coal as the l a r g e s t p o t e n t i a l source of f u e l i n the energy f u t u r e of t h e Un i ted States. I n a d d i t i o n , because o f i t s h igh ind igenous hydrogen content , it i s considered super io r t o coal as a p o t e n t i a l feedstock f o r convers ion i n t o l i q u i d fue l s . from t h e i no rgan ics w i t h which i t i s assoc iated. Temperatures s u f f i c i e n t t o crack t h e organics are used, and a very-h igh-n i t rogen, uns tab le "petroleum" i s produced. It i s forecasted by some s t r a t e g i c p lanners t h a t such o i l shale syncrude could e n t e r i n t o the domestic market d u r i n g the next decade and r e s u l t i n reduc t i on i n the n a t i o n ' s dependency on overseas f u e l suppl ies. However, r e t o r t i n g has not y e t proven capable o f producing a fue l t h a t i s t r u l y cost compe t i t i ve , and present decreases i n the p r i c e o f crude pet ro leum have reduced a t l e a s t t he sho r t term commerical p o t e n t i a l o f a l l synfuels .
O i l shale r e t o r t i n g centers around hea t ing the m a t e r i a l , which i s t y p i c a l l y 85% rock, t o about 480Y (900°F) or h ighe r i n a low oxygen environment (1). The kerogen and bitumen i n the rock are decomposed i n t o o i l , gas, and a res idua l char which remains w i t h i n the rock. Under favo rab le c i rcumstances ( l a b o r a t o r y a n a l y s i s by mod- i f i e d F i sche r assay) 70 w t % o f the organic ma t te r i s conver ted t o o i l upon hea t ing t o 5OO0C, and the remainder i s conver ted t o about 15% gas and 15% char (1,Z). These y i e l d s change when o i l shale i s processed i n p ro to type commercial r e t o r t s . O i l y i e l d i s reduced f rom 10% t o 30% below m o d i f i e d F i sche r assay y i e l d s , depending on t h e process (1 ,3 ) , and char and gas y i e l d s are co r respond ing ly increased.
The energy content o f t he organic matte; not conver ted t o o i l exceeds net p ro - cess heat requirements f o r o i l shale r e t o r t i n g . The excess depends on the organic content o f the shale and the process design, but f o r w e l l developed processes u s i n g a medium grade o f shale ( roughly 11 t o 15 w t % o rgan ic m a t t e r ) t h e excess can be 100% g rea te r than heat requirements. For instance, t h e TOSCO I 1 process i s based on d i s - c a r d i n g 100% o f the char produced from 11% organ ic ma t te r shale (1). The excess can be double or t r i p l e t h i s amount when r i c h e r m a t e r i a l i s processed.
The energy conta ined i n the char and gas by-products t y p i c a l l y cannot be used e f f i c i e n t l y . The gas produced i s o f t e n g r e a t l y d i l u t e d w i t h n i t r o g e n and carbon d i o x i d e ( l ) , and t h e heat content and i t s e f f i c i e n c y o f usage are g r e a t l y reduced. I n a d d i t i o n , t he energy generated by combustion o f t h e r e s i d u a l char i n t h e rock i s cons ide rab ly l ess than might be a n t i c i p a t e d , because o f h i g h temperature endothermic minera l carbonate decomposit ions ( 4 ) which occur when t h e char i s burned. I n shor t , t h e fue l s are i n d i l u t e forms and the energy contents have low thermodynamic a v a i l - a b i l i t y . This seve r l y reduces o r e l i m i n a t e s t h e i r commercial value. Areas i n which western o i l shale would be developed con ta in l i t t l e o r no nearby i n d u s t r i a l base which cou ld use such f u e l , and the gas and char would r e q u i r e p r o h i b i t i v e l y c o s t l y t r a n s p o r t . Th is , combined w i t h very low value, causes char and gas i n excess of process f u e l requirements t o be waste d isposal problems, r a t h e r than s a l a b l e byproducts.
The organic ma t te r i n o i l shale i s c o n v e n t i o n a l l y separated by r e t o r t i n g
I
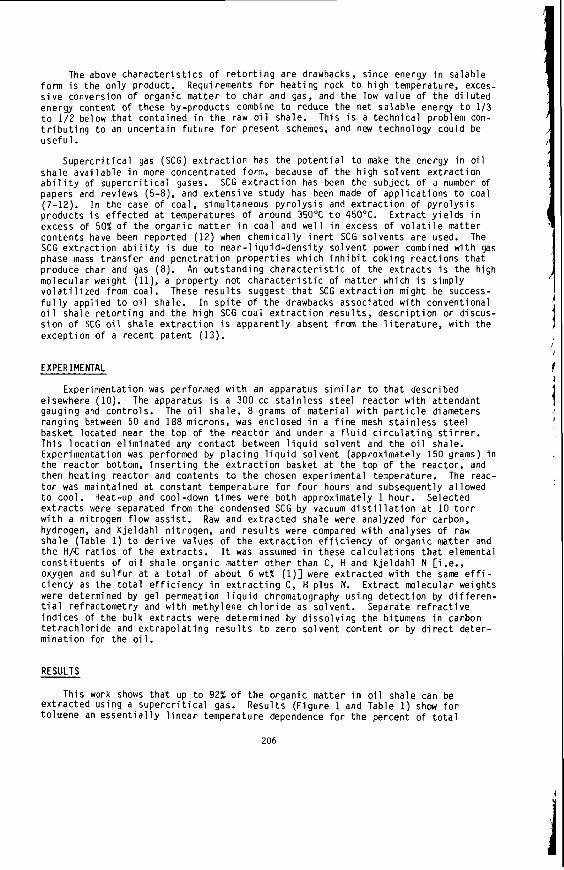
The above c h a r a c t e r i s t i c s o f r e t o r t i n g are drawbacks, s ince energy i n sa lab le form i s the only product . s i v e conversion o f organic m a t t e r t o char and gas, and t h e low value o f t he d i l u t e d energy content o f these by-products combine t o reduce the ne t s a l a b l e energy t o 1/3 t o 1/2 below t h a t conta ined i n t h e raw o i l shale. This i s a techn ica l problem con- t r i b u t i n g t o an u n c e r t a i n f u t u r e f o r present schemes, and new technology could be u s e f u l .
S u p e r c r i t i c a l gas (SCG) e x t r a c t i o n has the p o t e n t i a l t o make the energy i n o i l sha le a v a i l a b l e i n more concentrated form, because of t he h igh so l ven t e x t r a c t i o n a b i l i t y o f s u p e r c r i t i c a l gases. SCG e x t r a c t i o n has been the sub jec t o f a number of papers and rev iews (5-8), and e x t e n s i v e study has been made of a p p l i c a t i o n s t o coal (7-12). produc ts i s e f f e c t e d a t temperatures of around 35OOC t o 450'C. E x t r a c t y i e l d s i n excess of 5 0 % o f t he o rgan ic m a t t e r i n coal and we l l i n excess o f v o l a t i l e m t t e r con ten ts have been repo r ted (12) when chemica l l y i n e r t SCG so l ven ts are used. The S C G e x t r a c t i o n a b i l i t y i s due t o n e a r - l i q u i d - d e n s i t y so l ven t power combined w i t h gas phase mass t r a n s f e r and p e n e t r a t i o n p r o p e r t i e s which i n h i b i t cok ing r e a c t i o n s t h a t produce char and gas (8) . An ou ts tand ing c h a r a c t e r i s t i c o f the e x t r a c t s i s t he high molecular we igh t ( l l ) , a p r o p e r t y no t c h a r a c t e r i s t i c o f m a t t e r which i s s imply v o l a t i l i z e d from coal . These r e s u l t s suggest t h a t SCG e x t r a c t i o n might be success- f u l l y app l i ed t o o i l shale. I n s p i t e of t he drawbacks associated w i t h convent ional o i l shale r e t o r t i n g and the h igh SCG c o a l e x t r a c t i o n r e s u l t s , d e s c r i p t i o n o r d iscus- s i o n o f SCG o i l shale e x t r a c t i o n i s apparen t l y absent fran t h e l i t e r a t u r e , with the excep t ion o f a recent pa ten t (13) .
Requirements f o r hea t ing rock t o h igh temperature, exces-
I n the case o f coal , simultaneous p y r o l y s i s and e x t r a c t i o n o f p y r o l y s i s
EXPERIMENTAL
Exper imentat ion was performed w i t h an apparatus s i m i l a r t o t h a t descr ibed elsewhere (10) . The apparatus i s a 300 cc s t a i n l e s s s t e e l r e a c t o r w i t h a t tendan t gauging and con t ro l s . The o i l shale, 8 grams o f ma te r ia l w i t h p a r t i c l e diameters rang ing between 50 and 188 microns, was enclosed i n a f i n e mesh s t a i n l e s s s t e e l basket l oca ted near t h e t o p o f t h e r e a c t o r and under a f l u i d c i r c u l a t i n g s t i r r e r . Th is l o c a t i o n e l im ina ted any con tac t between l i q u i d so l ven t and the o i l shale. Exper imentat ion was performed by p l a c i n g l i q u i d so l ven t (approx imate ly 150 grams) i n the reac to r bottom, i n s e r t i n g t h e e x t r a c t i o n basket a t t he top o f t h e reac to r , and then hea t ing r e a c t o r and contents t o t h e chosen exper imenta l temperature. The reac- t o r was mainta ined a t constant temperature f o r f o u r hours and subsequently a l lowed t o coo l . Heat-up and cool-down t imes were both approx imate ly 1 hour. Selected e x t r a c t s were separated from t h e condensed SCG by vacuum d i s t i l l a t i o n a t 10 t o r r w i t h a n i t rogen f l o w a s s i s t . Raw and e x t r a c t e d shale were analyzed f o r carbon, hydrogen, and K je ldah l n i t rogen , and r e s u l t s were compared w i t h analyses o f raw sha le (Table 1) t o d e r i v e values of t h e e x t r a c t i o n e f f i c i e n c y o f o rgan ic ma t te r and t h e H/C r a t i o s o f t he e x t r a c t s . It was assumed i n these c a l c u l a t i o n s t h a t elemental c o n s t i t u e n t s o f o i l shale o rgan ic m a t t e r o t h e r than C, H and K j e l d a h l N [i.e., oxygen and s u l f u r a t a t o t a l o f about 6 w t % ( l ) ] were e x t r a c t e d w i t h the same e f f i - c i ency as the t o t a l e f f i c i e n c y i n e x t r a c t i n g C, H p l u s N. E x t r a c t molecular weights were determined by gel permeation l i q u i d chromatography u s i n g d e t e c t i o n by d i f f e r e n - t i a l re f rac tomet ry and w i t h methylene c h l o r i d e as so lvent . Separate r e f r a c t i v e i n d i c e s of t h e bulk e x t r a c t s were determined by d i s s o l v i n g t h e bitumens i n carbon t e t r a c h l o r i d e and e x t r a p o l a t i n g r e s u l t s t o zero so l ven t content o r by d i r e c t de te r - m i n a t i o n for the o i l .
RESULTS
Th is work shows t h a t up t o 92% o f t h e o rgan ic m t t e r i n o i l shale can be e x t r a c t e d us ing a s u p e r c r i t i c a l gas. Resu l t s (F igu re 1 and Table 1 ) show f o r t o l u e n e an e s s e n t i a l l y l i n e a r temperature dependence f o r t h e percent o f t o t a l
206
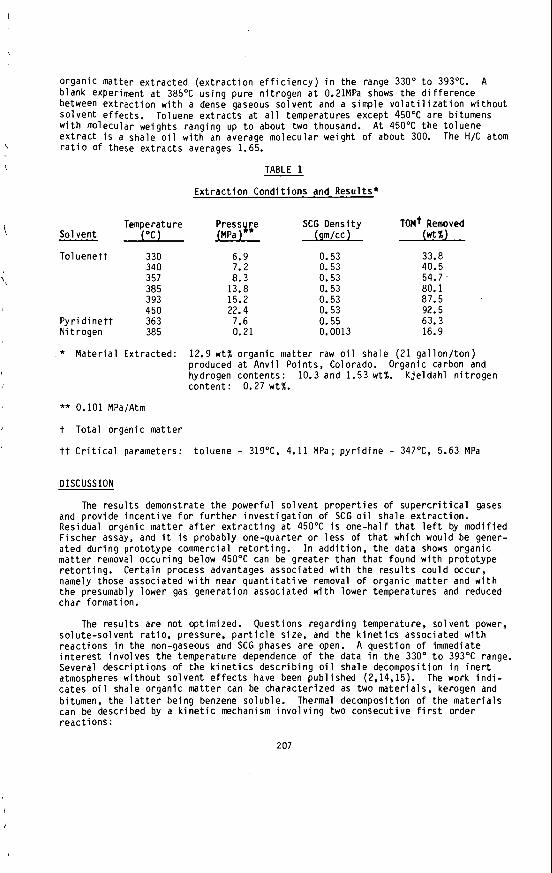
organ ic mat ter e x t r a c t e d ( e x t r a c t i o n e f f i c i e n c y ) i n the range 330' t o 393OC. b lank experiment a t 385OC u s i n g pure n i t r o g e n a t 0.21MPa shows the d i f f e rence between e x t r a c t i o n w i t h a dense gaseous so l ven t and a s imple v o l a t i l i z a t i o n w i thou t so l ven t e f f e c t s . w i t h molecular weights ranging up t o about two thousand. e x t r a c t i s a shale o i l w i t h an average molecular weight o f about 300. The H/C atom
A
Toluene e x t r a c t s a t a l l temperatures except 45OOC are bitumens A t 450'C t h e to luene
\ r a t i o of these e x t r a c t s averages 1.65.
i Sol vent
To1 uenet
'\
Py r i d i ne N i t rogen
TABLE 1
E x t r a c t i o n Cond i t i ons and Resu l t s *
Temperature Pressyge SCG Dens i t y TOM? Removed ("C) (MPa) (gm/cc) ( w t % )
330 340 357 385 393 450
t 363 385
6.9 7.2 8.3
13.8 15.2 22.4 7.6 0.21
0.53 0.53 0.53 0.53 0.53 0.53 0.55 0.0013
33.8 40.5 54.7 80.1 87.5 92.5 63.3 16.9
* M a t e r i a l Ext racted: 12.9 w t % organic ma t te r raw o i l shale (21 g a l l o n / t o n ) produced a t Anv i l Po in ts , Colorado. Organic carbon and hydrogen con ten ts : 10.3 and 1.53 wt%. K je ldah l n i t r o g e n con ten t : 0.27 w t % .
** 0.101 MPa/Atm
t To ta l organic ma t te r
tt C r i t i c a l parameters: t o luene - 319OC. 4.11 MPa; p y r i d i n e - 347OC. 5.63 MPa
DISCUSSION
The r e s u l t s demonstrate t h e powerfu l so l ven t p r o p e r t i e s o f s u p e r c r i t i c a l gases and p rov ide i n c e n t i v e f o r f u r t h e r i n v e s t i g a t i o n o f SCG o i l shale e x t r a c t i o n . Residual organic ma t te r a f t e r e x t r a c t i n g a t 450°C i s one-hal f t h a t l e f t by mod i f i ed F i sche r assay, and i t i s probably one-quar ter o r l ess o f t h a t which would be gener- a t e d du r ing p ro to type commercial r e t o r t i n g . I n a d d i t i o n , t he data shows organic ma t te r removal occu r ing below 45OOC can be g r e a t e r than t h a t found w i t h p r o t o t y p e r e t o r t i n g . C e r t a i n process advantages associated with t h e r e s u l t s could occur, namely those associated w i t h near q u a n t i t a t i v e removal o f organic ma t te r and w i t h t h e presumably lower gas genera t i on associated w i t h lower temperatures and reduced cha r formation.
The r e s u l t s are not opt imized. Quest ions regard ing temperature, so l ven t power, so lu te -so l ven t r a t i o , pressure, p a r t i c l e s ize, and the k i n e t i c s associated w i t h r e a c t i o n s i n the non-gaseous and SCG phases are open. A quest ion o f immediate i n t e r e s t i nvo l ves t h e temperature dependence o f t he data i n t h e 330' t o 393'C range. Several d e s c r i p t i o n s o f t h e k i n e t i c s d e s c r i b i n g o i l shale decomposit ion i n i n e r t atmospheres w i thou t so l ven t e f f e c t s have been pub l i shed (2,14,15). The work i n d i - ca tes o i l shale organic m a t t e r can be cha rac te r i zed as two mate r ia l s , kerogen and bitumen, the l a t t e r be ing benzene so lub le. Thermal decomposit ion o f t he m a t e r i a l s can be descr ibed by a k i n e t i c mechanism i n v o l v i n g two consecut ive f i r s t order r e a c t i o n s :
207
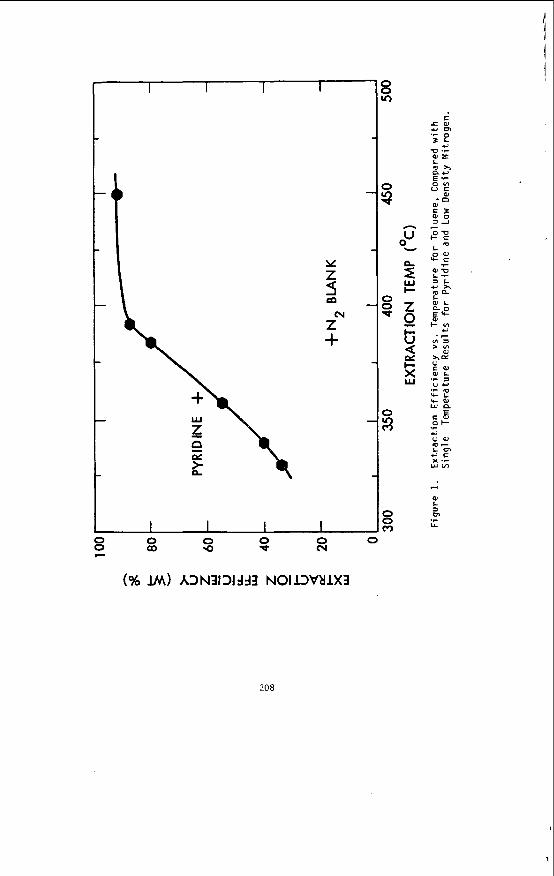
hd Z
m
Z
4
+ (v
0 0 0 0 0 0 Q) 9 * c
4
w
Ol
U
a .r
0 0 m
208
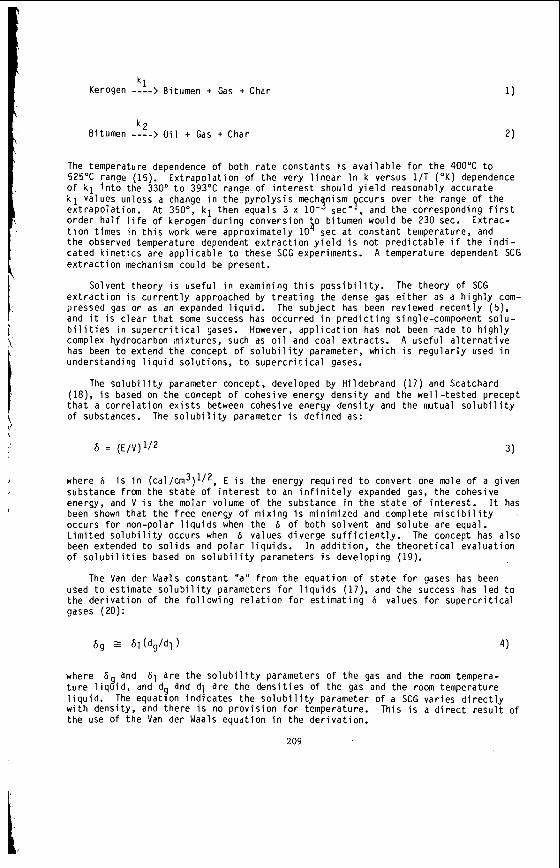
1) k l
Kerogen ----> Bitumen + Gas t Char
2) k 2
Bitumen ----> O i l t Gas t Char
The temperature dependence o f both r a t e constants i s a v a i l a b l e f o r t h e 400°C t o 525'C range (15). E x t r a p o l a t i o n o f t he very l i n e a r I n k versus 1 / T ( O K ) dependence o f k l i n t o the 330" t o 393°C range o f i n t e r e s t should y i e l d reasonably accurate k l values unless a change i n the p y r o l y s i s mech$nism-pccurs over the range of t he ex t rapo la t i on . A t 350", kl then equals 3 x 10- sec , and the corresponding f i r s t o rde r h a l f l i f e o f kerogen du r ing convers ion
t h e observed temperature dependent e x t r a c t i o n y i e l d i s no t p r e d i c t a b l e i f t h e i n d i - ca ted k i n e t i c s are a p p l i c a b l e t o these SCG experiments. e x t r a c t i o n mechanism cou ld be present .
Solvent theory i s use fu l i n examining t h i s p o s s i b i l i t y . The theo ry of SCG e x t r a c t i o n i s c u r r e n t l y approached by t r e a t i n g the dense gas e i t h e r as a h i g h l y com- pressed gas o r as an expanded l i q u i d . The sub jec t has been reviewed r e c e n t l y ( 5 ) . and i t i s c l e a r t h a t some success has occurred i n p r e d i c t i n g single-component s o l u - b i l i t i e s i n s u p e r c r i t i c a l gases. However, a p p l i c a t i o n has not been made t o h i g h l y complex hydrocarbon mixtures, such as o i l and coal ex t rac ts . A use fu l a l t e r n a t i v e has been t o extend t h e concept o f s o l u b i l i t y parameter, which i s r e g u l a r l y used i n understanding l i q u i d so lu t i ons , t o s u p e r c r i t i c a l gases.
o bitumen would be 230 sec. Ex t rac - t i o n t imes i n t h i s work were approx imate ly 10 5 sec a t constant temperature, and
A temperature dependent SCG
The s o l u b i l i t y parameter concept, developed by Hi ldebrand (17) and Scatchard (18), i s based on the concept o f cohesive energy d e n s i t y and the w e l l - t e s t e d precept t h a t a c o r r e l a t i o n e x i s t s between cohesive energy d e n s i t y and the mutual s o l u b i l i t y o f substances. The s o l u b i l i t y parameter i s de f i ned as:
\
6 = ( E / V ) I I 2 3 )
/ where 6 i s i n ( ~ a l / c m ~ ) l / ~ , E i s t he energy requ i red t o conver t one mole o f a given substance from the s t a t e o f i n t e r e s t t o an i n f i n i t e l y expanded gas, t he cohesive energy, and V i s t he molar volume o f the substance i n the s t a t e o f i n t e r e s t . It has been shown t h a t t he f r e e energy o f m ix ing i s min imized and complete m i s c i b i l i t y . occurs f o r non-polar l i q u i d s when the 6 o f both so l ven t and s o l u t e are equal. L i m i t e d s o l u b i l i t y occurs when 6 values d i ve rge s u f f i c i e n t l y . The concept has a l s o been extended t o s o l i d s and p o l a r l i q u i d s . I n a d d i t i o n , the t h e o r e t i c a l eva lua t i on o f s o l u b i l i t i e s based on s o l u b i l i t y parameters i s develop ing (19).
The Van der Waals constant "a" from the equat ion o f s t a t e f o r gases has been used t o est imate s o l u b i l i t y parameters f o r l i q u i d s (17), and the success has l e d t o t h e d e r i v a t i o n o f the f o l l o w i n g r e l a t i o n f o r e s t i m a t i n g 6 values f o r s u p e r c r i t i c a l gases (20):
where 6 and 61 a r e t h e s o l u b i l i t y parameters of t h e gas and t h e room tempera- t u r e l i q i i d , and dg and d l a r e the d e n s i t i e s of t h e gas and the room temperature l i q u i d . w i t h densi ty , and t h e r e i s no p r o v i s i o n f o r temperature. This i s a d i r e c t r e s u l t of t h e use o f t h e Van der Waals equat ion i n the d e r i v a t i o n .
The equat ion i n d i c a t e s the s o l u b i l i t y parameter o f a SCG va r ies d i r e c t l y
209

The s o l u b i l i t y parameter o f m a t e r i a l s f o r which values o f the cohesive energy and/or molar volume are unava i l ab le , such as o i l shale bitumen, can be est imated by us ing c o r r e l a t i o n s between 6 and t h e r e f r a c t i v e index (21). The f o l l o w i n g es t ima t ion i s used:
where n i s t he r e f r a c t i v e index and C i s a constant rep resen ta t i ve o f t h e chemical compound type. C ranges from a low o f approx imate ly 230 f o r branched a l i p h a t i c polymers t o a h igh o f 353 f o r a l i p h a t i c e s t e r polymers. The average value o f C over a broad range o f compounds, i n c l u d i n g but not l i m i t e d t o polymers, i s about 308. I f i t i s assumed t h a t t he bitumen produced i n t h i s exper imentat ion has about the same atomic makeup as o i l sha le kerogen, namely C200H30 SN5011 (22), then the ma te r ia l should con ta in a broad range o f chemical f u n c t i o n a f groups, i n c l u d i n g l a r g e c o n t r i - bu t i ons f rom unsaturated and heteroatomic groups. Th is assumption i s cons i s ten t w i t h r e s u l t s from analyses o f shale o i l which show a rough d i s t r i b u t i o n amounting t o 11 w t % s a t u r a t e d hydrocarbons, 18% o l e f i n s , 10% aromat ics, 36% n i t r o g e n compounds, 6% s u l f u r compounds, and 19% oxygen compounds (23). The va lue of C used w i t h Equa- t i o n 5 f o r t he o i l shale bitumen i s acco rd ing l y chosen as the broad range value of 308. The room temperature values f o r t he r e f r a c t i v e index of the bitumen and t h e o i l ex t rac ted i n t h i s work are 1.62 and 1.59, and Equat ion 5 y i e l d s an average room temperature s o l u b i l i t y parameter es t ima te f o r t he compounds compr is ing the bitumen o f 10.4. A somewhat h ighe r va lue can be de r i ved from a c o r r e l a t i o n based on the Lorentz-Lorenz f u n c t i o n (21). t h e f o l l o w i n g r e l a t i o n s h i p de r i ved f o r po lymer ic m a t e r i a l s (24):
The va lue o f 10.4 has been temperature co r rec ted w i t h
1.13
62 = 61[?]
where 61 and 62 a r e t h e s o l u b i l i t y parameters a t the re fe rence temperature and t h e temperature o f i n t e r e s t and d l and d2 a r e the respec t i ve dens i t i es . Basing t h e dens i t y change o f t he bitumen between roan and exper imentat ion temp ra tu res on t h e vo lumet r i c expansion c o e f f i c i e n t f o r pet ro leum a t lOO"C, namely 10-5/oC, y i e l d s est imates o f t he s o l u b i l i t y parameter o f t h e bitumen ranging f rom 7.7 a t 330°C t o 7.3 a t 393'C.
A comparison between t h e es t ima ted s o l u b i l i t y parameters of t he bitumen and s u p e r c r i t i c a l gas so l ven ts can now be made t o determine i f a temperature dependent e x t r a c t i o n cou ld be expected. Fo r SCG t o l u e n e a t t he 0.53 gm/cc dens i t y used, t he es t ima ted s o l u b i l i t y parameter based on Equat ion 4 i s 5.5, compared t o t h e 7.3 t o 7.7 est imated f o r t h e bitumen. I n normal p r a c t i c e these 6 values should be s u f f i - c i e n t l y d i f f e r e n t t o a l l o w p r e d i c t i o n o f a temperature-dependent, l i m i t e d s o l u b i l i t y f o r t h e bitumen i n s u p e r c r i t i c a l to luene. A h igher 6 SCG might be needed t o e l i m i - na te temperature dependent e x t r a c t i o n e f f e c t s and inc rease the o v e r a l l e x t r a c t i o n e f f i c i e n c y at temperatures below 400°C.
E x t r a c t i o n w i t h p y r i d i n e a t 363°C was performed t o t e s t t h i s p o s s i b i l i t y , and a comparison of r e s u l t s between e x t r a c t i o n w i t h to luene and p y r i d i n e i s i nc luded i n F i g u r e 1 and Table 1. E x t r a c t i o n e f f i c i e n c y i s increased by about 1/6 w i t h p y r i - dine, which has an Equat ion 4 S o f 6.0 under exper imenta l cond i t i ons . This s i n g l e r e s u l t needs con f i rma t ion . However, both organic carbon and organic hydrogen e x t r a c t i o n increase by t h e same amount w i t h p y r i d i n e , and it i s concluded t h a t
210
i
I
exper imentat ion w i t h y e t a h ighe r s o l u b i l i t y parameter SCG migh t r e s u l t i n a d d i t i o n a l l y enhanced e x t r a c t i o n a t temperatures below 400°C. might a l s o be improved, bu t t h e r e i s l i t t l e p r a c t i c a l i n c e n t i v e , because of t h e h igh e x t r a c t i o n e f f i c i e n c y a l ready found.
Resul ts above 40OoC
REFERENCES
1.
2.
3. 4. 5. 6. 7. 8.
9. 10.
11. 12. 13. 14. 15. 16. 17.
18. 19. 20. 21. 22.
23. 24.
Baughman, G. L. (Ed.), S y n t h e t i c Fuels Data Handbook, 2nd Ed., Cameron Engineers. Denver, 1978. Hubbard, A. B. and Robinson, W. E., Bureau o f Mines Report o f I n v e s t i g a t i o n s 4744, 1950. Brant ley, F. E., e t al., Ind. and Eng. Chem. 44, 2641 ‘(1952). Campbell, J. H., LLL Report UCRL-52089, Pa r t March 13, 1978. Wi l l iams, D. F., Chem. Eng. Sci. 36, 1769 (1981). Bot t , T. R., Chem. and Ind., p. 228 (15 Mar., 1980). Gangoli, N. and Thodos, G., Ind. Eng. Chem. Prod. Res. Oev. 16, 208 (1977). Paul, P. F. M. and Wise, W. S., The P r i n c i p l e s o f Gas Ex t rac t i on , M i l l s and Boon, London, 1971. Maddocks, R. R., e t al., Chem. Eng. Prog. p. 49 (June 1979). B less ing, J. E. and Ross, D. R., ACS Symposium Ser ies 71, Organic Chemistry of Coal, p. 15, 1978. B a r t l e , K. D., e t a l . , Fuel 58, 413 (1979). Kershaw, J. R. and Jezko, J.,Sep. Sci. and Tech. 2, 151 (1982). Wi l l iams, 0. F., U.S. Patent 4,108,760, 1978. A l l r e d , V. D., Chem. Eng. Prog. 62, 55 (1966). Braun. R. 1. and Rothman. A. J.,%el 54, 129 11975). MacKay, M. E. and P a u l a i t i s , M. E., I n x - E n g . Chem.’Fund. 18, 149 (1979). Hi ldebrand, J. H. and Sco t t , R. L., The S o l u b i l i t y o f N o n e x c t r o l y t e s , 3 r d Ed., Reinhold, New York, 1950. Scatchard, G., Chem. Rev. 8, 321 (1931). Srebrenik, S. and Cohen, ST, J. Phys. Chem. 80, 996 (1976). Giddings, J. D., e t al., J. Chromat. Sc i . 7 ,776 (1969). Lawson, D. D. and Ingham, J. D., Nature 223, 615 (1969). Weitkamp, A. W., and Gu tbe r le t , L. C., I n d . Eng. Chem. Proc. Des. Dev. 2, 386 (1970). Cady, W. E. and Seel ig , H. S., Ind. and Eng. Chem. 44, 2636 (1952). Fedors, R. F., Polymer Sci. and Eng. 14, 472 ( 1 9 7 4 ) F
ACKNOWLEDGMENT
The research descr ibed i n t h i s paper was c a r r i e d out by t h e J e t P ropu ls ion Laboratory, C a l i f o r n i a I n s t i t u t e of Technology, under c o n t r a c t w i t h t h e Na t iona l Aeronaut ics and Space Admin i s t ra t i on .
211
SOLVENT EFFECTS I N SUPERCRITICAL EXTRACTION OF COAL
Nicholas P. Vas i lakos , Joseph M. Dobbs, and AnthonyS. P a r i s i
Department of Chemical Engineer ing, Univers i ty of Texas Aus t in , Texas 78712
INTRODUCTION
S u p e r c r i t i c a l gas e x t r a c t i o n i s p a r t i c u l a r l y s u i t a b l e f o r t h e recovery of the These l i q u i d s a r e normally too l i q u i d s formed when c o a l is heated t o above 400°C.
i n v o l a t i l e t o d i s t i l l a t t h i s temperature . I f t h e temperature is increased , they polymerize t o form heavier and l a r g e r molecular s p e c i e s and evolve a s gases and li- quids . Only a r e l a t i v e l y smal l amount of t h e c o a l d i s t i l l s as t a r from t h e decom- posing m a t e r i a l . l i q u i d s a s they a r e formed whi le avoid ing t h e u n d e s i r a b l e decomposition r e a c t i o n s (1). S u p e r c r i t i c a l f l u i d s have a d e n s i t y of about 30% of t h a t of a normal f l u i d , which is high enough t o provide f o r good so lvent c a p a b i l i t y , but a l s o low enough for high d i f f u s i v i t y and r a p i d mass t r a n s f e r throughout t h e complex c o a l mat r ix .
pounds from c o a l was pioneered by t h e Nat ional Coal Board (NCB) i n B r i t a i n . Over a number of years , NCB has i n v e s t i g a t e d t h e d i r e c t e x t r a c t i o n o f c o a l s us ing l i g h t aro- matic s o l v e n t s (mostly toluene) under s u p e r c r i t i c a l c o n d i t i o n s . I n a r e c e n t WB re- p o r t , Whitehead (2) summarized t h e experimental d a t a on s u p e r c r i t i c a l e x t r a c t i o n of coa l , obtained both on bench-scale u n i t s and on a 5 kg/h Continuous p i l o t p l a n t oper- a t e d i n B r i t a i n by t h e Coal Research Establ ishment . According t o t h e s e d a t a , t h e re- s idence t i m e of coa l under s u p e r c r i t i c a l c o n d i t i o n s was t h e v a r i a b l e which most in- f luenced t h e e x t r a c t y i e l d . The i n f l u e n c e of p r e s s u r e and temperature on t h e y ie ld was a l s o s u b s t a n t i a l , and an e x t r a c t y i e l d of 35% by weight of t h e d r y , ash- f ree coa l could be obtained using to luene a t 42OoC and 27.5 MF'a pressure . I t was a l s o d e t e r - mined t h a t i t was not e s s e n t i a l f o r t h e e x t r a c t i n g f l u i d t o be above i t s c r i t i c a l temperature t o be e f f e c t i v e . For a given o p e r a t i n g p r e s s u r e , t h e advantages of oper- a t i n g i n a s u p e r c r i t i c a l s t a t e w e r e a s s o c i a t e d wi th t h e lower d e n s i t y and v i s c o s i t y of t h e f l u i d compared wi th a s u b c r i t i c a l f l u i d .
I n another c o a l - r e l a t e d e f f o r t i n the United S t a t e s , Kerr-McCee Corporat ion has developed a new s o l i d - l i q u i d s e p a r a t i o n technique u t i l i z i n g t h e unique s o l v e n t capa- b i l i t i e s of s u p e r c r i t i c a l f l u i d s (3 ) . The process , c a l l e d C r i t i c a l Solvent Deashing (CSD), is used to s e p a r a t e minera l matter and unreacted c o a l from c o a l l i q u i d s . A two-stage CSD p i l o t p l a n t ( i n t e g r a t e d i n t o an SRC process u n i t ) has been operated f o r t h e l a s t f o u r years a t W i l s o n v i l l e , Alabama.
Despi te t h e s t rong i n d u s t r i a l i n t e r e s t and t h e e x t e n s i v e research a c t i v i t y i n t h e f i e l d of s u p e r c r i t i c a l e x t r a c t i o n , much remains t o be learned i n t h e a p p l i c a t i o n of s u p e r c r i t i c a l f l u i d s t o coa l processing. An important f e a t u r e of s u p e r c r i t i c a l coa l e x t r a c t i o n t h a t has rece ived l i t t l e a t t e n t i o n i n t h e l i t e r a t u r e concerns t h e s p e c i f i c c h a r a c t e r i s t i c s ( p h y s i c a l and/or chemical) of t h e s u p e r c r i t i c a l so lvent and so lvent mixtures t h a t can a f f e c t t h e y i e l d and t h e q u a l i t y of t h e c o a l e x t r a c t s . Paul and Wise ( 4 ) i n t h e i r e x c e l l e n t monograph on gas e x t r a c t i o n used t h e semiquanti- t a t i v e approach of Rowlinson and Richardson (5) t o show t h e s t r o n g dependence of s u p e r c r i t i c a l s o l u b i l i t y on t h e c r o s s - v i r i a l c o e f f i c i e n t B i z of t h e s o l v e n t - s u b s t r a t e gas phase. They a l s o d iscussed empir ica l c o r r e l a t i o n s f o r c a l c u l a t i n g t h e s e coef- f i c i e n t s i n r e l a t i v e l y s imple c a s e s of nonpolar molecules . The e x i s t i n g BIZ c o r r e l a - t i o n s , however, a r e most l i k e l y t o prove completely u n s a t i s f a c t o r y f o r po lar s o l - v e n t s , o r f o r s o l v e n t s t h a t are chemical ly ( a s w e l l a s phys ica l ly) involved i n t h e mechanism of c o a l e x t r a c t i o n . e x e r t a s t ronger d i s s o c i a t i n g o r depolymerizing a c t i o n on c o a l dur ing t h e thermal f ragmentat ion s t a g e than nonpolar s o l v e n t s , thus i n c r e a s i n g t h e y i e l d of e x t r a c t - a b l e c o a l m a t e r i a l .
t a l i n v e s t i g a t i o n i n t o s o l v e n t and chemical-react ion e f f e c t s i n s u p e r c r i t i c a l coa l e x t r a c t i o n . of s u p e r c r i t i c a l e x t r a c t i o n and s p e c i f i c chemical t rea tment of t h e c o a l (such a s
S u p e r c r i t i c a l gas e x t r a c t i o n a f f o r d s a means of recover ing these
The use of s u p e r c r i t i c a l f l u i d s f o r t h e recovery of hydrocarbons and r e l a t e d com-
P o l a r o r hydrogen bonding s o l v e n t s , f o r example, may
The present paper d i s c u s s e s some r e s u l t s from t h e f i r s t phase of our experimen-
The second phase c u r r e n t l y under way i s concerned with t h e combination
212
c a t a l y t i c depolymerizat ion, a l k y l a t i o n , hydrogen-donor a c t i v i t y , e t c . ) t o i n c r e a s e t h e y i e l d of c o a l e x t r a c t s and decrease t h e s e v e r i t y of t h e e x t r a c t i o n condi t ions .
EXPERIMENTAL
1000 cm3 ( f r e e volume:910 cm3), 316SS AE MagneDrive a u t o c l a v e equipped wi th a d i g i - tal temperature c o n t r o l l e r / i n d i c a t o r and a d i g i t a l p r e s s u r e t r a n s d u c e r / i n d i c a t o r i n t h e 0-10,000 p s i range (Autoclave Engineers , Model DPS-0201). An I l l i n o i s No. 6 bituminous c o a l , 100x200 mesh s i z e , w a s used throughout t h i s i n v e s t i g a t i o n . Its proximate and u l t i m a t e ana lyses a r e included i n Table 5. vacuum a t l l O ° C f o r 24 hours before every run.
t i c a l d e n s i t y , was f i r s t measured i n t o t h e au toc lave . Then a fine-mesh basket con- t a i n i n g 20 grams of t h e d r i e d and s i z e d c o a l w a s suspended a t t h e 3 of t h e a u t o - c lave , 80 t h a t no a c t u a l c o n t a c t between t h e l i q u i d s o l v e n t and t h e c o a l sample w a s poss ib le . W e took t h i s precaut ion t o e l i m i n a t e any ambigui ty in t h e r e s u l t s , where a s i g n i f i c a n t f r a c t i o n o f t h e c o a l would be s o l u b l e under s u p e r c r i t i c a l c o n d i t i o n s but i n s o l u b l e when t h e system was brought back t o ambient c o n d i t i o n s , t h u s p r e c i p i - t a t i n g on t h e ex t rac ted c o a l and causing t h e e x t r a c t i o n y i e l d s (which are based on t h e weight l o s s of t h e raw coa l ) t o appear low (6) . solved under s u p e r c r i t i c a l c o n d i t i o n s i s c a r r i e d through and recovered o u t s i d e t h e basket a f t e r t h e experiment, whether o r not t h i s m a t e r i a l i s s t i l l s o l u b l e .
t r a c t i o n temperature (4OOOC). Following 2 h r s of e x t r a c t i o n , t h e system was cooled t o room temperature ( 2 h r s ) . Yield was def ined a s t h e weight loss of t h e vacuum d r i e d (24 h r s , llO°C), char-containing basket expressed as a percentage of t h e raw, dry-coal weight.
b l e w i t h i n 20.5 w t % (absolu te ) . Solvent r e c o v e r i e s a f t e r e x t r a c t i o n ranged between 96 and 100%. Decreasing t h e p a r t i c l e s i z e and t h e amount of c o a l sample ( f o r a given solvent d e n s i t y ) , and i n c r e a s i n g t h e e x t r a c t i o n t i m e had no e f f e c t on e x t r a c - t i o n y i e l d s . Therefore , t h e repor ted r e s u l t s r e f l e c t a c o n d i t i o n of e q u i l i b r i u m ex- t r a c t i o n wi th no mass t r a n s f e r o r s o l v e n t - s a t u r a t i o n l i m i t a t i o n s .
lyzed f o r e lemental composi t ion, h e a t i n g va lue , and p y r i d i n e s o l u b i l i t y .
A l l s u p e r c r i t i c a l e x t r a c t i o n experiments were c a r r i e d o u t i n ba tch mode, i n a
The c o a l was d r i e d under
I n each run a c e r t a i n amount of s o l v e n t , corresponding t o t h e d e s i r e d s u p e r c r i -
I n our system any m a t e r i a l d i s -
Af te r s e a l i n g and purging, t h e r e a c t o r w a s heated f o r about 1 . 5 h r t o reach ex-
The r e s u l t s on weight-percent e x t r a c t i o n repor ted i n t h i s paper were reproduci-
The e x t r a c t e d c o a l samples, a s w e l l as t h e s u p e r c r i t i c a l e x t r a c t s , were ana-
RESULTS AND DISCUSSION
1. Non-polar Sovent E f f e c t s To determine t h e e f f e c t of t h e p h y s i c a l parameters of t h e s u p e r c r i t i c a l so lvent
on c o a l e x t r a c t i o n , coa l -samples were e x t r a c t e d wi th a homologous series of n-paraf- f i n s (from pentane t o dodecane), a t 4OO0C and a t a c o n s t a n t s o l v e n t d e n s i t y of 2.75 m o l e s f l i t e r . (which is generated by t h e s u p e r c r i t i c a l so lvent i t s e l f ) are given i n Table 1. The c r i t i c a l parameters of t h e p a r a f f i n i c s o l v e n t s are l i s t e d i n Table 2.
The r e s u l t s i n d i c a t e t h a t e x t r a c t i o n y i e l d i n c r e a s e s w i t h increas ing molecular weight of t h e s o l v e n t , dodecane be ing t h e b e s t s u p e r c r i t i c a l so lvent under t h e given experimental condi t ions . On t h e o t h e r hand, e x t r a c t i o n p r e s s u r e d i s p l a y s an i n t e r - e s t i n g behavior , decreas ing with i n c r e a s i n g molecular weight of t h e so lvent ( a t con- s t a n t temperature and molar d e n s i t y ) , then pass ing through a minimum ( f o r nonane) , and f i n a l l y increas ing wi th Increas ing molecular weight .
Based on t h e i r experimental r e s u l t s on high-pressure gas chromatography, Gid- d ings et . a l . (7) suggested t h a t t h e so lvent power of a s u p e r c r i t i c a l medium i s d i - r e c t l y r e l a t e d t o its s o l u b i l i t y parameter , 6 . they developed t h e fo l lowing c o r r e l a t i o n :
R e s u l t s on weight-percent e x t r a c t i o n and f i n a l e x t r a c t i o n p r e s s u r e
Using t h e van d e r Waals equat ion ,
where Pc is t h e c r i t i c a l p r e s s u r e of t h e s o l v e n t i n a tmospheres ,
213
, and A P pr i s i ts reduced d e n s i t y =
p is t h e reduced d e n s i t y of l i q u i d s , taken t o be about 2.66.
' c r i t i c a l
9. It is important t o n o t e h e r e t h a t t h e above c o r r e l a t i o n is l i k e l y t o prove s a t i s f a c - t o r y f o r non-polar s o l v e n t s , b u t i t s v a l u e i n p r e d i c t i n g so lvent c a p a b i l i t i e s when s p e c i a l s o l v e n t e f f e c t s are p r e s e n t ( p o l a r c l u s t e r i n g , hydrogen bonding, e t c . ) i s v e r y much i n doubt . Bless ing and Ross (6 ) . based on a l i m i t e d number of s u p e r c r i t i - c a l e x t r a c t i o n experiments on c o a l and l i g n i t e , concluded t h a t t h e e x t r a c t i o n y ie ld is an almost l i n e r , u n i v e r s a l ( f o r a given coa1)funct ion of t h e s o l u b i l i t y parameter of t h e s o l v e n t as c a l c u l a t e d by t h e Giddings c o r r e l a t i o n , and t h a t r e g a r d l e s s o f t h e i r s t r u c t u r a l d i f f e r e n c e s , a l l compounds l a r g e l y perform i n accordance wi th t h e i r sol- v e n t c a p a b i l i t i e s . f a c t t h a t on ly one p o l a r s o l v e n t (methanol) was included i n t h e i r p l o t of c o a l ex- t r a c t i o n v e r s u s s o l u b i l i t y parameter of t h e s o l v e n t .
Using Giddings' c o r r e l a t i o n , so lubi l i ty -parameter v a l u e s f o r t h e homologous ser- ies of n-paraf f ins were c a l c u l a t e d a t t h e experimental so lvent d e n s i t y of 2.75 moles/ l i t e r . Weight-percent ex t rac- t i o n is p l o t t e d a g a i n s t so lvent s o l u b i l i t y parameter i n F igure 1. from t h e f i g u r e , t h e p l o t is h i g h l y l i n e a r ( c o r r e l a t i o n c o e f f i c i e n t 0.987), yie ld ing t h e fol lowing c o r r e l a t i o n :
This i s a r a t h e r a r b i t r a r y s ta tement , t ak ing i n t o account t h e
The r e s u l t s a r e given i n t h e l a s t column of Table 2. As can be seen
(wt% e x t r a c t i o n ) = 3.056 + 11.2 2) Table 4 inc ludes t h e r e s u l t s on s u p e r c r i t i c a l c o a l e x t r a c t i o n a t 4OO0C and t h r e e
d i f f e r e n t so lvent d e n s i t i e s , f o r another nonpolar hydrocarbon s o l v e n t , namely toluene. Solubi l i ty-parameter v a l u e s c a l c u l a t e d from Giddings' c o r r e l a t i o n a r e given i n t h e l a s t column of Table 4 . c o r r e l a t i o n ( c o r r e l a t i o n c o e f f i c i e n t 0.986):
Linear r e g r e s s i o n on t h e to luene runs y i e l d s t h e fol lowing
(wt% e x t r a c t i o n ) = 3.966 + 10.9 3) A measure of t h e accuracy of t h e experimental r e s u l t s is t h e pred ic ted v a l u e f o r t h e e x t r a c t i o n y i e l d a t t h e l i m i t 6 + 0 (vacuum p y r o l y s i s of c o a l ) , which should be t h e same f o r a l l s o l v e n t s . Equat ions 2 (n-paraf f ins ) and 3 ( to luene) p r e d i c t e x t r a c t i o n l i m i t s very c l o s e t o each o t h e r (11.2 and 10.9 weight percent r e s p e c t i v e l y ) . How- e v e r , cont ra ry to t h e conclusion of Bless ing and Ross, t h e e x t r a c t i o n y i e l d depends a l so o n t h e so lvent f u n c t i o n a l i t y . By comparing equat ions 2 and 3 i t can be seen t h a t t o l u e n e i s a b e t t e r s o l v e n t i n s u p e r c r i t i c a l c o a l e x t r a c t i o n than s t r a i g h t - c h a i n a l i ; p h a t i c hydrocarbons, f o r t h e same v a l u e of t h e Giddings s o l u b i l i t y parameter. w i l l show l a t e r t h e e f f e c t of f u n c t i o n a l i t y i s even s t r o n g e r f o r p o l a r s o l v e n t s .
f e c t e d by molecular s i z e , and t h a t t h e l o n g e s t dimension of each s o l v e n t molecule should be considered when comparing t h e c o a l e x t r a c t i o n e f f i c i e n c i e s of v a r i o u s su- p e r c r i t i c a l s o l v e n t s . The i m p l i c a t i o n h e r e i s t h a t p e n e t r a t i o n o f t h e micropore s t r u c t u r e of t h e c o a l can be achieved more e a s i l y by t h e smaller molecules . Our re- s u l t s on the homologous series of n - p a r a f f i n s , where dodecane, t h e longes t molecule , proved t o be t h e most e f f e c t i v e e x t r a c t i o n s o l v e n t , c e r t a i n l y do n o t support t h i s suggest ion. Mass t r a n s f e r l i m i t a t i o n s do n o t appear t o be s i g n i f i c a n t i n s u p e r c r i t i - c a l c o a l e x t r a c t i o n , a t l e a s t under t h e given experimental condi t ions .
s i t y i n t h e homologous series of n - p a r a f f i n s is worth f u r t h e r cons idera t ion from t h e s tandpoin t of opt imizing t h e e x t r a c t i o n condi t ions . Our r e s u l t s , f o r example, i n d i - c a t e t h a t n-nonane is a s u p e r i o r s o l v e n t than n-pentane i n s u p e r c r i t i c a l c o a l ex t rac- t i o n , n o t only i n terms of t h e h i g h e r e x t r a c t i o n y i e l d , b u t a l s o i n terms of t h e con- s i d e r a b l y lower e x t r a c t i o n pressure .
As we
It has a l s o been suggested (Fong, e t . a l , (8)) t h a t e x t r a c t i o n y i e l d s may be a f -
The behavior of t h e e x t r a c t i o n p r e s s u r e a t cons tan t temperature and molar den-
The Redlich-Kwong equat ion of s t a t e
where n 1 V = molar volume = E ( p = molar d e n s i t y )
4 )
214
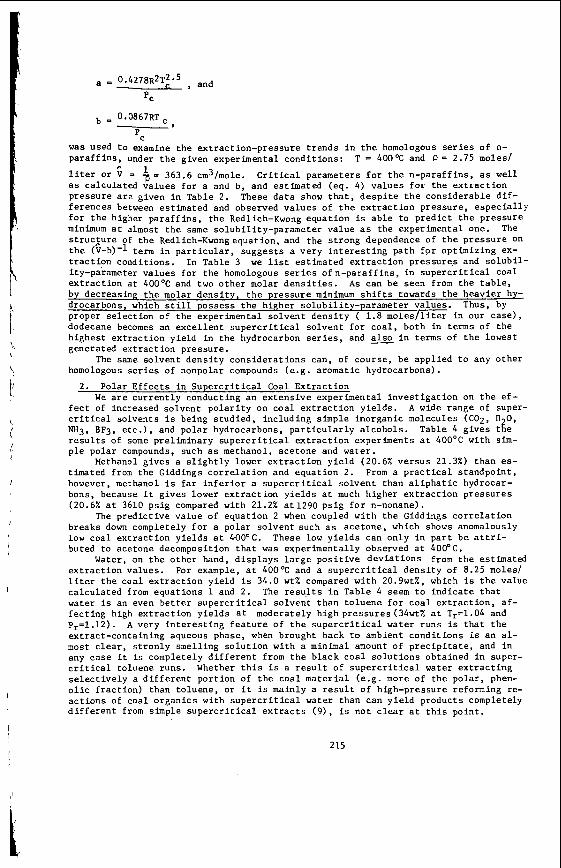
\\
I
I
= 0.0867RTc
pc w a s used t o examine t h e ex t rac t ion-pressure t r e n d s i n t h e homologous series o f n- p a r a f f i n s , under t h e given experimental condi t ions :
l i ter O r V = -p= 363.6 cm3/mole. as ca lcu la ted v a l u e s f o r a and b, and es t imated (eq. 4) va lues f o r t h e e x t r a c t i o n p r e s s u r e a r e given i n Table 2. fe rences between es t imated and observed v a l u e s of t h e e x t r a c t i o n pressure , e s p e c i a l l y f o r t h e higher p a r a f f i n s , t h e Redlich-Kwong equat ion i s a b l e t o p r e d i c t t h e p r e s s u r e minimum a t almost t h e same solubi l i ty -parameter va lue a s t h e experimental one. The s t r u c p r e of t h e Redlich-Kwongequation, and t h e s t r o n g dependence of t h e p r e s s u r e on t h e (V-b)-l term i n p a r t i c u l a r , sugges ts a very i n t e r e s t i n g p a t h f o r op t imiz ing ex- t r a c t i o n condi t ions . ity-parameter v a l u e s f o r t h e homologous series of n-paraff i n s , i n s u p e r c r i t i c a l Coal e x t r a c t i o n a t 4OOOC and two o t h e r molar d e n s i t i e s . As can be seen from t h e t a b l e , by decreasing t h e molar d e n s i t y , t h e p r e s s u r e minimum s h i f t s towards t h e h e a v i e r hy- drocarbons, which s t i l l possess t h e h igher so lubi l i ty -parameter values . Thus, by proper s e l e c t i o n of t h e experimental s o l v e n t d e n s i t y ( 1.8 m o l e s / l i t e r i n our c a s e ) , dodecane becomes an e x c e l l e n t s u p e r c r i t i c a l so lvent f o r c o a l , bo th i n terms of t h e h ighes t e x t r a c t i o n y i e l d i n t h e hydrocarbon s e r i e s , and i n terms of t h e lowest generated e x t r a c t ion pressure .
The same solvent d e n s i t y c o n s i d e r a t i o n s can, of course , be appl ied t o any o t h e r homologous series of nonpolar compounds (e .g . aromatic hydrocarbons).
2 . Polar E f f e c t s i n S u p e r c r i t i c a l Coal E x t r a c t i o n
T = 400% and P = 2.75 moles/ " 1 C r i t i c a l parameters f o r t h e n-paraf f ins , a s w e l l
These d a t a show t h a t , d e s p i t e t h e cons iderable d i f -
I n Table 3 we l i s t es t imated e x t r a c t i o n p r e s s u r e s and s o l u b i l -
We are c u r r e n t l y conduct ing an e x t e n s i v e experimental i n v e s t i g a t i o n on t h e e f - f e c t of increased so lvent p o l a r i t y on c o a l e x t r a c t i o n y i e l d s . c r i t i c a l so lvents i s being s t u d i e d , inc luding s imple inorganic molecules (CO2, H20, hW3, BF3, e t c . ) , and p o l a r hydrocarbons, p a r t i c u l a r l y a l c o h o l s . r e s u l t s of some pre l iminary s u p e r c r i t i c a l e x t r a c t i o n experiments a t 400'C wi th sim- p l e p o l a r compounds, such a s methanol, ace tone and water .
Methanol g ives a s l i g h t l y lower e x t r a c t i o n y i e l d (20.6% v e r s u s 21..3%) than es- t imated from t h e Giddings c o r r e l a t i o n and equat ion 2. From a p r a c t i c a l s t a n d p o i n t , however, methanol i s f a r i n f e r i o r a s u p e r c r i t i c a l s o l v e n t than a l i p h a t i c hydrocar- bons, because it g ives lower e x t r a c t i o n y i e l d s a t much h igher e x t r a c t i o n p r e s s u r e s (20.6% a t 3610 ps ig compared wi th 21.2% a t1290 p s i g f o r n-nonane).
The p r e d i c t i v e v a l u e of equat ion 2 when coupled wi th t h e Giddings c o r r e l a t i o n breaks down completely f o r a polar so lvent such a s ace tone , which shows anomalously low coa l e x t r a c t i o n y i e l d s a t 4 0 O O C . buted t o acetone decomposition t h a t was exper imenta l ly observed a t 40OoC.
from t h e est imated e x t r a c t i o n va lues . For example, a t 4OOOC and a s u p e r c r i t i c a l d e n s i t y of 8.25 moles/ l i ter t h e coa l e x t r a c t i o n y i e l d is 34.0 w t % compared wi th 20.9wt%, which is t h e va lue c a l c u l a t e d from equat ions 1 and 2. The r e s u l t s i n Table 4 seem t o i n d i c a t e t h a t water is an even b e t t e r s u p e r c r i t i c a l s o l v e n t than to luene f o r c o a l e x t r a c t i o n , a f - f e c t i n g high e x t r a c t i o n y i e l d s a t moderately h i g h p r e s s u r e s ( 3 4 w t % a t Tr=1.04 and Pr=1.12). A very i n t e r e s t i n g f e a t u r e of t h e s u p e r c r i t i c a l water runs is t h a t t h e ex t rac t -conta in ing aqueous phase, when brought back to ambient c o n d i t i o n s i s an al- most c l e a r , s t r o n l y smell ing s o l u t i o n w i t h a minimal amount of p r e c i p i t a t e , and i n any c a s e i t is completely d i f f e r e n t from t h e b l a c k c o a l s o l u t i o n s obtained i n super- c r i t i c a l toluene runs. Whether t h i s is a r e s u l t of s u p e r c r i t i c a l water e x t r a c t i n g s e l e c t i v e l y a d i f f e r e n t por t ion of t h e c o a l m a t e r i a l (e .g . more of t h e p o l a r , phen- o l i c f r a c t i o n ) than to luene , o r it i s mainly a r e s u l t of high-pressure reforming re- a c t i o n s of coa l o r g a n i c s wi th s u p e r c r i t i c a l water than can y i e l d products completely d i f f e r e n t from simple s u p e r c r i t i c a l e x t r a c t s ( 9 ) , i s n o t c l e a r a t t h i s po in t .
A wide range of super-
Table 4 g i v e s t h e
These low y i e l d s can only i n p a r t be a t t r i -
Water, on t h e o t h e r hand, d i s p l a y s l a r g e p o s i t i v e d e v i a t i o n s
215
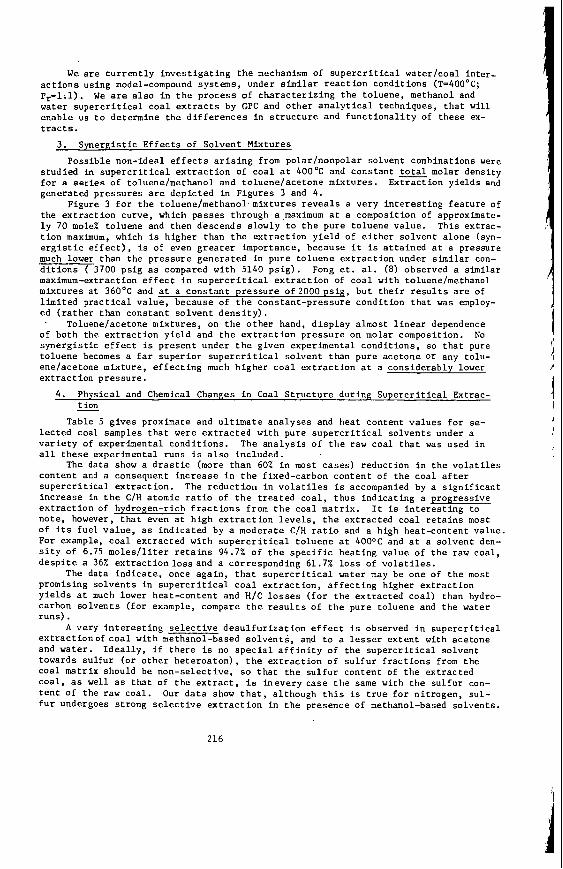
W e a r e c u r r e n t l y i n v e s t i g a t i n g t h e mechanism of s u p e r c r i t i c a l water /coa l i n t e r -
We are a l s o i n t h e p r o c e s s of c h a r a c t e r i z i n g t h e to luene , methanol and a c t i o n s us ing model-compound systems, under s i m i l a r r e a c t i o n condi t ions (T=400°C; p r = l . l ) . water s u p e r c r i t i c a l c o a l extracts by GPC and o t h e r a n a l y t i c a l techniques, t h a t w i l l enable us t o determine t h e d i f f e r e n c e s i n s t r u c t u r e and f u n c t i o n a l i t y of t h e s e ex- tracts.
3. Synerg is t ic E f f e c t s of Solvent Mixtures
P o s s i b l e non-ideal e f f e c t s a r i s i n g from polar /nonpolar so lvent combinations were s tud ied in s u p e r c r i t i c a l e x t r a c t i o n o f c o a l a t 400°C and cons tan t total molar dens i ty f o r a series of toluene/methanol and to luene /ace tone mixtures . E x t r a c t i o n y i e l d s and generated p r e s s u r e s are depic ted i n F igures 3 and 4.
Figure 3 f o r t h e toluene/methanol mixtures r e v e a l s a very i n t e r e s t i n g f e a t u r e of t h e e x t r a c t i o n curve , which passes through a,maximum a t a composition of approximate- l y 70 mole% to luene and then descends s lowly t o t h e pure to luene va lue . This extrac- t i o n maximum, which is h igher than t h e e x t r a c t i o n y i e l d of e i t h e r s o l v e n t a lone (syn- e r g i s t i c e f f e c t ) , i s of even g r e a t e r importance, because i t is a t t a i n e d a t a pressure much lower than t h e p r e s s u r e genera ted i n pure t o l u e n e e x t r a c t i o n under s i m i l a r con- d i t i o n s ( 3700 ps ig as compared wi th 5140 p s i g ) . Fong e t . a l . (8) observed a similar maximum-extraction e f f e c t i n s u p e r c r i t i c a l e x t r a c t i o n of c o a l with toluene/methanol mixtures a t 360°C and a t a c o n s t a n t p r e s s u r e o f 2 0 0 0 p s i g , b u t t h e i r r e s u l t s a r e of l i m i t e d p r a c t i c a l v a l u e , because of t h e cons tan t -pressure condi t ion t h a t was employ- ed ( r a t h e r than cons tan t s o l v e n t d e n s i t y ) . . Toluene/acetone mixtures , on t h e o t h e r hand, d i s p l a y almost l i n e a r dependence
of both the e x t r a c t i o n y i e l d and t h e e x t r a c t i o n p r e s s u r e on molar composition. No s y n e r g i s t i c e f f e c t is p r e s e n t under t h e given experimental c o n d i t i o n s , so t h a t pure t o l u e n e becomes a f a r s u p e r i o r s u p e r c r i t i c a l so lvent than pure ace tone o r any to lu- ene/acetone mixture , e f f e c t i n g much h igher c o a l e x t r a c t i o n a t a cons iderably lower e x t r a c t ion p r e s s u r e .
4. Phys ica l and Chemical Changes i n Coal S t r u c t u r e dur ing S u p e r c r i t i c a l Extrac- t ion
Table 5 g i v e s proximate and u l t i m a t e a n a l y s e s and heat conten t v a l u e s f o r se- l e c t e d coa l samples t h a t were e x t r a c t e d with pure s u p e r c r i t i c a l s o l v e n t s under a v a r i e t y of experimental condi t ions . The a n a l y s i s of t h e raw coa l t h a t was used i n a l l t h e s e experimental runs i s a l s o inc luded .
The d a t a show a d r a s t i c (more than 60% i n most c a s e s ) reduct ion i n t h e v o l a t i l e s conten t and a consequent i n c r e a s e i n t h e f ixed-carbon content of t h e c o a l a f t e r s u p e r c r i t i c a l e x t r a c t i o n . The r e d u c t i o n i n v o l a t i l e s i s accompanied by a s i g n i f i c a n t i n c r e a s e in t h e C/H a tomic r a t i o of t h e t r e a t e d c o a l , t h u s i n d i c a t i n g a p r o g r e s s i v e e x t r a c t i o n of hydrogen-rich f r a c t i o n s from t h e c o a l mat r ix . no te , however, t h a t even a t h i g h e x t r a c t i o n l e v e l s , t h e e x t r a c t e d c o a l r e t a i n s most of i t s f u e l v a l u e , a s i n d i c a t e d by a moderate C/H ra t io and a high heat-content value. For example, c o a l e x t r a c t e d w i t h s u p e r c r i t i c a l t o l u e n e a t 4OODC and a t a so lvent den- s i t y of 6.75 m o l e s / l i t e r r e t a i n s 94.7% of t h e s p e c i f i c h e a t i n g va lue of t h e r a w coa l , d e s p i t e a 36% e x t r a c t i o n l o s s and a cor responding 61 .7% loss of v o l a t i l e s .
promising s o l v e n t s i n s u p e r c r i t i c a l c o a l e x t r a c t i o n , a f f e c t i n g higher e x t r a c t i o n y i e l d s a t much lower hea t -conten t and H / C l o s s e s ( f o r t h e e x t r a c t e d coa l ) than hydro- carbon s o l v e n t s ( f o r example, compare t h e r e s u l t s of t h e pure toluene and t h e water runs).
e x t r a c t i o n o f c o a l wi th methanol-based s o l v e n t s , and t o a l e s s e r e x t e n t with ace tone and water. I d e a l l y , i f t h e r e is no s p e c i a l a f f i n i t y of t h e s u p e r c r i t i c a l so lvent towards s u l f u r ( o r o t h e r heteroatom), t h e e x t r a c t i o n of s u l f u r f r a c t i o n s from t h e c o a l mat r ix should be non-se lec t ive , so t h a t t h e s u l f u r conten t of t h e e x t r a c t e d coa l . as wel l as that of t h e e x t r a c t , i s i n e v e r y c a s e t h e same with t h e s u l f u r con- t e n t of t h e r a w coa l . Our d a t a show t h a t , a l though t h i s i s t r u e f o r n i t r o g e n , sul- f u r undergoes s t rong s e l e c t i v e e x t r a c t i o n i n t h e presence of methanol-based so lvents .
-
It is i n t e r e s t i n g t o
The data i n d i c a t e , once a g a i n , t h a t s u p e r c r i t i c a l water may be one of t h e most
A very i n t e r e s t i n g s e l e c t i v e d e s u l f u r i z a t i o n e f f e c t i s observed i n s u p e r c r i t i c a l
216
i
S u p e r c r i t i c a l e x t r a c t i o n of c o a l wi th pure methanol r e s u l t s i n a 31.8% l e v e l of selective s u l f u r reduct ion , whi le t h e a t h e r two oxygenated s o l v e n t s , ace tone and Water, a l s o d i s p l a y s i g n i f i c a n t ( ~ 2 3 % ) d e s u l f u r i z i n g a c t i o n on e x t r a c t e d c o a l Sam- p les . Chemical p a r t i c i p a t i o n of t h e methanol i n t h e coa l -pyro lys i s s tage , t h a t en- hances s e l e c t i v e l y t h e fragmentat ion of s u l f u r c l u s t e r s i n t h e c o a l molecule and t h e i r subsequent e x t r a c t i o n i n t h e s u p e r c r i t i c a l phase is proposed t o be t h e main cause of t h i s e f f e c t .
s o r p t i o n a t -196OC t o de te rmine t h e e f f e c t of p o s s i b l e changes occur ing i n t h e phys- i c a l S t ruc ture o f t h e c o a l dur ing s u p e r c r i t i c a l e x t r a c t i o n . i n Table 6. A sharp decrease i n t h e a v a i l a b l e s u r f a c e a r e a o f t h e c o a l is observed i n a l l t h e e x t r a c t e d samples, and t h i s decrease , 2 t least f o r t h e p a r a f f i n i c series, i s Progress ive ly more pronounced a t h igher e x t r a c t i o n l e v e l s . Coal, on t h e o t h e r hand, shows a h igher sur face-area r e d u c t i o n than hexane-ex- t r a c t e d c o a l , d e s p i t e t h e lower e x t r a c t i o n l e v e l . The surface-area-reduct ion e f f e c t may be a t t r i b u t e d t o a s h i f t i n t h e pore-s ize d i s t r i b u t i o n of t h e c o a l caused by the e x t r a c t i v e a c t i o n of t h e s u p e r c r i t i c a l so lvent . The removal of c o a l m a t e r i a l from t h e s o l i d mat r ix may r e s u l t in t h e progress ive opening of l a r g e r pore spaces , thus s h i f t i n g the pore-s ize d i s t r i b u t i o n towards t h e macropore range, g e n e r a l l y a s s o c i a t - ed wi th low s p e c i f i c s u r f a c e a r e a s . Swell ing phenomena i n t h e c o a l m a t r i x caused by s t r o n g H-bonding s o l v e n t s , such a s methanol, can c o n t r i b u t e f u r t h e r t o t h e c l o s i n g o f smal le r pores and, thus , t o a d d i t i o n a l c o l l a p s e of t h e microporous network. Fong et . a l . (8) proposed a d i f f e r e n t explana t ion based on t h e r e t e n t i o n of e x t r a c t i n t h e pores . A t t h e end of an e x t r a c t i o n cyc le , t h e removal of t h e v o l a t i l e super- c r i t i c a l so lvent from t h e pores could r e s u l t i n p a r t i a l condensat ion of t h e c o a l ex- t r a c t and, thus , i n ex tens ive pore blockage.
s o l u b i l i t y of raw and e x t r a c t e d c o a l samples. samples were determined by s t i r r i n g 0.5 grams i n 50 cm3 p y r i d i n e f o r 2 h r s a t room temperature , then f i l t e r i n g and evapora t ing t h e s o l v e n t , and dry ing t h e s o l i d resi- due under vacuum a t l l O ° C f o r 24 h r s . to luene and pure methanol runs a r e given below:
F ina l ly , s u r f a c e a r e a s of e x t r a c t e d c o a l samples were measured by n i t r o g e n ad-
The r e s u l t s are given
Methanol-extracted
Concluding t h i s s e c t i o n w e would l i k e t o r e p o r t some r e s u l t s on t h e p y r i d i n e The p y r i d i n e s o l u b i l i t i e s of d r i e d
Resul t s f o r t h e raw c o a l and f o r t h e pure
R A W C O A L
Toluene 4n0°c, 36.0
6.75 moles l i t e r
Met ha no1 4OO0C, 20.6
6.15 _moles l i t e r
I S u p e r c r i t i c a l Ext rac t ion Weight Percent P y r i d i n e S o l u b i l i t y I Solvent I Condit ions I E x t r a c t i o n 1 of Ext rac ted Coal (%)
1 1 . 2
0.8
2.4
217
SUMMARY
and so lvent mixtures t h a t can a f f e c t t h e y i e l d and t h e p r o p e r t i e s of c o a l e x t r a c t s were experimental ly i n v e s t i g a t e d . S t rong non-ideal i n t e r a c t i o n s , such as p o l a r for - ces and hydrogen bonding, as w e l l a s s y n e r g i s t i c i n t e r a c t i o n s in multicomponent sol- vent mixtures , were shown t o produce l a r g e d e v i a t i o n s from t h e s imple, dens i ty- d r i v e n s u p e r c r i t i c a l s o l u b i l i t y . These i n t e r a c t i o n s c a n be manipulated t o opt imize s u p e r c r i t i c a l c o a l e x t r a c t i o n by reducing t h e s e v e r i t y of t h e e x t r a c t i o n condi t ions (pressure i n p a r t i c u l a r ) . t u r e during s u p e r c r i t i c a l s o l v e n t e x t r a c t i o n were a l s o examined.
ACKNOWLEDGEMENTS
The s p e c i f i c p h y s i c a l and chemical c h a r a c t e r i s t i c s of s u p e r c r i t i c a l s o l v e n t s
Phys ica l and chemical changes occur ing i n t h e coa l s t r u c -
This work w a s supported by t h e United S t a t e s Department of Energy under Grant No. DE-FG22-81PC40801 and by t h e Center f o r Energy S t u d i e s , Aust in , Texas. The sup- port of t h e two agencies is g r a t e f u l l y acknowledged.
REFERENCES
1. 2 .
3 . 4 .
5 . 6 .
7. 8.
9.
Gangoll. N. and Thodos, G. , Ind . Eng. Chem., Prod. Res. Dev., 5, 208 (1977). Whitehead, J. C . , "Development of a Process f o r t h e S u p e r c r i t i c a l Gas Ext rac t ion of Coal", paper presented a t t h e 8 8 t h AIChE Nat iona l Meeting, Phi lade lphia , June 1980. Adams, R. M.,Knebel, A. H. and Rhodes, D. E . , Chem. Engr. Progr . , 2, 44 (1979). Paul , P. F. M. and Wise, W. S . , "The P r i n c i p l e s of Gas Extract ion", M i l l s and Boon Ltd., London (1971). Rowlinson, J.S. and Richardson, M. J . , Adv. Chem. Phys., 2, 85 (1959). Blessing. J. E. and Ross, D. S . , " S u p e r c r i t i c a l Solvents i n t h e Disso lu t ion of Coal and Ligni te" , in "Organic Chemistry of Coal", Larsen, J. W. ( ea . ) , ACS Symposium S e r i e s No. 71, Washington, D.C., 1978. pp. 171-185. Giddings, J. C. , et. a l . , Science, 162, 67 (1968). Fong. W. S . , et. a l . , "Experimental Observat ions on a Systematic Approach t o S u p e r c r i t i c a l E x t r a c t i o n of Coal", paper presented a t t h e 8 9 t h AIChE National Meeting, New Orleans, Louis iana, November 1981. Modell, M . , Reid, R. C. and Amin, S. I., U.S. P a t e n t No. 4113446, 1978.
218
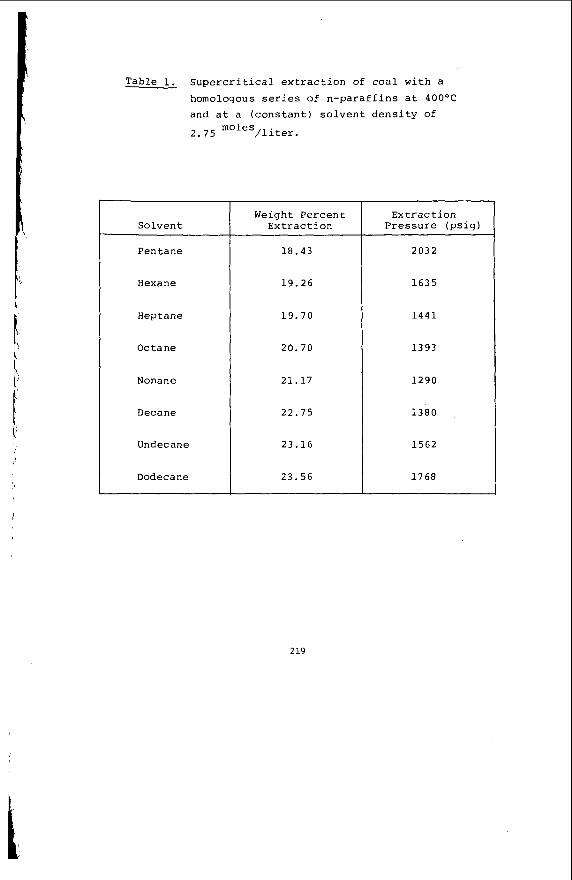
'!
D o d e c a n e I
2 3 . 5 6
T a b l e 1. S u p e r c r i t i c a l e x t r a c t i o n of coal w i t h a h o m o l o g o u s series of n - p a r a f f i n s a t 400°C a n d a t a ( c o n s t a n t ) s o l v e n t d e n s i t y of
2 . 7 5 moles/liter.
I W e i g h t P e r c e n t S o l v e n t E x t r a c t i o n
E x t r a c t i o n P r e s s u r e ( p s i g )
2 0 3 2
1 6 3 5
1441
1 3 9 3
1 2 9 0
1380
1 5 6 2
1 7 6 8
219
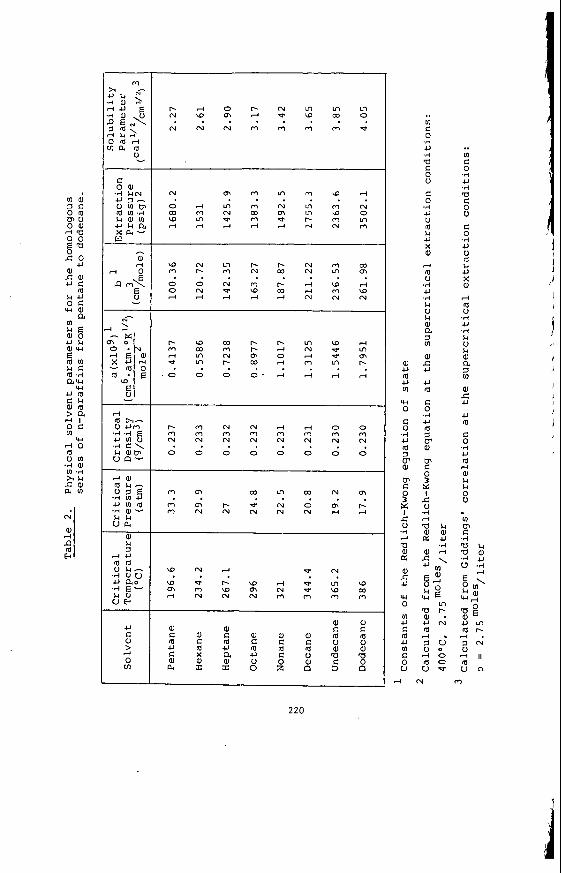
N m m m m w r l
O r l m m N t n m ~ m m m m m m w o w m a m v r - m m r l r l r l r l r l d ~ m
. . . . . .
r - m N N r l d 0 0 m m m m m m m m N N N N N N N N . . . . . . . . 0 0 0 0 0 0 0 0
W N r l . . . - J N . .
a, 4J m +J m w 0 C 4 4J
7 m F
m
x e .rl rl a d a, .c 4J
w 0 m U
m 4J
C
U
r l N
220
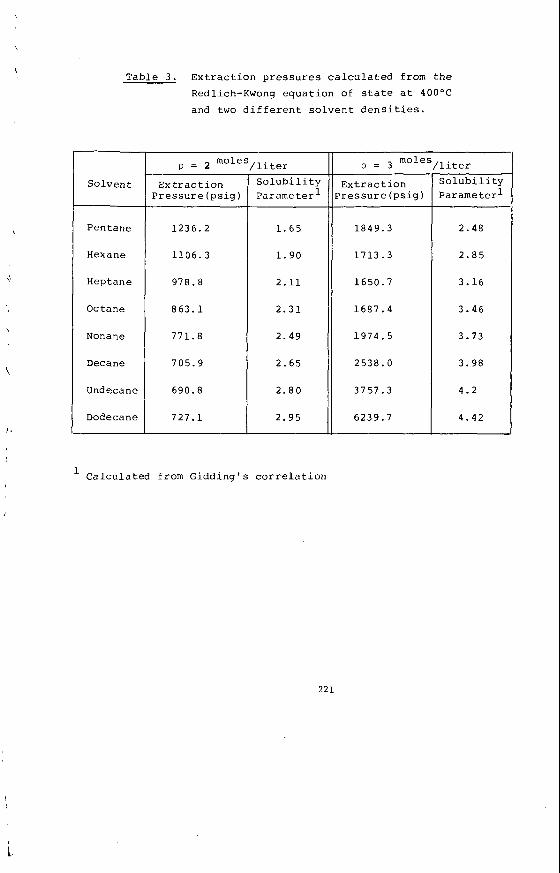
T a b l e 3 . E x t r a c t i o n p r e s s u r e s c a l c u l a t e d f r o m t h e
R e d l i c h - K w o n g e q u a t i o n of s t a t e a t 4OOOC
a n d t w o d i f f e r e n t s o l v e n t d e n s i t i e s .
S o l v e n t
P e n t a n e
H e x a n e
H e p t a n e
O c t a n e
Nonane
D e c a n e
U n d e c a n e
Dode c a n e
Ex t r a c t i o n P r e s s u r e ( p s i g )
1 2 3 6 . 2
1 1 0 6 . 3
978.8
8 6 3 . 1
771.8
705.9
690.8
7 2 7 . 1
' l i t e r S o l u b i l i t y P a r a m e t e r '
1 . 6 5
1 . 9 0
2 . 1 1
2 . 3 1
2.49
2 .65
2 . 8 0
2 .95
E x t r a c t i o n ' r e s s u r e ( p s i g )
1 8 4 9 . 3
1713.3
1650.7
1 6 8 7 . 4
1 9 7 4 . 5
2538.0
3 7 5 7 . 3
6239.7
S o l u b i l i t y P a r a m e t e r 1
2.48
2 .85
3.16
3 .46
3.73
3 .98
4.2
4.42
C a l c u l a t e d from G i d d i n g ' s c o r r e l a t i o n I
221
t.
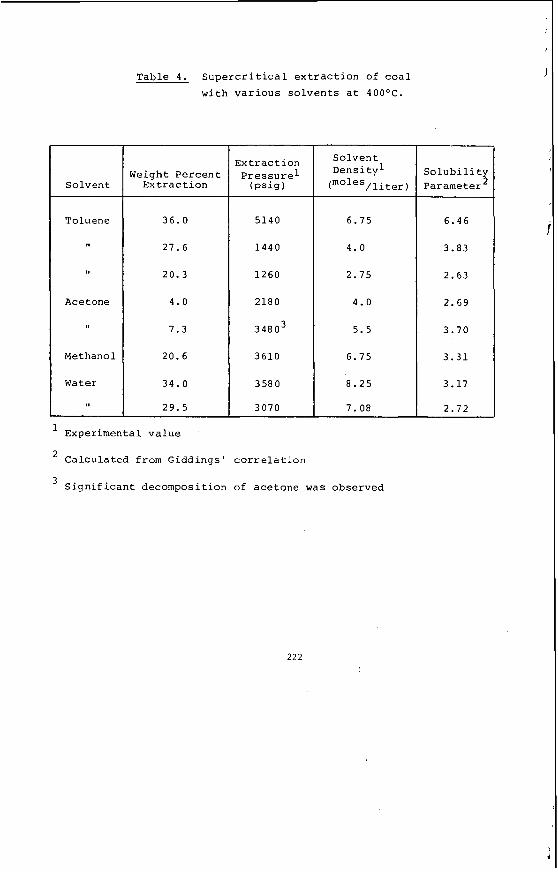
T a b l e 4. S u p e r c r i t i c a l e x t r a c t i o n of c o a l
w i t h v a r i o u s s o l v e n t s a t 400OC.
S o l v e n t
T o l u e n e
A c e t o n e
M e t h a n o l
W a t e r
M e i g h t P e r c e n t Ex t r a c t i o n
36.0
27.6
20.3
4.0
7.3
20.6
34.0
29.5
E x t r a c t i o n P r e s s u r e 1 ( w i g )
5140
1440
1260
2180
34803
3610
3580
3070
S o l v e n t D e n s i t y
(moles/liter)
6.75
4.0
2.75
4.0
5.5
6.75
8.25
7.08
E x p e r i m e n t a l v a l u e
C a l c u l a t e d f r o m G i d d i n g s ' c o r r e l a t i o n
S i g n i f i c a n t d e c o m p o s i t i o n of a c e t o n e w a s o b s e r v e d
Y S o l u b i li t P a r a m e t e r
6.46
3.83
2.63
2.69
3.70
3.31
3.17
2.72
222
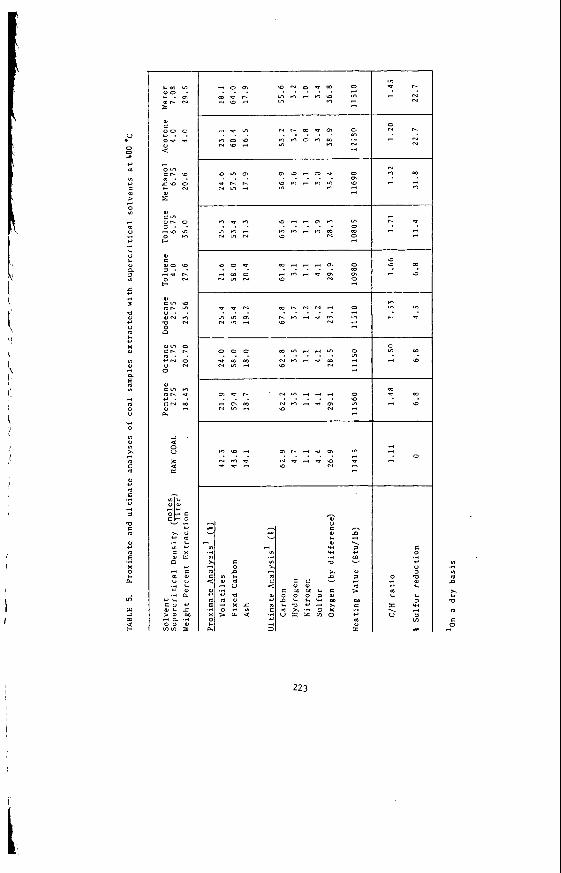
I
u
0 0 -t
Y m VI I.' C W > 3 0 m
3
m U .i e,
I. U I. W n
2 5 3 Q
Y
U m L Y
x
VI W 3 n
5 3 m 0 u
c 0
Y) o Y) x 3 m
m o e, m E .3
3 3 m e o ' m
x c n.
.3
v; w
m U
m . n . - o n o m o m 3 m Y . .n Ln m 3
3
1 0 - 0 ,
9 r . h N Y 1 3
. . . . . . . .
m 3 3 . - m 0 m 3 m 3 n m a' .0 N O 3
1 0 0 -
3 m c N L n N
. . . . . . . .
m h N N 3 O
c m 3 n m Y,
10 N d 3
.. _ O N
m m m N Y , 3
. . . . . . . .
m m r ( i Y ) D Ln
N m 3 9 m 3 10 N 3
3
O O C
- a m N Y 1 3
. . . . . . . .
- n 3 . 3 Y m v
W
3 a
2 M K ... Y
o e
Ln n r . . . 3 N N
0 N r -
. - N N
. .
N . o m
3 3 m . .
3 r . n . . 3 3 3
10 1 0 -
3 . n . .
m Y I Y ,
- 9 . .
0 Y , m
3 1 0 . .
01 n m . . 3 . 0
3 " ..- . o
C 0 .3 Y
u o m ._( o e , *
* c e w . A
v) u a
Y)
Y)
0 m
e m m K 0
3
223
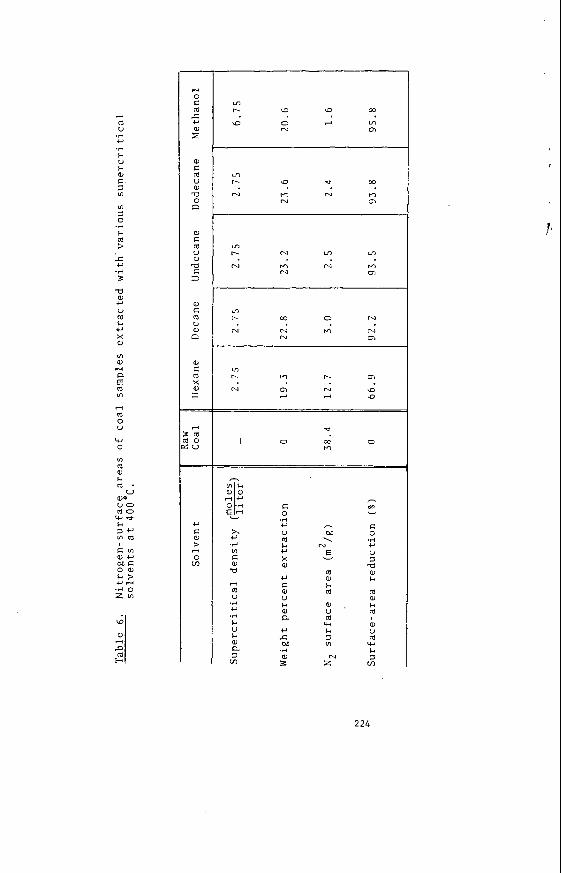
rl m U
.r( u .d h U h a, !=
2 m i
.rl h
? c u .,-I 3 a a, CI U m b. +J X
VI a, d P E VI
rl m 0 u * 0
m m a, c m . u mo u o m 0 *e h
22 c m a,- W K 0 0 c > u r l .rl 0 ZVI
W
a, r(
P m +
4 0 c - 2 u a, 2
a, K m U a, a 0 n
a, c m V W a 3
a,
m U a, c
W c x I:
__ __
rl : m ; 2 =
u C
> rl
0 m
m r. \D -s W
N r)
c1 N v.
N
Ln I- N Ln m N M N M
N a
m r. W 0 N
N N M N N 0 1
* 0 02 0
M I
C 0 .,-I u U m h u x a,
u E U c a, a u c M
.r(
a, z
h
\ N
E
m a, h m a, U m VI h 3 m
v
N z
h
0" v
c 0
.rl u U i TI a, h
m a, h m a, U m vi h 3 m
224
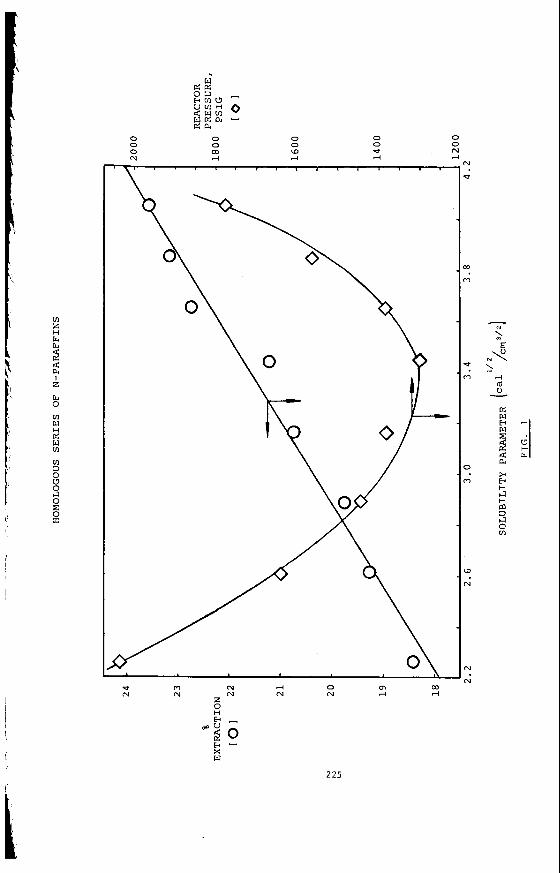
Lo z H h
3 d z h 0 Lo w H a w tn
Lo 3 0 c7 0 c-7 0 s:
0 0 0 N
w a a 0 3 E m u - V f f l H 0 4 W f f l w a a - a &
0 0 m
0 0 W rl
0 0
rl
Q- m N rl 0 a m N N N N N rl rl
*go E ' X w
225
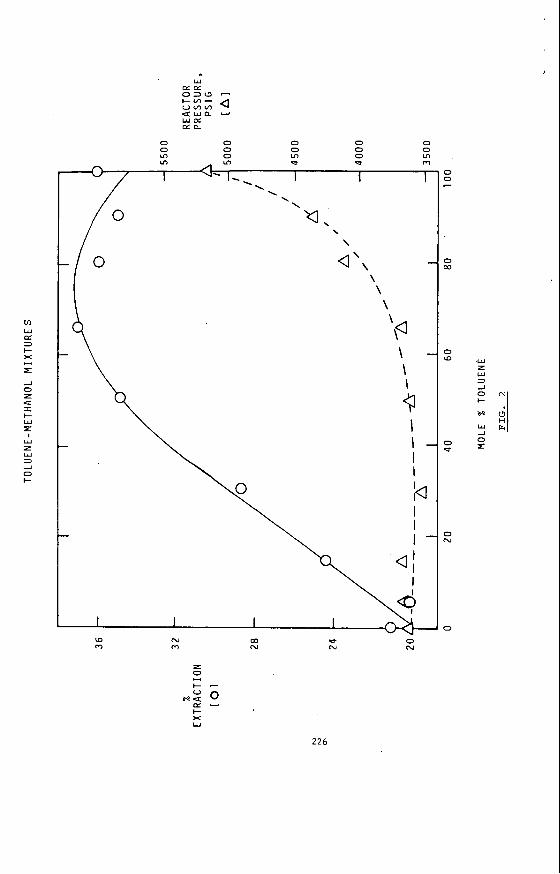
W
0 0 0 0 0 0 0 0 0 0
Ln Ln 0 LD 0 LD Ln e e m rn
W I I I \
\ 1
\ -
\ \
‘a, , / \
- I 0 4 \ \ \ \ \ 4
4 \ I
(D m 0
N
0 0 -
0 W
0 N
0
226
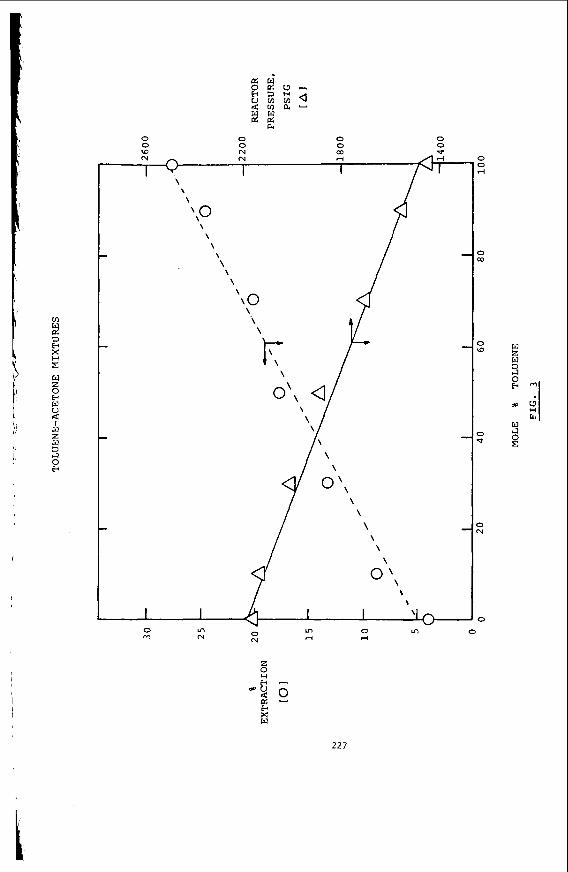
0 0 0 0 0 0 0 0 10 N m - N N r( / l r (
I Y I I I \
\ \ \ \ \ \ \
10 \
\ \ \
IT
i I I \
I \
VI 0 VI 0 rl rl
0 N
0 VI m N
0 0 4
0 m
z , ” W 3 cl 0 E
3 -4
0
227
THE ROLE OF THERMAL CHEMICAL PROCESSES I N
SUPERCRITICAL GAS EXTRACTION OF COAL
Many f a c t o r s which l i m i t t h e chemical convers ion o f i n s o l u b l e , s o l i d coal t o s o l u b l e , s m a l l e r fragments a r e due t o phenomena which are no t r o u t i n e l y encountered i n t h e chemical l a b o r a t o r y o r i n t h e chemical p rocess ing i n d u s t r y . I n t h e f i r s t p lace , i t o f t e n appears t h a t ' t h e r a t e and e x t e n t o f coal convers ion i s c o n t r o l l e d by a c c e s s i b i l i t y t o r e a c t i o n s i t e s r a t h e r than by r e a c t i o n energet ics1. t h e chemical o b j e c t i v e , d e p o l y m e r i z a t i o n , i s e x a c t l y t h e reverse o f t h a t o f a major
Secondly, I
Thomas G. Squires*, Tetsuo Aida, Yu-Ying Chen, and Barbara F. Smith
Energy & M i n e r a l Resources Research I n s t i t u t e Iowa S t a t e U n i v e r s i t y , Ames, Iowa 50011
228

I
I I
I n Some l i q u e f a c t i o n processes, t h e former o b j e c t i v e has been accomplished by i n t r o d u c i n g a hydrogen donor s t a b i l i z i n g reagent i n t o t h e convers ion mixture81g. Other processes have sought t o achieve t h e l a t t e r o b j e c t i v e by h e a t i n g t h e r e a c t i o n m i x t u r e r a p i d l y and l i m i t i n g t h e r e a c t i o n time'. While t h i s approach has been P a r t i a l l y e f f e c t i v e , i t does n o t address t h e r o o t o f t h e problem: i n t i m a t e c o n t a c t between r e a c t i v e fragments and res idua a t e leva ted temperature f o r l ong per iods.
Rapid vacuum p y r o l y s i s o f a t h i n bed o f coa l e f f e c t i v e l y min imizes r e t r o g r e s - s i v e char- forming r e a c t i o n s by cont inuous removal o f v o l a t i l e t a r fragments as they a re generated1O. Given t h e e f f e c t i v n e s s o f t h i s approach t o i n h i b i t i n g char form- i n g reac t i ons , i t i s s u r p r i s i n g t h a t t h e concept has n o t been a p p l i e d t o o t h e r thermal l i q u e f a c t i o n processes. Yet v i r t u a l l y a l l o f these processes operate i n t h e batch mode. n o t designed t o q u i c k l y separate r e a c t i v e coal fragments from r e a c t i v e coal r e s i d - ua. Moreover, researchers i n t h i s area have d i r e c t e d l i t t l e o r no e f f o r t t o ex- p l o r i n g such ideas. Most i n v e s t i g a t o r s c o n t i n u e t o employ ba tch mode techniques i n which coal fragments and r e s i d u a a re mixed a t e leva ted temperatures f o r s u b s t a n t i a l per iods. and secondary products i n a system as complex as coa l . t a n t o b j e c t i v e o f t h i s research i s t o develop a f l o w mode r e a c t o r system capable o f r a p i d l y separa t i ng coa l fragments from res idua and t o i n v e s t i g a t e p r imary and sec- ondary reac t i ons i n t h e chemical convers ions o f coal .
Even those processes which p u r p o r t t o ope ra te i n a f l o w mode are
Under such c o n d i t i o n s , i t i s imposs ib le t o d i s t i n g u i s h between pr imary Therefore, a t h i r d impor-
EXPERIMENTAL
General T l i n o i s #6 coa l from t h e Ames Lab Coal L i b r a r y was used i n these s tud ies . Th is coal has t h e f o l l o w i n g u l t i m a t e a n a l y s i s (dmmf b a s i s ) : 78.82% C; 5.50% H; 1.59% N; 2.29% S ; and 10.05% ash. P r i o r t o use, t h i s coal was ground, s i z e d t o 60 x 10Er4esh and d r i e d a t l l O ° C o v e r n i g h t under vacuum. e x t e n t o f d e v o l a t i l i z a t i o n , and e x t r a c t i o n y i e l d s are repo r ted on a raw coal basis.
Vacuum P y r o l y s i s Vacuum p y r o l y s i s experiments were conducted w i t h a constant vo l tage heated
g r i d a p p a r a t u s l l surrounded by a water j a c k e t e d condenser f o r c o l l e c t i n g t h e t a r and equipped w i t h a l i q u i d n i t r o g e n c o l d f i n g e r condenser f o r c o l l e c t i n g t h e l i g h t gases. I n a t y p i c a l exper iment , 200 mg o f I l l i n o i s #6 coa l and a Chromel-Alumel microthermocouple were p laced i n t h e g r i d , and t h e system pressure was ad jus ted t o 0.25 mm by b l e e d i n g He i n t o t h e system. Th is slow He purge was mainta ined through- o u t t h e run, and t h e pressure and temperature were c o n t i n u o u s l y monitored. The g r i d was then heated a t an i n i t i a l r a t e o f app rox ima te l y 200"C/min. t o t h e p ro - grammed f i n a l temperature where i t was mainta ined f o r 60 minutes. The e x t e n t o f d e v o l a t i l i z a t i o n was determined by measuring t h e weight o f char remain ing i n t h e g r i d .
Weight l o s s ,
Coal E x t r a c t i o n w i t h Methanol F ow mode e x t r a c t i o n o f coal w i t h methanol was c a r r i e d o u t i n t h e an apparatus
desc r i ked p rev ious l y12 . A boos te r h e a t i n g tape was wrapped around t h e r e a c t o r t o p rov ide r a p i d heat up c a p a b i l i t y . reac to r , and the ends were sealed w i t h 2 m ic ron s t a i n l e s s s t e e l f r i t s . The f r e e volume i n t h e loaded r e a c t o r was found t o be 0.70 m l . A f t e r connect ing t h e r e a c t o r and pu rg ing t h e e n t i r e system w i t h n i t r o g e n , t h e apparatus was f i l l e d w i t h methanol and pressur ized. I n r a p i d sequence, t h e r e a c t o r was i n s e r t e d i n t o t h e preheated furnace; and, as f l o w th rough t h e r e a c t o r was i n i t i a t e d , t h e r e a c t o r boos te r heater
Coal (ca. 500 mg.) was p laced i n t h e t u b u l a r
229
was swi tched on. t o t h a t of t h e heated g r i d . minutes, and t h e boos te r hea te r was sw i t ched o f f . s t a n t temperature, pressure, and f l o w r a t e (0.8-1 .O m l h i n . ) were mainta ined. A f t e r e x t r a c t i n g f o r two hours, t h e system was purged w i t h N2 and cooled t o roan temperature. ove rn igh t , and weighed t o determine t h e e x t e n t o f e x t r a c t i o n .
The h e a t i n g p r o f i l e f o r t h i s r e a c t o r was approx imate ly equ iva len t A s t a b l e f i n a l temperature was a t t a i n e d i n l e s s than 5
Throughout t h e e x t r a c t i o n con-
The r e a c t o r residuum was removed, d r i e d i n a vacuum oven a t 110°C
So lven t E x t r a c t i o n o f Coals and Residua
and u l t r a s o n i c a l l y i r r a d i a t e d under ambient c o n d i t i o n s f o r 30 minutes. The r e s u l t - Coal (ca. 500 mg) o r residuum (ca. 100 mg) was mixed w i t h 10 m l o f p y r i d i n e
i n g m i x t u r e was f i l t e r e d w i t h s u c t i o n th rough a 3 m ic ron M i l l i p o r e f i l t e r , and t h e s o l i d was washed w i t h an a d d i t i o n a l 10 m l o f so l ven t . A f t e r d r y i n g ove rn igh t a t 110°C under vacuum, t h e s o l i d was weighed t o determine t h e e x t e n t o f e x t r a c t i o n .
RESULTS AND DISCUSSIONS
The pr imary o b j e c t i v e s o f o u r i n v e s t i g a t i o n s of t h e SGE of coa l a re t h e
( 1 ) To d i f f e r e n t i a t e t h e e x t r a c t i v e and p y r o l y t i c components o f t h i s process; ( 2 ) To exp lo re f l o w mode concepts as a mean o f i n h i b i t i n g secondary r e a c t i o n s
by r a p i d l y removing p roduc ts f rom t h e r e a c t i o n zone; (3 ) To compare t h e e f f e c t i v e n e s s o f s u b c r i t i c a l and s u p e r c r i t i c a l so l ven ts i n
t h e e x t r a c t i o n o f coa l .
f o l l o w i n g :
Progress toward t h e f i r s t two o b j e c t i v e s has been achieved through two p a r a l l e l s e r i e s o f experiments.
E x t r a c t i v e and P y r o l y t i c Phenomena I n t h e f i r s t s e r i e s o f exper iments, weight l o s s of an I l l i n o i s #6 coa l was
determined as a f u n c t i o n o f t h e f i n a l coa l bed temperature us ing a heated g r i d vacuum py ro l yze r . g r i d temperature measured under t h e same c o n d i t i o n s . While t h e exper imenta l d i f f i - c u l t y o f measuring t h e a c t u a l bed temperature i s recognizedlO, we have repo r ted t h e bed temperature because t h e g r i d tempera tu re i s assu red ly a t tenua ted by heat t r a n s - f e r i n e f f i c i e n c i e s and because i t i s t h e bed temperature t h a t a c t u a l l y e f f e c t s t h e coa l p y r o l y s i s . s idua was a l s o determined. Resu l t s f rom these exper iments are repo r ted i n Table 1 and p l o t t e d i n F i g u r e 1.
The f i r s t process, which occurs a t a f i n a l temperature o f app rox ima te l y 2OO0C, apparen t l y a l t e r s t h e s o l i d coal s t r u c t u r e i n a way t h a t reduces i t s p y r i d i n e ex- t r a c t i b i l i t y . While t h i s may be a p h y s i c a l a l t e r a t i o n , one chemical change which would e x p l a i n t h i s i s t h e f o r m a t i o n o f c r o s s l i n k s . Whatever t h e cause, hea t ing and m a i n t a i n i n g t h e coa l a t 200°C decreases i t s ambient s o l u b i l i t y i n p y r i d i n e and, presumably, o t h e r so l ven ts as w e l l .
t o 350OC. m o l y s i s of weak bonds i n coa l l 0313 . es, as manifested by more e x t e n s i v e d e v o l a t i l i z a t i o n , i s ev iden t a t h ighe r tempera- t u r e s , e.g. 32% we igh t l o s s a t 528°C. d e r i v e from f i n a l temperatures above 35OOC a re m i n i m a l l y s o l u b l e i n p y r i d i n e .
f l o w mode r e a c t o r . Flow r a t e s were ad jus ted so t h a t methanol res idence t imes i n
The recorded bed temperature was up t o 50OC l e s s than t h e blank
The room temperature p y r i d i n e s o l u b i l i t y o f each o f t h e g r i d r e -
The occurrence o f two t ypes o f thermal processes a re revealed by F i g u r e 1.
The onset of t h e second process, d e v o l a t i l i z a t i o n , i s c l e a r l y ev iden t a t 300 Such behav io r has c o n s i s t e n t l y been i n t e r p r e t e d as r e s u l t i n g from t h e r -
An a c c e l e r a t i o n o f these p y r o l y t i c process-
I t i s impor tan t t o no te t h a t res idua which
A p a r a l l e l s e r i e s o f exper iments were conducted us ing a s h o r t res idence time.
230

t h e r e a c t o r were l e s s than one minute, and experiments were conducted t o detennine t h e e f f e c t o f e x t r a c t i o n t i m e on SGE y i e l d s a t 32OOC and 3000 p s i . These r e s u l t s , which are i nc luded i n Table 2 (Runs 8 and 9 ) , e s t a b l i s h t h a t over 90% o f t h e u l t i - mate e x t r a c t i o n has been accomplished w i t h i n 30 minutes under these c o n d i t i o n s . On t h i s bas i s , e x t r a c t i o n t imes of two hours (corresponding t o a t o t a l e x t r a c t i o n volume of 100 t o 120 m l ) were used f o r t h e remainder of t h e e x t r a c t i o n s . hour e x t r a c t i o n y i e l d s ( a t 3000 p s i ) were then determined as a f u n c t i o n of tempera- t u r e ; and these r e s u l t s and t h e p y r i d i n e e x t r a c t i b i l i t y of t h e res idua a r e i n c l u d - ed i n Table 2 and p l o t t e d i n F igu re 2.
The weight loss- temperature p r o f i l e from these exper iments, shown i n F i g u r e 2, i s remarkably s i m i l a r t o t h e p r o f i l e generated by t h e heated g r i d exper iments. 200°C a chemical o r phys i ca l change has occurred which depresses t h e t o t a l e x t r a c t - i b i l i t y of t h e c o a l , and t h e onset o f ex tens i ve p y r o l y s i s i s aga in ev iden t above 325OC. The co inc idence o f t hese thermal phenomena i n t h e heated g r i d py ro l yses and t h e methanol f l o w mode e x t r a c t i o n o f I l l i n o i s #6 coal i s c l e a r evidence t h a t t h e r - mal decomposit ion processes cannot be i gno red i n SGE exper iments conducted above 325°C. Rutkowski i n t h e i r i n v e s t i g a t ' o n s o f t o luene (T =32OoC) f l o w mode e x t r a c t i b i l i t y of an equ iva len t P o l i s h coal14. By determining'the e x t r a c t i o n y i e l d as a f u n c t i o n o f t ime and temperature, t hey found these e x t r a c t i o n s t o be c o n t r o l l e d by two d i s - t i n c t energ ies o f a c t i v a t i o n . Between 200 and 320"C, Ea was about 3kJ/mole which i s c o n s i s t e n t w i t h t h e opera t i on o f d i f f u s i o n c o n t r o l l e d , p h y s i c a l d i s s o l u t i o n process. A t h ighe r temperatures (35O-41O0C), Ea was found t o be 101 kJ/mole, and t h i s can be taken as c l e a r evidence f o r t h e opera t i on o f chemical processes.
I n f a c t when considered i n c o n j u n c t i o n w i t h t h e i n v e s t i g a t i o n s o f Slomak and Rutkowski, our experiments p r o v i d e compel l i n g evidence t h a t , above 35OoC, t h e SGE o f coa l i s c o n t r o l l e d by thermal decomposi t ion processes r a t h e r than p h y s i c a l ex- t r a c t i o n processes. I n l i g h t o f t h i s f i n d i n g , i t i s s u r p r i s i n g t o d i scove r a co r - r e l a t i o n between conver i o n y i e l d s and H i l deb rand s o l u b i l i t y parameters (6) f o r t h e SGE of coal above 325OCj.5. Y ie lds should be i n f l u e n c e d by t h e chemical na tu re o f t h e so l ven t i n t h i s temperature range, and any c o r r e l a t i o n wi th 6 must be co in - c i d e n t a l o r due t o secondary e f f e c t s .
Flow Mode vs. Batch Mode E x t r a c t i o n
t h e coal e x t r a c t , once generated, i s i n con tac t w i t h t h e res idua f o r l e s s than a minute. Although t h i s t i m e i s l o n g by mo lecu la r s tandards, i t i s sho r t compared t o con tac t t imes (45-100 minutes) i n ba tch e x t r a c t i o n of coa l . While these considera- t i o n s a re no t impor tan t below 325OC, they can c e r t a i n l y determine t h e e f f i c i e n c y and ex ten t o f SGE a t h ighe r temperatures. A t 4OO0C, one can h a r d l y expect a c o a l - l i k e fragment t o be chemica l l y i n e r t under c o n d i t i o n s which cause coal t o reac t o r d u r i n g var ious encounters w i t h o t h e r fragments, res idua , and r e a c t i v e i n te rmed ia tes d e r i v e d from these species.
The e f f i c a c y of f l o w mode e x t r a c t i o n i n m in im iz ing secondary, char- forming reac i ons i s demonstrated by t h e exper iments repo r ted here. Prev ious i n v e s t i g a -
present i n v e s t i g a t i o n a y i e l d o f 31% was obta ined, i n d i c a t i n g . t ha t , i n t h e batch mode, a t l e a s t o n e - t h i r d o f t h e l ' q u i d product i s l o s t t o char.
e x t r a c t up t o 12% o f t h e e x t r a c t i o n residua. w i t h p y r i d i n e . t o e x t r a c t i o n i n e f f i c i e n c i e s and t o r e d e p o s i t i o n o f s o l u b i l i z e d m a t e r i a l . Our r e s u l t s c l e a r l y show t h a t t h i s r e s i d u a l p y r i d i n e s o l u b l e m a t e r i a l can be removed u s i n g f l o w mode e x t r a c t i o n .
The two
By
These r e s u l t s a re i n s u b s t a n t i a l agreement w i t h those o f Slomka and
I n t h e f low mode e x t r a c t i o n o f coal w i t h methanol u t i l i z e d f o r t hese s tud ies ,
t o r s 5' have repo r ted maximum methanol e x t r a c t i o n y i e l d s o f 19% a t 450°C. I n the
F i n a l l y , o t h e r i nves t i ga to rs ' , us ing batch mode e x t r a c t i o n , have been able t o Presumably, t h i s i s due
231
ACKNOWLEDGEMENT Th is m a t e r i a l was prepared w i t h t h e suppor t o f t h e U. S. Department o f Enerqy.
Grant No. DE-FG22-82PC50786. However, any op in ions , f i n d i n g s , conc lus ions , o r -. recommendations expressed h e r e i n a r e those o f t h e authors and do not n e c e s s a r i l y r e f l e c t t h e views o f DOE.
I.
2.
3 . 4.
5.
6. 7.
8.
9.
10.
11.
12. 13. 14.
REFERENCES ' Larsen, J. W.; Green, T. K.; Choudhury, P.; Kuemrnerle, E. W. I n "Coal
S t r u c t u r e " ; Am. Chem. SOC. Adv. Chem. Ser. 1981, 192, 277. Paul, P. F. M.; Wise, W. S. "The P r i n c i p l e s o f G a s x t r a c t i o n ; " M i l l s and Boon: London, 1971 . Schneider, G. M. Angew. Chem., I n t . Ed. Engl. 1978, 17, 716. Jezko, J.; Gray, D.; Kershaw, J. R. Fue l Process ing Tech. 1982, 5, 229 and references c i t e d t h e r e i n . B less ing , J. E.; Ross, D. S. I n "The Organic Chemist ry o f Coal"; Am. Chem. SOC. Symp. Ser. 1978, 71, 171. Larsen. J . W.: YuEm. Y.: Sam. T. L. Fuel 1983, 62. 476. .~ - a. b. Hung, M.-H.; Stock, L. M. Fuel 1982, 61, 1161. c. d. Schlosberg, R. H.; Ashe. T. R.; Panci rov, R. J.; Donaldson, M. Fuel 1981,
G o r i r E. I n "Chemistry o f Coal U t i l i z a t i o n . Second Supplementary Volume"; E l l i o t t , M. A. , Ed., W i l e y - I n t e r s c i e n c e : New York, 1981; Chapter 27. Whi tehurst , D. D. "Coal L i q u e f a c t i o n Fundamentals"; Symp. Ser. No. 139, Am. Chem. SOC.: Washington, DC, 1980. F re ihau t , J. D.; Z a b i e l s k i , M. F.; Seery, D. J. Nineteenth Symposium ( I n t e r n a t i o n a l ) on Combustion, The Combustion I n s t i t u t e 1952, p. 1159 and re fe rences c i t e d t h e r e i n . Anthony, D. B.; Howard, J. B.; Meissner, H. P.; H o t t e l , H. C. Rev. Sc i . Instrum. 1974, 45, 992. K o l l , P.; M e t z g F , J. Angew. Chem., I n t . Ed. Engl. 1978, lJ, 754. Solomon, P. R . ; e t . a1 . Fuel 1981 , 60, 342. Slomka, B.; Rutkowski, A. Fuel P r o c z s i n g Tech. 1982, 5, 247.
Poutsrna, M. L. Fuel 1980, 3, 335.
Brucker, R.; K o l l i n g , G. Brennstof f -CGrnie 1965, 3, 41.
60, 155.
232
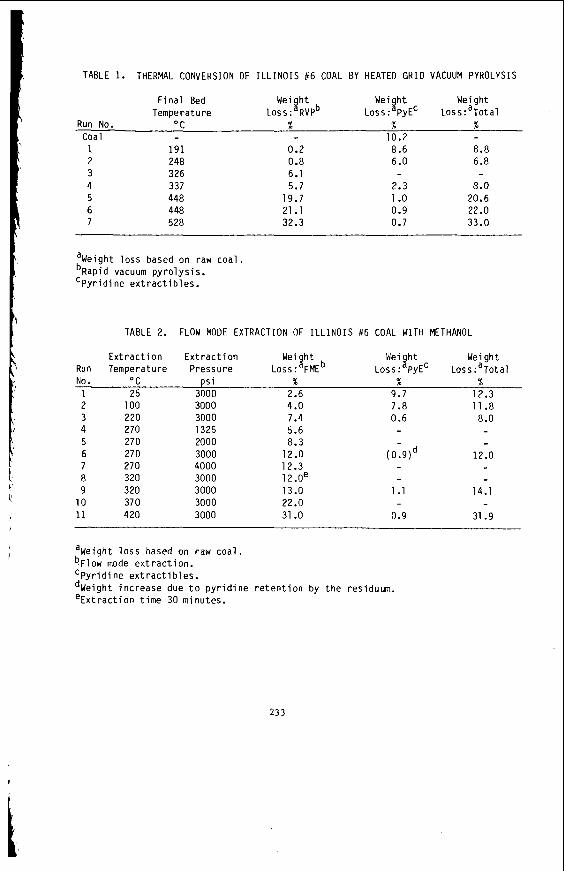
TABLE 1. THERMAL CONVERSION OF ILLINOIS #6 COAL BY HEATED G R I D VACUUM PYROLYSIS
F i n a l Bed W e i j h t W e i j h t Weight Temperature Loss: RVPb Loss: PyEC Loss:aTotal
Run No. "C % % % Coal 10.2 1 191 2 248 3 326 4 337 5 448 6 448 7 528
0.2 0.8 6.1 5.7
19.7 21.1 32.3
8.6 8.8 6 .O 6.8
2.3 8.0 1 .o 20.6 0.9 22 .o 0.7 33.0
aWeight l o s s based on raw coa l . bRapid vacuum p y r o l y s i s . 'Py r id i ne e x t r a c t i b les .
TABLE 2. FLOW MODE EXTRACTION OF ILLINOIS #6 COAL WITH METHANOL
E x t r a c t i o n E x t r a c t i o n Wei j h t Wei j h t Weight Run Temperature Pressure LOSS: F M E ~ Loss: PyEC Loss:aTotal No. " C p s i % % % 1 25 3000 2.6 9.7 12.3 2 100 3000 4.0 7.8 11.8 3 220 3000 7.4 0.6 8.0 4 270 1325 5.6 5 270 2000 8.3
7 270 4000 12.3
9 320 3000 13.0 1.1 14.1 10 370 3000 22.0 11 420 3000 31 .O 0.9 31.9
6 270 3000 12.0 (0.9)d 12.0
8 320 3000 12.0e
aWeight l o s s based on raw c o a l . bFlow mode e x t r a c t i o n .
dWeight i nc rease due t o p y r i d i n e r e t e n t i o n by t h e residuum. e E x t r a c t i o n t i m e 30 minutes.
Py r i d i ne ex t r a c t i b 1 e s .
233
I
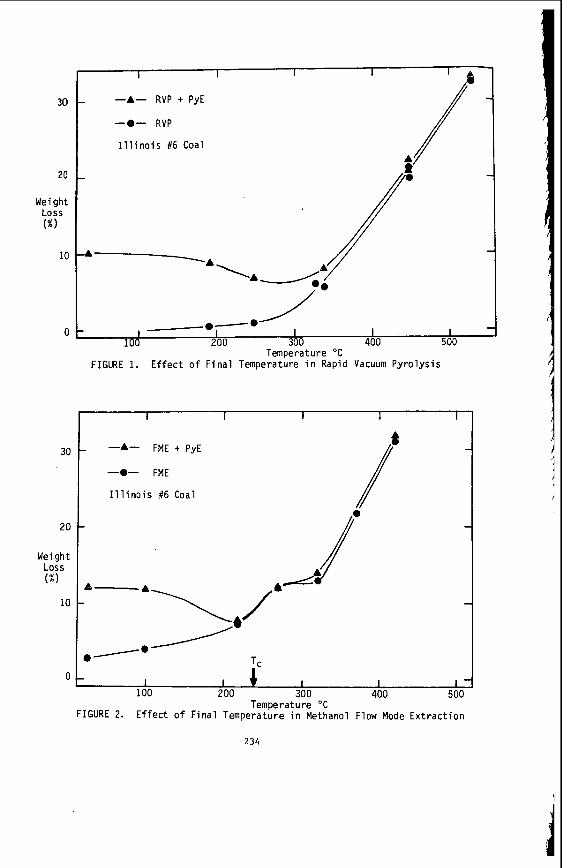
30
20
Weight Loss (%I
10
0
-A- RVP + PyE
-0- RVP
I l l i n o i s #6 Coal A
--o-O I I
A-A ' A d A _i 4.
30
I
20
Weight Loss ( % I
10
-0- FME
I l l i n o i s #6 Coal
I I I
0 I I c I I I 100 200 300 400 50C
Ef fect o f F i n a l Temperature in Methanol Flow Mode E x t r a c t i o n Temperature "C
FIGURE 2.
2 3 4
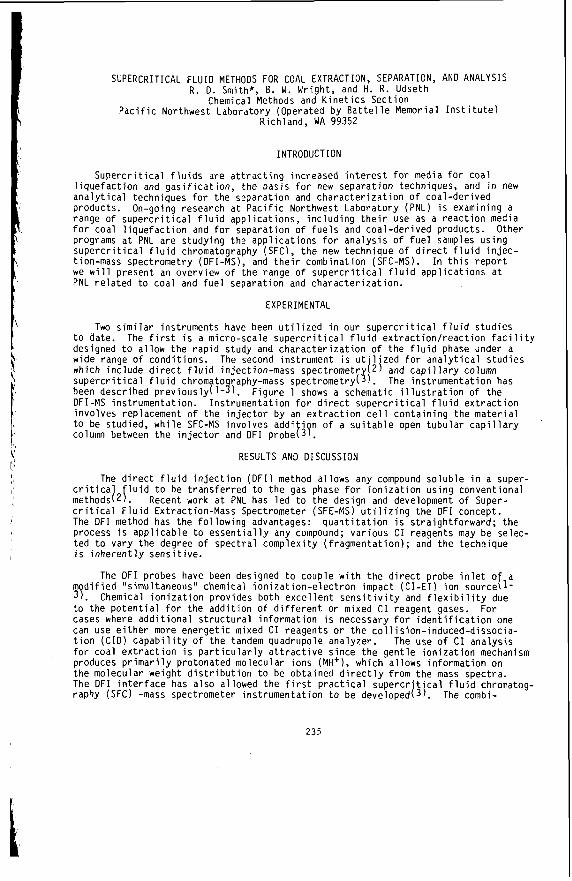
SUPERCRITICAL FLUID METHODS FOR COAL EXTRACTION, SEPARATION, AND ANALYSIS R. D. Smith*, B. W . Wright, and H. R. Udseth
Chemical Methods and Kinetics Section
Richland, WA 99352 Pacific Northwest Laboratory (Operated by Battelle Memorial Institute)
INTRODUCTION
Supercritical fluids are attracting increased interest for media for coal liquefaction and gasification, the basis for new separation techniques, and in new analytical techniques for the separation and characterization of coal-derived products. On-going research at Pacific Northwest Laboratory (PNL) is examining a range of supercritical fluid applications, including their use as a reaction media for coal liquefaction and for separation of fuels and coal-derived products. programs at PNL are studying the applications for analysis of fuel samples using supercritical fluid chromatography (SFC), the new technique of direct fluid injec- tion-mass spectrometry (DFI-MS), and their combination (SFC-MS). In this report we will present an overview of the range of supercritical fluid applications at PNL related t o coal and fuel separation and characterization.
Other
EXPERIMENTAL
Two similar instruments have been utilized in our supercritical fluid studies to date. The first is a micro-scale supercritical fluid extraction/reaction facility designed to allow the rapid study and characterization of the fluid phase under a wide range of conditions. The second instrument is ut'lized for analytical studies which include direct fluid injection-mass spectrometr{/2) and capillary column supercritical fluid chromato raphy-mass spectrometry( ). The instrumentation has
DFI-MS instrumentation. Instrumentation for direct supercritical fluid extraction involves replacement of the injector by an extraction cell containing the material to be studied, while SFC-MS involves addi 1 n of a suitable open tubular capillary column between the injector and DFI probeti?.
been described previously(1- 3 ). Figure 1 shows a schematic illustration of the
RESULTS AND DISCUSSION
The direct fluid injection (DFI) method allows any compound soluble in a super- critica met hods 121 . critical Fluid Extraction-Mass Spectrometer (SFE-MS) utilizing the OF1 concept. The DFI method has the following advantages: process is applicable to essentially any compound; various CI reagents may be selec- ted to vary the degree of spectral complexity (fragmentation); and the technique is inherently sensitive.
a in dified "simultaneous" chemical ionization-electron impact (CI-€1) ion sourcefl- 3?. Chemical ionization provides both excellent sensitivity and flexibility due to the potential for the addition of different or mixed CI reagent gases. cases where additional structural information is necessary for identification one can use either more energetic mixed CI reagents or the collision-induced-dissocia- tion (CID) capability of the tandem quadrupole analyzer. The use of CI analysis for coal extraction is particularly attractive since the gentle ionization mechanism produces primarily protonated molecular ions (MHt), which allows information on the molecular weight distribution t o be obtained directly from the mass spectra. The DFI interface has also allowed the first practical supercr'tical fluid chromatog- raphy (SFC) -mass spectrometer instrumentation to be developedl3).
luid to be transferred to the gas phase for ionization using conventional Recent work at PNL has led to the design and development of Super-
quantitation is straightforward; the
The DFI probes have been designed to couple with the direct probe inlet o
For
The combi-
235
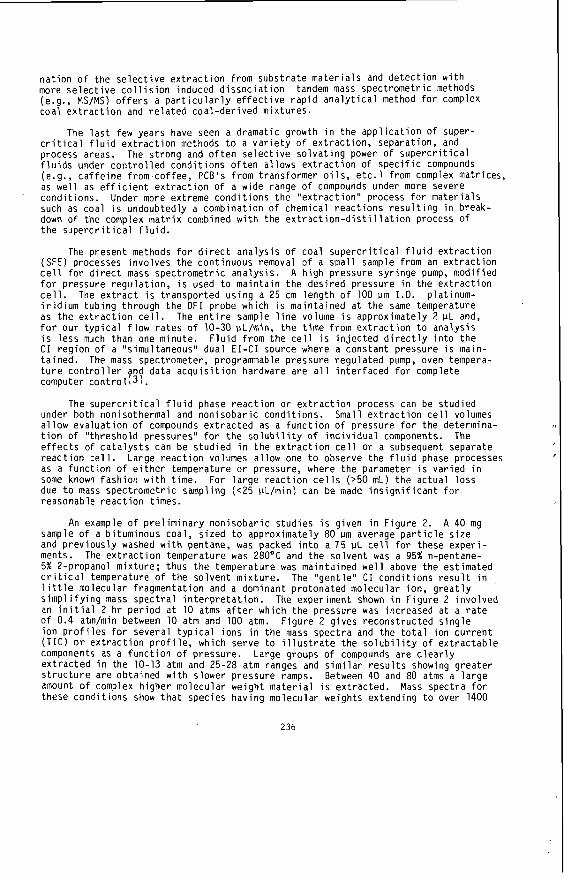
n a t i o n o f t h e s e l e c t i v e e x t r a c t i o n f rom s u b s t r a t e m a t e r i a l s and d e t e c t i o n w i t h more s e l e c t i v e c o l l i s i o n induced d i s s o c i a t i o n tandem mass spec t romet r i c methods (e.g., MS/MS) o f f e r s a p a r t i c u l a r l y e f f e c t i v e r a p i d a n a l y t i c a l method f o r complex coa l e x t r a c t i o n and r e l a t e d c o a l - d e r i v e d m ix tu res .
The l a s t few years have seen a dramat ic growth i n t h e a p p l i c a t i o n o f super- c r i t i c a l f l u i d e x t r a c t i o n methods t o a v a r i e t y o f e x t r a c t i o n , separat ion, and process areas. f l u i d s under c o n t r o l l e d c o n d i t i o n s o f t e n a l l ows e x t r a c t i o n o f s p e c i f i c compounds (e.g., c a f f e i n e f rom co f fee , PCB's f rom t rans fo rmer o i l s , e t c . 1 f rom complex matrices, as we l l as e f f i c i e n t e x t r a c t i o n o f a wide range o f compounds under more severe cond i t i ons . Under more extreme c o n d i t i o n s t h e " e x t r a c t i o n " process f o r m a t e r i a l s such as coa l i s undoubtedly a combinat ion o f chemical r e a c t i o n s r e s u l t i n g i n break- down o f t h e complex m a t r i x combined w i t h the e x t r a c t i o n - d i s t i l l a t i o n process of t h e s u p e r c r i t i c a l f l u i d .
The p resen t methods f o r d i r e c t a n a l y s i s o f coa l s u p e r c r i t i c a l f l u i d e x t r a c t i o n (SFE) processes i n v o l v e s t h e con t inuous removal o f a smal l sample from an e x t r a c t i o n c e l l f o r d i r e c t mass spec t romet r i c a n a l y s i s . A h i g h p ressu re s y r i n g e pump, m o d i f i e d f o r pressure r e g u l a t i o n , i s used t o m a i n t a i n t h e d e s i r e d pressure i n t h e e x t r a c t i o n c e l l . p la t i num- i r i d i u m t u b i n g through t h e DFI probe which i s ma in ta ined a t t he same temperature as t h e e x t r a c t i o n c e l l . The e n t i r e sample l i n e volume i s approx imate ly 2 LIL and, f o r ou r t y p i c a l f l o w r a t e s o f 10-30 uL/min, t h e t i m e f rom e x t r a c t i o n t o a n a l y s i s i s l e s s much than one minute. F l u i d f rom the c e l l i s i n j e c t e d d i r e c t l y i n t o t h e C I r e g i o n o f a "s imul taneous" dua l E I - C I source where a cons tan t pressure i s main- t a i n e d . The mass spectrometer, programmable pressure r e g u l a t e d pump, oven tempera- t u r e c o n t r o l l e r nd da ta a c q u i s i t i o n hardware are a l l i n t e r f a c e d f o r complete computer con t ro l l ' 3 ) .
The s u p e r c r i t i c a l f l u i d phase r e a c t i o n o r e x t r a c t i o n process can be s tud ied under both nonisothermal and n o n i s o b a r i c c o n d i t i o n s . Small e x t r a c t i o n c e l l volumes a l l o w e v a l u a t i o n o f compounds e x t r a c t e d as a f u n c t i o n o f pressure f o r t h e determina- t i o n o f " t h resho ld pressures" f o r t h e s o l u b i l i t y o f i n d i v i d u a l components. The e f f e c t s o f c a t a l y s t s can be s t u d i e d i n t h e e x t r a c t i o n c e l l o r a subsequent separate r e a c t i o n c e l l . Large r e a c t i o n volumes a l l ow one t o observe the f l u i d phase processes as a f u n c t i o n o f e i t h e r temperature o r pressure, where t h e parameter i s v a r i e d i n some known f a s h i o n w i t h t ime. For l a r g e r e a c t i o n c e l l s (>50 mL) t h e ac tua l l o s s due t o mass spec t romet r i c sampling ( ~ 2 5 vL/min) can be made i n s i g n i f i c a n t f o r reasonable r e a c t i o n t imes.
The s t r o n g and o f t e n s e l e c t i v e s o l v a t i n g power o f s u p e r c r i t i c a l
The e x t r a c t i s t r a n s p o r t e d u s i n g a 25 cm l e n g t h o f 100 um I . D .
An example of p r e l i m i n a r y n o n i s o b a r i c s t u d i e s i s g iven i n F i g u r e 2. A 40 mg
The e x t r a c t i o n temperature was 280°C and t h e so l ven t was a 95% n-pentane-
sample of a b i t um inous coa l , s i zed t o approx imate ly 80 wm average p a r t i c l e s i z e and p r e v i o u s l y washed w i t h pentane, was packed i n t o a 7 5 pL c e l l f o r these e x p e r i - ments. 5% 2-propanol m ix tu re ; t hus t h e temperature was ma in ta ined w e l l above the es t ima ted c r i t i c a l temperature of t he so l ven t m ix tu re . The "gen t le " CI c o n d i t i o n s r e s u l t i n l i t t l e molecular f ragmentat ion and a dominant p ro tona ted mo lecu la r i on , g r e a t l y s i m p l i f y i n g mass s p e c t r a l i n t e r p r e t a t i o n . The exper iment shown i n F i g u r e 2 i n v o l v e d an i n i t i a l 2 h r p e r i o d a t 10 atms a f t e r which the pressure was increased a t a r a t e of 0.4 atm/min between 10 atm and 100 atm. F i g u r e 2 g i ves recons t ruc ted s i n g l e i o n p r o f i l e s f o r seve ra l t y p i c a l i ons i n t h e mass spec t ra and the t o t a l i on c u r r e n t (TIC) o r e x t r a c t i o n p r o f i l e , which se rve t o i l l u s t r a t e t h e s o l u b i l i t y o f e x t r a c t a b l e components as a f u n c t i o n of pressure. Large groups o f compounds are c l e a r l y e x t r a c t e d i n the 10-13 atm and 25-28 atm ranges and s i m i l a r r e s u l t s showing g r e a t e r s t r u c t u r e are ob ta ined w i t h s lower p ressu re ramps. Between 40 and 80 atms a l a r g e amount o f complex h ighe r mo lecu la r we igh t m a t e r i a l i s ex t rac ted . Mass spec t ra f o r these c o n d i t i o n s show t h a t spec ies hav ing mo lecu la r weights extending t o over 1400
236
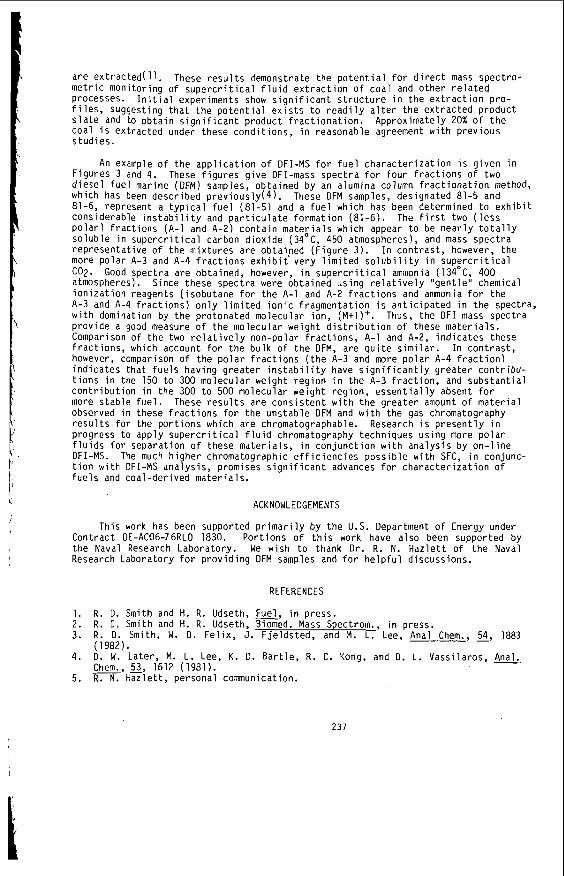
I
are extracted(1). metric monitoring of supercritical fluid extraction of coal and other related Processes. files, Suggesting that the potential exists to readily alter the extracted product slate and to obtain significant product fractionation. coal is extracted under these conditions, in reasonable agreement with previous studies.
An example of the application of DFI-MS for fuel characterization iS given in
These results demonstrate the potential for direct mass spectro-
Initial experiments show significant structure in the extraction pro-
Approximately 20% of the
Figures 3 and 4. These figures give DFI-mass spectra for four fractions of two diesel fuel marine (DFM) samples, obtained by an alumina column fractionation method, which has been described previously(4). These DFM samples, designated 81-5 and 81-6, represent a typical fuel (81-5) and a fuel which has been determined to exhibit considerable instability and particulate formation (81-6). The first two (less polar) fractions (A-1 and A-2) contain materials which appear to be nearly totally soluble in supercritical carbon dioxide (34OC, 450 atmospheres), and mass spectra representative of the mixtures are obtained (Figure 3). In contrast, however, the more polar A-3 and A-4 fractions exhibit' very limited solubility in supercritical COP. Good spectra are obtained, however, in supercritical ammonia (134"C, 400 atmospheres). Since these spectra were obtained using relatively "gentle" chemical ionization reagents (isobutane for the A-1 and A-2 fractions and ammonia for the A-3 and A-4 fractions) only limited ionic fragmentation is anticipated in the spectra, with domination by the protonated molecular ion, (M+l)+. Thus, the DFI mass spectra provide a good measure of the molecular weight distribution of these materials. Comparison of the two relatively non-polar fractions, A-1 and A-2, indicates these fractions, which account for the bulk of the DFM, are quite similar. In contrast, however, comparison of the polar fractions (the A-3 and more polar A-4 fraction) indicates that fuels having greater instability have significantly greater contribu- tions in the 150 to 300 molecular weight region in the A-3 fraction, and substantial contribution in the 300 to 500 molecular weight region, essentially absent for more stable fuel. observed in these fractions for the unstable DFM and with the gas chromatography results for the portions which are chromatographable. progress to apply supercritical fluid chromatography techniques using more polar fluids for separation of these materials, in conjunction with analysis by on-line DFI-MS. tion with DFI-MS analysis, promises significant advances for characterization of fuels and coal-derived materials.
These results are consistent with the greater amount of material
Research is presently in
The much higher chromatographic efficiencies possible with SFC, in conjunc-
ACKNOWLEDGEMENTS
This work has been supported primarily by the U.S. Department of Energy under Contract DE-AC06-76RLO 1830. Portions of this work have also been supported by the Naval Research Laboratory. We wish to thank Dr. R. N. Hazlett of the Naval Research Laboratory for providing DFM samples and for helpful discussions.
REFERENCES
1. R. 0. Smith and H. R. Udseth, w, in press. 2. R. 0. Smith and H. R. Udseth, Biomed. Mass Spectrom., in press. 3. R. 0. Smith, W. 0. Felix, J. Fjeldsted, and M. L. Lee, Anal Chem., 54, 1883 4. 0. W . Later, M. L. Lee, K. D. Bartle, R. C. Kong, and D. L. Vassilaros, Anal. 5. R. N. Hazlett, personal communication.
(1982).
m, 53, 1612 (1981).
237
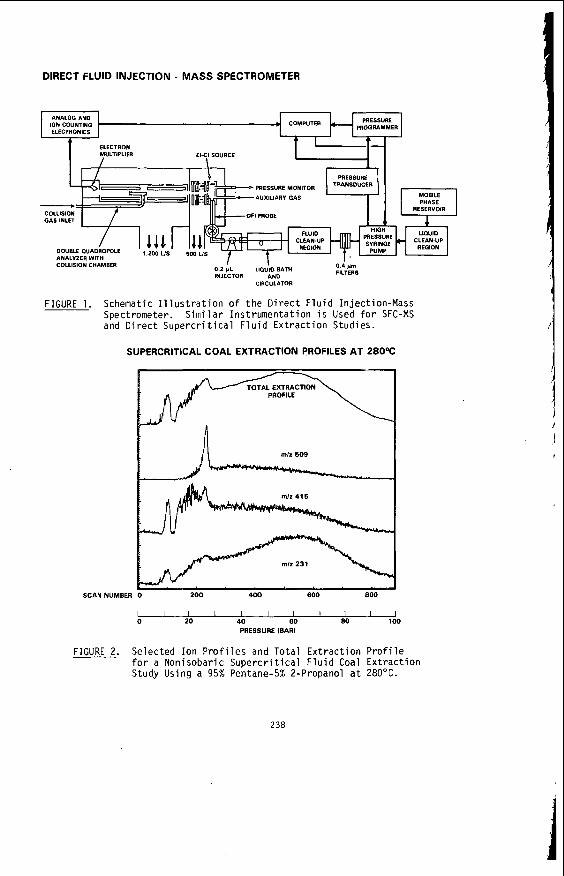
DIRECT FLUID INJECTION - MASS SPECTROMETER
PRESSURE MONITOR
INJECTOR AND CIRCULATOR
FIGURE 1. Schematic I l l u s t r a t i o n o f the Direct Fluid Injection-Mass Similar Instrumentation i s Used f o r SFC-MS Spectrometer.
and Direct Supercr i t ica l Fluid Extraction Studies.
SUPERCRITICAL COAL EXTRACTION PROFILES AT 280%
SCAN NUMBER
1 1 1 I I I I I I I I 0 20 40 60 80 100
PRESSURE IBARl
FIGURE 2. Selected Ion Prof i les and Total Extraction Prof i le f o r a Nonisobaric Supercrit ical Fluid Coal Extraction Study Using a 95% Pentane-5% 2-Propanol a t 280°C.
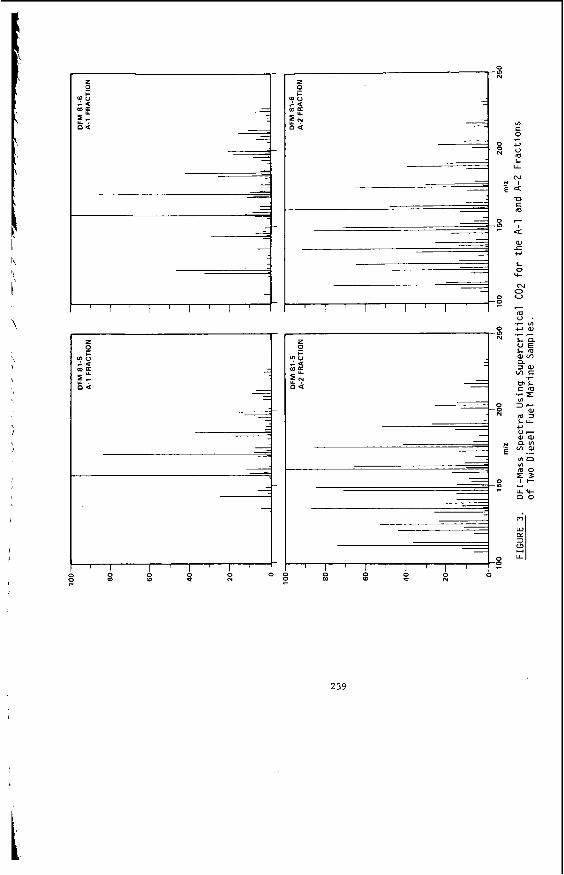
-I
II) c 0
c, u
L LL
.C
-4
239
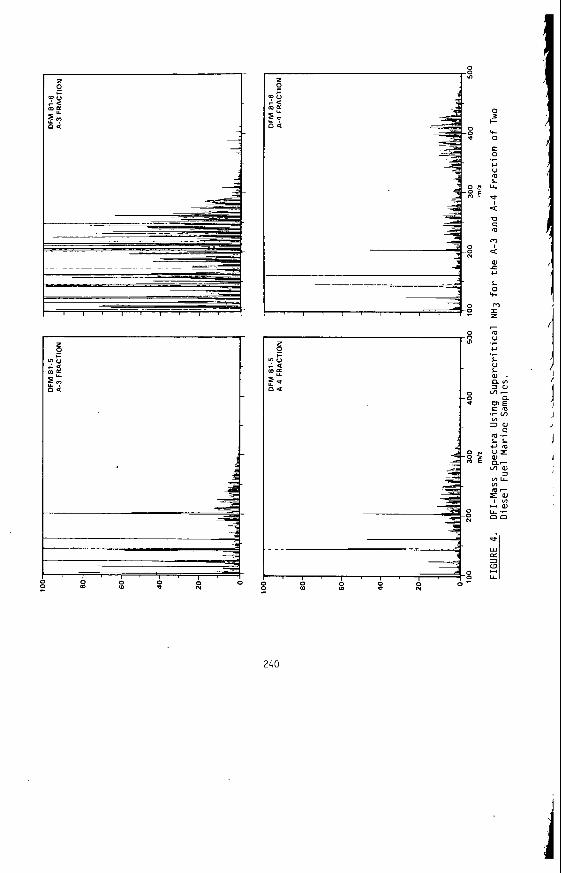
I ' I ' I . I . 1 0 0 0 0 0
240
. E
0 I-
+ 0
c 0 c) U
lL
0 I 4
D C m
m 4
aJ L u
L 0 Y-
I z
.r
m
I
m
F
m U
c)
L U
G I . 3 w Lo-
.r
.r
a m
i
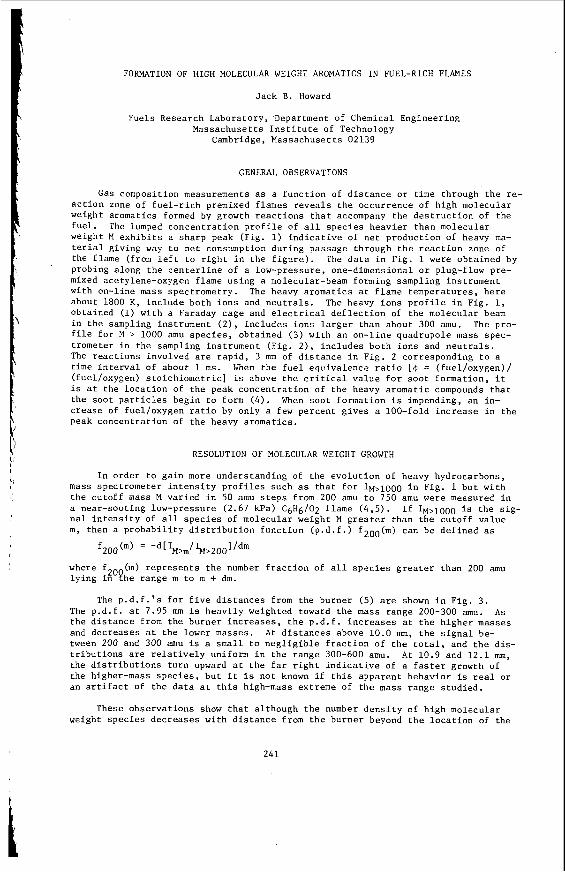
FORMATION OF HIGH MOLECULAR WEIGHT AROMATICS I N FUEL-RICH FLAMES
Jack B. Howard
Fuels Research Laboratory, Department of Chemical Engineer ing Massachuset ts I n s t i t u t e of Technology
Cambridge, Massachuset ts 02139
GENERAL OBSERVATIONS
Gas composition measurements a s a func t ion of d i s t a n c e o r t i m e through t h e re- a c t i o n zone of f u e l - r i c h premixed f lames r e v e a l s t h e occurrence of high molecular weight aromatics formed by growth r e a c t i o n s t h a t accompany t h e d e s t r u c t i o n of t h e f u e l . weight M e x h i b i t s a sharp peak (Fig. 1) i n d i c a t i v e of n e t product ion of heavy ma- t e r ia l g iv ing way t o n e t consumption dur ing passage through t h e r e a c t i o n zone of the flame (from l e f t t o r i g h t i n t h e f i g u r e ) . The d a t a i n Fig. 1 were obta ined by probing along t h e c e n t e r l i n e of a low-pressure, one-dimensional o r plug-flow pre- mixed acetylene-oxygen flame us ing a molecular-beam forming sampling instrument with on-line mass spectrometry. The heavy aromat ics a t f lame tempera tures , h e r e about 1800 K , i n c l u d e both i o n s and n e u t r a l s . The heavy i o n s p r o f i l e i n Fig. 1, obtained (1) wi th a Faraday cage and e l e c t r i c a l d e f l e c t i o n of the molecular beam i n t h e sampling instrument ( 2 ) , inc ludes i o n s l a r g e r than about 300 amu. The pro- f i l e f o r M > 1000 amu s p e c i e s , ob ta ined ( 3 ) with an on- l ine quadrupole mass spec- t rometer i n the sampling instrument (Fig. 2 ) , inc ludes both i o n s and n e u t r a l s . The r e a c t i o n s involved a r e r a p i d , 3 mm of d i s t a n c e i n F ig . 2 corresponding t o a t i m e i n t e r v a l of about 1 m s . When the f u e l equiva lence r a t i o [+ = ( fue l /oxygen) / ( fuelfoxygen) s t o i c h i o m e t r i c ] is above t h e c r i t i c a l v a l u e f o r s o o t format ion , i t i s a t t h e l o c a t i o n of the peak concent ra t ion of t h e heavy aromat ic compounds t h a t t h e soot p a r t i c l e s begin t o form ( 4 ) . When soot formation i s impending, an in- c rease of fuel /oxygen r a t i o by only a few percent g i v e s a 100-fold i n c r e a s e i n t h e peak concent ra t ion of t h e heavy aromat ics .
The lumped concent ra t ion p r o f i l e of a l l s p e c i e s heavier than molecular
RESOLUTION OF MOLECULAR WEIGHT GROWTH
I n order t o g a i n more understanding of the e v o l u t i o n of heavy hydrocarbons, mass spectrometer i n t e n s i t y p r o f i l e s such as t h a t f o r IM>~OOO i n Fig. 1 b u t wi th t h e cu tof f mass M var ied i n 50 amu s t e p s from 200 amu t o 750 amu were measured i n a near-soot ing low-pressure (2.67 kPa) CgH6/02 flame ( 4 , 5 ) . I f IM>~OOO i s the s i g - n a l i n t e n s i t y of a l l s p e c i e s of molecular weight M g r e a t e r than t h e cu tof f va lue m, then a p r o b a b i l i t y d i s t r i b u t i o n f u n c t i o n ( p . d . f . ) f200(m) can be def ined as
f200(m) = - d [ ~ , m / ~ , 2 0 0 1 / d m
where f l y i n g &'?he range m t o m + dm.
(m) r e p r e s e n t s t h e number f r a c t i o n of a l l s p e c i e s g r e a t e r than 200 amu
The p . d . f . ' s f o r f i v e d i s t a n c e s from the burner (5) are shown i n F i g . 3. The p .d . f . a t 7.95 nun i s h e a v i l y weighted toward t h e mass range 200-300 m u . A s t h e d i s t a n c e from t h e burner i n c r e a s e s , t h e p . d . f . i n c r e a s e s a t t h e h igher masses and decreases a t t h e lower masses. A t d i s t a n c e s above 10 .0 nun, t h e s i g n a l be- tween 200 and 300 amu is a s m a l l t o n e g l i g i b l e f r a c t i o n of t h e t o t a l , and t h e d is - t r i b u t i o n s a r e r e l a t i v e l y uniform i n t h e range 300-600 amu. A t 10 .9 and 1 2 . 1 mm, the d i s t r i b u t i o n s t u r n upward a t t h e f a r r i g h t i n d i c a t i v e of a f a s t e r growth of the higher-mass s p e c i e s , bu t i t i s n o t known i f t h i s apparent behavior i s real or an a r t i f a c t of t h e d a t a a t t h i s high-mass extreme of t h e mass range s tudied .
These observa t ions show t h a t a l though t h e number d e n s i t y of h igh molecular weight s p e c i e s decreases wi th d i s t a n c e from t h e burner beyond t h e l o c a t i o n of the
241
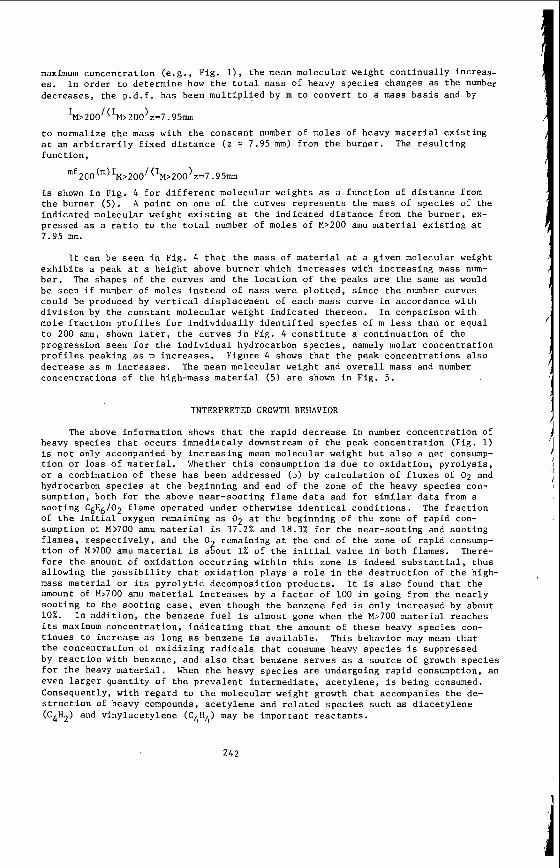
maximum concent ra t ion ( e . g . , Fig. 1). t h e mean molecular weight c o n t i n u a l l y increas- es. I n order t o determine how t h e t o t a l mass of heavy s p e c i e s changes a s t h e number decreases , t h e p .d . f . has been m u l t i p l i e d by m t o conver t t o a mass b a s i s and by
t o normalize t h e mass wi th t h e c o n s t a n t number of moles of heavy m a t e r i a l e x i s t i n g a t an a r b i t r a r i l y f i x e d d i s t a n c e ( z = 7.95 mm) from t h e burner . The r e s u l t i n g func t ion ,
i s shown i n Fig. 4 f o r d i f f e r e n t molecular weights a s a f u n c t i o n of d i s t a n c e from t h e burner (5 ) . A p o i n t on one of t h e curves r e p r e s e n t s the m a s s of spec ies of the ind ica ted molecular weight e x i s t i n g a t the i n d i c a t e d d i s t a n c e from t h e burner , ex- pressed a s a r a t i o t o t h e t o t a l number of moles of M>200 amu m a t e r i a l e x i s t i n g a t 7.95 mm.
It can be seen i n F ig . 4 t h a t the mass of m a t e r i a l a t a g iven molecular weight e x h i b i t s a peak a t a h e i g h t above burner which i n c r e a s e s wi th i n c r e a s i n g mass num- b e r . The shapes of t h e curves and t h e l o c a t i o n of t h e peaks a r e t h e same a s would be seen i f number of moles i n s t e a d of mass were p l o t t e d , s i n c e t h e number curves could be produced by v e r t i c a l displacement of each mass curve i n accordance wi th d i v i s i o n by the c o n s t a n t molecular weight i n d i c a t e d thereon. I n comparison with mole f r a c t i o n p r o f i l e s f o r i n d i v i d u a l l y i d e n t i f i e d s p e c i e s of m less than o r equal t o 200 amu, shown la ter , t h e curves i n Fig. 4 c o n s t i t u t e a c o n t i n u a t i o n of t h e progress ion seen f o r the i n d i v i d u a l hydrocarbon s p e c i e s , namely molar concent ra t ion p r o f i l e s peaking as m i n c r e a s e s . F igure 4 shows t h a t t h e peak concent ra t ions a l s o decrease as m i n c r e a s e s . The mean molecular weight and o v e r a l l mass and number concent ra t ions of t h e high-mass material (5) a r e shown i n F ig . 5 .
INTERPRETED GROWTH BEHAVIOR
The above informat ion shows t h a t the rap id decrease i n number concent ra t ion of heavy spec ies t h a t occurs immediately downstream of the peak concent ra t ion (Fig. 1) i s n o t only accompanied by i n c r e a s i n g mean molecular weight but a l s o a n e t consump- t i o n o r l o s s of m a t e r i a l . Whether t h i s consumption i s due t o oxida t ion , p y r o l y s i s , o r a combination of these has been addressed (5) by c a l c u l a t i o n of f l u x e s of 02 and hydrocarbon s p e c i e s a t t h e beginning and end of t h e zone of t h e heavy s p e c i e s con- sumption, both f o r t h e above near-soot ing flame d a t a and f o r similar d a t a from a s o o t i n g C 6 H 6 / 0 2 flame opera ted under o therwise i d e n t i c a l condi t ions . The f r a c t i o n of t h e i n i t i a l oxygen remaining a s O2 a t t h e beginning of t h e zone of rap id con- sumption of M>700 amu m a t e r i a l i s 37.2% and 18.3% f o r the near-soot ing and s o o t i n g f lames , r e s p e c t i v e l y , and t h e 0 remaining a t t h e end of t h e zone of rap id consump- t i o n of M>700 amu m a t e r i a l i s a2out 1% of t h e i n i t i a l va lue i n both flames. There- f o r e t h e amount of o x i d a t i o n occurr ing w i t h i n t h i s zone is indeed s u b s t a n t i a l , thus a l lowing the p o s s i b i l i t y t h a t o x i d a t i o n p lays a r o l e i n t h e d e s t r u c t i o n of t h e high- mass m a t e r i a l or its p y r o l y t i c decomposition products . I t i s a l s o found t h a t t h e amount of M>700 arnu m a t e r i a l i n c r e a s e s by a f a c t o r of 100 i n going from the n e a r l y s o o t i n g t o t h e s o o t i n g c a s e , even though the benzene fed is only increased by about 10%. I n a d d i t i o n , t h e benzene f u e l i s almost gone when the M>700 m a t e r i a l reaches i t s maximum concent ra t ion , i n d i c a t i n g t h a t t h e amount of t h e s e heavy s p e c i e s con- t i n u e s t o i n c r e a s e as long a s benzene is a v a i l a b l e . This behavior may mean t h a t t h e concent ra t ion of o x i d i z i n g r a d i c a l s t h a t consume heavy s p e c i e s i s suppressed by r e a c t i o n with benzene, and a l s o t h a t benzene s e r v e s as a source of growth s p e c i e s f o r t h e heavy material. When t h e heavy s p e c i e s are undergoing rap id consumption, an even l a r g e r q u a n t i t y of t h e p r e v a l e n t in te rmedia te , a c e t y l e n e , i s be ing consumed. Consequently, wi th regard t o t h e molecular weight growth t h a t accompanies t h e de- s t r u c t i o n of heavy compounds, a c e t y l e n e and r e l a t e d s p e c i e s such as d i a c e t y l e n e (C4H2) and v inylace ty lene (C4H4) may be important r e a c t a n t s .
IDENTIFIED SPECIES
Species and r e a c t i o n s involved i n the e a r l y s t a g e s of t h e formation of h igh molecular weight compounds were s tud ied (3 ,4) i n t h e near-soot ing C6H6/02 f lame d iscussed above us ing t h e ins t rument shown i n Fig. 2. Measured mole f r a c t i o n pro- f i l e s from which s p e c i e s f l u x e s and n e t r e a c t i o n r a t e s were computed a r e presented i n F igs . 6-10. It w i l l be noted i n these f i g u r e s t h a t numerous in te rmedia tes are involved whose formation and subsequent d e s t r u c t i o n e x h i b i t a g e n e r a l t rend t o l a r g e r molecular weights and smaller peak concent ra t ions . It is c h i s progress ion o r s e q u e n t i a l growth t h a t i s mentioned above a s cont inuing on t o t h e h igh molecu- l a r weight spec ies . This behavior i n both the near-soot ing C6H6/02 flame and t h e soot ing C2H2/02 flame d iscussed above i s i l l u s t r a t e d i n F ig . 11 where t h e mole f r a c t i o n s of s e l e c t e d compounds are p l o t t e d wi th t h e i n t e n s i t i e s of heavy s p e c i e s . The growth proceeds on t o s o o t i f t h e fuel /oxygen r a t i o exceeds t h e c r i t i c a l s o o t l i m i t .
MECHANISTIC FEATURES OF AROMATICS GROWTH
Analysis of t h e s e d a t a has provided some i n s i g h t s i n t o p o s s i b l e mechanisms of d e s t r u c t i o n of t h e f u e l and the formation and d e s t r u c t i o n of in te rmedia tes ( 3 , 4 , 6 ) . There i s i n d i c a t i o n t h a t aromatic hydrocarbons provide a s t r u c t u r e capable of s t a - b i l i z i n g , by i n t e r n a l aromatic s u b s t i t u t i o n r e a c t i o n s , t h e r a d i c a l s formed from a d d i t i o n of aromatic r a d i c a l s p e c i e s t o non-aromatics. S p e c i f i c a l l y , it appears t h a t t h e combined presence of aromatic r a d i c a l s , unsa tura ted a l i p h a t i c s such as a c e t y l e n i c spec ies and H atoms i s p a r t i c u l a r l y f a v o r a b l e t o growth of PAH and s o o t . Therefore , t h e product ion of phenyl r a d i c a l (C6H5) and t h e competi t ion be- tween i t s d e s t r u c t i o n , e s p e c i a l l y with 02, and a d d i t i o n t o unsa tura ted a l i p h a t i c s a r e important f a c t o r s i n t h e molecular weight growth of a romat ics .
With these mechanis t ic p o i n t s i n mind we r e t u r n t o t h e e a r l i e r d i s c u s s i o n of t h e consumption of s p e c i e s immediately downstream of t h e peak concent ra t ion of t h e h igh molecular weight m a t e r i a l . While t h e consumption is mainly by o x i d a t i o n , i t i s accompanied by f u r t h e r i n c r e a s e i n t h e mean molecular weight of t h e heavy s p e c i e s . Since t h e l a r g e s t amount of m a t e r i a l being consumed is ace ty lene , d iace- t y l e n e , and v inylace ty lene , and s i n c e t h e s e unsa tura ted a l i p h a t i c s a r e i d e n t i f i e d a s important s p e c i e s f o r molecular weight growth by a d d i t i o n r e a c t i o n s with a ro- mat ic r a d i c a l s , one can i n f e r t h a t the a c e t y l e n i c s p e c i e s do indeed c o n t r i b u t e t o t h e growth of the aromatic s t r u c t u r e s of which t h e heavy molecules and s o o t are comprised, presumably by a d d i t i o n r e a c t i o n s wi th t h e heavy aromat ics . Aromatic s p e c i e s with a c e t y l e n i c s i d e groups a r e observed i n the mass range (2’200 amu) where i n d i v i d u a l i d e n t i f i c a t i o n s were p o s s i b l e , and t h e amount of a c e t y l e n i c s p e c i e s con- sumed i n t h i s r e g i o n of t h e flame g r e a t l y exceeds t h e amount of s o o t eventua l ly formed. However, t h e peak f l u x of heavy s p e c i e s a l s o exceeds t h e amount of s o o t eventua l ly formed, so t h e propor t ions of t h e f i n a l soot mass cont r ibu ted by t h e a c e t y l e n i c s p e c i e s and by t h e heavy aromatics are not e s t a b l i s h e d . Q u a l i t a t i v e l y similar behavior was observed i n a soot ing acetylene/oxygen f lame. In both t h e ace ty lene and benzene f lames , t h e o x i d a t i v e and p o s s i b l y p y r o l y t i c d e s t r u c t i o n of heavy spec ies occurr ing downstream of t h e i r peak c o n c e n t r a t i o n would appear t o be an important source of p o l y c y c l i c aromatics emi t ted from t h e flame.
FORMATION OF FIRST AROMATIC R I N G S
In flames of a l i p h a t i c f u e l s t h e f i r s t aromatic r i n g s must be formed from non- aromatic precursors . P o s s i b l e mechanisms f o r t h i s c r i t i c a l s t e p have been assessed ( 7 ) by comparing predic ted formation r a t e s a g a i n s t exper imenta l va lues c a l c u l a t e d from mole f r a c t i o n p r o f i l e s of compounds measured i n a low-pressure 1,3-butadiene/ oxygen flame us ing t h e ins t rument shown i n Fig. 2 . Postu la ted mechanisms involv ing butad ienyl r a d i c a l (C H ) r e a c t i n g with an a c e t y l e n i c s p e c i e s and followed by rap id 4 5
243
c y c l i z a t i o n w e r e found t o form benzene, to luene , phenylace ty lene , and s t y r e n e a t rates c o n s i s t e n t wi th t h e d a t a . The r a t e - c o n t r o l l i n g s t e p s and p r e d i c t e d r a t e c o n s t a n t s are as fol lows:
C H + C2H2 -+ C6H6 + H , l o g kl = 8.5 - 3.7/8 4 5
4 5
4 5
4 5 6 5 2 3
where k's a r e i n L mo1-1s-' and f3 = 2.3 RT i s i n k c a l mol-'. could subsequent ly p a r t i c i p a t e i n molecular weight growth as d iscussed above.
C H
C H
+ C3H4 -+ C6H5CH3 + H
+ C4H2 -+ C6H5C2H + H ,
l o g k2 = 8.5 - 3.7/8
l o g k3 = 8 . 5 - 1.8/e C H + C4H4 + C H C H + H, l o g k4 = 8.5 - 0.6 /8
Aromatics thus formed
CONCLUSIONS
The chemistry of heavy aromat ic compounds i n f u e l - r i c h flames involves numerous in te rmedia te s p e c i e s whose s e q u e n t i a l format ion and d e s t r u c t i o n g i v e a progression t o decreas ing amounts of i n c r e a s i n g l y heavy s p e c i e s , l e a d i n g eventua l ly t o soot i f t h e fuel /oxygen r a t i o is h igh enough. The combined presence of a romat ic r a d i c a l s , unsa tura ted a l i p h a t i c s such as a c e t y l e n i c s p e c i e s and H atoms i s p a r t i c u l a r l y fa- v o r a b l e t o molecular weight growth. When t h e i n i t i a l f u e l c o n t a i n s no a romat ics , mechanisms c o n t r o l l e d by butad ienyl r a d i c a l r e a c t i n g wi th a c e t y l e n i c s p e c i e s can form s i n g l e - r i n g aromatics a t r a t e s c o n s i s t e n t wi th observed va lues .
ACKNOWLEDGEMENTS
Support from t h e fo l lowing sponsors is g r a t e f u l l y acknowledged: Environmental P r o t e c t i o n Agency, Grant No. R803242; Nat iona l Science Foundation, P a r t i c u l a t e and Multiphase Processes Program, Grant N o . NSF ENG 75-22679 AO1; Exxon Research and Engineering Company, Exxon/MIT Combustion Research Program; and t h e Nat iona l I n s t i - t u t e of Environmental Health Sc iences , Center Grant No. 5 P30 ES02109-02.
REFERENCES
1. Adams, D . E . : Measurement Technique f o r Charged Soot P a r t i c l e s i n Flames, Chemical Engineer ' s Degree T h e s i s , .Department of Chemical Engineer ing, M . I . T . , Cambridge, Mass. (1976).
2. Wersborg, B. L . , Yeung, A . C . , and Howard, J. B.: Concentrat ion and Mass D i s - t r i b u t i o n of Charged Spec ies i n Soot ing Flames, F i f t e e n t h Symposium ( I n t e r - n a t i o n a l ) on Combustion, The Combustion I n s t i t u t e , P i t t s b u r g h , pp. 1439- 1447 (1975).
3. B i t t n e r , J. D. and Howard, J. B. (1981): P r e - P a r t i c l e Chemistry i n Soot Forma- t i o n . I n : P a r t i c u l a t e Carbon - Formation During Combustion, e d i t e d by D . C. S ieg la and G . W. Smith, pp. 109-142, Plenum P r e s s , New York.
4 . B i t t n e r , J. D . and Howard, J. B . : Composition P r o f i l e s and React ion Mechanisms i n a Near-Sooting Premixed Benzene/Oxygen/Argon Flame, Eighteenth Symposium ( I n t e r n a t i o n a l ) on Combustion, The Combustion I n s t i t u t e , P i t t s b u r g h , pp. 1105-1116 (1981).
5. Howard, J. B. and B i t t n e r , J. D . : S t r u c t u r e of Sooting Flames. In: Soot Formation i n Combustion Systems and Its Toxic P r o p e r t i e s , e d i t e d by J. Lahaye, Plenum P r e s s , New York (1983).
6. B i t t n e r , J. D.,. Howard, J. B . , and Palmer, H. B . : Chemistry of In te rmedia te
244
Species in the Rich Combustion of Benzene. In: Soot Formation in Combustion Systems and Its Toxic Properties, edited by J. Lahaye, Plenum Press, New York (1983).
7. Cole, J. A., Bittner, J. D., Longwell, J. P., and Howard, J. B.: Formation Mechanisms of Aromatic Compounds in Aliphatic Flames, presented at ACS National Meeting, Seattle, Washington, March 20-25, 1983 (to be published).
245
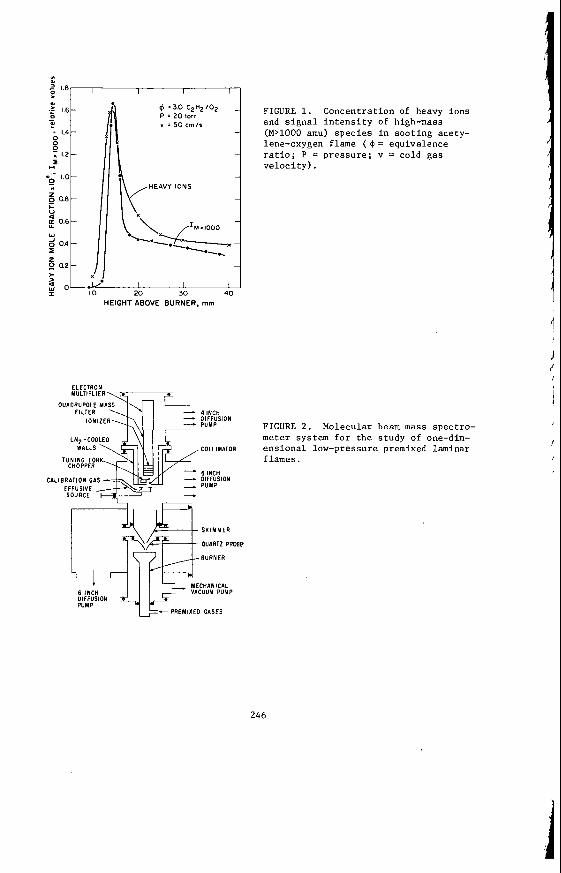
VI a2 2 1.8 I I I I
FIGURE 1. Concent ra t ion of heavy ions and s i g n a l i n t e n s i t y of high-mass
lene-oxygen flame ( 0 = equivalence
v e l o c i t y ) .
4 ‘30 C 2 H z I 0 2 - 0 P : 20 torr
Y = 50 c m l a - (M>1000 amu) s p e c i e s in soot ing acety-
- r a t i o ; P = p r e s s u r e ; v = cold gas
HEAVY IONS
W
d 0.4 - z g 0.2- - 5
I I 30 4 0
HEIGHT ABOVE BURNER, mm
ELECTRON MULTIPLIER
WALLS
EFFUSIVE SOURCE
6 INCH DIFFUSION PUMP
4 INCH DIFFUSION PUMP
,COLLIMATOR
6 INCH OlFFUSlON PUMP
SKIMMER
QUARTZ PROW
BURNER
VACUUM PUMP
FIGURE 2 . Molecular beam m a s s spec t ro- meter system f o r t h e s tudy of one-dim- e n s i o n a l low-pressure premixed laminar f lames.
I
I
2 4 6
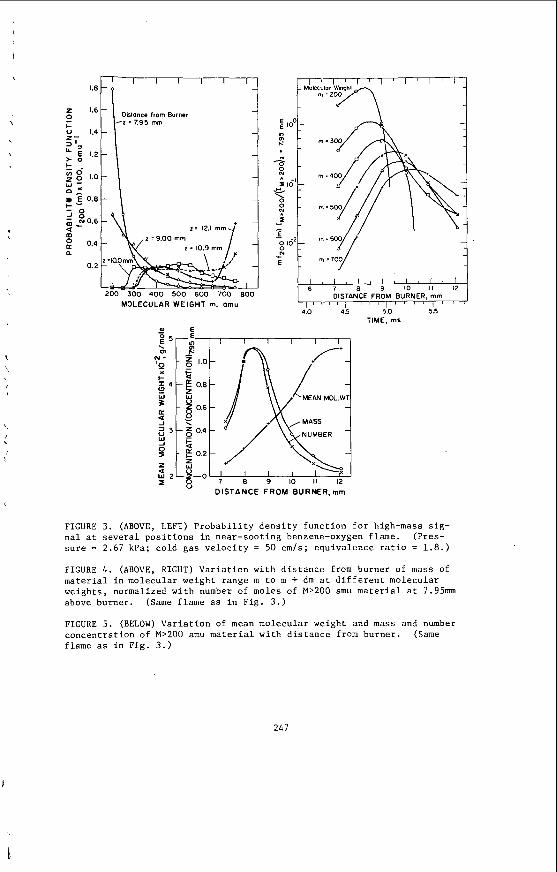
, z 1.6
I- 0 1.4
E 1.2
0
zi ,'= > a I- 3 6
o f E 0.8 t o
:-
5 2 l.0
' z0.6 m
a 0.4
0.2
1
\
Distance from Burner -
-
-
-
-
-
-
1' -
- MOLECULAR WEIGHT m. omu
1 , l 1 l 1 1 1 1 1 1 * 1
1 " " l " " I " ' ~ l ' "
6 7 8 9 10 1 1 12 DISTANCE FROM BURNER, mm
4.0 4.5 5.0 5.5 TIME. ms
W E
FIGURE 3 . (ABOVE, LEFT) P r o b a b i l i t y d e n s i t y func t ion f o r high-mass s i g - n a l a t s e v e r a l p o s i t i o n s i n near-soot ing benzene-oxygen flame. (Pres- s u r e = 2.67 kPa; cold gas v e l o c i t y = 5 0 cm/s; equivalence r a t i o = 1.8.)
FIGURE 4 . (ABOVE, RIGHT) V a r i a t i o n wi th d i s t a n c e from burner of mass of m a t e r i a l i n molecular weight range m t o m + dm a t d i f f e r e n t molecular weights , normalized wi th number of moles of M>200 amu m a t e r i a l a t 7.95mm above burner . (Same flame a s i n Fig. 3 . )
FIGURE 5. (BELOW) V a r i a t i o n of mean molecular weight and mass and number concent ra t ion of M>200 amu m a t e r i a l wi th d i s t a n c e from burner . (Same flame as i n F ig . 3 . )
247
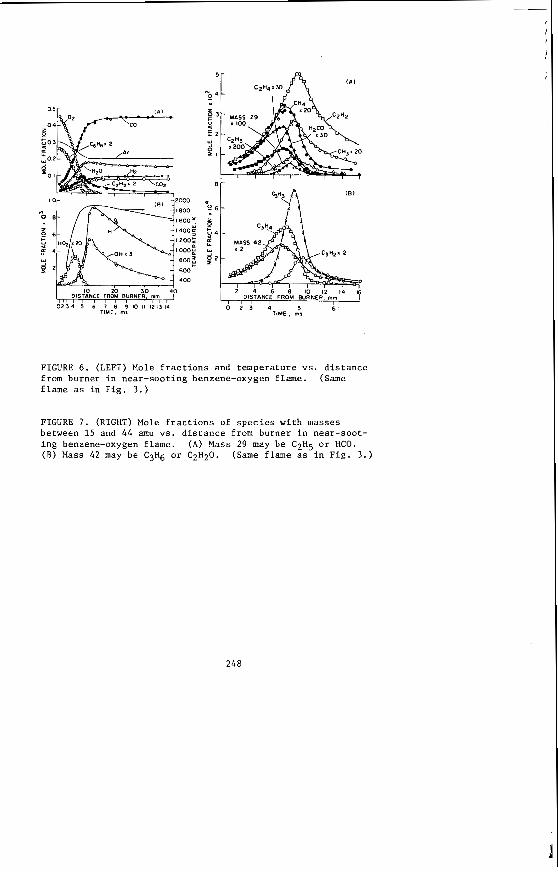
0 2 3 4 5 6 7 E 9 IO I 1 121314 TIME. ms TIME. ms
F I G U R E 6 . ( L E F T ) Mole f r a c t i o n s and temperature VS. d i s t a n c e from burner i n near-soot ing benzene-oxygen flame. f lame a s i n F i g . 3 . )
(Same
F I G U R E 7. ( R I G H T ) Mole f r a c t i o n s of s p e c i e s wi th masses between 15 and 44 amu vs. d i s t a n c e from burner i n near-soot- i n g benzene-oxygen flame. (B) Mass 42 may be C 3 H 6 o r C 2 H 2 0 .
(A) Mass 29 may be C 2 H 5 o r HCO. (Same flame a s i n Fig. 3 . )
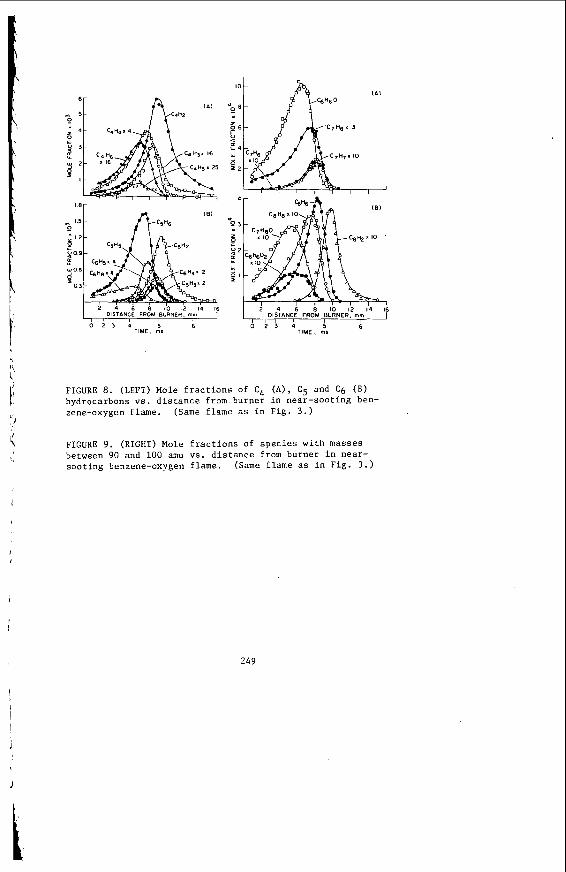
t A l
0 2 3 4 5 6 TIME, ms
-e 6 6 c Q
e 4 z2 4
z 3
E : z E d l w
0 2 3 4 5 6 TIME. m l
FIGURE 8. ( L E F T ) Mole fractions of C4 (A), C5 and Cf, (B) hydrocarbons vs . distance from burner in near-sooting ben- zene-oxygen flame. (Same flame as in Fig. 3 . )
FIGURE 9 . (RIGHT) Mole fractions of species with masses between 9 0 and 100 amu VS. distance from burner in near- sooting benzene-oxygen flame. (Same flame as in Fig. 3 . )
I I
249
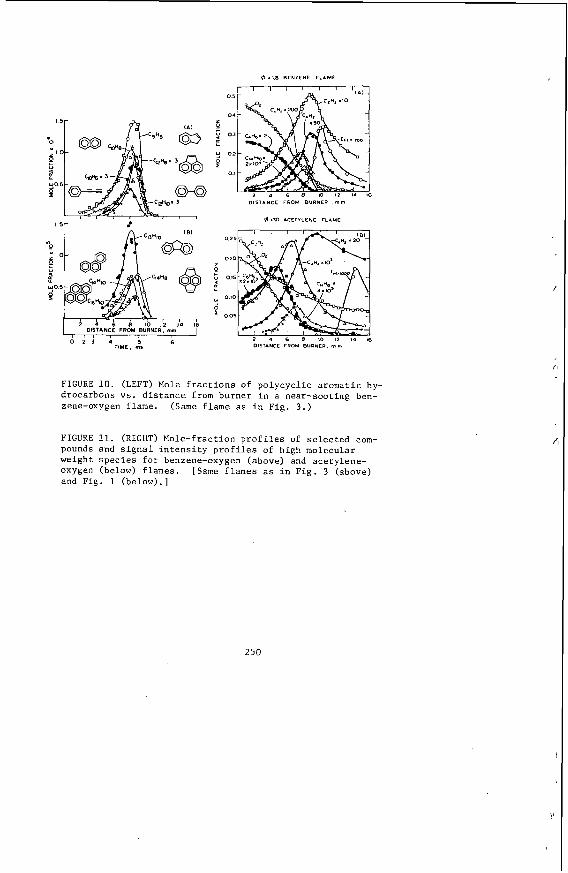
$3 -1.8 BENZENE FLAME
0 v
Y
8
FIGURE 10 . (LEFT) Mole f r a c t i o n s of po lycyc l i c aromatic hy- drocarbons VS. d i s t a n c e from burne r i n a near-soot ing ben- zene-oxygen flame. (Same f lame as i n Fig. 3 . )
FIGURE 11. (RIGHT) Mole-fract ion p r o f i l e s of s e l e c t e d com- pounds and s i g n a l i n t e n s i t y p r o f i l e s of high molecular weight s p e c i e s f o r benzene-oxygen (above) and acetylene- oxygen (below) flames. [Same f lames as i n F ig . 3 (above) and Fig. 1 (below).]
250
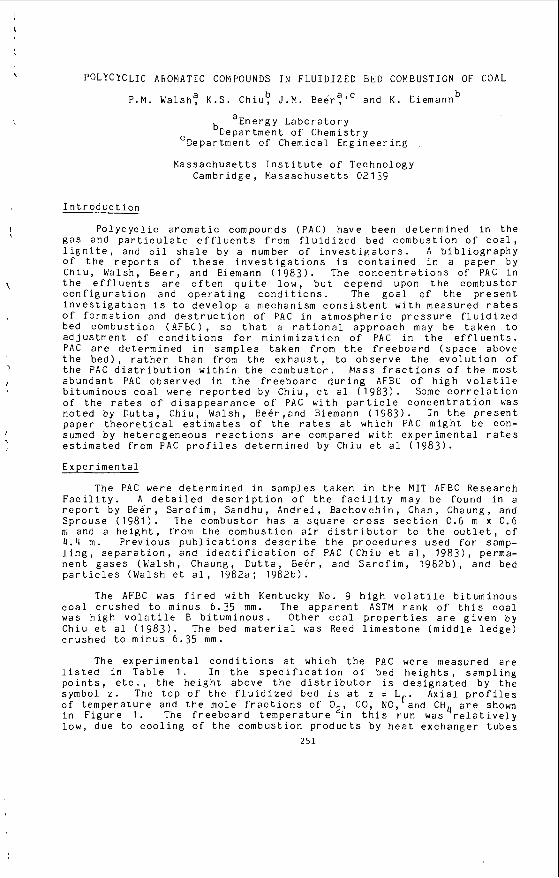
\
P O L Y C ~ C L I C AROMATIC COWPOUNDS IN FLUIDIZED B E E COMBUSTION OF C O A L b
P . M . Walsh: K.S. C h i u t J.M. Beer:’c and K . Eiemann
aEn e r g y La b o r a t o r y b E e p a r t m e n t o f C h e m i s t r y
C C e p a r t m e n t o f Chemical E n g i n e e r i n g
N a s s a c h u s e t t s I n s t i t u t e o f Techno logy Cambr idge , H a s s a c h u s e t t s 02139
I n t r o d u c t i o n
P o l y c y c l i c a r o m a t i c compounds (PAC) have been d e t e r m i n e d i n t h e g a s and p a r t i c u l a t e e f f l u e n t s f rom f l u i d i z e d bed c o m b u s t i o n o f c o a l , l i g n i t e , and o i l s h a l e by a number o f i n v e s t i g a t o r s . A b i b l i o g r a p h y o f t h e r e p o r t s of t h e s e i n v e s t i g a t i o n s i s c o n t a i n e d i n a p a p e r by C h l u , Walsh, Beer, and Eiemann ( 1 9 8 3 ) . The c o n c e n t r a t i o n s o f P A C i n t h e e f f l u e n t s a r e o f t e n q u i t e l o w , b u t depend upon t h e combus to r c o n f i g u r a t i o n and o p e r a t i n g c o n d i t i o n s . The g o a l o f t h e p r e s e n t i n v e s t i g a t i o n i s t o d e v e l o p a mechanism c o n s i s t e n t w i t h measu red r a t e s o f f o r m a t i o n and d e s t r u c t i o n o f P A C i n a t m o s p h e r i c p r e s s u r e f l u i d i z e d bed combus t ion (AFBC), so t h a t a r a t i o n a l a p p r o a c h may be t a k e n t o a d j u s t m e n t o f c o n d i t i o n s f o r m i n i m i z a t i o n o f P A C i n t h e e f f l u e n t s . PAC a r e d e t e r m i n e d i n s a m p l e s t a k e n from t h e f r e e b o a r d ( s p a c e above t h e b e d ) , r a t h e r t h a n from t h e e x h a u s t , t o o b s e r v e t h e e v o l u t i o n o f t h e PAC d i s t r i b u t i o n w i t h i n t h e c o m b u s t o r . Mass f r a c t i o n s o f t h e most a b u n d a n t P A C o b s e r v e d i n t h e f r e e b o a r d d u r i n g AFBC o f h i g h v o l a t i l e b i t u m i n o u s c o a l were r e p o r t e d by C h i u , e t a 1 ( 1 9 8 3 ) . Some c o r r e l a t i o n o f t h e r a t e s o f d i s a p p e a r a n c e o f P A C w i t h p a r t i c l e c o n c e n t r a t i o n was n o t e d by D u t t a , Ch iu , Walsh, Bee r , and Bieniann ( 1 9 8 3 ) . I n t h e p r e s e n t p a p e r t h e o r e t i c a l e s t i m a t e s o f t h e r a t e s a t wh ich P A C m i g h t be con- sumed by h e t e r o g e n e o u s r e a c t i o n s a r e compared w i t h e x p e r i m e n t a l r a t e s e s t i m a t e d from P A C p r o f i l e s d e t e r m i n e d by Chiu e t a 1 ( 1 9 8 3 ) .
E x p e r i m e n t a l
The PAC were d e t e r m i n e d i n s a m p l e s t a k e n i n t h e MJT AFBC Resea rch F a c i l i t y . A d e t a i l e d d e s c r i p t i o n o f t h e f a c i l i t y may be found i n a r e p o r t by Be6r , S a r o f i m , Sandhu , A n d r e i , Bachovchin , Chan , Chaung , and S p r o u s e ( 1 9 8 1 ) . The combus to r h a s a s q u a r e c r o s s s e c t i o n 0 .6 m x 0.6 n~ and a h e i g h t , from t h e combus t ion a i r d i s t r i b u t o r t o t h e o u t l e t , o f 4 . 4 m. P r e v i o u s p u b l i c a t i o n s d e s c r i b e t h e p r o c e d u r e s used f o r samp- l i n g , s e p a r a t i o n , and i d e n t i f i c a t i o n of PAC ( C h i u e t a l , 1 9 8 3 ) , perma- n e n t g a s e s ( W a l s h , Chaung, C u t t a , Eieer, and S a r o f i m , 1 9 8 2 b ) , and bed p a r t i c l e s (Walsh e t a l , 1 9 8 2 a ; 1 9 8 2 b ) .
The AFBC was f i r e d w i t h Kentucky No. 9 h i g h v o l a t i l e b i t u m i n o u s c o a l c r u s h e d t o m i n u s 6 .35 m m . The a p p a r e n t ASTM r a n k o f t h i s c o a l was h i g h v o l a t i l e B b i t u m i n o u s . O t h e r c o a l p r o p e r t i e s a r e g i v e n by Chiu e t a 1 ( 1 9 8 3 ) . The bed m a t e r i a l was Reed l i m e s t o n e ( m i d d l e l e d g e ) c r u s h e d t o m i n u s 6 . 3 5 m m .
The e x p e r i m e n t a l c o n d i t i o n s a t which t h e P A C were measu red a r e l i s t e d i n T a b l e 1 . In t h e s p e c i f i c a t i o n o f bed h e i g h t s , s a m p l i n g p o i n t s , e t c . , t h e h e i g h t above t h e d i s t r i b u t o r is d e s i g n a t e d by t h e symbol z . The t o p o f t h e f l u i d i z e d bed i s a t z = L f . Ax ia l p r o f i l e s o f t e m p e r a t u r e and t h e mole f r a c t i o n s o f 0 C O , N O , and CH4 a r e shown i n F i g u r e 1 . The f r e e b o a r d t e m p e r a t u r e 2 i n t h i s r u n was r e l a t i v e l y low, due t o c o o l i n g o f t h e c o m b u s t i o n p r o d u c t s by h e a t e x c h a n g e r t u b e s
251
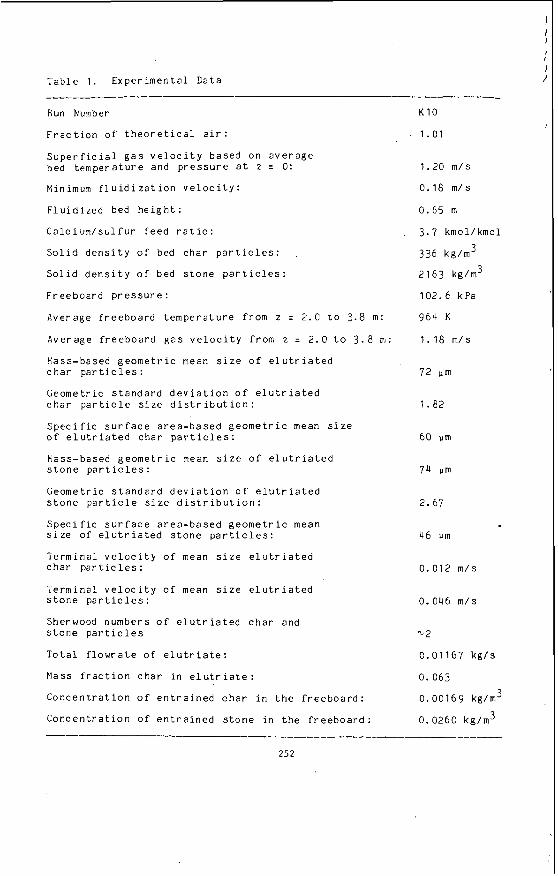
T a b l e 1 . E x p e r i m e n t a l n a t a -_ -- Run Number
F r a c t i o n of t h e o r e t i c a l a i r :
S u p e r f i c i a l g a s v e l o c i t y based on a v e r a g e bed t e m p e r a t u r e and p r e s s u r e a t z I 0:
W i n i m u m f l u i d i z a t i o n v e l o c i t y :
F l u i d i z e d bed h e i g h t :
C a l c i u m / s u l f u r f e e d r a t i o :
S o l i d d e n s i t y o f bed c h a r p a r t i c l e s :
S o l i d d e n s i t y o f bed s t o n e p a r t i c l e s :
F reeboa rd p r e s s u r e :
Average f r e e b o a r d t e m p e r a t u r e from z = 2.C t o 3.8 m:
Average f r e e b o a r d g a s v e l o c i t y from z = 2 . 0 t o 3 . 8 m :
#ass -based g e o m e t r i c mean s i z e o f e l u t r i a t e d c h a r p a r t i c l e s :
Geometr ic s t a n d a r d d e v i a t i o n o f e l u t r i a t e d c h a r p a r t i c l e s i z e d i s t r i b u t i o n :
S p e c i f i c s u r f a c e a r e a - b a s e d g e o m e t r i c mean s i z e o f e l u t r i a t e d c h a r p a r t i c l e s :
Fiass-based g e o m e t r i c mean s i z e o f e l u t r i a t e d s t o n e p a r t i c l e s :
Geomet r i c s t a n d a r d d e v i a t i o n o f e l u t r i a t e d s t o n e p a r t i c l e s i z e d i s t r i b u t i o n :
S p e c i f i c s u r f a c e a r e a - b a s e d g e o m e t r i c mean s i z e o f e l u t r i a t e d s t o n e p a r t i c l e s :
Te rmina l v e l o c i t y o f mean c h a r p a r t i c l e s :
T e r m i n a l v e l o c i t y o f mean s t o n e p a r t i c l e s :
Sherwood numbers o f e l u t r s t o n e p a r t i c l e s
T o t a l f l o w r a t e of e l u t r i a
s i z e e l u t r i a t e d
s i z e e l u t r i a t e d
a t e d c h a r and
e :
Mass f r a c t i o n c h a r i n e l u t r i a t e :
C o n c e n t r a t i o n o f e n t r a i n e d c h a r i n t h e f r e e b o a r d :
C o n c e n t r a t i o n o f e n t r a i n e d s t o n e i n t h e f r e e b o a r d :
K10
1.01
1 .20 m / s
0.18 m/s
0 .65 m
3 . 7 kmol/kmol
336 kg/m3
2163 kg/m3
1 0 2 . 6 kPa
964 K
1 .18 m/s
72 p m
1.82
60 um
7 4 vrn
2.67
46 v m
0.012 m/s
0.046 m / s
'L2
C.01167 kg/
0 .063
0.00169 kg/m3
0 .0260 kg/m3
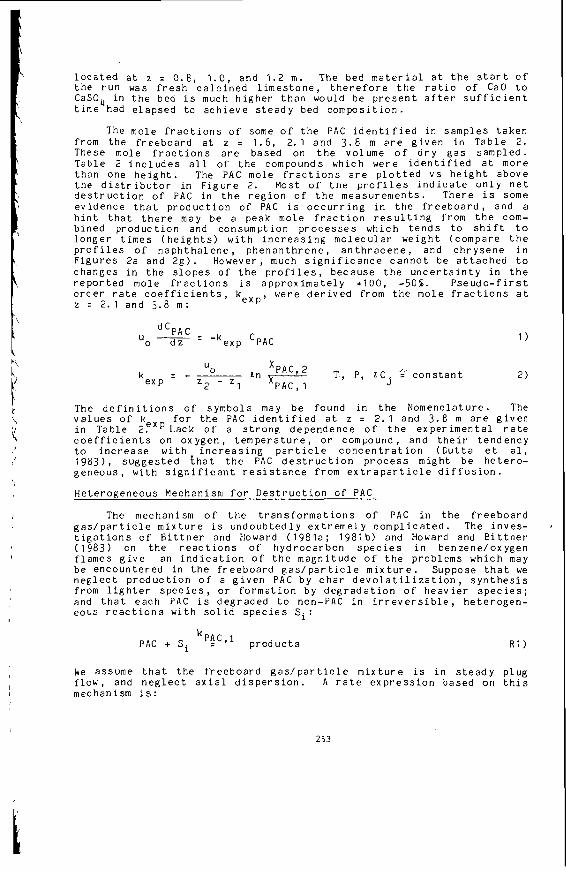
l o c a t e d a t z = 0.8, 1 . 0 , and 1 . 2 m . The bed m a t e r i a l a t t h e s t a r t o f t h e r u n was f r e s h c a l c i n e d l i m e s t o n e , t h e r e f o r e t h e r a t i o o f CaO t o CaS04 i n t h e bed i s much h i g h e r t h a n would be p r e s e n t a f t e r s u f f i c i e n t time had e l a p s e d t o a c h i e v e s t e a d y bed c o m p o s i t i o n .
The mole f r a c t i o n s o f some o f t h e PAC i d e n t i f i e d i n s a m p l e s t a k e n from t h e f r e e b o a r d a t z = 1 . 6 , 2.1 and 3.E m e r e g i v e n i n T a b l e 2. These mole f r a c t i o n s a r e based on t h e volume o f d r y g a s sampled . Tab le 2 i n c l u d e s a l l of t h e compounds which were i d e n t i f i e d a t more than one h e i g h t . The P A C mole f r a c t i o n s a r e p l o t t e d v s h e i g h t above t h e d i s t r i b u t o r i n F i g u r e 2. Most o f t h e p r o f i l e s i n d i c a t e o n l y n e t d e s t r u c t i o n o f PAC i n t h e r e g i o n o f t h e measu remen t s . There i s some e v i d e n c e t h a t p r o d u c t i o n o f PAC i s o c c u r r i n g i n t h e f r e e b o a r d , and a h i n t t h a t t h e r e may b e a peak mole f r a c t i o n r e s u l t i n g from t h e com- b ined p r o d u c t i o n and consumpt ion p r o c e s s e s which t e n d s t o s h i f t t o l o n g e r t i m e s ( h e i g h t s ) w i t h i n c r e a s i n g m o l e c u l a r w e i g h t ( compare t h e p r o f i l e s o f n a p h t h a l e n e , p h e n a n t h r e n e , a n t h r a c e n e , and c h r y s e n e i n F i g u r e s 2a and Z g ) . However, much s i g n i f i c a n c e c a n n o t be a t t a c h e d t o changes i n t h e s l o p e s o f t h e p r o f i l e s , b e c a u s e t h e u n c e r t a i n t y i n t h e r e p o r t e d mole f r a c t i o n s i s a p p r o x i m a t e l y +lOC, -50%. P s e u d o - f i r s t o r d e r r a t e c o e f f i c i e n t s , k e x p , were d e r i v e d from t h e mole f r a c t i o n s a t z = 2.1 and 3.8 m :
d C P A C u - - o d z - -kexp ‘PAC 1 )
The d e f i n i t i o n s o f symbol s may b e found i n t h e Nomencla ture . The v a l u e s o f k f o r t h e PAC i d e n t i f i e d a t z = 2. 1 and 3 . 8 m a r e g i v e n i n Table 2 F X p L a c k o f a s t r o n g d e p e n d e n c e o f t h e e x p e r i m e n t a l r a t e c o e f f i c i e n t s o n o x y g e n , t e m p e r a t u r e , o r compound, and t h e i r t e n d e n c y t o i n c r e a s e w i t h i n c r e a s i n g p a r t i c l e c o n c e n t r a t i o n ( C u t t a e t a l , 19831, s u g g e s t e d t h a t t h e P A C d e s t r u c t i o n p r o c e s s migh t b e h e t e r o - g e n e o u s , w i t h s i g n i f i c a n t r e s i s t a n c e from e x t r a p a r t i c l e d i f f u s i o n .
He te rogeneous Mechanisni f o r D e s t r u c t i o n o f PAC-
The mechanism o f t h e t r a n s f o r m a t i o n s o f P A C i n t h e f r e e b o a r d g a s / p a r t i c l e m i x t u r e is u n d o u b t e d l y e x t r e m e l y c o m p l i c a t e d . The i n v e s - t i g a t i o n s o f l j i t t n e r and Howard ( 1 9 8 1 a ; 1981b) and Howard and E i t t n e r ( 1 9 8 3 ) on t h e r e a c t i o n s o f h y d r o c a r b o n s p e c i e s i n benzene/oxygen f l a m e s g i v e an i n d i c a t i o n o f t h e m a g n i t u d e o f t h e p rob lems which may be e n c o u n t e r e d i n t h e f r e e b o a r d g a s / p a r t i c l e m i x t u r e . Suppose t h a t we n e g l e c t p r o d u c t i o n o f a g i v e n P A C by c h a r d e v o l a t i l i z a t i o n , s y n t h e s i s from l i g h t e r s p e c i e s , o r f o r m a t i o n by d e g r a d a t i o n o f h e a v i e r s p e c i e s ; and t h a t each P A C i s d e g r a d e d t o non-PAC i n i r r e v e r s i b l e , h e t e r o g e n - eous r e a c t i o n s w i t h s o l i d s p e c i e s S i :
PAC + Si kPAC’i - p r o d u c t s R 1 )
he assume t h a t t h e f r e e b o a r d g a d p a r t i c l e m i x t u r e is i n s t e a d y p lug flow, and n e g l e c t a x i a l d i s p e r s i o n . A r a t e e x p r e s s i o n based on t h i s mechanism is:
253
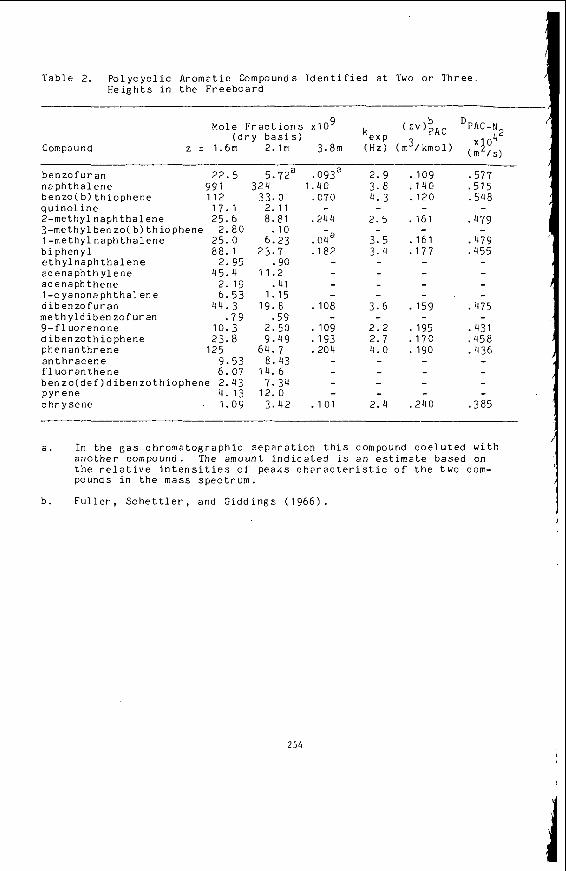
T a b l e 2. P o l y c y c l i c Aromat i c Compounds I d e n t i f i e d a t Two o r T h r e e H e i g h t s i n t h e F r e e b o a r d
Kole F r a c t i o n s x10 9 ( zv)bpAc D ~ ~ ~ - ~
z = 1.6m ( d r y b a s i s ) 2 . lm 3.8m k e x p (Hz) (m3/kmol) ( m x p 4 2 ,s) Corn po u n d
ben zo f u r an n a p h t h a l e n e 99 1 b e n z o ( b ) t h i o p h e n e 112 q u i n o l i n e 1 7 . 1 2-methyl n a p h t h a 1 e n e 2 5 . 6 3 -me thy lbenzo( b ) t h i o p h e n e 2 . 8 0 1 -me t h y 1 n a ph t h a 1 e n e 2 5 . 0 b i p h e n y l 88 . 1 e t h y l n a p h t h a l e n e 2 . 9 5 a c e n a ph t h y l e n e 45 .4 a c e n a p h t h e n e 2 . 1 9 1 -c y a n o n a p h t h a l e n e 6 . 5 3 d i b e n zo f u r an 44.3 rnethyld i b e n z o f u r a n . 7 9 9- f l uo renone 1 0 . 3 d i b e n z o t h i o p h e n e 2 3 . 8 p h e n a n t h r e n e 125 a n t h r a c e n e 9 . 5 3 fl u o r a n t h e n e 6 . 07 benzo(def)dibenzothiophene 2 . 4 3 p y r ene 4. 13 c h r y s e n e 1 . 0 5
2 2 . 5 5. 7za 3 2 4
3 3 . 0 2.11 8 . 8 1
.10 6 . 2 3
. g o
. 4 1 1 .15
.59 2 . 5 0 9 .49
e. 43
7.34
3 . 4 2
2 3 . 7
1 1 . 2
1 9 . 8
6 4 . 7
14. 6
1 2 . 0
. 093a 2 . 9 1.4c 3 . 8 . C70 4 . 3
. 2 4 4 2 . 5
. 3 . 5
. l e 2 3.4
- - - -
- - - - - -
. 108 3 . 6
. 109 2 . 2 - -
. I 9 3 2 . 7
. 204 4 . 0
- - . l o 1 2 . 4
. 109 .577
. 1 4 0 . 515
. 1 2 0 . 5 4 8
. 161 .479
. 161 .479
. 1 7 7 .455
- - - -
- -
- . -
. 159 .475
. 195 .431
. 1 7 c . 4 5 8 . 190 . 4 3 6
- -
- - - - - -
. 2 4 0 . 3 85 --
a . I n t h e g a s c h r o m a t o g r a p h i c s e p a r a t i o n t h i s compound c o f l u t e d w i t h a n o t h e r compound. The amoun t i n d i c a t e d is a n e s t i m a t e based on t h e r e l a t i v e i n t e n s i t i e s o f p e a k s c h a r a c t e r i s t i c o f t h e t w o com- pounds i n t h e mass s p e c t r u m .
b . F u l l e r , S c h e t t l e r , and G i d d i n g s ( 1 9 6 6 ) .
2 5 4 \
d C P A C " b A C , i C P A C o d z - - u - - 3 )
where k ' P A C i , t h e e f f e c t i v e r a t e c o e f f i c i e n t f o r t h e h e t e r o g e n e o u s r e a c t i o n of P A C w i t h s o l i d s p e c i e s i , c o n t a i n s t h e s e q u e n t i a l p r o - c e s s e s o f d i f f u s i o n o f P A C t o t h e s u r f a c e s o f p a r t i c l e s , and t h e h e t e r o g e n e o u s r e a c t i o n a t t h e s u r f a c e s :
P .
k b A C , i = __ 7+-- i C P A C P A C , is i ' P A C , i
Q i Prd:
4 )
I n o r d e r t o e v a l u a t e t h i s r a t e c o e f f i c i e n t we r e q u i r e e s t i m a t e s o f t h e c o n c e n t r a t i o n , d i a m e t e r , s o l i d d e n s i t y , and s p h e r i c i t y o f e a c h pa r - t i c l e s p e c i e s , and t h e d i f f u s i o n c o e f f i c i e n t s o f t h e P A C .
F r e e b o a r d P a r t i c l e P r o p e r t i e s
High p a r t i c l e c o n c e n t r a t i o n i s zn i m p o r t a n t f e a t u r e o f t h e f r e e - board f l o w , however p rec i se measu remen t s of t h e p a r t i c l e c o n c e n t r a - t i o n s a r e d i f f i c u l t . The p rob lems a r i s e from t h e f a c t s t h a t l a r g e p a r t i c l e s ( > 300 u r n ) a r e moving bo th upward and downward w i t h d i s t r i - b u t e d v e l o c i t i e s ; and t h a t s m a l l p a r t i c l e s (5, 300 p m ) , which a r e moving p r i m a r i l y upward , have v e l o c i t i e s which depend on p a r t i c l e s i z e and d e n s i t y . I s o k i n e t i c s ampl ing o f t h e p a r t i c l e s i s t h e r e f o r e n o t p o s s i b l e . C o n c e n t r a t i o n s o f p a r t i c l e s i n t h e bed a r e u s u a l l y d e t e r - mined from measuremen t s o f d i f f e r e n t i a l p r e s s u r e . T h i s t e c h n i q u e can o n l y be used i n t h e f r e e b o a r d a t low s u p e r f i c i a l v e l o c i t y when p r e s - s u r e f l u c t u a t i o n s a r e n o t l a r g e w i t h r e s p e c t t o t h e c h a n g e s i n p r e s - sure d u e t o t h e p r e s e n c e o f p a r t i c l e s , T h i s c o n d i t i o n i s u s u a l l y n o t met d u r i n g combus t ion measu remen t s . An a l t e r n a t i v e , a p p r o x i m a t e method f o r t h e d e t e r m i n a t i o n o f p a r t i c l e c o n c e n t r a t i o n s h a s been deve loped i n o r d e r t o e s t i m a t e t h e r a t e s o f h e t e r o g e n e o u s r e a c t i o n s .
The p a r t i c l e s a r e c l a s s i f i e d by t h e i r t e r m i n a l v e l o c i t i e s i n t o two g r o u p s : l a r g e p a r t i c l e s ( t e r m i n a l v e l o c i t i e s g r e a t e r t h a n t h e mean g a s v e l o c i t y ) and s m a l l p a r t i c l e s ( t e r m i n a l v e l o c i t y less than t h e mean g a s v e l o c i t y ) . The d e p e n d e n c e o f t h e f l u x o f l a r g e p a r t i c l e s on h e i g h t i n t h e f r e e b o a r d i s measured by c a t c h i n g d e s c e n d i n g p a r t i - c l e s i n cups p l a c e d a t s e v e r a l h e i g h t s above t h e bed ( W a l s h , Mayo, and Eee'r, 1 9 8 3 ) . The c o n c e n t r a t i o n o f l a r g e p a r t i c l e s i s e s t i m a t e d from t h e f l u x measu remen t s by a method proposed by Walsh , Yokozek i , and Ee6r ( 1 9 8 2 ) . The b a s i s o f t h i s e s t i m a t e i s an assumed i n i t i a l v e l o - c i t y d i s t r i b u t i o n ( G a u s s i a n ) o f p a r t i c l e s l e a v i n g t h e bed s u r f a c e . For a g i v e n p a r t i c l e f l u x a t t h e bed s u r f a c e , a g i v e n s t a n d a r d d e v i a - t i o n o f t h e v e l o c i t y d i s t r i b u t i o n , and t h e a s s u m p t i o n s o f n e g l i g i b l e d r a g and t o t a l r e f l u x ; b o t h t h e f l u x and c o n c e n t r a t i o n o f p a r t i c l e s a t a g i v e n h e i g h t a r e u n i q u e l y d e t e r m i n e d . I n t h i s way t h e l a r g e p a r t i - c l e c o n c e n t r a t i o n s can be e s t i m a t e d from t h e f l u x measu remen t s .
The s m a l l e n t r a i n e d p a r t i c l e s a r e p r e c i p i t a t e d by c y c l o n e s from t h e e x h a u s t , so t h e i r f l u x a t t h e f r e e b o a r d e x i t i s known. By assum- i n g t h a t t h e y move o n l y upward a t a c o n s t a n t v e l o c i t y e q u a l t o t h e mean g a s v e l o c i t y m i n u s t h e t e r m i n a l v e l o c i t y o f t h e mean s i z e p a r t i - c l e s , t h e i r c o n c e n t r a t i o n can a l s o be e s t i m a t e d . E r r o r s i n t h i s e s t i m a t e may a r i s e f rom:
255

1. Cyclone c o l l e c t i o n e f f i c i e n c y less t h a n 1 . 2. SO2 a n d / o r C02 r e a c t i o n s w i t h s t o n e and combus t ion o f c h z r i n
t h e f r e e b o a r d and e x h a u s t p i p e b e f o r e t h e c o l l e c t i o n p o i n t . 3. R e f l u x i n g o f t h e s m a l l p a r t i c l e s down t h e f r e e b o a r d wa l l
(Pember ton and C a v i d s o n , 1 9 8 3 ) .
P robob ly t h e most i m p o r t a n t p r o b l e m , however , i s i n t h e i n i t i a l a s s u m p t i o n : t h a t t h e p a r t i c l e s can be d i v i d e d i n t o two g r o u p s having mean s i z e s i n d e p e n d e n t o f h e i g h t . The p a r t i c l e s i z e and v e l o c i t y d i s t r i b u t i o n s unde rgo c o n t i n u o u s e v o l u t i o n from t h e t o p o f t h e bed ( and even w i t h i n t h e bed i t s e l f ) t o t h e combus to r o u t l e t . A more d e t a i l e d c a l c u l a t i o n can be made by machine c o m p u t a t i o n , b u t t h e v a l u e o f s u c h an e f f o r t i s t o some ex ten t n e g a t e d by t h e l a c k o f exper imen- t a l d a t a w i t h which t o compare t h e p r e d i c t i o n s .
T h e mass-based p a r t i c l e s i z e d i s t r i b u t i o n s o f t h e s t o n e and c h a r p a r t i c l e s i n a s ample o f t h e e l u t r i a t e p r e c i p i t a t e d i n t h e c y c l o n e s d u r i n g t h e p r e s e n t e x p e r i m e n t a r e shown i n F i g u r e 3. The mass f r a c - t i o n s o f s t o n e and c h a r i n t h e e l u t r i a t e were c a l c u l a t e d from t h e h e a t i n g v a l u e o f t h e m a t e r i a l i n e a c h s i z e r a n g e . The h e a t i n g v a l u e of p u r e c h a r was e s t i m a t e d u s i n g C u l o n g ' s f o r m u l a w i t h a c o m p o s i t i o n d e r i v e d from t h e u l t i m a t e and p r o x i m a t e a n a l y s e s o f t h e c021 . T h e s p e c i f i c s u r f a c e a r e a - b a s e d mean p a r t i c l e s i z e s were c a l c u l a t e d from t h e s t a n d a r d d e v i a t i o n and mass -based mean s i zes ( I r a n i and C a l l i s , 1 9 6 3 ) . The s p h e r i c i t y o f t h e e n t r a i n e d s t o n e and c h a r p a r t i c l e s was e s t i m a t e d t o b e . 0 . 5 ; t h e i r s o l i d d e n s i t i e s were assumed t o be t h e same a s t h o s e o f t h e l a r g e r s t o n e and c h a r p a r t i c l e s t a k e n from t h e bed . Te rmina l v e l o c i t i e s o f t h e p a r t i c l e s were c a l c u l a t e d u s i n n t h e c o r r e l a t i o n o f P e t t y j o h n and C h r i s t i a n s e n ( 1 9 4 8 ) . The p r o p e r t i e s o f t h e e n t r a i n e d p a r t i c l e s a r e summar ized i n T a b l e 1 .
The r e f l u x i n g p a r t i c l e s were assumed t o have t h e same s i z e , s p h e r i c i t y , and s o l i d d e n s i t y a s bed p a r t i c l e s . S p e c i f i c s u r f a c e a r e a - b a s e d mean s i z e s o f t h e bed s t o n e and c h a r p a r t i c l e s were 780 and 2900 m , r e s p e c t i v e l y . The mass f r a c t i o n o f c h a r i n t h e bed and r e f l u x i n g p a r t i c l e s i s o n l y C.43 w t 5 .
T o t a l p a r t i c l e c o n c e n t r a t i o n s e s t i m a t e d i n t h e p r e s e n t e x p e r i m e n t by t h e approx ima te me thods o u t l i n e d above a r e shown i n F i g u r e 4 . The bed p a r t i c l e c o n c e n t r a t i o n s were d e t e r m i n e d from measuremen t s o f d i f f e r e n t i a l p r e s s u r e , t h e r e f l u x i n g p a r t i c l e s from t h e s a m p l e s c o l - l e c t e d i n , t h e c u p s , and t h e e n t r a i n e d p a r t i c l e s from t h e c y c l o n e c a t c h . An e x p l a n a t i o n o f t h e second c u r v e on F i g u r e 4 i s g i v e n i n t h e C i s c u s s i o n s e c t i o n .
M o l e c u l a r D i f f u s i o n C o e f f i c i e n t s o f P o l y c y c l i c Aromat i c Compounds
Ex per imen t a l m e a s u r e m e n t s o f t h e m o l e c u l a r d i f f u s i o n c o e f f i c i e n t s o f PAC a r e r a r e . C i f f u s i o n c o e f f i c i e n t s i n a i r a t a t m o s p h e r i c p r e s - s u r e have been r e p o r t e d f o r n a p h t h a l e n e and b i p h e n y l a t 298 K , a n t h r a - c e n e a t 372 K (Mack, 1 9 2 5 ) , and b i p h e n y l a t 4 9 1 K ( G i l l i l a n d , 1 9 3 4 ) . Howard and E i t t n e r (1983) d e t e r m i n e d d i f f u s i o n c o e f f i c i e n t s o f heavy s p e c i e s (W = 200 t o 750 kg /kmol ) from c o n c e n t r a t i o n p r o f i l e s measured i n a n e a r - s o o t i n g b e n z e n e / o x y g e n / a r g o n f l a m e ( e q u i v a l e n c e r a t i o 1 . 8 ) , i n a r e g i o n of t h e f l ame where t h e s l o p e s o f t h e s p e c i e s p r o f i l e s , d a n C / d z , were d e t e r m i n e d o n l y by d i f f u s i o n . T h e p r e s s u r e i n t h e f l a m e , and t h e t e m p e r a t u r e i n t h e r e g i o n o f t h e measu remen t s were 2 .67 kPa and 1800 K , r e s p e c t i v e l y . Assuming t h a t t h e s p e c i e s o b s e r v e d were p o l y c y c l i c a r o m a t i c h y d r o c a r b o n s , Howard and E i t t n e r e s t i m a t e d t h e i r d i f f u s i o n c o e f f i c i e n t s a t 300 K from t h e c o r r e l a t i o n o f F u l l e r , S c h e t t l e r , and C i d d i n g s ( 1 9 6 6 1 , u s i n g t h e t e m p e r a t u r e dependence
256
d e r i v e d from t h e L e n n a r d - J o n e s 12-6 p o t e n t i a l , a s recommended b y Sherwood, P i g f o r d , and Wilke ( 1 9 7 5 ) . T h e a p p r o x i m a t i o n g i v e n by F r i s t r o m a n d Westenberg ( 1 9 6 5 ) t o t h e t e m p e r a t u r e dependence o f t he d i f f u s i o n c o l l i s i o n i n t e g r a l was u s e d . The c o r r e l a t i o n o f F u l l e r e t a l , w i t h t h i s m o d i f i c a t i o n , b e c o m e s ( i n S I u n i t s ) :
Howard and B i t t n e r (1983) r e p o r t e d good ag reemen t between t h e i r expe r - i m e n t a l d i f f u s i o n c o e f f i c i e n t s and t h o s e e s t i m a t e d from t h e modi f ied c o r r e l a t i o n , The d i s c r e p a n c i e s between e s t iniated v a l u e s a n d t h e e x p e r i m e n t a l v a l u e s f o r PAC r e p o r t e d b y Mack ( 1 9 2 5 ) , C i l l i l a n d ( 1 9 3 4 ) , and Howard and B i t t n e r (1983) a r e * 10 t o 1 5 % .
E s t i m a t e s of t h e b i n a r y d i f f u s i o n c o e f f i c i e n t s of PAC i n N u s i n g Equa t ion 5 a r e l i s t e d i n Tab le 2. The p r o c e d u r e g i v e n by F u l l e ? e t a 1 ( 1 9 6 6 ) f o r t h e e s t i m a t i o n of t h e m o l e c u l a r d i f f u s i o n volumes from a omic d i f f u s i o n volumes was f o l l o w e d . 7he volume i n c r e m e n t - 0 . 0 2 0 2 m /kmol was added f o r each a r o m a t i c a n d h e t e r o c y c l i c r i n g , b u t n o t fo r t h e r i n g c o n t a i n i n g t h e k e t o g roup i n 9 - f l u o r e n o n e .
5
D i s c u s s i o n
An upper l i m i t on t h e r a t e c o e f f i c i e n t f o r t h e s u r f a c e r e a c t i o n can be e s t i m a t e d from t h e p r o d u c t o f t h e f r e q u e n c y of c o l l i s i o n s of t h e PAC w i t h u n i t a r e a of a s u r f a c e a n d t h e p a r t i c l e e x t e r n a l s u r f a c e a r e a pe r u n i t volume of g a s :
6 )
U s i n g t h e e n t r a i n e d p a r t i c l e p r o p e r t i e s i n Tab le 1 t h e upper l i m i t s f o r n a p h t h a l e n e a t 964 K a r e 310 and 100 Hz f o r t h e s t o n e and char p a r t i c l e s , r e s p e c t i v e l y .
The r a t e c o e f f i c i e n t f o r t h e d i f f u s i o n p r o c e s s i s e q u a l t o
6 S h i D P A C - 0: 7 )
U s i n g t h e e l u t r i a t e d p a r t i c l e p r o p e r t i e s from Tab le 1 and t h e d i f f u - s i o n c o e f f i c i e n t f o r n a p h t h a l e n e i n N 2 f rom T a b l e 2 , v a l u e s o f 7 a n d 2 Hz a r e o b t a i n e d f o r t h e s t o n e a n d c h a r , r e s p e c t i v e l y . The r a t e c o e f f i c i e n t f o r t h e s u r f a c e r e a c t i o n i s t h e r e f o r e e s t i m a t e d t o be more r a p i d t h a n t h a t f o r e x t e r n a l d i f f u s i o n f o r v a l u e s of t h e s t i c k i n g c o e f f i c i e n t s g r e a t e r t h a n a b o u t C . 0 2 . I f t h e s t i c k i n g c o e f f i c i e n t were s u f f i c i e n t l y l a r g e , s a y .> 0 . 1 , t h e e x p e r i m e n t a l r a t e c o e f f i c i e n t would be a p p r o x i m a t e l y e q u a l t o t h e d i f f u s i o n l i m i t e d r a t e c o e f f i c i e n t g iven b y Equat ion 7 .
I n g e n e r a l t h e c o n c e n t r a t i o n of p a r t i c l e s , P . , i s a f u n c t i o h e i g h t , a s shown i n F i g u r e 4 . However, t h e q u a n t i t y z b S h . p . / $ . p * d . 1 s dominated b y t h e a p p r o x i m a t e l y c o n s t a n t c o n c e n t r a t i o n o f ' s r i a l t $ a h t i - c l e s o v e r most of t h e h e i g h t of t h e f r e e b o a r d unde r t h e p r e s e n t c o n d i - t i o n s , shown b y t h e second c u r v e i n F i g u r e 4 . We mey t h e r e f o r e base e s t i m a t e s of t h e d i f f u s i o n l i m i t e d r a t e c o e f f i c i e n t s from Equa t ion 7
4 O f
257
on t h e p r o p e r t i e s o f t h e s m a l l p a r t i c l e s a l o n e .
The c a l c u l a t e d r a t e c o e f f i c i e n t s f o r d e s t r u c t i o n of PAC b y d i f f u - s i o n l i m i t e d s u r f a c e r e a c t i o n s on t h e s m a l l s t o n e and c h a r p a r t i c l e s a r e p l o t t e d v s . P A C d i f f u s i o n c o e f f i c i e n t i n F i g u r e 5. The r a t e c o e f f i c i e n t f o r s i m u l t a n e o u s d i f f u s i o n c o n t r o l l e d d e s t r u c t i o n on both t y p e s of p a r t i c l e s i s t h e s u m o f t h e v a l u e s shown f o r s t o n e and c h a r . The d a t a p o i n t s a r e t h e e x p e r i m e n t a l r a t e c o e f f i c i e n t s d e t e r m i n e d from t h e PAC mole f r a c t i c n s a t z = 2. 1 a n d 3 .8 m .
Any v a l u e s o f t h e e x p e r i m e n t a l r a t e c o e f f i c i e n t s which a r e equa l t o , o r l e s s t h a n t h e t h e o r e t i c a l upper l i m i t ( s u m o f s t o n e and c h a r v a l u e s ) a r e c o n s i s t e n t w i t h t h e model . S i n c e t h i s c o n d i t i o n i s n o t d i f f i c u l t t o s a t i s f y t h e l o c a t i o n o f t h e e x p e r i m e n t a l p o i n t s below t h e upper l i m i t i s l i t t l e more t h a n 2 j u s t i f i c a t i o n f o r f u r t h e r t e s t i n g and e x a m i n a t i o n o f t h e mode l . However, t h e c o n s i s t e n c y o f t h e d a t a p o i n t s ( f a c t o r o f 2 ) i s i n t e r e s t i n g . I f t h e s i m i l a r i t y o f t h e v a l u e s o f t h e e x p e r i m e n t a l r a t e c o e f f i c i e n t s i s n o t due t o s i g n i f i c a n t d i f f u s i o n r e s i s t a n c e , t h e n t h e r a t e c o e f f i c i e n t s f o r t h e n e t ' d e s t r u c - t i o n o f P A C b y h e t e r o g e n e o u s a n d / o r homogeneous r e a c t i o n s a r e r a t h e r i n s e n s i t i v e t o m o l e c u l a r s t r u c t u r e . The l o c a t i o n o f t h e e x p e r i m e n t a l p o i n t s between t h e r a t e c o e f f i c i e n t s f o r d i f f u s i o n l i m i t e d r e a c t i o n on s t o n e and c h a r i s an i n d i c a t i o n t h a t a t l e a s t p a r t o f t h e s t o n e i s p a r t i c i p a t i n g i n t h e r e a c t i o n . Such a c o n c l u s i o n i s n o t j u s t i f i e d however , c o n s i d e r i n g t h e a s s u m p t i o n s a n d a p p r o x i m a t i o n s used i n t h e model and c a l c u l a t i o n s . The r e a c t i o n m i g h t be o c c u r r i n g o n l y on t h e c h a r . If t h e PAC d e s t r u c t i o n were o n l y v i a h e t e r o g e n e o u s r e a c t i o n s t h e i n t e r c e p t o f a l i n e t h r o u g h t h e d a t a p o i n t s would be z e r o a t D p A C = 0. The e x t r a p o l a t e d v a l u e is a p p r o x i m a t e l y 0 .7 Hz.
Conc lus ion
A h e t e r o g e n e o u s mechanism f o r d e s t r u c t i o n o f P A C i n t h e A F B C f r e e b o a r d c o u l d n o t be r u l e d o u t by compar ison w i t h t h e r a t e s of d i s a p p e a r a n c e o f 2 t o 4 r i n g P A C a t one s e t o f o p e r a t i n g c o n d i t i o n s . If h e t e r o g e n e o u s r e a c t i o n s a r e , i n f a c t , r e s p o n s i b l e f o r P A C d e s t r u c - t i o n , a more d e t a i l e d model a c c o u n t i n g f o r p r o d u c t i o n o f PAC and f i n i t e r a t e s o f t h e s u r f a c e r e a c t i o n s may be needed . The r e l a t i v e i m p o r t a n c e o f s t o n e a n d c h a r p a r t i c l e s can o n l y be d e t e r m i n e d b y a d d i t i o n a l m e a s u r e m e n t s ove r a r a n g e o f r a t i o s o f t h e c h a r / s t o n e c o n c e n t r a t i o n s . The p o s s i b i l i t y t h a t o n l y a f r a c t i o n o f t h e s u r f a c e a r e a o f e a c h t y p e o f p a r t i c l e i s u t i l i z e d , due t o nonuni form s u r f a c e c o m p o s i t i o n , w i l l be d i f f i c u l t t o a s s e s s . E e t t e r s p a t i a l r e s o l u t i o n o f t h e P A C p r o f i l e s i s needed .
Acknowledgements
T h i s work was s u p p o r t e d b y t h e N a t i o n a l I n s t i t u t e o f Envi ron- m e n t a l Hea l th S c i e n c e s , N a t i o n a l I n s t i t u t e s of Hea l th ( C e n t e r Gran t N O . 5 P50 ES02109). The m e a s u r e m e n t s o f PAC were made i n c o n j u n c t i o n w i t h o t h e r AFBC e x p e r i m e n t s which a r e s u p p o r t e d b y t h e O f f i c e o f F o s s i l Ene rgy , U . S . l j epa r tmen t o f Energy ( G r a n t No. DE-FC22-80PC3G215) and b y t h e Tennessee Va l l ey A u t h o r i t y ( C o n t r a c t No. TV-55783) .
The a u t h o r s t h a n k P r o f e s s o r J . B . Howard f o r h e l p f u l d i s c u s s i o n s o f h i s d e t e r m i n a t i o n o f d i f f u s i o n c o e f f i c i e n t s from t h e f l ame measure- m e n t s . We a r e i n d e b t e d t o P r o f e s s o r J . P . Longwell f o r h i s s u g g e s t i o n t h a t i n t e r a c t i o n s of PAC w i t h p a r t i c l e s m i g h t be a s i g n i f i c a n t d e t e r - m i n a n t o f t h e PAC c o n c e n t r a t i o n s i n t h e f r e e b o a r d . The r e s p o n s i b i l i t y f o r t h e a c c u r a c y o f t h e a n a l y s i s , however , r e s t s e n t i r e l y w i t h t h e a u t h o r s . We a r e g r a t e f u l f o r t h e a s s i s t a n c e o f James f i . Fyrd of t h e
252
Tennessee V a l l e y A u t h o r i t y , C h a t t a n o o g a , i n s u p p l y i n g t h e c o a l , 1 lme- s t o n e , and a n a l y s e s o f t h e p a r t i c l e s a m p l e s . We t h a n k Ms. Bonnie Caput0 Of t h e M I T Energy L a b o r a t o r y f o r p a t i e n t l y and e x p e r t l y t y p i n g t h e d r a f t s and f i n a l m a n u s c r i p t .
Nomenc la tu re
C . J
d i
')AB
DPAC
kexp k . .
J 11
k'. . J
Lf
'i Sh T
P R
UO W.
J X .
J
J , i
2
r l .
'i
+ i
Pyi
( W j
c o n c e n t r a t i o n of g a s e o u s s p e c i e s j, kmol/m3
S p e c i f i c s u r f a c e a r e a - b a s e d g e o m e t r i c mean d i a m e t e r o f p a r t i c l e s i , m
2 b i n a r y d i f f u s i o n c o e f f i c i e n t , m / s
d i f f u s i o n c o e f f i c i e n t o f P A C i n t h e f r e e b o a r d g a s , assumed t o be e q u a l t o C p A C - N , m / s
e x p e r i m e n t a l f i r s t o r d e r r a t e c o e f f i c i e n t , Hz r a t e c o e f f i c i e n t f o r s u r f a c e r e a c t i o n o f g a s e o u s s p e c i e s j w i t h p a r t i c l e s i , m/s e f f e c t i v e f i r s t o r d e r r a t e c o e f f i c i e n t f o r h e t e r o g e n e o u s r e a c - t i o n o f g a s e o u s s p e c i e s j w i t h p a r t i c l e s i , Hz f l u i d i z e d bed h e i g h t , m p r e s s u r e , Pa g a s c o n s t a n t = 8 3 1 4 J/kmol.K B E T s p e c i f i c s u r f a c e a r e a o f p a r t i c l e s i , r / k g Sherwood number f o r p a r t i c l e s i , d i m e n s i o n l e s s t e m p e r a t u r e , K s u p e r f i c i a l ( empty t u b e ) g a s v e l o c i t y , m/s
m o l e c u l a r w e i g h t o f s p e c i e s j , kg/kmol mole f r a c t i o n o f g a s e o u s s p e c i e s j , d i m e n s i o n l e s s h e i g h t above a i r d i s t r i b u t o r , m e f f e c t i v e n e s s f a c t o r f o r r e a c t i o n o f g a s e o u s s p e c i e s J w i t h p a r t i c l e s i , d i m e n s i o n l e s s
3 c o n c e n t r a t i o n o f p a r t i c l e s i , kg/m s o l i d d e n s i t y o f p a r t i c l e s i , kg/rr3 s p h e r i c i t y o f p a r t i c l e s i , d i m e n s i o n l e s s sum o f a t o m i c d i f f u s i o n volumes f o r m o l e c u l e s o f g a s e o u s s p e c i e s j , m 3 / k m o l
2
2
2
R e f e r e n c e s
B e e r , J.M., S a r o f i m , A . F . Sandhu , S . S . , A n d r e i , M . , E a c h o v c h i n , D . , Chan L . K . , Chaung, T.Z., and S p r o u s e , A . M . , 1981, h0 E m i s s i o n s from F l u i d i z e d Coal Combus t ion , F i n a l Repor t unde r G r a n t 'No. R804978020, U.S. Env i ronmen ta l P r o t e c t i o n Agency, Resea rch T r i a n g l e P a r k , N C .
B i t t n e r , J . C . , and Howard, J . E . , 1 9 8 1 a , P r e - P a r t i c l e C h e m i s t r y i n Soot F o r m a t i o n , I n : P a r t i c u l a t e Carbon F o r m a t i o n D u r i n g Combus t ion , f .C. S i e g l a and G . W . S m i t h , e d s . , Plenum Press , N Y , p p . 109-1112.
259
D i t t n e r , J . G . , and Howard, J . B . , 1 9 8 1 b , Composi t ion P r o f i l e s and R e a c t i o n Mechanisms i n a Near -Soot ing Premixed Benzene/Oxygen/Argon F l a m e , E i g h t e e n t h Symposium ( I n t e r n a t i o n a l ) on Combus t ion , The Combus- t i o n I n s t i t u t e , P i t t s b u r g h , P A , pp . 1105-1116.
C h i u , K.S., Walsh, P . M . , Beer, J .M. , and Biemann, K . , 1983 , P o l y c y c l i c Aromat ic Compounds i n F l u i d i z e d Eed Combustion o f B i tuminous Coal ,
uminous C o a l , and O i l S h a l e . I n : P o l y n u c l e a r A r o m a t i c Hydro-
D u t t a , A . , C h i u , K.S., W a l s h , P . H . , Beer, J.M., and Biemann, K . , 1983 , The R a t e s o f Methane and N a p h t h a l e n e C e s t r u c t i o n i n t h e F r e e b o a r d o f a F l u i d i z e d Bed C o a l C o m b u s t o r , A m e r i c a n C h e m i c a l S o c i e t y , 1 8 5 t h N a t i o n a l Elee t ing , S e a t t l e , W A , March 20-25 , C i v i s i o n o f Env i ronmen ta l C h e m i s t r y , Extended A b s t r a c t .
F r i s t r o m , R . M . , a n d W e s t e n b e r g , A . A . , 1 9 6 5 , F l z m e S t r u c t u r e , KcGraw-Hill , N Y , p. 2 7 6 .
F u l l e r , E . L . , S c h e t t l e r , P . D . , and G i d d i n g s , J . C . , 1966, I n d u s t r i a l and E n g i n e e r i n g C h e m i s t r y , 58, No. 5 , 1 9 .
G i l l i l a n d E . R . , 1934, I n d u s t r i a l and E n g i n e e r i n g C h e m i s t r y , 6, 681.
Howard, J . B . , and E i t t n e r , J . C . , 1 9 8 3 , S t r u c t u r e of S o o t i n g F lames , I n : E F o r n , a t i o n i n Combus t ion S y s t e m s and I t s T o x i c P r o p e r t i e s , J . L a h a y e , e d . , Plenum P r e s s , N Y .
I r a n i , R . R . , and C a l l i s , C.F. : 1963 ; P a r t i c l s S i z e : Z e a s u r e m e n t , I n t e r p r e t a t i o n , and A p p l i c a t i o n , W i l e y , N Y , p p . 4 3 - r
v a c k , E . , 1925, J . A m . Chem. SOC. 3, 2468.
Pember ton , S . ? . , and C a v i d s o n , J . F . , 1963 , E l u t r i a t i o n o f F i n e P a r t i - c l e s from Bubbl ing F l u i d i z e d B e d s , F o u r t h I n t e r n a t i o n a l C o n f e r e n c e on F l u i d i z a t i o n , K a s h i k o j i m a , J a p a n , Eiay 29 - J u n e 3 .
P e t t y j o h n , E .S . , and C h r i s t i a n s e n , E . B . , 1948, Chem. Eng. P r o g . 5, 1 5 7 .
S h e r r o o d , T . K . , P i g f o r d , R.C., and k ' i l k e , C . R . , 1975, Mess T r a n s f e r , McGraw-Hill, N Y , p. 1 8 .
Wal sh , P . N . , Chaung T . Z . , C u t t a , A . , Beer , J.M., and S a r o f i m , A.F. , l 9 8 2 a , P a r t i c l e E n t r a i n m e n t and N i t r i c O x i d e R e d u c t i o n i n t h e F r e e - b o a r d of a F l u i d i z e d Coal Combus to r , American Chemical S o c i e t y , Div i - s i o n o f F u e l C h e m i s t r y , P r e p r i n t s , Vol . 2 7 , No. 1 , pp. 243-261.
W a l s h , P . M . , Chaung, T . Z . , C u t t a , A . , Bee'r, J .M., and S a r o f i m , A.F., 198213, Ni t r ic Oxide Reduc t ion i n t h e F r e e b o a r d o f a F l u i d i z e d Eed Coal Combus to r , N i n e t e e n t h Symposium ( I n t e r n e t i o n a l ) on Combus t ion , The Combustion I n s t i t u t e , P i t t s b u r g h , P A , pp. 1281-1289.
K a l s h , P . M . , Y o k o z e k i , A . , and b e e r , J . N . , 1982, Unpubl i shed work.
W a l s h , P . M . , I",ayo, J . E . , and E e g r , J.M., 1 9 8 3 , R e f l u x i n g P a r t i c l e s i n The F r e e b o a r d of a F l u i d i z e d Eed , American I n s t i t u t e o f Chemical E n g i n e e r s , 1983 A n n u a l M e e t i n g , Wash ing ton , C C , C c t o b e r 30 - November 4 .
260
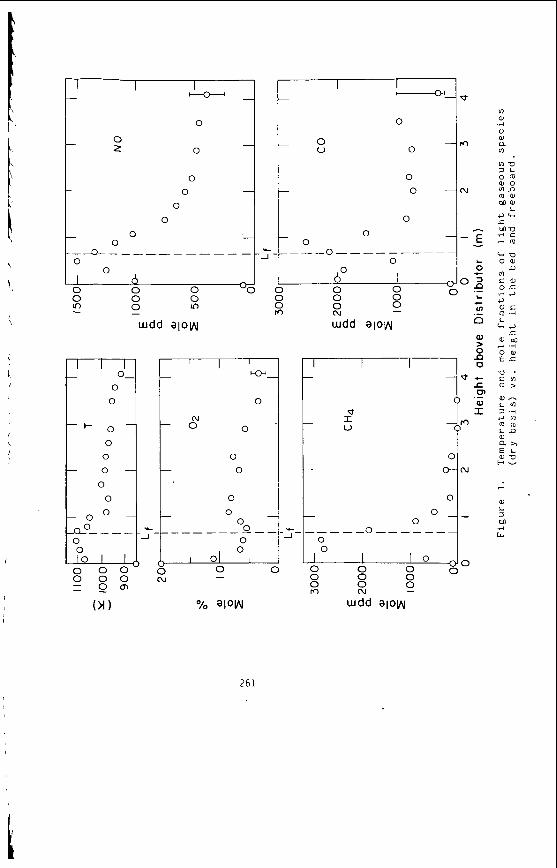
wdd slow
0 Uo c A -
0 I 0
I ' 0 0 0 0 0 0 0 0 0 0 YC) z 0
261
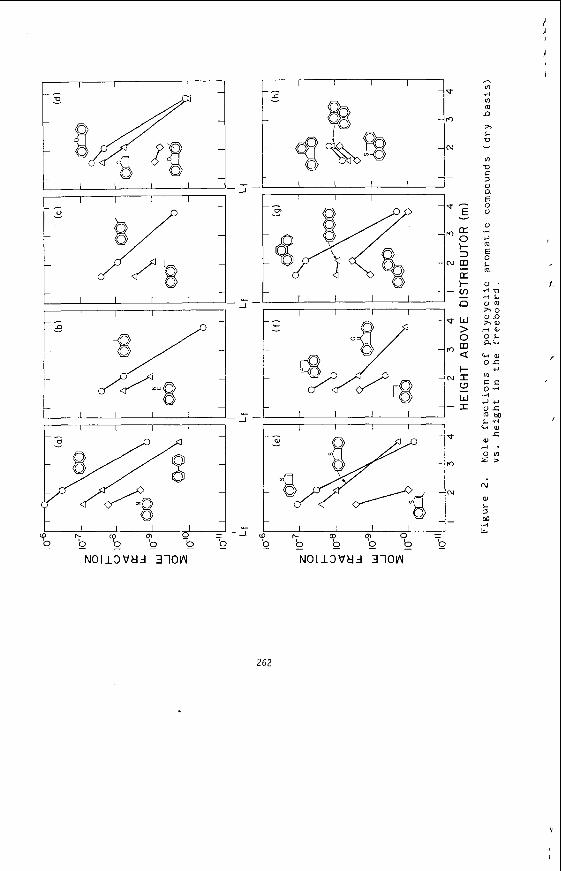
I I I I I
1 I I I I I
L -1- - I I I I I
I I I I I
I I I I
m -I 1:
I I I I I 1
N
262
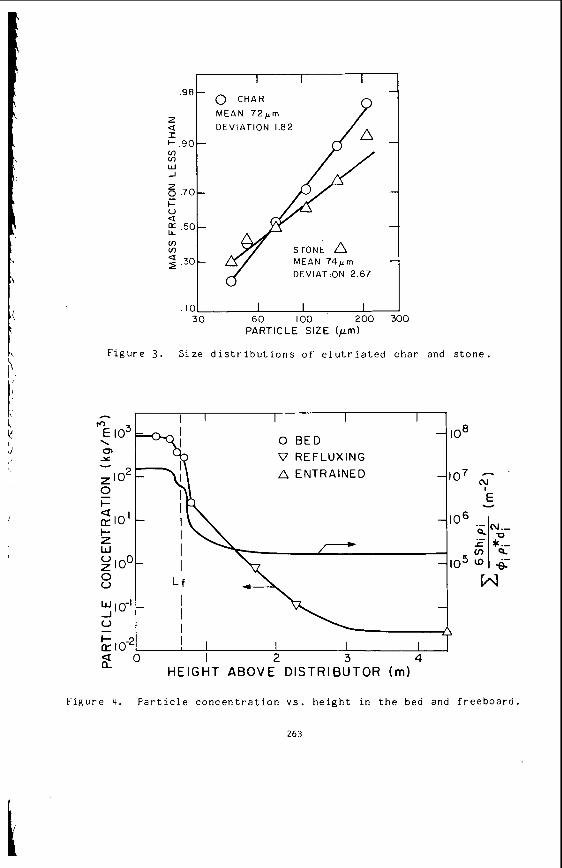
.98 -
z I
cn cn w J
a I- .90 -
6 .70- I- U
- a
.50- cn cn 2 .30-
I I I
IO 30 60 I O 0 2 00 PARTICLE SIZE ( p m )
F i g u r e 3 . S i z e d i s t r i b u t i o n s o f e l u t r i a t e d c h a r and s t o n e .
0 BED V REFLUXING
F i g u r e 4 . P a r t i c l e c o n c e n t r a t i o n v s . h e i g h t i n t h e bed and f r e e b o a r d .
263
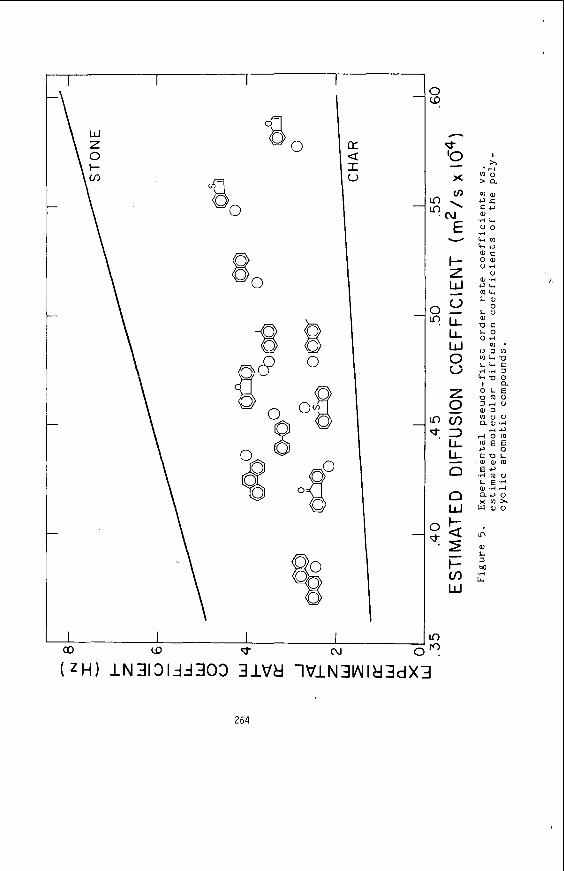
I I
W Z \ 0
\
c I 0
a
I 00 d-
I
' -0 aJc
r( 0 ID m E E c , o C U L a , a J m
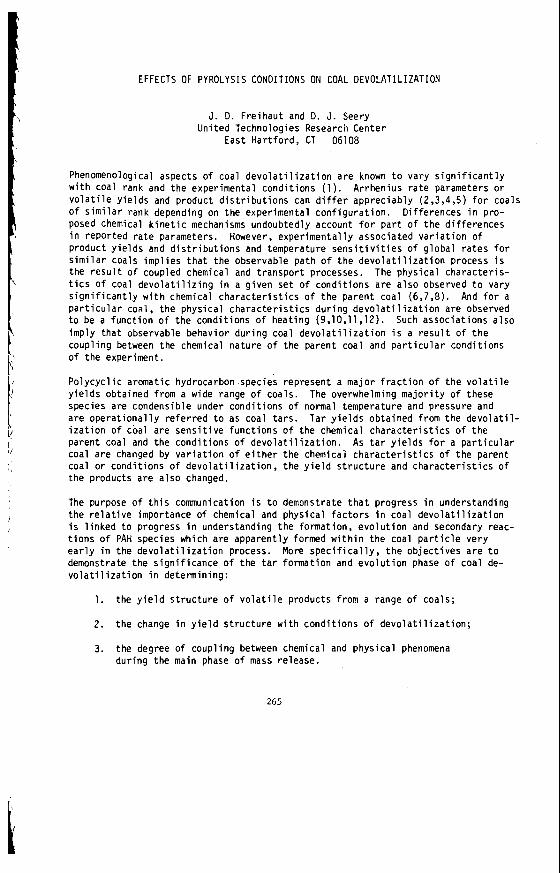
I/ ! I '
EFFECTS OF PYROLYSIS CONDITIONS OW COAL DEVOLATILIZATION
J. D. Freihaut and D. J. Seery United Technologies Research Center
East Hartford, CT 06108
Phenomenological aspects of coal devolatilization are known to vary significantly with coal rank and the experimental conditions (1). Arrhenius rate parameters or volatile yields and product distributions can differ appreciably (2,3,4,5) for coals Of similar rank depending on the experimental configuration. Differences in pro- posed chemical kinetic mechanisms undoubtedly account for part of the differences in reported rate parameters. product yields and distributions and temperature sensitivities of global rates for similar coals implies that the observable path of the devolatilization process is the result of coupled chemical and transport processes. The physical characteris- tics of coal devolatilizing in a given set of conditions are also observed to vary significantly with chemical characteristics of the parent coal (6,7,8). And for a particular coal, the physical characteristics during devolatilization are observed to be a function of the conditions of heating (9.10,11,12). imply that observable behavior during coal devolatilization is a result of the coupling between the chemical nature of the parent coal and particular conditions of the experiment.
Polycyclic aromatic hydrocarbon species represent a major fraction of the volatile yields obtained from a wide range of coals. The overwhelming majority of these species are condensible under conditions of normal temperature and pressure and are operationally referred to as coal tars. Tar yields obtained from the devolatil- ization of coal are sensitive functions of the chemical characteristics of the parent coal and the conditions of devolatilization. As tar yields for a particular coal are changed by variation o f either the chemical characteristics of the parent coal or conditions of devolatilization, the yield structure and characteristics of the products are also changed.
The purpose of this communication is to demonstrate that progress in understanding the relative importance of chemical and physical factors in coal devolatilization is linked to progress in understanding the formation, evolution and secondary reac- tions of PAH species which are apparently formed within the coal particle very early in the devolatilization process. More specifically, the objectrves are to demonstrate the significance of the tar formation and evolution phase of coal de- volatilization in detennining:
However, experimentally associated variation of
Such associations also
1.
2.
3.
the yield structure o f volatile products from a range of coals;
the change in yield structure with conditions of devolatilization;
the degree of coupling between chemical and physical phenomena during the main phase of mass release.
265
I
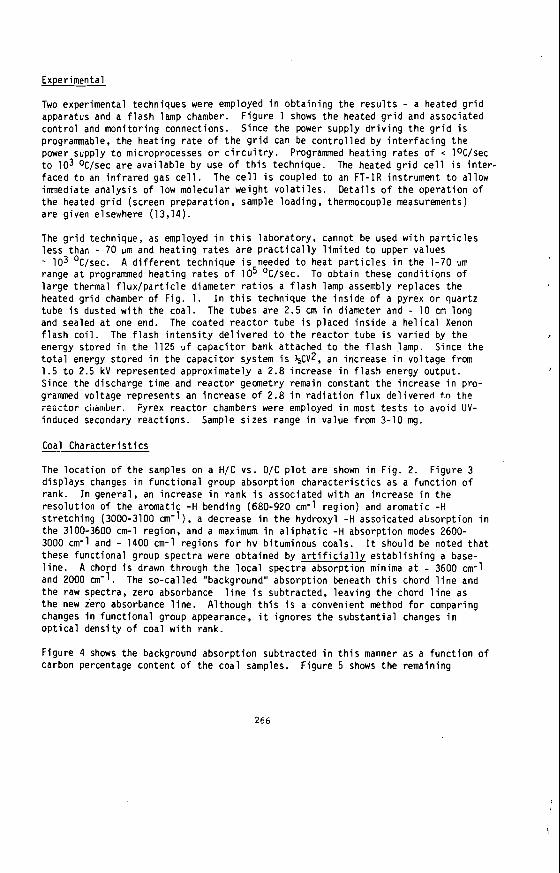
Experimental
Two experimental techniques were employed i n obtaining the r e su l t s - a heated grid apparatus and a f lash lamp chamber. Figure 1 shows the heated g r i d and associated control and monitoring connections. Since the power supply driving the grid i s programmable, the heating r a t e of t he gr id can be controlled by interfacing the power supply t o microprocesses o r c i r cu i t ry . t o lo3 OC/sec a re available by use of t h i s technique. faced t o an infrared gas c e l l . immediate analysis of low molecular we igh t vo la t i l e s . the heated grid (screen preparation, sample loading, thermocouple measurements) a re given elsewhere (13,14).
The grid technique, as employed in t h i s laboratory, cannot be used with par t ic les l e s s than - 70 urn and heating r a t e s are prac t ica l ly limited t o upper values - lo3 OC/sec. range a t programmed heating r a t e s of lo5 OC/sec. large thermal f lux /par t ic le diameter r a t io s a f lash lamp assembly replaces the heated grid chamber of Fig. 1. tube i s dusted with the coal. The tubes a re 2.5 cm in diameter and - 10 cm long and sealed a t one end. The coated reac tor tube i s placed inside a helical Xenon f lash coil . The f lash in tens i ty delivered t o the reactor tube i s varied by the I
energy stored in the 1125 uf capacitor bank attached t o the f lash lamp. to t a l energy stored i n the capacitor system i s % C V 2 , an increase i n voltage from 1.5 t o 2.5 kV represented approximately a 2.8 increase i n f l a sh energy output. Since the discharge time and reactor geometry remain constant the increase in pro- grammed voltage represents an increase of 2.8 i n radiation flux delivered t o t h e I c o b ~ ~ r chaiiiber. Pyrex reactor chambers were employed i n most t e s t s t o avoid UV- induced secondary reactions.
Programmed heating ra tes of < 1°C/sec The heated grid ce l l i s inter-
The ce l l i s coupled t o an FT-IR instrument t o allow Details of the operation of
A d i f fe ren t technique i s needed t o heat par t ic les in the 1-70 um To obtain these conditions of
In t h i s technique the inside of a pyrex or quartz
Since the
I
_^._ &-.-
Sample s i zes range in value from 3-10 mg.
Coal Characterist ics
The location of the samples on a H / C vs. O/C p lo t a r e shown i n Fig. 2 . Figure 3 displays changes i n functional group absorption charac te r i s t ics as a function o f rank. I n general, an increase i n rank i s associated with an increase in the resolution of the aromatic -H bending (680-920 cm-1 region) and aromatic -H stretching (3000-3100 an-'), a decrease in the hydroxyl -H assoicated absorption i n the 3100-3600 cm-1 region, and a maximum i n a l ipha t ic -H absorption modes 2600- 3000 cm-1 and - 1400 cm-1 regions f o r h v bituminous coals. I t should be noted tha t these functional group spectra were obtained by a r t i f i c i a l l y establishing a base- l ine . and 2000 an-l. The so-called "background" absorption beneath t h i s chord l i ne and the raw spectra, zero absorbance l i n e i s subtracted, leaving the chord l i ne as the new zero absorbance l i ne . Although th i s i s a convenient method fo r comparing changes i n functional group appearance, i t ignores the substantial changes i n op t ica l density of coal with rank.
Figure 4 shows the background absorption subtracted i n t h i s manner as a function of carbon percentage content of the coal samples.
A chord i s drawn through the loca l spectra absorption minima a t - 3600 cm-1
Figure 5 shows the remaining
266
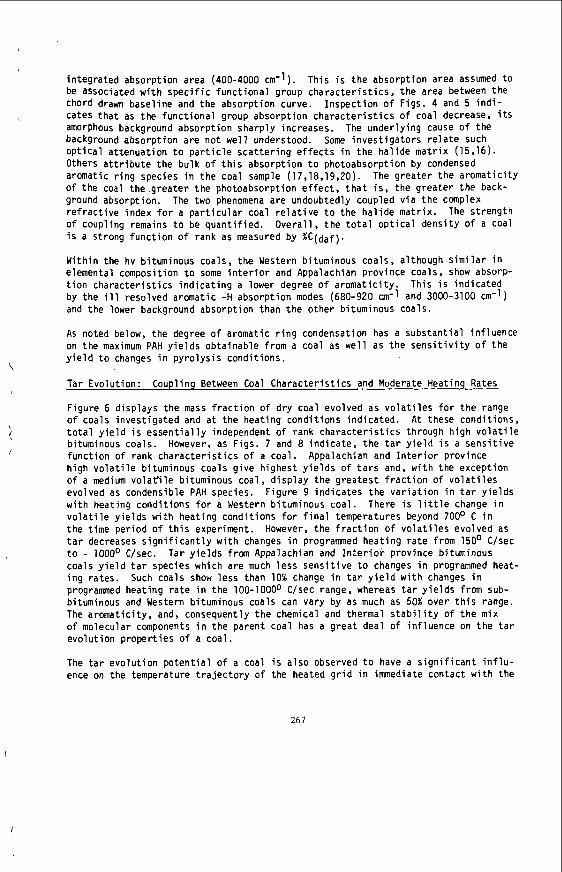
i n teg ra ted absorpt ion area (400-4000 un-'). be associated wi th s p e c i f i c f u n c t i o n a l group c h a r a c t e r i s t i c s , t h e area between the chord drawn base l i ne and t h e abso rp t i on curve. cates t h a t as t h e f u n c t i o n a l group abso rp t i on c h a r a c t e r i s t i c s o f coa l decrease, i t s amorphous background abso rp t i on sha rp l y increases. background abso rp t i on a r e n o t w e l l understood. o p t i c a l a t tenua t ion t o p a r t i c l e s c a t t e r i n g e f f e c t s i n t h e h a l i d e m a t r i x (15,16). Others a t t r i b u t e t h e b u l k o f t h i s abso rp t i on t o photoabsorpt ion by condensed aromatic r i n g species i n t h e coal sample (17,18,19,20). of t h e coal t h e .g rea te r t h e photoabsorpt ion e f f e c t , t h a t i s , t he g r e a t e r t h e back- ground absorpt ion. r e f r a c t i v e index f o r a p a r t i c u l a r coal r e l a t i v e t o t h e h a l i d e m a t r i x . The s t reng th Of coupl ing remains t o be q u a n t i f i e d . Overa l l , t h e t o t a l o p t i c a l d e n s i t y of a Coal i s a s t rong f u n c t i o n o f rank as measured by %C(daf).
W i th in the hv b i tuminous coals , t h e Western b i tuminous coals , a l though s i m i l a r i n elemental composit ion t o some i n t e r i o r and Appalachian p rov ince coals , show absorp- t i o n c h a r a c t e r i s t i c s i n d i c a t i n g a lower degree o f a r o m a t i c i t y . Th i s i s i n d i c a t e d by the ill resolved aromat ic -H abso rp t i on modes (680-920 un-l and 3000-3100 cm-l) and t h e lower background absorpt ion than t h e o t h e r b i tuminous coals .
As noted below, the degree o f aromatic r i n g condensation has a s u b s t a n t i a l in f luence on t h e maximum PAH y i e l d s ob ta inab le f rom a coal as w e l l as t h e s e n s i t i v i t y o f t h e y i e l d t o changes i n p y r o l y s i s cond i t i ons .
Tar Evo lu t i on : Coupling Between Coal C h a r a c t e r i s t i c s and Moderate Heating Rates
F igure 6 d i sp lays t h e mass f r a c t i o n o f d r y coa l evolved as v o l a t i l e s f o r t h e range o f coals i n v e s t i g a t e d and a t t h e hea t ing cond i t i ons i nd i ca ted . A t these cond i t i ons , t o t a l y i e l d i s e s s e n t i a l l y independent o f rank c h a r a c t e r i s t i c s through h i g h v o l a t i l e bituminous coals . f u n c t i o n o f rank c h a r a c t e r i s t i c s o f a coal . h igh v o l a t i l e bituminous coals g i v e h ighes t y i e l d s o f t a r s and, w i t h the except ion o f a medium v o l a t i l e bituminous coal , d i s p l a y t h e g r e a t e s t f r a c t i o n o f v o l a t i l e s evolved as condensible PAH species. w i t h hea t ing cond i t i ons f o r a Western b i tuminous coa l . v o l a t i l e y i e l d s w i t h hea t ing cond i t i ons f o r f i n a l temperatures beyond 700° C i n t h e t ime pe r iod o f t h i s experiment. t a r decreases s i g n i f i c a n t l y w i t h changes i n programmed h e a t i n g r a t e from 150' C/sec t o - 1000° C/sec. coals y i e l d t a r species which a re much l e s s s e n s i t i v e t o changes i n programmed heat- i n g ra tes . programmed hea t ing r a t e i n t h e 100-1000° C/sec range, whereas t a r y i e l d s from sub- bituminous and Western bituminous coals can va ry by as much as 50% over t h i s range. The a romat i c i t y , and, consequently t h e chemical and thermal s t a b i l i t y o f t h e mix o f molecular components i n t h e parent coa l has a g r e a t deal o f i n f l u e n c e on t h e t a r e v o l u t i o n p r o p e r t i e s o f a coa l .
The t a r e v o l u t i o n p o t e n t i a l o f a coal i s a l s o observed t o have a s i g n i f i c a n t i n f l u - ence on the temperature t r a j e c t o r y o f t he heated g r i d i n immediate con tac t w i t h t h e
Th is i s t h e abso rp t i on area assumed t o
Inspec t i on o f F igs. 4 and 5 i n d i -
Some i n v e s t i g a t o r s r e l a t e such The under l y ing cause of t he
The g rea te r t h e a r o m a t i c i t y
The two phenomena a re undoubtedly coupled v i a t h e complex
However, as F igs. 7 and 8 i n d i c a t e , t h e t a r y i e l d i s a s e n s i t i v e Appalachian and I n t e r i o r prov ince
F igure 9 i n d i c a t e s t h e v a r i a t i o n i n t a r y i e l d s There i s l i t t l e change i n
However, t h e f r a c t i o n o f v o l a t i l e s evolved as
Tar y i e l d s from Appalachian and I n t e r i o r p rov ince b i tuminous
Such coals show l e s s than 10% change i n t a r y i e l d w i t h changes i n
267
I
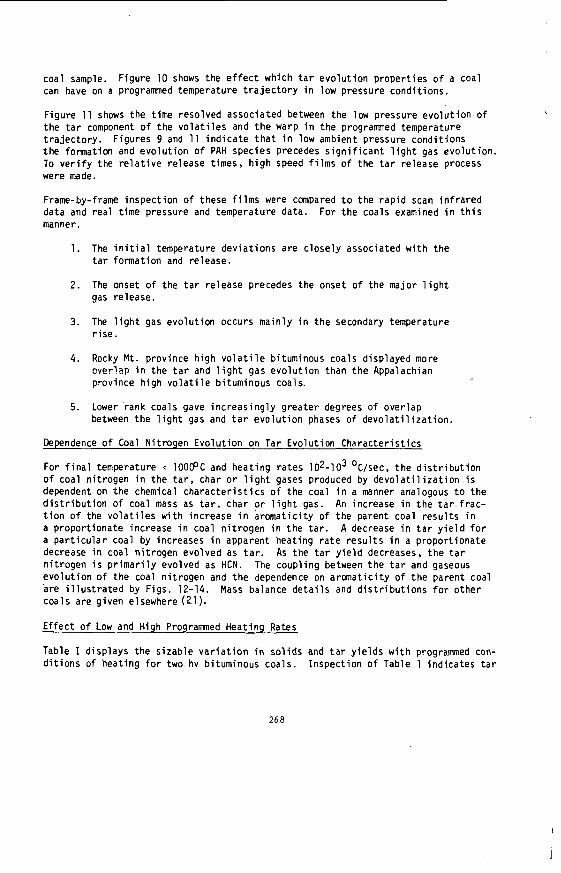
coal sample. can have on a programmed temperature t r a j ec to ry i n low pressure conditions,
Figure 11 shows the time resolved associated between the l o w pressure evolution of the t a r component of the vo la t i l e s and the warp i n the programed temperature t ra jec tory . Figures 9 and 11 indicate t h a t i n low ambient pressure conditions the formation and evolution of PAH species precedes s ign i f icant l i gh t gas evolution. To verify the r e l a t ive release times, high speed films of the t a r release process were made.
Figure 10 shows the e f f ec t which t a r evolution properties of a coal
Frame-by-frame inspection o f these fi lms were compared t o the rapid scan infrared data and real time pressure and temperature data. For the coals examined in t h i s manner.
1 . The i n i t i a l temperature deviations a re closely associated with the t a r formation and release.
2 . The onset o f the t a r release precedes the onset of the major l i gh t gas release.
The l i gh t gas evolution occurs mainly i n t he secondary temperature r i s e .
3.
4 . Rocky M t . province h i g h v o l a t i l e bituminous coals displayed more everlap i n the t a r and l i g h t gas evolution than the Appalachian province h i g h vo la t i l e bituminous coais.
Lower -rank coals gave increasingly grea te r degrees of overlap between the l igh t gas and t a r evolution phases of devola t i l i za t ion .
5.
Dependence of Coal Nitrogen Evolution on Tar Evolution Characterist ics
For f ina l temperature < 1008C and heating r a t e s 102-103 OC/sec, t he d is t r ibu t ion of coal nitrogen i n the t a r , char o r l i gh t gases produced by devola t i l i za t ion i s dependent on the chemical charac te r i s t ics of the coal i n a manner analogous t o the d is t r ibu t ion of coal mass as t a r . char or l i g h t gas . An increase in the t a r f rac- t ion of the vola t i les w i t h increase i n aromaticity of the parent coal resu l t s in a proportionate increase i n coal nitrogen in the t a r . A decrease in t a r y ie ld f o r a par t icu lar coal by increases i n apparent heating r a t e r e su l t s in a proportionate decrease i n coal nitrogen evolved as t a r . nitrogen i s primarily evolved as H C N . evolution of the coal nitrogen and the dependence on aromaticity of the parent coal a r e i l l u s t r a t ed by Figs. 12-14. coals are given elsewhere (21).
As the tar yield decreases, t he t a r The coupling between the t a r and gaseous
Mass balance de t a i l s and d is t r ibu t ions f o r other
Effect of Low and High Programmed Heating Rates
Table I displays the sizable var ia t ion in so l ids and t a r y ie lds w i t h programmed con- di t ions of heating for two h v bituminous coals. Inspection of Table 1 indicates tar
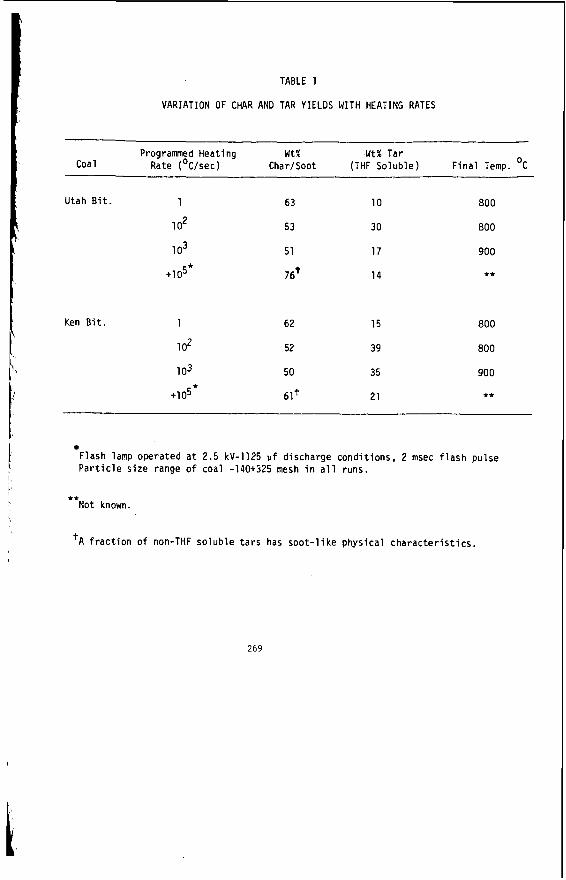
TABLE 1
VARIATION OF CHAR AND TAR YIELDS WITH HEATING RATES
~~ ~
0 Programed Heat ing W t % Wt% Tar Coa 1 Rate (OC/sec) Char/Soot (THF So lub le ) F i n a l Temp. C
Utah B i t . 1 63 10 800
1 o2 53 30 800
1 o3 51 17 900
+1 OS* 7bt 14 **
Ken B i t . 1 62 15 800
1 o2 52 39 800
103 50 35 900
+1 OS* 61t 21 **
F lash lamp operated a t 2.5 kV-1125 v f d ischarge c o n d i t i o n s , 2 msec f l a s h p u l s e P a r t i c l e s i z e range o f coal -140+325 mesh i n a l l runs.
** Not known.
'A f r a c t i o n o f non-THF s o l u b l e t a r s has s o o t - l i ke phys i ca l c h a r a c t e r i s t i c s .
269
y i e l d s and char y i e l d s a re min imized f o r hv B i t coa ls i n moderate hea t ing condi t ions and low pressure cond i t i ons . have t h e e f f e c t o f decreasing t a r y i e l d s w h i l e i nc reas ing s o l i d s y i e l d s , e i t h e r i n t h e form o f cha r o r a combination of char and soot . thermal f l u x c o n d i t i o n s i n t h e t a r f o rma t ion and e v o l u t i o n stages.
Very low h e a t i n g r a t e s and ve ry h i g h hea t ing ra tes
L i g h t gas y i e l d s r e f l e c t the
Summary and Discuss ion o f Resul ts
The format ion and e v o l u t i o n o f PAH species i n coal d e v o l a t i l i z a t i o n i s observed t o be a s e n s i t i v e f u n c t i o n o f t h e mix o f mo lecu la r species present i n t h e pa ren t coal. Through h i g h v o l a t i l e b i tuminous c o a l s and w i t h i n moderate hea t ing cond i t i ons , PAH y i e l d s i nc rease wi th apparent a r o m a t i c i t y o f t h e coal . Those coa ls having t h e g r e a t e r a r o m a t i c i t y , as i n d i c a t e d by i n f r a r e d abso rp t i on c h a r a c t e r i s t i c s , g i v e con- s i s t e n t l y g r e a t e r t a r y i e l d s than l e s s aromat ic samples. Such coa ls a l s o show less v a r i a t i o n i n t a r y i e l d s w i t h changes i n hea t ing r a t e . For moderate hea t ing ra tes t o f i n a l temperatures l e s s than 1000° C, t h e coal n i t r o g e n e v o l u t i o n m i r r o r s the pa ren t coal e v o l u t i o n as char, t a r o r l i g h t gas species on a mass f r a c t i o n bas is . Heating r a t e s o f l o C/sec o r l e s s a r e observed t o lower t a r y i e l d s o f b i tuminous coa ls wh i l e i nc reas ing char and l i g h t gas y i e l d s . On t h e o t h e r hand, p rog ramed hea t ing r a t e s o f 105-106 OC/sec a l so r e s u l t i n a decrease i n t a r y i e l d s w i t h an increase i n s o l i d species products . A f r a c t i o n o f these s o l i d s appear t o be soot p a r t i c l e s . Gaseous y i e l d s o f coals sub jec ted t o such h igh thermal f l u x e s show C2H2, CO, CH4, HCN, C2H4 and polyacety lenes as t h e predominant gas phase species.
Not on l y do t a r y i e l d s vary w i t h hea t ing cond i t i ons b u t e v o l u t i o n t imes va ry s i g - n i f i c a n t l y as w e l l . x d e r o f severa i m i l l i s e c o n d s i n the h ighes t p rog ramed h e a t i n g r a t e s employed t o f r a c t i o n o f seconds t o seconds i n moderate hea t ing r a t e cond i t i ons , and hundreds o f seconds i n t h e lowest hea t ing r a t e s employed. spec ies appears t o begin temperature range. heat and mass t r a n s f e r parameters as w e l l as chemical c h a r a c t e r i s t i c s o f these p r imary t a r s . t h e l e s s secondary chemical reac t i ons i n f l u e n c e observable behavior. For these coals , the i n i t i a l mass loss o f t h e coa l i s l i k e l y heat and mass t r a n s p o r t l i m i t e d . For h ighe r rank coa ls , t h e p r imary t a r s are l i k e l y t o be o f such molecular weights and dimension t h a t secondary char- forming reac t i ons w i l l become compe t i t i ve w i t h the t a r e v o l u t i o n process. r e s u l t s r e f l e c t t h e coupled e f fec ts o f i n t r i n s i c and e x t r i n s i c parameters on pr imary PAH format ion and e v o l u t i o n .
Tar format ion and e v o l u t i o n t i m e s ITP oS:~TL'E: io Le o f t n e
Formation o f p o l y c y l c i c aromat ic a t r e l a t i v e l y low temperature, t h a t i s i n t h e 300-4750 C
The u l t i m a t e t a r y i e l d than appears t o be a complex f u n c t i o n o f
Fo r hv B i t coa ls and lower ranks, t he more aromat ic t h e p r imary ta rs ,
I n view of such considerat ions, t h e wide v a r i a t i o n i n repo r ted
Low hea t ing r a t e s a l l o w secondary char- forming reac t i ons o f t a r s t o take p lace w i t h i n t h e coa l p a r t i c l e . Very h igh hea t ing r a t e s i n t roduce secondary c rack ing and r i n g condensation r e a c t i o n s o f Primary t a r s as they evolve. mary t a r s t o undergo char- forming o r c rack ing reac t i ons i s a f r a c t i o n o f chemical c h a r a c t e r i s t i c s o f t h e pr imary t a r s . As noted i n t h e I n t r o d u c t i o n t h e development o f a comprehensive model o f coa l devolatilizationlpyrolysis f o r a s i n g l e rank o f coal i n a range o f cond i t i ons o r a range o f coa ls i n a s i n g l e c o n d i t i o n i s cont ingent upon fundamental s tud ies of t h e fo rma t ion and e v o l u t i o n of pr imary PAH species.
The s u s c e p t i b i l i t y o f p r i -
270
I REFERENCES
1. Howard, J. B., "Fundamentals o f Coal Pyrolysis and Hydropyrolysis," Chemistry of Coal Utilization, 2nd Supp. Volume, M. A. Elliott (Editor), Wiley - Inter- science, New York, 665 (1981 ) .
Solomon, P. R. and Colket. M. B., Seventeenth Symposium (International) on Combustion, The Combustion Institute, Pittsburgh, PA, 131 (1979).
2.
3. Anthony, 0. B., Howard, J. B., Hottel, H. C. and Meisner, H. P . , Fifteenth Symposium (International) on Combustion, The Combustion Institute, Pittsburgh,
\ PA 1303 (1975).
4.
5.
Tyler, R. J., Fuel, E, 218 (1980). Kobayashi. H, Howard, J. B. and Sarofim, A. F., Sixteenth Symposium (International) on Combustion, The Combustion Institute, Pittsburgh, PA 411 (1977).
6. Brown, H. R., Hesp, W. R . , and Waters, P. L., J. Inst. Fuel, 130 (1964).
7. Cameron, A. R. and Botham, J. C., Coal Science, 55, 564 (1966).
8. Habermehl, D., Orywal, F., and Beyer, Hans-Dieter, "Plastic Properties of Coal ,"
Interscience, New York, 317 (1981).
Gryaznov, N. S., Coke Chem. USSR, 1, 5 (1962).
\ Chemistry of Coal Utilization and Supp. Volume, M. A. Elliott (Editor), Wiley-
9.
10. Van Kreulen, D. W., Huntjens, F. J., and Dormans, H. N. M., Fuel, 35, 462 (1956).
11. Kreulen, D. J. W., Fuel, 29, 112 (1950). 12. Nadziakiewicz, J., Fuel. 2, 361 (1958).
13. Freihaut, J. D., Zabielski, H. F. and Seery, 0. J., h e r . Chem. SOC. Div. of Fuel Chem., 21, No. 2, 89 (1982).
14. Freihaut, J. D., Zabielski, 11. F. and Seery. D. J. Nineteenth Symposium (Inter- national) on Combustion, The Combustion Institute, Pittsburgh, PA, 1159 (1982).
15. Bergmann, G., Husk, G., Karwell, J. and Luter, H., Brennstoff Chem., 35, 175 (1954).
16.
17. Friedel, R. A., Fuel, 38, 541 (1959).
Duyckaerts, G., The Analyst, 84, 201 (1959).
2 71
t
18.
19. Brown, J . K . , J r . Chem. S O C . , 744 (1955) .
20.
21 .
Kmetko, E . A. Phys. Rev, 82, 456 (1951) .
F r i e d e l , R . A . , and Queiser, J . A . , J r . Anal. Chem., 28, 22 (1956) .
F re ihaut , J . D . , and Seery, D. J . , Am. Chem. SOC. D i v . o f Fuel . Chem., 26, NO. 3 , 18 (1981) .
272
ACKNOWLEKMENTS
The authors express t h e i r g r a t i t u d e t o G . Wagner and D. Srntos f o r t h e i r techn ica l expert ise i n performing t h i s invest iga t ion . Par t o f t h i s work was sponsored by DOE
. Contract DE-AC21-81MC16221.
I
273
I
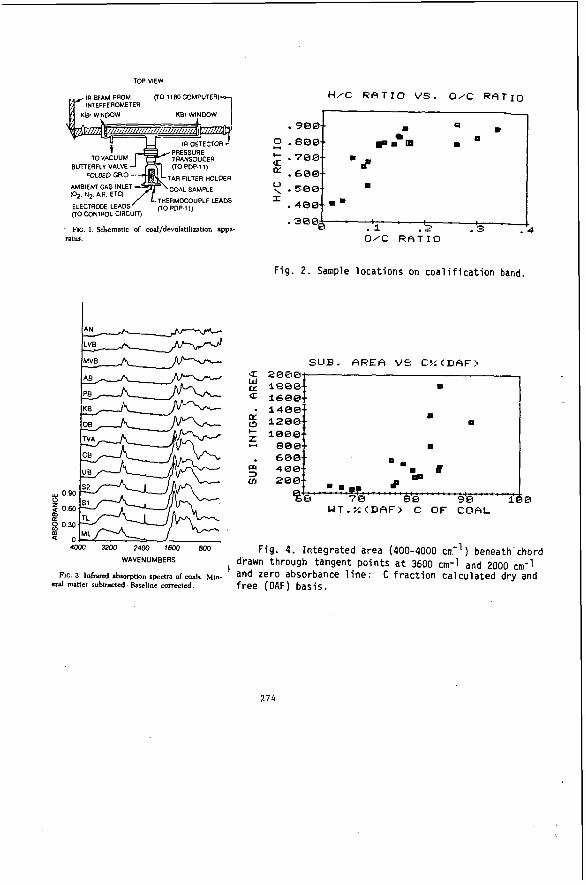
TOP VIEW
AMBIENT GAS INLE
ELECTRODE LEADS (TO p ~ p . 1 1 ) (TO CONTROL CIRCUIT)
FIG. 1. Schematic of coal/devolatilization appa ntus.
. 980-
0 .SOB-- c( ; .780.-
. 680.-
. 5 0 0 .
. 480.. I
0.90 u 2 060
5 0.30
z o 4MK) 3200 2400 1m 800
r
I P I
0 P O m
0
9 =
Fig . 2 . Sample locat ions on c o a l i f i c a t i o n band.
SUR. FtREA V S CXCDFIF)
II 0
0
W T . % < D H F > C O F C:OAL
Fig . 4. In tegra ted area (400-4000 CIT-') beneath chord WAVENUMBERS drawn through tangent po in ts a t 3600 cm-1 and 2000 cm-1
c f r a c t i o n ca lcu la ted dry and f ree (OAF) basis.
F , ~ 3 I,,- abrorptlon rpectrao~malr M,n. ' and zero absorbance l i n e : erd matter subtracted Barelme corrected
274
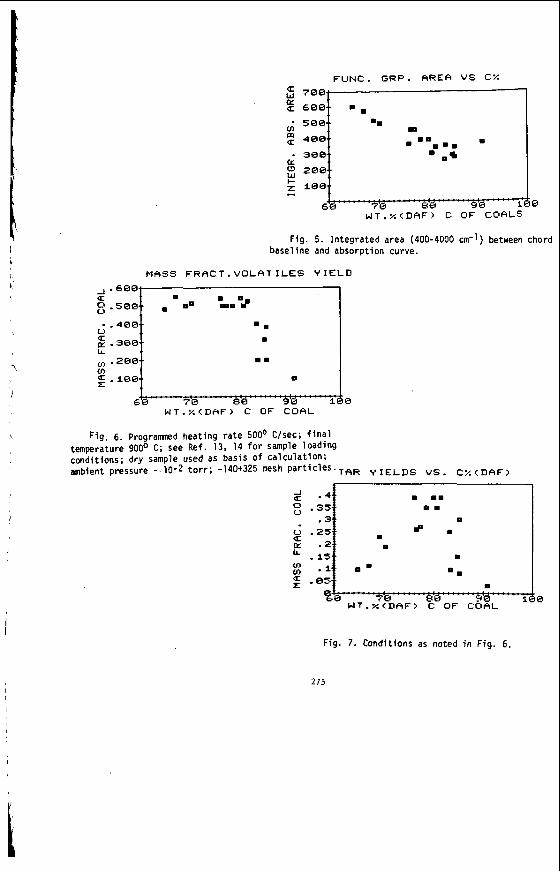
7001 CL Q 600..
Do m
v; 500..
.m=o. .
m *
2 400-
* 300.. CZ
200-
z' 100- - 6% 7'0 - 90
MFISS F R A C T . VOLFIT ILES Y I E L D
I
1 8
t - .400
-300 u
LL
1 (13.206 (13 E. 100
6j0 70 - 90 G I T . % < D A F ) C O F COFIL
Fig. 6. Programd heating r a t e 500° C/sec; f i n a l temperature 900° C; see Ref. 13. 14 f o r sample loading conditions; dry sample used as basis o f calculation; ambient pressure - 10-2 t o r r ; -140+325 mesh particles.TFIR YIELDS v s . C x ( D A F ,
z! . 4 f 0 0 0 o m
0
1
.05
W T . ; r < D e F > C O F COFtL
Fig. 7. Conditions as noted i n Fig. 6.
275
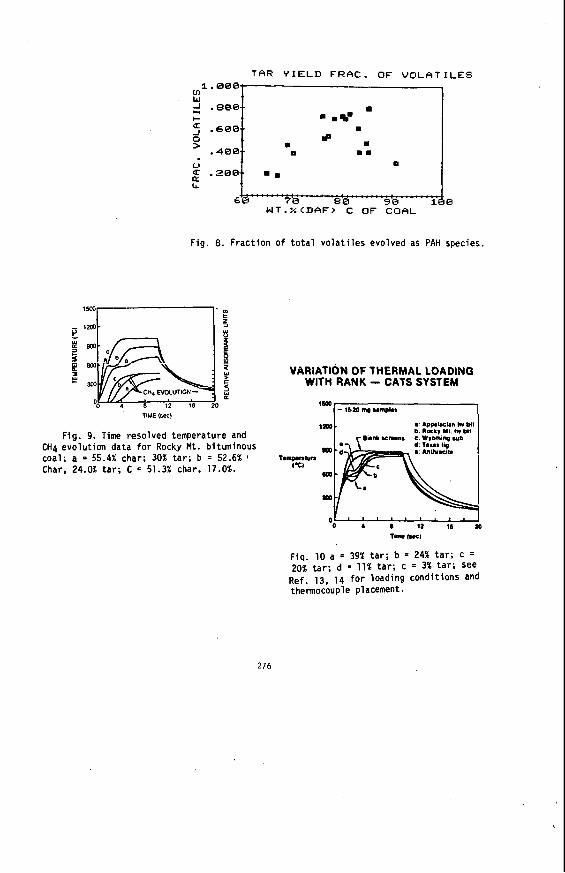
TFlR Y I E L D FRRC. O F V O L F l T I L E S 1.000
u1 w =! .e00 c =
t u
LL
g .200
4% P 70 90 1 W T . % < D A F > C OF C O A L
0
Fig. 8. Fraction of total volatiles evolved as PAH species.
TLME (en0
Fig. 9. Time resolved temperature and CH4 evolution data for Rocky Mt. bituminous coal; a = 55.4% char; 30% tar; b = 52.6% 1
Char, 24.0% tar; C = 51.3% char, 17.0%.
VARIATION OF THERMAL LOADING WITH RANK - CATS SYSTEM
- 1bP mp ump** I
Fiq. 10 a = 39% tar; b = 24% tar; c = 20% tar; d = 11% tar; c = 3% tar; see Ref. 13, 14 for loading conditions and thermocouple placement.
276
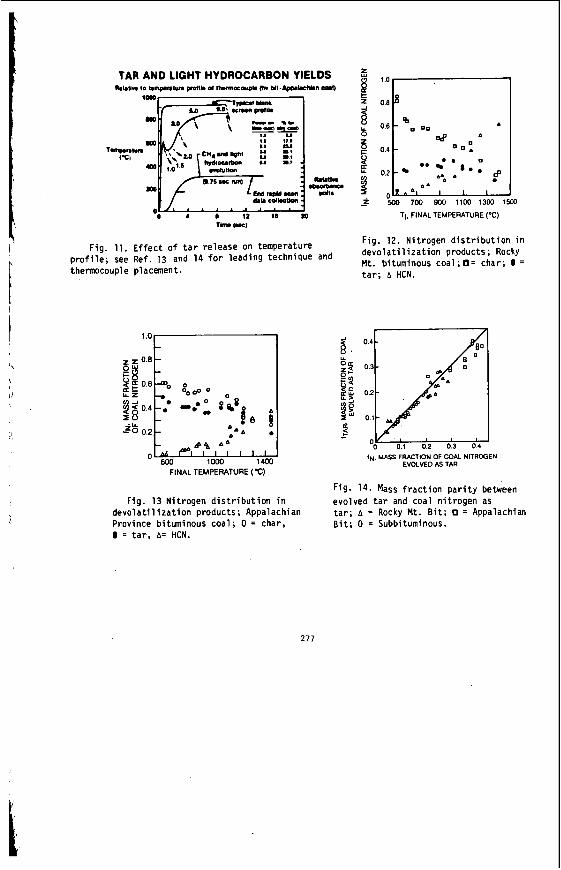
I
'\ I!
i!
TAR AND LIGHT HYDROCARBON YIELDS
0.8 p
500 700 900 11W 13W 1Mo
Tf. FINAL TEMPERATURE ('C)
Fig. 11. Effect o f t a r release on temperature Fig. 12. Nitrogen d i s t r i b u t i o n i n devolatilization products; Rocky M t . bituminous coal ;O= char; 0 = prof i le ; see Ref. 13 and 14 fo r leading technique and
thermocouple placement.
1 .o
1M#) 14M) FINAL TEMPERATURE ('c)
Fig. 13 Nitrogen d i s t r i b u t i o n i n devolat i 1 i z a t i o n products ; Appalachian Province bituminous coal; 0 = char,
= t a r , A= HCN.
ta r ; A HCN.
IN, MASS FRACTION OF COAL NITROGEN EVOLVED AS TAR
Fig. 14. Mass f r a c t i o n p a r i t y between evolved t a r and coal nitrogen as ta r ; A = Rocky M t . B i t ; 0 = Appalachian B i t ; 0 = Subbituminous.
277
Internal and External M a s s T r a n s f e r L i m i t a t i o n s in Coal Pyrolysis
P h i l l i p E. U n g e r * Dept . o f C h e m . E n g . , C a r n e g i e - M e l l o n University, P i t t s b u r g h , P a . 15213
Eric M . Suuberg D i v i s i o n of Engineering, Brown U n i v e r s i t y , P r o v i d e n c e , R . I . 02912
Introduction
T h e recent w o r k of P r o f e s s o r Howard and colleagues at M I T has helped f o c u s attention u p o n t h e s i g n i f i c a n t role that m a s s transfer limitations c a n play in s h a p i n g the pyrolysis behavior of c o a l s (see, f o r example, t h e r e v i e w by J . B . Howard,l.981). D e s p i t e having learned a great deal f r o m these and earlier Studies, i t is fair to say that much r e m a i n s -to be learned o n t h i s t o p i c . T h e present paper outlines some recent reiults o f r e l e v a n c e . T h e focus h e r e will be mainly on s t u d i e s o f high heating r a t e pyrolysis o f f i n e l y ground c o a l s ( l e s s than a millimeter in diameter) in low p a r t i c l e concentration e n v i r o n m e n t s . Such c o n d i t i o n s of c o u r s e e.xist in a n enormous variety o f coal conversion processes. T h e present f o c u s is n a r r o w e d f u r t h e r by considering only the tar products o f p y r o l y s i s . Not only a r e these species central in discussions o f m a s s transfer limitations, but they are o f considerable interest a s dominant p r o d u c t s o f m o s t . c o a l pyrolysis p r o c e s s e s . Also, the topic o f tar chemisty f i t s in w e l l w i t h Professor H o w a r d ' s own discussion in t h i s session, s i n c e tars have been suggested a s key intermediates in c e r t a i n soot f o r m a t i o n processes during c o m b u s t i o n o f coal (Seeker et a l . , 1 9 8 1 ; M c l e a n et a l . 1981).
Background
I t is customary to e x p l o r e f o r internal m a s s transfer limitat ions in gas-solid r e a c t i o n systems b y p e r f o r m i n g experiments at various particle d i a m e t e r s . U n f o r t u n a t e l y , data o n the variation of pyrolysis product y i e l d s w i t h p a r t i c l e diameter a r e o f t e n influenced b y unintentional variations in heat transfer conditions ( J . B . Howard et a 1 . , 1 9 8 1 ) . In addition, e v e n in situations in w h i c h heat transfer t o particles is relatively w e l l defined ( a s in the heated w i r e mesh technique described below), t h e r e are s o m e t i m e s d i f f i c u l t i e s in particle siz-e characterization, s i n c e p a r t i c l e s s o f t e n , s w e l l , andlor f l o w o n the s u r f a c e o f solid s u p p o r t s d u r i n g pyrolysis. Consequently, most reliable i n f o r m a t i o n on m a s s transfer e f f e c t s during rapid pyrolysis of fine Particles has c o m e f r o m e x p e r i m e n t s in w h i c h the primary variable is external g a s pressure.
It is w e l l e s t a b l i s h e d that pyrolysis o f c o a l s under reduced pressures leads to increased volatile m a t t e r yields, compared to pyrolysis under atmospheric p r e s s u r e (H.C.Howard,l945.1963; Anthony and J . B . Howard.1976; J . B . Howard.1981). T h e r e also remains little question that a n increase in tar yield is mainly responsible for this increase in volatile matter yields ( s e e a b o v e reviews and S u u b e r g et a1.,1979a). Tar
* Present Address: Shell D e v e l o p m e n t Corp., H o u s t o n , T e x a s
IS h e r e crudely d e f i n e d as any r o o m temperature cond.ensable products O f P Y r O l Y s i s ; water is. excluded, b u t small amounts of product that iS sometimes categorized a s "oil" m a y be included. T h e increase in tar y i e l d s under reduced pressure h a s been qualitatively explained in the f o l l o w i n g terms. W h e n heated, the coal "depolymerizes", yielding tar-like s p e c i e s . ~f these s p e c i e s a r e quickly transpor-ted away f r o m the particle, they are observed as part of the tar products O f p Y r O l Y S i S . I f , however, the s p e c i e s a r e g i v e n long times in the hot environment o f the particles, they may be "repolymerized" into the m a s s o f the P a r t i c l e , and, later b e c o u n t e d in w i t h the c h a r .
W h i l e therc is l.ittle d e b a t e over this q u a l i t a t i v e picture, the development o f quantitative m o d e l s h a s revealed a great diversity o f opinion concerning the n a t u r e o f volatiles t r a n s p o r t . S o m e have m o d e l e d the controlling transport processes by u s e o f empirical external m a s s t r a n s f e r c o e f f i c i e n t s (.Anthony et a 1 . , 1 9 7 4 ; R e i d e l b a c h and SummerfieId.1975). some by postulating internal pore transport to be limiting (Russel et a 1 . , 1 9 7 9 ; Melia and B o w m a n , 1 9 8 2 , the latter a l l o w i n g for bubble f o r m a t i o n ) , o n e by c o n s i d e r i n g n u c l e a t i o n and m o t i o n o f bubbles w i t h i n s o f t e n e d coal particles (Lewellen.1975) another by considering the m o t i o n o f volatiles in pseudo-bubbles (not accounting f o r particle s w e l l i n g , J a m e s and M i l l s , 1976), and some by employing both a crude model o f pore d i f f u s i o n and a n external film c o e f f i c i e n t ( C h e n and W e n , 1979). Other m o d e l s have m o r e 'explicitly consgdered h o w product compositions m a y vary during p y r o l y s i s . O f these, several have represented gas f i l m d i f f u s i o n a s controlling, m u c h as in classic droplet . evaporation m o d e l s ( S u u b e r g et a 1 . , 1 9 7 9 b ; Unger and Suuberg,l981; and Zacharias.1979). In other c a s e s , pore transport m o d e l s h a v e again been developed ( C a v a l a s .and W i l k s , 1 9 8 0 ; Cheong,1977). Finally, in one case, m a s s transport limitations h a v e been handled through the use of a pseudo-chemical kinetic model ( S o l o m o n and Colket.1979).
I t is apparent that there c o n t i n u e s to be considerable disagreement as t o the true n a t u r e of m a s s transfer limitations which a r e responsible f o r the observed effect.5 o f p r e s s u r e . Part o f the di5agreemen.t c o n c e r n s the location o f the m a i n transport limitation- whether i t is internal or external to the pyrolyzing coal particle. Another source o f the apparent disagreement between different workers concerns the n a t u r e of the starting coal- w h e t h e r i t is s o f t e n i n g or non-softening ( i n the former case, i t m a k e s more sense to m o d e l the particle as essentially a droplet). In this paper, some of these issues are readdressed in the context of newly available data o n t h e n a t u r e o f coal tars.
General O b s e r v a t i o n s C o n c e r n i n q M a s s T r a n s f e r Limitations Durixg P v r o l y s is
T h e r e is a paucity of information concerning the e f f e c t o f pressure on product yields observed during p y r o l y s i s . Figure 1 presents an attemp't at summarizing the majority o f relevant data concerning pressure e f f e c t s o n tar yield5 during p y r o l y s i s . I t is a plot of reported tar yield v s . pressure, w h i c h illustrates the general feature of decreasing tar yield w i t h increasing pr e s s u r e . In order to compare the results f o r a w i d e range of ranks in a s i n g l e f i g u r e , the data f o r
279
I
each coal have b e e n " n o r m a l i z e d " by d i v i d i n g tar yield at a particular pressure b y t h e m a x i m u m tar y i e l d w h i c h c a n b e obtained w i t h that coal, T h i s m a x i m u m tar yield n a t u r a l l y o c c u r s at t h e lowest pressure'examined during t h e g e r i e s of e x p e r i m e n t s o n t h e particular c o a l . Table 1 s u m m a r i z e s the c o n d i t i o n s under w h i c h the d a t a in Figure 1 were o b t a i n e d . W h e r e a c t u a l tar yield d a t a w e r e not a v a i l a b l e , a correlation based o n all t h e a v a i l a b l e tar yield data w a s used to estimate n o r m a l i z e d tar y i e l d s f r o m w e i g h t l o s s d a t a . T h i s correlati,on was of form:
N o r m a l i z e d tar yield=1-0.55((v - V ) / ( V ~ - ~ ~ ) )
w h e r e v,, is t h e w e i g h t loss at t h e lowest p r e s s u r e employed in the s t u d y , v is t h e w e i g h t l o s s at t h e highest pressure employed in the study, a n y v is t h e actual w e i g h t loss at t h e pressure of interest.
A rather c o n s i s t e n t trend of decreasing' tar yield with increasing p r e s s u r e is o b s e r v e d in F i g . 1 . N o t e that the data include b o t h s o f t e n i n g c o a l s a n d n o n - s o f t e n i n g c o a l s , ranging in rank from lignite to l o w v o l a t i l e b i t u m i n o u s . I t is noteworthy that t h e points w h i c h s e e m . t o f a l l a b o v e t h e genera.1 trend a r e m a i n l y those w h i c h were n o r m a l i z e d w i t h respect t o 0.1 a t m tar yield data. B o t h the data of Anthony et aI.(1974.) and A r e n d t a n d v a n H e e k ( l 9 8 1 ) imply that 0 . 1 a t m is s t i l l a h i g h e n o u g h p r e s s u r e s u c h that an additional d e c r e a s e in pressure might tend t o increase tar y i e l d s f u r t h e r ; thus the n o r m a l i z a t i o n factor a p p l i e d t o t h e data o f Arendt and van Heek(l981) and Cavalas and Wilks(i980) m i g h t be relatively higher t h a n that applied to the other d a t a . W e r e lower p r e s s u r e d a t a available in these latter t w o Cases, i t is p o s s i b l e that n o r m a l i z a t i o n w i t h respect to s u c h data w o u l d pull t h e s e groups' r e s u l t s into e v e n better a q r e c r u e l l i w i t h the general t r e n d .
On t h e b a s i s of t h e general agreement between the diverse sets of data s h o w n in F i g . 1 , i t m ight be concluded that t h e e f f e c t of e x t e r n a l . pressure is s i m i l a r in all ranks of c o a l . Of c o u r s e t h e coals that produce t h e largest a m o u n t s o f tar are l i k e w i s e those w h o s e product y i e l d s a r e most s e n s i t i v e to v a r i a t i o n s in p r e s s u r e . T h e actual nature of t h e m a s s t r a n s f e r p r o c e s s r e s p o n s i b l e f o r s u c h behavior is still u n k n o w n , h o w e v e r . S o m e order o f m a g n i t u d e a n a l y s e s have been advanced to elim'inate a f e w p o s s i b i l i t i e s .
I f a p a r t i c l e is non-softening and ordinary gas phase d i f f u s i o n w e r e s o l e l y r e s p o n s i b l e f o r transport o f tar, Russel et a1.(1979) h a v e pointed out that internal pore d i f f u s i o n w o u l d almost certainly be c o n t r o l l i n g . I t is p o s s i b l e that either pressure driven bulk f l o w cr K n u d s e n d i f f u s i o n m i g h t play a role in pore transport (,though i t m ust b e recalled that the latter does not depend upon pressure). N i k s a ( i 9 8 1 ) c o n c l u d e s that bulk f l o w m u s t control f l o w out of t h e pores, s o long a s t h e p a r t i c l e retains its identity a s a s o l i d ; h o w e v e r , the possible role o f a n external g a s film limitation is not consider ed .
I f t h e coal p a r t i c l e s o f t e n s , Attar(1978) h a s proposed that a c o m p e t i t i o n e x i s t s b e t w e e n l i q u i d phase d i f f u s i o n and bubble nucleation w i t h i n particles. W h i l e p l a u s i b l e , i t s e e m s equally likely that bubbles a r e formed by g a s P r e s s u r e s w e l l i n g pores originally p r e s e n t . w i t h i n the p a r t i c l e . It is not clear h o w important bubble transport o f tar s p e c i e s i s . A small b u b b l e b r e a k i n g t h e s u r f a c e o f t h e p a r t i c l e only s e r v e s to increase the s u r f a c e a r e a o f t h e particle s l i g h t l y , but a large bubble s w e l l i n g the p a r t i c l e into a c e n o s p h e r e increases its s u r f a c e area
0
, I
I
I
enormOUSly. T h e extent to w h i c h bubbles aid in diffusion of 5 p e c i . e ~ f r o m bulk t o s u r f a c e is a l s o u n c l e a r . .In a d d i t i o n , i t is possible that bubble growth and m p t i o n could be a s o u r c e o f internal m i x i n g . I t is d i f f i c u l t to make any general s t a t e m e n t s about the effect o f b u b b l e s or their s i g n i f i c a n c e , except that i t is likely that their presence will enhance transport r a t e s . T h e re-mainder of the d i s c u s s i o n o n transport in the Case o f softening c o a l s will disregard the r o l e o f bubbles.
S o f t e n e d coal p a r t i c l e s h a v e been previously viewed as analogous to multicomponent liquid droplets (Unger an,d Suuberg,l981). Consider the r a t i o -of characteristic time for internal liquid phase dif-fusion of tars f r o m t h e bulk to the p a r t i c l e s u r f a c e ( t i ) t o t h e characteristic time f o r external d i f f u s i o n of t h e tar through a stagnant vapor f i l m w h i c h s u r r o u n d s . t h e p a r t i c l e ( t ) :
t . I t 5 D C y / D E 8
where D v and D are vapor aAd f i q u ~ d v d i f k u k i v i t i e s , r e s p e c t i v e l y ; C and c are vapor L p h a s e and particle phase mo-lar d e n s i t i e s ; y IS t h e zapor pkase mole fr.actiqn o f a tar s p e c i e s at the particle s u r f a o e , a n d x is the liquld phase m o l e f r a c t i o n o f a tar s p e c i e s at the particle s u r f a c e . BY use of Raoult's L a w , ' i f P o is t h e vapor p r e s s u r e of t h e tar species. Y / X = P o / P , In the c a s e o f atmospheric pressure pyrolysis, P ' is 1 a t m . a n i o t ( C V / C ) is o f order 1 0 - 2 to Neither Po nor b ' \ D L is k n o w n priori. in particular, D L is d i f f i c u l t to estimate, eve: to a n order o'f magnitude.
I t h a s b e e n suggested that D L c a n b e estimated by use o f the Stokes-Einstein equation to be o f the order o f 1 0 - 1 4 s q . C m / s e C (Cavalas.1982). U n f o r t u n a t e l y , s u c h e s t i m a t e s a r e based o n having a knowledge o f coal viscosity, w h i c h is itself u n k n o w n to even a n o r d e r o f m a g n i t u d e under the high heating rate, high temperature c o n d i t i o n s o f interest here. In addition, recent m e a s u r e m e n t s of the d i f f u s i v i t y o f naphthalene in hi g h viscosity oils h a v e s h o w n , the Stokes-Einstein equation to be invali-d (Hiss and Cussler.1973). T h i s is not surprising, since this e q u a t i o n h a s b e e n d e r i v e d assuming a large disparity in the s i z e of solvent a n d ' solute, a condition w h i c h is met in neither coal m e l t s nor the experiments described a b o v e . A l t h o u g h i t is impossible to m a k e even a c r u d e ' e s t i m a t e of D , i t is reasonably c e r t a i n that i t will be smaller than IO-5sq.cmlsec. \mplying that (D I D L ) is larger t h a n 1 0 5 o r l o 6 . Hence, unles's Po is of order or l e s s , internal d i f f u s i o n will definitely control.
Again, Po is d i f f i c u l t to e s t i m a t e , because t h e r e exist no vapor pressure data f o r t h e t y p e o f coal tar5. of' intereat. T o m a k e a c r u d e estimate, w e have improved a previously used (Suuberg et a 1 . , 1 9 7 9 ) simple correlation for v'apor p r e s s u r e s o f high molecular weight hydrocarbons :
w h e r e MW is m o l e c u l a r .weight and T is te m p e r a t u r e in K . S e e T a b l e 2 for a comparison o f t h e predictions o f ' t h e correlation to vapor pressure d a t a . Note that the. c o r r e l a t i o n d o e s not i n c l u d e any structural information, nor h a s i t b een .tested against d a t a o n h i g h molecular weight m a t e r i a l s w i t h significant heteroatom cqntents.. Considering "typical" tar m o l e c u l a r w e i g h t s in th e r a n g e 5 0 0 to 2 0 0 0 (Un er and Suuberg,l983a), at temperatures around 1000K. then apparently P i is of o r d e r I O - ' to l o q 6 atm. O n t h e b a s i s of t h i s r a n g e of values, i t is impossible to d r a w a , f i r m c o n c l u s i o n ,regarding the relative importance o f internal and esternal m a s s transfer limitations. I t is p o s s i b l e that
a
PO(.atm)= 5?56*exp(-i55*MGIo.5861T)
281
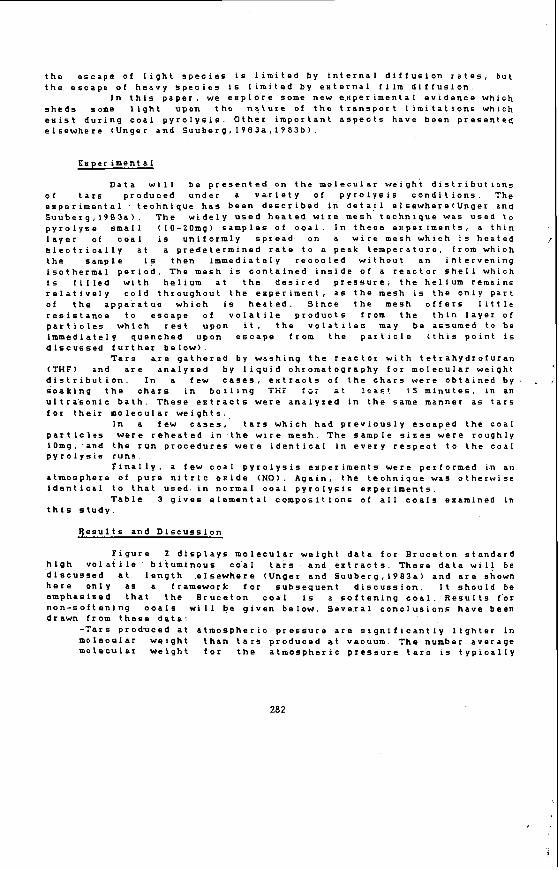
the escape o f light s p e c i e s is limited b y internal d i f f u s i o n rates, but the escape o f h e a v y s p e c i e s is limited by external film diffusion.
In this paper, w e e x p l o r e some n e w experimental evidence which s h e d s some light u p o n t h e n * t u r e of t h e transport limitations which exist during coal p y r o l y s i s . O t h e r important aspects have been presented e l s e w h e r e ( U n g e r and Suuberg, 1 9 8 3 a , 1 ? 8 3 b ) .
Exper imental
D a t a will be p r e s e n t e d on the m o l e c u l a r weight distributions o f tars produced under a va.riety of pyrolysis c o n d i t i o n s . The experimental ' technique h a s b e e n described in detajl elsewhere(Unger and Suuberg,1?83a). T h e w i d e l y u s e d heated w i r e m e s h t e c h n i q u e w a s used to p y r o l y z e small (10-20mg) s a m p l e s of c o a l . In these experiments, a thin layer o f coal is u n i f o r m l y spread on a w i r e m e s h w h i c h is heated electrically at a predetermined rate to a peak temperature, f r o m which the sample is then immediately recooled without a n intervening isothermal p e r i o d , T h e m e s h is contained inside of a reactor shell which is filled w i t h helium at t h e desired p r e s s u r e ; the h e l i u m remains relatively cold throughout t h e e x p e r i m e n t , a s t h e m e s h is the only part o f t h e -apparatus w h i c h is h e a t e d . S i n c e t h e m e s h offers l i t t l e resistance to escape o f v o l a t i l e products from the thin layer o f particles w h i c h rest u p o n it, t h e v o l a t i l e s m a y be assumed to be immediately quenched u p o n e s c a p e f r o m t h e particle (this point is discussed further below).
T a r s a r e gathered by w a s h i n g t h e reactor w i t h tetrahydrofuran ( T H F ) and are analyzed by liquid chromatography for m o l e c u l a r weight d i s t r i b u t i o n . In a f e w c a s e s , extracts of the c h a r s w e r e obtained by s o a k i n g t h e c h a r s in boiling TKF i c r s t l e ~ s t . 1 5 m i n u t e s , in an ultra'soonic bath. T h e s e e x t r a c t s w e r e analyzed in the same manner as tars f o r their m o l e c u l a r weights.,
In a f e w c a s e s , t a r s w h i c h had previously escaped the coal particles w e r e reheated in t h e w i r e m e s h . T h e s a m p l e s i z e s w e r e roughly iOmg.'and the r u n procedures w e r e identical in every respeot to the coal pyrolysis runs.
F i n a l l y , a f e w coal p y r o l y s i s experiments w e r e performed in an atmosphere o f pure nitric o x i d e (NO). Again, the technique w a s otherwise identical to that used. in n o r m a l coal pyrolysis experiments.
T a b l e 3 gives elemental c o m p o s i t i o n s of all coals examined in t h i s study.
g e s u l t s and D i s c u s s i o n
figure 2 displays m o l e c u l a r .weight data for Bruceton standard h i g h v o l a t i l e . b i t u m i n o u s co'al tars and extracts. T h e s e data will be discussed at length e l s e w h e r e (Unger and S u u b e r g , l 9 8 3 a ) and are shown h e r e only as a f r a m e w o r k f o r subsequent d i s c u s s i o n . I t should be emphasized that the B r u c e t o n coal is a s o f t e n i n g c o a l . Results f'or n o n - s o f t e n i n g o o a l s will be given b e l o w . Several. conclusions h a v e been d r a w n from these data:
-Tars produced at a t m o s p h e r i c pressure are significantly lighter in molecular weight t h a n tars produced a C v a c u u m . T h e number average molecular w e i g h t f o r t h e atmospheric p r e s s u r e tars is typically
282
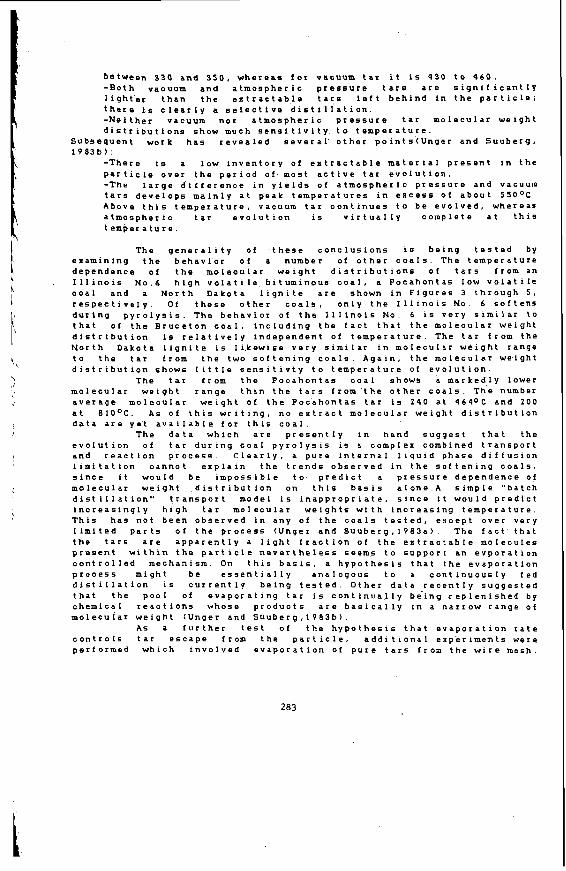
between 3 3 0 a n d . 3 5 0 , w h e r e a s for v a c u u m tar i t is 4 3 0 to 460. -Both vaouum and atmospherio pressure t a r s a r e s i g n i f i o a n t l g light'er t h a n the extractable tars left behind in the p a r t i c l e ; there is clearly a selective distillation. -Neither vacuum nor atmospheric pressure tar molecular weight distributions s h o w m u c h sensitivity. t o temperature.
Subsequent w o r k has revealed several other points(Unger and S u u b e r g , 1983b):
-There is a low inventory of extractable m a t e r i a l present in the particle over the period o f most active tar evolution. -The large d i f f e r e n c e in yields o f atmospheric pressure and vacuum tars develops mainly at peak temperatures in excess o f about 5 5 O o C . Above this temperature, vacuum tar c o n t i n u e s t o be evolved, whereas atmospheric tar evolut.ion is virtually complete at this temper a ture.
T h e generality o f - t h e s e c o n c l u s i o n s is being tested b y examining the behavi'or o f a ' n u m b e r o f other c o a l s . T h e temperature dependence o f the molecular w e i g h t d i s t r i b u t i o n s o f tars f r o m an Illinois N o . 6 h i g h volatile bituminous coal, a Pocahontas low volatile coal and a N o r t h D a k o t a lignite are s h o w n in Figures 3 through 5 . respectively. O f these other c o a l s , only t h e Illinois N o . 6 softens during pyrolysis. T h e behavior of t h e Illinois No. 6 is very similar to that of the B r u c e t o n coal-, including the fact that the m o l e c u l a r weight distribution is relatively independent o f t e m p e r a t u r e . T h e tar f r o m the N o r t h Dakota lignite is likewise very similar in molecular weight range to the tar f r o m the two softening c o a l s . A g a i n , the molecular weight distribution s h o w s little sensitivty t o t e m p e r a t u r e of evolution.
T h e tar from the P o c a h o n t a s coal s h o w s a m a r k e d . 1 ~ lower molecular weight range t h a n the tars f r o m ' t h e other coals. T h e number average molecular weight of t h e P o c a h o n t a s tar is 240 at 4 6 4 o C and 2 0 0 at 810°C. A s of this writing, n o extract m o l e c u l a r weight distribution data are yet available f o r this c o a l .
T h e data w h i c h are presently in hand suggest that the evolution o f tar during coal pyrolysis is a complex combined transport and reaction process. C l e a r l y , a pure internal liquid phase d i f f u s i o n limitation cannot explain the trends observed in the softening coals, since i t w ould be impossible to. predict a pressure d e p e n d e n c e o f molecular weight , d i s t r i b u t i o n o n this b a s i s a1one.A s i m p l e "batch distillation" transport model is inappropriate, s i n c e i t w o u l d predict increasingly h i g h tar molecular w e i g h t s w i t h increasing temperature. T h i s has not been observed in any o f the c o a l s tested, except over very limited parts o f the process (Unger and S u u b e r g , l 9 8 3 a ) . T h e f a c t ' that the tars are apparently a light f r a c t i o n of the extractable molecules pc'esent w i t h i n the particle n e v e r t h e l e s s s e e m s to support an evporation controlled m e c h a n i s m . O n this b a s i s , a h y p o t h e s i s that the evaporation process might be essentially analogous to a continuously f e d distillation is currently being tested. Other data recently suggested that the pool o f evaporating tar is continually being replenished b y chemical reactions w h o s e products a r e basically in a n a r r o w range o f molecular weight (Unger and Suuberg.1983b).
As a f u r t h e r test o f the h y p o t h e s i s that evaporation rate controls tar escape f r o m the particle. additional experiments were performed w h i c h involved evaporation o f pure tars f r o m the w i r e m e s h .
283
I
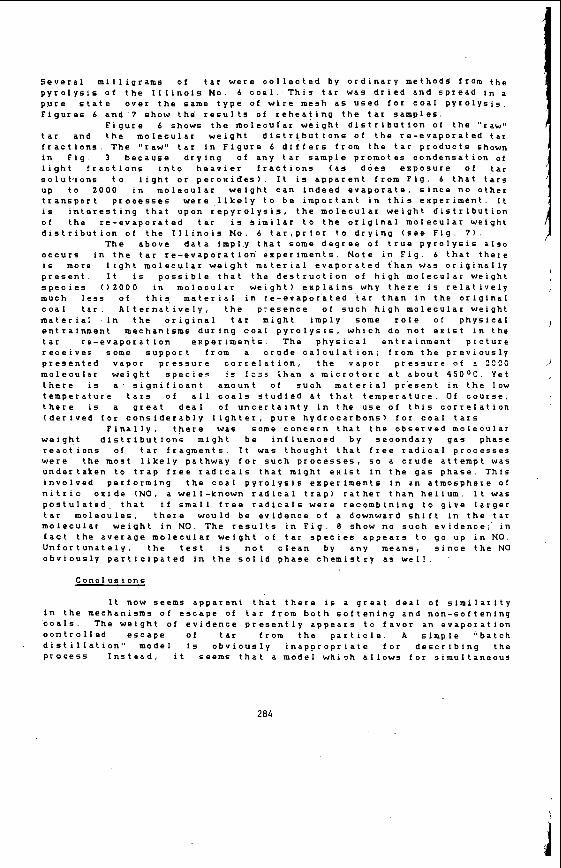
Several m i l l i g r a m s o f tar w e r e c o l l e c t e d by ordinary m e t h o d s f r o m the pyrolysis of t h e I l l i n o i s No. 6 c o a l . T h i s tar w a s dried and spread in a pure s t a t e over t h e s a m e t y p e o f w i r e m e s h a s used for coal pyrolysis. Figures 6 and 7 s h o w t h e results of reheating the tar s a m p l e s .
F i g u r e 6 shows t h e m o l e c u i a r weight d i s t r i b u t i o n o f the "raw" tar and t h e m o l e c u l a r w e i g h t distri.bution5 o f t h e re-evaporated tar fractions. T h e "raw" tar in F i g u r e 6 d i f f e r s from the tar products shown in F i g . 3 b e c a u s e drying o f any tar s a m p l e p r o m o t e s condensation of light f r a c t i o n s into h e a v i e r fractions ( a s d o e s exposure of tar solut,ions t o light o r p e r o x i d e s ) . I t is apparent from F i g . 6 that tars up to 2000 in m o l e c u l a r w e i g h t c a n indeed e v a p o r a t e , s i n c e no other transport processes w e r e , l i k e l y t o b e important in t h i s experiment. I t is interesting that u p o n r e p y r o l y s i s , t h e m o l e c u l a r w e i g h t distribution o f the re-evaporated tar is similar t o t h e o r i g i n a l molecular weight distribution o f the Illinois No. 6 t a r , p r i o r to drying ( s e e Fig. 7 ) .
T h e above d a t a i m p l y that s o m e d e g r e e of t r u e pyrolysis also o c c u r s in the tar re-evaporation. e x p e r i m e n t s . N o t e in F i g . 6 that there is more light m o l e c u l a r w e i g h t m a t e r i a l e v a p o r a t e d t h a n w a s originally present. I t is p o s s i b l e that the d e s t r u c t i o n of high molecular weight s p e c i e s 0 2 0 0 0 in m o l e c u l a r w e i g h t ) e x p l a i n s w h y there is relatively m u c h less o f this, m a t e r i a l in re-evaporated tar t h a n in the original c o a l t a r . A l t e r n a t i v e l y , t h e presence of s u c h h i g h m o l e c u l a r weight material . i n t h e o r i g i n a l tar might imply s o m e r o l e o f physical entrainment m e c h a n i s m s during coal p y r o l y s i s , w h i c h d o not exist in the tar re-evaporation e x p e r i m e n t s . T h e physical entrainment picture receives s o m e support f r o m a c r u d e c a l c u l a t i o n ; f r o m t h e previously presented vapor pressure c o r r e l a t i o n , t h e vapor pressure of I ?"OO m o lecular w e i g h t s p e c i e s is ! = = s ' ' tnan a m i c r o t o r r at about 4 5 0 0 C . Yet ihere is a significant a m o u n t of s u c h m a t e r i a l present in t h e low temperature t a r s of all c o a l s studied at that t e m p e r a t u r e . Of c o u r s e , t h e r e is a great deal of uncertainty in the u s e of t h i s correlation (derived f o r c o n s i d e r a b l y l i g h t e r , pure h y d r o c a r b o n s ) for coal t a r s .
F i n a l l y , t h e r e w a s s o m e c o n c e r n that t h e observed molecular w e i g h t d i s t r i b u t i o n s m i g h t b e influenced by secondary gas phase reactions o f tar f r a g m e n t s . I t w a s thought that f r e e radical processes w e r e the most likely pathway f o r s u c h p r o c e s s e s , so a crude attempt w a s undertaken to trap free r a d i c a l s that might exist in the gas phase. This involved p e r f o r m i n g t h e coal pyro1,ysis e x p e r i m e n t s in a n atmosphere o f n i t r i c o x i d e (NO. a w e l l - k n o w n radical trap) rather t h a n h e l i u m . I t w a s postulated. that i f s mall f r e e radicals w e r e recombining to give larger tar m o l e c u l e s , t h e r e w o u l d be evidence of a downward shift in t h e tar molecular w e i g h t in NO. T h e r e s u l t s in F i g . 8 s h o w no s u c h evidence;' in f a c t the a v e r a g e m o l e c u l a r w e i g h t of tar s p e c i e s a p p e a r s t o g o u p in N O . U n f o r t u n a t e l y , t h e test is n o t c l e a n by any m e a n s , s i n c e the N O obviously participated in t h e s o l i d phase c h e m i s t r y as wel!. .
Conclusions
I t n o w s e e m s apparent that there i $ a great deal of similarity in t h e m e c h a n i s m s o f escape of t a r f r o m b o t h s o f t e n i n g and non-softening 'coals. T h e w e i g h t o f e v i d e n c e presently a p p e a r s t o favor a n evaporation oontrolled e s c a p e of tar f r o m the p a r t i c l e . A s i m p l e "batch distillation" m o d e l is o b v i o u s l y i n a p p r o p r i a t e f o r describing the p r o c e s s . I n s t e a d . i t s e e m s that a m o d e l w h i s h a l l o w s f o r simultaneous
204
d
tar precursor f o r m a t i o n r e a c t i o n s , evaporation p r o c e s s e s , and repolymerization reactions is n e c e s s a r y .
R e f e r e n c e s
-Anthony,D.B. and H o w a r d , J . B . , AIChEJ. 2 2 , 6 2 5 ( 1 9 7 6 ) . - A n t h o n y , D . B . , H o , w a r d , J . B . , H o t t e l , H . C . , and t4eissner.H.P. 15th Svmp.
-Arendt ,P: and van H e e k , K - H . , F u e l . 60, 77.9 ( 1 9 8 1 ) . -Attar.A., AIChEJ, 24, 106 ( 1 9 7 8 ) . - C h e n , L . W . and W e n , C . Y . , A C S D i v . o f Fuel C h e m . P r e P r . , , 2 4 ( 3 ) . 141
- C h e o n g , P . H . , P h D T h e s i s , C a l i f o r n i a Institute o f T e c h n o l o g y ,
-Cavalas,.C.R., Coal Pvrolysis, p 104, Elsevier. 1 9 8 2 . - C a v a l a s , C . R . and Wi1ks.K.A.. A I C h E J , 2 6 , 2 0 1 (1980). - H i s S , T . C . and Cuss1er.E.L.. AI'ChEJ, 19, 6 9 8 ( 1 9 7 3 ) . - H o w a r d , H . C . in C h e m . of Coal U t i l . , ( H . H . ' L o w r y , E d . ) , pp761-773. WileY,
( I n t . ) on C o m b . , p1303, 1974.
( 1 9 7 9 ) .
P a s a d e n a , C a . 1977.
1 9 4 5 . -Howard;H.C. in C h e m . o f Coal U t i l . , S u p p l . V o l . , ( H . H . L o w r y , Ed.),
- H o w a r d , J . R . in Q e m . o f Coal U t i l . , Second S u p p l . V o l . , ( M . A . pp3,40-394,WiIey, 1963.
Elliott , E d , ) , pp665-784, W i l e y , 1981. - H o w a r d , J . B . , P e t e r 5 , W . A . . and Serio. M . A . , EPRI Report AP-1803.
- J a m e s , R . K . and M i l l s , A . F . , Letters in Heat and M a s s T r a n s f e r , 2, 1
- Lewellen, P . C . , S . M . T h e s i s , D e p t . of O h e m . E n g . , M . I . T . , Cambridge,
Electric Power R e s e a r c h Institute, P a l o Alto, C a . , April. 1981.
(1976).
M a . 1975. - M c L e a n , W . J . , Hardesty, D . R . , and P o h l , J . H . , 18th S y m p . ( I n t . ) on
- M e l i a , P . F . and B o w m a n , C . T . , W S S l C l Paper N o . 8 2 - 7 , Paper presented at C o m b . , p1239. 1981.
the Western States S e c t i o n l C o m b u s t i o n Institute Meeting, Salt Lake C i t y , U t . , A p r i l , 1982.
- N i k s a , S . , P h D T h e s i s , D e p t . o f C h e m . E n g . , P r i n c e t o n U n i v . , Princeton, N . J . . 1981.
-Reidelbach,H. and S u m m e r f i e l d , M . , A C S D i v . of F y e l C h e m . P r e p r . 2 0 ( 1 ) , 161 (1975).
- R u s s e l , W . B . , Savi1le.D.A.. an'd C r e e n e , M . I . , A I C h E J , 25, 65 (1979). -Seeker,W.P. ,Samuelson,C.S. , H e a p , M . P . and Trol,inger,J.D., .l,8th Symp.
- S o l o m o n , P . R . and C o l k e t , M . B . , 17th S y m p . ( I n t . ) on C o m b . , p131, 1979. ( I n t . ) on C o m b . , ~ 1 2 1 3 , 1 9 8 1 .
-Suuberg.E.M., Peters.,W.A. and H0ward.J.B.. IGEC P r o c . D e s . and Dev., - 17, 37 (1978). -
-a- , in Thermal H y d r o c a r b o n C h e m i s t r y , ( A . O b l a d et a l . , Eds.), A C S Adv. in Chem. Series N o . 183, C h a ~ . 14, 1979a. - - - , 17th S y m p . ( I n t . ) o n C o m b . , p117. 1979b -Unger, P . E . and Suuberg, E . M . . 18th S y m p . ( I n t . ) o n C o m b . , ~ 1 2 0 3 . 1981. --- , Manuscript submitted f o r publication, 1 9 8 3 a . --- , Manuscsipt submitted t o the International Conference on Coal
S c i e n c e , P i t t s b u r g h , P a . , A u g u s t , 1983b. -Zachariae,M.W.,S.M. T h e s i s , D e p t . of Chem. E n g . , . M . l . T . , C a m b r i d g e , Ma. 19.7 9 .
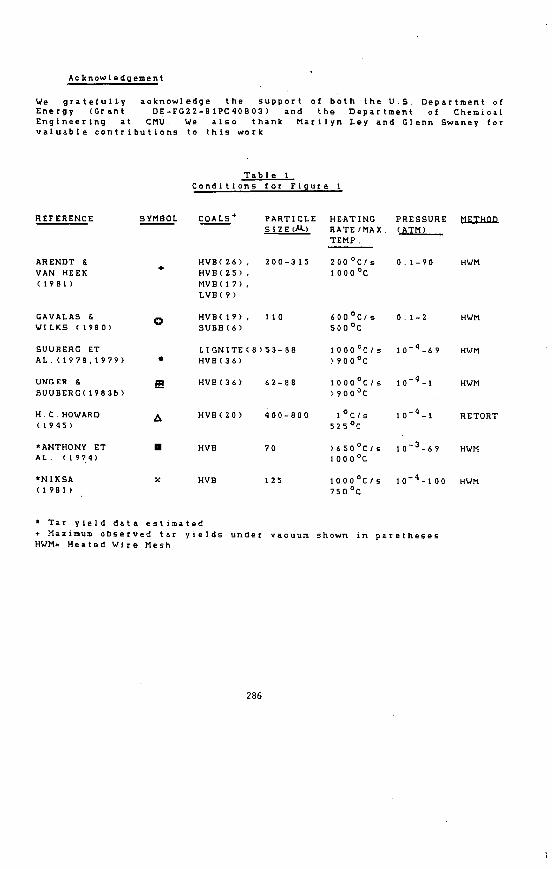
Ac know1 edaement
W e g r a t e f u l l y a c k n o w l e d g e t h e support o f b o t h t h e U.S. Department o f Energy (Grant D E - F G 2 2 - 8 1 P C 4 0 8 0 3 ) and t h e D e p a r t m e n t o f Chemical Engineering at C M U . W e a l s o thank M a r i l y n Ley and Glenn Swaney f o r v a l u a b l e contributions to this w o r k .
T a b l e 1 C o n d i t i o n s f o r F i g u r e 1
R E F E R E N C E S Y M B O L C O A L S + P A R T I C L E H E A T I N G P R E S S U R E METHOD SIZE(&) R A T E I H A X . ( A T M )
T E M P .
A R E N D T 6 V A N H E E K ( 1 9 8 1 )
HVB(26), 200-315 200°C/s 0 . 1 - 9 0 H W M
MVB(17), LVB(9)
+ H V B ( 2 5 ) , 1ooooc
G A V A L A S & HVB(l9), 110 600°CIs 0 . 1 - 2 H W M W I L K S ( 1 9 8 0 ) S U B B ( 6 ) 5 o o o c
S U U R E R G ET LIGNITE(8)53-88 1 0 0 0 ° C / 5 10-4-69 H W M A L . (1978.1979) 0 H V B ( 3 6 ) )9OO0C
LINGER 6 e HVB(36) 62-88 1 0 0 O ~ C I s 10-4-1 H W M S U U B E R C ( 19836) : 9 0 0 ' C
H . C . H O W A R D A HV S ( 2 0 ) 400-800 l 0 C / 5 10-4-1 R E T O R T ( 1 9 4 5 ) 525'C
* A N T H O N Y ET H V B 70 ) 6 5 O o C I s 10-3-6? H W M A L . (1974) l0OO0C
* N I K S A ( 1 9 8 1 )
x H V B 125 1000°CIs 10-4-100 H W M 7 5 O o C
* Tar yield d a t a estimated + M a x i m u m observed tar yields u n d e r vacuum s h o w n in paretheses H W M = Heated W i r e M e s h
286
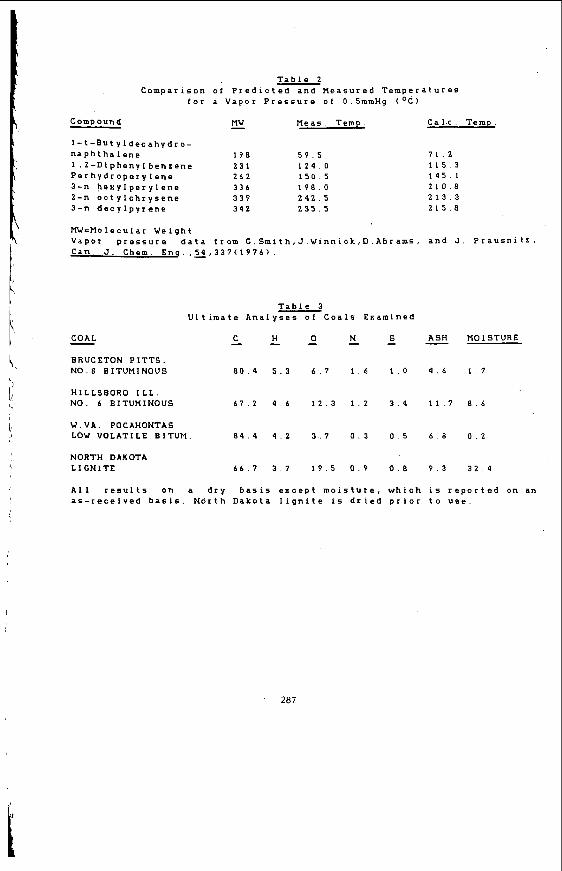
T a b l e 2 C o m p a r i s o n o f P r e d i c t e d and Measured T e m p e r a t u r e s
f o r a Vapor P r e s s u r e o f 0 5 m m H g ( O C )
M W M e a s T e m p Calc T e m p - Compound
1-t-Butyldecahydro-
1,Z-DiphenyI benzene 231 1 2 4 . 0
3-n hexylperylene 336 1 9 8 . 0 2-n octylchrysene 339 2 4 2 . 5 3-n decylpyrene 342 2 3 5 . 5
naphthalene 198 5 9 . 5
Perhydroperylene 262 1 5 0 . 5
71 . 2 1 1 5 . 3 1 4 5 . 1 210.8 2 1 3 . 3 215.8
W = M o l e c u l a r W e i g h t Vapor pressure d a t a f r o m C.Smith,J.Winnick,D.Abrams, and J . PrausnitZ. C a n . J. Chem. E n g . , 4 , 3 3 7 ( 1 9 7 6 ) .
T a b l e 3 Ultimate A n a l y s e s of C o a l s Examined
- H - 0 - N - 5 - A S H M O I S T U R E c - C O A L - B R U C E T O N P l T T S . N 0 . 8 B I T U M I N O U S 8 0 . 4 5 . 3 6 . 7 1 . 6 1 . 0 4 . 6 1 . 7
H I L L S B O R O ILL. NO. 6 B I T U M I N O U S 6 7 . 2 4 . 6 1 2 . 3 1 . 2 3 . 4 1 1 . 7 8 . 6
W . V A . P O C A H O N T A S L O W V O L A T I L E BITVM. 8 4 . 4 4 . 2 3 . 7 0 . 3 0 . 5 6 . 8 0 . 2
NORTH DAKOTA L I C N I T E 6 6 . 7 3 . 7 1 3 . 5 0 . 9 0 . 8 9 . 3 3 2 . 4
All results o n a dry basis except m o i s t u r e , w h i c h is reported on an as-received b a s i s . N o r t h D a k o t a lignite is dried prior t o u s e .

X
X ;
x x
3 Y
t + =A
x :
x x +
PRESSURE < A T M >
FIGURE 1 . VARIATION OF TAR YIELD W I T H PRESSURE OF INERT CAS EXTERNAL TO THE PARTICLE DURING PYROLYSIS. SEE TABLE 1 FOR EXPLANATION OF SYMBOLS.
% 2 5 r
k I - F 2 0 I- z w 0
w
I- I (3
w - 3 0 1000 2000 3000
a a
-
15
I O
5
0
FIGURE 2 . MOLECULAR WEIGHT DISTRIBUTIONS OF BRUCETON COAL T A R S AND EXTRACTS. SOLID CURVE-ATPlOSPHERIC P R E S S I J R E T A R ; DASHED CURVE-VACUUIT TAR: DOTTED CCRVE-COAL E X i 2 A i T . ALL F O R SAMPLES HEATED AT'lOOO"C/s TO 5 4 6 O C . FOLLOWED B Y COGLING A T 200-400°C/s.
288
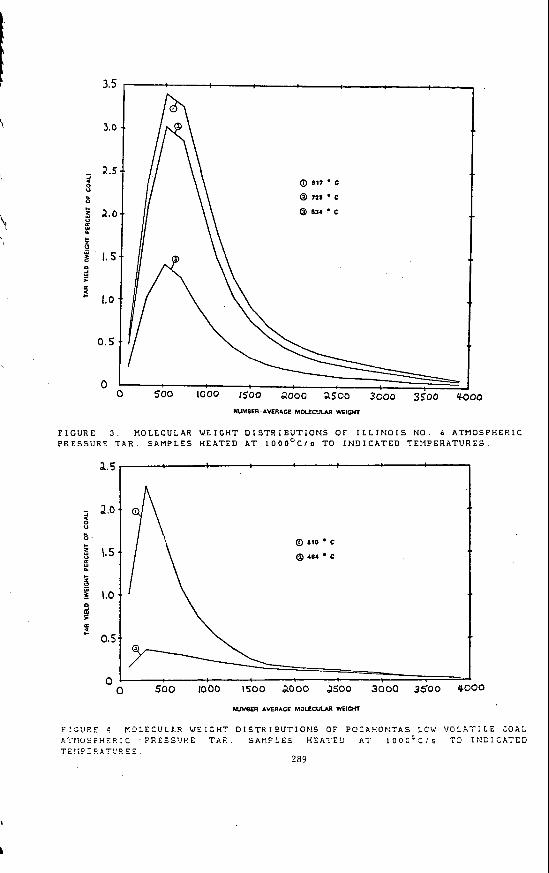
3.0
- 2.5 i'
a U
5 a.0 a Y
c 0 E 1. 5 0
w > P
1.0 2
0 . 5
O O
Q 810 c @ 48b C
A
0 MIMBER'AVERAGE MOLECUUJ( WElQn
FIGURE 3 . MOLECULAR W E I G H T D I S T R I B U T I O N S OF ILLIEIOIS NO. 6 ATMOSPHERIC PRESSURE T A R . SAMPLES H E A T E D A T 1000°C/s T O INDICATED T E M P E R A T U R E S .
F!C.VP.E 4 Y 0 L E C U L E . R W E i G H T D I S T R I E U T I O H S O F P O C A H O N T A S LOL' V O L A T I L E C O A L A ' 7 I l O ~ P H E S i C ' PRESS'JRE T A R . S A M F L E S H E A T E D A T 1 @ @ C G C / 5 I C Ih!Z!CATEI? 7 E ! i p 3 A TI.,?. E
289
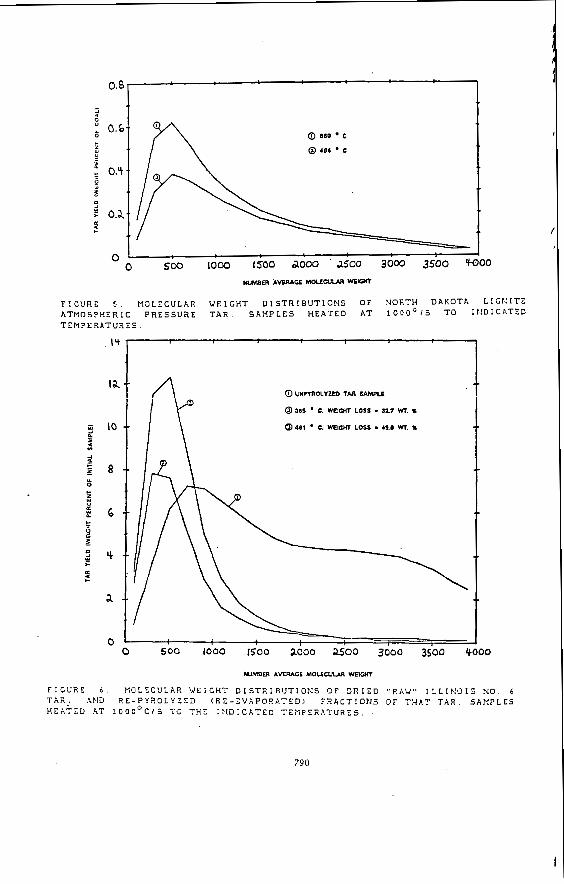
0 860 c
@ 464 ' C
F I G U R E 5 . M O L E C U L A R W E I G H T D I S T R I B U T I O N S O F N O R T H D A K O T A L I C M I T E A T M O S P H E R I C P R E S S U R E T A R . S A M P L E S H E A T E D AT 1 0 0 0 " I S T O I N D I C A T E D T E M P E R A T U R E S .
U
MJJMBER AVERAGE MOLEQlW mtM
F I G U R E 6 M , O L E C U L A P . W E I G H T D I S T ~ I B U T I O N S O F D R I E D " R A ' J " I L L I P I O I S N O . 6 T A R ? AND R E - P Y R O L Y Z E D (RE-ZVAPORATED) F R A C T ! C ? l S O F THAT TAR. S A M P L E S H E A T E D AT ! 0 0 0 " C I S 70 T H E : : I O ! C k T E D T E X P : R A T U R E S .
290
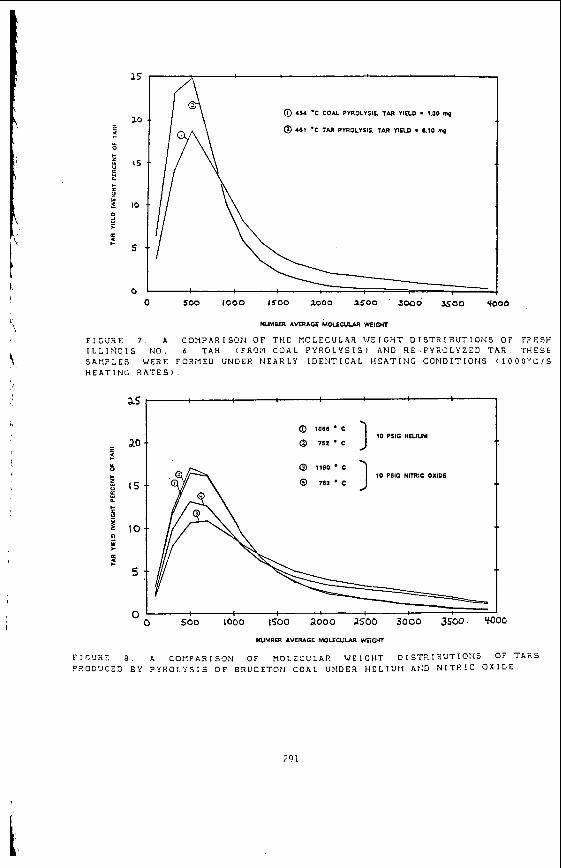
15
30 - E *
0 0 500 1000 is00 LOOO as00 so00 x a o YOOO
W E E R AVERAGE MOLE- W E l O n
F I G U R E 7 A C O M P A R I S W O F T H E M O L E C U L A R W I G H T D I S T R I ~ U T I O ~ I S O F F F E S F I L L I S I O I S !JO 6 T A R ( F R O : ? C O A L P Y R O L Y S I S ) A N D R E - P Y R O L Y Z E D T A R T H E S E S A P l P L E S W E R E F O R M E D U N D E R N E A R L Y I D E H T I C A L H E A T I P I G C O N D I T I O I I S ( l O O O " C / S H E A T I t l G R A T E S )
I- H E Y D
c 0
I
as
ao
15
IO
5
I
I
291
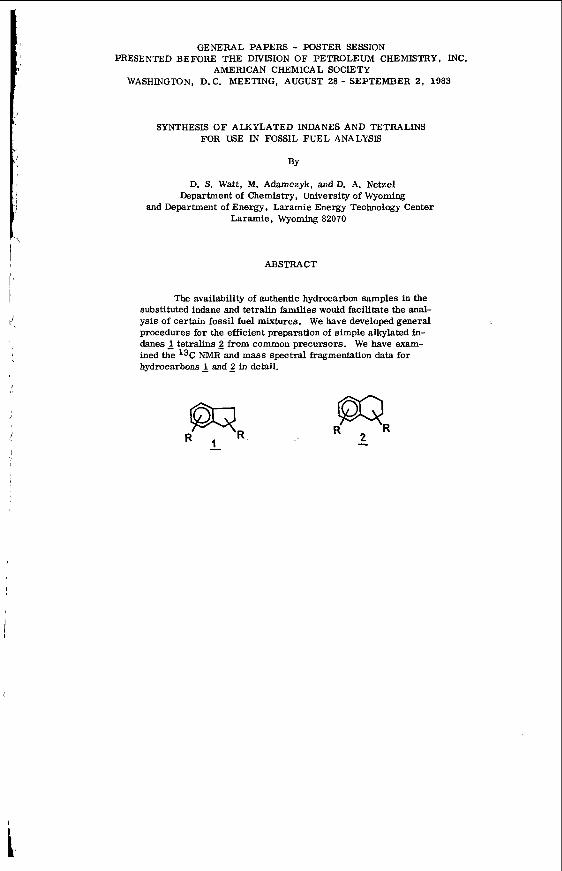
GENERAL PAPERS - POSTER SESSION PRESENTED BEFORE THE DIVISION OF PETROLEUM CHEMISTRY, INC.
AMERICAN CHEMICAL SOCIETY WASHINGTON, D. C. MEETING, AUGUST 28 - SEPTEMBER 2, 1983
SYNTHESIS O F ALKYLATED INDANES AND TETRALINS FOR USE IN FOSSIL FUEL ANALYSIS
BY
D. S. Watt, M. Adamczyk, andD. A. Netzel Department of Chemistry, University of Wyoming
and Department of Energy, Laramie Energy Technology Center Laramie, Wyoming 82070
ABSTRACT
The availability of authentic hydrocarbon samples in the substituted indane and tetralin families would facilitate the anal- ysis of certain fossil fuel mixtures. We have developed general procedures for the efficient preparation of simple alkylated in- danes 1 tetralins ? from common precursors. We have exam- ined the 13C NMR and mass spectral fragmentation data for hydrocarbons 1 and 2 in detail.
R I mR
GENERAL PAPERS - POSTER SESSION PRESENTED BEFORE THE DIVISION OF PETROLEUM CHEMISTRY, INC.
AMERICAN CHEMICAL SOCIETY WASHINGTON, D. C. MEETING, AUGUST 28 - SEPTEMBER 2, 1983
A TIME-TEMPERATURE-CONCENTRATION MATRM FOR INDUCED SEDIMENT FORMATION IN SHALE DIESEL FUEL
BY
J. 77. Cooney, E. J. Beal, and R. N. Hazlett Naval Research Laboratory, Code 6180, Washington, D. C. 20375
INTRODUCTION
Deterioration in fuel quality with time bas been a continuing problem in the utilization of middle distillate fuels. These stability problems will intensify a s we develop alternative sources of fuel, such as shale oil and coal. Present knowledge has suggested that for some fuels, nitrogen heterocycles may play a causative role in the formation of insoluble sediments and gums under con- ditions of ambient and accelerated storage (1). In light of the high costs of fuel processing, sub- stantial savings could be realized if i t were possible to identify those nitrogen heterocycles which are most actively involved in the formation of insoluble material. Currently, i t appears that rela- tively non-basic nitrogen heterocycles, particularly those which contain alkyl groups in certain positions, may be the most troublesome (2). However, in other fuels and under different test con- ditions, basic nitrogen compounds may play a significant role (3).
In addressing this subject, we a r e defining the stability of shale-derived diesel fuel marine (DFM), stressing the sample under accelerated storage conditions, and determining the amoimt ef total insoluble material produced. This report describes rp.sc!t;: o5j'hinea when 2,5-dimethylpyrrole (DMP) was used a s a dopQnt k 2 +&re-iemperature-concentration matrix. Results of a survey of other nitrogen compounds a s fuel additives a r e also presented.
EXPERIMENTAL
Storage Test Techniques
300 ml samples of filtered fuel were stressed in the dark in 500 ml screw-cap borosilicate Erlen- meyer flasks (Teflon-lined caps). Al l samples were run in duplicate. Vented testa were accom- plished by using modified screw caps which were drilled to hold 6 mm glass tubing (with glass wool plugs). After s t ress , test flasks were allowed to cool to room temperature before being filtered under slight vacuum through a double layer of Gelman glass fiber filter paper. F l a s k contents were then rinsed with several ml of g-heptane, with additional sediment being collected on the filter paper. The filter cake w a s rinsed withpheptane to remove adsorbed fuel. The flasks and filter holders were heated (120°C) under vacuum for twelve hours, allowed to equilibrate on a benchtop (several hours), and accurately weighed several times on an analytical balance. Appropriate blank fiasWfilter holder corrections were applied. Filtrable sediment values were Qbtained from the corrected net weight change of the filter holder with adherent gum values determined from the weight change of the test flask (4).
Reagents The base fuel for the present study is DFM refined from Paraho crude shale oil by SOHIO.
This fuel, produced in the U. S. Navy's Shale-11 demonstration, is well-characterized (4). It was available with (sample "D-1'3 and without (sample "D-11") antioxidant added. The antioxidant, 2,4- dimethyl-6s-butylphenol (AO-30), was present a t the 24 mg/l level in fuel D11. No other additives were present in either sample. All nitrogen compounds used as dopants were pure by NMR, capil- lary GC, and/or mp. Fresh DMP was stored frozen under nitrogen so as to prevent autoxidation and i t remained colorless under this storage. The concentration matrix was prepared by appropri- ate dilution of a quantity of stock-doped fuel solution (typically 450 ppm w/v nitrogen).
The experimental procedures used were developed from reported methods (2). In summary,
RESULTS AND DISCUSSION
Accelerated fuel stability tests are important to the producers of fuels and to those perform- ing research on chemical instability phenomena (5). The majority of these tests measure sediment weight in order to estimate fuel instability, and tes t temperatures have varied between ambient and
t. ! ads, the accompanying uncertainty of the significance of the observed conditions may be dominant.
Figure 1 summarizes a time-temperature matrix for several accelerated fuel stability tests which have appeared in the literature. It is noteworthy that a majority of the stability tests depicted fall close to the solid line, which represents a doubling of test time for each 10°C drop in temperature. The line extrapolates to approximately one year of ambient storage. The present study has concen-
CONCLUSIONS
A common reaction pathway appears to exist for DMP-promoted sedimentation in DFM. Re- sults obtained are consistent with those of other workers (2) A high-precision gravimetric method of fuel storage stability determination has been developed.
ACKNOWLEDGMENT
The authors thank Dr. Dennis W. Brinkman of the Bartlesville Energy Technology Center (WE) for sponsoring this work under DOE contract DE-AI-8lBC10525. References to brand names were made for identification only and do not imply endorsement by DOE or NRL.

FIGURE 1 Time-Temperature Correlation f o r Accelerated Fuel Stability Tests
+!!EL, \ ONRL
DuPont
NRL
Daniel
soft glass 0 121OC-168 hrs.
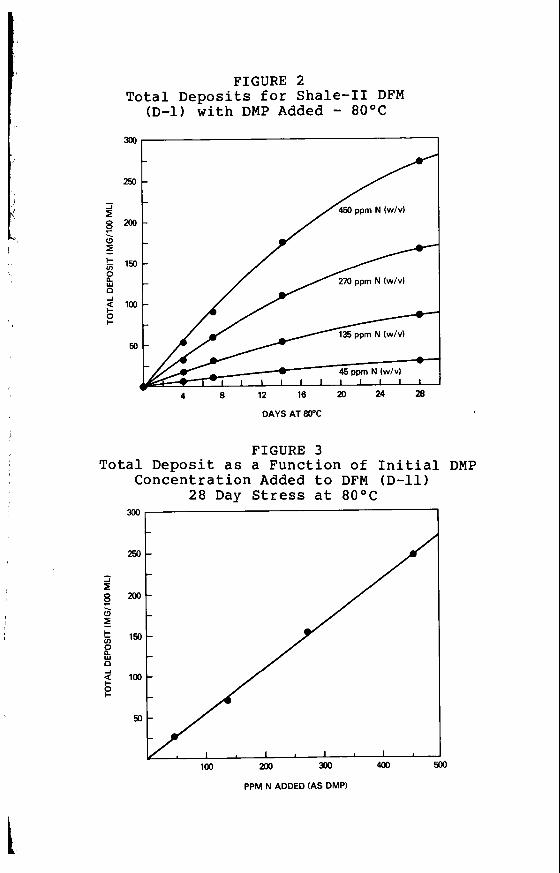
FIGURE 2 Total Deposits for Shale-I1 DFM
(D-1) with DMP Added - 8OoC
250
450 ppm N (w/v) /
4 8 12 16 P 24 28
DAYS AT 80°C
FIGURE 3 Total Deposit as a Function of Initial DMP
I
PPM N ADDED (AS DMP)
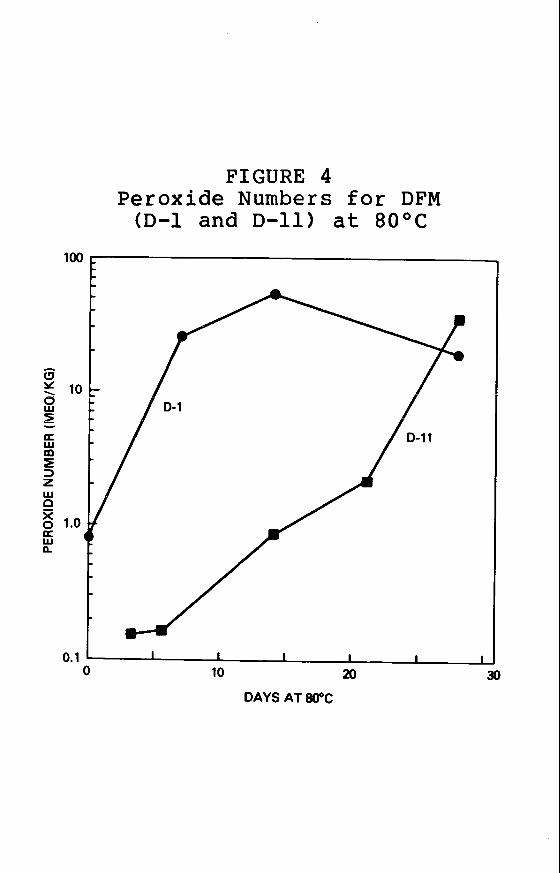
FIGURE 4 Peroxide Numbers for DFM
(D-1 and D-11) at 8OoC
0.1 I I I I I I I _
10 20 30 0
DAYS AT 80°C
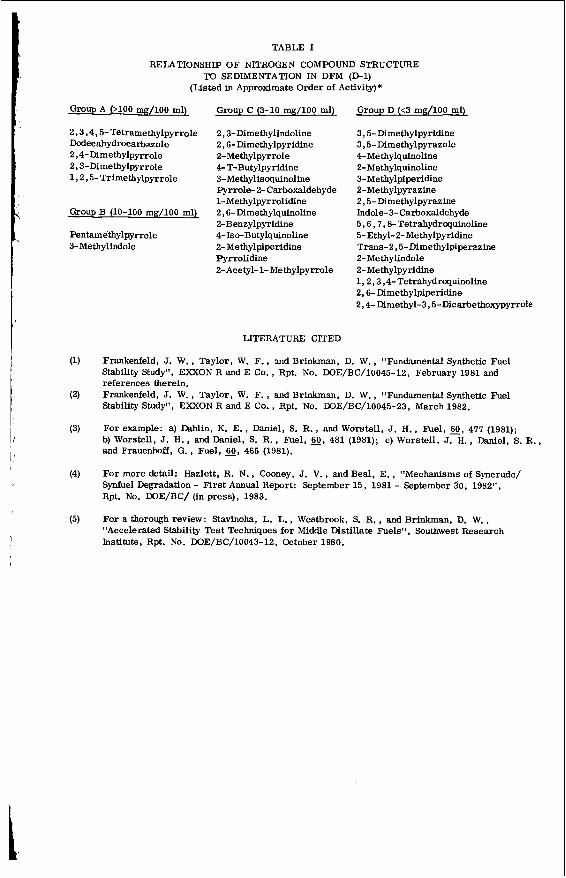
TABLE I
RELATIONSHIP OF NITROGEN COMPOUND STRUCTURE TO SEDIMENTATION IN DFM (D1)
(Listed in Approximate Order of Activity)*
I '
Group A (>lo0 %/lo0 ml)
2,3,4,5-Tetramethylpyrrole Dodecahydrocarbezole 2,4-Dimethylpyrrole 2,3-Dimethylpyrrole 1,2,5- Trimethylpyrrole
Group B (10-100 mg/100 ml)
Pentamethylpyrrole 3-Methylindole
Group C (3-10 m g / l O O ml)
2,3-Dimethylindoline 2,6-Dimethylpyridine 2-Methylpyrrole 4- T-Butylpyridine 3-Methylisoquinoline Pyrrole- 2- Carboxaldehyde 1- Methylpyrrolidine 2,6-Dimethylquinoline 2-Benzylpyridine 4-Is-Butylquinoline 2-Methylpiperidine Pyrrolidine 2-Acetyl- 1- Methylpyrrole
LITERATURE CITED
Group D ( t3 mg/100 mly
3,5-Dimethylpyridine 3,5-Dimethylpyrazole 4- Methylquinoline 2-Methylquinoline 3-Methylpiperidine 2-Methylpyrazine 2,5-Dimethylpyrazine Indole- 3- Carboxaldehyde 5,6,7,8- Tetrahydrcquinoline 5-Ethyl-2-Methylpyridine Trans-2,5-Dimethylpiperazine 2-Methylindole 2- Methylpyridine 1 ,2 ,3 ,4- Tetrahydroquinoline 2,6- Dimethylpiperidine 2,4-Dimethyl-3,5-Dicarbethoxypyrrole
Frankenfeld, J. W., Taylor, W. F., and Brinkman, D. W., "Fundamental Synthetic Fuel Stability Study", EXXON R and E Co., Rpt. No. WE/BC/10045-12, February 1981 and references therein. Frankenfeld, J. W., Taylor, W. F., and Brinkman, D. W., "Fundamental Synthetic Fuel Stability Study", EXXON R and E Co., Rpt. No. WE/BC/10045-23, March 1982.
For example: a) Dahlin, K. E., Daniel, S. R., and Worstell, J. H., Fuel, E, 477 (1981); b) Worstell, J. H., and Daniel, S. R., Fuel, 2, 481 (1981); c) Worstell, J. H., Daniel, S. R., and Frauenhoff, G . , Fuel, 60, 485 (1981).
For more detail: Hazlett, R. N., Cooney, J. V., and B e d , E . , "Mechanisms of Syncrude/ Synfuel Degradation - First Annual Report: September 15, 1981 - September 30, 1982", Rpt. No. DOE/BC/ (in press), 1983.
For a thorough review: Stavinoha, L. L., Westbrook, S. R. , and Brinkman, D. W., "Accelerated Stability Test Techniques for Middle Distillate Fuels", Southwest Research Institute, Rpt. No. WE/BC/10043-12, October 1980.
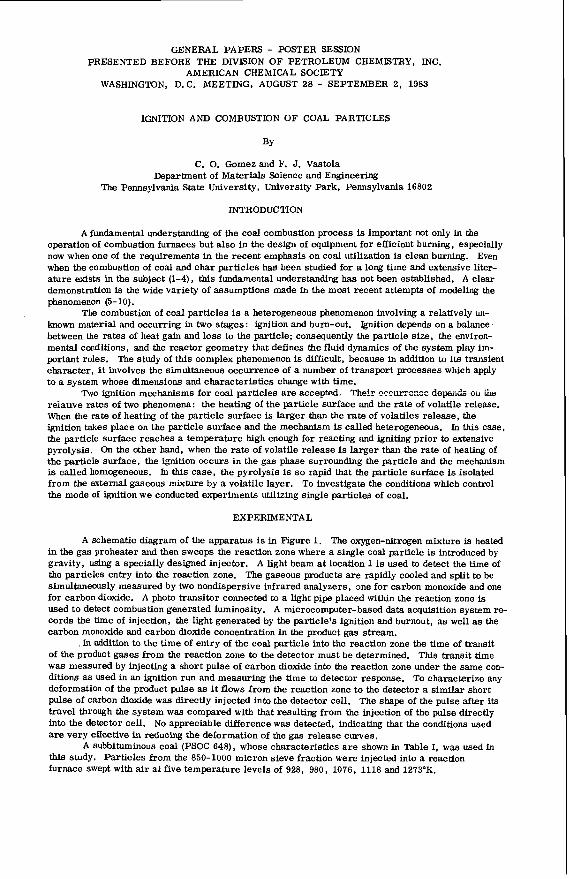
GENERAL PAPERS - POSTER SESSION PRESENTED BEFORE THE DIVISION OF PETROLEUM CHEMISTRY, INC.
AMERICAN CHEMICAL SOCIETY WASHINGTON, D.C. MEETING, AUGUST 28 - SEPTEMBER 2, 1983
IGNITION AND COMBUSTION OF COAL PARTICLES
BY
C. 0. Gomez and F. J. Vastola Department of Materials Science and Engineering
The Pennsylvania State University, University Park, Pennsylvania 16802
INTRODUCTION
A fundamental understanding of the coal Combustion process is important not only in the operation of combustion furnaces but also in the design of equipment for efficient burning, especially now when one of the requirements in the recent emphasis on coal utilization is clean burning. Even when the combustion of coal and char particles has been studied for a long time and extensive liter- ature exists in the subject (1-4), this fundamental understanding has not been established. A clear demonstration is the wide variety of assumptions made in the most recent attempts of modeling the phenomenon (5-10).
The combustion of coal particles is a heterogeneous phenomenon involving a relatively un- known material and occurring in two stages: ignition and burn-out. Ignition depends on a balance between the rates of heat gain and loss to the particle; consequently the particle size, the environ- mental conditions, and the reactor geometry that defines the fluid dynamics of the system play im- portant roles. The study of this complex phenomenon is difficult, because in addition to its transient character, i t involves the simultaneous occurrence of a number of transport processes which apply to a system whose dimensions and characteristics change with time.
TWO ignition mechanisms for coal particles are accepted: Tkir C?CCET'C~CC d c ~ n & 011 h e reianve rates of two phenomena: the heating of the particle surface and the rate of volatile release. When the rate of heating of the particle surface is larger than the ra te of volatile6 release, the ignition takes place on the particle surface and the mechanism is called heterogeneous. In this case, the particle surface reaches a temperature high enough for reacting and igniting prior to extensive pyrolysis. On the other hand, when the rate of volatile release is larger than the rate of heating of the particle surface, the ignition occurs in the gas phase surrounding the particle and the mechanism is called homogeneous, In this case, the pyrolysis is so rapid that the particle surface is isolated from the external gaseous mixture by a volatile layer. To investigate the conditions which control the mode of ignition we conducted experiments utilizing single particles of coal.
EXPERIMENTAL
A schematic diagram of the apparatus is in Figure 1. The oxygen-nitrogen mixture is heated in the gas preheater and then sweeps the reaction zone where a single coal particle is introduced by gravity, using a specially designed injector. A light beam a t location 1 is used to detect the time of the particles entry into the reaction zone. The gaseous products a r e rapidly cooled and split to be simultaneously measured by two nondispersive infrared analyzers, one for carbon monoxide and one for carbon dioxide. A photo transitor connected to a light pipe placed within the reaction zone is used to detect combustion generated luminosity. A microcomputer-based data acquisition system re- cords the time of injection, the light generated by the particle's ignition and burnout, a s well as the carban monoxide and carbon dioxide concentration in the product gas stream.
, In addition to the time of entry of the coal particle into the reaction zone the time of tramit of the product gases from the reaction zone to the detector must be determined. This transit time was measured by injecting a short pulse of carbon dioxide into the reaction zone under the same con- ditions as used in an ignition run and measuring the time to detector response. To characterize any deformation of the product pulse as it flows from the reaction zone to the detector a similar short pulse of carbon dioxide was directly injected into the detector cell. The shape of the pulse after its travel through the system was compared with that resulting from the injection of the pulse directly into the detector cell. No appreciable difference was detected, indicating that the conditions used are very effective in reducing the deformation of the gas release curves.
A subbituminous coal (PSOC 648), whose characteristics a r e shown in Table I, was used in this study. Particles from the 850-1000 micron sieve fraction were injected into a reaction furnace Swept with air a t five temperature levels of 928, 980, 1076, 1118 and 1273°K.
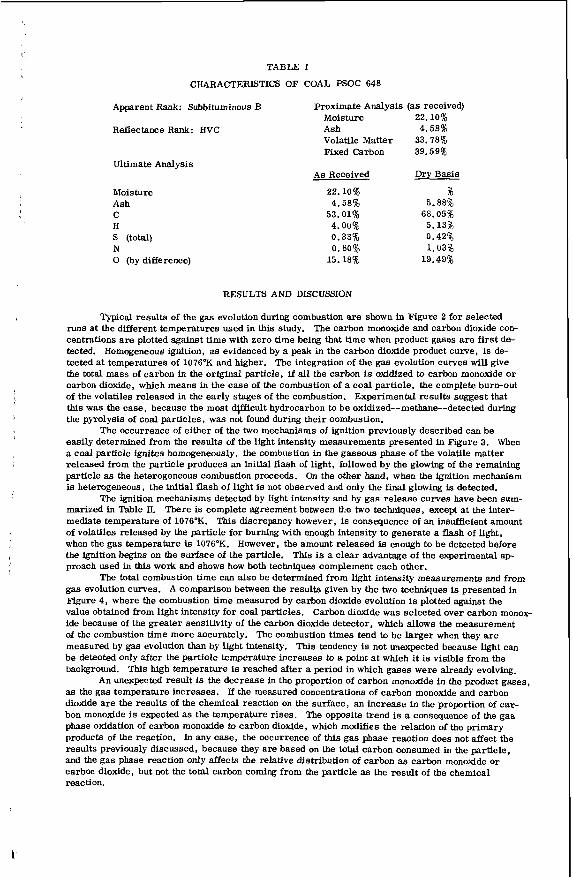
TABLE 1
CHARACTERISTICS OF COAL PSOC 648
Apparent Rank: Subbituminous B proximate Analysis (as received) Moisture 22. 10%
Reflectance Rank: HVC Ash 4.58% Volatile Matter 33.78% Fixed Carbon 39.59%
A s Received Dry Basis Ultimate Analysis
Moisture Ash C H
N 0 (by difference)
s (total)
22.10% 3& 4.58% 5.88% 53.01% 68.05% 4.00% 5.13%
0.80% 1.03% 15.18% 19.49%
0.33% 0.42%
RESULTS AND DISCUSSION
Typical results of the gas evolution during combustion are shown in Figure 2 for selected runs at the different temperatures used in this study. The carbon monoxide and carbon dioxide con- centrations a re plotted against time with zero time being that time when product gases a r e f i rs t de- tected. Homogeneous ignition, as evidenced by a peak in the carbon dioxide product curve, is de- tected at temperatures of 1076°K and higher. The integration of the gas evolution curves will give the total mass of carbon in the original particle, if all the carbon is oxidized to carbon monoxide or carbon dioxide, which means in the case of the combustion of a coal particle, the complete burn-out of the volatiles released in the early stages of the combustion. Experimental results suggest that this was the case, because the most difficult hydrocarbon to be oxidized--methane--detected during the pyrolysis of coal particles, was not found during their combustion.
easily determined from the results of the light intensity measurements presented in Figure 3. When a coal particle ignites homogeneously, the combustion in the gaseous phase of the volatile matter released from the particle produces an initial flash of light, followed by the glowing of the remaining particle as the heterogeneous combustion proceeds. On the other hand, when the ignition mechanism is heterogeneous, the initial flash of light is not observed and only the final glowing ia detected.
The ignition mechanisms detected by light intensity and by gas release curves have been sum- marized in Table II. There is complete agreement between the two techniques, except a t the inter- mediate temperature of 1076°K. This discrepancy however, is consequence of an insufficient amount of volatiles released by the particle for burning with enough intensity to generate a flash of light, when the gas temperature is 1076°K. However, the amount released is enough to be detected before the ignition begins on the surface of the particle. This is a clear advantage of the experimental a p proach used in this work and shows how both technQues complement each other.
gas evolution curves. A comparison between the results given by the two techniques is presented in Figure 4, where the combustion time measured by carbon dioxide evolution is plotted against the value obtained from light intensity for coal particles. Carbon dioxide was selected over carbon monox- ide because of the greater sensitivity of the carbon dioxide detector, which allows the measurement of the combustion time more accurately. The combustion times tend to be larger when they are measured by gas evolution than by light intensity. This tendency is not unexpected because light can be detected only after the particle temperature increases to a point at which it is visible from the background. This high temperature is reached after a period in which gases were already evolving.
as the gas temperature increases. If the measured concentrations of carbon monoxide and carbon dioxide a r e the resulta of the chemical reaction on the surface, an increase in the proportion of car- bon monoxide is expected a s the temperature rises. The opposite trend is a consequence of the gas phase oxidation of carbon monoxide to carbon dioxide, which modifies the relation of the primary products of the reaction. In any case, the occurrence of this gas phase reaction does not affect the results previously discussed, because they are based on the total carbon consumed in the particle, and the gas phase reaction only affects the relative distribution of carbon a s carbon monoxide or carbon dioxide, but not the total carbon coming from the particle as the result of the chemical reaction.
The occurrence of either of the two mechanisms of ignition previously described can be
The total combustion time can also be determined from light intensity measurements and from
An unexpected result is the decrease in the proportion of carbon monoxide in the product gmes,
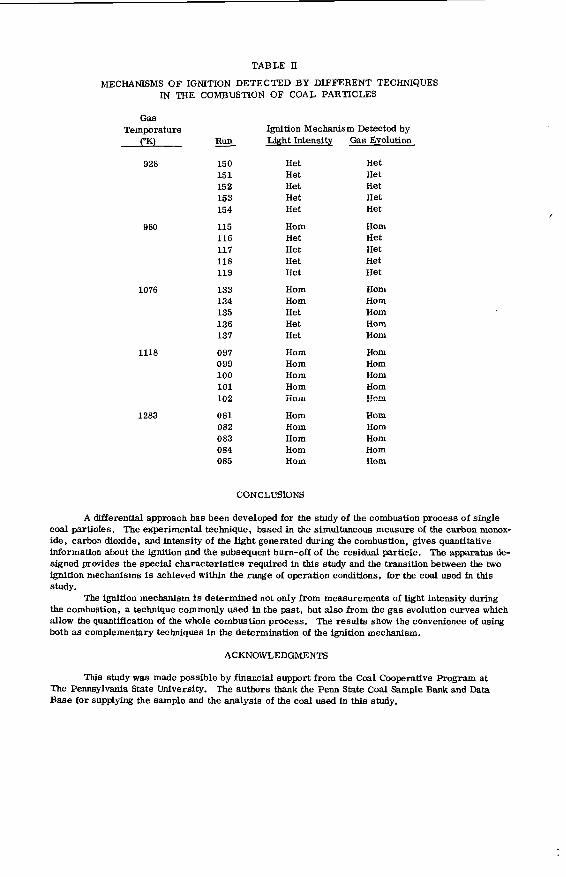
TABLE 11
MECHANISMS OF IGNITION DETECTED BY DIFFERENT TECHNIQUES IN THE COMBUSTION OF COAL PARTICLES
980
1076
1118
1283
Gas
RUn (“K)
928 150 151 152 153 154
115 116 117 118 119
133 134 135 136 137
097 099 100 101 102
081 082 083 084 085
Temperature -
Ignition Mechanism Detected by Light Intensity Gas Evolution
Het Het Het Het Het Het Het Het Het Het
Horn Horn Het Het Het Het Het Het He t Het
Horn Horn Horn Horn Het Horn Het Hom Het Horn
Horn Horn Horn Hom Hom Horn Horn Horn HOrU _--- Horn Horn Horn Hom Horn Horn Horn Horn Horn Horn
Unm
/
CONCLUSIONS
A differential approach has been developed for the study of the combustion process of single coal particles. The experimental technique, based in the simultaneous measure of the carbon monox- ide, carbon dioxide, and intensity of the light generated during the combustion, gives quantitative information about the ignition and the subsequent burn-off of the residual particle. The apparatus de- signed provides the special characteristics required in this study and the transition between the two ignition mechanisms is achieved within the range of operation conditions, for the coal used in this study.
the combustion, a technique commonly used i n the past, but also from the gas evolution curves which allow the quantification of the whole combustion process. The results show the convenience of using both a s complementary techniques in the determination of the ignition mechanism.
The ignition mechanism is determined not only from measurements of light intensity during
ACKNOWLEDGMENTS
This study was made possible by financial support from the Coal Cooperative Pmgram at The Pennsylvania State University. The authors thank the Penn State Coal Sample Bank and Data Base for supplying the sample and the analysis of the coal used in this study.
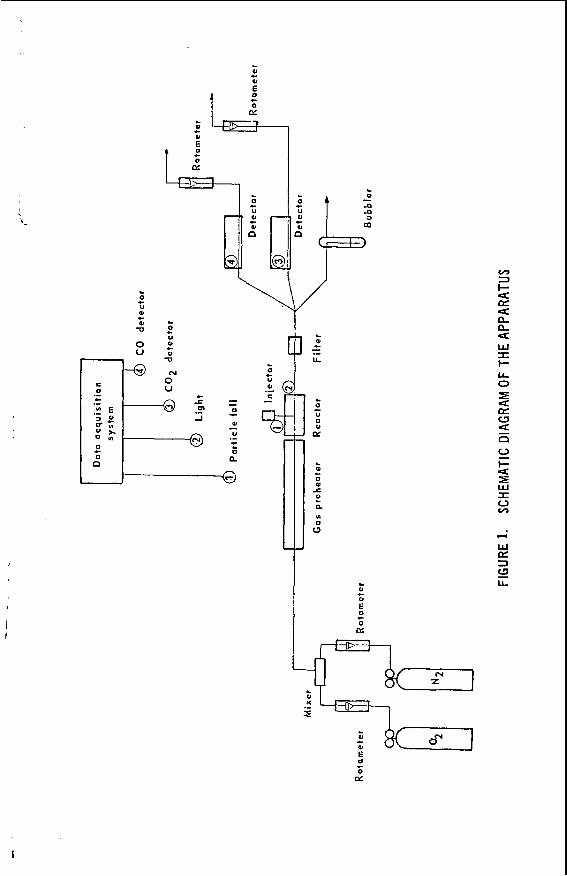
l
L
e 0)
al
c alL m' If: ,
b.
c 0 U al
0 ' c
- 2 0 " u z
i' b.
e al
u. - .-
b.
c 0 U 0 0)
z
L
e al " 0
0 c1:
E c
.-
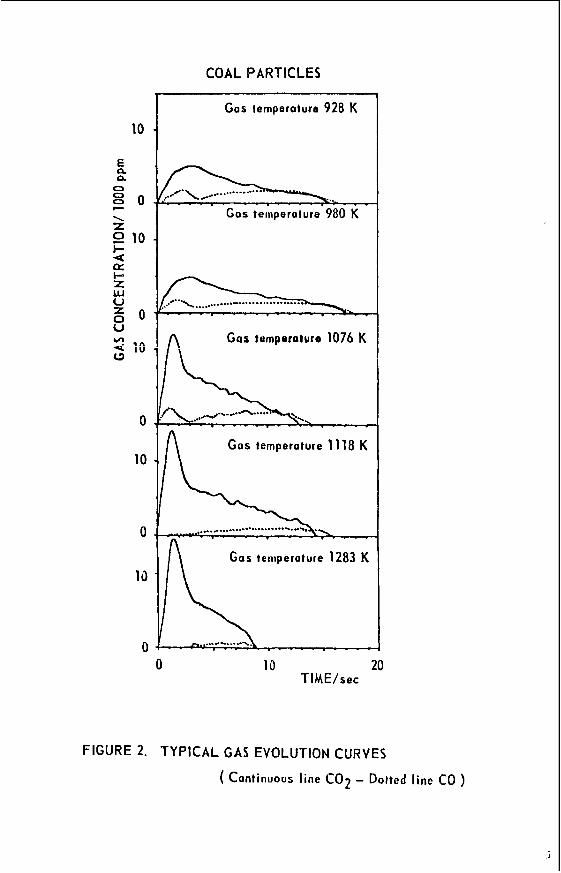
COAL PARTICLES
10
E n 0. 0
P 8 0 \ Z
i- 4 e I- z w 0
u
L1
2 10
5 0 2 i o
0
10
0
13
0 0
Gas temperature 928 K
Gas temperature 980 K
A Gas temperature 1076 K
- . _ . . _ _ _ G a s temperature 11 18 K n
' L
Gas teiiiperature 1283 K
10 20 TIME/sec
FIGURE 2. TYPICAL GAS EVOLUTION CURVES
( Continuous line CO2 - Dotted line CO )
J
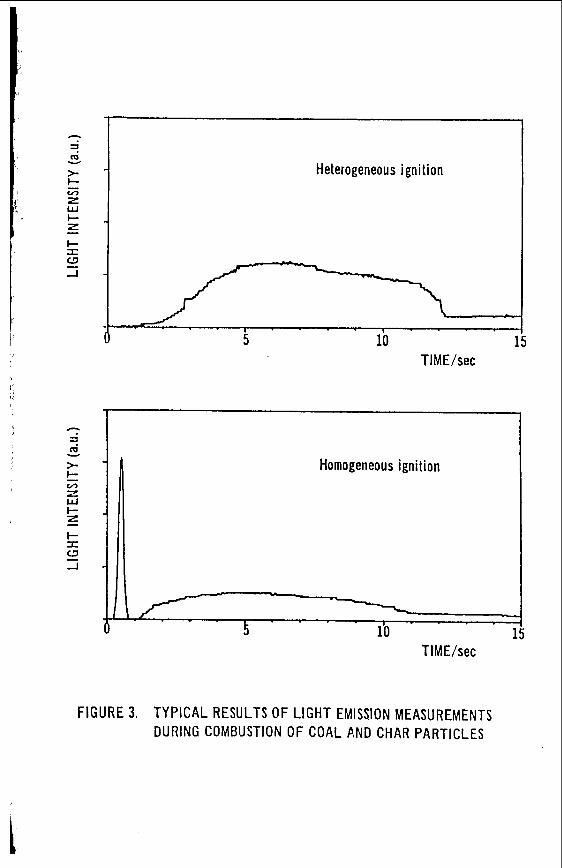
Heterogeneous ignition
1
0 5 10 I
Homogeneous ignition
TIME/sec
TIME/sec
F I G U R E 3. T Y P I C A L RESULTS OF L I G H T EMISSION MEASUREMENTS DURING COMBUSTION OF COAL P,ND CHAR P A R T I C L E S
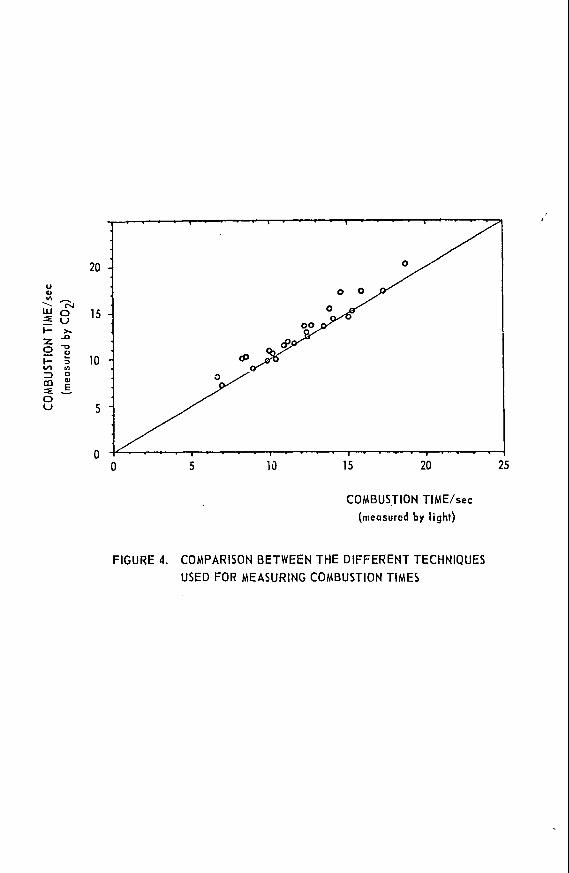
COMBUSTION TIME/sec (measured by light)
FIGURE 4. COMPARISON BETWEEN THE DIFFERENT TECHNIQUES USED FOR MEASURING COMBUSTION TIMES
LITERATURE CITED
Essenigh, R. H . , J. Inst. Fuel, 3, 239 (1961). Essenhigh, R. H., "Chemistry of Coal Utilization, Second Supplementary Volume" (Ed. M. A. Elliot), John Wileyandhns , 1981, Ch. 19. Field, M. A. , Gill, D. W., Morgan, B. B . , and Hawksley, P. G. W., "Combustion Of Pulverized Fuel", British Coal Utilization Research Association, Leatherhead, Surrey, 1967. Mulcahy, M. F. R., and Smith, r. W., Rev. Pure and Appl. Chem., 2, 81 (1962). Annamalai, K., and Durbetaki, P., Combust. Ftalpe, 2, 193 (1977). Bandyopadhyaw, S . , and Bhaduri, D., Combust. Flame, 2, 411 (1972). Baum, M. M., and Street, P. J., Combust. Sci. Technol., 3, 231 (1971). Juniper, D. A., and Wall, T. F., Combust. Flame, 2, 69 (1980).
I
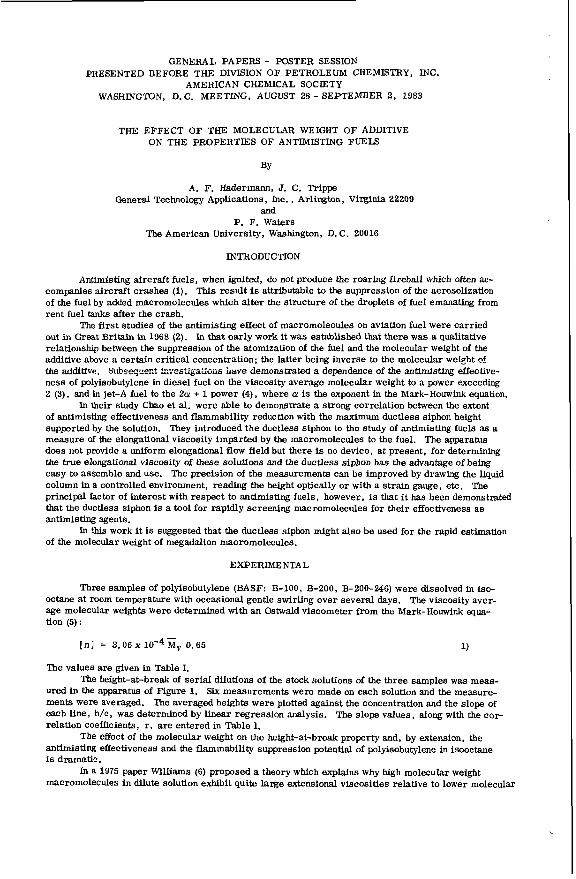
GENERAL PAPERS - POSTER SESSION
AMERICAN CHEMICAL SOCIETY PRESENTED BEFORE THE DIVISION O F PETROLEUM CHEMLSTRY, INC.
WASHINGTON, D.C. MEETING, AUGUST 28 - SEPTEMBER 2, 1983
THE EFFECT O F THE MOLECULAR WEIGHT OF ADDITIVE ON THE PROPERTIES OF ANTIMISTING FUELS
BY
A. F. Hadermann, J. C. Trippe General Technology Applications, Inc., Arlington. Virginia 22209
and P. F. Waters
The American University, Washington, D. C. 20016
INTRODUCTION
Antimisting aircraft fuels, when ignited, do not produce the roaring fireball which often ac- companies aircraft crashes (1). This result is attributable to the suppression of the aerosolization of the fuel by added macromolecules which alter the structure of the droplets of fuel emanating from rent fuel tanks after the crash.
The first studies of the antimisting effect of macromolecules on aviation fuel were carried out in Great Britain in 1968 (2). In that early work it was established that there was a qualitative relationship between the suppression of the atomization of the fuel and the molecular weight of the additive above a certain critical concentration; the latter being inverse to the molecular weisht nt the additive. S l l h s e q ~ m t k~~~'&-~t&iii~ have demonstrated a dependence of the antimisting effective- ness of polyisobutylene in diesel fuel on the viscosity average molecular weight to a power exceeding 2 (3), and in jet-A fuel to the 2a! + 1 power (4), where a! is the exponent in the Mark-Houwink equation.
of antimisting effectiveness and flammability reduction with the maximum ductless siphon height supported by the solution. They introduced the ductless siphon to the study of antimisting fuels as a measure of the elongational viscosity imparted by the macromolecules to the fuel. The apparatus does not provide a uniform elongational flow field but there is no device, a t present, for determining the true elongational viscosity of these solutions and the ductless siphon bas the advantage of being easy to assemble and use. The precision of the measurements can be improved by drawing the liquid column in a controlled environment, reading the height optically or with a strain gauge, etc. The principal factor of interest with respect to antimisting fuels, however, is that i t bas been demonstrated that the ductless siphon is a tool for rapidly screening macromolecules for their effectiveness as antimisting agents.
of the molecular weight of megadalton macromolecules.
In their study Chao et al. were able to demonstrate a strong correlation between the extent
In this work i t is suggested that the ductless siphon might also be used for the rapid estimation
EXPERIMENTAL
Three samples of polyisobutylene (BASF: B-100, B-200, B-200-246) were dissolved in is+ octane at room temperature with occasional gentle swirling over several days. The viscosity aver- age molecular weights were determined with a n Ostwald viscometer from the Mark-Houwink equa- tion (5) :
1n1 = 3.06x10⁻⁴Mv 0.65 1)
The values are given in Table I. The height-at-break of seriaI dilutions of the stock SOIU~~O~S of the three samples was meas-
ured in the apparatus of Figure 1. Six measurements were made on each solution and the measure- ments were averaged. The averaged heights were plotted against the concentration and the slope of each line, h/c, was determined by linear regression analysis. The slope values, along with the c o p relation coefficients, r, a re entered in Table I.
antimisting effectiveness and the flammability suppression potential of polyisobuwlene in isooctane is dramatic.
In a 1975 paper Williams (6) proposed a theory which explains why high molecular weight macromolecules in dilute solution exhibit quite large extensional viscosities relative to lower molecular
The effect of the molecular weight on the height-at-break property and, by extension, the
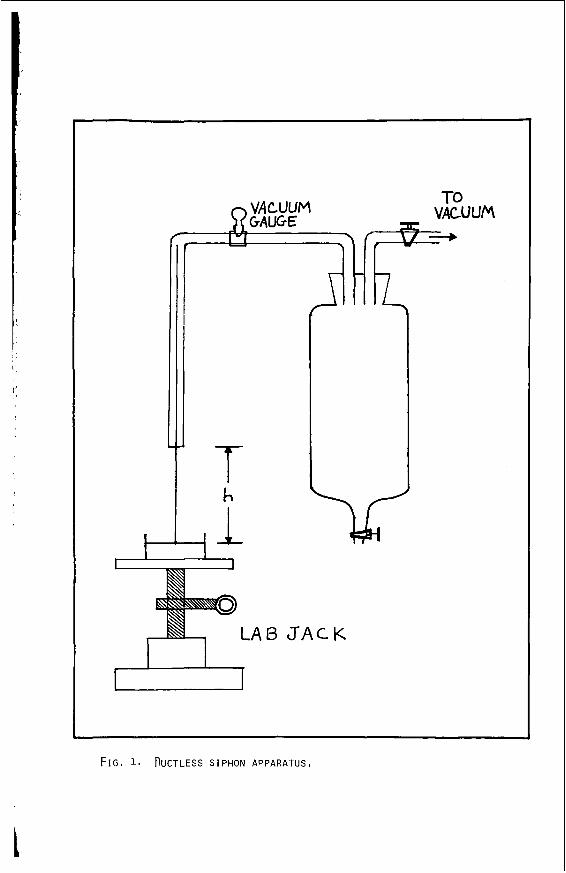
t
3
-
h
-1 1
LA B J A c K
F I G I 1. nUCTLESS S I PHON APPARATUS,
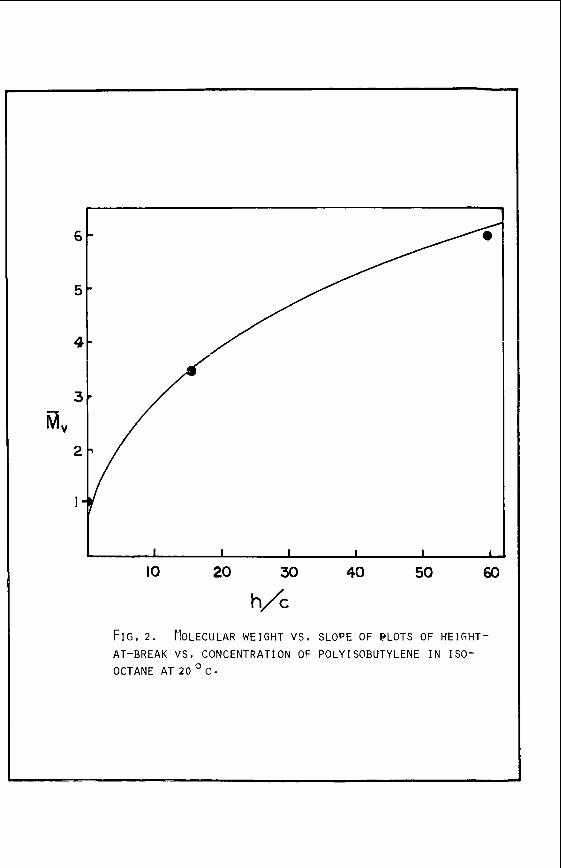
IO 20 30 40 50 60
FIG, 2 . FOLECULAR WEIGHT vs , SLOPE OF BLOTS OF HEIGHT-
AT-BREAK V S , CONCENTRATION OF POLYISOBUTYLENE I N ISO- OCTANE AT 20 C -
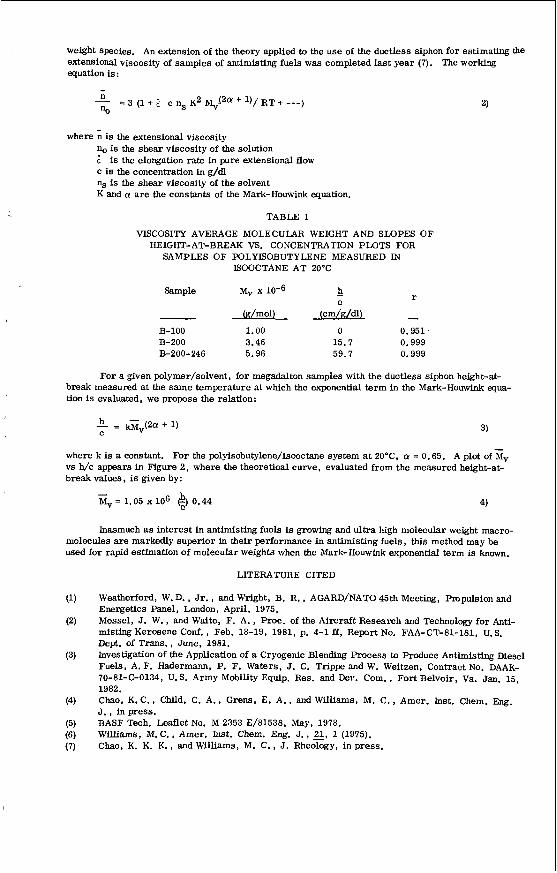
weight Species. An extension of the theory applied to the use of the ductless siphon for estimating the extensional viscosity of samples of antimisting fuels was completed last year (7). The working equation is :
where n is the extensional viscosity "0 is the shear viscosity of the solution e is the elongation rate in pure extensional flow c is the concentration in g/dl ns is the shear viscosity of the solvent K and a are the constants of the Mark-Houwink equation.
TABLE I
VISCOSITY AVERAGE MOLECULAR WEIGHT AND SLOPES OF HEIGHT-AT-BREAK VS. CONCENTRATION PLOTS FOR
SAMPLES OF POLYISOBUTYLENE MEASURED IN ISOOCTANE AT 20°C
h Sample Mv x loa6 - r C
(g/mol) (cm/g/dl) - B-100 1.00 0 0.951. B-200 3.46 15.7 0.999 B-200-246 5.96 59.7 0.999
For a given polymer/solvent, for megadalton samples with the ductless siphon height-at- break measured at the same temperature at which the exponential term in the Mark-Houwink equa- tion is evaluated, we propose the relation:
where k is a constant. For the polyisobutylene/isooctane system at 20°C, (Y = 0.65. A plot of Gv vs h/c appears in Figure 2, where the theoretical curve, evaluated from the measured height-at- break values, is given by:
- M, = 1.05 x lo6 e) 0.44 4)
Inasmuch as interest in antimisting fuels is growing and ultra high molecular weight macro- molecules are markedly superior in their performance in antimisting fuels, this method may be used for rapid estimation of molecular weights when the Mark-ffouwink exponential term is hown.
LITERATURE CITED
(1)
(2)
Weatherford, W. D. , Jr. , and Wright, B. R., AGARD/NATO 45th Meeting, Pmpulsion and Energetics Panel, London, April, 1975. Mossel, J. W., and Waite, F. A. , Roc. of the Aircraft Research md Technology for Anti- misting Kerosene Conf., Feb. 18-19, 1981, p. 4-1 f f , Report No. FAA-CT-81-181, U.S. Dept. of Trans., June, 1981. Investigatlon of the Application of a Cryogenic Blending Process to Roduce Antimisting Diesel Fuels, A. F. Hadermann, P. F. Waters, J. C. Trippe and W. Weitzen, Contract No. DAAK-
(3)
70-81-00134, U.S. Army Mobility Equip. Res. and Dev. Com. , Fort Belvoir, Va. Jan. 15, 1982. chao, K.C., Child, C. A., Grens, E. A., and Wil l iams , M. C., Amer. Inst. Chem. Eng. J., in press. BASF Tech. Leaflet No. M 2353 E/81538, May, 1978. williams, M.C., Amer. Inst. Chem. Eng. J., 21, l(1975). Chao, K. K. K., and Williams, M. c. I J. Rheology, in Press.
(4)
(5) (6) (7)
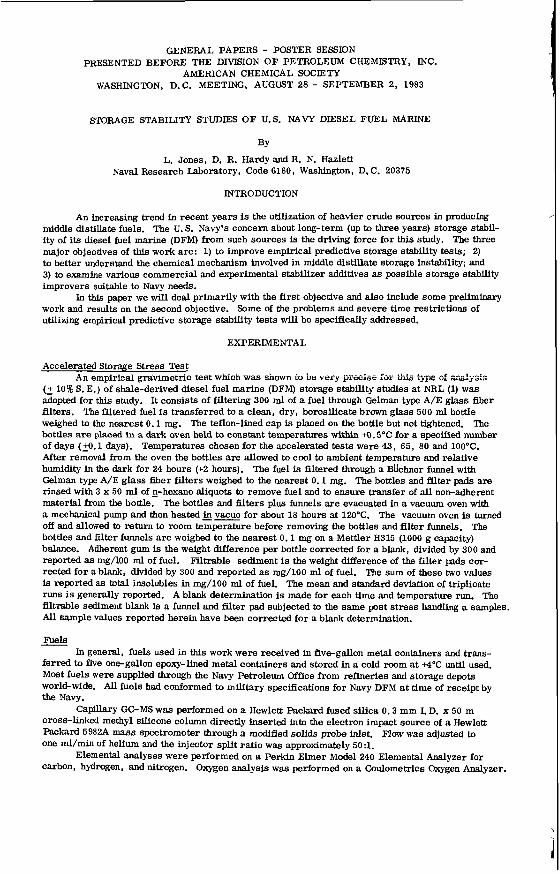
GENERAL PAPERS - POSTER SESSION PRESENTED BEFORE THE DIVISION OF PETROLEUM CHEMISTRY, INC.
AMERICAN CHEMICAL SOCIETY WASHINGTON, D.C. MEETING, AUGUST 28 - SEPTEMBER 2, 1983
STORAGE STABILITY STUDIES OF U.S. NAVY DIESEL FUEL MARINE
BY
L. Jones, D. R. HardyandR. N. Hazlett Naval Research Laboratory, Code 6180, Washington, D.C. 20375
INTRODUCTION
An increasing trend in recent years is the utilization of heavier crude sources in producing middle distillate fuels. The U. S. Navy's concern about long-term (up to three years) storage stabil- ity of its diesel fuel marine (DFM) from such sources is the driving force for this study. The three major objectives of tllis work are: 1) to improve empirical predictive storage stability tests; 2) to better understand the chemical mechanism involved in middle distillate storage instability; and 3) to examine various commercial and experimental stabilizer additives as possible storage stability improvers suitable to Navy needs.
In this paper we will deal primarily with the first objective and also include some preliminary work and results on the second objective. Some of the problems and severe time restrictions of utilizing empirical predictive storage stability tests will be specifically addressed.
EXPERIMENTAL
Accelerated Storage Stress Test
(2 10% S. E.) of shale-derived diesel fuel marine (DFM) storage stability studies at NRL (1) was adopted for this study. It consists of filtering 300 ml of a fuel through Gelman type A/E glass fiber filters. The filtered fuel is transferred to a clean, dry, borosilicate brawn glass 500 ml bottle weighed to the nearest 0.1 mg. The teflon-lined cap is placed on the bottle but not tightened. bottles are placed in a dark oven held to constant temperatures within +O. 5°C for a specified number of days (3.1 days). Temperatures chosen for the accelerated tests were 43, 65, 80 and 1OO'C. After removal from the oven the bottles are allowed to cool to ambient temperature and relative humidity in the dark for 24 hours (+2 hours). The fuel is filtered through a BUchner funnel with Gelman type A/E glass fiber filters weighed to the nearest 0 . 1 mg. The bottles and filter pads are rinsed with 3 x 50 ml of "hexane aliquota to remove fuel and to ensure transfer of all non-adherent material from the bottle. The bottles and filters plus funnels a re evacuated in a vacuum oven with a mechanical pump and then heated in vacuo for about 18 hours at 120°C. The vacuum oven is turned off and allowed to return to room temperature before removing the bottles and filter funnels. The bottles and filter funnels are weighed to the nearest 0.1 mg on a Mettler H315 (1000 g capacity) balance. Adherent gum is the weight difference per bottle corrected for a blank, divided by 300 and reported as mg/lOo ml of fuel. Filtrable sediment is the weight difference of the filter pads cor- rected for a blank, divided by 300 and reported as mg/lOO ml of fuel. The sum of these two values is reported as total insolubles in m g / l O O ml of fuel. The mean and standard deviation of tripiicate runs is generally reported. A blank determination is made for each time and temperature run. The filtrable sediment blank is a funnel and filter pad subjected to the same post stress handling a samples. All sample values reported herein have been corrected for a blank determination.
Fuels In general, fuels used in this work were received in five-gallon metal containers and trans-
fer& to five one-gallon epoxy-lined metal containers and stored in a cold room at HOC until used. Most fuels were supplied through the Navy Petroleum Office from refineries and storage depots world-wide. All fuels had conformed to military specifications for Navy DFM a t time of receipt by the Navy.
Capillary GCMS was performed on a Hewlett Packard fused silica 0.3 mm I. D. x 50 m c r o s s - h k d methyl silicone column directly inserted into the electron impact source of a Hewlett Packad 5982A mass spectrometer through a modified solids probe inlet. Flow was adjusted to one ml/min of helium and the injector split ratio was approximately 50:l.
carbon, hydrogen, and nitrogen. Oxygen analysis was performed on a Coulometrics Oxygen Analyzer.
An empirical gravimetric test which was shown iu Le very p r ~ i s e fcc L&i~ tj-fi 6: -ys!s
The
-
Elemental analyses were performed on a Perkin Elmer Model 240 Elemental Analyzer for
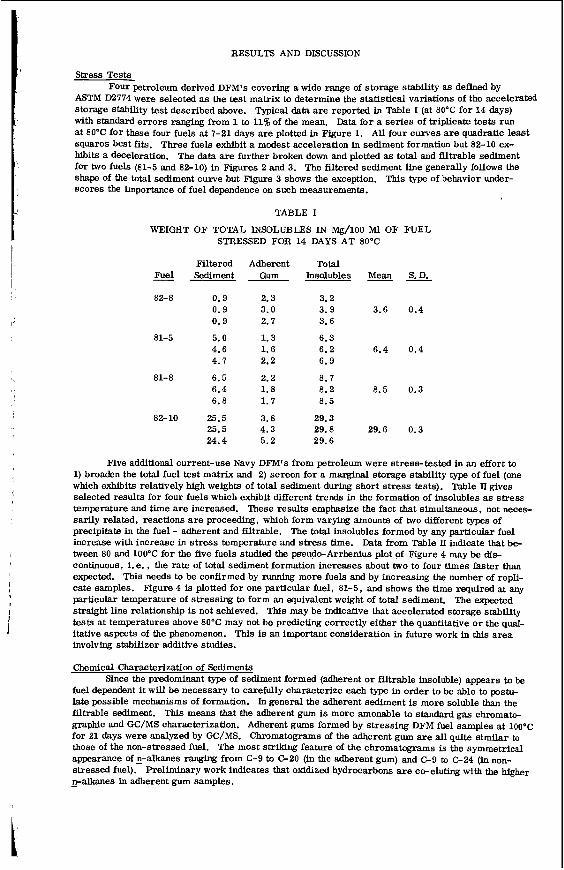
1'
, .
RESULTS AND DISCUSSION
Stress Tests Four petroleum derived DFM's covering a wide range of storage stability as defined by
ASTM D2774 were selected as the test matrix to determine the statistical variations of the accelerated Storage stability test described above. Typical data are reported in Table I (at 80°C for 14 days) with standard errors ranging from 1 to 11% of the mean. Data for a series of triplicate tests run at 80°C for these four fuels a t 7-21 days are plotted in Figure 1. All four curves are quadratic least squares best fits. Three fuels exhibit a modest acceleration in sediment formation but 82-10 ex- hibits a deceleration. The data are further broken down and plotted as total and filtrable sediment for two fuels (81-5 and 82-10) in Figures 2 and 3. The filtered sediment line generally follows the shape of the total sediment curve but Figure 3 shows the exception. This type of behavior under- scores the importance of fuel dependence on such measurements.
TABLE I
WEIGHT OF TOTAL INSOLUBLES IN Mg/lOO Ml OF FUEL STRESSED FOR 14 DAYS AT 80°C
Filtered Adherent Total Fuel Sediment Gum Insolubles Mean S.D.
82-8 0.9 2.3 3.2 0.9 3.0 3.9 3.6 0.4 0.9 2.7 3.6
81-5 5.0 1.3 6.3 4.6 1.6 6.2 6.4 0.4 4.7 2.2 6.9
81-8 6.5 2.2 8.7 6.4 1.8 8.2 8.5 0.3 6.8 1.7 8.5
82-10 25.5 3.8 29.3 25.5 4.3 29.8 29.6 0.3 24.4 5.2 29.6
Five additional current-use Navy DFM's from petroleum were stress-tested in an effort to 1) broaden the total fuel test matrix and 2) screen for a marginal storage stability type of fuel (one which exhibits relatively high weights of total sediment during short stress tests). Table II gives selected results for four fuels which exhibit different trends in the formation of insolubles a s stress temperature and time are increased. These results emphasize the fact that simultaneous, not neces- sarily related, reactions are proceeding, which form varying amounts of two different types of precipitate in the fuel - adherent and filtrable. The total insolubles formed by any particular fuel increase with increase in stress temperature and stress time. Data from Table II indicate that be- tween 80 and 100°C for the five fuels studied the pseudeArrhenius plot of Figure 4 may be dis- continuous, i. e. , the rate of total sediment formation increases about two to four times faster than expected. This needs to be confirmed by running more fuels and by increasing the number of repli- cate samples. Figure 4 is plotted for one particular fuel, 81-5, and shows the time required at any particular temperature of stressing to form an equivalent weight of total sediment. The expected straight line relationship is not achieved. This may be indicative that accelerated storage stability tests at temperatures above 80°C may not be predicting correctly either the quantitative or the qual- itative aspects of the phenomenon. This is an important consideration in future work in this area involving stabilizer additive studies.
Chemical Characterization of Sediments
fuel dependent i t will be necessary to carefully characterize each type in order to be able to postu- late possible mechanisms of formation. In general the adherent sediment is more soluble than the filtrable sediment. This means that the adherent gum is more amenable to standard gas ch romab graphic and GC/MS characterization. Adherent gums formed by stressing DFM fuel samples at loooc for 21 days were analyzed by GC/MS. Chromatograms of the adherent gum are all quite similar to those of the non-stressed fuel. The most striking feature of the chromatograms is the symmetrical appearance of E-alkanes ranging from C-9 to C 2 0 (in the adherent gum) and C 9 to C24 (in non- stressed fuel). Preliminary work indicates that oxidized hydrocarbons a re co-eluting with the h&her - n-alkanes in adherent gum samples.
Since the predominant type of Sediment formed (adherent or filtrable insoluble) appears to be
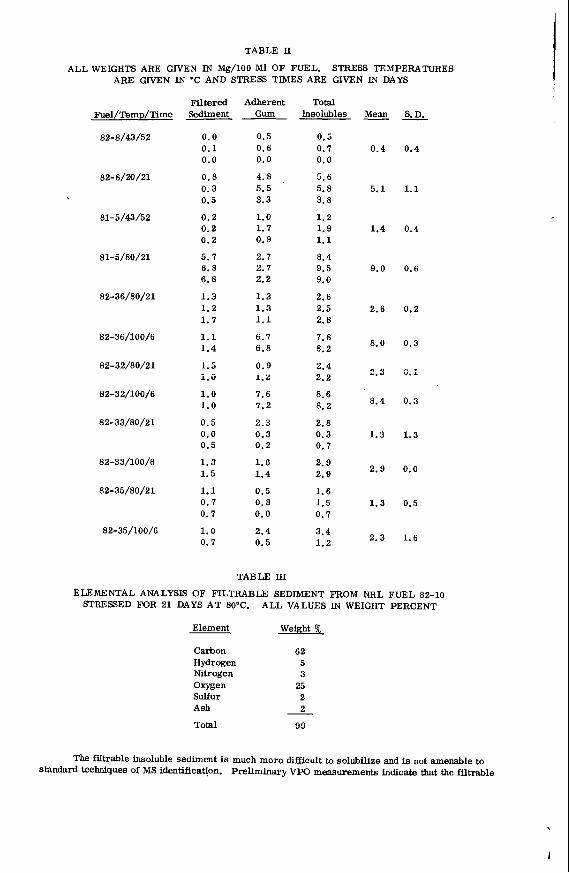
TABLE II
ALL WEIGHTS ARE GIVEN IN Mg/lOO M1 OF FUEL, STRESS TEMPERATURES ARE GIVEN IN "C AND STRESS TIMES ARE GIVEN IN DAYS
Fuel/Temp/Time
82-8/43/52
82-8/20/21
81-5/43/52
81-5/80/21
82-36/80/21
82-36/100/6
82-32/80/21
82-32/100/6
82-33/80/21
82-33/100/6
82-35/80/21
82-35/100/6
Filtered Adherent Sediment Gum --
0.0 0.1 0.0
0.8 0.3 0.5
0.2 0.2 0.2
5.7 6.8 6.8
1.3 1.2 1.7
1.1 1.4
1.5 i. 0
1.0 1.0
0.5 0.0 0.5
1.3 1.5
1.1 0.7 0.7
1.0 0.7
0.5 0.6 0.0
4.8 . 5.5 3.3
1.0 1.7 0.9
2.7 2.7 2.2
1.3 1.3 1.1
6.7 6.8
0.9 i. B
7.6 7.2
2.3 0.3 0.2
1.6 1.4
0.5 0.8 0.0
2.4 0.5
TABLE III
Total Insolubles
0.5 0.7 0.0
5.6 5.8 3.8
1.2 1.9 1.1
8.4 9.5 9.0
2.6 2.5 2.8
7.8 8.2
2.4 2.2
8.6 8.2
2.8 0.3 0.7
2.9 2.9
1.6 1.5 0.7
3.4 1.2
Mean
0.4
5.1
1.4
9.0
2.6
8.0
- 9 1."
8.4
1.3
2.9
1.3
2.3
s. D. -
0.4
1.1
0.4
0.6
0.2
0.3
n . W. I
0.3
1.3
0.0
0.5
1.6
ELEMENTAL ANALYSIS OF FILTRABLE SEDIMENT FROM NRL FUEL 82-10 STRESSED FOR 21 DAYS AT 80°C. ALL VALUES IN WEIGHT PERCENT
Element Weight %
Carbon 62 Hydrogen 5 Nitrogen 3 Oxygen 25 Sulfur 2 Ash 2
Total 99
The filtrable insoluble sediment is much more difficult to solubilize and is not amenable to standard techniques of MS identification. Preliminary VPO measurements indicate that the filtrable
0 rl I
N m
m m m I I 1
m m m r ( N r(
82
19 co
__)_I__- _+ __t_. .. __
5
si V I .
ez
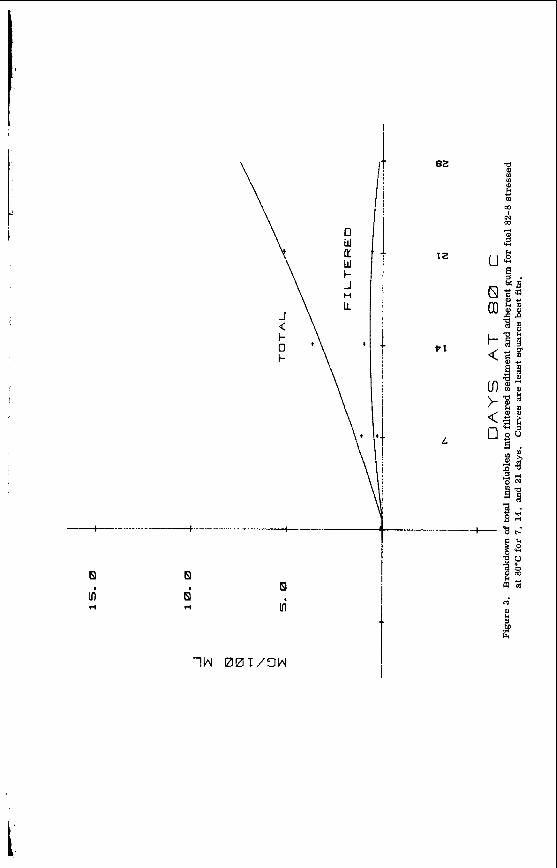
B
vi d
El
6 d
El vi
81
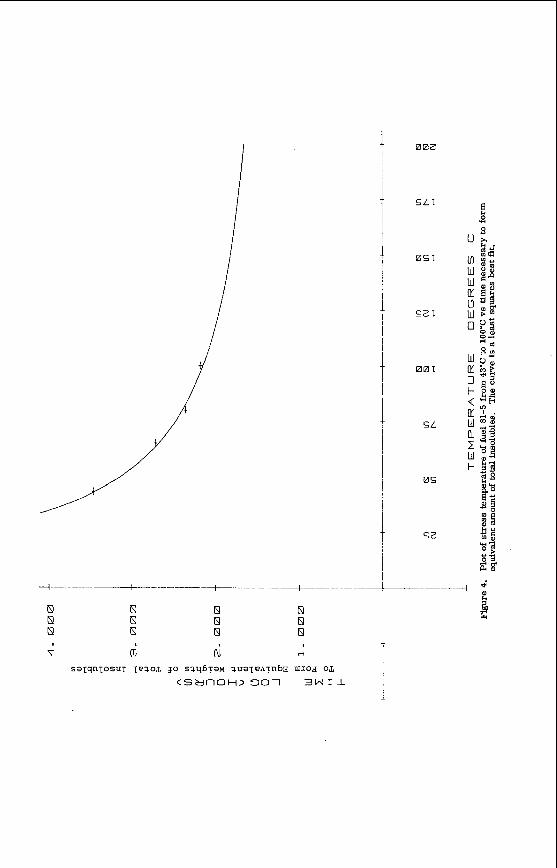
B B B
B B B
N B B
002
S L T
0s 1
sz 1
00 I
S L
0s
sz
insoluble sediment is of higher molecular weight (up to 1500 mu). A typical elemental analysts for filtrable sediment of 82-10 (a particularly unstable DFM) is given in Table La. Oxygen has been directly determined by coulometric measurements. The high heteroatom content is typical for this type of s e h e n t (2). Six major components of a filtered sediment extract in hot THF have been isolated by gas chromatography. Filtered sediments a re usually insoluble in most organic solvents. Further analysis of the major fuel degradation components will establish the identity of the reactive species in fuels.
LITERATURE CITED
(1) Hazlett, R. N., Cooney, J. V. , and Bed , E. J. , First Annual Report, Sept. 15, 1981- Spt . 30, 1982, NRL;Washington, D. C., to be published by USDOE under contract
Nixon, A. C. , "Autoxidation and Antioxidants of Petroleum", Chapter 17 in "Autoxidation and Antioxidants", W. 0. Lundberg, Ed., John Wiley, New York, 1962.
DE-AI-19- 81BC10525. (2)
I
c
GENERAL PAPERS - POSTER SESSION PRESENTED BEFORE THE DIVISION OF PETROLEUM CHEMISTRY, INC.
AMERICAN CHEMICAL SOCIETY WASHINGTON, D.C. MEETING, AUGUST 28 - SEPTEMBER 2, 1983
RADIOACTIVE (I4C) TRACER STUDIES OF METHANOL CONVERSION OVER A Ni-ZSM-5 ZEOLITE
BY
F. S. Hwu* and J. W. Hightower Department of Chemical Engineering, Rice University, Houston, Texas 77251
LNTRODUCTION
within the last few years, researchers at the Mobil Research and Development Corporation (1) have synthesized a novel zeolite catalyst, ZSM-5, which is capable of converting oxygenates, e.g. , methanol, into aliphatics and aromatic hydrocarbons in the gasoline boiling range. Since tech- nology exists for making methanol from coal-derived synthesis gas (2), this new process provides an additional source of chemical feedstocks and transportation fuels.
compounds have been identified (3,4). The major hydrocarbon products can be classified into three categories: olefins, paraffins, and aromatics. There is a strong possibility that some of these products, once formed, react further to produce other products. The objective of this research was to investigate this possibility by labeling some of the products and following the transfer of the label to other products.
In the conversion of methanol to hydrocarbons over such catalysts, more than 100 different
The reaction is thought to follow the sequence
Methanol ,* Mr;eSlyi elher > C2 - C5 Olefins Paraffins and Aromatics +BZO
The interconversion of methanol anddimethyl etherover such catalysts has been confirmed in several studies (5,6). At very low conversion of methanol, dimethyl ether is the major product, and the tramformation of methanol into dimethyl ether is 20 to 30 times faster than hydrocarbon formation (6). On the other hand, when dimethyl ether is the starting material, both methanol and hydrocarbons a re formed readily (5,6). The intermediate role of dimethyl ether was also confirmed by wing a 13CH3- 0-13CH3 tracer technique (6).
carried out reactions of C2, C3, and C4 olefins over ZSM-5 catalysts and observed similar aromatic product distributions from both methanol and all the olefins. Therefore, they concluded that light olefins were intarmediates of methanol conversion to gasoline boiling range products.
This research was aimed at identifying some of the major reactions involved in the overall methanol reaction. A 14Clabeled tracer technique was developed to explore the roles played by the various species, including olefins, paraffins, and aromatics. The results a r e described herein.
The roles played by the lightweight olefins were investigated by Dejaifve et al. (7). They
EXPERIMENTAL
Catalyst
tories. This material was in the sodium form and was calcined for 2 hours a t 600'C. It was then soaked in a solution of ammonium nitrate (9 wt%) for. another 2 hours with constant agitation. After the resulting NHq-ZSM-5 had been washed and filtered, it was impregnated with a solution of 0.0439 g nickel acetate/g of dry zeolite and then heated until dry at 120°C. This impregnated Ni-ZSM-5 cata- lyst was subsequently blended with alumina, which served a s a binder, in the proportion 0.3 g alum- ina/g ZSM-5. A l l catalysts used for these reaction studies were pelletized, crushed, and screened to 30/40 mesh.
Chemicals Methanol (99.99% purity) was obtained from Fisher Scientific Company. The radioactive
compounds, along with their suppliers, a re shown in Table I. Both chemical and radiochemical purities of each were checked by the radio-gas chromatograph described later. Since the methanol,
The original ZSM-5 catalyst was prepared at the Exxon Research and Development Labora-
*Present address: Department of Mechanical Engineering, University of Texas, Arlington, Texas 76019.
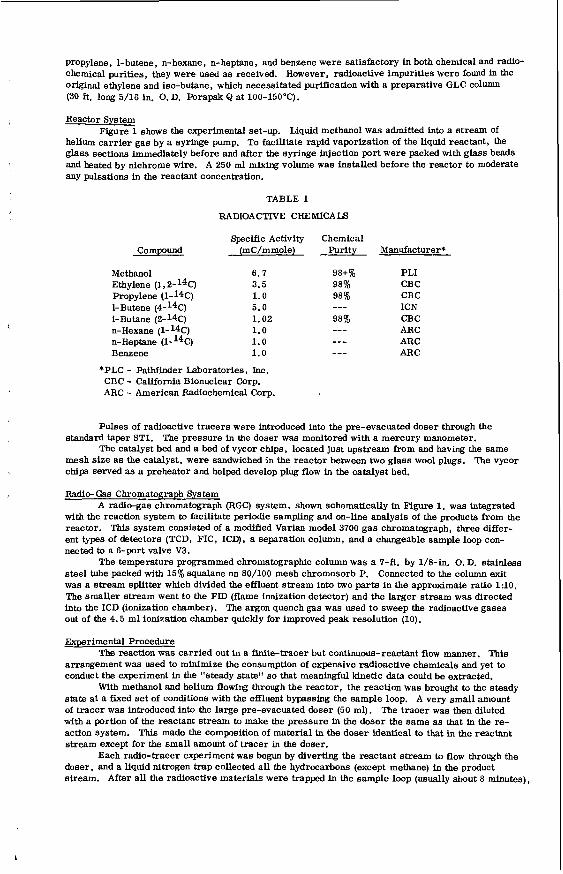
Propylene, 1-butene, n-hexane, n-heptane, and benzene were satisfactory in both chemical and radio- chemical purities, they were used a s received. However, radioactive impurities were found in the odginal ethylene and iso-butane, which necessitated purification with a preparative GLC co~Umn (30 ft. long 5/18 in. 0. D. Porapak Q at 100-150°C).
Reactor System
helium carr ier gas by a syringe pump. To facilitate rapid vaporization of the liquid reactant, the glass sections immediately before and after the syringe injection port were packed with glass beads and heated by nichrorne wire. A 250 ml mixing volume was installed before the reactor to moderate any pulsations in the reactant concentration.
Figure 1 shows the experimental set-up. Liquid methanol was admitted into a stream of
TABLE I
RADIOACTIVE CHEMICALS
Specific Activity Chemical Compound (mC/mmole) Purity Manufacturer*
Methanol Ethylene (1,2-14C) Propylene (1-14c) 1-Butene (4-14C) I-Butane (2-14C) n-Hexane ( 1 - w ) n-Heptane (l-14C) Benzene
6.7 3.5 1 .0 5.0 1.02 1.0 1.0 1.0
PLI CBC CBC ICN CBC ARC ARC ARC
*PLC - Pathfinder Laboratories, Inc. CBC - California Bionuclear Corp. ARC - American Radiochemical Corp.
Pulses of radioactive tracers were introduced into the pre-evacuated doser through the
The catalyst bed and a bed of vycor chips, located just upstream from and having the same standard taper ST1. The pressure in the doser was monitored with a mercury manometer.
mesh size a s the catalyst, were sandwiched in the reactor between two glass wool plugs. The vycor chips served a s a preheater and helped develop plug flow in the catalyst bed.
Radio-Gas Chromatograph System A radio-gas chromatograph (FlGC) system, shown schematically in Figure 1 , was integrated
with the reaction system to facilitate periodic sampling and on-line analysis of the products from the reactor. This system consisted of a modified Varian model 3700 gas chromatograph, three differ- ent types of detectors (TCD, FIC, ICD), a separation column, and a changeable sample loop con- nected to a 6-port valve V3.
steel tube packed with 15% squalane on SO/lOO mesh chromosorb P. Connected to the column exit was a stream splitter which divided the effluent stream into two parts in the approximate ratio 1 : l O . The smaller stream went to the FLD (flame ionization detector) and the larger stream was directed into the ICD (ionization chamber). The argon quench gas was used to sweep the radioactive gases out of the 4.5 ml ionization chamber quickly for improved peak resolution (10).
Experimental Procedure The reaction was carried out in a finite-tracer but continuous-reactant flow manner. This
arrangement was used to minimize the consumption of expensive radioactive chemicals and yet to conduct the experiment in the "steady state" so that meaningful Idnetic data could be extracted.
state a t a fixed set of conditions with the effluent bypassing the sample loop. A very small amount of tracer was introduced into the large pre-evacuated doser (50 ml). The tracer was then diluted with a portion of the reactant stream to make the pressure in the doser the same a s that in the re- action system. This made the composition of material in the doser identical to that in the reactant stream except for the small amount of tracer in the doser.
doser, and a liquid nitrogen trap collected all the hydrocarbons (except methane) in the product stream. After all the radioactive materials were trapped in the sample loop (usually about 8 minutes),
The temperature programmed chromatographic column was a 7-ft. by 1/8-in. 0. D. stainless
With methanol and helium flowing through the reactor, the reaction was brought to the steady
Each radio-tracer experiment was begun by diverting the reactant stream to flow through the
the sampling valve was returned to its original position, the liquid nitrogen dewar flask was removed, and the p ' d u c t s were flashed into the GLC column. the FD, and the radioactivity i n each peak was measured by the ICD.
The amount of each product was monitored on
The specific activfty A i in each of the analyzed peaks was calculated by the following equation:
(Radioactivity in product i, mC)
Moles of product i Ai 5 petal radioactivity in all hydrocarbon products, mC)
Total moles of hydrocarbon products
RESULTS
Different types of l4C-labeled tracers -- olefins (ethylene, propylene, 1-butene, paraffins (iso-butane, "-hexane, "-heptane), and aromatics (benzene) -- w e r e used to investigate the roles timt these several species play in the overall methanol-to-hydrocarbon reaction.
h dl experiments, the reaction was carried out over 100 mg of the Ni-ZSM-5 catalyst a t 368°C and 1 atm total pressure. The partial pressure of methanol in the inlet stream was 0.05 atm, and the space time 't was 218 rag cat. sec/cm3-STP. Other reaction conditions for each experiment a r e given in Table 11.
TABLE I1
REACTION CONDITIONS FOR TRACERS
Ethylene Propylene 1-Butene i-Butane n-Hexane n-Heptane Benzene
Amount Addcc! 0.51 0.76 0.76 1.14 2.53 2.53 1.03
( p o l e )
Radio- activity 1.79 0.76 0.10 1.16 0.10 0.10 0.30
(Hc)
Partial pressure of methanol - 0.05 atm 7 (Space time) - 218 mg cak sec/cm3-STP Reactor temperature - 368°C
Table JII lists the specific activity A i for all the products (or groups of products) when the olefins, ethylene, propylene, and 1-butene, were used as tracers. For propylene and 1-butene, the radioactivity was almost uniformly spread among all the products, even including the compound ini- tially labeled. However, for ethylene less than 50%of the radioactivity was incorporatbd into other products with the majority remaining in the ethylene. For this reason, the radioactivity in the ethyl- ene was excluded from the normalization of the radioactivity in each of the products. In other words, the distribution of radioactivity among the various products was based only on the ethylene that re- *, and not on the total radioactive ethylene admitted.
TABLE JII
RADIOACTIVITY DISTRIBUTION AMONG HYDROCARBON PRODUCTS
Specific Activity in hoducts Tracer a & C& Q+ Toluene Xylenes
c2Hq ----* 1.29 1.03 1.43 1.00 2.18 1.62
c3H6 0.39 1.15 1.00 1.38 0.95 2.27 1.81
I - C ~ H ~ 0.35 0.91 1.35 1.52 1.18 2.06 1.64
*Since more than 50% of the added radioactivity remained in the ethylene, its radioactivity was not included in calculating the specific activity of the other products. Thus, the specific activities given a r e based only on the ethylene that reacted, not the amount added.
The paraffins were much less reactive than the olefins. For example, in the runs with is- butane a s the tracer, essentially no radioactivity was found in any reaction products other than in the iso-butane. Wheng-hexane and"-heptane were used a s tracers, most (ca. 80% of the radioactivity
remained in the starting labeled tracer compound. There was a small amount of radioactivity in the C2 to C4 &&tics. Significantly, no radioactivity was detected in the aromatic products.
When labeled benzene was used as a tracer, no radioactivity was found in any of the products except certain aromatics, i. e. there was no measurable radioactivity in the aliphatics. The major- ity (52% of the radioactivity remained in the benzene. Considerable radioactivity was in the toluene (263, followed by @+*-xylene (184&), ?xylene (3%), and trimethylbenzene (1%). Since the products contained about 6 times a s much @+@-xylene as =-xylene, the "specific activity" for these
factor of 3.4) than the xylenes, while trimethylbenzene had less (about 0.2) relative to the xylenes. i dimethyl ammatics must be the same. Toluene had a higher specific activity (approximately by a
Olefin Tracers
labeled ethylene, propylene, or 1-butene were used a s tracers clearly indicates that these three The observation of radioactivity in all the hydrocarbons from methanol conversion when [!
light olefins play i e r y -hnportant roles in the overall methanol-to-hydrocarbon reaction. Especially, the results have verified that even ethylene is involved in the reactions (as postulated by Dejaifve e t al. (7) and suspected by Anderson et al. (8)), although ethylene is much less active than are the larger olefins.
radioactivity in itself than occurred with the labeled propylene and 1-butene, we suggest that the de- sorption Of ethylene is faster than its reactive chemisorption. Moreover, the appearance of radio- active propylene from the initial ethylene tracer supports the claim that the surface reaction of chemisorbed ethylene with methanol is relatively fast. Such a facile reaction of surface ethylene with methanol and/or dimethyl ether, viewed a s an autocatalytic step, has been described by Chen and Reagan (9).
of the same order of magnitude. This strongly suggests that the formation of aliphatics proceeds mainly via a C1 step addition, o r more specifically through alkylation with methanol or dimethyl ether.
and in the C2 - C3 aliphatics when 1-butene was the tracer implies that these small olefins a re not cracked substantially but a r e rather incorporated into higher molecular weight products. These larger hydrocarbons may then be cracked into lower molecular weight compounds.
Similar specific radioactivities were found in both toluene and in the xylenes, regardless of which olefinic tracer was used. This observation illustrates the common role played by these light olefins in the formation of aromatics during methanol conversion of the Ni-ZSM-5 catalyst. Further- more, since the specific radioactivities in the aromatics a r e 1.5 to 2.0 times greater than those in the C3 and C4 products, it is reasonable to infer that a major pathway of toluene and xylene forma- tion is the reaction between one C3 and one C4 or two C4 species. This conclusion was also drawn by Derouane and co-workers (7).
In view of the lower reactivity of gaseous ethylene a s evidenced by the retention of much more
The data in Table III show that specific radioactivities of C2, C3, C4, and C5 aliphatics a r e
The detection of much less specific radioactivity in the C2 diphatics from the propylene tracer
Paraffin Tracers
that 14C-tagged iso-butane retains essentially @J i ts radioactivity within itself among the hydrocar- bon products shows that neither isomerization of butanes nor alkylation of iso-butane with prevailing olefins is occurring at 368°C.
dominate over their straight-chain counterparts (5,8). The same was obsented with our Ni-ZSM-5 catalyst. In general, this is consistent with thermodynamic equilibrium (the methyl paraffins a r e more stable than the corresponding straight chain molecules), except for the butanes. At 368°C thermodynamics predicts tbat ;-butane is more stable than iso-butane (57% vs. 43%. Since these two paraffins a r e not interconverted under reaction conditions, they a r e probably formed mainly by hydrogen transfer to the respective "butenes or iso-butene.
Aromatic Tracers Benzene is a very thermodynamically stable compound. However, its low concentration among
the reaction products causes one to question its function in the overall methanol conversion reactions. The radioactivity distribution among the aromatic products when benzene was used a s a tracer re- veals that alkylation of benzene to form toluene, the xylenes, and trimethylbenzene is a major route for their formation.
Benzene may be alkylated with methanol or with dimethyl ether to produce toluene, which in turn reacts with more methanol o r ether molecules to form first the xylenes and then the trimethyl- benzenes. This is consistent with the specific activity ratio following the order toluene > xylenes >
Paraffins a r e relatively stable final products in the methanol conversion system. The fact
In methanol conversion over ZSM-5-trpe zeolites, monomethyl paraffins and olefins pre-
t
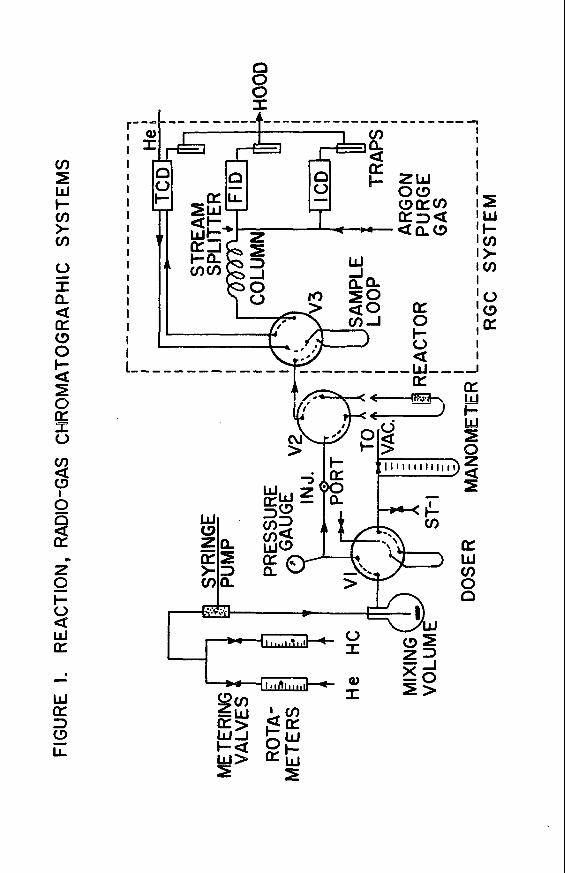
r- I I I I I I I I I I I I I I I I I I 1,
0 0 0 I
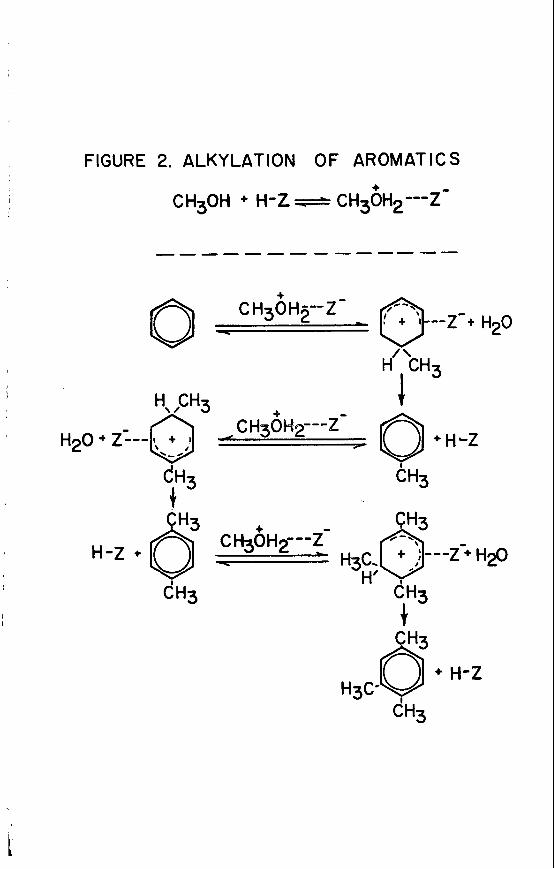
FIGURE 2. ALKYLATION OF AROMATICS + -
CH30H + H-Z CH3OH2---Z
CH3
i
trimethylbenzenes when benzene was used a s the tracer. It is worth noting that the role played by benzene in the formation of alkylated benzenes is quite
similar to that of ethylene in the production of higher aliphatics. AS observed for the ethylene tracer, 14C-labeled benzene retains most of its radioactivity intact, again indicating that reactive chemisorption is relatively slow. However, the formation of radioactive toluene suggests that the surface reaction of the chemisorbed benzene with methanol o r dimethyl ether occurs readily. These results also seem to point out that the nature of this reaction is autocatalytic, a s proposed by Chen and Reagan (9) for ethylene reaction with methanol or dimethyl ether to account for the low concentration of ethylene in the product.
proposed for the formation of alkylated benzenes from benzene a s indicated in Figure 2. In light of the acidic properties of the ZSM-5 catalyst, a carbenium ion mechanism can be
CONCLUSIONS
Through the use of 14C-labeled t racer compounds, some important secondary reactions have been identified in the overall conversion of methanol to hydrocarbons over a Ni-ZSM-5 catalyst. The major €indings are:
formation of larger olefins with one more carbon atom.
olefins, i. e. , ones having the same carbon skeleton.
stable products; isomerization among paraffin isomers does not take place at 368°C.
aromatics formation.
benzene and subsequent alkylated benzenes.
1. The alkylation of light olefins with methanol o r dimethyl ether is a major pathway for the
2. Paraffins a r e mainly produced by hydrogen transfer reactions to their corresponding
3. Except for minor cracking reactions, paraffins with up to a t least 7 C atoms a r e final
4. Light olefins, e.g. , ethylene, propylene, and butenes, a r e reactive intermediates for
5. Aromatic compounds can also be produced by methanol- or di-methyl ether-alkylation of
APKNOWLE DGMENTS
The authors a r e grateful to Dr. H. E. Robson at the W o n Research and Developmeni W s for providing a sample of the ZSM-5 zeolite and to the Robert A. Welch Foundation and Haldor Topsoe A/S (Denmark) for financial support.
LITERATURE CITED
Meisel, S. L. , McCullough, J. P., Lechthaler, C. H., and Weisz, P. B., Chem. Technol., 6, 86 (1976). Danner, C. A., ed. "Methanol Technology and Economics", Chem. Eng. Progr. Symp. Ser. No. 2, 66 (1970). Stockinger, J. H., J. Chromatographic Sci., 15, 198 (1977). Bloch, M. G., Callen, R. B., and Stockinger, J. H . , J. Chromatography Sci., 5, 504 (1977). Chang, C. D., and Silvestri, A. J., J. Catal., 9, 249 (1977). Perot, G., Cormerais, F., and Guisnet, M., J. Chem. Res. (S), 58 (1982). Dejaifve, P., Vedrine, J. C., Bolis, V., and Derouane, E. G., J. Catal., 3, 331 (1980). Anderson, J. R., Foger, K., Mole, T., Rajadhyaksha, R. A., andSanders, J. V., J. Catal., 58, 114 (1979). Chen, N. Y., and Reagan, W. J., J. Catal., 59, 123 (1979). Hwu, F. S., "Conversion of Methanol and Light Olefins to Gasoline over a Shape Selective Catalyst, ZSM-5", Ph. D. Dissertation, Rice University, 1981. Stull, D. R . , Westrum, E. F., and Sinke, G. C., "The Chemical Therm@ynamics of Organic Compounds", John Wiley and Sons, 1969.
GENERAL PAPERS - POSTER SESSION
AMERICAN CHEMICAL SOCIETY WASHINGTON, D. C. MEETING, AUGUST 28 - SEPTEMBER 2, 1983
PRESENTED BEFORE THE DIVISION OF PETROLEUM C H E M ~ T R Y , INC.
NATURAL GAS BASED TECHNOLOGIES AS REVEALED IN POSSIBLE NEW ZEAIAND ENERGY PROGRAMS
BY
P. Jawetz Independent Consultant on policy, 415 East 64th Street, New York, New York 10021
INTRODUCTION
New Zealand is an exporter of commodities and thus completely dependent on world market conditions. Its large resources of hydro-electricity, forests, natural gas and fish give i t the possi- bility of industrializing. US $ 1,052 per head of population - just about a s high a s the per capita debt of Argentina - a coun- try mentioned when the world banking system started to worry about possible defaults. In the words of Foreign Minister Warren Cooper before the U. N. General Assembly on October 6, 1982 - "As a small trading nation, New Zealand is acutely sensitive to fluctuations in the health of our major trading partners. New Zealand is classed a s a developed country, but we share many of the problems of developing countries".
New Zealand has no oil resources and when the country was hit by the Energy Crisis i t de- cided to develop the gas fields a t Kapuni and a t Maui in the Taranaki province (in the western part of the North Island) in order to collect associated liquid condensates. The gas was first used to fire electrical plants and later readied for reticulation via pipelines in the Northern bland. Eventually, when the condensate became so much more valuable than the gas - despite its quantity being much smaller - it actually led to flaring the gas to waste in order to obtain the condensate. A "takeor- pay" system was negotiated under which the government is contracted to take a given amount of gas per year from the producing partnership. Assuming that future oil prices will r ise only a few per- cent per year in real terms and performing a standard Discount Cash Flow analysis with a 10% discount rate, the conclusion reached was that there was a higher financial value to be obtained from using the condensate - leading to a zero value for the gas and to a financial justification for flaring it. O n the other hand, the gas could be used 1) for reticulation, 2) for promoting a CNG industry (compressed natural gas) or 3) for use in petrochemical industries to produce chemicals o r further liquid fuels. Following this logic, and attempting to produce the least change in the transportation system, the New Zealand Ministry of Energy went along with a plan to produce synthetic gasoline from what was then seemingly unwanted gas.
The present paper argues that it would be rather to the long range advantage of New Zealand for the Government to stop at the methanol stage and use methanol a s a new liquid fuel in addition to CNG motor fuel rather than go all the way to produce the synthetic gasoline from natural gas.
The off-shore debt on March 31, 1982, stood at US $ 3 , 2 6 3 million or about
A MJSUSED INNOVATION
Mobil Research and Development Corporavon laboratories in Paulsboro, New Jersey, de- veloped spongy, shape-selective catalysts to promote a reaction that transforms alcohol into hydro- carbons by excising water molecules. The catalysts are different pore sized aluminum silicates o r clays called zeolites (the Greek word for boiling stones - this because the ancient Greeks observed that certain stones when thrown into fire appeared to boil, thus indicating that the interior structure was hollow enough to contain water and that the pore openings were large enough to allow the water to escape). ZSM-5 is a synthetic zeolite whose uniform pore size and shape is such that when treated in a Mobil-developed process will make possible the chemical reactions involved in the elimination of water molecules from the methanol feedstock. (Z stands for Zeolite; S stands for Socony, and M stands for Mobil a s 7tsoCony" o r Standard Oil Company of New York was an old name for todayis Mobil Oil; 5 is a key for the class of the catalyst.)
When producing the hydrocarbons we define a s synthetic gasoline, the catalytic process con- sumes 10-15% of the energy content in the methanol feedstock (1) but what should be remembered as equally important is that half of the volume of the liquid feedstock is lost when the water molecules a re eliminated. Then, depending on haw the fuels a r e used, if the energy content as measured in calorimetric units does not express accurately the work yield of the fuel vehicle engine, o r if dif- ferent fuels show different efficiencies when used in the same engine, the fact that we have lost half
the volume m y lead to serious differences in work yield. In other words, reducing the liquid fuel volume of the methanol to approximately one half in order to form the twice higher energy-content synthetic gasoline wastes advantages the alcohol has had per energy unit. This is where the most serious inefficiencies of the Mobil MTG (methanol-to-gasoline) process a re incurred - more 80 than in the energy loss of the process itself (2).
The methanol for the Mobil process can be obtained by passing synthetic gas produced from coal over a copper catalyst or starting with natural gas. Mobil Oil has no proprietory technology for the production of methanol and in New Zealand it will be using an I. C. I. process and 40% of the natural gas feedstock energy content will be lost a t this stage. The Mobil ZSM-5 catalyst's com- peting technology is a ZnClg process that was also looked into by the New Zealanders when making their decision (3). To be sure, one does not expect difficulties in upscaling the Mobil MTG process from the four-barrels-a-day pilot unit in Paulsboro, New Jersey to the 13,000-14,000 b.p.d. plant a t Motunui, New Zealand, and when completed the plant will most probably deliver a s planned but then one could reasonably expect that besides not allowing for a maximum gain to New Zealand from the available natural gas resource, the influx of synthetic gasoline will create an amazing s t ress on the one and only petroleum refinery in New Zealand that will have to continue to operate on imported crude in order to provide the needed diesel fuel, leading to a future when New Zealand will probably have to import expensive petroleum crude and export cheap gasoline. New Zealand will be left in the process totally dependent on petroleum or "Petroleum-alike" fuels while losing the opportunity i t had to move away from petroleum systems by using the natural gas a s an entry to a gas and alcc- hol future to make the two New Zealand islands energy independent indeed. This goal c m o t be achieved by providing fuels to existing systems, but rather by adapting ita fuel uses to fuels avail- able locally i. e. change ita motor vehicle fleets to CNG and methanol cars and opening the future, by establishing now the appropriate end use to biogas, synthetic natural gas from coal, methanol from coal or peat and ethanol from biomass.
New Zealand in answer to i ts energy needs was destined to experiment with new energy de- velopment but i t seemingly chose to stay with the old instead of going the way of true innovation. New Zealand. thanks to its g e ~ a p h p cz? gc it z!cnc. Zy act h V i u g to worry about cross-border traffic it can isolate itself by going CNG and methanol before the rest of us do so (3).
THE PETROLEUM REFINERY
Petroleum refinery design is dictated by the needs of a relatively small number of products, e.g., gasoline, jet fuel, diesel fuel, fuel oil. It is generally recognized that the most important part of any refinery is its gasoline manufacturing facility. A s the demand for gasoline increased, more and more of the lighter kerosene components were included in gasoline but the maximum suit- able portion depended on the kind of crude oil and rarely exceeded 20%. As such, methods more and more complicated were developed to obtain further products that could be blended into the original gasoline fraction. The customary processing in a refinery is thus no more a fractionation process producing relatively pure hydrocarbons, but rather a very complicated system with flows into a general pool of products - the gasoline produced being a mixture of ingredients with different eco- nomic costs. Gasoline blending is thus the combining of components to make up the liquid defined by a given set of properties that enable i t to be a fuel in a motor vehicle internal-combustion engine. One of the most important properties that must be satisfied is the required octane value. To produce higher octane ingredients that when blended with the f i rs t run low octane product, higher temperatures in cracking processes have to be employed. This more severe and energy intensive process, besides being more costly, a s it requires higher energy inputs, also creates less valuable by-products - the upshot being that the economics of production a t the refinery change. Furthermore, with the requirement to eliminate the octane boosting tetra-ethyl lead from the gasoline formulation because of environmental reasons some refineries, in most cases the smaller refineries, do not even pos- sess some of the needed equipment for these processes.
gasoline's octane number by one point (that is the average over motor octane and research octane). With 10% of the alcohol the average octane value is improved by about 3 pin ta and with 20% of the alcohol 5 mints improvement of the average octane value is achieved. Detailed calculation for sav- ings in petroleum crude, when using alcohol octane boosting additives to gasoline, were presented before the Mrst European Communities Conference on Energy from Biomass (4-6). To recapiMate here - i t was found that each Btu of ethanol used this way replaces 3.55 Btu of gasoline o r one liter of ethanol replaces at least 2.5 liters of gasoline. Following a similar path one can calculate that when us- 5% methanol as an additive to gasoline each Btu of methanol used this way replaces 4 Btu of gasoline or one liter of methanol replaces a t least 2 liters of gasoline.
In order to calculate the effective energy balance (in the use a s well a s in the production of the alcohol) the above values have to be multiplied with the energy balance in the manufacture of the alcohol. For the case of biomass ethanol, using a factor calculated by Professor Melvin Calvin - 1.76 each Btu used a s energy input in fertilizers, agricultural machinery or distillation equipment
Both methanol and ethanol when added a t about 3% to low octane gasoline wi l l enhance the
end UP displacing 6.6 Btu of petroleum origin when the ethanol is used a s an octane boosting additive to gasoline. When the ethanol is used instead as a fuel in an ethanol driven engine (no gasoline in- volved) in the effective use of the ethanol the potential gain at the refinery is lost. Also, the Btu content of the engine fuel that in the mixture is decreased only by about 3% will be decreased now by rather 30% while the octane value of the fuel has been increased in the ethanol-alone case to a value higher than required by an unchanged engine. It is expected thus to decrease from the above calculated advantages for the case of the mixed fuels to net gains of only about 20% above the Btu content of the fuel; each liter of ethanol used replaces now only about 0.8 liters of gasoline and each liter of methanol used replaces only 0 .6 liters of gasoline - this leading to higher savings in terms of petroleum resources, but also for economics much more difficult. This alternative becomes a possibility when political decision is taken to avoid dependence on petroleum crude. When mention- ing alcohol-gasoline mixtures, despite the favorable results of the Brazilian program and many other programs, i. e. , in the U. S. , West Germany, South Africa, when a New Zealand journalist visited the Mobil Oil Paulsboro facility he was cautioned against such blends "as liable to cause too many technical and distribution problems". Considering that a second plant in New Zealand was built to produce methanol for export - this in a world market that is already saturated with methanol produc- tion capacity - Mobil that is already expected to supply one third of New Zealand's need for gasoline in 1985 suggests to use the additional output of methanol in its Motunui plant (7) thus resulting in production of synthetic gasoline equal to over 50% of what could reasonably by expected to be the New Zealand need for gasoline by a conventional motor-vehicle fleet. Interestingly Shell and B. P. , the other corporate partners of the New Zealand refining corporation, did not agree to participate in the Mobil Oil project.
POLICY ISSUES
The Marsden Point refinery used, in 1981, 2,300,000 tonnes of crude oil and 440,000 tonnes of gas condensate and produced 1,236,000 tonnes gasoline and 665,000 tonnes of diesel. After the expenditure of over 1 billion for expansion and for building a hydrocracker, the refinery will use 2,884,000 tonnes of crude and 816,000 tonnes of condensate in order to produce 1,050,000 tonnes of gasoline, 430,000 tonnes of aviation fuel, and 1,125,000 tonnes of diesel. This change at the refinery will also double the refinery fue l loss from 165,000 tonnedyear to 330,000 tonnes/year.
On March 31, 1980, New Zealand Motor Vehicle licenses amounted to 1,283,661 passenger cars , 3,134 taxicabs, 3,397 buses and coaches, 176,692 trucks under 2 tonnes, 76,872 trucks Over 2 tomes. When including all other vehicles such as motorcycles, and motor homes, a grand total of 2,157,516 motor vehicles were licensed. New registrations for the year 1981 amounted to a total of 114,842 cars , the majority of which were assembled in New Zealand from parts imported mainly from Japan (73%. Other important countries of origin were the U.K. with 13.6% and Australia with 11.1%. A l l other countries of origin, including the U. S. , amounted to only 2.3% (nevertheless, when analyzing the manufacturing companies i t is clear that Ford and General Motors a re well repre- sented, mainly through their Australian and U.K. affiliates, amounting to about 30%).
Two of the motor vehicle assembly corporations were responsible for over 21,000 vehicles each while four other corporations were in the 10,000-18,000 range. Thus it is reasonable t o assume that a corporation that may not even produce a CNG o r methanol car for i ts own home market may find it advantageous to send such kits to the New Zealand assembly plant. In effect it would just take the cooperation of two such corporations in order to embark on a slow process of changing the motor vehicle fuels system gradually. The funds for such changes could then easily be found from the $1.5 billion that could be saved by eliminating some changes at the refinery and by eliminating the methanol-to-gasoline stage a t the Motunui plant (8).
It is preferable to go to dedicated vehicles - vehicles that were originally built for non- petroleum fuels use - rather than convert vehicles that were originally built to use gasoline fuels. Such conversions, for the CNG case, leave the vehicle with an undesirable seriously decreased trunk space.
CONCLUSIONS
The Mobil MTG process, to be employed in New Zealand, is being scaled up from the Mobil O i l Paulsboro operation to what could be a commercial size plant. Nevertheless, the economics in the New Zealand case a re such that this operation can only prove the technical aspects of the plant but not the economics - the New Zealand economics being figured out on the basis of a practical give-away of the natural gas.
Furthermore, New Zealand being a se t of two islands with very little traffic from the out- side, could have switched to a transportation system based on CNG and methanol with an intermediary stage that uses the existing Whangarei refinery, without changes, and methanol for an octane en- hancer. Such a policy besides having environmental benefits is economically sounder in the long range as 1) it allows for a much larger energy efficiency for the natural gas resource and 2) it prepares
the economy to an eventual switch to other sources of fuel gas and alcohols. New Zealand has large potential for the production of biomass and has a s well coal and peat deposits that will even- tually form the basis for an industrialization of the South Island. The elimination of the dependence on a petroleum system and the development of an indigenous industry a re , reasonably, the real long range interests of New Zealand.
What was said here is in no way an expression of doubt in the technical feasibility of the Mobil MTG process. It is highly possible that for other countries, and in other objective circum- stances, this process can be applied in accordance with national interests. Such circumstances could be envisioned for example for the case a country cannot isolate itself when its roads a re being used or by cars originating in areas that would not participate in a policy of switching from petroleum fuels.
LITERATURE CITED
"Energy Research Reports", ER Publications Inc., P. 0. Box 157, Watertown, MA 02172, U.S.A. (a) December 11, 1978; @) October 29, 1979. Jawetz, P. , "Relative Economics of Alcohol Octane Boosting Additives to Gasoline, Alcohol Fueled Cars, and Synthetic Gasoline from Alcohol". pean Communities Conference, A. Strub, P. Chartier, G. Schlesser, editors, Applied Science Publishers, London, 1983. Jawetz, P. , "Natural Gas Based Energy Systems - How New Zealand Decided to Act Not In Its Own Best Interest", Monograph No. 83-Pet-28 (1983). The American Society of Mechan- ical Engineers, 345 E. 47th St., New York, N, Y. 10017. Jawetz, Pi , "The Economics of Improving Octane Values of Gasoline with Alcohol Additives", Palz, W., Chartier, P . , and Hall, D.O., editors, "EnergyfromBiomass", Applied Science Fublications, London 1981. Jawetz, P. , "Alcohol Additives to Gasoline - An Economic Way for Extending Supplies of Fuels and for Increasing Octane Rations", PREPRINTS, Div. of Petrol. Chem., ACS, - 24, 198 (1979). Jawetz, P., PREPRINTS, Div. of Petrol. Chem., ACS, 25 (1). 99 (1980). New Zealand Press Association correspondent, "The Press", Christchurch, March 18, 1983. Peace, D. J. , Technical Officer for the Aucklmd Gas Association, in submission for "The Environmental Impact Audit Synthetic Petrol Plant", Volume II, April 20, 1981.
Energy from Biomass, Second Euro-
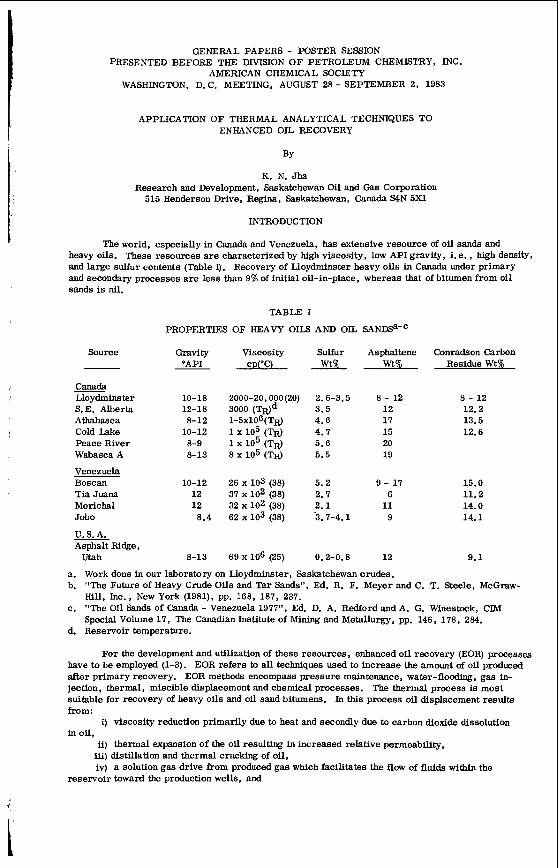
GENERAL PAPERS - FOSTER SESSION PRESENTED BEFORE THE DIVISION OF PETROLEUM CHEMBTRY, INC.
AMERICAN CHEMICAL SOCIETY WASHINGTON, D. C. MEETING, AUGUST 28 - SEPTEMBER 2, 1983
APPLICATION OF THERMAL ANALYTICAL TECHNIQUES TO ENHANCED OIL RECOVERY
BY
K. N. Jha Research and Development, Saskatchewan Oil and Gas Corporation 515 Henderson Drive, Regina, Saskatchewan, Canada SQN 5x1
INTRODUCTION
The world, especially in Canada and Venezuela, has extensive resource of oil sands and heavy oils. These resources are characterized by high viscosity, low API gravity, i. e. , high density, and large sulfur contents (Table I). Recovery of Lloydminster heavy oils in Canada under primary and secondary processes a r e less than 9% of initial oil-in-place, whereas that of bitumen from oil sands is nil.
TABLE I
PROPERTIES OF HEAVY OILS AND OIL SANDSa-'
Source Gravity Viscosity Sulfur Asphaltene Conradson Carbon "API CP('C) Wt% Wt% Residue Wt%
Lloydminster 10-18 2000-20,000(20) 2.6-3.5 8 - 12 8 - 12 S.E. Alberta 12-18 3000 (Wd 3.5 12 12.2
Peace River 8-9 l x lo5 (TR) 5.6 20
Athabasca 8-12 1-5~106(TR) 4.6 17 13.5 Cold Lake 10-12 i x 105 (TR) 4.7 15 12.6
Wabasca A 8-13 a x 105 (TR) 5.5 19
Tia Juana 12 37x102 (38) 2.7 6 11.2
Venezuela Boscan 10-12 26 x 103 (38) 5.2 9 - 17 15.0
Morichal 12 32x102 (38) 2.1 11 14.0 Job0 8.4 62 x lo3 (38) 3.7-4.1 9 14.1
U. S. A. Asphalt Ridge,
Utah 8-13 69 x lo6 (25) 0.2-0.8 12 9.1
a. Work done in our laboratory on Lloydminster, Saskatchewan crudes. b. "The Future of Heavy Crude Oils and Tar Sands", Ed. R. F. Meyer and C. T. Steele, McGraw-
Hill, Inc., New York (1981), pp. 168, 187, 237. c. "The Oil Sands of Canada - Venezuela 1977", Ed. D. A. Redford and A. G. Winestock, ClM
Special Volume 17, The Canadian Institute of Mining and Metallurgy, pp. 146, 178, 284. d. Reservoir temperature.
For the development and utilization of these resources, enhanced oil recovery (EOR) processes have to be employed (1-3). EOR refers to all techniques used to increase the amount of oil produced after primary recovery. EOR methods encompass pressure maintenance, water-flooding, gas in- jection, thermal, miscible displacement and chemical processes. The thermal process is most suitable for recovery of heavy oils and oil sand bitumens. In this process oil displacement results from:
in oil, i) viscosity reduction primarily due to heat and secondly due to carbon dioxide dissolution
ii) thermal expansion of the oil resulting in increased relative permeability, iii) distillation and thermal cracking of oil, iv) a solution gas drive from produced gas which facilitates the flow of fluids within the
reservoir toward the production wells, and
1
I
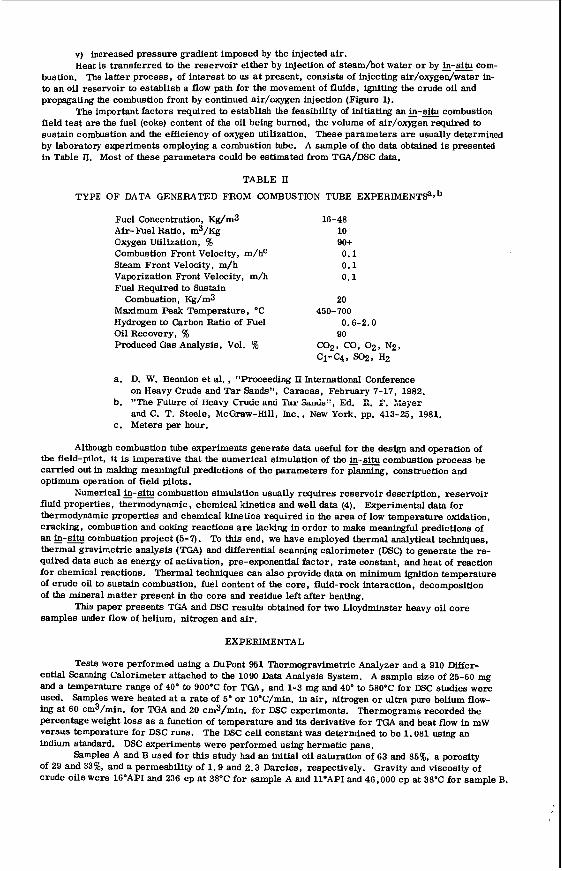
v) increased pressure gradient imposed by the injected air . Heat is transferred to the reservoir either by injection of steam/hot water or by &-e com-
bustion. The latter process, of interest to u s at present, consists of injecting air/oxygen/water in- to an oil reservoir to establish a flow path for the movement of fluids, igniting the crude oil and propagating the combustion front by continued aidoxygen injection (Figure 1).
field test are the fuel (coke) content of the oil being burned, the volume of air/oxygen required to sustain combustion and the efflciency of oxygen utilization. These parameters a r e usually determined by laboratory experiments employing a combustion tube. A sample of the data obtained is presented in Table ll. Most of these parameters could be estimated from TGA/DSC data.
The important factors required to establish the feasibility of initiating an &-E& combustion
TABLE II
TYPE OF DATA GENERATED FROM COMBUSTION TUBE EXPERIMENT^^^ Fuel Concentration, Kg/m3 Air-Fuel Ratio, m3/@ Oxygen Utilization, % Combustion Front Velocity, m/hc Steam Front Velocity, m/h Vaporization Front Velocity, m/b Fuel Required to Sustain
Combustion, @/m3 Maximum Peak Temperature, "C Hydrogen to Carbon Ratio of Fuel OilRecovery, % Produced Gas Analysis, Vol. %
16-48 10. so+ 0.1 0.1 0.1
a. D. W. Bennion e t al., "Proceeding II International Conference on Heavy Crude and Ta r Sands", Caracas, February 7-17, 1982.
b. "The Future oi Heavy Crucie anci Tdiar %an&", Ed. E. F. Xeyer and C. T. Steele, McGraw-Hill, Inc., New York, pp. 413-25, 1981.
c. Meters per hour.
Although combustion tube experiments generate data useful for the design and operation of the field-pilot, it is imperative that the numerical simulation of the &-e combustion process be carried out in making meaningful predictions of the parameters for planning, construction and optimum operation of field pilots.
Numerical &-e combustion simulation usually requires reservoir description, reservoir fluid properties, thermodynamic, chemical kinetics and well data (4). Experimental data for thermodynamic properties and chemical kinetics required in the area of low temperature oxidation, cracking, combustion and coking reactions a r e lacking in order to make meaningful predictions of an &-e combustion project (5-7). To this end, we have employed thermal analytical techniques, thermal gravimetric analysis (TGA) and differential scanning calorimeter (DSC) to generate the re- quiked data such a s energy of activation, pre-exponential factor, rate constant, and heat of reaction for chemical reactions. Thermal techniques can also provide data on minimum ignition temperature of crude oil to sustain combustion, fuel content of the core, fluid-rock interaction, decomposition of the mineral matter present in the core and residue left after heating.
samples under flow of helium, nitrogen and air . This paper presents TGA and DSC results obtained for two Lloydminster heavy oil core
EXPERIMENTAL
Tests were performed using a DuPont 951 Thermogravimetric Analyzer and a 910 Differ- ential Scanning Calorimeter attached to the 1090 Data Analysis System. A sample size of 25-60 mg and a temperature range of 40' to 900°C for TGA, and 1-3 mg and 40" to 58OOC for DSC studies were used. Samples were heated at a rate of 5" o r lO"C/min. in air , nitrogen or ultra pure helium flow- ing at 60 cm3/min. for TGA and 20 cm3/min. for DSC experiments. Thermograms recorded the percentage weight loss as a function of temperature and ita derivative for TGA and heat flow in mW versus temperature for DSC rum. The DSC cell constant was determined to be 1.081 using an indium standard. DSC experiments were performed using hermetic pans.
Samples A and B used for this study had an initial oil saturation of 63 and 85%. a porosity of 29 and 33%, and a permeability of 1.9 and 2.3 Darcies, respectively. Gravity and viscosity of crude oils were 16"API and 236 cp a t 38°C for sample A and 11'API and 46,000 cp at 38OC for sample B.
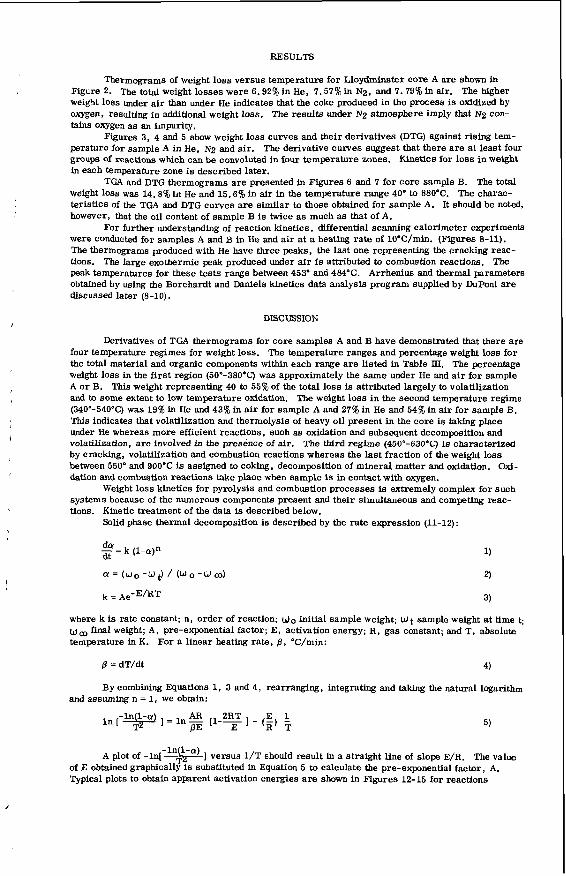
RESULTS
Thermograms of weight loss versus temperature for Lloydminster core A a re shown in Figure 2. The total weight losses were 6.92% in He, 7.57% in Nz, and 7.79% in air. The higher weight loss under a i r than under He indicates that the coke produced in the process is oxidized by oxygen, resulting in additional weight loss. The results under Nz atmosphere imply that N2 con- tains oxygen as an impurity.
Figures 3, 4 and 5 show weight loss curves and their derivatives (DTG) against rising tem- perature for sample A in He, N2 and air. The derivative curves suggest that there a r e a t least four groups of reactions which can be convoluted in four temperature zones. Kinetics for loss i n weight in each temperature zone is described later.
TGA and DTG thermograms a re presented in Figures 6 and 7 for core sample B. The total weight h3s was 14.8% in He and 15.6% in air in the temperature range 40" to 880°C. The charac- teristics of the TGA and DTG curves are similar to those obtained for sample A. It should be noted, however, that the oil content of sample B is twice a s much a s that of A.
For further understanding of reaction kinetics, differential scanning calorimeter experiments were conducted for samples A and E in He and a i r at a heating rate of lO"C/min. (Figures 8-11). The thermograms produced with He have three peaks, the last one representing the cracking reac- tions. The large exothermic peak produced under air is attributed to combustion reactions. The peak temperatures for these tests range between 453" and 484°C. Arrhenius and thermal parameters obtained by using the Borchardt and Daniels kinetics data analysis program supplied by DuPont a r e discussed later (8-10).
DISCUSSION
Derivatives of TGA thermograms for core samples A and B have demonstrated that there are four temperature regimes for weight loss. The temperature ranges and percentage weight loss for the total material and organic components within each range a r e listed in Table III. The percentage weight loss in the first region (5O'-38O0C) was approximately the same under He and a i r for sample A o r B. This weight representing 40 to 55% of the total loss is attributed largely to volatilization and to some extent to low temperature oxidation. The weight loss in the second temperature regime (34Oe-54O4C) was 19% in He and 43% in air for sample A and 27% in He and 54% in air for sample 3. This indicates that volatilization and thermolysis of heavy oil present in the core is taking place under He whereas more efficient reactions, such as oxidation and subsequent decomposition and volatilization, are involved in the presence of air. The third regime (45O0-630'C) is characterized by cracking, volatilization and combustion reactions whereas the last fraction of the weight loss between 550" and 900°C is assigned to coking, decomposition of mineral matter and oxidation. Oxi- dation and combustion reactions take place when sample is in contact with oxygen.
Weight loss kinetics for pyrolysis and combustion processes is extremely complex for such systems because of the numerous components present and their simultaneous and competing reac- tions. Kinetic treatment of the data is described below.
Solid phase thermal decomposition is described by the rate expression (11-12):
where k is rate constant; n, order of reaction; u0 initial sample weight; Wt sample weight a t time t ; (,j temperature in K. For a linear heating rate, f l , "C/min:
final weight; A , pre-exponential factor; E, activation energy; R , gas constant; and T, absolute
f l = dT/dt 4)
By combining Equations 1, 3 and 4 , rearranging, integrating and taking the natural logarithm and assuming n = 1, we obtain:
A plot of -In[-'"$-") ] versus 1/T should result in a straight line of slope E/R. The value of E obtained graphically is substituted in Equation 5 to calculate the pre-exponential factor, A. Typical plots to obtain apparent activation energies a r e shown in Figures 12-15 for reactions
occurring in the four temperature zones for sample A under He flow. Equation 3 is used to estimate rate constant a t any temperature. Values of E, A , and rate
constant at mean temperature for each reaction zone a re presented in Table III.
TABLE III
THEFOUL DECOMPOSITION PARAMETERS FOR LLOYDMINSTER HEAVY OIL CORES
Sample Reaction Temp. wt. LOSS 96 E A 103kmeanb Fuel (Purge Zone Range, "C Total Organica kcal/mol -1 -1 (Coke)
~ d m 3 - A. (He) 1
2 3 4
(N2) 1 2 3 4
(Air) 1 2 3 4
B. (He) 1 2 3 4
(Air) 1 2,s 3,4
50-340 340-475 475-550 550-800
50-360 360-450 450-550 550-900
50-340 340-480 480-550 550-800
50-380 380-500 500-600 600-800
50-380 380-540 540-630
3.01 2.94 4.6 1.25 1.08 20.2 0.69 0.45 49.9 1.62 1.33 18.3
3.09 3.01 4.9 0.89 0.79 29.3 1.18 0.88 36.3 2.32 1.98 14.8
3.17 3.10 4.9 3.26 3.00 23.5 0.62 0.45 45.5 0.48 0.08 14.2
8.10 8.01 6.2 3.90 3.66 35.3 1.15 0.92 46.4 1.52 1.31 21.5
6.85 6.74 6.6 8.32 7.95 39.4 0.22 0.10 29.2
1.3 x 10⁻¹ 3.3 103 2.5 x 10¹¹ 1.5 x lo1 1.3 x 10⁻¹ 5.0 x 10⁶
1.8 3.3 107
1 . 2 x 10⁻¹ 6 . 7 . ~ 104 1.7 x 10¹⁰ 2.5
6.4 x 10⁻¹ 3.8 x 10⁸ 1.0 x 10¹⁰ 1.2 x 10%
8.8 x 10⁻¹ 1 .8 x 109 2.0 x 10⁵
0.92 1.1 3.3 0.91
0.75 1.8 1.8 1.0
0.62 2.0 4 .1 1.3
1.1 5.8 4.8 1.8
1.0 3.2 7.3
)39.2 29.3)
)49.1 28.0) '
a. Contribution from decomposition of mineral matter was subtracted from % total weight loss to get organic weight loss.
b. Mean temperature.
The apparent activation energy obtained for reaction zone 1, E l , varies between 4.6 and 6.6 kcal/mol for samples A and B under He, N2 and air. E1 values being very close to the latent heat of vaporization for hydrocarbons confirms our suggestion that weight loss in this reaction zone is mostly due to volatilization (13). E2 values for sample A range from 20.2 to 29.3 kcal/mol and for sample B 35.3 to 39.4 kcal/mol. These values a r e similar to those reported for thermolysis and oxidation of hydrocarbons and crude oils (14-16). E3 values of 49.9 and 46.4 kcal/mol for sam- ples A and B in He a re larger than 45.5 and 29.2 kcal/mol for A and B, respectively, in air. Cracking reactions under inert environment a r e known to have higher E values than under oxidizing atmosphere (5-6). Etayashitani e t al. have postulated a series of cracking reactions in helium in- volving light oil, heavy oil and asphaltene components in the pyrolysis of bitumen extracted from the Athabasca oil sand (17). Activation energies for cracking reactions reported by them range between 57.4 and 65.2 kcal/mol. Bennion et al. have reported that these values of activation energies were divided by 1.37 to be used in numerical simulation in order to obtain reasonable values of tempera- ture and fuel lay-down (5). These activation energies divided by 1.37 produce an average value of 44.1 kcal/mol which agrees with 49.9 and 45.5 kcal/mol obtained by us for reactions in zone 3 under He atmosphere. This indicates that the results obtained from TGA are more meaningful for use in the numerical simulation than those obtained from pyrolysis experiments in a closed system. Activation energies for reactions in zone 4 ranging between 14.2 and 21.5 kcal/mol a re typical of reactions involving either coke formation or its axidation (6).
The fuel (coke) contents of samples A and B have been determined to check if the minimum amount of fuel required to sustain combustion front is available. Calculation of fuel lay-down was based upon percentage organic loss in He in reaction zone 4 because coke is formed in this region. Since the maximum combustion temperature of the fire front listed in Table I1 ranges between 450" and 700"C, it is expected that for some fireflood tests, weight loss in zone 3 in He will also contribute to fuel lay-down. The fuel content under both scenarios calculated by assuming the density of the sample 2.2 g/cm3 is included in Table III. Estimated fuel content values under either assumption a r e greater than the value required (20 kg/m3) to sustain combustion.
!
J
!
i
Activation energies, pre-exponential factors, ra te constants a t peak temperatures, and heats of reactions obtained from treating DSC data for the last peak using the Borchardt and Daniels kinetics program are listed in Table IV. Order of reaction was assumed to be 1.0. Activation energies for cracking under He of sample A was 55.9 and of sample B was 61.7 kcal/mol and for combustion under a i r of sample A was 20.5 and of sample B was 28.9 kcal/mol. These values a r e higher for cracking and lower f o r combustion reactions than those obtained from kinetic treatment of TGA data in tem- perature zone 3 (Table rrr). Although inhomogeneity of core samples is always a problem in gener- ating reproducible data, i t is believed that more experimental data is needed before such discrepancy can be resolved. Heats of reaction for testa under air a r e much larger, 147 for A and 240 cal/g for B, thin in He, 38 for A and 91 cal/g for B. It is evident that heat of reaction for sample A is lower than that of B. This is because oxidation reactions a r e much more exothermic than cracking reactions and oil content of sample A is one-half of E. Table IV includes peak and ignition temperatures de- rived from DSC thermograms. Ignition temperature is defined here a s the temperature to which the product must be heated in the presence of air to sustain combustion. Temperature a t the onset point of the combustion peak on DSC thermograms has been assigned to this value. Ignition temperature for sample A is 325'C and for sample B is 345°C.
TABLE IV REACTION PARAMETERS FROM DSC EXPERIMENTS~
Sample Peak Activation A 10% Heat of Ignition (Purge Temp. Energy peak Reaction Temp.
C a l k "C -1 s-1 Gas) "C kcal/mol 6 A. (He) 462 55.9 2.6 x 10¹⁴ 5.7 38
(Air) 453 20.5 6 . 2 ~ 103 3.9 147 325
E. (He) 484 61.7 4 . 2 ~ 1 0 ~ 5 5.2 91 (Air) 480 28.9 9 . 2 ~ 105 3.3 240 345
a. Order of reaction was assumed to be 1.0 for estimation of activation energy and pre-exponential factor.
SUMMARY
Thermal degradation of Lloydminster heavy oil core samples has been investigated in He, N2 and a i r using TGA and DSC techniques. TGA and DTG thermograms demonstrated four distinct types of chemical reactions occurring in four different temperature zones. Reactions in zone 1 are attributed to volatilization and low temperature oxidation; in zone 2 to thermolysis of heavy oil frac- tions, volatilization and oxidation; in zone 3 to cracking and combustion; and in zone 4 to coking, de- composition of mineral matter and oxidation of the coke produced. oxidation reactions take place when the sample is in contact with air. Fuel (coke) contents of sample A ranged between 29.3 and 39.2 Kg/m3 and that of B, 28.8 and 49.1 Kg/m3. Arrhenius and thermal parameters obtained for reactions in TGA/DSC studies a re listed in Tables III and IV.
Data generated from TGA/DSC experiments a re essential for running numerical simulation of the &-a combustion process and verifying their match to the laboratory results. In addition, TGA/DSC data can be manipulated to yield air-fuel ratio, oxygen utilization, combustion front velocity, produced gas compxition and hydrogen-bcarbon ratio of the fuel. It is evident that thermal analyti- cal techniques have the potential to produce data which can be used for planning, design and construc- tion of the field &-E& combustion tests and for numerical simulation to predict process variables and economics.
1 , I
ACKNOWLEDGMENTS
I wish to thank G. Perron for technical assistance and A. Leu for calculation of some of the data. Partial financial support from Saskatchewan Energy and Mines is acknowledged for this work.
Figure 1. Schematic diagram of in-situ combustion process.
INJECTION WELL PRODUCTION WELL
AND WATER
PRODUCING FORMATION
1
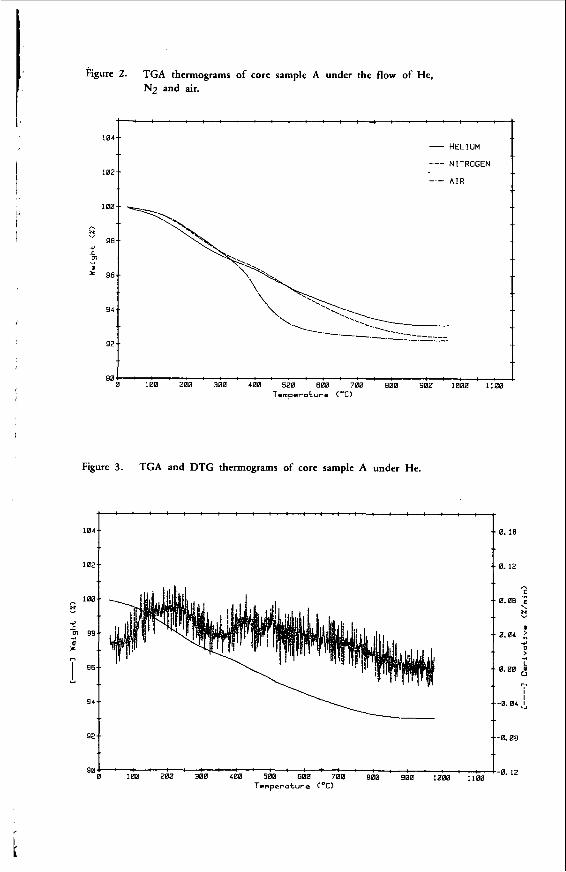
Figure 2. TGA thermograms of core sample A under the flow of He, N2 and air.
100.-
e.
98- t5 U
m u
96.-
94.-
92.-
102 104 i
L
- -
AIR
92.- ---0.08
90 0 t 100 200 300 400 500 600 700 800 900 1000 1100 Temperature (OC)
Figure 3. TGA and DTG thermograms of core sample A under He.
102 l 0 I
c
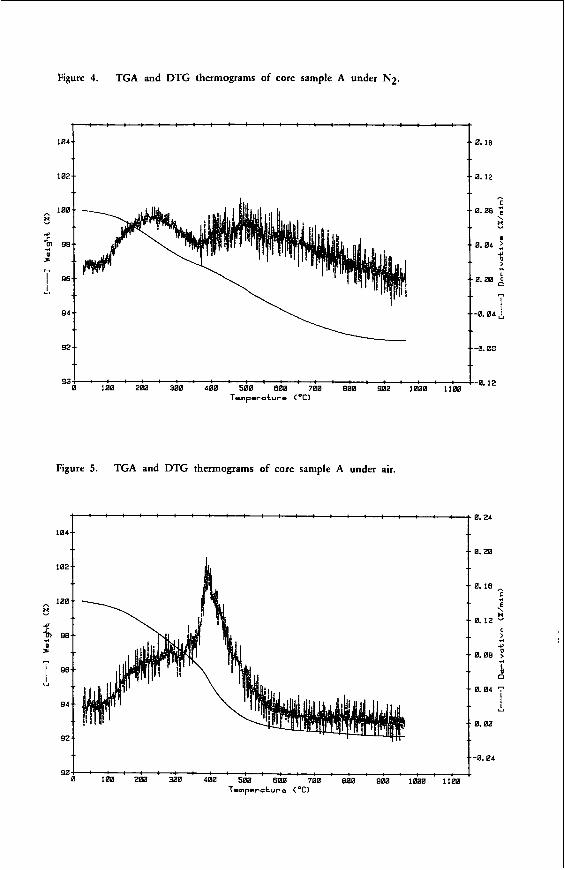
Figure 4. TGA and DTG thermograms of core sample A under N2.
h 180..
f! U I: m 98-
L .. a
7 96.- Y
94.-
' 8.16
8.12
h
S
\ .. 0.08 ;
f! Y
.. 0. 0 4 1, U
> L *
.. 0.80
F,
! - - -E . 04 L
92 t f I t t
ea! . . . . . . . . . . . . . . . . . . . . . . . -0.12 0 180 280 300 400 500 600 700 E00 900 1080 1100
Temperature (OC)
Figure 5. TGA and DTG thermograms of core sample A under air.
90 . . . . . . . . . . . . . . . . . . . . . . 0 108 200 300 400 500 600 780 E00 980 1080 1100
Temperature (OC)
0.24
0.20
0.16 c
E \ *
0.12 f! u
4 *
8.0E 4 L
0
0.04 '7 1 Y
0.88
-0.04
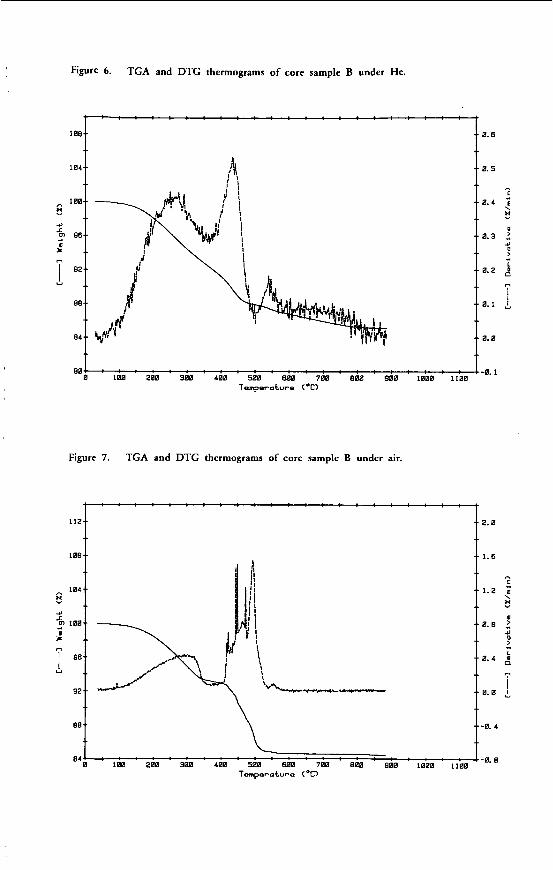
Figure 6. TGA and DTG thermograms of core sample B under He.
t : : : : : : : : : : : : : : : : : : : : : :
104 la8I
88 8 t 180 200 300 400 508 BBB 700 E08 900 1000 1100 Temperature (*C)
Figure 7. TGA and DTG thermograms of core sample B under air.
. . . . . . . . . . . . . . . . . . . . . . .
EO-.
8 108 200 300 480 580 600 788 E00 800 1800 1100 8 4 T : : : : : : : : : : : : : : : : : : : : : :
Temperature (OC)
I ! i
0. 6
0. 5
n
0.4 ; f!
0. 1 j
0.0
-0. 1
2. 0
1.6
h
1.2 ; t! \
u
+I >
0. 6 2
* 0.4
r.
i 0. 0 ?,
-0. 4
-0. E
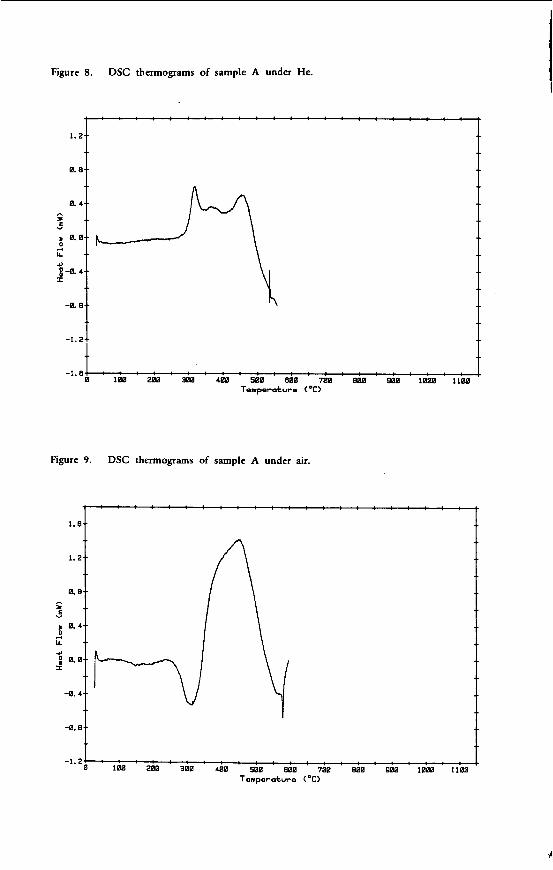
Figure 8. DSC thermograms of sample A under He.
1.2.-
0. e--
0. 4.-
s I 0.8.- " 0
u #
I
- e -8.4..
-0. e--
-1.2.-
4 : : : : : : : : : : : : : : : : : : : : : : C
..
..
\
- 1 . 8 1 : : : : : : : : : : : : : : : : : : : : : : $.
0 100 200 388 400 588 E00 700 E00 880 1000 1100
Figure 9. DSC thermograms of sample A under air.
1. e- -
1.2.-
0. e-- P " I 8.4.. 4 LL
#
I : 0.0..
-0.4..
-8.8..
+ : : : : : : : : : : : : : : : : : : : : : : +
..
..
- 1 . 2 . : : : : : : : : : : : : : : : : : : : : : : 0 I00 200 300 400 580 W E 700 800 880 1000 I100
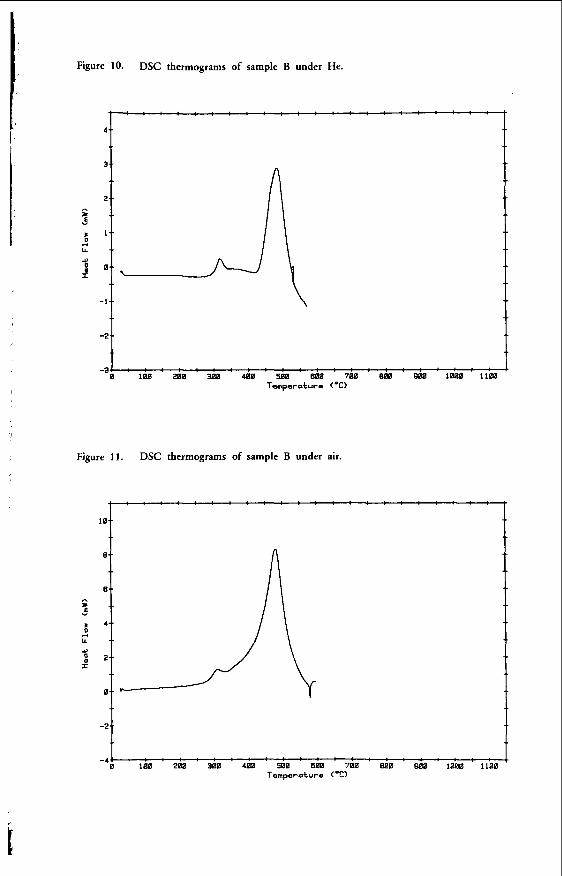
Figure 10. DSC thermograms of sample B under He.
4..
3..
2.-
1.-
0.-
-1..
-2..
. . . . . . . . . . . . . . . . . . . . . . . . . . E LEE zaa zm 488 ~ B B am 700 am scm imm iim
Figure 11. DSC thermograms of sample B under air.
Temperature (OC) 0 im 200 300 480 WE BEE 700 wa 488 1000 i im
- 4 1 : : : : : : : : : : : : : : : : : : : : : : L
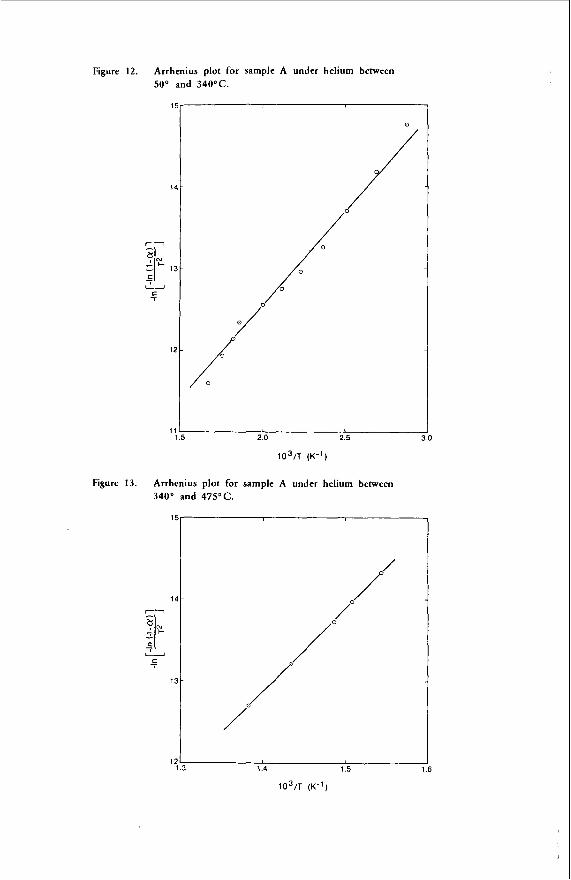
Figure 12. Arrhenius plot for sample A under helium between 50' and 34OoC.
0
2.0 2.5
1 0 ~ 1 ~ (K-I)
Figure 13. Arrhenius plot for sample A under helium between 340° and 475OC.
14-
I
12 1.3 1.4 1.5
1 0 ~ 1 ~ ( ~ - 1 )
i
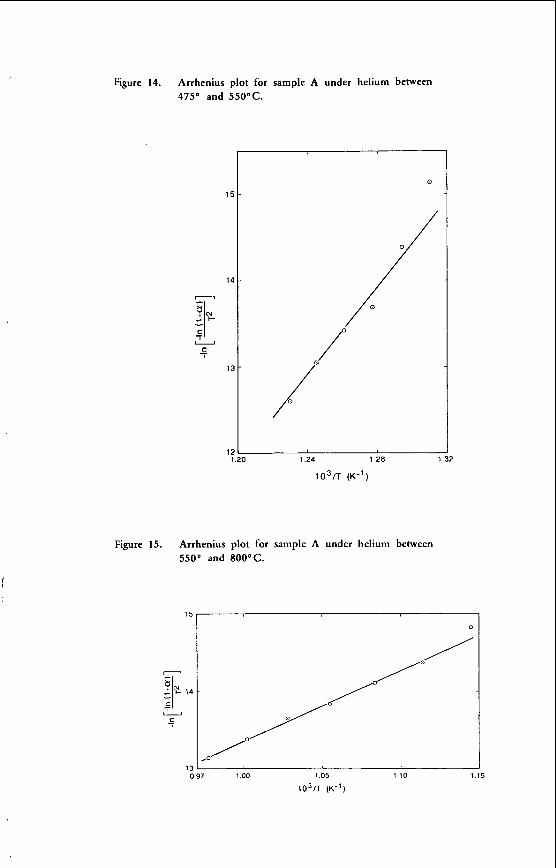
Figure 14. Arrhenius plot for sample A under helium between 475O and 550°C.
0
1.24 1.28 1
103/T (K-’)
Figure 15. Arrhenius plot for sample A under helium between 550° and 800’C.
2
‘ “ I 0
0.97 1 .oo 1.05 1.10 1.15
1 0 3 n ( K - ~ )
I 1 LITERATURE CITED
Jha, K. N., Chemistry in Canada, pp. 19-26, September 1982. Jha, K. N. , and Verma, A . , Proc. Il International Conf. on Heavy Crudes and Tar Sands in Caracas, Venezuela, Vol. IV, Feb. 7-17, 1982. "Fundamentals of Enhanced Oil Recovery", K. H. van Poolen and Assoc. Inc., PennWell Books, Tulsa, Oklahoma, U. S.A., 1980. "Fully ImplicitaS& Combustion and Steam Model", ISCOM User Manual, Version 2 .2 , April, 1981, Computer Modelling Group, Calgary, Alberta, Canada. B e d o n , D. W., Moore, R. G., Donnelly, J. K. , and Erian, A . , Proc. Il International Cod. on Heavy Crudes and Tar Sands in Caracas, Venezuela, Vol. 11, February 7-17, 1982. Lin, C. Y . , Chen, W. H., Lee, S. T., and Culham. W. E., 57th Ann. Fall Tech. Conf., Sot. Pet. Engg. SPE 11074, New Orleans, U.S.A. September 26-29, 1982. Vossoughi, S. , Barlett, G. W., and Willhite, G. P., 57th Ann. Fall Tech. Conf., Soc. Pet. Engg. SPE 11073, New Orleans, U.S.A., September 26-29, 1982. Borchardt, H. J., and Daniels, F., J. Am. Chem. Soc., 3, 41-46 (1957). Grentzer, T. H., Holsworth, R. M . , and Provder, T., National ACS, 3/81, ORPL. "Borchardt and Daniels Kinetics Data Analysis Program", PN994377-912, DuPont, Wilmington, Delaware, U. S. A. , August 1982. Coats, A. W., and Refdern, J. P . , Nature, 201, 68-69 (1964). Thakur, D. S., Nuttal, H. E . , and Cha, C. Y . , Preprint, Div. Fuel Chem., 2 (2), 131 (1982). Yaws, C. L., "Physical Properties", Chem. Engg., McGraw-Hill Co., New York, p. 205 (1977). Baldwin, R. R., Bennett, J. P., and Walker, R. W., 16th International Symp. on Com- bustion, MIT, Cambridge, Mass. , U. S. A. , August 15-20, 1976. Jha, K. N., Rao, P. M., and Stausz, 0. P., Preprint, Div. Fuel Chem., 23 (4), 91 (1978). Campbell, J. H., Koskinas, G. H . , and Stout, N. D., Fuel, 57, 372 (1978). Hayashitani, M., Bennion, D. W., Donnelly, J. K . , and Moore, R. G., "The Oil Sands of Canada-Venezuela 1977". Ed. Redford, D. A . , and Winestock, A. G., Can. Ins. Mining and :Let., pp. 233-2A7 (1977).
GENERAL PAPERS - FOSTER SESSION PRESENTED BEFORE THE DIVISION OF PETROLEUM CHEMISTRY, INC.
AMERICAN CHEMICAL SOCIETY WASHINGTON, D. C. MEETING, AUGUST 28-SEPTEMBER 2 , 1983
DEVELOPMENT OF AN ALTERNATIVE S.A.R.A. METHOD FOR THE CHARACTERIZATION OF COAL-DERIVED LIQUIDS
BY
F. M. Lancas, H. S. Karam and H. M. McNair Department of Chemistry, Virginia Polytechnic Institute and State University
Blacksburg, Virginia 24061
INTRODUCTION
Coal-derived liquids have been studied extensively, because of their potential applications in many fields such as fuel and feedstocks generation (1). One of the most popular methods by which to characterize fossil fuels is by fractionation of the sample into saturates, aromatics, re- sins and asphaltenes (S.A.R.A.). Two different approaches a r e widely used for this purpose: sol- vent extraction and liquid chromatography. Although much work has been done using these two ap- proaches, characterization of fossil fuels is still unsatisfactory and exhaustive research is still re- quired. Solvent extraction methods currently used, though simple and inexpensive, present pro- blems with reproducibility, time consumption, solvent evaporation, co-extraction and loss of vola- tiles (2, 3). In most of the liquid chromatographic methods used, the fossil fuel extract is f irst treated with a non-polar hydrocarbon (such as n-pentane) to precipitate the asphaltenes and the re- maining solution is applied to an Attapulgus clay column to separate resins from oils. Finally, the oils a r e fractionated to saturates and aromatics on alumina and/or silica columns (4). All these steps, in addition to being unnecessary and inconvenient, do not provide the actual group-type dis- tribution in the extract since part of the resins could be co-precipitated with asphaltenes (5). With these problems in mind, we have developed and applled an alternative S.A.R.A. method for the characterization of Brazilian coal-derived liquids.
RESULTS AND DISCUSSION
Fractionation by Solvent Extraction
different solvents for 30 minutes using a magnetic s t i r r e r (100 ml of solvent to 10 g of coal). Re- sults showed that stirring time is not critical. After one hour of stirring with hexane, the unextrac- ted coal was 96.6% of the original sample, while after 12 hours it was 95.6%. Following extraction, the solvent was evaporated and the extract redissolved in 2 ml of solvent. Asphaltenes were preci- pitated by adding 80 ml of n-pentane to the concentrated extract solution (volume ratio of 40 to 1). In all experiments solvents were evaporated by a combination of rotary evaporation for sample con- centration and controlled heating under nitrogen flow until dryness of the extract. the results of a study comparing the relative amounts of asphaltenes and maltenes present in the "Mina do Leao" (high-ash Brazilian coal). The relative amounts extracted by the different solvents a r e displayed in Figure 2. Although pyridine is the best solvent examined, we decided to use te- trahydrofuran (THF) since it has a similar performance and it i s less toxic and less polar.
In a different set of experiments, the fractionation of the THF coal extract into asphaltols, asphaltenes and oils was carried out utilizing the schematic shown in Figure 3. The results of this study appear in Table I.
Coal was finely ground, sieved through a 60 mesh (U. S. Standard) sieve, extracted with
Figure 1 shows
Fractionation by Column Chromatography
packed for comparison purposes. Dry packing was done by constantly tapping the column while adding 2 g of the packing material in small portions. A plug of glass wool and a layer of white sand (ca. 0.5 cm) on the top were used to support the solid adsorbent and to prevent it from washing through the stopcock. Slurry packing was performed by first adding the solid adsorbent a little a t a time to hexane in a beaker, swirling the beaker and pouring the slurry into a draining column (pre- viously filled about 1/3 full with the first eluent, hexane). The results of a comparative study using different packing techniques and materials a r e displayed in Table 11. A set of five identical columns was employed, to determine the reproducibility of each system a s applied to a hexane coal extract. For this study, the hexane soluble materials were filtered following extraction into a 100 ml
A 50 cm (L) x 11 mm (I. D.) glass column fitted with a teflon stopcock was dry o r s l u r r y
I
volumetric flask. 10 ml of this stock solution was loaded into the chromatographic column. The eluents used to generate the fractions were hexane (50 ml), toluene (75 ml) and methanol (50 ml) for saturates, aromatics and resins, respectively, following precipitation of asphaltenes, in accord- ance with the Phillips method (6). The results show that slurry packing with silica is the most re- producible system investigated. (It is well-established in the literabre that asphaltols are highly adsorbed on alumina, while fewer substances a r e adsorbed on silica gel because of its mildly acidic properties (7, a).)
TABLE I
SOLUBILITY CHARACTERISTICS OF HIGH-ASH BRAZILIAN COAL THF EXTRACT
Sample Wt % Asphaltols Wt % Asphaltenes Wt % Oils
38.5 35.2 26.3 38.5 32.4 29.1 37.8 36.9 25.4 36.4 37.6 26.0 42 .1 34.8 23.1
X 38.7 35.4 26.0 0- 2.1 2.0 2.1
R.S.D. 5.4 5.7 8.3
-
TABLE II
COMPARISON OF DIFFERENT PACKDG STSTEW A S APPLIED TO HEXANE COAL EXTRACT
GroupType Column Typea: 2 - 2 __ 3
wt I 40.4 35.3 24.3 Saturates 0- 8.8 3.4 2.3
R. S. D. 22 9.8 9.5
Aromatics Wt % 30.1 22.4 30.1 6 5.9 3.1 2.2
R. S. D. 20 14 7.1
Wt I 29.4 42.3 45.6 Resins 0- 10 2. 5 1 .8
r’ R.S.D. 35 5.8 4.0
a. l=dry-packed alumina; 2=slurry-packed alumina; S=slurry-packed silica.
Since the best performance was shown with THF as extracting agent and silica gel as an adsorbent for slurry packing technique, w e have applied the whole coal extract (a maximum of 200 mg) to the column to avoid problems associated with the asphaltenes precipitating in non-polar sol- vents. The characteristics of the chromatographic elution utilizing this new system as well as the relative group type distribution of the THF coal extract appear in Table In.
TABLE III
CHROMATOGRAPHIC ELUTION CHARACTERISTICS AND RELATIVE GROUP TYPE DISTRIBUTION O F THF COAL EXTRACT
Eluent Volume of Eluent Color of Eluent Identity - Wt %
Hexane 50 ml Colorless Saturates 3.3 Toluene 75 ml Orange Aromatics 20.2 Methanol 50 ml Red-Wine Resins 51.8 TH F 50 ml Dark Brown Asphaltenes 24.7
100.0
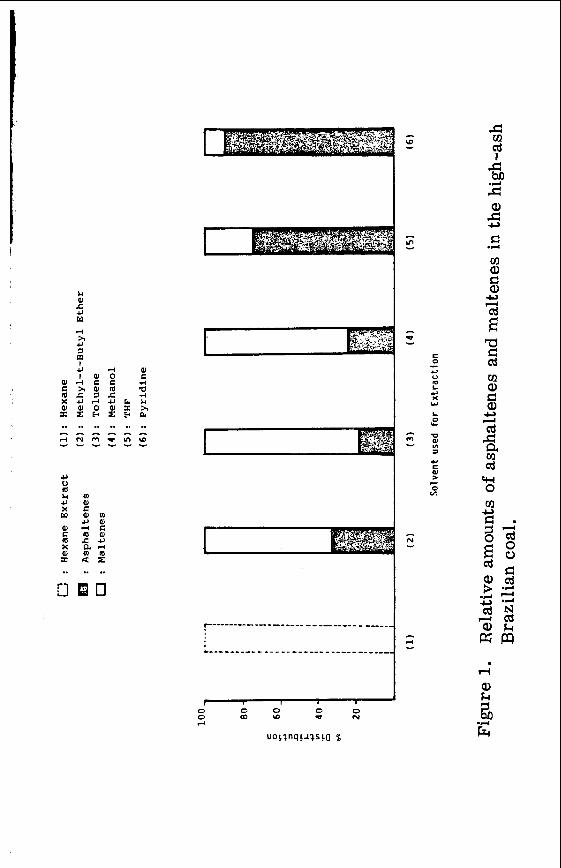
u c 4J w
.. .. .. .. .. .. L
m F - v )
U
E W
0 v)
a
c
.. .. .. O B 0
cw 0 m e . u
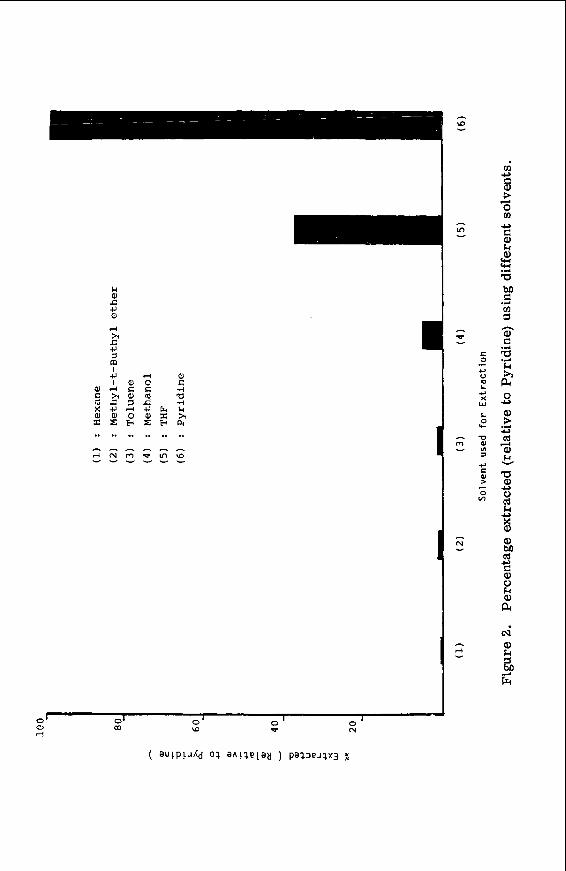
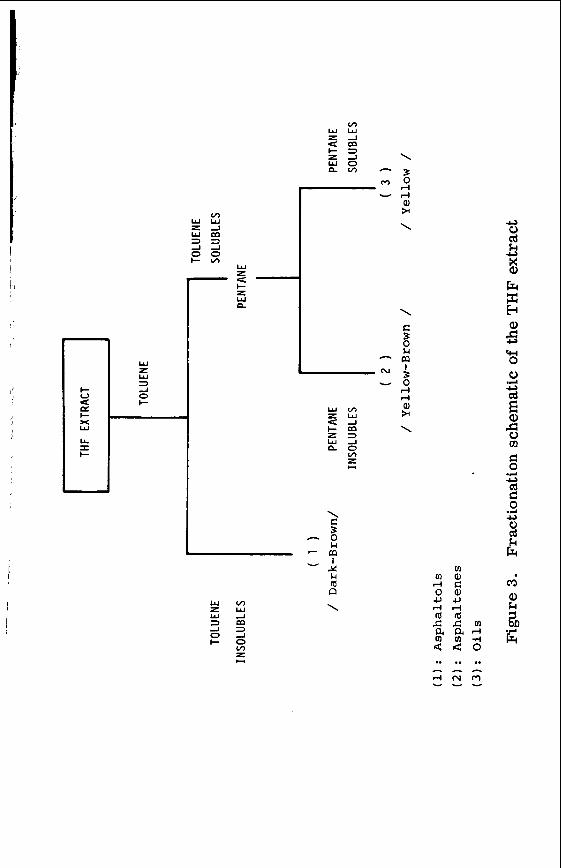
/ /
I
W z 4
\
c
& 8 m h L - J &
I- z w n
- 0 rl d
w v ) z w w - I D m - I 2 0 - I I - 0
v) z w-#
\ c
&
x k rd
\
- g - a - 1
n
Q)
3 w 0 0
cd
Q)
rn
.d Y
E 3
CONCLUSION
Compared with methods of characterization of coal extract described in the literature, the method we have developed has the following advantages:
1. Extraction step: Using THF instead of hexane, pyridine, toluene, etc. , gives more reproducible results and avoids extracting very polar compounds and loss of volatiles during the evaporation step. Magnetic stirring instead of manual stirring or Soxhlet extraction is an easier, faster and more reproducible extraction procedure.
2. Column Chromatography: Slurry packing with silica permits a better stationary bed and, at the same time, avoids irreversible adsorption. By fractionating the whole THF coal ex- tract, one avoids the precipitation of asphaltenes prior to column chromatography. In addition, fractionating the whole extract permits collection of the four S .A. R.A. (saturates, aromatics, re- sins and asphaltenes) fractions for further characterization.
ACKNOWLEDGKENTS
F. M. Lancas would like to thank Fundacao de Amparo a Pesquisa do Estado de Sa0 Paulo (FAPESP) for the fellowship (Process0 16-Quimica 81/0557-2) and Universidade de Sa0 Paulo for the free absence.
LITERATURE CITED
Whitehurst, D. D., Mitchell, T. 0. and Farcasiu, M. , "Coal Liquefaction. The Chemis- try and Technology of Thermal Processes", Academic Press, NY (1980). Boduszynski, M. M., Hurtubise, R. J. and Silver, H., Anal. Chem., 54, 372 (1982). Bockrath, B., Schroeder, K. T. and Steffgen, F. W., Anal. Chem., 51, ll6R. Galya, L. G. and Suatoni, J. C. , J. of Liquid Chmmaiogr., - 3, 229 (1980). Bunger: J. Ur. and ii, N. C . , eds. , "Chemistry of Asphaltenes", Advances in Chem. Series, No. 195, AMS (1981). Phillips Petroleum Company, Research and Development, Method 8045-AS (1980). Whitehurst, D. D. , Farcasiu, M. and Mitchell, 0. , "The Nature and Origin of Asphal- tenes in Processed Coals", EPRI Annual Report (1976). Given, P. H., Cronauer, D. C . , Spakman, K . , Lovell, H. L . , Davis, A. and Biswas, B. , Fuel, 54, 34 (1975); 54, 40 (1975).
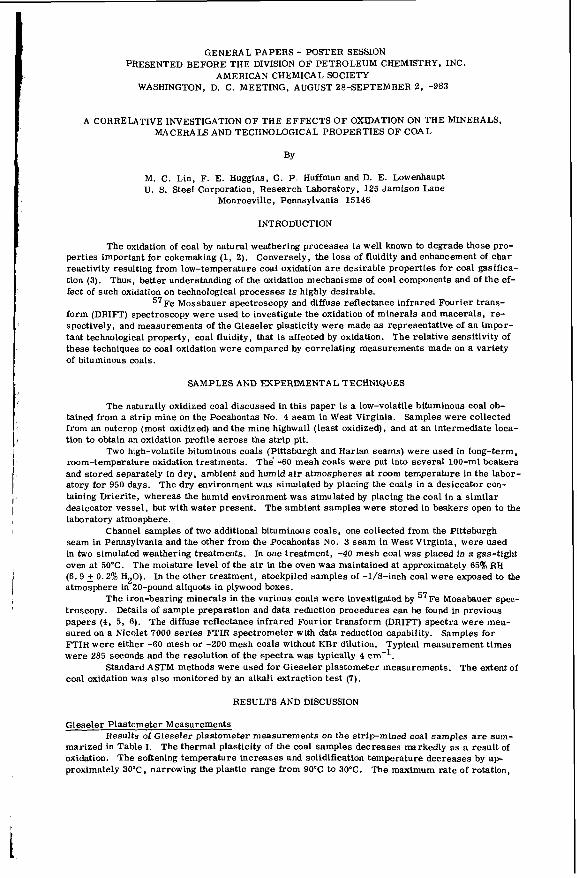
GENERAL PAPERS - POSTER SESSION PRESENTED BEFORE THE DIVISION O F PETROLEUM CHEMISTRY, INC.
AMERICAN CHEMICAL SOCIETY WASHINGTON, D. C. MEETING, AUGUST 28-SEPTEMBER 2, -983
A CORRELATIVE INVESTIGATION O F THE EFFECTS OF OXIDATION ON THE MINERALS, MA CERA IS AND TECHNOLOGICAL PROPERTIES OF COAL
BY
M. C. Lin, F. E. Huggins, G. P. Huffman and D. E. Lowenhaupt U. S. Steel Corporation, Research Laboratory, 125 Jamison Lane
Monroeville, Pennsylvania 15146
INTRODUCTION
The oxidation of coal by natural weathering processes is well known to degrade those pro- perties important for cokemaking (1, 2). Conversely, the loss of fluidity and enhancement of char reactivity resulting from low-temperature coal oxidation a r e desirable properties for coal gasifica- tion (3). Thus, better understanding of the oxidation mechanisms of coal components and of the ef- fect of such oxidation on technological processes i s highly desirable.
57Fe Mossbauer spectroscopy and diffuse reflectance infrared Fourier trans- form (DRIFT) spectroscopy were used to investigate the oxidation of minerals and macerals, re- spectively, and measurements of the Gieseler plasticity were made as representative of an impor- tant technological property, coal fluidity, that is affected by oxidation. The relative sensitivity of these techniques to coal oxidation were compared by correlating measurements made on a variety of bituminous coals.
SAMPLES AND EXPERIMENTAL TECHNIQUES
The naturally oxidized coal discussed in this paper is a low-volatile bituminous coal ob- tained from a strip mine on the Pocahontas No. 4 seam in West Virginia. Samples were collected from an outcrop (most oxidized) and the mine highwall (least oxidized), and at an intermediate loca- tion to obtain an oxidation profile across the s t r ip pit.
Two high-volatile bituminous coals (Pittsburgh and Harlan seams) were used in long-term, room-temperature oxidation treatments. T h e -60 mesh coals were put into several 100-ml beakers and stored separately in dry, ambient and humid a i r atmospheres at room temperature in the labor- atory for 950 days. The dry environment was simulated by placing the coals in a desiccator con- taining Drierite, whereas the humid environment was simulated by placing the coal in a similar desiccator vessel, but with water present. The ambient samples were stored in beakers open to the laboratory atmosphere.
seam in Pennsylvania and the other from the Pocahontas No. 3 seam in West Virginia, were used in two simulated weathering treatments. In one treatment, -40 mesh coal was placed in a gas-tight oven at 50'C. The moisture level of the air in the oven was maintained a t approximately 65% RH (6.9 5 0.2% HZO). In the other treatment, stockpiled samples of -l/8-inch coal were exposed to the atmosphere in 20-pound aliquots in plywood boxes.
The iron-bearing minerals in the various coals were investigated by 57Fe Mossbauer spec- troscopy. Details of sample preparation and data reduction procedures can be found in previous papers (4, 5, 6). The diffuse reflectance infrared Fourier transform (DRIFT) spectra were mea- sured on a Nicolet 7000 ser ies FI'IR spectrometer with data reduction capability. Samples for FTIR were either -60 mesh or -200 mesh coals without KBr dilution. Typical measurement t imes were 285 seconds and the resolution of the spectra was typically 4 ern-',
coal oxidation was also monitored by an alkali extraction test (7).
RESULTS AND DISCUSSION
Channel samples of two additional bituminous coals, one collected from the Pittsburgh
Standard ASTM methods were used for Gieseler plastometer measurements. The extent of
Gieseler Plastometer Measurements Results of Gieseler plastometer measurements on the strip-mined coal samples are sum-
marized in Table I. The thermal plasticity of the coal samples decreases markedly as a result of oxidation. The softening temperature increases and solidification temperature decreases by ap- proximately 30°C. narrowing the plastlc range from 90'C to 30°C. The maximum ra te of rotatlon,
I
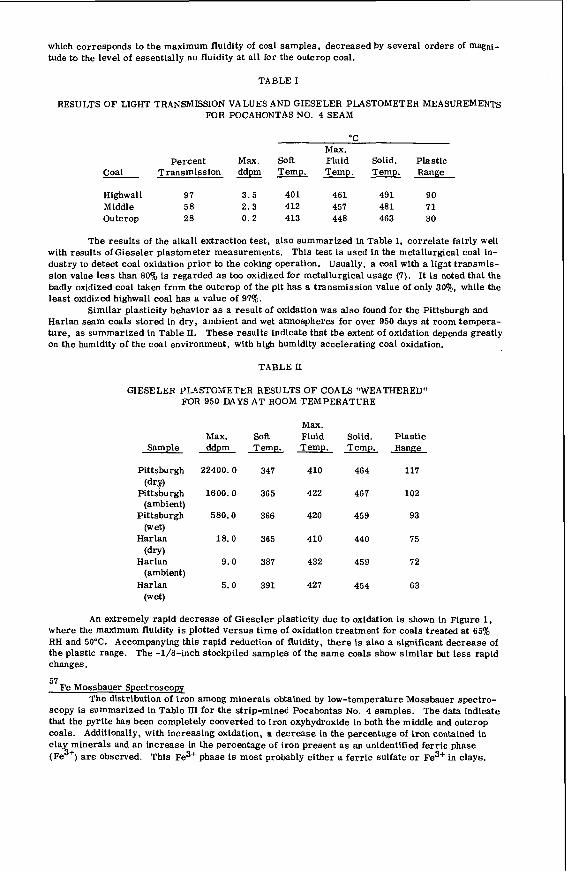
which corresponds to the maximum fluidity of coal samples, decreased by several orders of magni- tude to the level of essentially no fluidity a t all for the outcrop coal.
TABLE I
RESULTS OF LIGHT TRANSMISSION VALUES AND GIESELER PLASTOMETER MEASUREMENTS FOR POCAHONTAS NO. 4 SEAM
o r
Max. Percent Max. Soft Fluid Solid. Plastic
Coal Transmission ddpm Temp. Temp. Temp. Range
Highwall 97 3.5 401 461 491 90 Middle 58 2.3 412 457 481 71 Outcrop 28 0.2 413 448 463 30
The results of the alkali extraction test , also summarized in Table I, correlate fairly well with results of Gieseler plastometer measurements. This test is used in the metallurgical coal in- dustry to detect coal oxidation prior to the coking operation. Usually, a coal with a light transmis- sion value less than 80% is regarded as too oxidized for metallurgical usage (7). I t is noted that the badly oxidized coal taken from the outcrop of the pit has a transmission value of only 30%, while the least oxidized highwall coal has a value of 97%.
Harlan seam coals stored in dry, ambient and wet atmospheres for over 950 days at room tempera- tu re , as summarized in Table 11. These results indicate that the extent of oxidation depends greatly on the humidity of the coal environment, with high humidity accelerating coal oxidation.
Similar plasticity behavior as a result of oxidation was also found for the Pittsburgh and
TABLE II
GIESELER Pl4STOMETER RESULTS OF COALS "WEATHERED" FOR 950 DAYS AT ROOM TEMPERATURE
Max. Max. Soft Fluid Solid. Plastic
Sample ddpm Temp. Temp. Temp. Range
Pittsburgh 22400. 0 347 410 464 117
Pittsburgh 1600.0 365 422 46 7 102
Pittsburgh 580.0 366 420 459 93
car,, (ambient)
(wet)
(dry) Harlan 18.0 365 410 440 75
Harlan 9.0 387 432 459 72
Harlan 5.0 391 427 454 63 (ambient)
(wet)
An extremely rapid decrease of Gieseler plasticity due to oxidation is shown in Figure 1, where the maximum fluidity is plotted versus t ime of oxidation treatment for coals treated at 65% RH and 50°C. Accompanying this rapid reduction of fluidity, there is also a significant decrease of the plastic range. The -l/d-inch stockpiled samples of the same coals show similar but less rapid changes.
57 Fe Mossbauer Spectroscopy
The distribution of iron among minerals obtained by low-temperature Mossbauer spectro- scopy is summarized in Table III for the strip-mined Pocahontas No. 4 samples. The data indicate that the pyrite has been completely converted to iron oxyhydroxide in both the middle and outcrop coals. Additionally, with increasing oxidation, a decrease in the percentage of iron contained in clay minerals and a n increase in the percentage of iron present a s a n unidentified ferric phase (Fe3+) a r e observed. This Fe3+ phase is most probably either a fe r r ic sulfate or Fe3+ in clays.
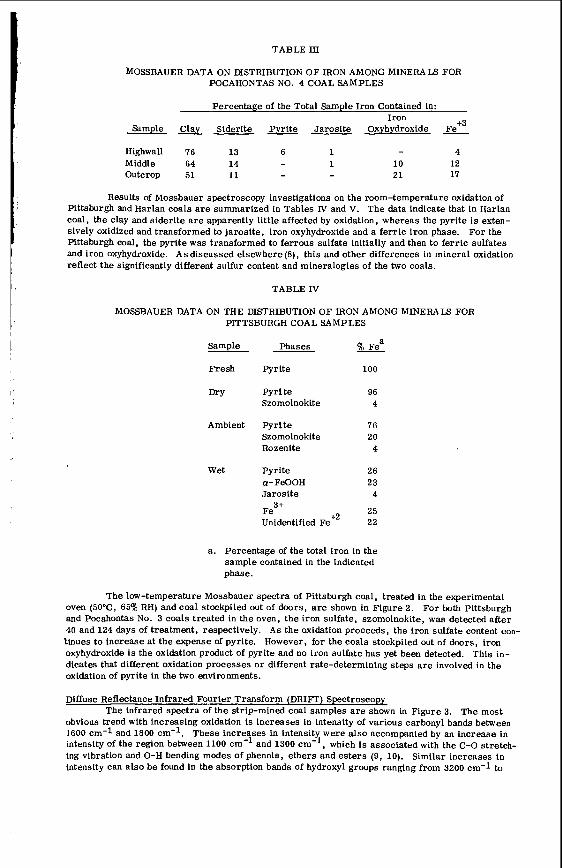
TABLE ID
MOSSBAUER DATA ON DISTRIBUTION OF IRON AMONG MINERALS FOR POCAHONTAS NO. 4 COAL SAMPLES
Percentage of the Total Sample Iron Contained in:
+3 Sample Clay Siderite Pyrite Jarosite Oxyhydroxide Fe Iron
- Highwall 76 13 6 1 4 Middle 64 14 - 1 10 12 Outcrop 51 11 - - 21 17
Results of Mossbauer spectroscopy investigations on the room-temperature oxidation of Pittsburgh and Harlan coals a r e summarized in Tables lV and V. The data indicate that in Harlan coal, the clay and siderite a r e apparently little affected by oxidation, whereas the pyrite is exten- sively oxidized and transformed to jarosite, iron oxyhydroxide and a fe r r ic iron phase. Pittsburgh coal, the pyrite was transformed to ferrous sulfate initially and then to ferric sulfates and iron oxyhydroxide. A s discussed elsewhere(8), this and other differences in mineral oxidation reflect the significantly different sulfur content and mineralogies of the two coals.
For the
TABLE IV
MOSSBAUER DATA ON THE DISTRIBUTION OF IRON AMONG MINERALS FOR PITTSBURGH COAL SAMPLES
Sample Phases -~ Fresh Pyrite 100
Pyrl te 96 Szomolnokite 4
Ambient Pyrl te 76 Szomolnokite 20 Rozenite 4
Wet Pyrite 26 cr-FeOOH 23 Jarosite 4
Fe 25 Unidentified Fef2 22
3+
a. Percentage of the total iron in the sample contained in the indicated phase.
The low-temperature Mossbauer spectra of Pittsburgh coal, treated in the experimental oven (50'C, 65% RH) and coal stockpiled out of doors, are shown in Figure 2. For both Pittsburgh and Pocahontas No. 3 coals treated in the oven, the iron sulfate, szomolnokite, was detected after 40 and 124 days of treatment, respectively. A s the oxidation proceeds, the iron sulfate content con- tinues to increase at the expense of pyrite. However, for the coals stockpiled out of doors, iron oxyhydroxide is the oxidation product of pyrite and no iron sulfate has yet been detected. This in- dicates that different oxidation processes or different rate-determining steps a r e involved in the oxidation of pyrite in the two environments.
Diffuse Reflectance Infrared Fourler Transform (DRIlT) Spectroscopy
obvious trend with increasing oxidation is increases in intensity of various carbonyl bands between 1600 cm-l and 1800 cm-l. These Increases in intensity were also accompanied by an increase in intensity of the region between 1100 cm-' and 1300 cm-', which is associated with the c-0 stretch- ing vibration and 0-H bending modes of phenols, ethers and es te rs (9, 10). Similar increases in intensity can also be found in the absorption bands of hydroxyl groups ranging from 3200 cm-1 to
The infrared spectra of the strip-mined coal samples are shown in Figure 3. The most

3600 cm-'. However, the intensity of absorption bands at 2860, 2920 and 2950 cm-l, which cor- respond to the aliphatic C-H stretching modes, show systematic decreases from the least oxidized to the most oxidized coal samples. Similar decreases in intensity a l so occur for the aromatic C-H stretching mode at 3040 cm-l , and the absorption bands between 700 and 900 cm-l , which corre- spond to the aromatic C-H out-of-plane bending modes.
TABLE V
MOSSBAUER DATA ON THE DISTRIBUTION OF IRON AMONG MINERALS FOR HARLAN COAL SAMPLES
Sample
Fresh
Dry
Ambient
Wet
Phases
Pyrite Clays Siderite
Pyrite Clays Siderite Jarosite
Pyrite
Siderite Jarosite
c lays
Pyrite Clays Siderite Jarosite Iron Oxyhydroxide F c + ~
53 43 4
46 43
5 6
42 43
6 9
1 2 42
6 20 7
13
a. Percentage of the total iron in the sample contained in the indicated phase.
For the laboratory-oxidized Pittsburgh and Harlan coal samples, the carbonyl and carboxy- lic-acid absorption bands between 1600 cm-l and 1800 cm-l, which a r e found in naturally oxidized coals from strip-mines and are closely associated with effects of coal oxidation, were not detected. This suggests that the oxidation of these coal samples is still at a relatively early stage; although both Mossbauer spectroscopy and Gieseler plastometer measurements clearly show changes due to oxidation. This observation is further supported by the DRIFT results obtained after severely oxi- dizing the dry and wet Pittsburgh coal samples in a i r a t 110°C fo r seven days. Figure 4 shows that, in addition to the 1650 cm-' and 1735 cm-l bands observed before, carbonyl and carboxyl bands near 1585, 1680, 1690, 1710 and 1765 cm-l also appear after this rather severe oxidation treat- ment.
DRIFT spectra were also obtained from al l oven-oxidized and stockpiled coal samples. NO significant difference between the treated and f resh coals was found. This indicates that DRIFT spectroscopy is not sufficiently sensitive to detect the early stages of oxidation that cause the large decreases observed in plasticity.
CONCLUSIONS
Mossbauer spectroscopy shows that pyrite in coal is readily altered by low-temperature coal oxidation. The oxidation of pyrite in coals subjected to simulated weathering treatments at constant temperature and humidity in the laboratory gives r i se to a variety of iron sulfates. This i s in contrast to coal samples stockpiled out-of-doors and strip-mined coals, in which the principal pyrite oxidation product is iron oxyhydroxide.
strip-mined coal is detected in DRIFT spectra. These changes accompany the enhancement in in- tensity of certain carbonyl and carboxyl bands. However, these carbonyl bands are not detected in spectra of laboratory oxidized coals until oxidation is qui te extensive.
A reduction in intensity of aliphatic and aromatic bands with increasing oxidation of a
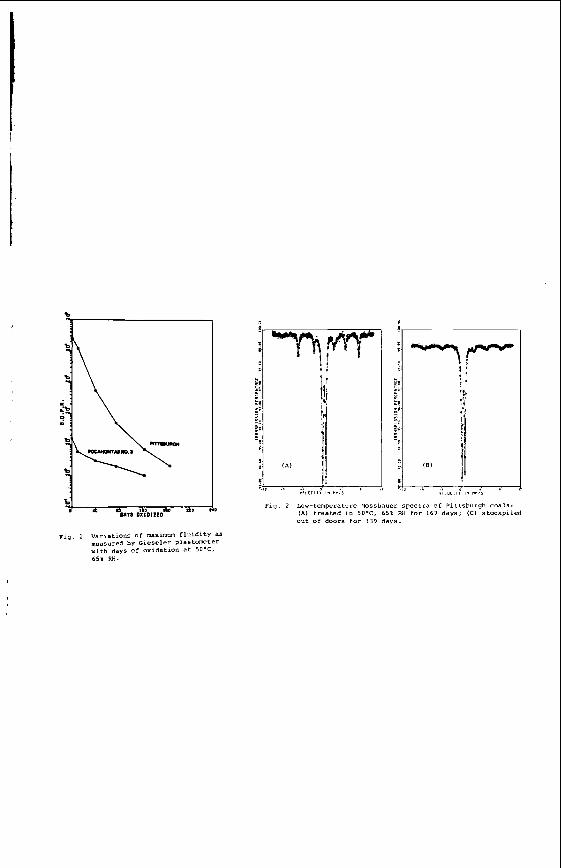
F i a . 2 Low-temperature tmssbauer Spectra of P i t t sburgh coals: (A1 t r e a t e d i n 50-C, 65% RH for 167 days ; IC1 s t o c k p i l e d
Out of doors for 1 3 9 d a y s .
~ i g . 1 v a r i a t i o n s of maximum f l u l d i t y as measured by G i e s e l e r p las tometer w i t h days of o x i d a t l o " a t 50.C. 650 R H .
,
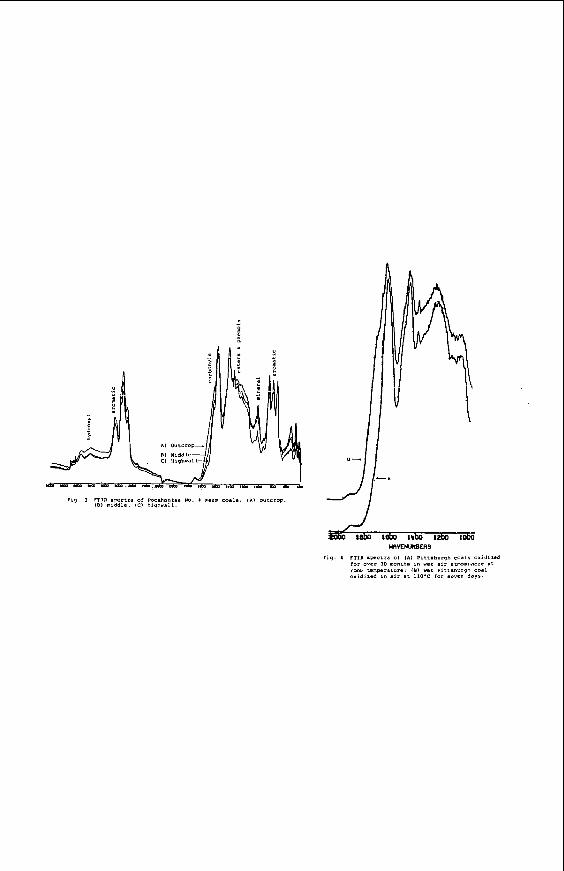
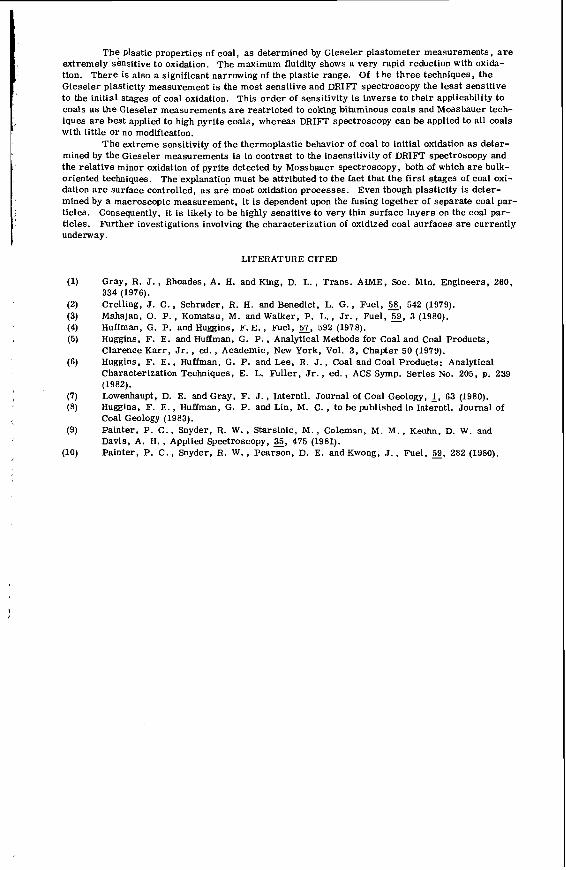
I
The Plastic properties of coal, a s determined by Gieseler plastometer measurements, a r e extremely sensitive to oxidation. The maximum fluidity shows a very rapid reduction with oxida- tion. There is also a significant narrowing of the plastic range. Of t h e three techniques, the Gieseler plasticity measurement i s t h e most sensitive and DRIIT spectroscopy the least sensitive to the initial stages of coal oxidation. This order of sensitivity i s inverse to their applicability to coals as the Gieseler measurements are restricted to coking bituminous coals and Mossbauer tech- iques are best applied to high pyrite coals, whereas DRIFT spectroscopy can be applied to all coals with little or no modification.
The extreme sensitivity of the thermoplastic behavior of coal to initial oxidation a s deter- mined by the Gieseler measurements is in contrast to the insensitivity of DRIFT spectroscopy and the relative minor oxidation of pyrite detected by Mossbauer spectroscopy, both of which a r e bulk- oriented techniques. The explanation must be attributed to the fact that the first stages of coal oxi- dation a r e surface controlled, as a r e most oxidation processes. Even though plasticity is deter- mined by a macroscopic measurement, it is dependent upon the fusing together of separate coal par- ticles. Consequently, it i s likely to be highly sensitive to very thin surface layers on the coal par- ticles. Further investigations involving the characterization of oxidized coal surfaces a r e currently underway.
LITERATURE CITED
Gray, R. J., Rhoades, A. H. andKing, D. L . , Trans. AIME, Soc. Min. Engineers, 260, 334 (1976). Crelling, J. C. , Schrader, R. H. and Benedict, L. G. , Fuel, 2, 542 (1979). Mahajan, 0. P . , Komatsu, M. and Walker, P. L., Jr., Fuel, 59, 3 (1980). Huffman, G. P. and Huggins, F.E., Fuel, 51, 592 (1978). Huggins, F. E. and Huffman, G. P., Analytical Methods for Coal and Coal Products, Clarence Karr , Jr., ed., Academic, New York, Vol. 3, Chapter 50 (1979). Huggins, F. E., Huffman, G. P. and Lee, R. J., Coal and Coal Products: Analytical Characterization Techniques, E. L. Fuller, Jr . , ed . , ACS Symp. Series No. 205, p. 239
Lowenhaupt, D. E. and Gray, F. J. , Interntl. Journal of Coal Geology, 1, 63 (1980). Huggins, F. E. , Huffman, G. P. and Lin, M. C. , to be published in Interntl. Journal of Coal Geology (1983). Painter, P. C . , Snyder, R. W. I StarSiniC, M . , Coleman, M. M . , Keuhn, D. W. and Davis, A. H . , Applied Spectroscopy, 35, 475 (1981). Painter, P. C . , Snyder, R. W. , Pearson, D. E. and Kwong, J . , Fuel, 2. 282 (1980).
(1982).
I
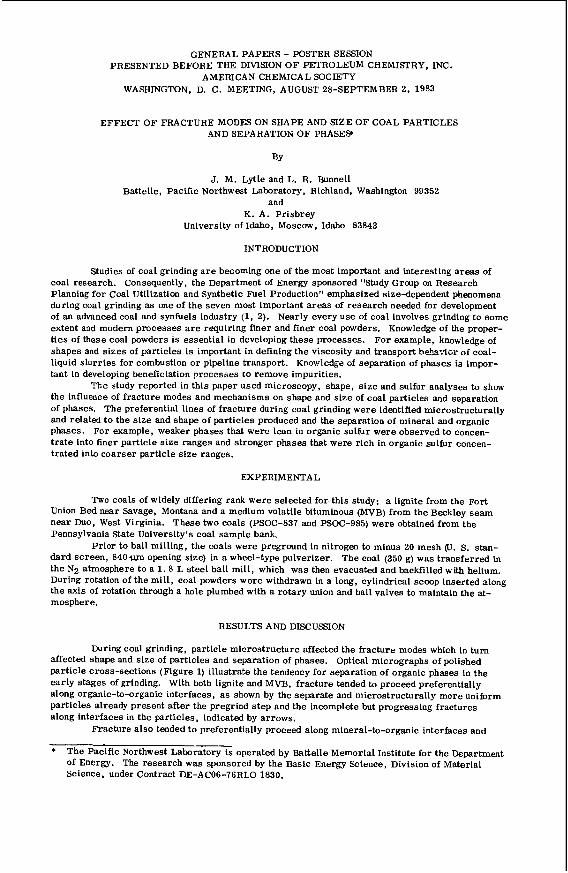
GENERAL PAPERS - POSTER SESSION PRESENTED BEFORE THE DIVISION O F PETROLEUM CHEMISTRY, INC.
AMERICAN CHEMICAL SOCIETY WASHINGTON, D. C. MEETING, AUGUST 28-SEPTEMBER 2, 1983
EFFECT OF FRACTURE MODES ON SHAPE AND SIZE OF COAL PARTICLES AND SEPARATION O F PHASES+
BY
J. M. Lytle and L. R. Bunnell Battelle, Pacific Northwest Laboratory, Richland, Washington 99352
and K. A. Prisbrey
University of Idaho, Moscow, Idaho 83843
INTRODUCTION
Studies of coal grinding a r e becoming one of the most important and interesting areas of coal research. Consequently, the Department of Energy sponsored "Study Group on Research Planning for Coal Utilization and Synthetic Fuel Production" emphasized size-dependent phenomena during coal grinding a s one of the seven most important areas of research needed for development of an advanced coal and synfuels industry (1, 2). Nearly every use of coal involves grinding to some extent and modern processes a r e requiring finer and finer coal powders. Knowledge of the proper- ties of these coal powders is essential in developing these processes. For example, knowledge of shapes and s izes of particles is important in defining the viscosity and transport h c h v i w of coal- liquid slurries for combustion o r pipeline transport. KnmiIcSge of separation of phases is impor- tant in developing beneficiation processes to remove impurities.
Tke ~ i u d y reported in this paper used microscopy, shape, s ize and sulfur analyses to show the influence of fracture modes and mechanisms on shape and size of coal particles and separation of phases. The preferential lines of f racture during coal grinding were identified microstructurally and related to the s ize and shape of particles produced and the Separation of mineral and organic phases. For example, weaker phases that were lean in organic sulfur were observed to concen- t ra te into finer particle size ranges and stronger phases that were rich in organic sulfur concen- trated into coarser particle size ranges.
EXPERIMENTAL
Two coals of widely differing rank were selected for, this study: a lignite from the Fort Union Bed near Savage, Montana and a medium volatile bituminous (MVB) from the Beckley seam near Duo, West Virginia. These two coals (PSOC-837 and PSOC-985) were obtained from the Pennsylvania State University's coal sample bank.
Prior to ball milling, the coals were preground in nitrogen to minus 20 mesh (v. S. stan- dard screen, 8 4 0 ~ opening size) in a wheel-type pulverizer. The coal (350 g) was transferred in the N2 atmosphere to a 1 . 8 L steel ball mill, which was then evacuated and backfilled with helium. During rotation of the mill, coal powders were withdrawn in a long, cylindrical scoop inserted along the axis of rotation through a hole plumbed with a rotary union and ball valves to maintain the at- mosphere.
RESULTS AND DISCUSSION
During coal grinding, particle microstructure affected the fracture modes which in turn affected shape and size of particles and separation of phases. Optical micrographs of polished particle cross-sections (Figure 1) illustrate the tendency for separation of organic phases in the early stages of grinding. With both lignite and MVB, fracture tended to proceed preferentially along organic-to-organic interfaces, as shown by the separate and microstructurally more uniform particles already present after the pregrind s tep and the incomplete but progressing fractures along interfaces in the particles, indicated by arrows.
Fracture a lso tended to preferentially proceed along mineral-to-organic interfaces and
* The Pacific Northwest Laboratory is operated by Battelle Memorial Institute for the Department of Energy. The research was sponsored by the Basic Energy Science, Division of Material Science, under Contract DE-AC06-76RLO 1830.
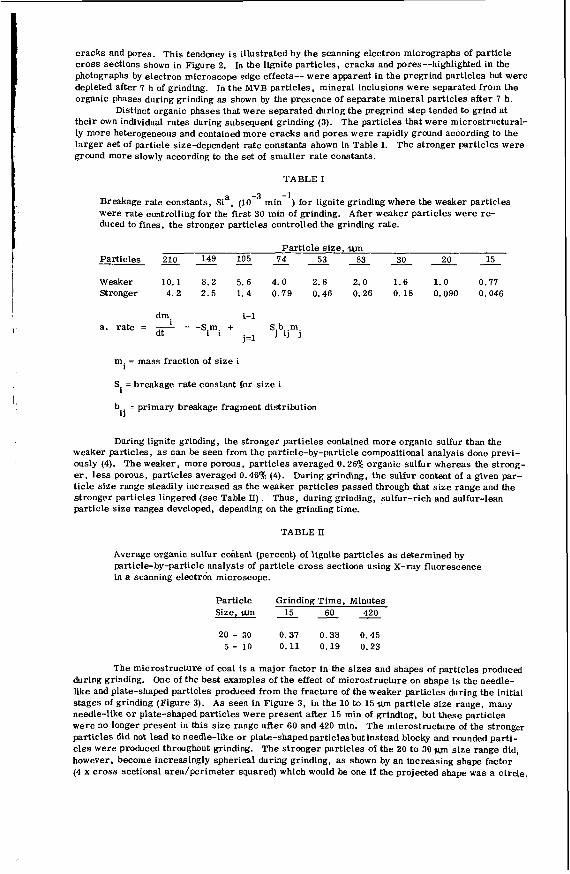
cracks and pores. This tendency is illustrated by the scanning electron micrographs of particle cross sections shown in Figure 2. In the lignite particles, cracks and pores--highlighted in the photographs by electron microscope edge effects-- were apparent in the pregrind particles but were depleted after 7 h of grinding. In the MVB particles, mineral inclusions were separated from the organic phases during grinding as shown by the presence of separate mineral particles after 7 h.
their own individual rates during subsequent grinding (3). The particles that were microstructural- ly more heterogeneous and contained more cracks and pores were rapidly ground according to the larger Set of particle size-dependent rate constants shown in Table I. The stronger particles were ground more slowly according to the set of smaller rate constants.
Distinct organic phases that were separated during the pregrind step tended to grind a t
TABLE I
-3 -1 min Breakage rate constants, Sia, (10
Were rate controlling for the first 30 min of grinding. After weaker particles were re- duced to fines, the stronger particles controlled the grinding rate.
) for lignite grinding where the weaker particles
Particle s ize , wn Particles 210 149 105 74 53 83 30 20 15
Weaker 10.1 8.2 5.6 4.0 2.8 2.0 1.6 1.0 0.77 Stronger 4.2 2.5 1.4 0.79 0.46 0.26 0.18 0.090 0.046
- - - - - - - - - -
I dm I-1
dt 1 1 J 13 1 i a. rate = - = -S.m. + S.b..m. 1,
I,
m. = mass fraction of size i
S. = breakage rate constant for s ize i
b.. = primary breakage fragment distribution 13
During lignite grinding, the stronger particles contained more organic sulfur than the weaker particles, as can be seen from the particle-by-particle compositional analysis done previ- ously (4). The weaker, more porous, particles averaged 0.26% organic sulfur whereas the strong- er, less porous, particles averaged 0.46% (4). During grinding, the sulfur content of a given par- ticle size range steadily increased as the weaker particles passed through that s ize range and the stronger particles lingered (see Table II) . Thus, during grinding, sulfur-rich and sulfur-lean particle size ranges developed, depending on the grinding time.
TABLE II
Average organic sulfur content (percent) of lignite particles a s determined by particle-by-particle analysis of particle cross sections using X-ray fluorescence in a scanning electron microscope.
Particle Grinding Time, Minutes Size,- 2 _. 60 - 420
20 - 30 0.37 0.38 0.45 5 - 10 0.11 0.19 0.23
The microstructure of coal is a major factor in the s izes and shapes of particles produced during grinding. One of the best examples of the effect of microstructure on shape is the needle- like and plate-shaped particles produced from the fracture of the weaker particles during the initial stages of grinding (Figure 3). As seen in Figure 3, in the 10 to 1 5 m particle size range, many needle-like or plate-shaped particles were present after 15 min of grinding, but these particles were no longer present in this size range after 60 and 420 min. The microstructure of the stronger particles did not lead to needle-Vie or plate-shapedparticles but instead blocky and rounded parti- cles were produced throughout grinding. The stronger particles of the 20 to 30 size range did, however, become increasingly spherical during grinding, as shown by an increasing shape factor (4 x cross sectional area/perimeter squared) which would be one if the projected shape was a circle.
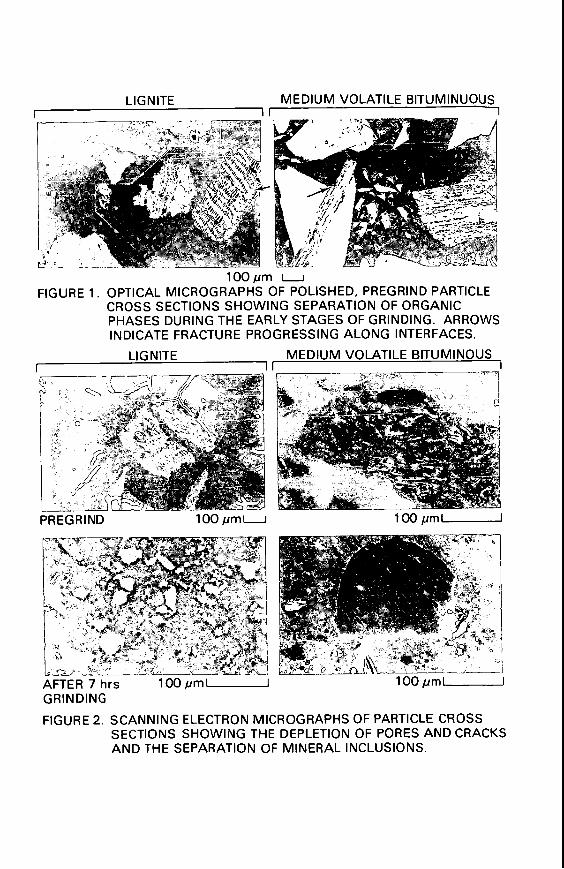
LIGNITE MEDIUM VOLATILE BITUMINUOUS I I I I
100pm u FIGURE 1. OPTICAL MICROGRAPHS OF POLISHED, PREGRIND PARTICLE
CROSS SECTIONS SHOWING SEPARATION OF ORGANIC PHASES DURING THE EARLY STAGES OF GRINDING. ARROWS INDICATE FRACTURE PROGRESSING ALONG INTERFACES.
LIGNITE MEDIUM VOLATILE BITUMINOUS I
PREGRIND 100 p m u 900 ,urn-
AFTER 7 hrs 100 pm- GRINDING
100 p m U
FIGURE 2. SCANNING ELECTRON MICROGRAPHS OF PARTICLE CROSS SECTIONS SHOWING THE DEPLETION OF PORES AND CRACKS AND THE SEPARATION OF MINERAL INCLUSIONS.
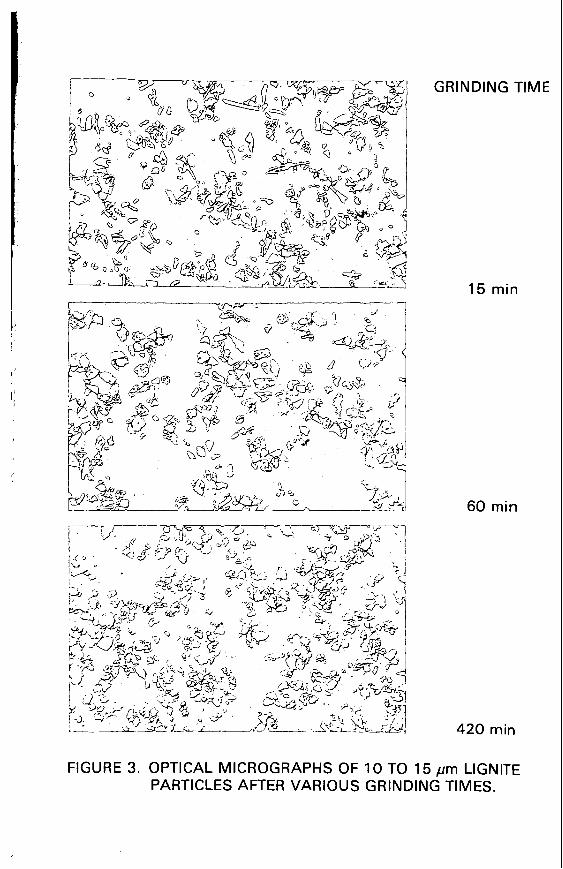
GRINDING TIME
15 min
60 min
420 min
FIGURE 3. OPTICAL MICROGRAPHS OF 10 TO 15 pm LIGNITE PARTICLES AFTER VARIOUS GRINDING TIMES.
The shape factor was 0.47, 0.47 and 0.62 after 15, 60 and 420 min of grinding, respectively.
CONCLUSIONS
During coal grinding, the modes and mechanisms of fracture change with time and particle Fracture tends to proceed preferentially first along organic-to-organic interfaces, then along size.
mineral-to-organic interfaces and cracks and pores: f i r s t , through the largest cracks and pores, then through gradually smaller cracks and pores a s encountered by the s t ress field. Thus, parti- cles with limited porosity and mineral inclusions a r e the stronger particles that tend to grind at lower rates.
Modeling studies indicate. that two sets of comminution rate constants a r e required to mo- del the grinding of lignite because weaker components control the rates initially and stronger com- ponents control the rates later in grinding.
These modes and mechanisms of fracture cause changes in the shape and size of particles and the separation of phases. The shapes and sizes of particles a r e first changed by fracture through organic-to-organic interfaces, then by the microstructure of the weaker phases and finally by the microstructure of the stronger phases. During lignite grinding, the weaker phases produce needle-like or plate-shaped particles that are changed to more blocky and rounded shaped particles a s particle size is decreased. The stronger phases produce blocky and rounded shaped particles that become more rounded with longer grinding times.
In both coals the organic phases a r e separated initially by the tendency for fracturing pre- ferentially through organic-to-organic interfaces. Then the stronger phases a r e ground more slow- ly than the weaker phases. The stronger phases of lignite have greater organic sulfur content than the weaker phases. Thus, there i s a stage in grinding where low-sulfur particles a r e concentrated in the fines and high-sulfur particles a r e concentrated in the larger size ranges.
Mineral phases a r e separated from the organic phases during. grinding. The exiicteni of se- paration depends on the size distrihutl~n ~f %e mineral phases and the extent of grinding.
The size and shape of particles and the separation of phases a r e important factors in mo- dern coal processes. include coal-to-liquid ratio, rheological properties of slurry, particle size distribution and mineral content. marked effect on slurry viscosity as well as the packing density of slurries, thus, it may be advan- tageous to grind a coal more extensively in some cases to produce more rounded particles. The potential for removal of mineral impurities increases with grinding time. However, the potential for removal of organic sulfur may be greater a t an intermediate stage of grinding. Thus, detailed knowledge of the coal grinding arocess can greatly increase the potential for more efficient and en- vironmentally safe ways of using coal.
For example, in producing and using coal-liquid slurries important factors
The results of this study impact all of those factors. The shapes of particles can have a
LITERATURE CITED
(1) (2)
(3)
(4)
Robinson, A. L.; "Can Physicists Clean Up Coal's Act?", Science, 213, 1484 (1981). Study Group on Research Planning for Coal Utilization and Synthetic Fuel Production, B. R. Cooper, Chairman, Rev. Mod. Phys. 53 (4, Part 2) (1981). Lytle, J. M. , Daniel, J. L. and Prisbrey, K. A . , "The Effect of Microstructure on the Size and Shape of Coal Particles During Comminution", submitted to Fuel (1983). Lytle, J. M. , Daniel, 3. L. and Tingey, G. L. , "Concentration of Sulfur and Mineral- Rich Components in Particle Classes m r i n g Coal Comminution", submitted to Fuel (1982).
GENERAL PAPERS - POSTER SESSION PRESENTED BEFORE THE DIVISION OF PETROLEUM CHEMISTRY, INC.
AMERICAN CHEMICAL SOCIETY WASHINGTON, D. C. MEETING, AUGUST 28 - SEPTEMBER 2 , 1983
RAPID DISSOLUTION OF COAL FOR ANALYSIS FOB SULFUR, IRON, AND OTHER ELEMENTS
BY
R. Markuszewski, B. C. Wheeler, andR. S. Johnson Iowa State Mining and Mineral Resources Research Institute
Iowa State University, Ames, Iowa 50011
C. C. Hach Hach Chemical Company, P.O. Box 389, Loveland, Colorado 80537
and
ABSTRACT
Most dissolution methods necessary for the determination of major, minor, and trace constituents in coal are tedious and require unusual procedures. A rapid dissolution method is based on heating 250 mg coal with 10 ml of a 4:3:3 mixture of HNO3, HClO4 (72%$, and &PO4 (85%). In numerous analyses of 8 subbituminous and bi- tuminous coals using a simple digestion apparatus, the entire sample was dissolved in 20-45 min. , leaving silica in a pure form suitable for determination by filtration, ignition, and weighing as BO,. In the clear filtrate, total sulfur was determined by a turbidimetric measure- ment of BaSO4. For the 8 coals, containing 0.41-4.20% S, the results agreed well with those obtained by using a combustion method followed by automatic iodometric titration of the SO2. In other aliquots of the same filtrate, total iron was determined speckophotometrically using FerroZine. For an iron range of 0.113-1.7628, the standard devi- ations were 0.001-0.050. The clear digest can be also used to de- termine other elements by spectrophotometric, atomic absorption, or other procedures.
GENERAL PAPERS - POSTER SESSION PRESENTED BEFORE THE DIVISION OF PETROLEUM CHEMISTRY, INC.
AMERICAN CHEMICAL SOCIETY WASHINGTON, D. C. MEETING, AUGUST 28-SEPTEMBER 2, 1983
GUM AND DEPOSIT FORMATION FROM JET TURBINE AND DIESEL FUELS
BY
F. R. MayoandB. Y. Lan SRI International, Menlo Park, California 94025
INTRODUCTION
The objective of this work is to determine the chemistry of deposit formation in hot parts
Previous work in the field has been extensive (1, 2). but a real understanding of deposit of je t turbine and diesel engines and, thus, to predict and prevent deposit formation.
formation has been elusive. Work at SRI started on the basis that deposit formation from fuels must take place stepwise and is associated with autoxidation and the hydroperoxide produced (3). More recent work (4) showed that in the absence of dissolved oxygen, higher temperatures a r e required for deposit formation. Our recent report (5) indicated that gum and deposit formation proceed mainly through oxidation products of the parent hydrocarbon, coupling of these products to dimeric, tr imeric and higher condensation products (partly or wholly by radicals from hydroperoxides) and precipitation of insoluble products. We know of no information on how these first precipitates a r e converted to the ultimate, very insoluble, carbonaceous materials that cause epglse problems.
in both pure hydrocarbons and mixed hydrscarbon fuels. Some patterns appear that can be largely explained on the basis sf what is known about co-oxidations of hydrocarbon mixtures.
The present paper describes measurements of rates sf oxidation and soluble gum formation
EXPERIMENTAL PROCEDURES
All of our hydrocarbons and fuels were distilled at about 10 torr before use. This step eliminated the highest boiling 2-5% of the fuels, but was essential to eliminate whatever gum had accumulated before the fuel was distilled. The fuels were then stored under nitrogen at -8°C until used. Some of the purchased "pure" hydrocarbons exhibited marked induction periods on oxidation, but in all such cases, chromatography through acidic alumina resulted in faster oxidations at fairly steady rates.
intervals, 7 0 G samples of gas were withdrawn and analyzed for oxygednitrogen ratio by gas chromatography on a 6 ' x 1/8" 0. D. stainless steel column packed with 13X molecular sieve and attached to a thermal conductivity detector. Soluble gum was determined by evzporating a weighed 5-mL sample of fuel in a gentle stream of nitrogen at 160°C (without spattering). The residue 6 0 . 1 mL) was then transferred with 1-2 mL of acetone to a tared aluminum dish weighing about 50 mg. This sample was then brought to constant weight (3-10 h) in a gentle stream of nitrogen in a furnace at 200°C. Weighings were made on a Perkin Elmer AD22 electromicrobalance. This me- thod gave results reproducible within 20% at low levels of gum, usually within 5% at higher levels.
Fuels A and C a r e very stable and very unstable je t turbine fuels supplied by NASA-Lewis Research Center. Fuels 1, 10, 13, 14 and 15 a r e diesel fuels supplied by the U. S. Army Fuels and Lubricants Research Laboratory.
A l l of ou r oxidations were carried out in an oil bath at 130°C, with shaking under air . At
RESULTS
Table I summarizes our work on pure hydrocarbons and several fuels; it shows that gum formation is closely associated with oxidation. Indene and N-methylpyrrole (NMP) a r e listed se- parately at the bottom of the table because they a r e special cases. The other materials a r e listed in the first column of figures according to decreasing rates of oxygen absorption under a i r at 130°C. There is a clear distinction between the pure compounds, which oxidize faster and the fuels, which oxidize slower. The second column of figures lists the same materials in order of decreasing rate of gum formation, which is nearly the same a s the order for oxidation. The figures in the last column a r e the quotients of the rates for the indicated fuels in the previous columns. This column show that the pure, fastest oxidizing compounds usually require the most oxygen to produce a milli- gram of gum, or that the fuels at the bottom of this column produce the most gum for the oxygen absorbed. The quotient i s constant with time for Fuel A ; similar information i s lacking for other fuels.
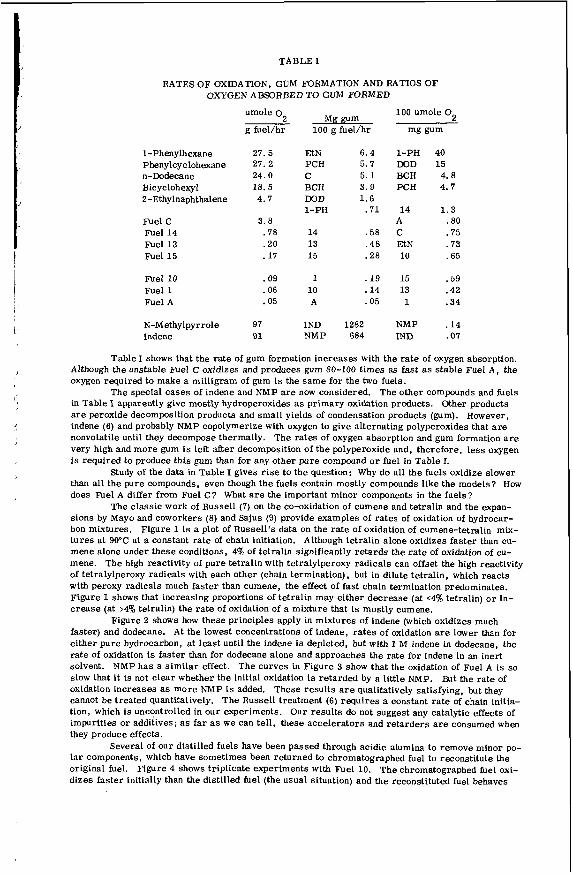
TABLE I
RATES OF OXIDATION, GUM FORMATION AND RATIOS OF OXYGEN ABSORBED TO GUM FOAMED
1-Phenylhexane Phenylcyclohexane n-Dodecane Bicyclohexyl 2-Ethylnaphthalene
Fuel C Fuel 14 Fuel 13 Fuel 15
Fuel 10 Fuel 1 Fuel A
N-Methylpyrrole Indene
2 umole 0
g fuel/hr
27.5 27. 2 24.0 18. 5 4.7
3.8 .78 .20 .17
.09
.06
.05
97 91
Mg gum 100 g fuel/hr
EtN 6.4 PCH 5.7 C 5.1 BCH 3.9 DOD 1.6 1-PH .71
14 .58 13 .48 15 .28
1 .19 10 .14 A .05
IND 1282 NMP 684
100 umole O2
mg gum
1-PH 40 DOD 15 BCH 4.8 PCH 4.7
14 1.3 A .80 C .75 EtN .73 10 .65
IS .59 13 .42 1 .34
NMP .14 IND . 01
Table I shows that the rate of gum formation increases with the rate of oxygen absorption. Although the unstable Fuel C oxidizes and produces gum 80-100 times as fast a s stable Fuel A , the oxygen required to make a milligram of gum is the same for the two fuels.
The special cases of indene and NMP are now considered. The other compounds and fuels in Table I apparently give mostly hydroperoxides as primary oxidation products. Other products are peroxide decomposition products and small yields of condensation products (gum). However, indene (6) and probably NMP copolymerize with oxygen to give alternating polyperoxides that are nonvolatile until they decompose thermally. The rates of oxygen absorption and gum formation a r e very high and more gum is left after decomposition of the polyperoxide and, therefore, less oxygen is required to produce this gum than for any other pure compound or fuel in Table I.
Study of the data in Table I gives rise to the question: Why do all the fuels oxidize slower than all the pure compounds, even though the fuels contain mostly compounds like the models? How does me1 A differ from Fuel C? What are the important minor components in the fuels?
The classic work of Russell (7) on the co-oxidation of cumene and tetralin and the expan- sions by Mayo and coworkers (8) and Sajus (9) provide examples of rates of oxidation of hydrocar- bon mixtures. Figure 1 is a plot of Russell’s data on the rate of oxidation of cumene-tetralin mix- tures at 90°C at a constant rate of chain initiation. Although tetralin alone oxidizes faster than cu- mene alone under these conditions, 4% of tetralin significantly retards the ra te of oxidation of cu- mene. The high reactivity of pure tetralin with tetralylperoxy radicals can offset the high reactivity of tetralylperoxy radicals with each other (chain termination), but in dilute tetralin, which reacts with peroxy radicals much faster than cumene, the effect of fast chain termination predominates. Figure 1 shows that increasing proportions of tetralin may either decrease (at ~ 4 % tetralin) or in- crease (at >4% tetralin) the ra te of oxidation of a mixture that is mostly cumene.
faster) and dodecane. At the lowest concentrations of indene, rates of oxidation are lower than for either pure hydrocarbon, at least until the indene is depleted, but with 1 M indene in dodecane, the rate of oxidation is faster than for dodecane alone and approaches the rate for indene in an inert solvent. NMP has a similar effect. The curves in Figure 3 show that the oxidation of Fuel A is so slow that it is not clear whether the initial oxidation is retarded by a little NMP. But the rate of oxidation increases as more NMP is added. These results a r e qualitatively satisfying, but they cannot be treated quantitatively. The Russell treatment (6) requires a constant ra te of chain initia- tion, which is uncontrolled in our experiments. Our results do not suggest any catalytic effects of impurities or additives; as f a r as we can tell, these accelerators and retarders are consumed when they produce effects.
Several of our distilled fuels have been passed through acidic alumina to remove minor po- la r components, which have sometimes been returned to chromatographed fuel to reconstitute the original fuel. Figure 4 shows triplicate experiments with Fuel 10. The chromatographed fuel oxi- dizes faster initially than the distilled fuel (the usual situation) and the reconstituted fuel behaves
Figure 2 shows how these principles apply in mixtures of indene (which oxidizes much
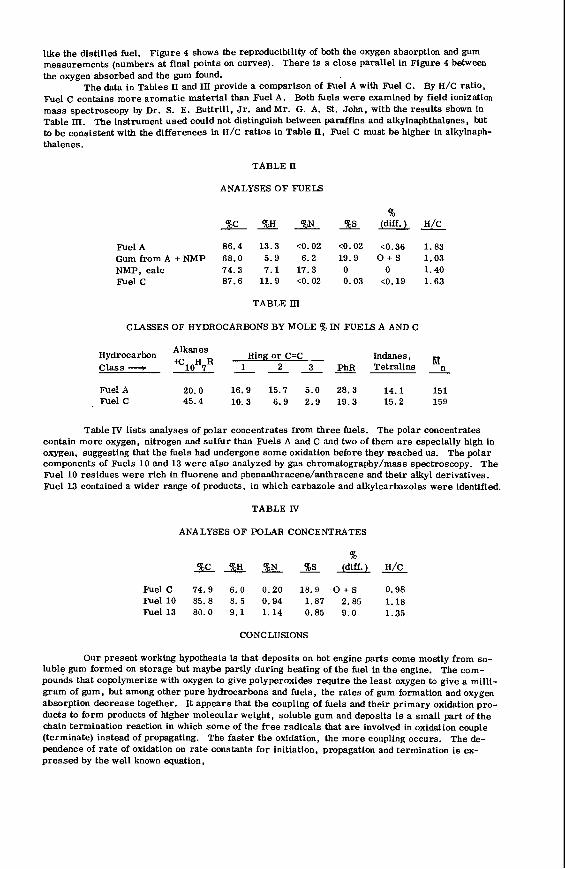
like the distilled fuel. measurements (numbers a t final points on curves). There is a close parallel in Figure 4 between the oxygen absorbed and the gum found.
The data in Tables Ii and III provide a comparison of Fuel A with Fuel C. By H/C ratio, Fuel c contains more aromatic material than Fuel A. Both fuels were examined by field ionization mass spectroscopy by Dr. S. E. Buttrill, Jr. and Mr. G. A. St. John, with the results shown in Table m. The instrument used could not distinguish between parafftns and akylnaphthalenes, but to be consistent with the differences in H/C ratios in Table II, Fuel C must he higher in alkylnaph- thalenes.
Figure 4 shows the reproducibility of both the oxygen absorption and gum
TABLE II
ANALYSES OF FUELS
% %C %H %N %S H/C
Fuel A 86.4 13.3 CO.02 <0.02 <0.36 1.83 Gum from A +NMP 68.0 5.9 6 . 2 19.9 0 + S 1.03 NMP, calc 74.3 7 . 1 17.3 0 0 1.40
- - - -
Fuel C 87.6 11.9 ~ 0 . 0 2 0.03 <0.19 1 .63
TABLE III
CLASSES OF HYDROCARBONS BY MOLE % IN FUELS A AND C
Hydrocarbon Akanes Ring or C=C Indanes , 1 2 3 phR Tetralina Class- ___ - - - __ ~
lax2 A 20 .0 16.9 15.7 5 . 0 28.3 14.1 Fuel C 45.4 10.3 6 .9 2.9 19.3 15.2
_. 'n
151 159
Table IV l ists analyses of polar concentrates from three fuels. The polar concentrates contain more oxygen, nitrogen and sulfur than Fuels A and C and two of them a r e especially high in oxygen, suggesting that the fuels had undergone some oxidation before they reached us. The polar components of Fuels 10 and 13 were also analyzed by gas chromatography/mass spectroscopy. The Fuel 10 residues were rich in fluorene and phenanthracene/anthracene and their alkyl derivatives. Fuel 13 contained a wider range of products, in which carbazole and alkylcarbazoles were identified.
TABLE IV
ANALYSES OF POLAR CONCENTRATES
% %C %H %N %S (diff.) H/C
Fuel C 74.9 6.0 0.20 18.9 0 + S 0.98 Fuel 10 85.8 8.5 0 .94 1.87 2.85 1.18 Fuel13 80.0 9 .1 1 .14 0.85 9 . 0 1.35
CONCLUSIONS
-- - -
Our present working hypothesis is that deposits on hot engine parts come mostly from so- luble gum formed on storage but maybe partly during heating of the fuel in the engine. The com- pounds that copolymerize with oxygen to give polyperoxides require the least oxygen to give a milli- gram of gum, but among other pure hydrocarbons and fuels, the rates of gum formation and oxygen absorption decrease together. It appears that the coupling of fuels and their primary oxidation pro- ducts to form products of higher molecular weight, soluble gum and deposits is a small part of the chain termination reaction in which some of the free radicals that a r e involved in oxidation couple (terminate) instead of propagating. The faster the oxidation, the more coupling occurs. The de- pendence of ra te of oxidation on rate constants for initiation, propagation and termination is ex- pressed by the well known equation,
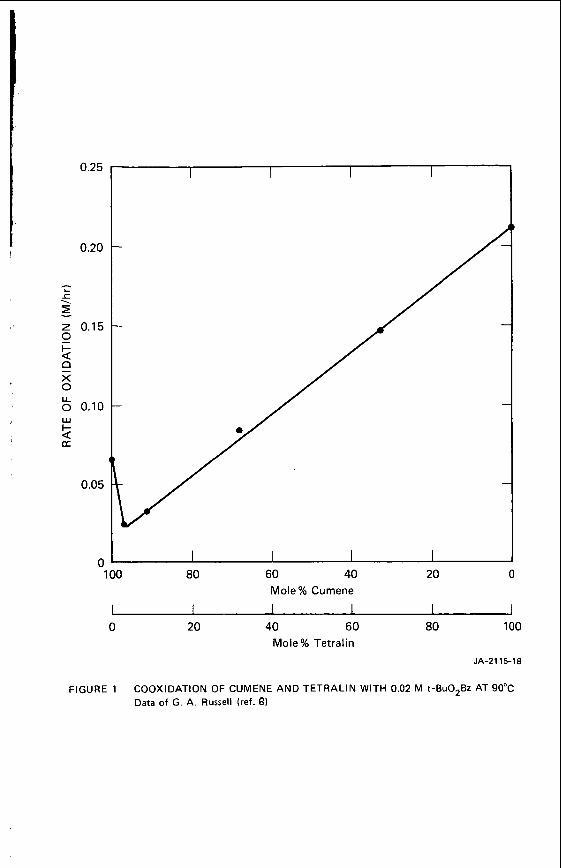
0.25
0.20
z 0.15
I- 0 3 - X 0
8 0.10
G w
a
0.05
0 100 80 60 40 20 0
Mole% Cumene
0 20 40 60 Mole% Tetralin
80 100
JA-2115-18
FIGURE 1 COOXIDATION OF CUMENE AND TETRALIN WITH 0.02 M t-Bu02BZ AT 90°C Data of G. A. Russell (ref. 6)
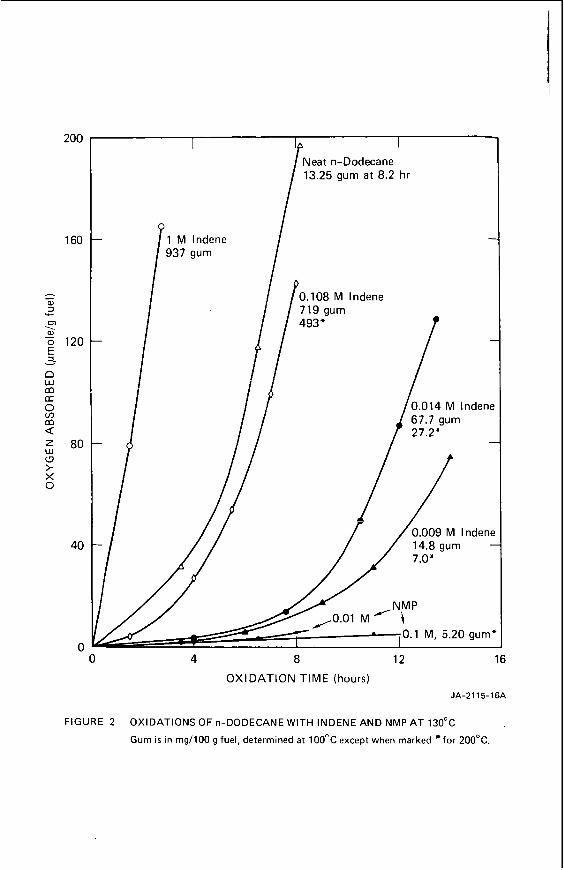
=i - n m w (r
E a m
z w U > X 0
120
80
40
0
I
Neat n-Dodecane 13.25 gum a t 8.2 hr
0 4 8 12 16 OXIDATION TIME (hours)
JA-2115-16A
FIGURE 2 OXIDATIONS OF n-DODECANE WITH INDENE AND NMP AT 13OoC
Gum i s in mg/100 g fuel, determined a t 100°C except when marked for 2OO0C.
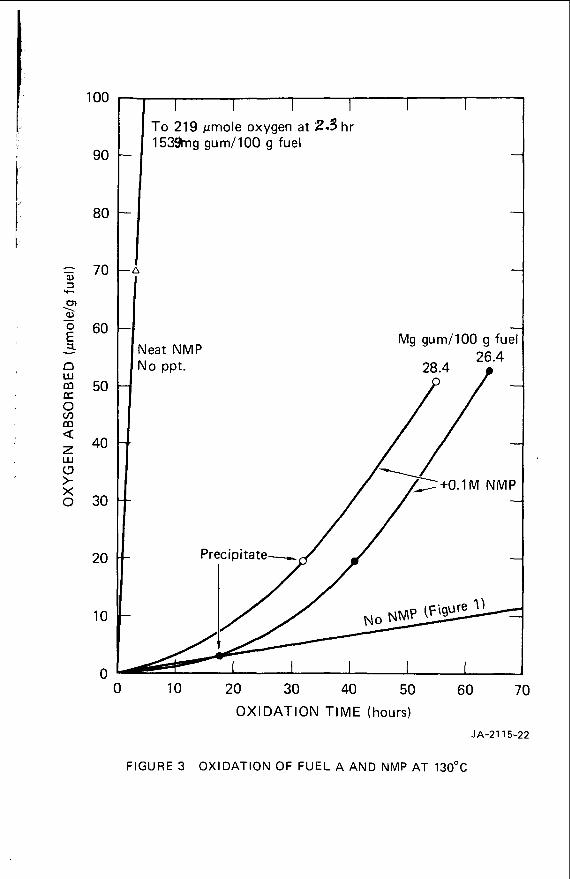
100
90
80
70
60
50
40
30
20
10
0
I To 219 pmole oxygen a t 2.3 hr 1539mg gum/100 g fuel
Mg gum/100 g fu Neat NMP No ppt.
-
0 10 20 30 40 50 60 70 OXIDATION TIME (hours!
JA-2115-22
FIGURE 3 OXIDATION OF FUEL A AND NMP AT 130°C
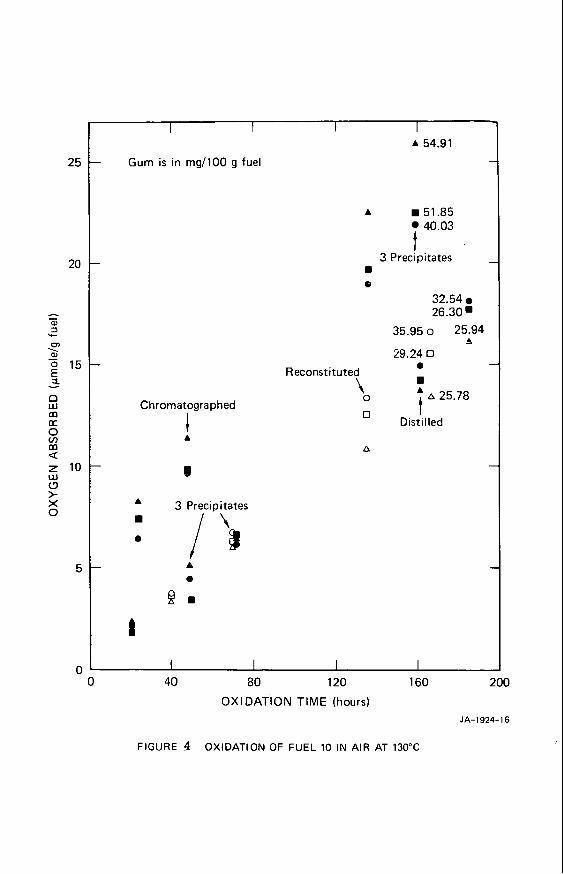
A 54.91
Gum is in mg/100 g fuel
A 51.85 40.03
3 Precipitates I
0
Reconstituted \\ 0
0 Chromatographed
I A
A
0
I
A
b
3 Precipitates
I ‘a
32.54 26.30,
35.95 o 25.94
29.24 0 A
a
Ir A 25.78 t Distilled
0 0 40 80 120 160 200
OXIDATION TIME (hours) JA-1924-16
FIGURE 4 OXIDATION OF FUEL 10 IN AIR AT 130°C
For fuels that contain mostly paraffins, naphthenes and alkylbenzenes, the kps should be quite similar. We think that is the most susceptible of the three constants to the effect of other fuel components, which may explain why nearly all the fuels oxidize and produce gum slower than the pure hydrocarbons. Although ki can be affected moderately by minor components, any effect on in- creasing the rate of peroxide decomposition will be offset by a decrease in the steady state concen- tration of peroxides. It is known that polynuclear aromatic hydrocarbons and their alkyl derivatives a r e very reactive toward peroxy radicals and that their chain termination constants in oxidation vary over a wide range (lo).
of a radical condensation mechanism a r e lacking, it appears to us now that the most fruitful ap- proach to understanding and reducing gum and deposit formation in fuels is through the effects of condensed aromatic and heterocyclic compounds on the rates of oxidation of fuels.
Other factors that appear to be critical in gum and deposit formation a r e the effects of ox- ygen concentration and metals and the mechanism by which soluble gum evolves into insoluble de- posits. Ourconclusions based on oxidation at 130°C should eventually be confirmed by tests a t storage temperatures, although the relative stabilities of fuels appear not to change much hetween 40 and 150°C (11).
Although a non-radical condensation mechanism has not been excluded and although details
ACKNOWLEDGMENT
This research was supported by the U. S. Army Research Office and NASA-Lewis Re- search Center.
LITERATURE CITED
Nixon, A. C . , Chapter 17 in Autoxidation and Antioxidants, W. 0. Lundberg, ed., Wiley Interscience, NY (1962). CRC Literature Survey on the Thermal Oxidation Stability of Jet Fuel, Report No. 509 of Coordinating Research Council, Inc. , Atlanta (1979). Mayo, F. R. , Rlchardson, H. and Mayorga, G. D., PREPRINTS, Div. of Petrol. Chem., ACS, (l), 33 (1975).
Mayo, F. R . , Buttrill, S. E. , Jr., Lan, B. , St. John, G. A. and Dulin, D., Preprints, Div. of Fuel Chem. , 21 (2), 76 (1982). Russell, G. A . , J. Amer. Chem. Soc., E, 1035, 1041 (1956). Ibid., E, 4583 (1955). Mayo, F. R. , Syz, M. G . , Mill, T. andcastleman, J. K., Adv. Chem. Series, 5, 38 (1968). Sajus, L., Adv. Chem. Series, 75, 59 (1968). Huntington, J. G . , Mayo, F. R. and Kirschen, N. A. , Fuel, g, 31 (1979). Stavinoha, L. L. , Westbrook, S. R. and Brinkman, D. W. , DOE/BC/10043-12 (1980).
(2), pg. 71.
GENERAL PAPERS - POSTER SESSION PRESENTED BEFORE THE DIVISION OF PETROLEUM CHEMISTRY, INC.
AMF,RICAN CHEMICAL SOCIETY WASHINGTON, D.C. MEETING, AUGUST 28 - SEPTEMBER 2, 1983
FT-IR MEASUREMENTS OF ALIPHATIC AND AROMATIC C-H GROUPS IN COAL
BY
B. Riesser, M. Starsinic, A. Davis, and P. C. Painter College of Earth and Mineral Sciences
The Pennsylvania State University, University Park, Pennsylvania 16802
ABSTRACT
The experimental difficulties involved in the study of coal structure are both notorious and well-documented. Nevertheless, recent improvements in spectroscopic instrumentation have al- lowed the determination of what are thought to be reasonably a e curate parameters describing an average coal structure. For example, Fourier transform infrared spectroscopy (FT-IR) has been applied to the determination of aromatic and aliphatic hydro- gen. Unlike measurements of aromaticity by NMR, hoWev.or, hi- frared methwk rely ori caiibrating the intensities of specific bands to the concentration of the appropriate functional groups, using model compounds or other procedures. We have recently found that the values obtained depend heavily on the choice of bands and the methodology employed. In addition, the calibration coefficients vary considerably with rank. We will discuss the various ap- proaches we have employed and the e r rors involved in each. Our results indicate that the best that can be achieved is the definition of a band of values of aromatic and aliphatic hydrogen.
GENERAL PAPERS - POSTER SESSION
AMERICAN CHEMICAL WCIETY WASHINGTON, D. C. MEETING, AUGUST 28-SEPTEMBER 2 , 1983
PRESENTED BEFORE THE DIVISION OF PETROLEUM CHEMISTRY, INC.
SULFUR COMWNENTS ANALYSIS I N HYDROCARBON MATRM BY GAS CHROMATOGRAPHY
BY
0. PUZiC Esso Chemical Canada, P. 0. Box 3004, Sarnia, Ontario, Canada N7T 7M5
INTRODUCTION
Determination of low concentrations of sulfur-containing gases has received considerable attention in recent years (1-6). The need i s particularly acute in the petroleum industry, since the trace amounts of sulfur compounds cause corrosion and poison cataiysts. Because of their reac- tivity and labile nature, a s well a s diversity of stream composition, determination of sulfur com- ponents in hydrocarbon matrix i s a complex and intricate task. This paper presents a method for GC analysis of trace levels (0-200 ppm) of sulfur compounds in gaseous hydrocarbon streams.
EXPERIMENTAL
'Chromatography
Flame Ionization Detector (FPD and FID, respectively) and Vista 401 Dual Channel Data System was employed. Material used for sample transfer lines, 1 cc gas sample loop and the column was high grade, acetone-washed nickel. The gas sample was introduced onto the column via a six port teflon Valco valve. Two certified standard gas blends, compressed in an aluminum gas cylinder from Scott Specialty Gases, were used a s calibration gases. Standard 1 contained: hydrogen sul- fide, methyl mercaptan, ethyl mercaptan, dimethyl sulfide and dimethyl disulfide in nitrogen ma- trix. Standard 2 contained: dimethyl sulfide, methyl ethyl sulfide, diethyl sulfide and diethyl di- sulfide in nitrogen matrix. The concentration of each component was certified within 2 2%. Ultra high purity He was used for the ca r r i e r gas and high purity hydrogen and a i r for the flame gases in the two detectors. The optimal flow rates for the flame photometric detector fuel gases were found to be: H2, 142 ml/min; a i r #1, 80 ml/min; air #2, 170 mI/min. In the f i rs t flame, decomposition of the sample takes place. Combustion products from sulfur-containing compounds wlll produce op- tical emission in the second flame from the S radicals formed. The Varian flame photometric de- tector employs a filter with maximum optical2transmission at 365 nm for sulfur detection. For the flame ionization detector, the fuel gas flow rates were: H2, 30 ml/min; and a i r , 300 ml/min. The car r ie r gas flow ra te was 26 ml/min.
composition and the hydrocarbon concentration. various sulfur species a s well a s resolution between hydrocarbons and sulfur compounds such as H2S, C1 and C2 mercaptans, sulfides and disulfides was achieved using a 6 ' x 1/8" acetone-washed nickel column packed with oxi-propionitrile/Porasil C - Durapak 80-100 mesh. However, when analyzing H2S in propylene rich streams (propylene concentration greater than loo/o), there is no longer a baseline separation between H2S and propylene with this column. A phenomenon referred to as "quenching effect" takes place in the detector, whereby the decrease in sulfur response is ap- parently due to inactivation of the excited S2 species by its combination or collision with a hydrocar- bon and its degradation products (5, 7). Silicone, QF-1 (5%) on Porapak QS column packing materi- al will provide the necessary separation in the H2S region when high propylene concentration is ex- pected (6).
An effluent splitter (ratio 50550) i s placed on the outlet of the column to send identical gas streams to the FPD and the FID, thereby allowing detection of components on both detectors simul- taneously. The temperature programming profile suitable for most applications was: initial tem- perature, 70'C; final temperature, 100°C; hold, 45 min. ; ra te 10'C/min. Retention times for vari- ous sulfur compounds obtained using the chromatographic conditions described above a r e presented in Table I.
Calibration and Analysis For quantitative analysis of Sulfur species, an external standard method was used for Cali-
bration. After the sample loop had been purged with the calibration gas for several minutes, the sample of calibration gas was injected, at atmospheric pressure, by means of a six-port injection
Varian Model 3700 Gas Chromatograph equipped with a Dual Flame Photometric and a
The type of column packing material used for trace sulfur analysis depends on the stream For most applications, a complete separation of
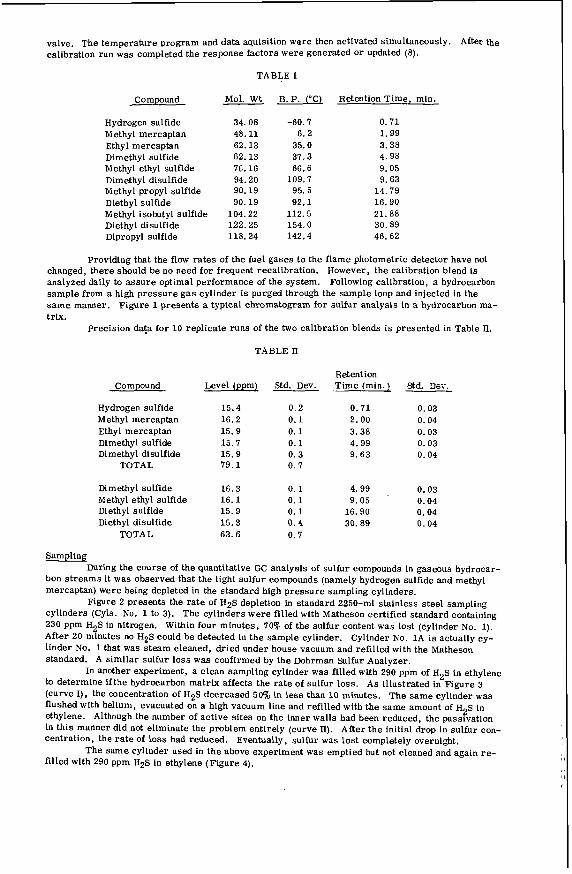
valve. The temperature program and data aquisition were then activated simultaneously. calibration run was completed the response factors were generated or updated (8).
After the
TABLE I
Compound Mol. Wt B. P. (“C) Retention Time, min.
Hydrogen sulfide Methyl mercaptan Ethyl mercaptan Dimethyl sulfide Methyl ethyl sulfide Dimethyl disulfide Methyl propyl sulfide Diethyl sulfide Methyl isobutyl sulfide Diethyl disulfide Dipropyl sulfide
34.08 48.11 62.13 62.13 76.16 94.20 90.19 90 .19
104.22 122.25 118.24
-60.7 6 . 2
35 .0 37 .3 66 .6
109 .7 95 .5 92 .1
112.5 154.0 142.4
0.71 1 . 9 9 3 .38 4 .98 9 .05 9 .63
14 .79 16.90 21.88 30 .89 46 .62
Providing that the flow rates of the fuel gases to the flame photometric detector have not changed; there should be no need for frequent recalibration. However, the calibration blend i s analyzed daily to assure optimal performance of the system. Following calibration, a hydrocarbon sample from a high pressure gas cylinder is purged through the sample loop and injected in the same manner. Figure 1 presents a typical chromatogram for sulfur analysis in a hydrocarbon ma- trix.
Precision data for 10 replicate runs of the two calibration blends is presented in Table II.
TABLE U
Retention Compound Level (ppml Std. Dev. Time (min.1 Std. Sev.
Hydrogen sulfide 15.4 0 . 2 0 .71 0 .03 Methyl mercaptan 16 .2 0.1 2 .00 0 .04 Ethyl mercaptan 15.9 0 . 1 3.38 0 .03 Dimethyl sulfide 15.7 0 . 1 4 .99 0 .03 Dimethyl disulfide 15 .9 0 . 3 9 . 6 3 0 .04
TOTAL 7 9 . 1 0.7
Dimethyl sulfide 1 6 . 3 0 .1 4 . 9 9 0 .03 Methyl ethyl sulfide 1 6 . 1 0 . 1 9 .05 0 .04 Diethyl sulfide 15 .9 0 . 1 16 .90 0 . 0 4 Diethyl disulfide 15 .3 0 . 4 30.89 0 .04
TOTAL 63 .6 0 . 7
Sampling
bon s t reams it was observed that the light sulfur compounds (namely hydrogen sulfide and methyl mercaptan) were being depleted in the standard high pressure sampling cylinders.
Figure 2 presents the r a t e of H2S depletion in standard 2250-m1 stainless steel sampling cylinders (Cyls. No. 1 to 3). The cylinders were filled with Matheson certified standard containing 230 ppm H2S in nitrogen. Within four minutes, 70% of the sulfur content was lost (cylinder No. 1). After 20 minutes no H2S could be detected in the sample cylinder. Cylinder No. 1A is actually cy- linder No. 1 that was steam cleaned, dried under house vacuum and refilled with the Matheson standard. A similar sulfur loss was confirmed by the Dohrman Sulfur Analyzer.
to determine ifthe hydrocarbon matrix affects the ra te of sulfur loss. A s illustrated in Figure 3 (curve I), the concentration of H2S decreased 50% in less than 10 minutes. The same cylinder was flushed with helium, evacuated on a high vacuum line and refilled with the same amount of H2S in ethylene. Although the number of active si tes on the inner walls had been reduced, the passivation in this manner did not eliminate the problem entirely (curve U). After the initial drop in sulfur con- centration, the rate of loss had reduced. Eventually, sulfur was lost completely overnight.
filled with 290 ppm H2S in ethylene (Figure 4).
During the course of the quantitative GC analysis of sulfur compounds in gaseous hydrocar-
In another experiment, a clean sampling cylinder was filled with 290 ppm of H2S in ethylene
The same cylinder used in the above experiment was emptied but not cleaned and again re-
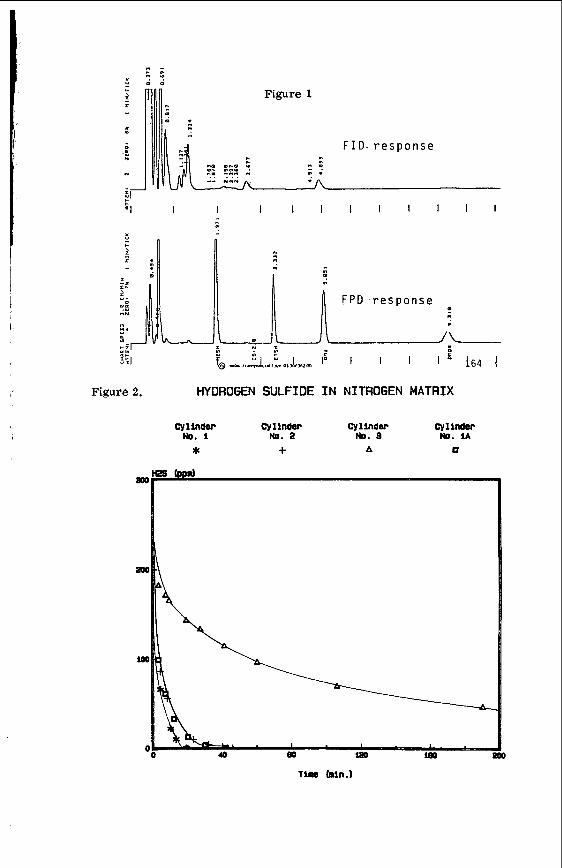
\
c
.P
n
L
Figure 2. HYDROGEN SULFIDE IN NITROGEN MATRIX
Figure 1 c-
, s t m
FID. r e sponse n
n l n . - . A
c y 1 in- Cylinder cylinder Cylinder No. 1 No. 2 MI. a No. 1 A * + A a
If29 @Pa) 800
Tim bin.)
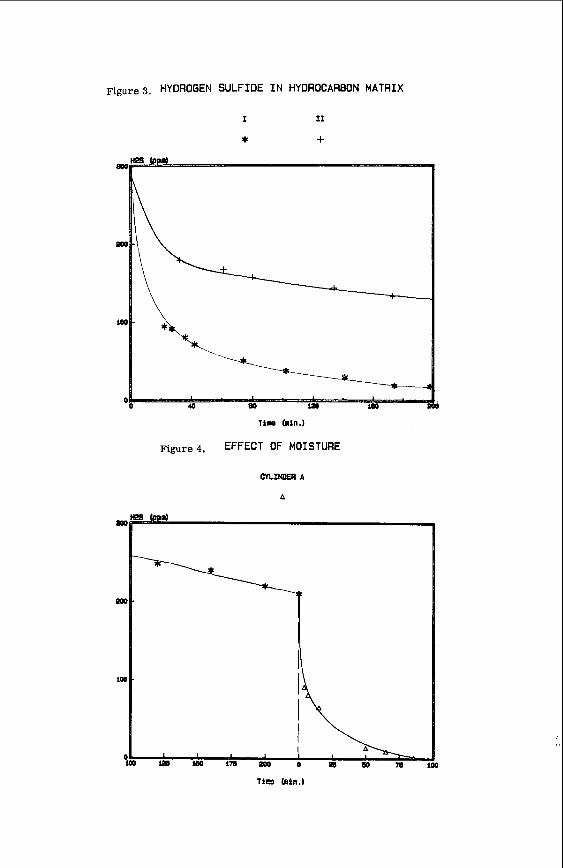
~i~~~~ 3. HYDROGEN SULFIDE IN HYDROCARBON MATRIX
I I1
* +
Tim hin .1
Figure 4. EFFECT OF MOISTURE
CnUmER A
A
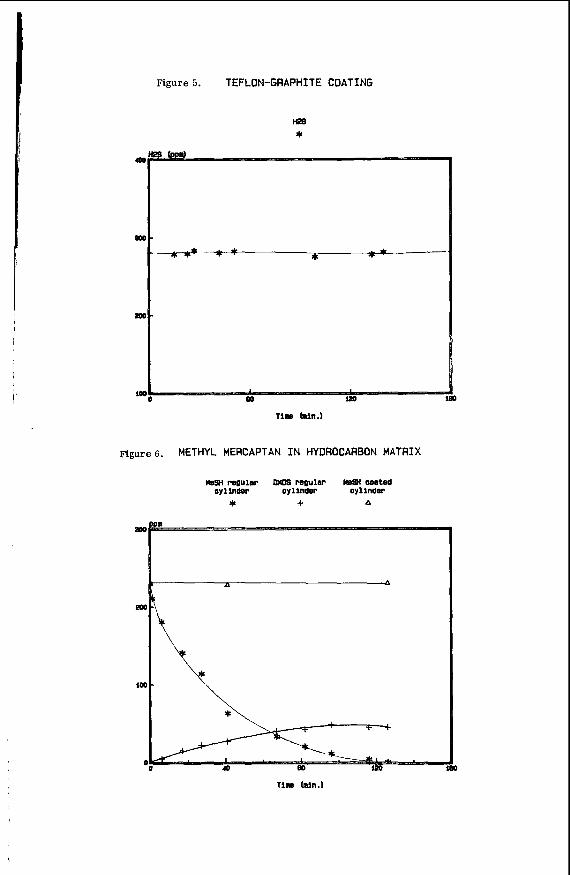
Figure 5. TEFLON-GRAPHITE COATING
figure6. METHYL MERCAPTAN IN HYDROCARBON MATRIX

Presumably, the walls of the sample cylinder were further passivated, and the sulfur de- pletion rate was very low. After about 4 hours at a sulfur concentration of 210 ppm, the sample was transferred to a cylinder (passivated in the same manner) that contained 0.2 ml of water. A sudden drop in sulfur content (curve A ) i l lustrates the high solubility of H S in water according to the re- action:
2
H2S + H20 -j H30+ + HS-
Provided a moisture-free environment i s assured, adsorption on the metal walls appears
In an attempt to contain light sulfur compounds, a 2250 ml gas sample cylinder was lined to be the predominant cause for the decrease in sulfur concentration.
with 0.0005 inch of teflon-graphlte where the coating was baked onto the metal surface. The cylin- der was tested with the same H2S in ethylene mixture as in previous experiments (Figure 5). There was no apparent decrease in H2S concentration over a period of 48 hours.
Figure 6 presents the comparative study of the two types of sample cylinders, i.e. , teflon- graphite coated and regular (stainless steel) when methyl mercaptan is present In the hydrocarbon environment (ethylene matrix). Rapid oxidation of methyl mercaptan to dimethyl disulfide, reaction probably being catalized by the m tal surface, as well as depletion on the walls i s evident in the "regular" cylinder. However, in the teflon-graphite coated cylinder, the reaction did not take place and mercaptan content was unchanged over the t ime period indicated.
DISCUSSION
The unique and reactive properties associated with sulfur gases have presented difficult obstacles in attempts to contain low levels of these gases in high pressure cylinders (9, 10). Many factors a r e responsible for the apparent loss of sulfur content in the standard sample cylinders, such as , among others: . Chemical reaction with, or promoted by, water molecules.
. Adsorption and/or reaction on the walls of the sampling cylinders.
. Oxidatinn nf merc~pi~cs tc diszlfidcs. The results of this study indicate that gas mixtures containing low concentrations of sulfur
compounds can exhibit stability if proper cylinder material and cylinder treatment techniques are used. Further evaluation of the teflon-graphite coated cylinders for their suitability in sampling of su l fur containing gases in various plant s t reams i s under way. In addition, long term experience is being gathered.
LITERATURE CITED
Ferguson, D. A. and Luke, L. A . , Chromatographia, 12, 197 (1979). Patterson, P. L . , Anal. Chem., 2, 345 (1978). Feeney, M . , DeCood, J. and Warren, E., Pittsburgh Conf., Abstracts, No. 350 (1982). McGaughey, J. F. and Gangwal, S. K., Anal. Chem., 52, 2079 (1980). Fanvell, S. 0. and Gluck, S. J . , Anal. Chem., 51, 609 (1979). Pearson, C. D. and Hines, W. J., Anal. Chem., e, 123 (1977). Fredriksson, S. A. and Cedergren, A . , Anal. Chem., 53, 614 (1981). Vista 401 Chroatography Data System Operators Manual, Varian (1980). Kramer, F. J. and Wechter, S. G . , J. Chrom. Sci., 3, 674 (1980). Shultz, J. F., Karn, F. S. and Anderson, R. B., Ind. Eng. Chem., 54, 44 (1972).
GENERAL PAPERS - POSTER SESSION PRESENTED BEFORE THE DMSION O F PETROLEUM CHEMISTRY, INC.
AMERICAN CHEMICAL SOCIETY WASHINGTON, D. C. MEETING, AUGUST 28-SEPTEMBER 2, 1983
AN ANALYTICAL MODEL OF COMBUSTION OF SPENT OIL SHALE BLOCKS: THE MODEL AND EXPERIMENTS
BY
M-D. Ho, E. M. Suuberga and H. L. Toor Department of Chemical Engineering, Carnegie-Mellon University, Pittsburgh, PeMSylVanh 15213
INTRODUCTION
Oil shale, a potential source of liquid fuel, is a fine-grained, sedimentary rock composed of both organic and inorganic solid compounds. The production of liquid fuel from oil shale requires the retorting of the shale, in which oil and gas a r e destructively distilled from the shale rock, leaving behind a highly carbonaceous char within the spent shale matrix. The amount of char left depends on the richness of the raw shale. Typically, 23% by weight of the organic material origin- ally present in the shale i s left a s char (1).
retorting of the shale (2). behavior of spent shale (2-8). Although char in shale is not pure carbon, most studies have treated it as carbon with reasonable success.
In the combustion of spent oil shale in an environment of a i r with other inert gases, there are three active components to be considered, 02, CO and CO and four major chemical reactions (9 , l o ) , namely:
Combustion of this char could potentially provide all o r part of the heat requirement for There have recently been several studies dealing with the combustion
2 . Direct oxidation of the residual char. a process which is limited by the diffusion of oxy- . .
gen and which creates an "unburned core".
0 + (l+P)C -> 2pco + (l-P)CO,
co + 1/202 -> co
2
Oxidation of CO
2
. CO -C gasification reaction 2
co + c ->2co 2
b . Carbonate decomposition reactions
MgCa(C0 ) -> MgO + CaCO + CO and CaCO -> CaO + CO or 3 2 3 2 3 2
n CaCO + m Si0 -> Ca Si 0 + n CO 3 2 n m m+n 2
Reaction 1
Reaction 2
Reaction 3
Reaction 4
Therefore, the combustion of spent shale consists of two competing schemes: one is the direct oxidation of char; the other is the gasification of the char by C02 released from the carbon- ate decomposition reactions.
There have been several modeling studies of the combustion of spent shale in the presence of oxygen and nitrogen (2-7) which used the classical shrinking core model. This model assumes that the reaction ra te is limited only by the internal diffusion of oxygen; hence, it neglects the other reactions (2, 3 and 4) which may play a major role a t elevated temperature (above 875'K).
Mallon and Braun (7, 11) have included the decomposition and gasification reactions (3 and 4) in their model, but they treated the gasification reaction and the direct oxidation reaction inde- pendently and then superposed the two results. This approximation was inaccurate. Braun et al.
a. Present address: Division of Engineering, Brown University, Providence, Rhode Island 02912. b. For the detail and kinetics of this reaction, see Manor et a1 (8).
(2) modeled gasification of spent oil shale blocks by steam and C02 but did not consider oxidation reactions. Their solution scheme involved solving differential equations numerically.
Our previous publication (Manor et al. (8)) offered a model which successfully predicted thecombustion behavior of shale in nitrogen diluted a i r , but that model also required the numerical solution of differential equations.
The model that we present here is an improvement over the model of Manor et al. The major advantage of the new model l i es in the simplicity of the closed form result which eliminates the necessity of cumbersome numerical solution of the differential equations. Our new model thus allows more convenient use of the single particle (or block) combustion model in the modeling of packed bed retorts. Experiments similar t o those car r ied out earlier were used to extend the data.
DEVELOPMENT O F THE MODEL
Consider the burning sample shown schematically in Figure 1. We will use the assump-
1. Mass transfer processes may be treated a s pseudo-steady. 2. Only radial transport in a cylinder is considered. 3. Temperature is spatially uniform. 4. No significant pressure gradient exists within the shale. 5. The reaction of char with oxygen is fast enough to be lumped at the surface of the
6. The gasification Reaction 3 occurs uniformly within the unburned core. 7. Carbonates decompose uniformly throughout the shale. 8. The bulk flow of all species out ot the shale i s dominated by the release of carbon diox-
9. Fick's law holds for each component and al l effective diffusivities a r e equal. An additional assumption that allows the model to be treated analyticz!!;. is t k t the uxida-
tions that were employed by Manor et al. (8).
unburned core.
ide from the decomposition of carbonates.
tion reaction of cnrhnr? rr.sc--ide is iiisisncaneousd.
Transport Model The formal statement of assumption 8 is:
N = R p-'/Zrr) = R r/2 = G L y t 4 4
where
L = C D /Is
2 G = R r /(2 De C) 4 s
y = r/r
and where rs i s the radius of the cylinder. Other symbols a r e defined in the table of nomenclature. The formal statement of assumption 9 is:
Ni = -C De dXi/dr + X i Nt o r N. = -L dX./dy + X. G L y. i = CO, COz. o2 2)
The species conservation equation for each component can be written as:
1/r d/dr (r Ni) =&.. A. 3) 11 1
w h e r e v . is the stoichiometric coefficient of component i with respect to Rj. At the surface of the cylindrical sample (r=rs or y=l ) , external mass transfer resistance is taken into account by speci- fying:
11
Ni,s = CKx + Nt)P + 2Q)l Xi, - Kx P Q/Wx + 2Q)l si,f 4)
a. The measured CO/C02 ratio at the surface of the shale never exceeded 20% in the ignition stage and then declined very rapidly to a negligible value, therefore, weassume allCO is burned to CO very quickly in the presence of oxygen. See also Manor et al. (E) for more detail.
2
where Q is the molar flow rate of sweeping gas pe r unit surface area of the sample. The new cor- rection term, 12 Q/(K, + Z Q ) ~ , is used to take into account the change in sweeping gas compositions due to the mass transfer to and from the sample. When the gas flow rate i s very large, the correc- tion term reduces to unity and i s not required.
Define a pseudo-component concentration:
I t follows from Equation 3 and the stoichiometry of the reactions that
l/r d/dr (r N, ) = R 4 1
5)
The substitution of Equation 2 into Equation 5 yields:
6) 2
l / Y d/dy (-Y (dXl/dy) + X1 G Y ) = G
subject to the boundary conditions that, a t the center of the sample, the flux is zero and at the sur- face of the sample, Equation 4 holds for pseudo-component 1.
Thus, Equation 6 can be solved to give:
which eliminates one unknown.
the unburned core region and the product of shell layer. For the sake of convenience, we shall f i r s t consider the two regions of shale separately:
Core Reaction Model The core reaction model i s similar to the one in Manor et al. ( S ) , i t is rederived here for
the convenience of the reader. Within the unburned core section, the conservation equation for CO can be written as:
8) 3 l/r d/dr (r NCo) = 2 R
with boundary conditions:
c ' xco=xco, c r = 0, dXCO/dr = 0; r=r
where rc i s the radius of the edge of the unburned core. Assumption 6 allows R3 to be treated as position independent. core. Therefore, Equation 8 can be integrated to give:
I ts value is evaluted at the average concentrations of reactants within the
2 2 = (xco,c - B) exp[(y -Yc ) G/21 + xco
where
B = 2 R / R = R (4GL/r ) 3 4 3
Note that X = X1 - 1/2Xco in the core region, since X = 0 and the average mole fractions are: co2 O2
91
where
x c o 2 . c = - %o, c
It is assumed that C20-C gasificztion proceeds at a ra te given by the equation suggested by Ergun (13)
3 Ka a, 3 1 +<Xco> /Kex<X >
R = (gmole/cm sec)
c02
7 2 -1 where K a = 4.5 x 10 (as suggested by Campbell and Burnham (9)). Cc is the molar concentration of char(gmole/cm3) and Kex = 138 exp(-7,500/T) ( fmm Ergun and Menster (14)).
exp(-24,500/T) + 3.75 x 10 exp(-16,000/T) sec
Shell Transport and Reaction Model
pseudo-component X2, where In order to eliminate reaction te rms in the conservation equation, let us again create a
X = X - 1/2 Xco, N, 5 Y"
2 2 oi
If follows that in the shell region,
l/r d/dr (r Nx ) = 0 2
and with Equation 2 and dimensionless variables,
2 l /y d/dy [-Y (dX2/dy) + X2 G Y 1 = 0
Equations 12 and 13 can he integrated to give
YN, = M 2
and
where:
and M is an integration constant. A t y= l , Equation 4 is used as the other boundary condition.
follows that the coexistence of carbon monoxide and oxygen is not allowed and the flame front at which al l the oxidation reactions occur is assumed to be infinitely thin.
a t r>rc), i. e. , case 2.
Since we have assumed that the oxidation reaction of carbon monoxide is instantaneous, it
The flame front occurs either a t the core surface, case 1, o r out of the core surface (i. e. ,
Case 1: Flame Front a t the Core Surface
carbon monoxide produced in the core and by the direct oxidation of char, i. e. , In this case, oxygen flux to the core surface will be consumed both by the reaction with
-N = (R1 + R3) rc/2 0 2 ' C
where
R1=K C X 1 c 0 2 ' C
7 -1 and the value Of K1 is provided by Sohn and Kim (10) as 1.503 x 10 exp(-11102/T) sec Manor et al. (8) . K1 was assumed to be infinitely large.)
to be zero, which requires
. (In
c0,c and NCO,C Since oxygen i s present a t the core surface in this case, we can assume X
X2, = Xo2, and M=y N c 02.c.
where
Case 2: Flame Front Out of Core Surface In case 2, the flame front is being pushed outward by carbon monoxide, so oxygen cannot
reach the core surface and X Note that since 'Ic
must be less than zero, since X = 1/2 Sco,c 2.c
a mass balance around the core surface gives:
NCO,c = R3 rc
Using Equations 14 and 17, we can get
2 M = -R3 rs yc /2
Equations 15 and 18 allow us to compute the value of X as: 2.c
2 R3((Kx+2Q)/2Q + (G + KX/U F(l.Yc) aP(G/2))
19) 2
(G L + Kx) exp(G/2 ( l -Yc )) xco ,c=-2x2 ,c -
Model Solution Note that in the core region, if we substitute Equations 9 and 10 into Equation 11, R, can
be solved as a function of X C ~ , ~ , while in the reacted shell region Xco or can be obtained from Equation 19 as a function of R3 in case 2. Simultaneous solution of these two regions gives the following equation:
is either zero in cxse 1,
where
and
or
or
R =[ (K K K 2-2K K K K 2+(K K )2-2K K (K K +K )+4K K K K +K 2, 3 J 3 5 e x 3 4 5 a 4 e x 2 e x 3 5 4 1 4 5 e x 2
+ K -K K K -K K ]/(4K1-4K K ) 2 3 5 e x 4 e x 3 e x
K 1 = C - 2 C C + 2 C C 4 4 5 1 5
K = 2 C C 2 2 5
K = C C + 1/2 C4 - C4C5
K = 1 + 2 C C -2C
3 1 5
4 3 5 5
K = 2KabpC/MW 5 C
C1 = O ( C a s e l )
2 2 rsYc exP(Gyc ) [ F(1, yC)/L)+exp(-G/2) (kx+ZQ)/ZQ/(k +GL)I
C2 = O (Case 1)
2 2X0 fexP(G/2(~c -l))[kx/(GL+kx)] (Case 2)
2 '
(Case 2)
or
Thus, R3 can be obtained from Equation 20 and all the other quantities desired, such a s
N 02'S
(the oxygen consumption rate) and dy /dt (the rate of shrinkage of the core) can be calculated in a straightforward fashion. A tr ial and'error calculation procedure is used to determine whether case 1 or case 2 is true. This model is then integrated numerically only over time, with the reaction rates and temperature recalculated at each t ime step.
PHYSICAL PROPERTIE
In the model calculation, the temperature is calculated from
ps cp (dTs/dt) = h S AT + 2Ri4Hi
where the heat capacity is:
2 C = 0.72 + 7.7 x T /(T + 300) J/gm-K
P s s
and the heat transfer coefficient a is:
-6 2 h = 9.76x10-~ + 2.48 x 10 (Ts - 755) W/cm K
The temperature difference AT in the heat loss te rm is actually measured i n our experiments, it usually maintains a constant value throughout an experiment due to the configuration of the reactor.
tive diffusivity of spent oil shale as: A general correlation based on a random pore model (15) allows us to estimate the effec-
2 0 , a i r D = E D
2
where E is the porosity and
, a i r 2
is the buut binary diffusivity of oxygen in air . No te that there a r e no adjustable parameters in the above equation. This approach is a modification of that used by Manor et al.
For the purpose of prediction, porosity, char concentration and shale grade can be conven- iently estimated from shale density using correlations i n the l i terature (16, 17).
Smith provided a theoretical relationship between density and oil yield for oil shale (17) and he supported his prediction with experimental results. The correlation was found to be very good in our experiments.
(1) and his result can be correlated as follows: The data on the carbonaceous char contents of spent shales was gathered by Stanfield et al.
, where Wc i s the char density as percentage of the raw shale density (not weight fraction of the spent shale, as DocMer and Turner stated) and A is the shale grade in l i ters of oil per ton. The initial porosity of the spent shale retorted to 750°K can also be estimated with Tisot's data which is cor- related by DocMer and Turner (5):
E =0.111+ 1.55 A + 1.23 x loq5 A~
EXPERIMENTAL VERIFICATION .
The analytical model gives results very close to the numerical model of Manor et al. , which agreed reasonably well with the experimental data reported earlier. In addition, a number of new experiments were car r ied out to further tes t the validity and applicable range of the model. The experimental conditions used were similar to the earlier one (8). Colorado oil shales were machined into cylinders and retorted in a furnace in nitrogen to a maximum temperature of 750°K. The combustion was then initiated by switching the sweep gas fromnitrogen to air or nitrogen dilu- ted air . Heat transfer to and from the furnace wall was minimized by controlling the furnace wall to within two "K of the shale surface temperature.
The effects of shale grades (from 40 to 229 li terhon), cylinder sizes (from 1 cm to 10 cm
a: The heat transfer coefficient sometimes has been adjusted to account for non-ideal temperature distribution in the furnace during rapid temperature rise.
in diameter) and feed gas oxygen concentration (from 5% to 21%) were examined. It was found that this model adequately accounts for these effects in the testing range. Shown in Figure 2 is the com- parison of experimental and model prediction of average temperatures and dimensionless reaction rates of rich shale cylinders (208 liter/ton) of two different sizes (3.5 cm, and 9.3 cm in diameter) in 13.5% oxygen plotted against dimensionless time. A 5 c m sample from the same piece of rock was also tested against the model with s imi la r success but the result was excluded from the figure to avoid crowding. It can be seen from FLgure 2 that the two different size samples give very simi- lar curves on a dimensionless t ime scale (the 5 c m sample gave similar curves), but other grades of shale do not scale this way.
B!SO been used and the model also predicted the combustion behavior successfully. In Table I , we compare measured and predicted total burn out times for these samples.
Various sizes (1 cm. 2.4 CZL, 5 . i c m and 9.7 cm diameters) of 104 liter/ton shale have
TABLE I
BURN OUT TIXE FOR XEDiUIVf GRADE SHALE' (104 LITER/TON) OF FOUR DIFFERENT SIZES: EXPERIMENTS AND MODEL PREDICTION
Shale Burn Out Time Expt. No. Diameter '2% Expt. Model
55 9.7 c m 21% 660 min. 670 min. 65 5 .1 c m 15% 340 min. 330 min. 67 3 .4 cm 15% 160 min. 163 min. 69 1 . 0 cm 15% 20 min. 22 min.
a. Important parameters used are: Initial porosity = 308, carbon density = 0.06 gm/cm3, spent shale density = 1.87 gm/cm3.
CONCLUSION
An analytical model satisfactorily predicts the combustion behavior of spent oil shale blocks. The only additional assumption besides those employed by Manor et al. (8) is that the oxi- dation reaction of carbon monoxide is instantaneous.
ACKNOWLEDGMENTS
We wish to thank Occidental Petroleum Corporation and Rio Blanco Oil Shale Company for supplying the oil shale used in this work.
NOMENCLATURE
A shale grade, liter/ton B
C
constant defined a s 2R3/R4, dimensionless
molar concentration in gas phase, gmole/cm molar concentration of char in shale, gmole/cm
constants, defined below Equation 20
heat capacity of the sha le , J/gm-K
effective diffusivity of gases in the shale, cm2/sec
3 3
cC
'i
Cp
De
G constant=R r /2CDe, dimensionless
h
Ki
Kx mass transfer coefficient, gmole/sec-cm L constant=CD /r gmole/sec-cm'
e s'
2 4 s
2 heat transfer coefficient, W/cm K constants, defined below Equation 20
2
net molar flux anywhere within the sample, gmole/sec-cm 2 Nt
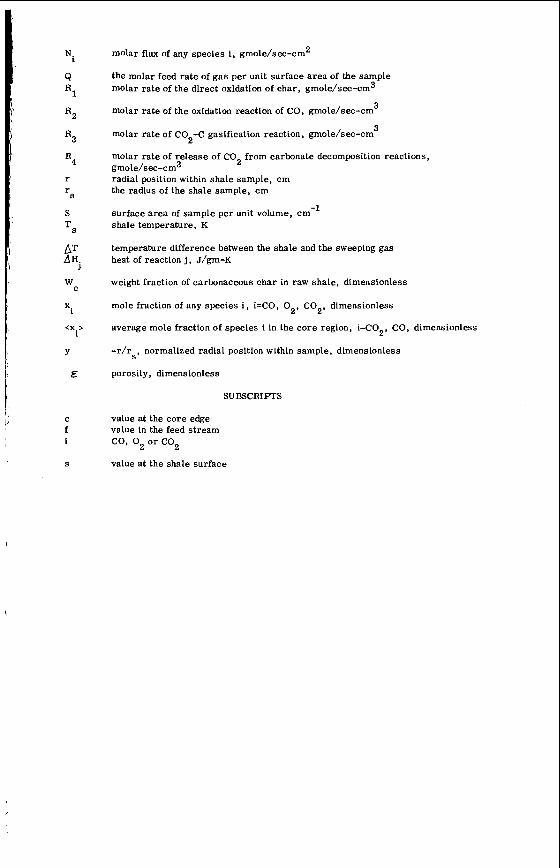
Ni
Q
R2
R3
R4
r r
S
TS
.AT
wC
AHj
X.
<x > i
Y
E
C f i
S
molar flux of any species i , gmole/sec-cm2
the molar feed r a t e of gas per unit surface a rea of the sample molar rate of the direct oxidation of char, gmole/sec-cm3
molar rate of the oxidation reaction of CO, gmole/sec-cm
molar rate of co -C gasification reaction, gmole/sec-cm
molar rate of release of CO from carbonate decomposition reactions, gmole/sec-cm’ 2
radial position within shale sample, cm the radius of the shale sample, cm
surface a rea of sample per unit volume, cm-l shale temperature, K
temperature difference between the shale and the sweeping gas heat of reaction j , J/gm-K
weight fraction of carbonaceous char in raw shale, dimensionless
mole fraction of any species i, i=CO, 02, CO , dimensionless
average mole fraction of species i in the core region, i=C02, CO, dimensionless
=r/rs. normalized radial position within sample, dimensionless
porosity, dimensionless
3
3 2
2
SUBSCRIPTS
value at the core edge value in the feed stream CO, O2 or C02
value at the shale surface
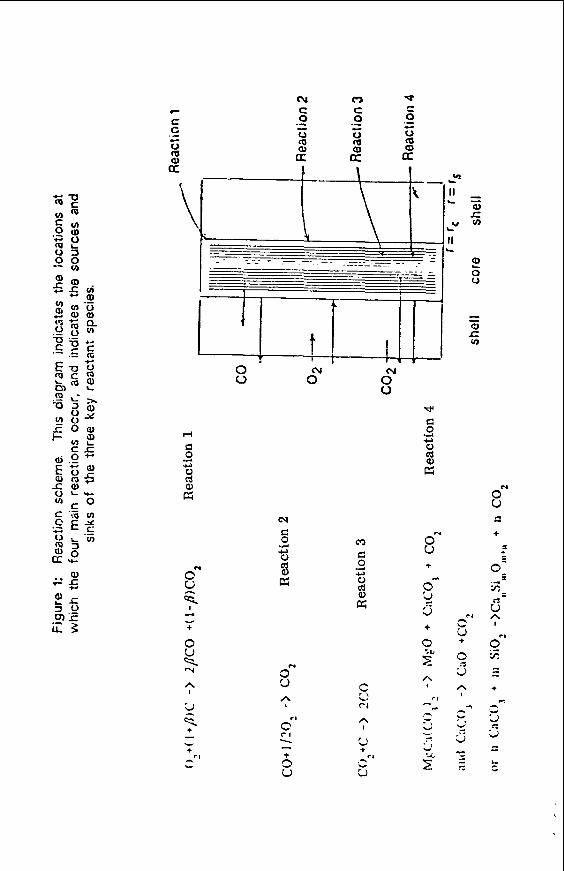
h I
A I
+ 0 V
A I
E
a n +
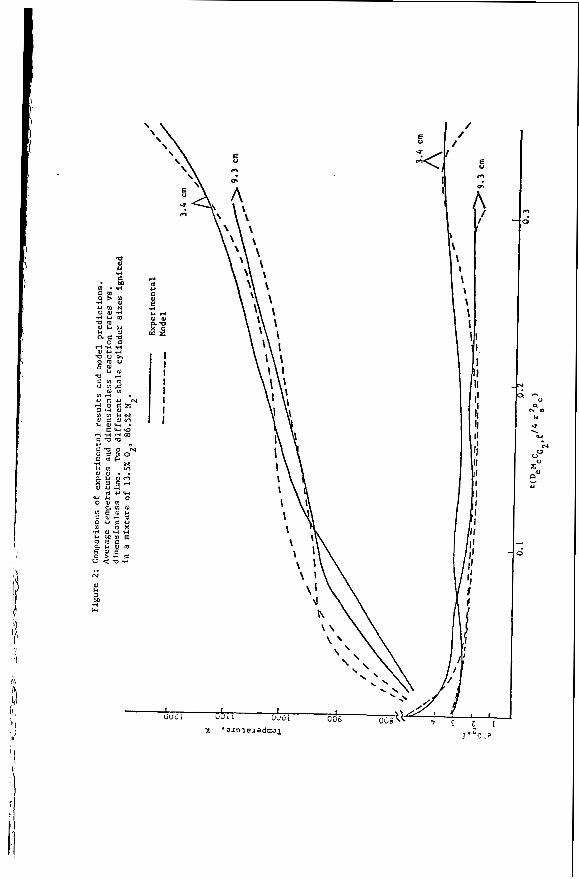
I '
i
N
LITERATURE CITED
Stanfield, K. E . , Frost , I. E . , Mcauley, W. S. andsmith, W. S., "Propertiesof Colorado Oil Shale", U. S. Bureau of Mines, R I 4825 (1951). B c k t e r , L . , "Combustion of Oil-Shale Carbon Residue", AICHE Symp. Series, Vol. 72, No. 155 , p. 24 (1975). Huang, E. T. S. , "Retorting of Single Oil-Shale Blocks with Nitrogen and Air", SPE Journal, p. 331 (October 1977). Thomson, W. J. and Soni, Y., "Oxidation of Oil Shale Char", In Situ, Vol. 4, No. 1, p. 61 (1980). Bck te r , L. and Turner, T. F. , "Combustion Rates for Oil Shale Carbonaceous Residue", InSitu, Vol. 2 , No. 3, p. 197 (1978). Duvall, J. J. and Tyner, C. E. , "Laboratory and Modeling Studies of the Combustion Retorting of Large Clocks of Oil Shale", Tech. report , Sandia Laborator-ies (1979). Mallon, R. and Braun, R. , "Reactivity of Oil Shale Carbonaceous Residue with Oxygen and Carbon Dioxide", Quarterly of the Colorado School of Mines, Vol. 71, No. 4, Proceedings of the 9th Oil Shale Symp. (1976). Manor, Y., Suuberg, E. M. , Ho, M. andToor, H. L . , "TheIgnitionandCombustion Behavior of Spent Shale Particles", in 19th Interntl. Symp. on Combustion, The Combus- tion Institute, Pittsburgh, PA, p. 1093 (1982). Campbell, J. H. and Brunham, A. K. , "Reaction Kinetics for Modeling Oil Shale Retor- ting", In Situ, Vol. 4, No. l(1980). Sohn, H. Y. and Kim, S. K. , "Intrinsic Kinetics of the Reaction between Oxygen and Car- bonaceous Residue in Retorted Oil Shale", Ind. Eng. Chem., Process Design and Develop- ment, Vol. 19, No. 4, p. 550 (1980). Braun, R . L. , "Mathematim! Node!!ng cf XodSed io-Siiu and Aboveground Oil Shale Re- torting", Tech. report UCRL-53119, Lawrence Livermore Laboratory (1981). Braun, R. L. , Mallon, R . G. and Sohn, H. Y. , "Analysis of Multiple Gas-Solid Reactions during the Gasification of Char in Oil Shale Blocks", Tech. report UCRL-85279, Lawrence Livermore Laboratory (April 1981). Ergun, S. , "Kinetics of Reaction of Carbon Oxidide with Carbon", Journal of Physical Chem., Vol. 60, p. 480 (1956). Ergun, S. and Menster, M., "Reaction of Carbon with Cog and Steam", in Cbem. and Physics of Carbon, P. L. Walker, ed. , p. 203 (1965). Smith, J. M., Chem. Engineering Kinetics, McGraw-Hi11 Co., p. 466, 3rd ed. (1981). Tisot, R. , "Alterations in Structure and Physical Properties of Green River Oil Shale by Thermal Treatment", J. Chem. Eng. Ref. Data, Vol. 12, p. 405 (1967). Smith, J. W. , "Theoretical Relationship Between Density and Oil Yield for Oil Shales", Tech. report R17248, Bureau of Mines (April 1969).
I
GENERAL PAPERS - POSTER SESSION PRESENTED BEFORE THE DMSION OF PETROLEUM CHEMISTRY, INC.
AMERICAN CHEMICAL SOCIETY WASHINGTON, D. C. MEETING, AUGUST 28-SEPTEMBER 2, 1983
THE EFFECT OF CRYOGRINDING ON THE MOLECULAR WEIGHT OF SAMPLES O F POLYISOBUTYLENE
BY
P. F. Waters The American University, Washington, D. C. 20016
and A . F. Hadermann and J. C. Trippe
General Technology Applications, Inc. , Arlington, Virginia 22209
INTRODUCTION
A significant recent development in polymer technology is the discovery that megadalton- molecular-weight macromolecules can be dissolved instantaneously in liquids which a r e normally solvents for the materials. This finding portends increasing development and u s e of ultra high molecular weight macromolecules deriving from the superior effects they exhibit in a variety of ap- plications. Past studies have demonstrated that macromolecules, added in small quantities, (1) en- hance the flow of liquids through pipelines; (2) impart high extensional viscosities to and (3) impede the aerosolization of liquids in which they a re dissolved. The latter is a property of antimisting fuels.
sibility might well be the on-site dissolution of the macromolecules in the fuels. This requirement is occasioned by the high susceptibility of some dissolved macromolecules to shear degradation; a concomitant of fuel transportation and transfer by pumping. The cryogenic comminution and subse- quent blending of macromolecules with the fuels offers a direct route to instantaneous dissolution. The process is described elsewhere (3-5).
Consequently, an understanding of the effect of cryogrinding on the molecular weight of a potential antimisting fuel additive i s required. In this study, samples of polyisobutylene of three different molecular weights were cryofractured and dissolved. break in a ductless siphon (8) of the solutions were compared with those of solutions of unground samples and the comparative values were used a s indicators of the extent of degradation.
In the event that antimisting fuels ga in wide use, a not inconsiderable facilitation of the fea-
The antimisting effect is a strong function of the molecular weight of the additive (2. 6 , 7).
Measurements of the viscosity and height-at-
EXPERIMENTAL
Samples of BASF polyisobutylene of three different molecular weights (B-100, B-200, B-200-246) were fractured in a mill, under nitrogen, at 77%. However, they were not added im- mediately to the solvent a s was the procedure followed in the work reported earlier. Instead, the samples were allowed to warm to rcom temperature under nitrogen and each w a s dissolved in iso- octane in the usual manner, i. e. , with occasional swirling in a flask over a period of several days. Simultaneously, unground samples of the same materials were similarly dissolved.
tions of the samples, because the reduced viscosities become nonlinear a t concentrations near 0.1 wt % in good solvents for the molecular weights used in this study.
The viscosity and ductless siphon measurements were made on relatively low concentra-
The data a r e displayed in Table I.
CONCLUSIONS
The viscosity data show that there was apparently no detectable degradation on cryogrind- ing the sample with the lowest molecular weight. The sample with the intermediate molecular weight suffered a molecular weight decrease of a bit above 5%. It was reported earlier that cryo- grinding reduced the molecular weight of a sample of B-200 by about 6% (5). In that instance, Wv was determined in cyclohexane at 30"C, with the material cryoground directly into the solvent and the concentration measured by weight after precipitation of the macromolecules from solution with acetone. The molecular weight of the sample with the highest molecular weight decreased by about S?+,. The relative decrease in the molecular weight on cryogrinding,
4
I
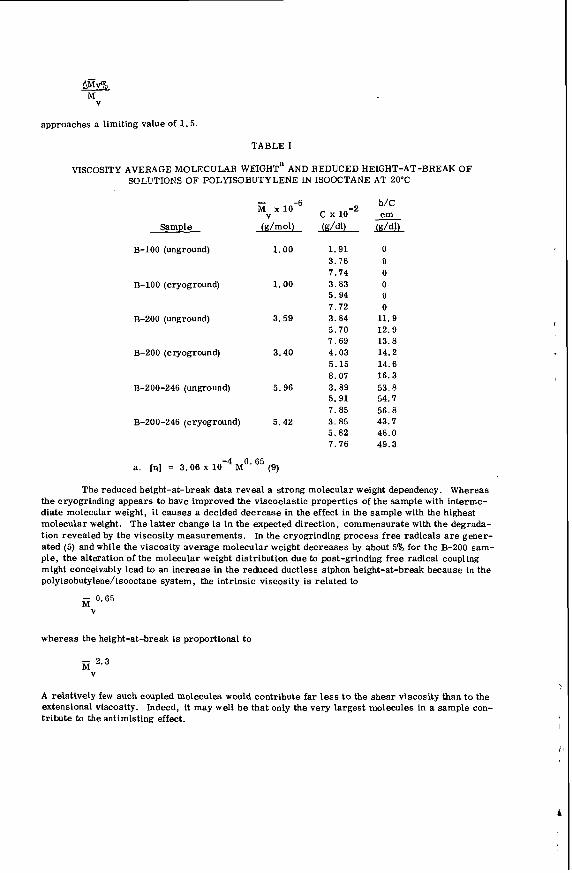
approaches a limiting value of 1 .5 .
TABLE I
VISCOSITY AVERAGE MOLECULAR WEIGHT^ AND REDUCED HEIGHT-AT-BREAK OF SOLVTIONS OF POLITSOBUTYLENE I N ISOOCTANE AT 20°C
iii x
Sample (g/mol)
B-100 (unground) 1 .00
B-100 (cryoground) 1 .00
B-200 (unground) 3.59
B-200 (cryoground) 3.40
B-200-246 (unground) 5.96
B-200-246 (cryoground) 5.42
-4 0.65 a. [q] = 3.06 x 10 M (9)
c x ( d d l )
1.91 3.76 7.74 3.83 5.94 7.72 3.84 5.70 7.69 4.03 5.15 8.07 3.89 5.91 7. 85 3.85 5.82 7.76
h/C cm -
1d41 0 0 0 0 0 0
11.9 12.9 13.8 14.2 14.6 16.3 53.8 54.7 56.8 43.7 48.0 49.3
The reduced height-at-break data reveal a strong molecular weight dependency. Whereas the cryogrinding appears to have improved the viscoelastic properties of the sample with interme- diate molecular weight, it causes a decided decrease in the effect in the sample with the highest molecular weight. The latter change is in the expected direction, commensurate with the degrada- tion revealed by the viscosity measurements. In the cryogrinding process free radicals a r e gener- ated (5) and while the viscosity average molecular weight decreases by about 5% for the B-200 sam- ple, the alteration of the molecular weight distribution due to post-grinding free radical coupling might conceivably lead to an increase in the reduced ductless siphon height-at-break because i n the polyisobutylene/isooctane system, the intrinsic viscosity is related to
whereas the helght-at-break is proportional to
A relatively few such coupled molecules would contribute far less t o the shear viscosity than to the extensional viscosity. Indeed, it may well be that only the very largest molecules in a sample con- tribute to the antimtsting effect.
LITERATURE ClTED
Proceedings of the IUTAM Symp. on Structure of Turbulance and Drag Reduction, F. Frenkel, M. Landahl and J. Tumley, eds. , Phys. Fluids 3, No. 10, Part ll (1977). Chao, K. C . , Child, C. A , , Grens, E. A. andWilliams, M. S., Am. Inst. Ch. Eng. J . , in press. Waters, P. F. , Trippe, J. C. and Hadermann, A . F . , Proceeding of the Aircraft Re- search and Technology for Antimisting Kerosene Conf., p. 5-1 ff, Atlantic City, NJ, February 18-19, 1981. Report No. FAA-CT-81-181, U. S. Dept. of Trans. , June, 1981. Trippe, J. C. , Waters, P. F. and Hadermann, A. F., Application of GTA Blending Pro- cess to Antimisting Fuel Additives, Report No. FAA-CT-81-51, U. S. Dept. of T rans . , May, 1981. Waters. P. F., Hadermann, A . F. , Weitzen, W. and Trippe, J. C. , IUPAC 28th Macro- molecular Symp. Proceedings, p. 679, July 12-16, 1982. Hadermann, A. F . , Waters, P. F . , Trippe, J. C. and Weitzen, W., Contract No. DAAK- 70-81-C-0134, U. S. Army Mobility Equip. Res. and Dev. Com., Fort Belvoir, VA, January 15, 1982. Waters, P. F. , Hadermann, A . F. andTrippe, J. C . , Proceedings of the 2nd Jnterntl. Conf. on Reactive Processing of Polymers, pp. 11-22, J. T. Lindt, ed . , University of Pittsburgh, November 2-4, 1982. Chao, K. K. K. andWilliams, M. C . , J. Rheology, in p re s s . BASF Tech. Leaflet No. M 2353 E/81538; May, 1978.
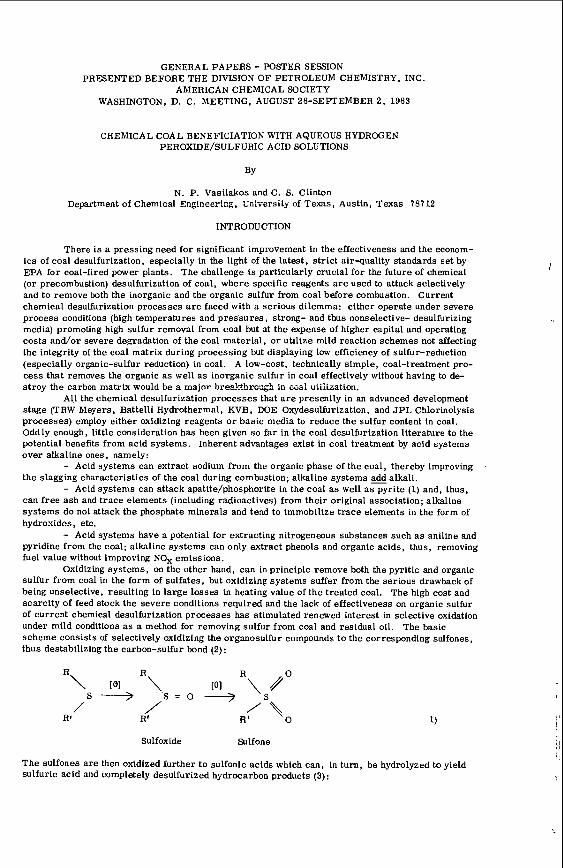
GENERAL PAPERS - POSTER SESSION PRESENTED BEFORE THE DIVISION OF PETROLEUM CHEMISTRY, INC.
AMERICAN CHEMICAL SOCIETY WASHINGTON, D. C. MEETING, AUGUST 28-SEPTEMBER 2 , 1983
CHEMICAL COAL BENEFICIATION WITH AQUEOUS HYDROGEN PEROXIDE/SULFURIC ACID SOLUTIONS
BY
N. P. Vasilakos and C. S. Clinton Department of Chemical Engincerisg, University of Texas, Austin, Texas 78712
INTRODUCTION
There is a pressing need for significant improvement in the effectiveness and the econom- ics of coal desulfurization, especially in the light of the latest, strict air-quality standards set by EPA for coal-fired power plants. The challenge is particularly crucial for the future of chemical (or precombustion) desulfurization of coal, where specific reagents a r e used to attack selectively and to remove both the inorganic and the organic sulfur from coal before combustion. Current chemical desulfurization processes are faced with a serious dilemma: either operate under severe process conditions (high temperatures and pressures , strong- and thus nonselective- desulfurizing media) promoting high sulfur removal from coal but at the expense of higher capital and operating costs a n d o r severe degradation of the coal material, o r utilize mild reaction schemes not affecting the integrity of the coal matrix during processing but displaying low efficiency of sulfur-reduction (especially organic-sulfur reduction) in coal. A low-cost, technically simple, coal-treatment pro- cess that removes the organic a s well as inorganic sulfur in coal effectively without having to de- stroy the carbon matrix would be a majnr hreekthr~~gh in m a l uiiiizarion.
stage (TRW Meyers, Battelli Hydrothermal, KVB, DOE Oxydesulfurization, and J P L Chlorinolysis processes) employ either oxidizing reagents or basic media to reduce the sulfur content in coal. Oddly enough, little consideration has been given s o far in the coal desulfurization literature to the potential benefits from acid systems. Inherent advantages exist in coal treatment by acid systems over alkaline ones, namely:
- Acid systems can extract sodium from the organic phase of the coal, thereby improving the slagging characteristics of the coal during combustion; alkaline systems add alkali.
- Acid systems can attack apatite/phosphorite in the coal a s well a s pyrite (1) and, thus, can free ash and trace elements (including radioactives) from their original association; alkaline systems do not attack the phosphate minerals and tend to immobilize trace elements in the form of hydroxides, etc.
- Acid systems have a potential for extracting nitrogeneous substances such as aniline and pyridine from the coal; alkaline systems can only extract phenols and organic acids, thus, removing fuel value without improving NOx emissions.
Oxidizing systems, on the other hand, can i n principle remove both the pyritic and organic sulfur f rom coal in the form of sulfates, but oxidizing systems suffer from the serious drawback of being unselective, resulting in large losses in heating value of the treated coal. The high cost and scarcity of feed stock the severe conditions required and the lack of effectiveness on organic sulfur of current chemical desulfurization processes has stimulated renewed interest in selective oxidation under mild conditions a s a method for removing sulfur from coal and residual oil. The basic scheme consists of selectively oxidizing the organosulfur compounds to the corresponding sulfones, thus destabilizing the carbon-sulfur bond (2):
All the chemical desulfurization processes that a r e presently in an advanced development
1)
Sulfoxide Sulfone
The sulfones are then oxidized further to sulfonic acids which can, in turn, be hydrolyzed to yield sulfuric acid and completely desulfurized hydrocarbon products (3):
[01/H20 H + / H ~ O RS02R' > RSO H+R'H -2 ROH+R'H+H2S04
3
The f i rs t step in the sequence, i. e. the oxidation of sulfur compounds to sulfones, is ex- tensively documented in the literature. Numerous oxidants have been reported which can effect the conversion of even the most stable organosulfur compounds (thiophenes) to the corresponding S U I -
fones, including NO2 (4), C1 /H 0 (5), H202/acetic acid and hydroperoxides (6).
significant extent and there a re very few references in the literature on the desulfurizing effects Of extended oxidation of organosulfur compounds. Vasilakos (7) has reported the complete desulfuriza- tion of aliphatic sulfides by oxidative chlorination in aqueous systems at low temperatures (60°C) and atmospheric pressure.
course, selectivity. Concurrent oxidation of the remainder of the coal matrix by the sulfur-oxidiz- ing agent should be minimized to prevent excessive loss of the heat content of the coal. A compari- son of half-wave potentials for oxidation of organic substrates of the type found in coal (8) shows that organosulfur compounds as well as alcohols and amines a r e vastly more susceptible to oxida- tion than a re ether and benzene derivatives. Thus, given a mild oxidizing agent, i t may be possible to oxidize the organic sulfur compounds, amines and alcohols without destroying the hydrocarbon portion of the coal molecule.
One of the most promising oxidants in this direction is hydrogen peroxide, particularly in acid solutions, where it has a standard oxidation potential approximately 1 .4 V more positive than that of pyrite and about 1 . 6 V more positive than the S02/S couple (9). Thus, H202 is an oxidizing agent capable of oxidizing effectively the pyritic sulfur to the sulfate form.
aqueous hydrogen peroxide. This treatment was claimed to give nearly quantiative removal of py- ritic sulfur without changing the caking properties of the coal. No data on organic-sulfur reduction were given. Nalwalk and coworkers (11) also reported that decomposition of coal with 30wt % H202 slowly oxidized pyrite to sulfate.
Smith (12) investigated the desulfurization of U. S. coals with 10-15 wt % H 2 0 2 , 0.1-0.3 N H2S04, aqueous solutions. Treatment of several coals at ambient temperature with H202 alone had a noticable effect in removing pyritic sulfur, but the reaction was significantly enhanced when a small amount of sulfuric acid was added to the peroxide solutions. Although pyritic sulfur and ash were effectively removed in this way, organic sulfur remained unaffected. Minimal attack on the organic constituents of the coal matrix was observed. The reaction mechanism was postulated to involve the intermediate formation of peroxysulfuric acid, H2S05 (catalyzed by metal lons and sul- fates present in coal), followed by oxidation of the pyrite, with competing peroxide decomposition by metal ions.
The apparent resistance of the organic sulfur in coal to oxidative desulfurization in this case does not necessarily imply that organic sulfur functionalities a r e not affected by the H202/ H2S0 treatment. A s we will show in the section on model compounds, all the basic organosulfur structures present in coal can be readily converted to the sulfone form under the conditions of the H202/H2S0 attack. In most cases, however, the oxidation does not proceed beyond the sulfone stage, and t%e additional desulfurization steps necessary to free the organic sulfur from the coal matrix (Equation 2) do not take place.
In a recent study (13), Kralik has reported that a hot aq. Na2C03 wash of coal pretreated with a mild oxidizing agent results in significant organic-sulfur reduction, mainly by splitting off relatively low-molecular-weight, oxidized sulfur compounds from the hydrocarbon matrix. It i s feasible that the high selectivity of the peroxide treatment of coal towards sulfur oxidation could be combined with a subsequent alkaline hydrolysis step to leach out a significant portion of the oxidized organosulfur compounds, thus affecting not only pyritic, but also organic-sulfur removal from coal.
The oxidation of sul$ur {eyond the sulfone stage (Reaction 2) has not been studied to any
The key to an economically feasible desulfurization process based on oxidation is, of
Muka i et al. (10) studied the treatment of several Japanese bituminous coals with 3 wt %
EXPERIMENTAL
Chemical beneficiation experiments were carried out in batch mode at ambient temperature and pressure with a Redstone high-volatile A , bituminous coal. The ultimate analysis and sulfur forms for this coal, designated a s PSOC-715, a r e included in Table I. In each r u n , approximately 20 grams of the dried and sized (200x325 mesh) coal was slurried in a 500-ml Pyrex Erlenmeyer flask with 300 ml of a 15 Wt % H202 solution of the desired H2SO4 concentration. At the end of the reaction period the slurry was vacuum-filtered through a fine-porosity fritted glass funnel and the coal was washed several times with water for analytical purposes. Treated coal samples were dried for 24 hours under vacuum at 110°C and then analyzed for proximate and ultimate composition and heating value. A portion of the H 2 0 2 / ~ p 0 4 treated coal was further subjected to an extended
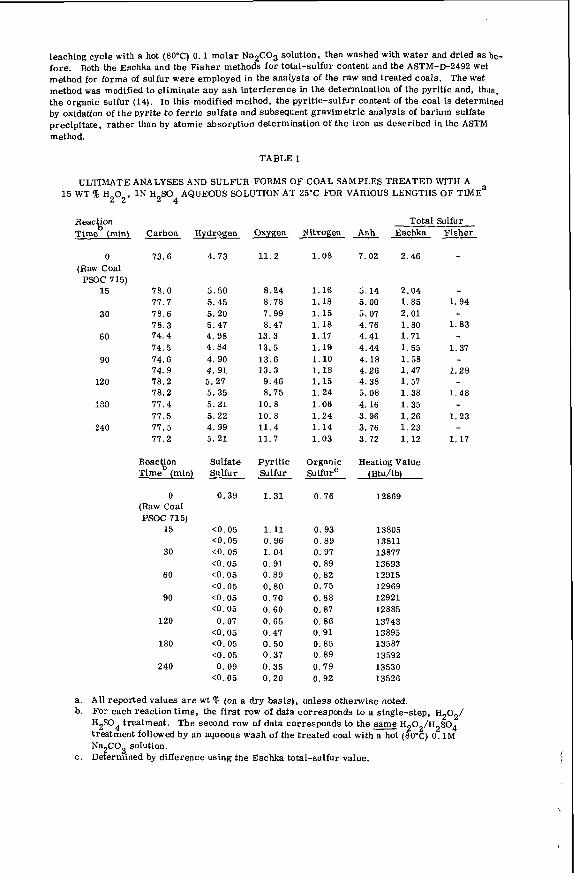
leaching cycle with a hot (50°C) 0 . 1 molar Na2C03 solution, then washed with water and dried as be- fore. method for forms of sulfur were employed in the analysis of the raw and treated coals. The wet method w a s modified to eliminate any ash interference in the determination of the pyritic and, thus, the organic sulfur (14). In this modified method, the pyritic-sulfur content of the coal is determined by oxidation of the pyrite to ferr ic sulfate and subsequent gravimetric analysis of barium sulfate precipitate, rather than by atomic absorption determination of the iron as described in the ASTM method.
Both the Eschka and the Fisher methods for total-sulfur content and the ASTM-D-2492 wet
TABLE I
ULTIMATE ANALYSES AND SULFUR FORMS OF COAL SAMPLES TREATED WITH A 15 WT H202, 1 N H2S04 AQUEOUS SOLUTION AT 25°C FOR VARIOUS LENGTHS OF TIMEa
Eleac' ion Tim) (min)
0
PSOC 715) 15
30
60
90
120
:e3
240
(Raw Coal
Carbon Hydrogen
73.6 4.73
78.0 5.50 77.7 5.45 78.6 5.20 78.3 5.41 74.4 4.98 74.5 4.84 74.6 4. 90 74.9 4.91 75.2 5.27 78.2 5.35
5.21 11.4
77.5 5.22 17.5 4.99 77.2 5.21
--
Oxygen
11.2
8.24 5. 75 7.99 8.47
13.3 13.5 13.6 13.3
9.46 8.75
10.8 10.8 11 .4 11.7
Total Sulfur Nitrogen Ash Eschka Fisher
1.05 7.02 2.46 -
1.16 5.14 2.04 1.18 5.00 1.85 1.94 1 .15 5.07 2.01 1.18 4.16 1.50 1.83 1.17 4.41 1.71 - 1.19 4.44 1 .55 1.37 1.10 4.18 1.55 - 1.1s 4.26 1.47 1.29 1.15 4.38 1.57 1.24 5.08 1.38 1.48 1.06 4.16 1 .35 1.24 3.96 1.26 1.23 1.14 3.76 1.23 - 1.03 3.72 1.12 1.17
Reacfbn , Sulfate Pyritic Organic Heating Value Time (mini Sulfur Sulfur Sulfur' (Btu/lb)
0 (Raw Coal PSOC 715)
15
30
60
90
120
180
240
0.39 1 .31 0.76
c0.05 1.11 0.93 C0.05 0.96 0.89 cO.05 1.04 0. 97 C0.05 0.91 0. 59 C O . 0 5 0.89 0.82 cO.05 0.80 0.75 CO.05 0.70 0.58 cO.05 0.60 0.87 0.07 0.65 0.86
cO.05 0.47 0.91 cO.05 0.50 0.55 ~ 0 . 0 5 0.37 0.89 0.09 0.35 0.79
cO.05 0.20 0.92
12869
13505 13811 13577 13693 12915 12969 12921 12555 13743 13895 13551 13592 13530 13526
a. All reported values are wt 5% (on a dry basis), unless otherwise noted. b. For each reaction t ime, the first row of data corresponds to a single-step, H202/
H2S04 treatment. The second row of data corresponds to the ~ a m e H202/H2S04 treatment followed by an aqueous wash of the treated coal with a hot (SO'C) 0.1M NaZCO solution.
c. Deterzined by difference using the Eschka total-sulfur value.
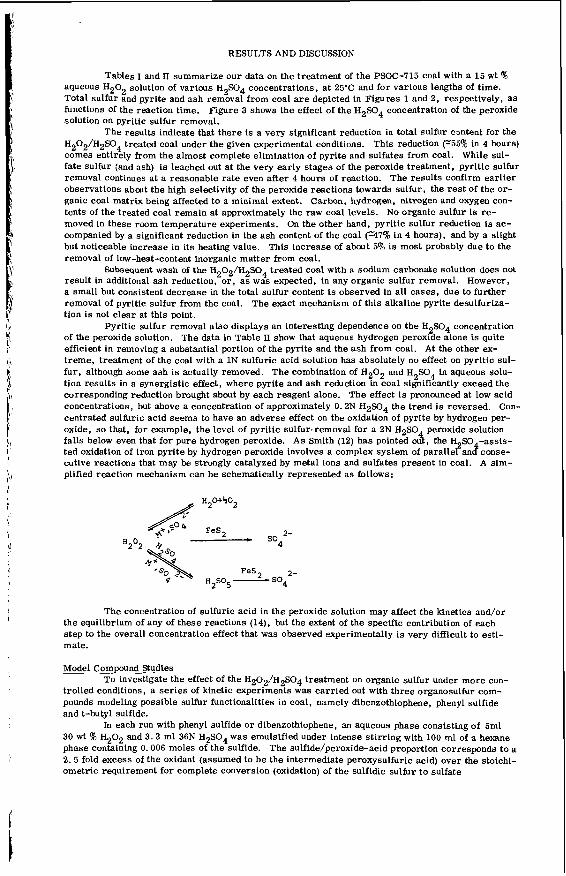
RESULTS AND DISCUSSION
Tables I and II summarize our data on the treatment of the PSOC-715 coal with a 15 wt '% aqueous H202 solution of various H2S04 concentrations, a t 25'C and for various lengths of time. Total Sulfur and pyrite and ash removal from coal a r e depicted in Figures 1 and 2, respectively, as functions of the reaction time. Figure 3 shows the effect of the H 2 m 4 concentration of the peroxide solution on pyritic su l fur removal.
The results indicate that there i s a very significant reduction in total sulfur cmtent for the H 0 /H SO treated coal under the given experimental conditions. This reduction F55% in 4 hours) comes entirely from the almost complete elimination of pyrite and sulfates from coal. While sul- fate Sulfur (and ash) i s leached out at the very early stages of the peroxide treatment, pyritic sulfur removal Continues at a reasonable rate even after 4 hours of reaction. The results confirm earlier observations about the high selectivity of the peroxide reactions towards sulfur, the res t of the or- ganic coal matrix being affected to a minimal extent. Carbon, hydrogen, nitrogen and oxygen con- tents of the treated coal remain at approximately the raw coal levels. moved in these room temperature experiments. On the other hand, pyritic sulfur reduction is ac- companied by a significant reduction in the ash content of the coal (=47% in 4 hours), and by a slight but noticeable increase in its heating value. This increase of about 5% is most probably due to the removal of low-heat-content inorganic matter from coal.
result in additional ash reduction, or, a s was expected, in any organic sulfur removal. However, a small but consistent decrease in the total sulfur content i s observed in all cases, due to further removal of pyritic su l fur from the coal. The exact mechanism of this alkaline pyrite desulfuriza- tion i s not clear at this point.
of the peroxide solution. The data in Table II show that aqueous hydrogen peroxide alone is quite efficient in removing a substantial portion of the pyrite and the ash from coal. At the other ex- treme, treatment of the coal with a 1N sulfuric acid solution has absolutely no effect on pyritic sul- f u r , although some ash i s actually removed. The combination of H202 and H2S04 in aqueous solu- tion results in a synergistic effect, where pyrite and ash reduction in coal significantly exceed the corresponding reduction brougllt about by each reagent alone. The effect is pronounced at low acid concentrations, but above a concentration of approximately 0.2N H 2 m 4 the trend is reversed. Con- centrated sulfuric acid seems to have an adverse effect on the oxidation of pyrite by hydrogen per- oxide, so that, for example, the level of pyritic sulfur.remova1 for a 2N H2SO peroxide solution falls below even that for pure hydrogen peroxide. A s Smith (12) has pointed oh, the H SO -assis- ted oxidation of iron pyrite by hydrogen peroxide involves a complex system of parallefan%conse- cutive reactions that may be strongly catalyzed by metal ions and sulfates present in coal. A sim- plified reaction mechanism can be schematically represented as follows:
2 2 2 . 4
No organic sulfur is re-
Subsequent wash of the H202/H2S04 treated coal with a sodium carbonate solution does no1
Pyritic sulfur removal also displays an interesting dependence on the H2S04 concentration
FeS2
H2O2
H SO - 2 5
The concentration of sulfuric acid in the peroxide solution may affect the kinetics and/or the equilibrium of any of these reactions (14). but the extent of the specific contribution of each step to the overall concentration effect that was observed experimentally i s very difficult to esti- mate.
Model Compound Studies
trolled conditions, a series of kinetic experiments was carried out with three organosulfur com- pounds modeling possible sulfur functionalities in coal, namely dibenzothiophene, phenyl sulfide and t-butyl sulfide.
In each run with phenyl sulfide or dibenzothiophene, a n aqueous phase consisting of 5ml 30 wt % H202 and 3.3 ml 36N H2S04 was emulsified under intense st irring with 100 ml of a hexane phase containing 0.006 moles of the sulfide. The sulfide/peroxide-acid proportion corresponds to a 2. 5 fold excess of the oxidant (assumed to be the intermediate peroxysulfuric acid) over the stoichi- ometric requirement for complete conversion (oxidation) of the sulfidic sulfur to sulfate
To investigate the effect of the H20!/H2S04 treatment on organic sulfur under more con-
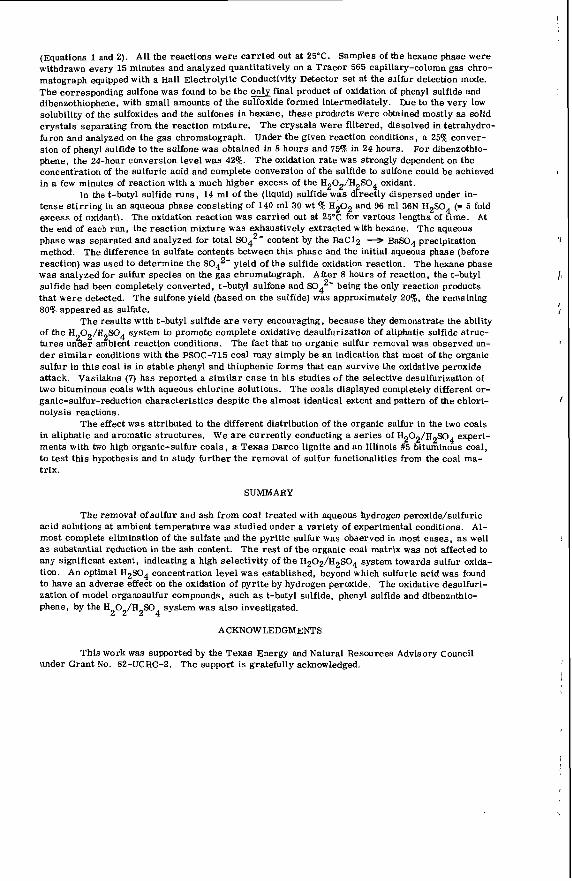
(Equations 1 and 2). All the reactions were carr ied out a t 25°C. Samples of the hexane phase were withdrawn every 15 minutes and analyzed quantitatively on a Tracor 565 capillary-column gas chro- matograph equipped with a Hall Electrolytic Conductivity Detector se t at the sulfur detection mode. The corresponding sulfone was found to be the &final product of oxidation of phenyl sulfide and dibenzothiophene, with small amounts of the sulfoxide formed intermediately. Due to the very low solubility of the sulfoxides and the sulfones i n hexane, these products were obtained mostly a s solid crystals separating from the reaction mixture. The crystals were filtered, dissolved in tetrahydro- furon and analyzed on the gas chromatograph. Under the given reaction conditions, a 25% conver- sion of phenyl sulfide to the sulfone was obtained in 8 hours and 75% in 24 hours. For dibenzothio- phene, the 24-hour conversion level was 42%. The oxidation ra te was strongly dependent on the concentration of the sulfuric acid and complete conversion of the sulfide to sulfone could be achieved in a few minutes of reaction with a much higher excess of the H20,/HgS04 oxidant.
tense stirring in an aqueous phase consisting of 140 ml 30 wt % H 2 0 2 and 96 ml 36N H SO (- 5 fold excess of oxidant). The oxidation reaction was carr ied out at 25'C for various lengths of time. A t the end of each run, the reaction mixture was exhaustively extracted with hexane. phase was separated and analyzed for total S042- content by the BaCl2 method. The difference in sulfate contents between this phase and the initial aqueous phase (before reaction) was used to determine the S042- yield of the sulfide oxidation reaction. The hexane phase was analyzed for sulfur species on the gas chromatograph. After 8 hours of reaction, the t-butyl sulfide had been completely converted, t-butyl sulfone and So42- being the only reaction products that were detected. The sulfone yield (based on the sulfide) was approximately 2090, the remaining 80% appeared a s sulfate.
The results with t-butyl sulfide are very encouraging, because they demonstrate the ability of the H 0 /€I SO system to promote complete oxidative desulfurization of aliphatic sulfide struc- tures un%er ambient reaction conditions. The fact that no organic sulfur removal was observed un- der similar conditions with the PSOC-715 coal may simply be an indication that most of the organic sulfur in this coal is in stable phenyl and thiophenic forms that can survive the oxidative peroxide attack. Vasilakos (7) has reported a similar case in his studies of the selective desulfurization of two bituminous coals with aqueous chlorine solutions. The coals displayed completely different or- ganic-sulfur-reduction characteristics despite the almost identical extent ,and pattern of the chlori- nolysis reactions.
The effect was attributed to the different distribution of the organic sulfur in the two coals in aliphatic and aromatic structures. We a r e currently conducting a ser ies of H 2 0 2 / ~ 2 y , experi- ments with two high organic-sulfur coals, a Texas Darco lignite and an IlIinois 85 bituminous coal, to test this hypothesis and to study further the removal of sulfur functionalities from the coal ma- trix.
In the t-butyl sulfide r u n s , 14 ml of the (liquid) sulfide was directly dispersed under in-
2 4
The aqueous BaS04 precipitation
2 2 4
SUMMARY
The removal of sulfur and ash from coal treated with aqueous hydrogen peroxide/sulfuric acid solutions at ambient temperature was studied under a variety of experimental conditions. Al- most complete elimination of the sulfate and the pyritic sulfur was observed in most cases, as well as substantial reduction in the ash content. The res t of the organic coal matrix was not affected to any significant extent, indicating a high selectivity of the H202/H2S04 system towards sulfur oxida- tion. An optimal H2S04 concentration level w a s established, beyond which sulfuric acid was found to have an adverse effect on the oxidation of pyrite by hydrogen peroxide. The oxidative desulfuri- zation of model organosulfur compounds, such as t-butyl sulfide, phenyl sulflde and dibenzothio- phene, by the H 0 /H So system was also investigated.
2 2 2 4
ACKNOWLEDGMENTS
This work was supported by the Texas Energy and Natural Resources Advisory Council under Grant No. 82-UCRC-2. The support is gratefully acknowledged.
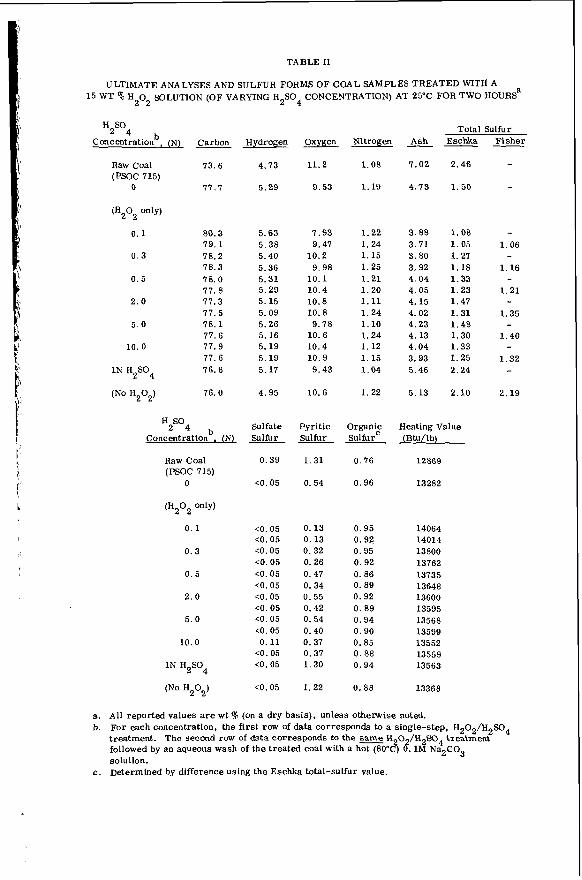
TABLE I1
ULTIMATE ANALYSES AND SULFUR FORMS OF COAL SAMPLES TREATED WITH A 15 WT % H202 SOLUTION (OF VARYING HZS04 CONCENTRATION) AT 25°C FOR TWO HOURSa
H2S04 Concentrationb, (N) Carbon Hydrogen
Raw Coal 73.6 (PSOC 715)
0 77.7
W202 only)
0 . 1 80.3 79.1
0 .3 78.2 78.3
0 . 5 78.0 77.8
2.0 77.3 77.5
5 . 0 78.1 77.6
10.0 77.9 77.6
1 N H2S04 76.6
(No H202) 76. 0
H SO 2 4
Concentrationb, (N)
Raw Coal ( R O C 715)
0
(H202 only)
0 . 1
0 . 3
0.5
2.0
5 .0
10.0
4.73
5.29
5.63 5.38 5.40 5.36 5.31 5.29 5.15 5.09 5.26 5.16 5.19 5.19 5.17
4.95
Sulfate Sulfur
0.39
<O. 05
<O. 05 <O. 05 <O. 05 <O. 05 <O. 05 <O. 05 <O. 05 <O. 05 <O. 05 <O. 05 0.11
<O. 05 <O. 05
<O. 05
Total Sulfur Fisher
~ ~- Oxygen Nitrogen Ash Eschka
11.2
9.53
7.93 9.47
9.98 10.2
10.1 10.4 10.8 10.8
10.6 10.4 10.9
9.78
9.43
10.6
Pyritic Sulfur
1.31
0.54
0. 1 3 0.13 0.32 0.26 0.47 0.34 0.55 0.42 0.54 0.40 0.37 0.37 1.30
1.22
1.08
1.19
1.22 1.24 1.15 1.25 1 . 2 1 1.20 1.11 1.24 1.10 1.24 1.12 1.15 1.04
1.22
Organic SulfurC
0.76
0.96
0.95 0.92 0.95 0.92 0.86 0.89 0.92 0.89 0.94 0 .90 0.85 0.88 0.94
0.88
7.02 2.46
4.73 1.50
3.88 1.08 3.71 1.05 3.80 1.27 3.92 1.18 4.04 1.33 4.05 1.23 4.15 1.47 4.02 1 .31 4.23 1 .48 4.13 1.30 4.04 1.33 3.93 1 .25 5.46 2.24
5.13 2.10
Heating Value (Btu/lb)
12869
13282
14064 14014 13800 13762 13735 13648 13600 13595 13568 13599 13552 13559 13563
13368
- -
- 1.06
1.16
1 .21
1.35
1.40
1.32
-
- - -
2.19
a. A l l reported values are wt '% (on a dry basis), unless otherwise noted. b. For each concentration, the first row of data corresponds e0 a single-step, H202/H2S04
treatment. The second raw of data corresponds to the same H202/H2S04 treatment followed by an aqueous wash of the treated coal with a hot (80OC) 0.1M Na2C0 solution. Determined by difference using the Eschka total-sulfur value.
3
c.
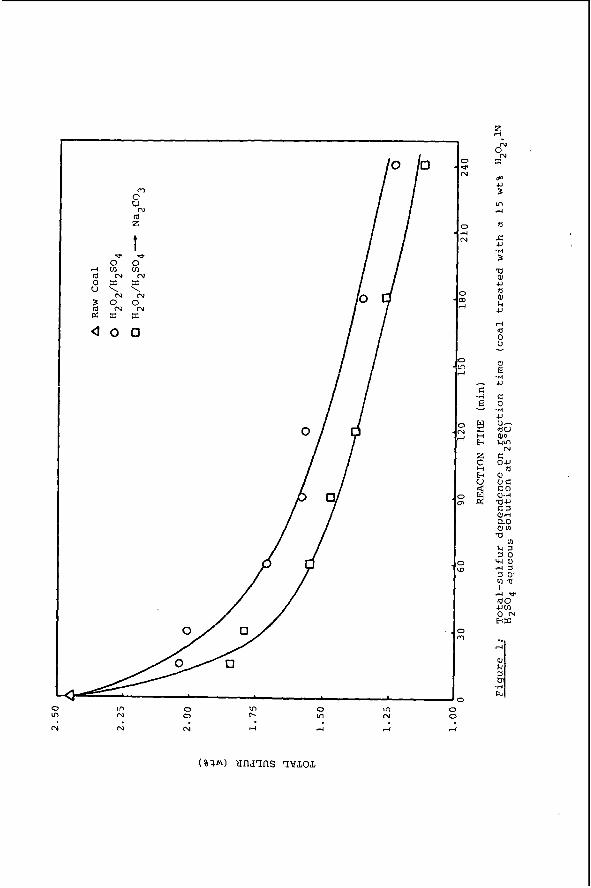
0 ul ul N
N N
0 0
N
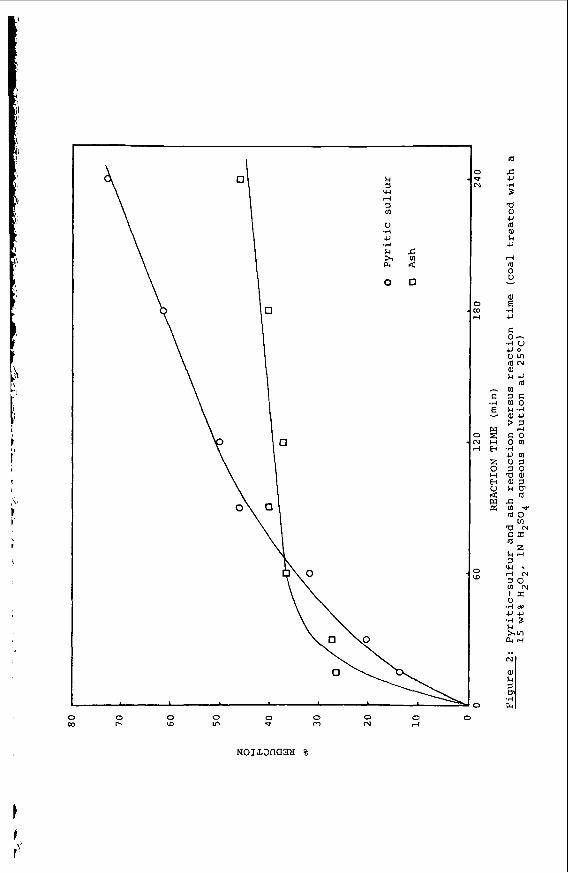
!
i” i
I J i
I >
I
0 0 0 0 N ,-I
Nonmam %
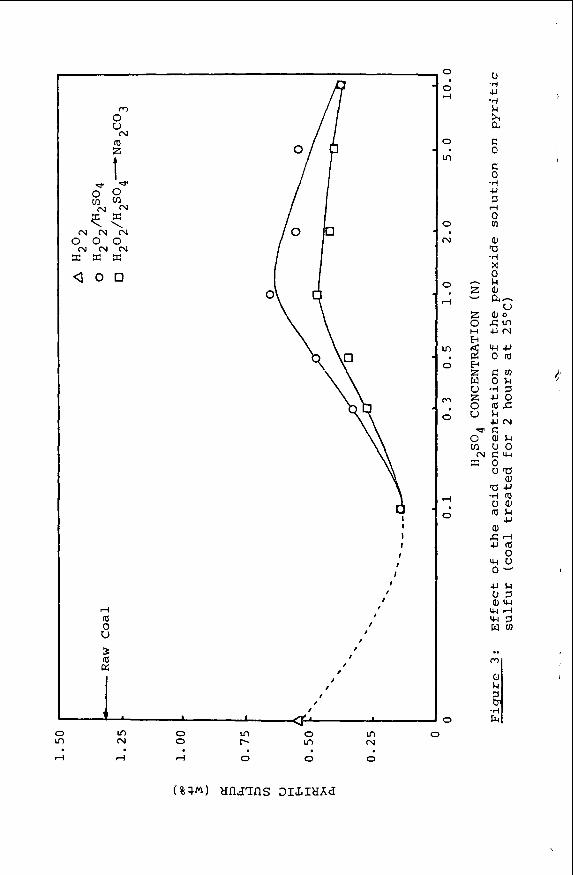
m 0
(d z
t e - $ $ <e N
P I rd 0 u 3 (d ffi
I
I I I I I
I I
I t
I
I I
f I
I I
I t
I I
f I
0 In 0 In 0 In 0 In N 0 P In N
rl 4 4 0 0 0
LITERATURE CITED
DU Fresne, E. R. , "Coal Cleaning Versus Flue-Gas Desulfurization in Meeting New Pro- prosed Air Pollution Standards", Assessment Report, J e t Propulsion Lab. , Pasadena, CA (1979). Attar, A. andCorcoran, W . H . , Ind. Eng. Chem. Prod. Res. Dev., 11, 102 (1978). Kalvinskas, J. J . , et al. , "Final Report for Phase II - Coal Desulfurization by Low Tem- perature Chlorinolysis", Jet Propulsion Lab. Publication 80/15, Pasadena, CA (1980). Friedman, S. , Lacount, R. B. and Warzinski, R . P. , "Oxidative Desulfurization of Coal", in "Coal Desulfurization", ACS Symp. Series No. 64, Washington, DC (1977). Vasilakos, N. P . , Bone, A. L. andcoworan , W. H . , Ind. Eng. Chem. Prod. Res. Dev., - 20, 376 (1981). Reid, E. E., "Organic Chemistry of Bivalent Sulfur", Chemical Publishing Co., Inc. , NY (1960). Vasilakos, N. P. , "Coal Desulfurization by Selective Chlorinolysis", Ph. D. Thesis, California Inst. of Tech. , Pasadena, CA (1980). Ross, S. D., Finkelstein, M . and Rudd, E. J. , "Anodic Oxidation", Academic Press, Inc., NY (1975). Meyers, R. A . , "Coal Desulfurization", Marcel Dekker, Inc., NY (1977). Mukai, S. , A r a k i , Y. , Konish, M. and Otomura, K. , Nenryo Kyoka-shi 48, 905 (1969); Chem. Abstr. 72, 123720d (1970). Nalwalk, A. J. , Friedel, R.A. and Queiser, J. A. , Energy Sources 1, 179 (1974). Smith, E. B. , "Lowering the Sulfur and Ash Contents of High-Sulfur Coals by Peroxide- Acid Treatment", ACS, Div. of Fuel Chem., Preprints, g, 140 (1975). Kralik, J. G. , "An Investigation of the Applied Chemistry of the Reactions of Coal and Nitrogen Dioxide with Particular Emphasis on Oxidative Desulfurization", Ph. D. Thesis, California Inst. of Tech., Pasadena, CA (1982). Monger, J. M. and Redlick, O . , J. Phys. Chem., 60, 797 (1956).