Embed Size (px)
Citation preview
1
The Costs of Powdery Mildew Management in Grapes and the Value of Resistant Varieties: Evidence from California
Olena S. Sambucci, Julian M. Alston, Kate B. Fuller
September 11, 2014
Olena Sambucci is a PhD candidate in the Department of Agricultural and Resource Economics at the University of California, Davis.; Julian Alston is a professor in the Department of Agricultural and Resource Economics and Director of the Robert Mondavi Institute Center for Wine Economics at the University of California, Davis, and a member of the Giannini Foundation of Agricultural Economics; Kate Fuller is an Assistant Professor and Extension Specialist in the Department of Agricultural Economics and Economics at Montana State University. The authors are grateful for advice and comments provided by Mark Battany, Larry Bettiga, Monica Cooper, Nick Dokoozlian, Matthew Fidelibus, Franka Gabler, Doug Gubler, Ross Jones, Travis Lybbert, Mike Moriyama, Kathleen Nave, David Ramming, Rhonda Smith, Rick Stark, and Andrew Walker. The work for this project was partially supported by Specialty Crop Research Initiative Competitive Grant, Award No. 2011-51181-30635, of the USDA National Institute of Food and Agriculture, through the VitisGen project, http://www.vitisgen.org/, and the Giannini Foundation of Agricultural Economics.
© Copyright 2014 by Olena Sambucci, Julian M. Alston, and Kate B. Fuller. All rights reserved. Readers may make verbatim copies of this document for non-commercial purposes by any means provided that this copyright notice appears on all such copies.
2
The Costs of Powdery Mildew Management in Grapes and the Value of Resistant Varieties: Evidence from California
ABSTRACT. Powdery mildew (PM) is a fungal disease that can affect a variety of crops, but it is the most significant disease in terms of expenses for control and losses in quality and yield faced by grape growers worldwide. PM-resistant grape varieties are currently being developed, but the value of such varieties to the growers in different industry segments is yet to be determined. The first step in estimating the potential value of PM-resistant varieties is to establish the costs of PM management that these varieties will serve to mitigate. We utilize Pesticide Use Reports from the California Department of Pesticide Regulation as well as data on pesticide application costs and measures of environmental impact to evaluate annual costs, both pecuniary and non-pecuniary, of powdery mildew management among California grape growers. We estimate the statewide cost of PM management (fungicides and their application) in 2011 to be about $189 million. In addition, we find that PM management accounts for 74 percent of restricted material (pesticide) applications by grape growers and eliminating powdery mildew would significantly reduce the environmental burden from disease management in grapes. Key Words: Powdery mildew, resistant varieties, California grapes, disease management JEL Codes: Q12; Q16; Q50
3
1. Introduction
Powdery mildew (PM) is a fungal disease that can be caused by several species of
fungi and can affect a variety of plants. Grape powdery mildew (Erisiphe necator, syn.
Uncinula necator) affects grape crops all over the world and is the most significant
disease in terms of expenses for control and losses in quality and yield faced by grape
growers, in California and worldwide (Bettiga et. al., 2013). Efforts are underway to
develop PM-resistant grape varieties that can be used by growers of all types of grapes,
including wine, table and raisin grapes (e.g., VitisGen http://www.vitisgen.org/). So far,
there has been no formal evaluation of the likely value to growers in the different
industry segments, and the broader community if PM resistant varieties become
available. A first step to answering that question is to establish the costs of PM
management, which resistant varieties would serve to mitigate. The total statewide costs
of PM management include pecuniary costs such as the costs of purchasing and applying
fungicides, and non-pecuniary costs such as environmental and worker health effects, as
well as the inconvenience to the grower from having to worry about the appropriate
methods of disease control or the potential damage to the crop.
We find that PM management accounts for a very large share of the total pesticide
applications (74 percent of total pounds of active ingredient) by California grape growers
and a significant share (17 percent) of the total pesticide use in California agriculture.
The pecuniary costs vary across industry segments, depending on various factors such as
the location of production and the end-use for the grapes, but these costs typically
represent a very substantial share of the total costs of production—in the range of 37
percent of the gross value of production in places where PM pressure is significant. Much
4
of the total volume of fungicides is sulfur, which is relatively environmentally benign,
but even so in the production of table grapes and raisins, in particular, PM-management
may account for well more than 90 percent of the total environmental burden from
pesticide applications.
2. Powdery Mildew in Grapes
Grape powdery mildew can survive the winter in California in buds or as spore
structures (chasmotheica). Once weather conditions are favorable (warm, moist winter
days or during early spring), the release of ascospores begins the reproduction cycle,
which continues throughout the season.1 Initial infection appears as white, powdery spots
on leaves, shoots, flowers, or fruit. These spots are the mycelium (fungal tissue) spores,
which are the fungi’s primary means of dispersal. If untreated, the mycelium can spread
over large areas of the leaves and stems and cause reduced yields and lower quality fruit
(Davis, et al., 2008).
Grape growers start spraying early in the spring and continue either at preset
intervals or using a disease risk-assessment tool such as the Powdery Mildew Index
(PMI). Fungicides commonly used for PM treatment can be classified into the categories
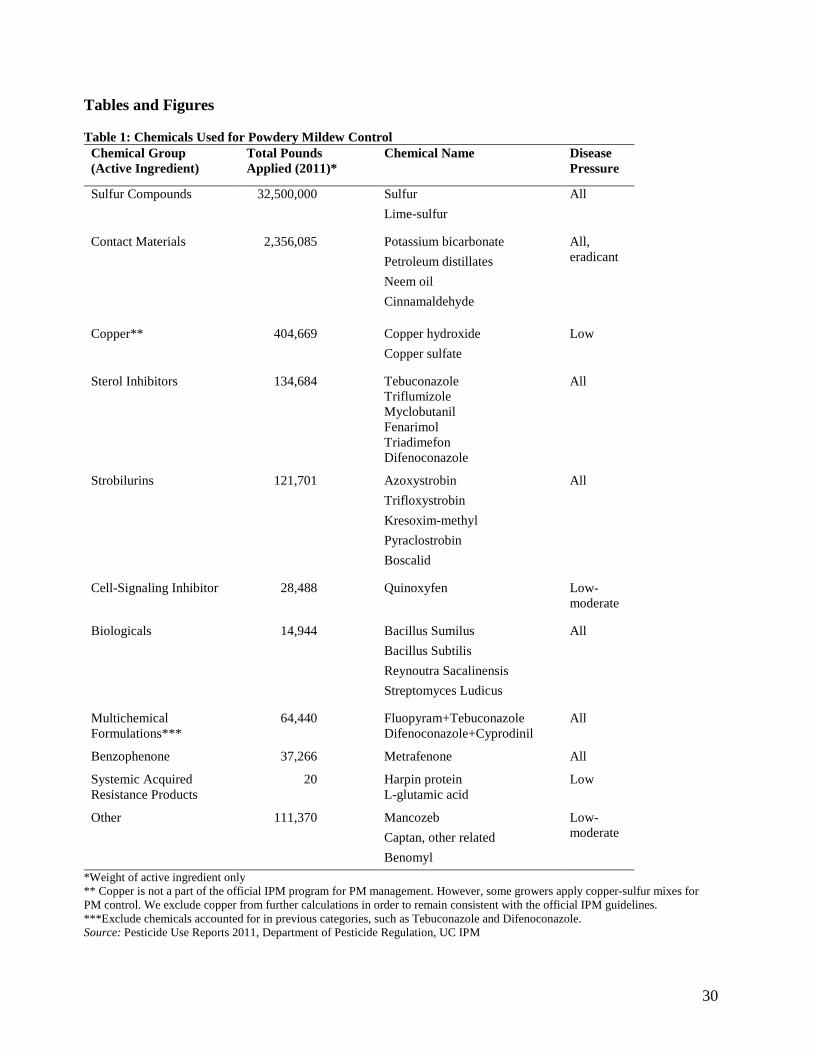
shown in in Table 1.
[Table 1: Pesticides Used for Powdery Mildew Control]
The three most commonly used groups of pesticides are strobilurins, sterol
inhibitors, and sulfur. Other types of pesticides such as biological, systemic acquired
resistance products, or cell-signaling inhibitors are typically used when disease pressure
1 Ascospores are reproductive spores specific to fungi such as powdery mildew.
5
is low to moderate. Contact materials, such as stylet oils, are mainly used for eradication,
but can also be used for outbreak prevention and may be used as an alternative to sulfur
in areas where buyers discourage the use of sulfur, primarily among wine grape growers.
Powdery mildew populations have shown an ability to develop resistance to
fungicides with a single mode of action, such as sterol inhibitors and strobilurins. As a
result, growers are recommended to alternate between fungicides from different groups
and limit the number of applications of fungicides from a single group of synthetic
chemicals per season. A common spraying schedule is to alternate sterol inhibitors,
strobilurins and other synthetics with sulfur. Organic growers use only organically
certified products that include sulfur, biologicals, and contact chemicals such as stylet oil,
neem oil, and potassium bicarbonate and fungicidal soaps (Bentley, et al., 2008).2
The cost of PM management to a grape grower includes the cost of the pesticides
used, the application costs and any losses from reduced yield and quality. In addition to
these pecuniary costs, three categories of non-pecuniary costs are associated with
management of crop pests and diseases: human and worker safety, environmental
pollution, and the general inconvenience from having to devote time and resources to
ensure the adequacy of pest and disease control (Marra and Piggott, 2006). We first take
a closer look at the pecuniary costs incurred by growers: specifically, the value of
materials applied and the costs of application.
2 Neem oil is a vegetable oil obtained from the seeds and fruit of the neem tree (Azadirachta Indica). It is widely used in organic farming as an insect repellent and for control of fungal diseases such as powdery mildew. Stylet oil is paraffinic oil used for treatment and prevention of powdery mildew and as an insecticide, primarily for mite control. JMS Stylet Oil is the most popular of the stylet oils for use on grapes and is certified for organic farming.
6
3. Fungicides used for PM Management and their Application Schedule
a) Categories of pesticides
The choice of chemical and application schedule depend to some extent on the
location of the vineyard, category of grapes (i.e., wine, table, or raisin) and varieties
grown. Location of the vineyard can affect the pesticide application schedule because the
timing of the growing season and disease pressure vary among different regions
throughout the state (Bettiga, et al., 2013).
b) Grape production regions
California is made up of six major grape growing regions: the North Coast,
Central Coast, South Coast, Northern San Joaquin Valley, Southern San Joaquin Valley,
and Coachella Valley. Each region has a slightly different growing season for grapes
because of differences in climate (Bettiga, et al., 2013).Therefore the timing of the
critical disease control season also varies. Grape growing regions can further be classified
according to PM disease pressure. Powdery mildew thrives in moderate climates, so at
any given time during the growing season, coastal regions and the foothills typically have
higher disease pressure than the Central Valley, where temperatures are higher.
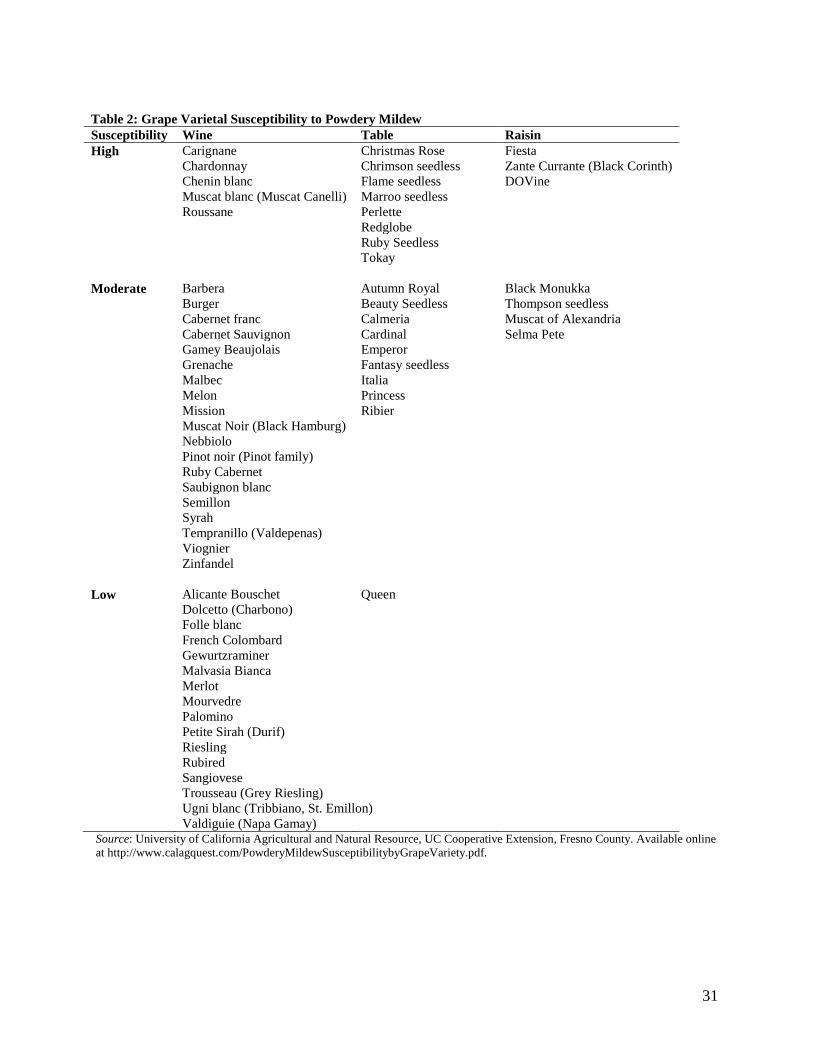
Differences in varietal susceptibility and category of grapes create additional
differences in PM management programs. Grape varieties also vary in their sensitivity to
PM at different points in the season. White grape varieties are more susceptible than red
grape varieties, with chardonnay being highly susceptible (W. Douglas Gubler, 2013,
personal communication). In some cases fruit quality may also be affected by the amount
or timing of a pesticide application (for example, some grapes may be damaged by sulfur
or copper). The end-use category of grapes also matters: at 8–12° Brix PM is no longer
7
able to infect the fruit, but can still affect stems and leaves, a quality factor only for table
grapes.3 Therefore, according to the University of California Integrated Pest Management
(UC IPM) guidelines, PM management for wine and raisin grapes may be discontinued
once the fruit reaches 12° Brix, but should be continued until harvest for table grapes
(Bentley, et al., 2008). While many growers still continue spraying wine and raisin grapes
up until harvest, the spraying schedule may be more conservative after the grapes reach
12° Brix. Table 2 includes the classification of grape varieties into three groups of
susceptibility to PM for each category of production: table, wine or raisin grapes.
[Table 2: Grape Varietal Susceptibility to Powdery Mildew]
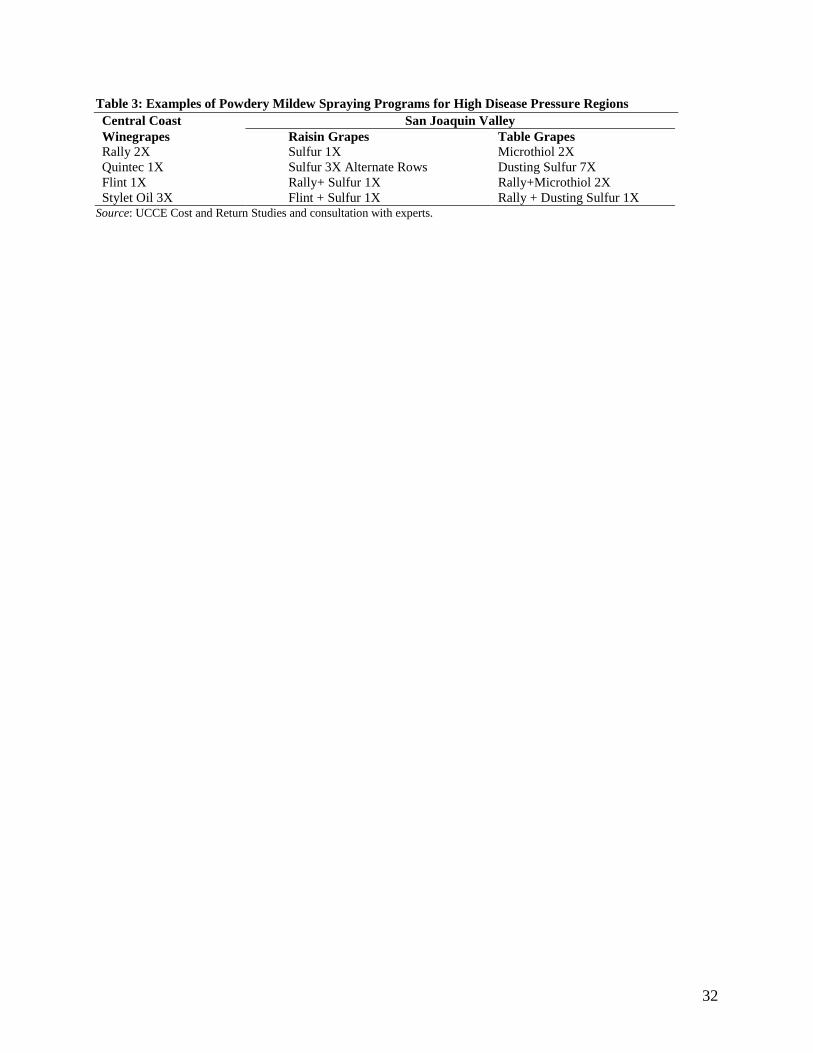
c) Sample Spraying Programs
Growers who follow a calendar schedule will spray at predetermined intervals as
recommended for each group of pesticides. Sample recommended treatment programs for
growers in areas with high and moderate disease pressure are presented in Table 3.
[Table 3: Examples of powdery mildew spraying programs]
d) PM Forecasting Tools
Growers may adjust the spraying schedule if they feel weather is particularly
favorable for PM. Additionally, growers can use forecasting tools to guide their timing of
pesticide sprays. The Gubler-Thomas Powdery Mildew Index (PMI) is the leading tool
for forecasting PM; it is available to growers either bundled with weather monitoring
software, or for free from public sources such as the UC IPM website or pesticide
suppliers. The index provides information about disease pressure and recommendations
for adjusting the spraying intervals for various groups of pesticides. In field trials,
3 The Brix scale is used to measure the sugar content of grapes and wine. Each degree Brix is equivalent to 1 gram of sugar per 100 grams of grape juice.
8
growers using the PMI to guide the timing of their treatment saved 2–4 sprays per year, a
significant reduction both in pesticide application costs and the environmental burden
from PM control (Thomas, et al., 1994, Weber, et al., 1996).
4. Statewide Pesticide Application Data
We can estimate the quantities of pesticides applied and the approximate costs of
PM management to grape growers in California using the Pesticide Use Reports (PUR)
published by the California Department of Pesticide Regulation. Pesticides used for PM
control are used almost exclusively for that reason. Several other diseases are treated with
fungicides, but the choice of product, timing and amount of application allows us to
identify PM treatments with a high degree of accuracy. Our analysis includes pesticide
totals in pounds of material and active ingredient, as well as estimates of the costs of both
the product used and its application. Tables 4 and 5 describe the amounts of pesticides
applied by chemical category in pounds of active ingredient. The calculations include
only pesticides applied during the “preferred disease management seasons” for each
growing region as described in the 2013 University of California Grape Pest Management
Handbook (Bettiga, et al., 2013) but these totals account for 89 percent of total fungicide
applications. We include only applications made during preferred PM management
seasons in order to exclude fungicide applications made for reasons other than PM
management, but in doing so we also will have excluded some applications made for PM
control.
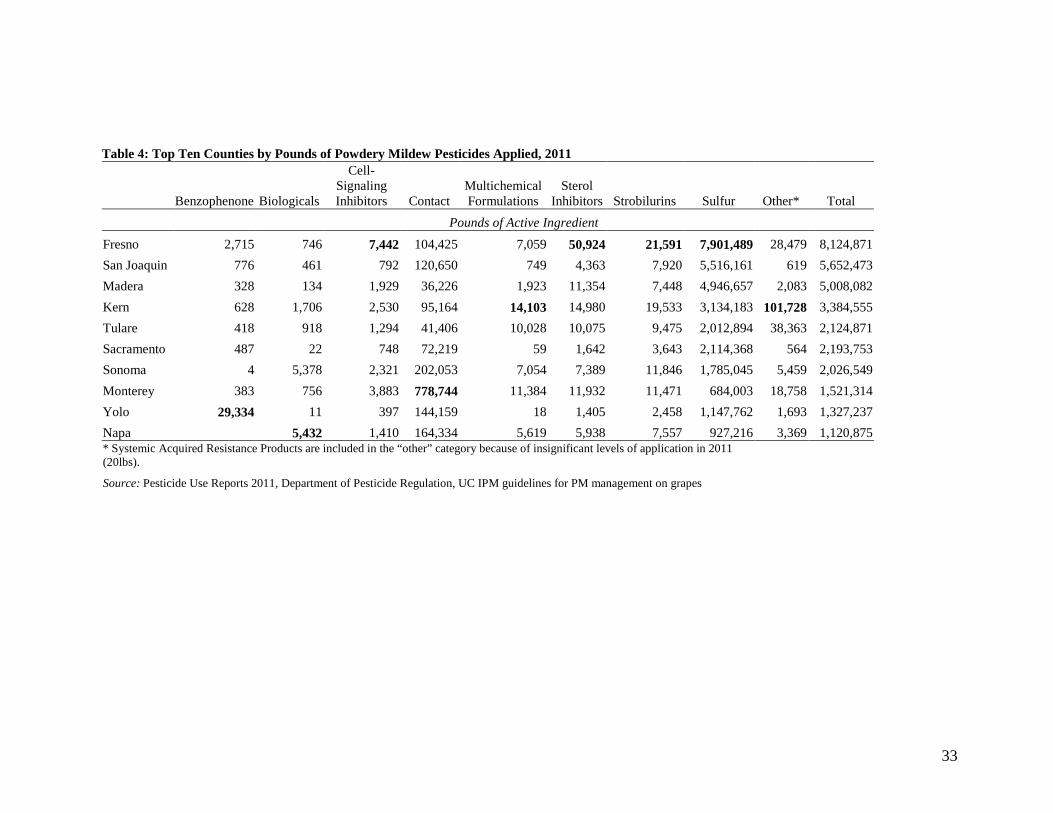
The quantity of pesticides applied gives some indication of the magnitude of
potential savings both in vineyard management costs to the grower and in environmental
9
costs from pesticide applications if the danger of PM infections were significantly
reduced by the introduction of resistant grape varieties. Table 4 includes the top ten
counties by total pounds of pesticides applied in 2011, which are also the top grape
producing counties in California.
[Table 4: Top Ten Counties by Pounds of Powdery Mildew Pesticides Applied, 2011]
Pesticide use for PM management varies substantially by geographic location and
according to the value of the crop. Geography and grape crop value in California are
highly correlated, so it is feasible to analyze the two together. We begin by analyzing the
pesticide use trends at the county level, making use of PURs.
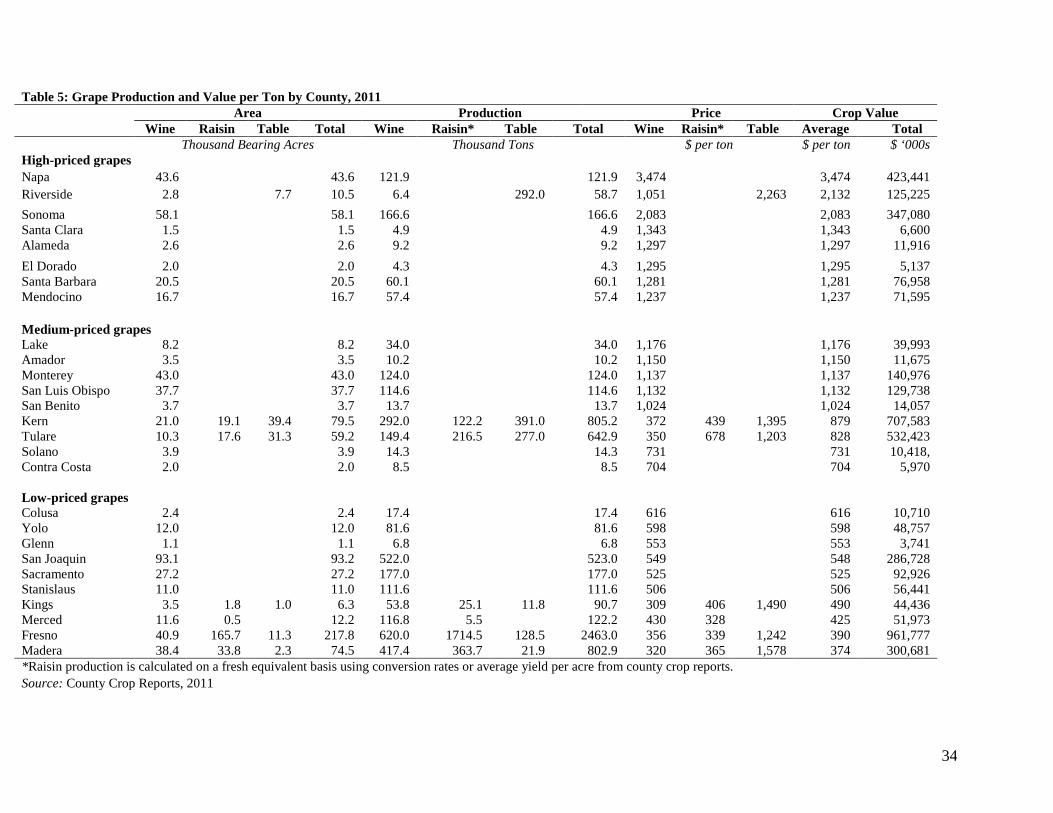
We gathered data on county grape acreage, average yield per acre, and harvest
value from the annual county crop reports available from the corresponding Agricultural
Commissioners’ offices. We used the information from these reports to group grape-
producing counties into three categories: high-priced grape counties include counties with
average grape prices above $1200 per ton in 2011; low-priced grape counties include
counties with average grape prices $700 per ton and below in 2011, and medium-priced
grape counties include counties not in the previous two groups. The prices used to form
these categories are weighted averages for all three categories of grapes: wine, raisin, and
table grapes based on reported acreage, production and price per ton for each category, as
provided in the annual county crop reports. Production and price per ton for dried raisin
grapes were calculated on a fresh equivalent basis.
[Table 5: Grape Value per Ton, by County, 2011]
We then used the PUR data to rank the counties according to the amount of
pesticides used per acre harvested as well as per ton of grapes produced. The results are
10
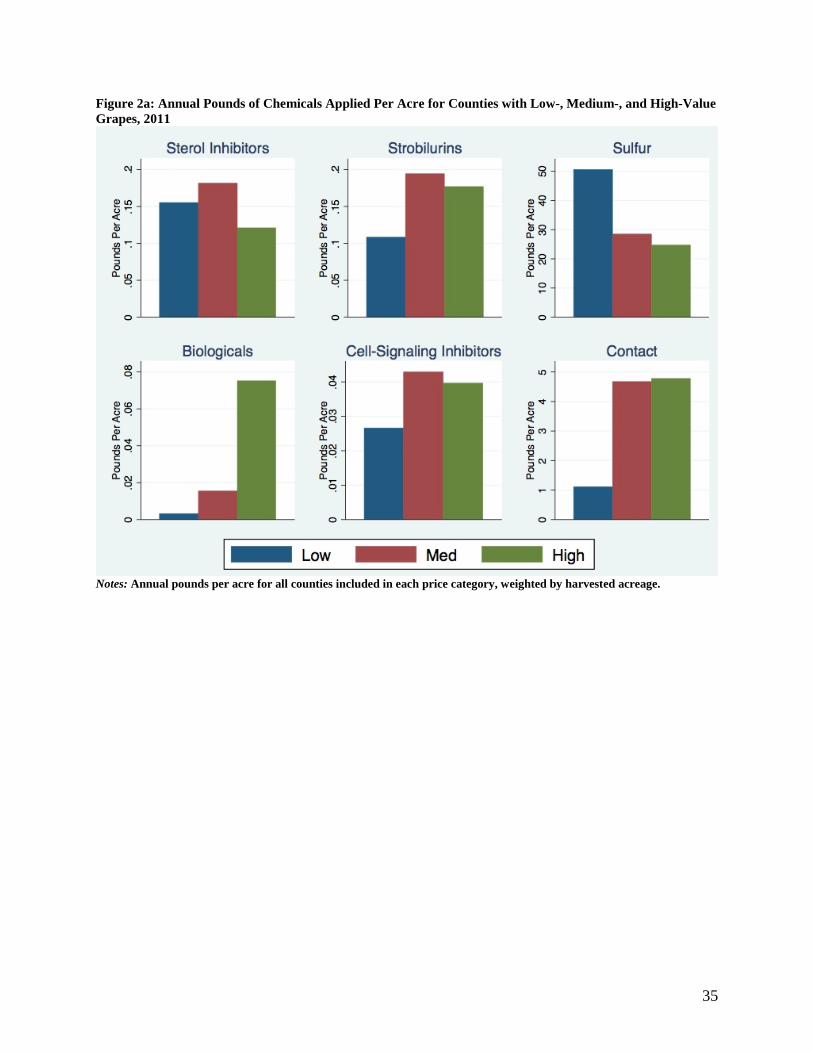
presented in Figures 2a and 2b. Figure 2b shoes the amount of pesticides applied per acre.
Counties with lower-value grapes are by far the heaviest per acre users of sulfur, while
counties with the highest-value grapes lead in the use of biologicals.4 Sulfur is losing
popularity in counties that predominantly grow wine grapes, especially high-value wine
grapes. Contact materials such as JMS Stylet Oil and Kaligreen, and biologicals can serve
as alternatives for sulfur in a PM spraying program, and we can see that the heaviest
users of these types of products are indeed counties with high- and medium-value grapes.
Synthetic fungicides such as sterol inhibitors and strobilurins are designed for rotation
with other chemical groups to avoid resistance buildup. Growers generally alternate with
sulfur or contact materials. Sulfur is by far the cheapest to purchase and apply (in terms
of material and application costs per acre), and synthetics, biologicals and contact
materials are significantly more expensive.
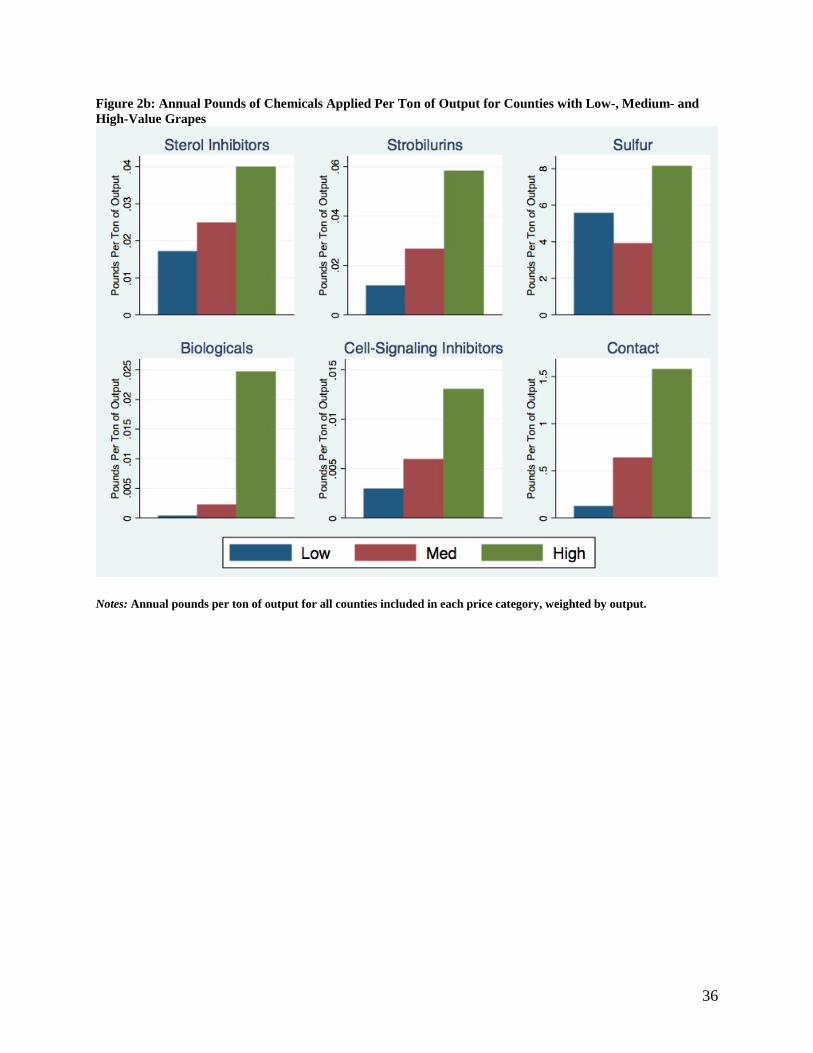
Figure 2b shows the amount of pesticides applied per ton of output. By this
measure, counties with high-value grapes use the most chemicals of any category because
the yields per acre are much lower compared to lower value grapes (3.5 to 4.5 tons per
acre in North Coast counties versus 12 or more tons/acre in Central Valley counties).
[Figures 2a-b: Annual Pounds of Pesticides Used per Acre and Per Ton of Output, by
Chemical Category, 2011]
The variation in pesticide choices means that the benefits from adopting varietals
resistant to PM will also vary geographically, as well as by type of grower. In particular,
counties producing high-priced grapes are in the coastal valleys—mainly Napa and 4 Biological fungicides are based on microorganisms such as fungi, bacteria or viruses. Biologicals used for PM control include Sonata and Serenade, both of which are based on bacteria (Bacillus pumilis and Bacillus subtilis respectively) and are approved for organic use.
11
Sonoma—and produce premium winegrapes. The 2011 average prices per ton for these
counties were $3,508 and $1,176 per ton, respectively. Counties producing medium-
priced grapes, among which county average prices ranged from $614 to $1,150 per ton in
2011, include some counties producing mid-priced winegrapes (primarily Monterey and
San Luis Obispo counties on the Central Coast) and some Central Valley counties
producing table grapes (in particular Kern and Tulare counties). Counties producing low-
priced grapes, among which county average prices ranged from $390 to $600 per ton in
2011, produce low-priced winegrapes, raisin grapes and table grapes, predominantly in
the southern San Joaquin Valley—in particular, Fresno, Madera, and San Joaquin
Counties.
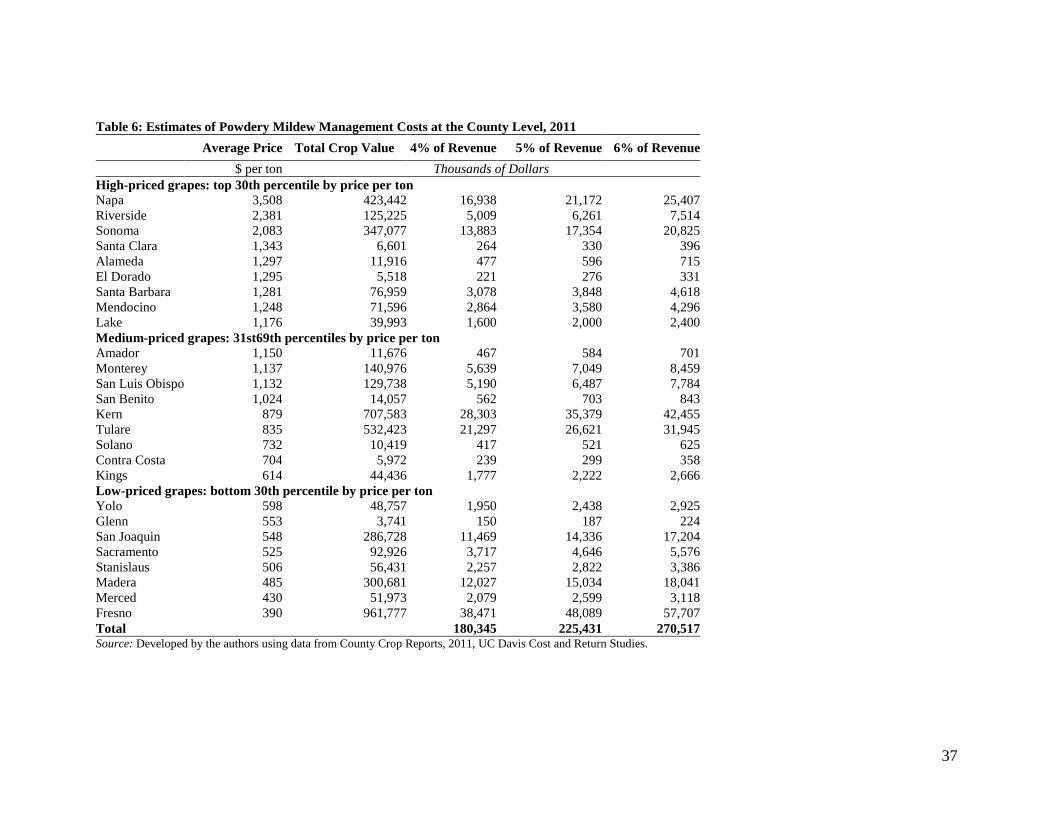
5. Pecuniary Costs of Powdery Mildew Management
In this section we focus on the pecuniary costs of PM management such as
the dollar value of pesticides applied and the costs of application. University of
California (UC) Davis Cost and Return studies indicate that PM management
costs—including materials, labor, and costs of running tractors or other equipment
involved in the application process—average about 4–6% of revenue for grape
growers. Applying these percentages to the crop values reported at the county
level, we derive rough estimates of costs at the level of the county. These
estimates are presented in Table 6.
[Table 6: Estimates of County Level Powdery Mildew Management Costs, 2011]
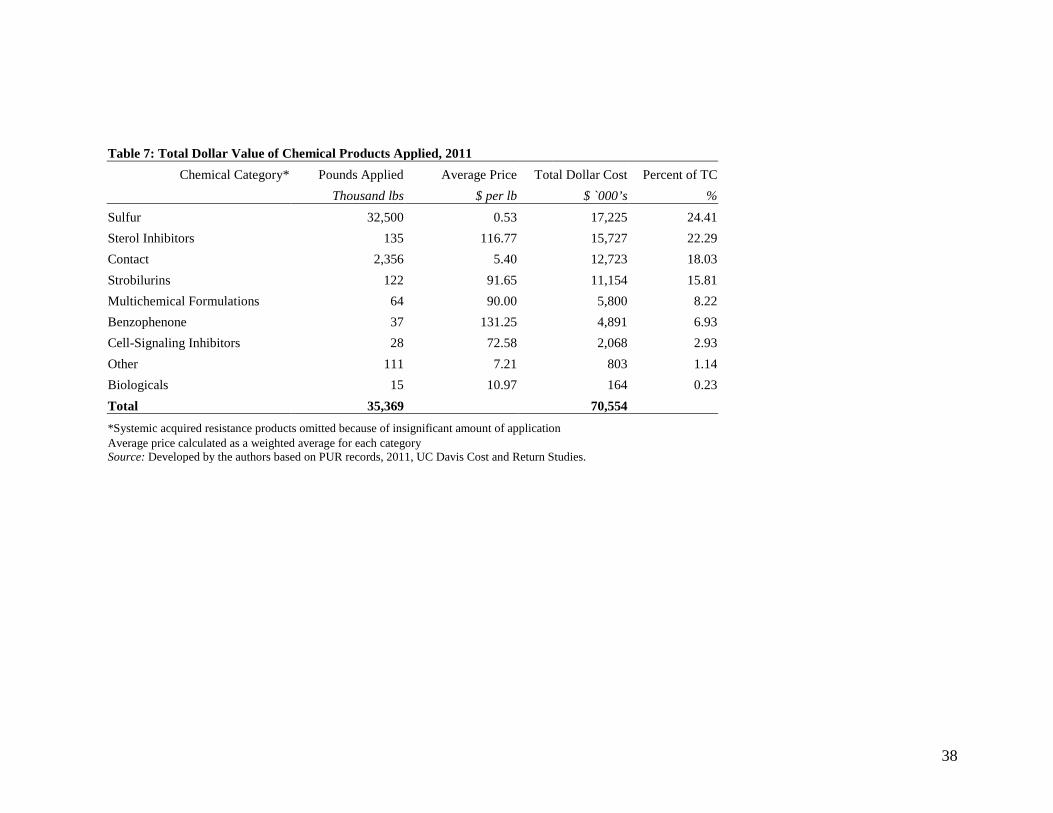
Several hundred products are registered with the State of California for
use on PM and we were not able to collect specific pricing information for all of
12
the products. Consequently, we can estimate only an approximate monetary value
of all products applied in a particular year. We grouped the products into
categories according to their content of active ingredients, and collected prices for
the most-used products in each category. We then calculated an average price per
pound of chemical for each category, and used this price to calculate the dollar
value of products applied. The results are presented in Table 7.
[Table 7: Total Dollar Value of Chemical Products Applied, 2011]
Total expenditure on PM pesticide products in California in 2011 was
approximately $70 million. Over fifty percent was spent on synthetic fungicides
such as sterol inhibitors and strobilurins. Sulfur accounts for about 25 percent of
total expenditure, but over 90 percent of the total pounds of pesticide products
applied. The estimated costs in Table 6 include both product and application
costs, which range from $180 to $271 million. Based on the total value of
pesticide materials alone, the product costs are around $70 million, which leaves
the application costs at between $110 to $201 million. We take a closer look at the
application costs per acre to arrive at a more precise estimate.
Application Costs
Powdery mildew pesticides can be applied either as dry dust (sulfur dust) or liquid
spray (wettable sulfur and all other fungicides). The applications are made with a tractor
and appropriate spraying equipment: a duster for dry applications or a large capacity
vineyard sprayer (100 gallons and more) for the other fungicides.
13
We use information from the UC Davis Cost and Return Studies for grape
operations in the North Coast, San Joaquin Valley and Sacramento Valley to estimate the
average per acre treatment times and the implied costs of labor and equipment. The
details of the estimation procedure are described in the Appendix.5
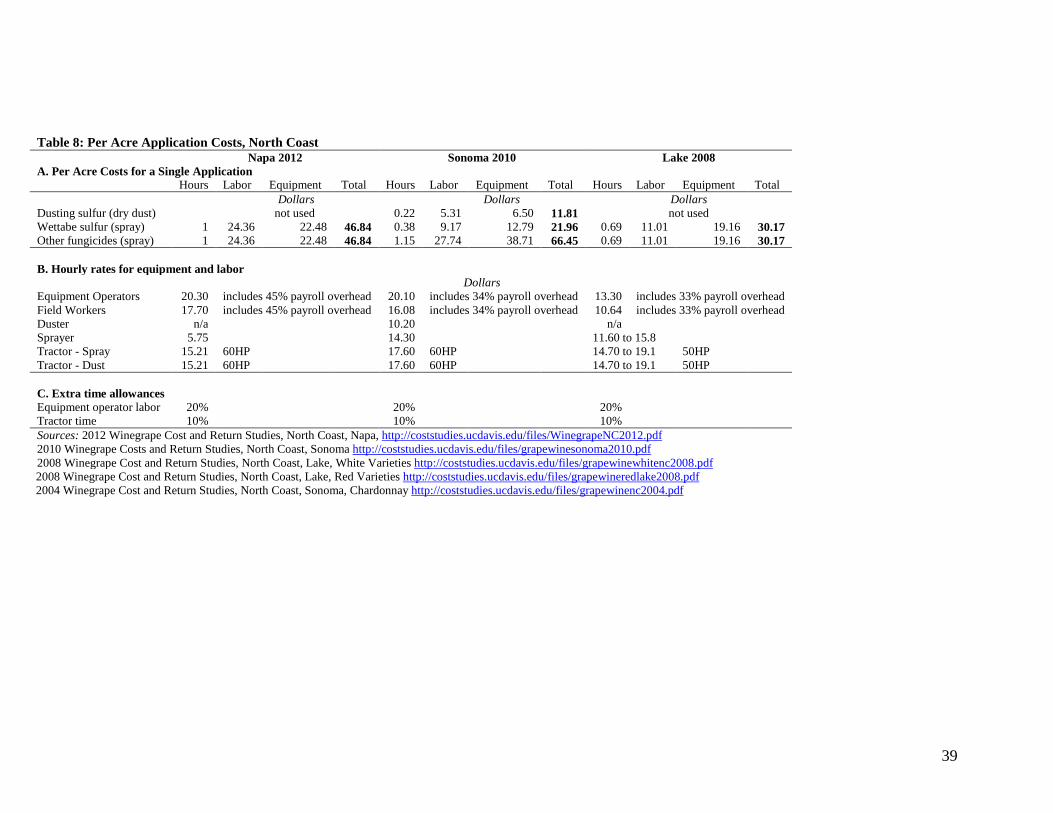
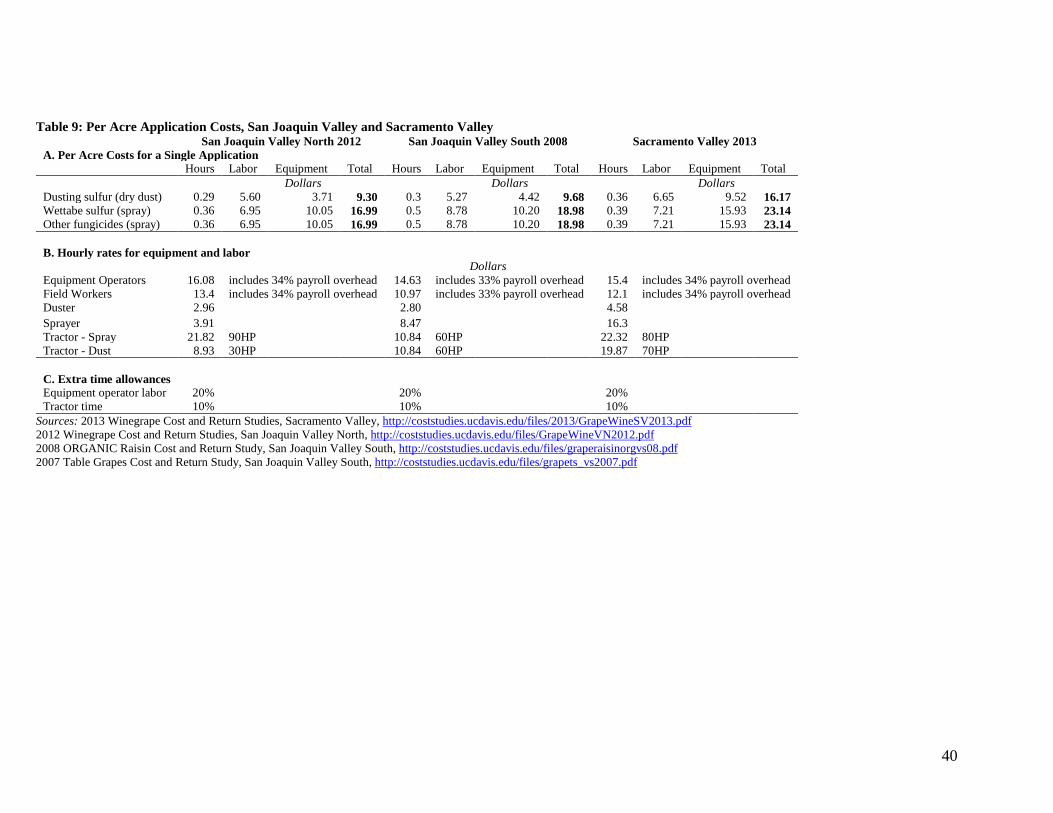
Tables 8 and 9 summarize the application costs per acre from the most recent Cost
and Return Studies for the North Coast, San Joaquin Valley and the Sacramento Valley.
Application costs range between $12 per acre and $67 per acre for North Coast counties
and between $9.30 per acre and $23 per acre for the San Joaquin and Sacramento
Valleys. Dusting sulfur is the cheapest to apply, with costs ranging from $9 per acre to
$16 per acre. Wettable sulfur has the same application costs as other sprayable
fungicides, ranging from about $10 per acre to $46 per acre. The differences in costs
result from higher prices for labor and equipment for North Coast counties and also
higher operation times.6 Additionally, Napa County wage rates include a payroll
overhead of 45%, which is significantly larger than overhead for other counties, which
have payroll overhead of 33 or 34%).
[Table 8: Per Acre Application Costs, North Coast]
[Table 9: Per Acre Application Costs, San Joaquin Valley and Sacramento Valley]
The type of tractor used to operate the sprayers/dusters affects both application
times and total cost. Tractors with less power are cheaper to operate per hour, but they
also take longer to cover a vineyard acre. Powerful tractors are more expensive to
purchase, but they shorten operation time considerably, especially on flat valley terrain.
5Assumptions about the types of labor and machinery used for fungicide applications, as well allowances for setup and removal of equipment and payroll overhead are based on the UCCE Cost and Return Studies. 6 Higher operation times may be because of terrain or applicators taking greater care with a more-highly valued crop.
14
As a result, liquid spray operation times vary between about 1.0 hours per acre for the
North Coast to around 0.5 hours per acre for the Central Valley.
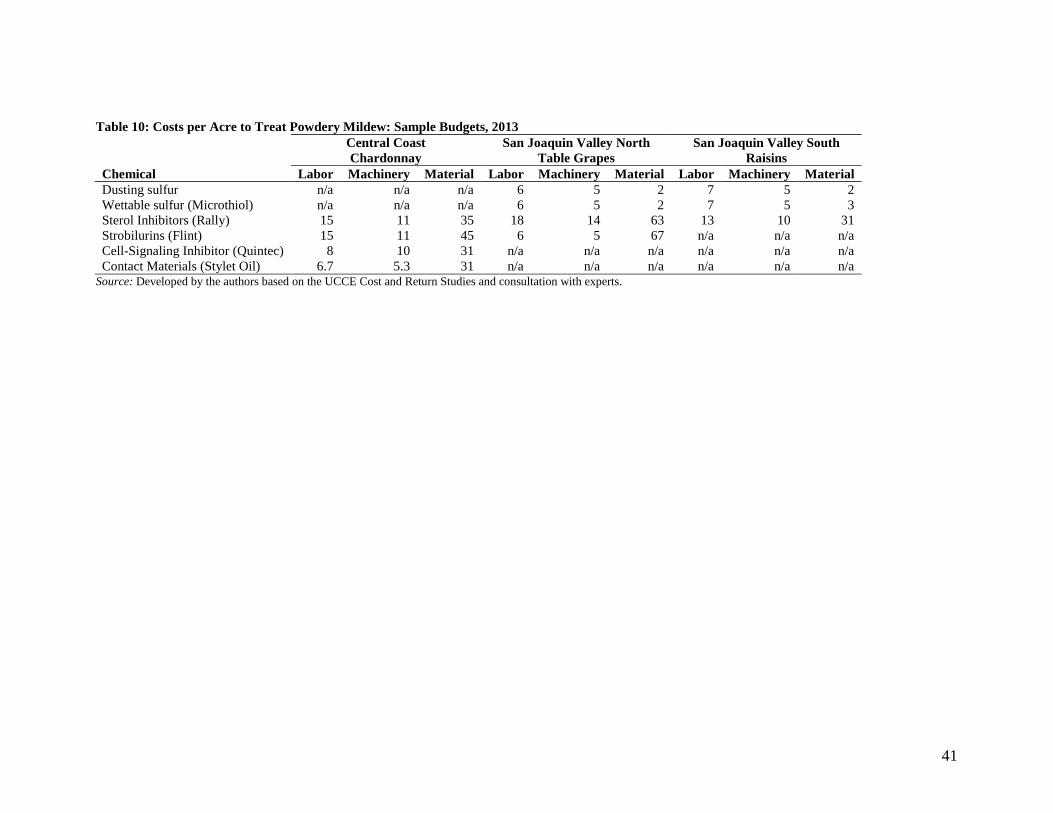
We interviewed UC Extension specialists and industry experts to develop similar
Cost and Return budgets for a selection of growers typical to the Central Coast and San
Joaquin Valley regions and updated the application costs to reflect current prices and
preferred programs for treating PM. Table 10 provides the best estimates of the current
labor and machinery costs per acre based on the sample budgets (for additional details,
see Fuller et al., 2014).
[Table 10: Costs per Acre to Treat Powdery Mildew: Sample Budgets, 2013]
Extending estimates to other counties
Application times and prices paid for labor and equipment vary significantly
among grape growing regions. Analysis of application costs for other counties not
included in the Cost and Return Studies requires a set of assumptions about appropriate
work rates (hours per acre) for each type of application. We base our estimates of the
appropriate work rates and equipment rates for each major grape growing region on the
most recent Cost and Return Studies as well as the set of budgets we developed for
regionally specific wine, raisin, and table grape growers (Fuller et al., 2014).
San Joaquin and Sacramento Valleys
We assume that a 60HP tractor is used for both dust and liquid spray applications.
Drawing on estimates from the available cost studies, the assumed work rate is 0.3 hours
per acre for dry dust and 0.5 hours per acre for liquid spray. Tractor use time includes an
15
additional 10 percent allowance and equipment operator time includes an additional 20
percent. We assume that these rates are applicable to all grape growing counties in the
San Joaquin and Sacramento Valleys.
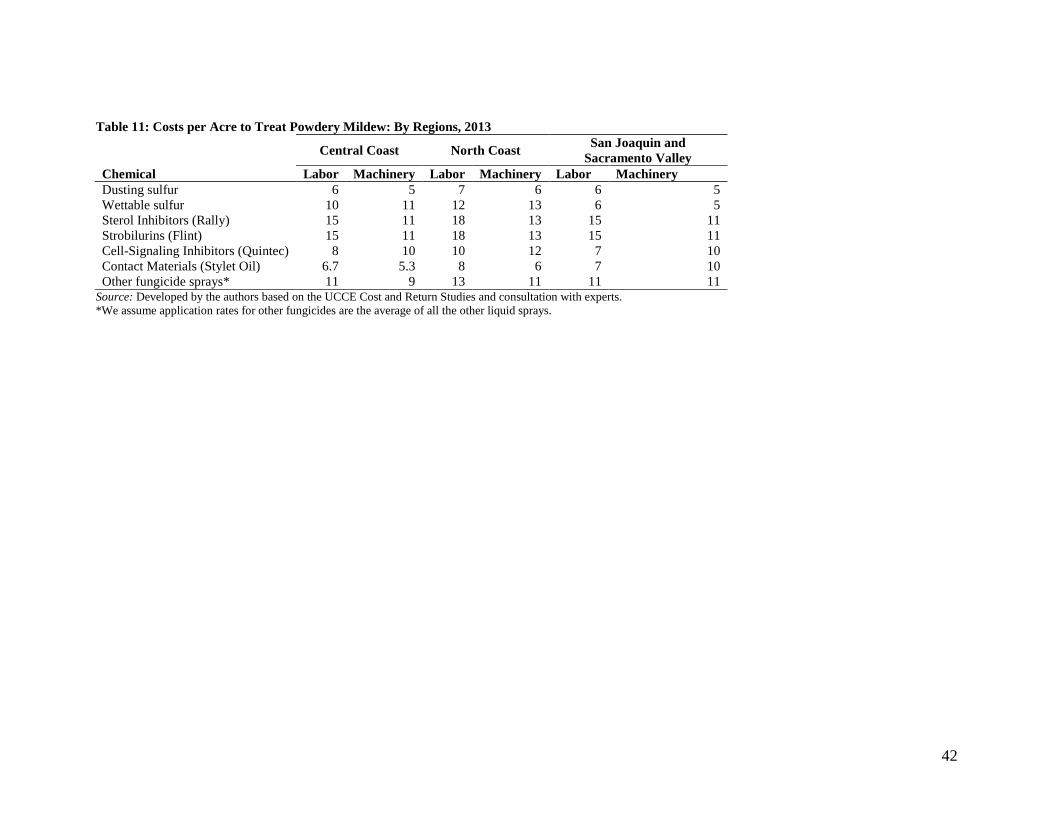
North Coast and Central Coast
We assume that a 60HP tractor is used for both dust and liquid spray applications and the
work rate is between 0.7 and 1.0 hours per acre for liquid sprays and 0.5 hours per acre
for dry dust, plus the allowances for tractor use time and operator time as above. We
combine information from Tables 8, 9 and 10, and estimate the current average labor and
equipment costs for Coastal and Valley growing regions. Results are in Table 11.
[Table 11: Costs per Acre to Treat Powdery Mildew: by Region, 2013]
Mixed Sprays
Liquid sprays are often made with more than one pesticide. Two types of mixed
sprays are used: mixed sprays with more than one fungicide (PM control) and mixed
sprays that include insecticides or other types of pesticides in addition to the fungicides
used for PM control. Mixed sprays of the first type are entirely for PM management, but
mixed sprays of the second type are not. In the case of mixed insecticide and fungicide
sprays, the question is whether an application would have been made absent a PM threat
were absent. It is reasonable to assume that the sprays would have still been made for
insect control, so we do not attribute the spraying costs to PM control. In 2011, 13% of
all chemical applications related to PM included mixed sprays. Of that 13%, only 2%
included insecticides or other chemicals not related to PM. The other 11% of mixed
sprays consisted of two or more fungicides used for PM treatment.
16
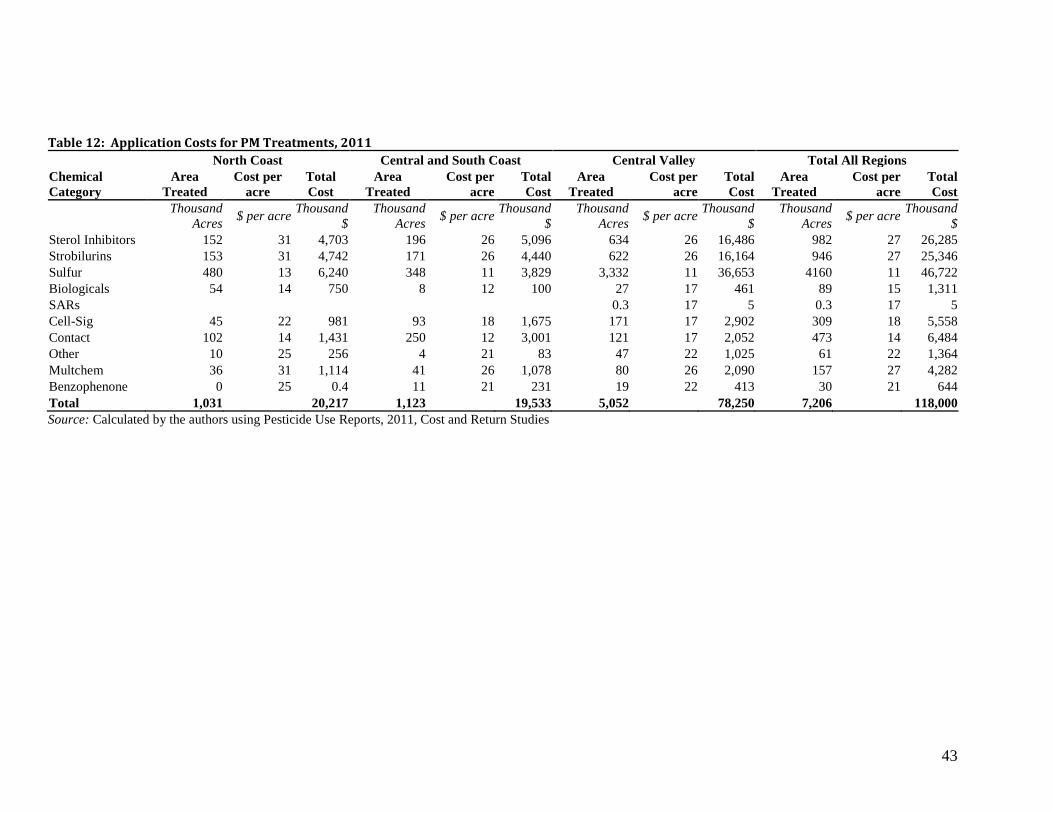
Using assumed average application rates for Coastal and Valley regions, the total
application costs for chemicals used for PM treatment are summarized in Table 12. The
total estimated statewide application cost is about $118 million. The total pecuniary costs
of PM management combined from Tables 7 and 12 are $189 million in 2011, which is
approximately 4% of revenue as calculated in Table 6.
[Table 12: Statewide Application Costs for Powdery Mildew Treatment, 2011]
6. Non-pecuniary Costs of Powdery Mildew Management
The toxicity of each product is evaluated both with respect to both humans and
the environment. Common health hazards include skin or eye irritation and inhalation
potential. Environmental hazards include ground water contamination: toxicity to fish
and aquatic organisms, domestic animals and livestock, and drinking water
contamination. According to the United States Environmental Protection Agency (EPA)
Pesticide Product Label System (PPLS), most products used for PM management are
considered to be of low toxicity, with the exception of some synthetic products in the
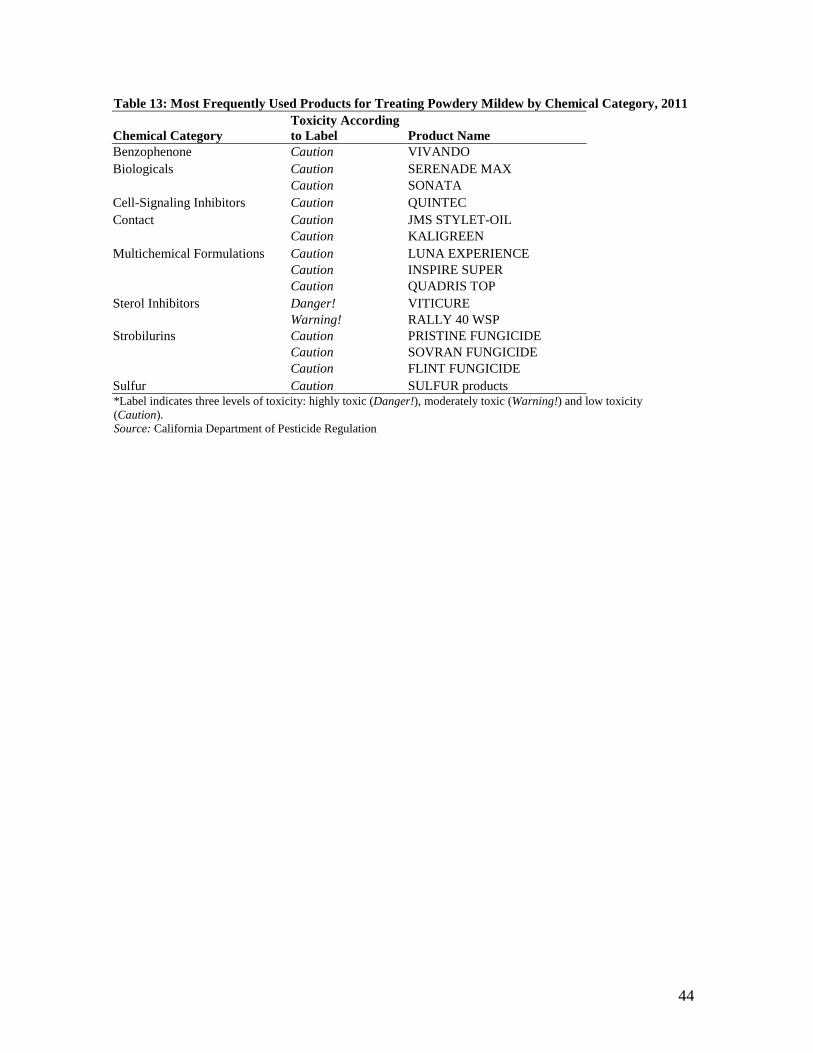
sterol inhibitor chemical category. The toxicity ratings of the most popular PM products,
according to their labels, are summarized in Table 13.7
[Table 13: Most Frequently Used Products for Treating Powdery Mildew, 2011]
b) Description of EIQ and PURE
The impact of pesticide use on human health and the environment use is a topic of
much interest, and multiple measures of pesticide use risk have been developed in recent
7 The PPLS provides a collection of pesticide product labels with three potential hazard levels: caution, warning, danger. The hazard levels are based on the exposure to undiluted chemicals, so they are especially relevant for handling during mixing and preparation for application. Labels are available on the EPA website: http://iaspub.epa.gov/apex/pesticides/f?p=PPLS:1.
17
years. Pesticide risk indicators typically use a ranking or an index based on toxicological
and physiochemical properties of the pesticides, as well as site-specific environmental
conditions (Bockstaller, et al., 2009). Many pesticide risk indicators are developed with a
specific purpose or user in mind and it is not always possible to apply them outside the
intended scope (Labite, et al., 2011). To quantify the environmental effect of PM control
on human health and the environment, we use two pesticide risk measures: the
Environmental Impact Quotient (EIQ) and the Pesticide Use Risk Evaluation (PURE)
systems. We use the EIQ to calculate the environmental impact of PM control programs
from our sample farmer budgets and compare the environmental impact profiles of PM
management in several regions. The PURE system is specific to California and it
calculates environmental risk scores for actual pesticide applications from the PUR
database. We use this measure to evaluate the environmental impact of PM control for
actual pesticide applications by grape growers in California in 2011.
c) EIQ
The EIQ is an aggregate measure of environmental impact, which combines the
pesticide hazard posed to farm workers (applicator and harvester exposure), consumers
(consumer exposure and ground water contamination), and the environment (toxicity to
aquatic and terrestrial organisms and bees) (Kovach, et al., 2012).
Data on toxicity of individual chemicals is collected from sources such as the
Extension Toxicology Network (Cornell University Pesticide Managment Education
Program/ExToxNet), CHEM-NEWS (Cornell Cooperative Extension Network),
SELCTV database (Oregon State), and other studies by the USDA Economic Research
18
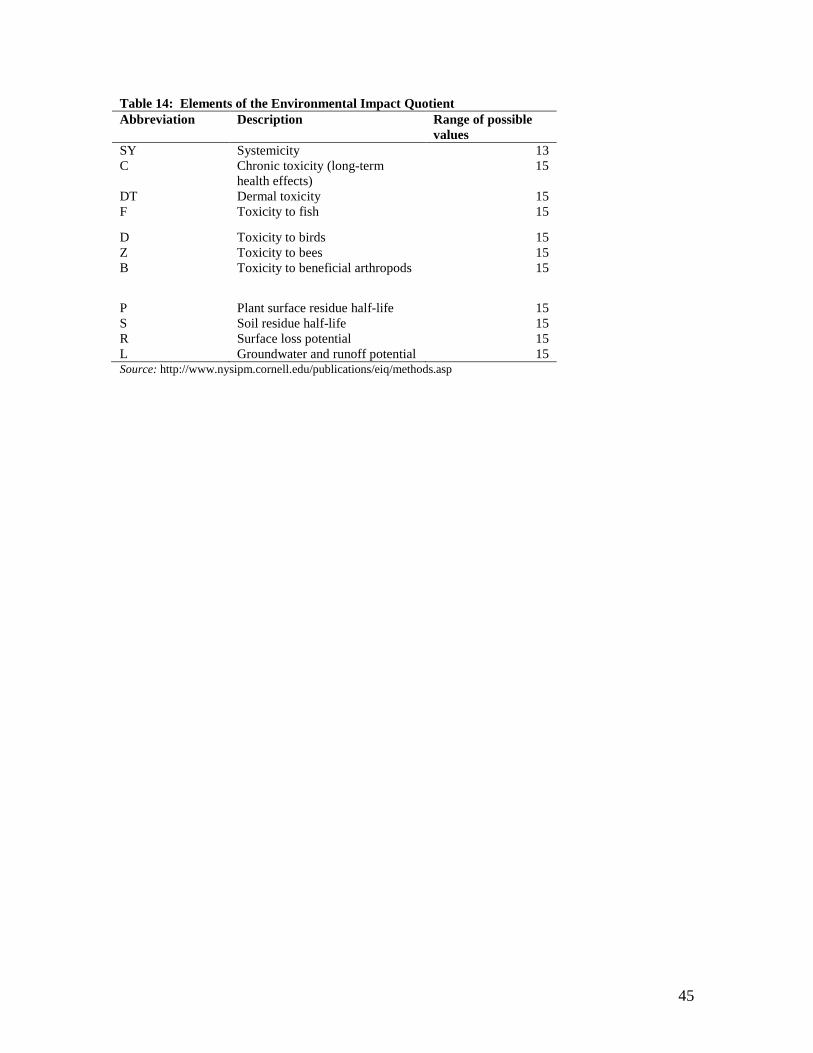
Service and the Environmental Protection Agency, as well as material safety data sheets
from chemical manufacturers. Table 14 describes the elements used to construct the EIQ.
[Table 14: Elements of the Environmental Impact Quotient]
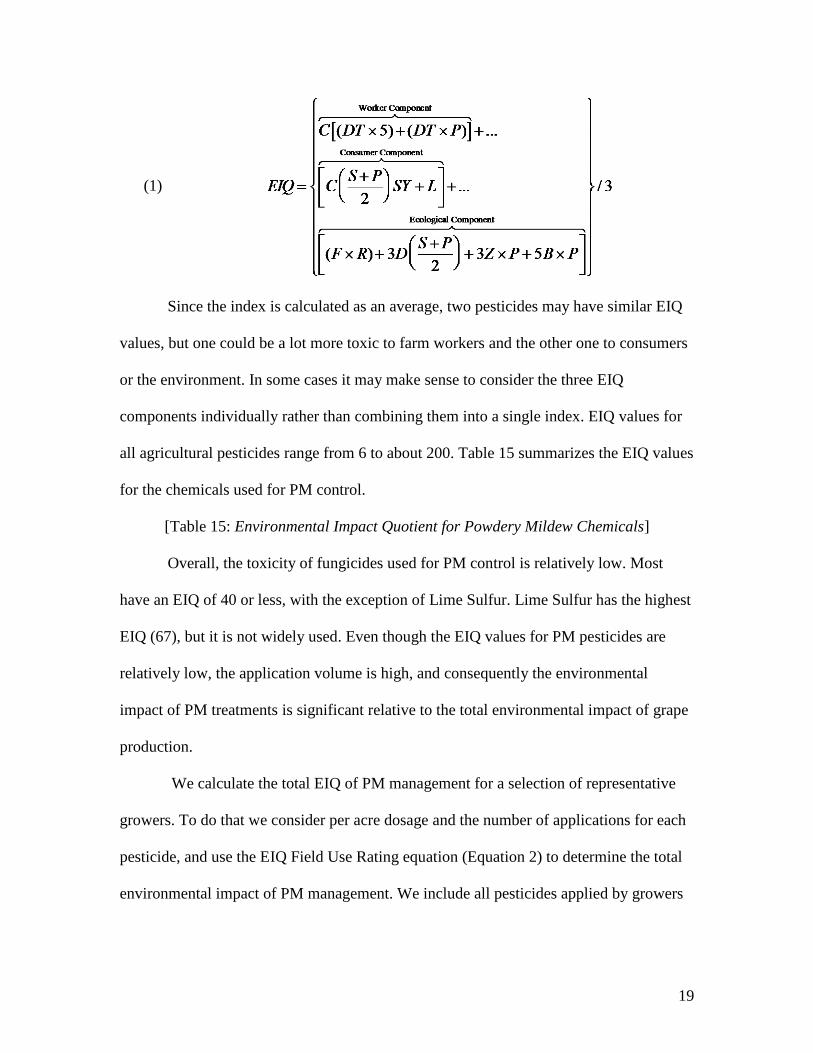
The Environmental Impact Quotient is a simple average of three EIQ
components: farm worker EIQ, consumer EIQ and ecological EIQ. Each component
combines the relevant factors of chemical toxicity described in Table 14. The basic
principle behind EIQ is that the impact of the chemical is equal to a measure of toxicity
times the potential time of exposure. Factors within each component carry different
weights: factors with the highest impact are multiplied by five, factors with medium
impact are multiplied by three and factors with low impact are multiplied by one.
Therefore, while the total EIQ is a simple average of three components, the elements
within each component are weighted based on toxicity and exposure potential.
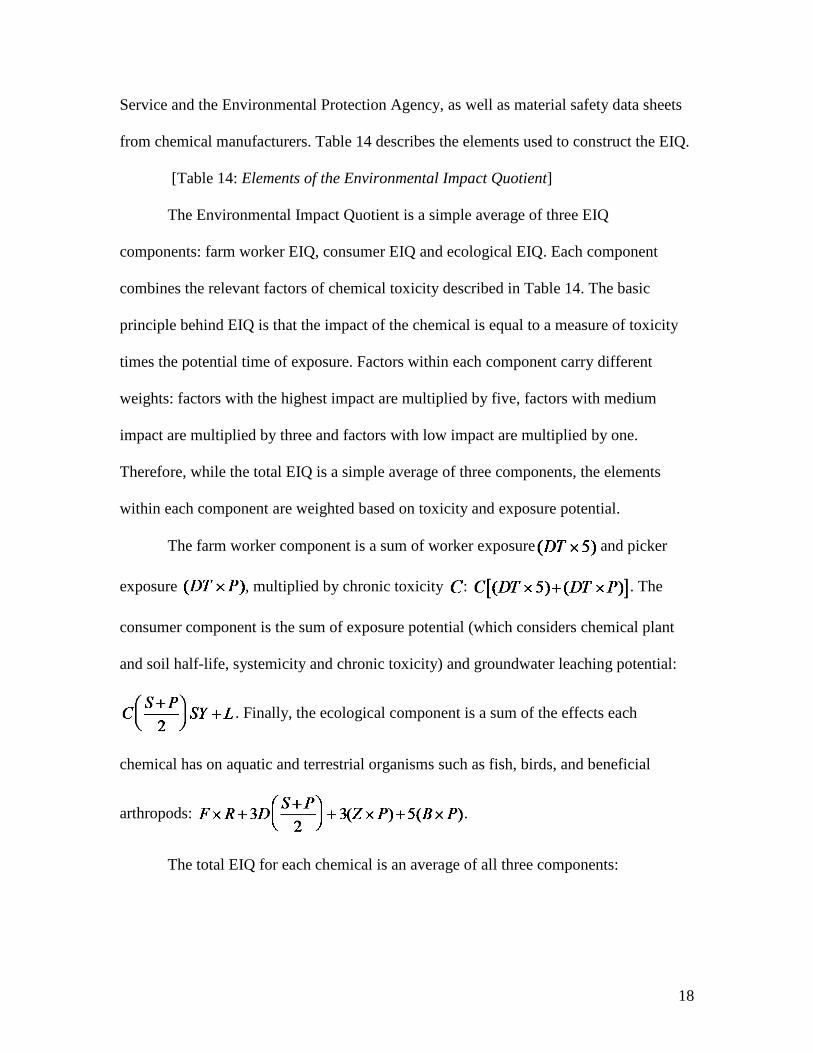
The farm worker component is a sum of worker exposure and picker
exposure , multiplied by chronic toxicity : . The
consumer component is the sum of exposure potential (which considers chemical plant
and soil half-life, systemicity and chronic toxicity) and groundwater leaching potential:
. Finally, the ecological component is a sum of the effects each
chemical has on aquatic and terrestrial organisms such as fish, birds, and beneficial
arthropods: .
The total EIQ for each chemical is an average of all three components:
19
(1)
Since the index is calculated as an average, two pesticides may have similar EIQ
values, but one could be a lot more toxic to farm workers and the other one to consumers
or the environment. In some cases it may make sense to consider the three EIQ
components individually rather than combining them into a single index. EIQ values for
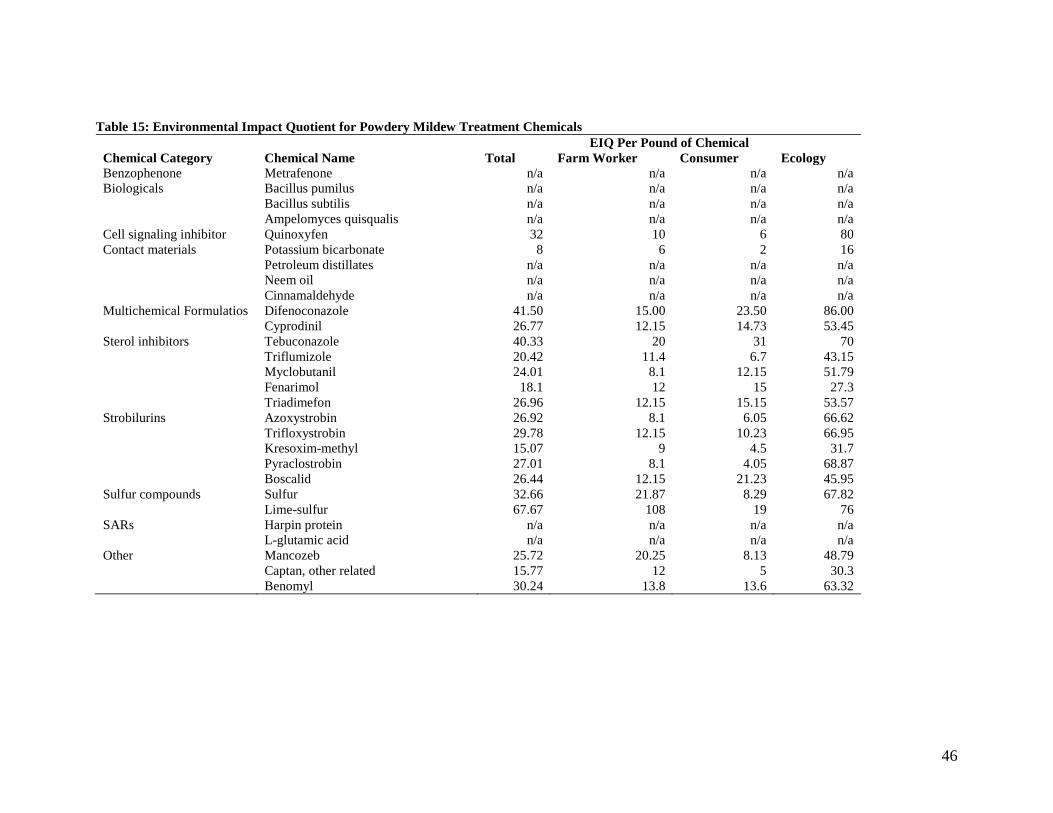
all agricultural pesticides range from 6 to about 200. Table 15 summarizes the EIQ values
for the chemicals used for PM control.
[Table 15: Environmental Impact Quotient for Powdery Mildew Chemicals]
Overall, the toxicity of fungicides used for PM control is relatively low. Most
have an EIQ of 40 or less, with the exception of Lime Sulfur. Lime Sulfur has the highest
EIQ (67), but it is not widely used. Even though the EIQ values for PM pesticides are
relatively low, the application volume is high, and consequently the environmental
impact of PM treatments is significant relative to the total environmental impact of grape
production.
We calculate the total EIQ of PM management for a selection of representative
growers. To do that we consider per acre dosage and the number of applications for each
pesticide, and use the EIQ Field Use Rating equation (Equation 2) to determine the total
environmental impact of PM management. We include all pesticides applied by growers
20
during a standard growing season, not just the PM pesticides. Doing so allows us to
compare the EIQs for traditional grape varieties with PM-resistant varieties.
(2) EIQ Field Use Rating=EIQ × % active ingredient × Rate of application (lbs per
acre)
We use sample budgets for representative raisin, table and wine grape growers in
the San Joaquin Valley and the Central Coast, which describe the standard pesticide
application programs, including PM treatment programs, for each type of grower. We
collected information about active ingredient content and recommended per-acre dosage
rates for each product from the California Department of Pesticide Regulations and the
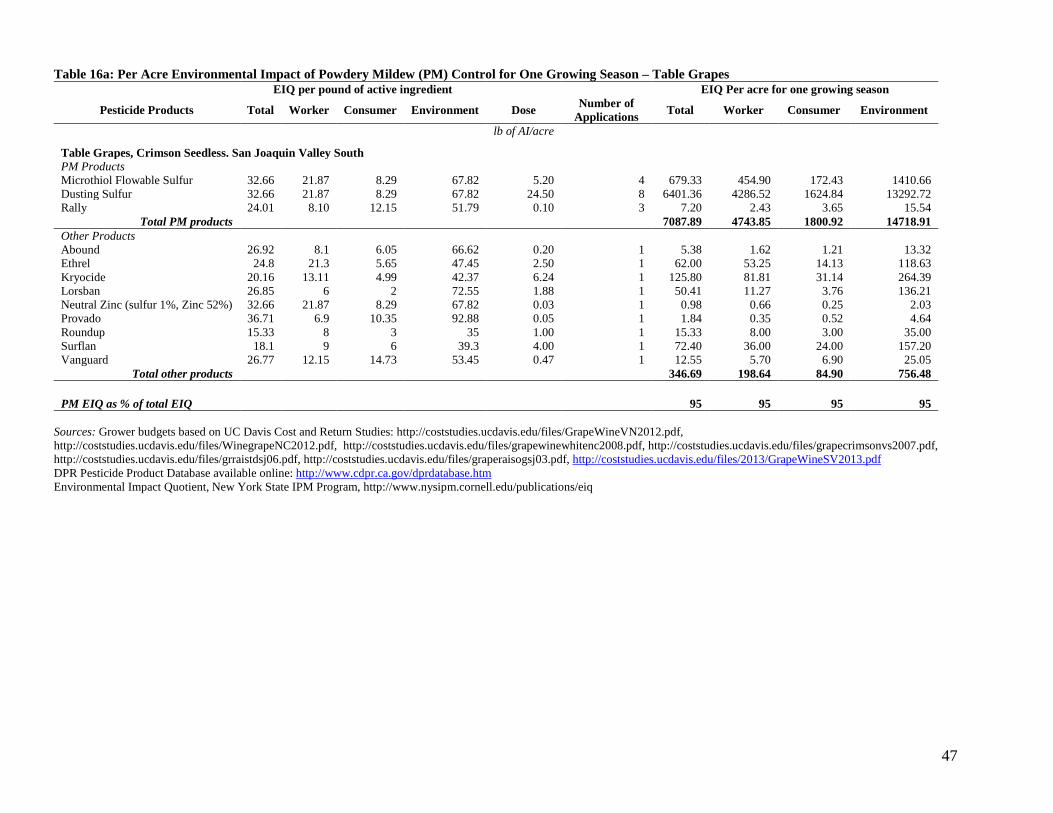
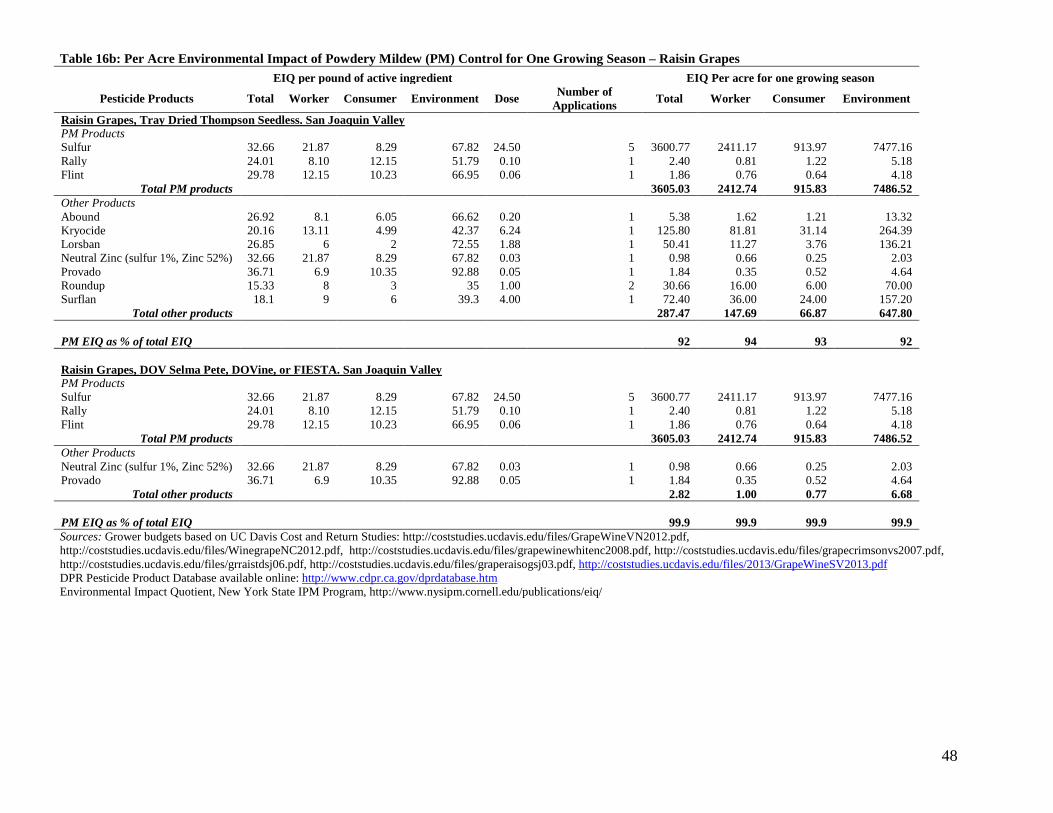
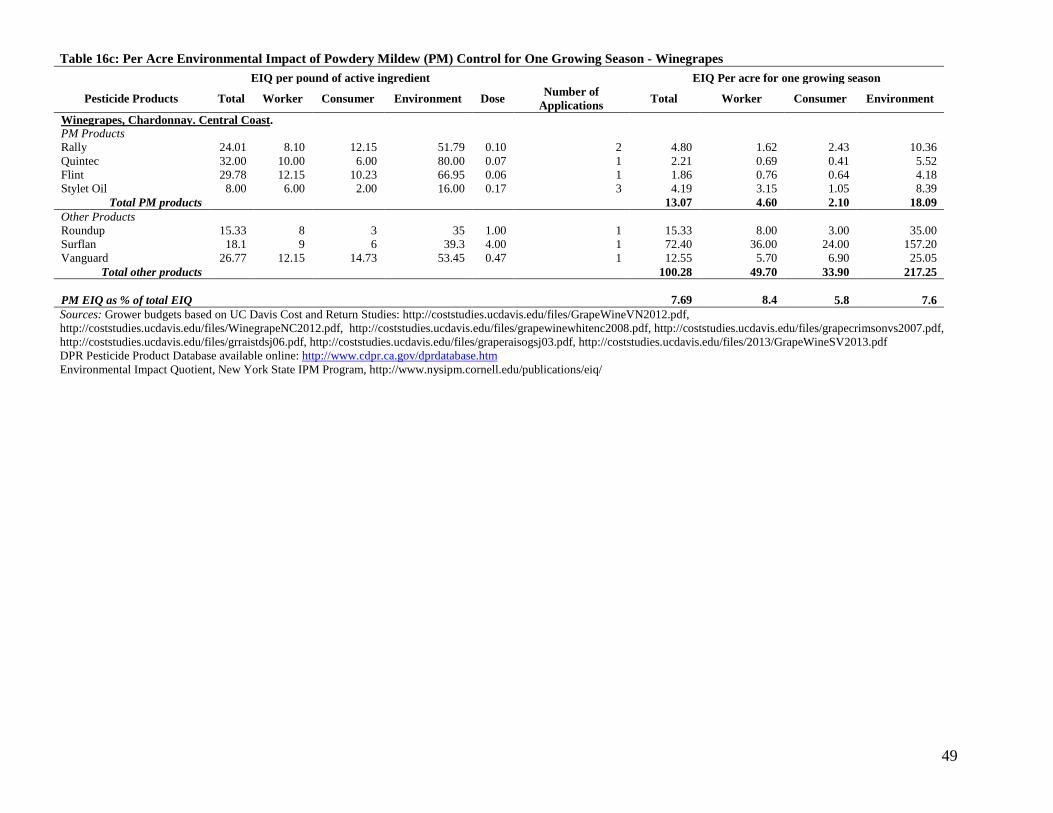
UC IPM website, and calculated the EIQ for each representative grower. Table 16
provides a summary of the results.
[Table 16: Per Acre Environmental Impact of Powdery Mildew Control]
Powdery mildew management by table grape growers has by far the largest per-
acre environmental impact compared with other types of grape growers. Table grape
growers have the longest disease pressure season, and are concerned about the
appearance of the entire cluster, so they have to manage PM on stems as well as berries.
As a result, table grape growers apply more PM treatments than raisin or wine grape
growers. In addition, table grape growers use more sulfur, which raises the EIQ quite a
bit because of large volumes applied per acre. The total EIQ of wine grape growers is
almost negligible because the synthetic pesticides they use are applied infrequently and at
very low application rates per acre. In addition to fungicides required for PM control,
Table 16 also includes EIQ calculations for other chemicals applied by grape growers
throughout the growing season, such as insecticides, herbicides and fungicides for non-
21
PM issues. Even though the per-pound EIQ score for sulfur is relatively low, EIQ is
calculated per pound of chemical, and sulfur constitutes the majority of chemical weight
applied by raisin and table grape growers. PM control accounts for over ninety percent of
the total EIQ per acre for table and raisin growers (almost one hundred percent for DOV
raisin grapes), and only eight or so percent per acre for Central Coast Chardonnay
growers, who do not use any sulfur in our scenario.8
Sulfur is by far the biggest contributor to the EIQ for grape growers because of
the dosage per acre (10 pounds or more) and the frequency of application. However a
review of literature on the environmental and health impacts of sulfur suggests that sulfur
is widely considered to be environmentally neutral (Cornell University Pesticide
Management Education Program/ExToxNet, 1995) and the main concern with sulfur
applications in agriculture are human health effects. Specifically, sulfur has been linked
to respiratory illness (McGourty, 2008), although the exact mechanism and type of
exposure that causes illness is unknown (Lee, et al., 2006). Because of these findings we
treat the extremely high EIQ from sulfur use with caution. We feel that it is appropriate to
discount the ecological component of the sulfur EIQ and to consider the human health
component in more depth. For example, the exposure potential to the workers is highest
during sulfur applications because of the large per acre volume and frequent applications.
In this case it make sense to think of the risk as an additive risk because there is potential
for exposure during each application. In contrast, some of the other synthetic chemicals
are applied at longer intervals (up to 21 days) and in very diluted form (application rate
8 Over ninety percent may seem unreasonably high, but it is important to note that powdery mildew fungicide applications dominate any other pesticide applications by grape growers. In fact, for many grape growers, PM fungicides are the only restricted materials they report in the PURs and in their case PM accounts for 100% of their environmental imprint from pesticide applications.
22
for synthetics is less than one pound per acre, versus 10 or more pounds per acre for
sulfur). The high total worker EIQ for sulfur demonstrates the total risk over the course of
the growing season. Even though appropriate equipment and safety precautions can
reduce or eliminate worker exposure, the implementation and management of such
equipment and precautions is a cost to the grower. The costs of enforcing the safety rules
(e.g., worker training, supervision and any necessary equipment) can be classified as a
pecuniary cost (although it is not counted in our budgets), while the general
inconvenience of having to implement these rules and the existing potential for unknown
negative health effects is a non-pecuniary cost.
Overall, the EIQ values suggest that the environmental benefits from PM-resistant
varieties are disproportionately distributed among the three different types of growers.
Varietals resistant to PM would almost eliminate the current environmental impact for
table and raisin grape growers, but would have very little effect on wine grape growers.
Additionally, we can conclude that the environmental benefits from eliminating PM
control would mostly accrue to growers, farm workers and the natural environment.
According to the EIQ, the effect on the consumers is relatively minor.
d) PURE
An alternative method for evaluating the environmental impact of PM control is
Pesticide Use Risk Scores. The Pesticide Use Risk Evaluation system (PURE) system
information on pesticide properties (toxicity) with environmental conditions to evaluate
the risk from pesticide use on a specific field with respect to five dimensions of the
environment: groundwater, surface water, soil, air and bees (Zhan and Zhang, 2012). The
model was developed as a decision support system for growers to help with evaluating
23
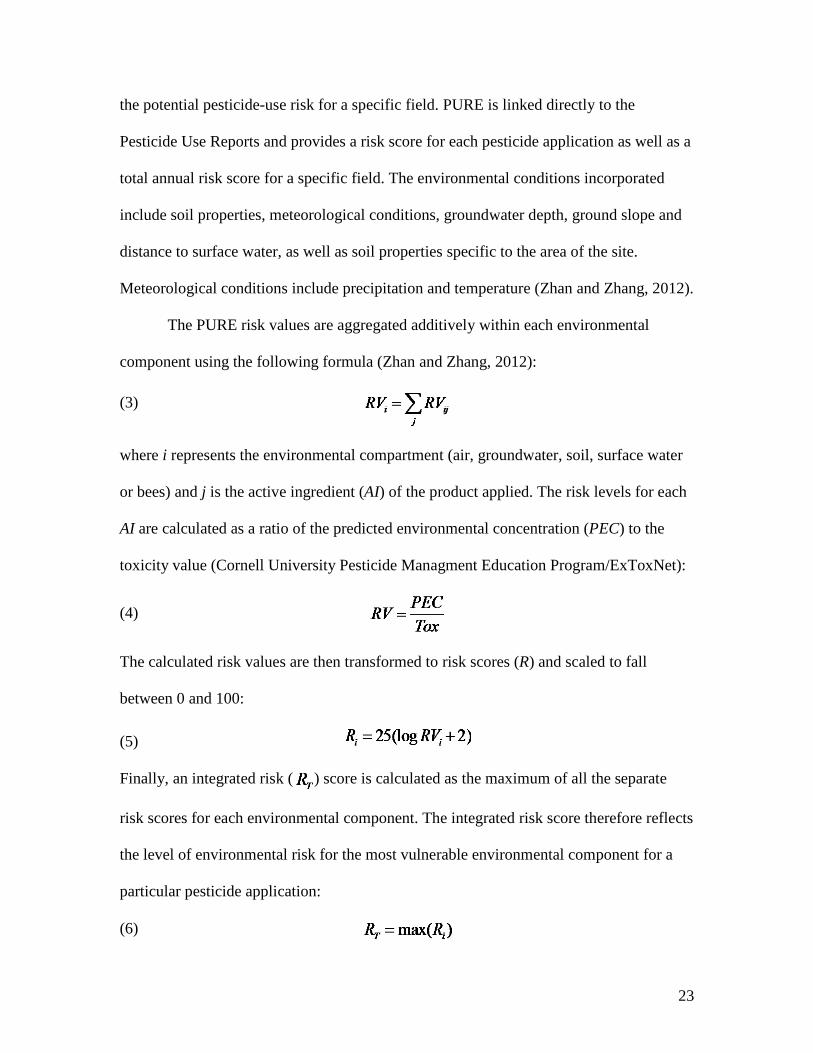
the potential pesticide-use risk for a specific field. PURE is linked directly to the
Pesticide Use Reports and provides a risk score for each pesticide application as well as a
total annual risk score for a specific field. The environmental conditions incorporated
include soil properties, meteorological conditions, groundwater depth, ground slope and
distance to surface water, as well as soil properties specific to the area of the site.
Meteorological conditions include precipitation and temperature (Zhan and Zhang, 2012).
The PURE risk values are aggregated additively within each environmental
component using the following formula (Zhan and Zhang, 2012):
(3)
where i represents the environmental compartment (air, groundwater, soil, surface water
or bees) and j is the active ingredient (AI) of the product applied. The risk levels for each
AI are calculated as a ratio of the predicted environmental concentration (PEC) to the
toxicity value (Cornell University Pesticide Managment Education Program/ExToxNet):
(4)
The calculated risk values are then transformed to risk scores (R) and scaled to fall
between 0 and 100:
(5)
Finally, an integrated risk ( ) score is calculated as the maximum of all the separate
risk scores for each environmental component. The integrated risk score therefore reflects
the level of environmental risk for the most vulnerable environmental component for a
particular pesticide application:
(6)
24
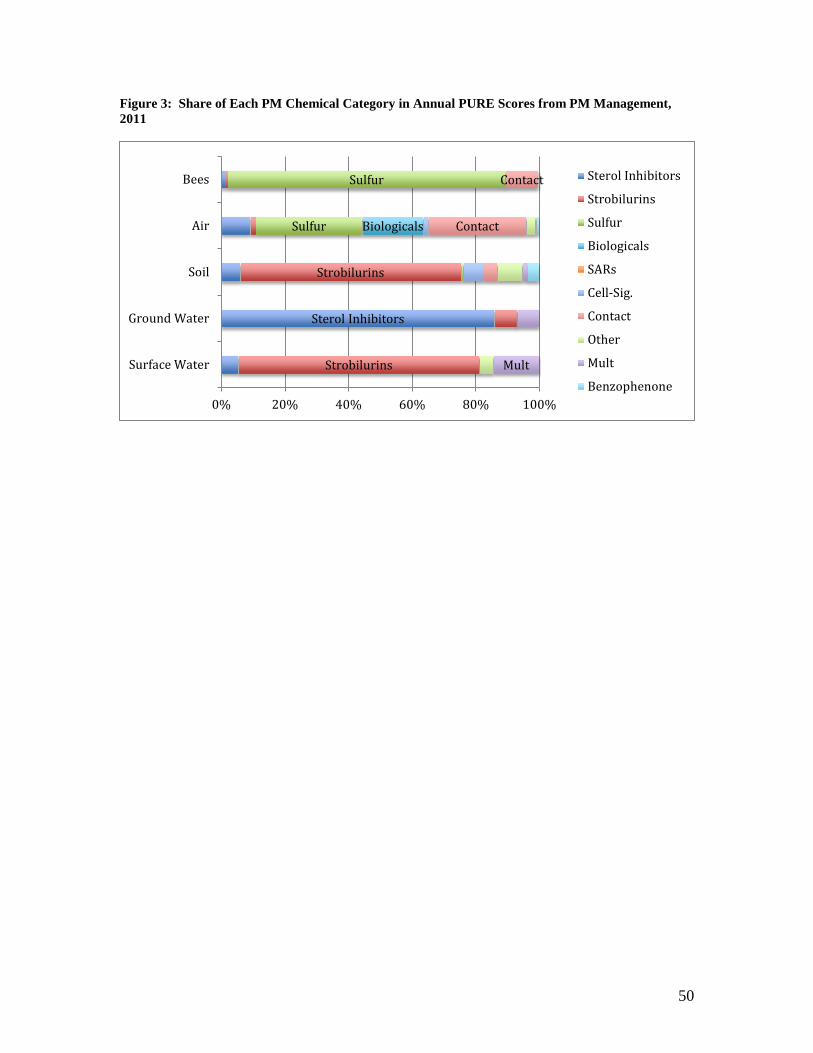
We obtained a dataset of PURE values for all pesticide applications made on
grapes during 1996-2011. We use the unscaled risk values to evaluate the contribution of
each PM pesticide category to the share of environmental effects from PM management.
Figure 3a details the results.
[Figure 3: Share of Each Chemical Category in Annual PURE Scores from PM
Management, 2011]
Strobilurins, sterol inhibitors and sulfur account for most of the environmental
risk from PM management. Strobilurins and sterol inhibitors (both synthetic pesticides)
are responsible for the largest share of soil, ground water and surface water risk. Sulfur
applications have the largest effect on bees and air. The PURE scores are specific to
California and so may not be representative of the environmental effects from PM
management in other states. However, California accounts for the vast majority of U.S.
grape production.
We can use the EIQ or PURE scores to evaluate the environmental impact of PM
pesticides relative to other chemicals, and for some general comparison of per-acre
applications among growers in different regions and growing grapes for different market
segments or end-uses. While the fungicides used for PM treatments are relatively non-
toxic compared to some of the other classes of pesticides, large volumes and frequency of
application do matter, especially when it comes to safety measures to prevent worker
exposure. Although the exact effect on human health is unknown, the implementation of
safety measures and the potential for human health effects factor into both pecuniary and
non-pecuniary costs for the grower.
25
Conclusion
Powdery mildew in grapes is responsible for the bulk of pecuniary disease management
costs for the entire industry. In addition, the volume of pesticides applied creates an
environmental burden that contributes to non-pecuniary costs from PM. We estimate
pecuniary PM management costs in California of $189 million in 2011. We do not place
a monetary value on environmental costs, but we conclude that, depending on the
location, and the type of grapes being grown, PM management can account for over 90
percent of the environmental burden from pesticide applications on grapes. We also show
that just a few of the chemicals used on grapes account for the majority of the
environmental impact from PM management, and reducing the use of these chemicals
would have a beneficial effect on all environmental categories, especially soil, air and
bees.
26
References Bentley, W.J., L.G. Varela, F.G. Zalom, R.J. Smith, A.H. Purcell, P.A. Phillips, D.R.
Haviland, K.M. Daane, and M.C. Battany. 2008. "Insects and Mites." In B. L. Ohlendorf and M.L. Flint, eds., UC IPM Pest Management Guidelines: Grapes. Oakland. University of California Agriculture and Natural Resources Publication 3448.
Bettiga, L.J., D.W. Gubler, and G.M. Leavitt. 2013. "Powdery Mildew." in L.J. Bettiga,
ed., Grape Pest Management, 3rd ed., Oakland. University of California Division of Agricultural and Natural Resources Publication 3343, pp. 137-149
Bockstaller, C., L. Guichard, O. Keichinger, P. Girardin, M.-B. Galan, and G. Gaillard.
2009. "Comparison of methods to assess the sustainability of agricultural systems. A review." Agronomy for Sustainable Development 29(1): 223-235.
Cornell University Pesticide Management Education Program/ExToxNet. 1995. Pesticide
Information Profile: Sulfur. Available: http://pmep.cce.cornell.edu/profiles/extoxnet/pyrethrins-ziram/sulfur-ext.html. Accessed: 1 September 2014.
Davis, R.M., W.D. Gubler, and S.T. Koike. 2008. "Powdery Mildew on Vegetables."
University of California Integrated Pest Management. Available: http://www.ipm.ucdavis.edu/PMG/PESTNOTES/pn7406.html. Accessed 1 September 2014.
Fuller, K.B., Alston, J. M., and O.S. Sambucci. 2014. "The Value of Powdery Mildew
Resistance in Grapes: Evidence from California", Robert Mondavi Institute for Wine Economics Working Paper No. 162528.
Kovach, J., C. Petzoldt, J. Degni, and J. Tette. 1992 "A Method to Measure the
Environmental Impact of Pesticides." New York Food and Life Sciences Bulletin Number 139. Available: http://www.nysipm.cornell.edu/publications/eiq/. Accessed 5 September 2014.
Labite, H., F. Butler, and E. Cummins. 2011. "A Review and Evaluation of Plant
Protection Product Ranking Tools Used in Agriculture." Human and Ecological Risk Assessment: An International Journal 17(2):300-327.
Lee, K., J.L. Smith, and J.A. Last. 2006. "Absence of Respiratory Inflammatory Reaction
of Elemental Sulfur Using the California Pesticide Illness Database and a Mouse Model." Journal of Agromedicine 10(3):41–47.
Marra, M.C., and N.E. Piggott. 2006. "The Value of Non-pecuniary Characteristics of
Crop Biotechnologies: A New Look at the Evidence." New York. Natural Resource Management and Policy series, vol. 30.
27
McGourty, G. 2008. "Fighting Disease Organically." Available: http://www.winesandvines.com/template.cfm?section=features&content=58955.
Accessed 1 September 2014. Thomas, C.S., W.D. Gubler, and G. Leavitt. 1994. "Field Testing of a Powdery Mildew
Disease Forecast Model on Grapes in California." Phytopathology 84:1070. University of California Cooperative Extension (2000–2011) Cost and Return Studies.
Davis. UC Davis Agriculture and Resource Economics. Available: http://coststudies.ucdavis.edu.
Weber, E., W.D. Gubler, and A. Derr. 1996. "Powdery Mildew Controlled with Fewer
Fungicide Applications." Practical Winery & Vineyard Jan/Feb. Zhan, Y., and M. Zhang. 2012. "PURE: A web-based decision support system to evaluate
pesticide environmental risk for sustainable pest management practices in California." Ecotoxicology and Environmental Safety 82(0):104-113.
28
Appendix A: Details of Application Costs for PM Products
Operation time (hours per acre) depends on the type of application and equipment
used. Tractors with more power typically take less time to cover an acre, and dry dust
takes less time to apply than liquid spray. Application costs per acre depend on the time it
takes to spray or dust an acre using appropriate equipment, plus additional labor to set up
and disassemble the equipment.
Labor
Agricultural operations involve two types of labor: non-machine labor and
equipment operator labor. Powdery mildew management requires equipment operator
labor, which is slightly more expensive than non-machine labor. Hourly wages include an
additional 34–45% for payroll overhead, which consists of the employer’s share of
payroll taxes (state and federal), workers’ compensation insurance and other benefits
(University of California Cooperative Extension, 2000–2011). Labor time for operations
involving machinery is assumed to be 20% higher than the per acre operation time to
allow for time spent in setting up, maintenance, moving, field repairs etc. Total labor
costs therefore include per acre operation costs plus a 20% time allowance for equipment
operations.
Machinery
Tractors used for pesticide application range from 30 to 90 Horsepower. In
addition to the tractor, pesticides are applied using either dusters (sulfur dust) or sprayers
(micronized wettable sulfur and all other pesticides). Dusters are used only for dusting
29
sulfur, while sprayers apply liquid mixes and can be used for other pesticide applications
(University of California Cooperative Extension, 2000–2011). Total hourly operating
costs include fuel, lube and repair costs per hour of operation. Tractor time is assumed to
be 10% higher than operation time to allow for setup, travel and down time. Total
equipment costs therefore include operation costs per acre (costs per hour divided by the
hours per acre for the operation), plus the stated time allowance.
30
Tables and Figures Table 1: Chemicals Used for Powdery Mildew Control
Chemical Group (Active Ingredient)
Total Pounds Applied (2011)*
Chemical Name Disease Pressure
Sulfur Compounds 32,500,000 Sulfur All Lime-sulfur
Contact Materials 2,356,085 Potassium bicarbonate All, eradicant Petroleum distillates
Neem oil Cinnamaldehyde Copper** 404,669 Copper hydroxide Low Copper sulfate
Sterol Inhibitors 134,684 Tebuconazole All Triflumizole Myclobutanil Fenarimol Triadimefon
Difenoconazole
Strobilurins 121,701 Azoxystrobin All Trifloxystrobin Kresoxim-methyl Pyraclostrobin Boscalid
Cell-Signaling Inhibitor 28,488 Quinoxyfen Low-moderate
Biologicals 14,944 Bacillus Sumilus All Bacillus Subtilis Reynoutra Sacalinensis
Streptomyces Ludicus Multichemical Formulations***
64,440 Fluopyram+Tebuconazole Difenoconazole+Cyprodinil
All
Benzophenone 37,266 Metrafenone
All
Systemic Acquired Resistance Products
20 Harpin protein L-glutamic acid
Low
Other 111,370 Mancozeb Low-moderate Captan, other related
Benomyl *Weight of active ingredient only ** Copper is not a part of the official IPM program for PM management. However, some growers apply copper-sulfur mixes for PM control. We exclude copper from further calculations in order to remain consistent with the official IPM guidelines. ***Exclude chemicals accounted for in previous categories, such as Tebuconazole and Difenoconazole. Source: Pesticide Use Reports 2011, Department of Pesticide Regulation, UC IPM
31
Table 2: Grape Varietal Susceptibility to Powdery Mildew Susceptibility Wine Table Raisin High Carignane Christmas Rose Fiesta
Chardonnay Chrimson seedless Zante Currante (Black Corinth)
Chenin blanc Flame seedless DOVine
Muscat blanc (Muscat Canelli) Marroo seedless
Roussane Perlette
Redglobe
Ruby Seedless
Tokay
Moderate Barbera Autumn Royal Black Monukka
Burger Beauty Seedless Thompson seedless
Cabernet franc Calmeria Muscat of Alexandria
Cabernet Sauvignon Cardinal Selma Pete
Gamey Beaujolais Emperor
Grenache Fantasy seedless
Malbec Italia
Melon Princess
Mission Ribier
Muscat Noir (Black Hamburg)
Nebbiolo
Pinot noir (Pinot family)
Ruby Cabernet
Saubignon blanc
Semillon
Syrah
Tempranillo (Valdepenas)
Viognier
Zinfandel
Low Alicante Bouschet Queen
Dolcetto (Charbono)
Folle blanc
French Colombard
Gewurtzraminer
Malvasia Bianca
Merlot
Mourvedre
Palomino
Petite Sirah (Durif)
Riesling
Rubired
Sangiovese
Trousseau (Grey Riesling)
Ugni blanc (Tribbiano, St. Emillon)
Valdiguie (Napa Gamay) Source: University of California Agricultural and Natural Resource, UC Cooperative Extension, Fresno County. Available online at http://www.calagquest.com/PowderyMildewSusceptibilitybyGrapeVariety.pdf.
32
Table 3: Examples of Powdery Mildew Spraying Programs for High Disease Pressure Regions Central Coast San Joaquin Valley Winegrapes Raisin Grapes Table Grapes Rally 2X Sulfur 1X Microthiol 2X Quintec 1X Sulfur 3X Alternate Rows Dusting Sulfur 7X Flint 1X Rally+ Sulfur 1X Rally+Microthiol 2X Stylet Oil 3X Flint + Sulfur 1X Rally + Dusting Sulfur 1X Source: UCCE Cost and Return Studies and consultation with experts.
33
Table 4: Top Ten Counties by Pounds of Powdery Mildew Pesticides Applied, 2011
Benzophenone Biologicals
Cell-Signaling Inhibitors Contact
Multichemical Formulations
Sterol Inhibitors Strobilurins Sulfur Other* Total
Pounds of Active Ingredient Fresno 2,715 746 7,442 104,425 7,059 50,924 21,591 7,901,489 28,479 8,124,871 San Joaquin 776 461 792 120,650 749 4,363 7,920 5,516,161 619 5,652,473 Madera 328 134 1,929 36,226 1,923 11,354 7,448 4,946,657 2,083 5,008,082 Kern 628 1,706 2,530 95,164 14,103 14,980 19,533 3,134,183 101,728 3,384,555 Tulare 418 918 1,294 41,406 10,028 10,075 9,475 2,012,894 38,363 2,124,871 Sacramento 487 22 748 72,219 59 1,642 3,643 2,114,368 564 2,193,753 Sonoma 4 5,378 2,321 202,053 7,054 7,389 11,846 1,785,045 5,459 2,026,549 Monterey 383 756 3,883 778,744 11,384 11,932 11,471 684,003 18,758 1,521,314 Yolo 29,334 11 397 144,159 18 1,405 2,458 1,147,762 1,693 1,327,237 Napa
5,432 1,410 164,334 5,619 5,938 7,557 927,216 3,369 1,120,875
* Systemic Acquired Resistance Products are included in the “other” category because of insignificant levels of application in 2011 (20lbs).
Source: Pesticide Use Reports 2011, Department of Pesticide Regulation, UC IPM guidelines for PM management on grapes
34
Table 5: Grape Production and Value per Ton by County, 2011 Area Production Price Crop Value
Wine Raisin Table Total Wine Raisin* Table Total Wine Raisin* Table Average Total
Thousand Bearing Acres Thousand Tons $ per ton $ per ton $ ‘000s
High-priced grapes Napa 43.6
43.6 121.9
121.9 3,474
3,474 423,441
Riverside 2.8
7.7 10.5 6.4
292.0 58.7 1,051
2,263 2,132 125,225 Sonoma 58.1
58.1 166.6
166.6 2,083
2,083 347,080
Santa Clara 1.5
1.5 4.9
4.9 1,343
1,343 6,600 Alameda 2.6
2.6 9.2
9.2 1,297
1,297 11,916
El Dorado 2.0
2.0 4.3
4.3 1,295
1,295 5,137 Santa Barbara 20.5
20.5 60.1
60.1 1,281
1,281 76,958
Mendocino 16.7
16.7 57.4
57.4 1,237
1,237 71,595 Medium-priced grapes
Lake 8.2
8.2 34.0
34.0 1,176
1,176 39,993 Amador 3.5
3.5 10.2
10.2 1,150
1,150 11,675
Monterey 43.0
43.0 124.0
124.0 1,137
1,137 140,976 San Luis Obispo 37.7
37.7 114.6
114.6 1,132
1,132 129,738
San Benito 3.7
3.7 13.7
13.7 1,024
1,024 14,057 Kern 21.0 19.1 39.4 79.5 292.0 122.2 391.0 805.2 372 439 1,395 879 707,583 Tulare 10.3 17.6 31.3 59.2 149.4 216.5 277.0 642.9 350 678 1,203 828 532,423 Solano 3.9
3.9 14.3
14.3 731
731 10,418,
Contra Costa 2.0
2.0 8.5
8.5 704
704 5,970 Low-priced grapes
Colusa 2.4
2.4 17.4
17.4 616
616 10,710 Yolo 12.0
12.0 81.6
81.6 598
598 48,757
Glenn 1.1
1.1 6.8
6.8 553
553 3,741 San Joaquin 93.1
93.2 522.0
523.0 549
548 286,728
Sacramento 27.2
27.2 177.0
177.0 525
525 92,926 Stanislaus 11.0
11.0 111.6
111.6 506
506 56,441
Kings 3.5 1.8 1.0 6.3 53.8 25.1 11.8 90.7 309 406 1,490 490 44,436 Merced 11.6 0.5
12.2 116.8 5.5
122.2 430 328
425 51,973
Fresno 40.9 165.7 11.3 217.8 620.0 1714.5 128.5 2463.0 356 339 1,242 390 961,777 Madera 38.4 33.8 2.3 74.5 417.4 363.7 21.9 802.9 320 365 1,578 374 300,681 *Raisin production is calculated on a fresh equivalent basis using conversion rates or average yield per acre from county crop reports. Source: County Crop Reports, 2011
35
Figure 2a: Annual Pounds of Chemicals Applied Per Acre for Counties with Low-, Medium-, and High-Value Grapes, 2011
Notes: Annual pounds per acre for all counties included in each price category, weighted by harvested acreage.
36
Figure 2b: Annual Pounds of Chemicals Applied Per Ton of Output for Counties with Low-, Medium- and High-Value Grapes
Notes: Annual pounds per ton of output for all counties included in each price category, weighted by output.
37
Table 6: Estimates of Powdery Mildew Management Costs at the County Level, 2011
Average Price Total Crop Value 4% of Revenue 5% of Revenue 6% of Revenue
$ per ton Thousands of Dollars
High-priced grapes: top 30th percentile by price per ton Napa 3,508 423,442 16,938 21,172 25,407 Riverside 2,381 125,225 5,009 6,261 7,514 Sonoma 2,083 347,077 13,883 17,354 20,825 Santa Clara 1,343 6,601 264 330 396 Alameda 1,297 11,916 477 596 715 El Dorado 1,295 5,518 221 276 331 Santa Barbara 1,281 76,959 3,078 3,848 4,618 Mendocino 1,248 71,596 2,864 3,580 4,296 Lake 1,176 39,993 1,600 2,000 2,400 Medium-priced grapes: 31st69th percentiles by price per ton Amador 1,150 11,676 467 584 701 Monterey 1,137 140,976 5,639 7,049 8,459 San Luis Obispo 1,132 129,738 5,190 6,487 7,784 San Benito 1,024 14,057 562 703 843 Kern 879 707,583 28,303 35,379 42,455 Tulare 835 532,423 21,297 26,621 31,945 Solano 732 10,419 417 521 625 Contra Costa 704 5,972 239 299 358 Kings 614 44,436 1,777 2,222 2,666 Low-priced grapes: bottom 30th percentile by price per ton
Yolo 598 48,757 1,950 2,438 2,925 Glenn 553 3,741 150 187 224 San Joaquin 548 286,728 11,469 14,336 17,204 Sacramento 525 92,926 3,717 4,646 5,576 Stanislaus 506 56,431 2,257 2,822 3,386 Madera 485 300,681 12,027 15,034 18,041 Merced 430 51,973 2,079 2,599 3,118 Fresno 390 961,777 38,471 48,089 57,707 Total
180,345 225,431 270,517
Source: Developed by the authors using data from County Crop Reports, 2011, UC Davis Cost and Return Studies.
38
Table 7: Total Dollar Value of Chemical Products Applied, 2011 Chemical Category* Pounds Applied Average Price Total Dollar Cost Percent of TC
Thousand lbs $ per lb $ `000’s %
Sulfur 32,500 0.53 17,225 24.41 Sterol Inhibitors 135 116.77 15,727 22.29 Contact 2,356 5.40 12,723 18.03 Strobilurins 122 91.65 11,154 15.81 Multichemical Formulations 64 90.00 5,800 8.22 Benzophenone 37 131.25 4,891 6.93 Cell-Signaling Inhibitors 28 72.58 2,068 2.93 Other 111 7.21 803 1.14 Biologicals 15 10.97 164 0.23 Total 35,369
70,554
*Systemic acquired resistance products omitted because of insignificant amount of application Average price calculated as a weighted average for each category Source: Developed by the authors based on PUR records, 2011, UC Davis Cost and Return Studies.
39
Table 8: Per Acre Application Costs, North Coast
Napa 2012 Sonoma 2010 Lake 2008
A. Per Acre Costs for a Single Application Hours Labor Equipment Total Hours Labor Equipment Total Hours Labor Equipment Total
Dollars Dollars Dollars Dusting sulfur (dry dust) not used 0.22 5.31 6.50 11.81 not used Wettabe sulfur (spray) 1 24.36 22.48 46.84 0.38 9.17 12.79 21.96 0.69 11.01 19.16 30.17 Other fungicides (spray) 1 24.36 22.48 46.84 1.15 27.74 38.71 66.45 0.69 11.01 19.16 30.17 B. Hourly rates for equipment and labor Dollars Equipment Operators 20.30 includes 45% payroll overhead 20.10 includes 34% payroll overhead 13.30 includes 33% payroll overhead Field Workers 17.70 includes 45% payroll overhead 16.08 includes 34% payroll overhead 10.64 includes 33% payroll overhead Duster n/a
10.20
n/a
Sprayer 5.75
14.30
11.60 to 15.8 Tractor - Spray 15.21 60HP
17.60 60HP
14.70 to 19.1 50HP
Tractor - Dust 15.21 60HP
17.60 60HP
14.70 to 19.1 50HP
C. Extra time allowances Equipment operator labor 20%
20%
20%
Tractor time 10% 10% 10% Sources: 2012 Winegrape Cost and Return Studies, North Coast, Napa, http://coststudies.ucdavis.edu/files/WinegrapeNC2012.pdf
2010 Winegrape Costs and Return Studies, North Coast, Sonoma http://coststudies.ucdavis.edu/files/grapewinesonoma2010.pdf 2008 Winegrape Cost and Return Studies, North Coast, Lake, White Varieties http://coststudies.ucdavis.edu/files/grapewinewhitenc2008.pdf 2008 Winegrape Cost and Return Studies, North Coast, Lake, Red Varieties http://coststudies.ucdavis.edu/files/grapewineredlake2008.pdf 2004 Winegrape Cost and Return Studies, North Coast, Sonoma, Chardonnay http://coststudies.ucdavis.edu/files/grapewinenc2004.pdf
40
Table 9: Per Acre Application Costs, San Joaquin Valley and Sacramento Valley
San Joaquin Valley North 2012 San Joaquin Valley South 2008 Sacramento Valley 2013
A. Per Acre Costs for a Single Application Hours Labor Equipment Total Hours Labor Equipment Total Hours Labor Equipment Total
Dollars Dollars Dollars Dusting sulfur (dry dust) 0.29 5.60 3.71 9.30 0.3 5.27 4.42 9.68 0.36 6.65 9.52 16.17 Wettabe sulfur (spray) 0.36 6.95 10.05 16.99 0.5 8.78 10.20 18.98 0.39 7.21 15.93 23.14 Other fungicides (spray) 0.36 6.95 10.05 16.99 0.5 8.78 10.20 18.98 0.39 7.21 15.93 23.14 B. Hourly rates for equipment and labor
Dollars Equipment Operators 16.08 includes 34% payroll overhead 14.63 includes 33% payroll overhead 15.4 includes 34% payroll overhead Field Workers 13.4 includes 34% payroll overhead 10.97 includes 33% payroll overhead 12.1 includes 34% payroll overhead Duster 2.96
2.80
4.58
Sprayer 3.91
8.47
16.3 Tractor - Spray 21.82 90HP
10.84 60HP
22.32 80HP
Tractor - Dust 8.93 30HP
10.84 60HP
19.87 70HP
C. Extra time allowances Equipment operator labor 20%
20%
20%
Tractor time 10% 10% 10% Sources: 2013 Winegrape Cost and Return Studies, Sacramento Valley, http://coststudies.ucdavis.edu/files/2013/GrapeWineSV2013.pdf
2012 Winegrape Cost and Return Studies, San Joaquin Valley North, http://coststudies.ucdavis.edu/files/GrapeWineVN2012.pdf 2008 ORGANIC Raisin Cost and Return Study, San Joaquin Valley South, http://coststudies.ucdavis.edu/files/graperaisinorgvs08.pdf 2007 Table Grapes Cost and Return Study, San Joaquin Valley South, http://coststudies.ucdavis.edu/files/grapets_vs2007.pdf
41
Table 10: Costs per Acre to Treat Powdery Mildew: Sample Budgets, 2013
Central Coast Chardonnay
San Joaquin Valley North Table Grapes
San Joaquin Valley South Raisins
Chemical Labor Machinery Material Labor Machinery Material Labor Machinery Material Dusting sulfur n/a n/a n/a 6 5 2 7 5 2 Wettable sulfur (Microthiol) n/a n/a n/a 6 5 2 7 5 3 Sterol Inhibitors (Rally) 15 11 35 18 14 63 13 10 31 Strobilurins (Flint) 15 11 45 6 5 67 n/a n/a n/a Cell-Signaling Inhibitor (Quintec) 8 10 31 n/a n/a n/a n/a n/a n/a Contact Materials (Stylet Oil) 6.7 5.3 31 n/a n/a n/a n/a n/a n/a Source: Developed by the authors based on the UCCE Cost and Return Studies and consultation with experts.
42
Table 11: Costs per Acre to Treat Powdery Mildew: By Regions, 2013
Central Coast North Coast San Joaquin and Sacramento Valley
Chemical Labor Machinery Labor Machinery Labor Machinery Dusting sulfur 6 5 7 6 6 5 Wettable sulfur 10 11 12 13 6 5 Sterol Inhibitors (Rally) 15 11 18 13 15 11 Strobilurins (Flint) 15 11 18 13 15 11 Cell-Signaling Inhibitors (Quintec) 8 10 10 12 7 10 Contact Materials (Stylet Oil) 6.7 5.3 8 6 7 10 Other fungicide sprays* 11 9 13 11 11 11 Source: Developed by the authors based on the UCCE Cost and Return Studies and consultation with experts.
*We assume application rates for other fungicides are the average of all the other liquid sprays.
43
Table 12: Application Costs for PM Treatments, 2011 North Coast Central and South Coast Central Valley Total All Regions Chemical Category
Area Treated
Cost per acre
Total Cost
Area Treated
Cost per acre
Total Cost
Area Treated
Cost per acre
Total Cost
Area Treated
Cost per acre
Total Cost
Thousand
Acres $ per acre Thousand $
Thousand Acres $ per acre Thousand
$ Thousand
Acres $ per acre Thousand $
Thousand Acres $ per acre Thousand
$ Sterol Inhibitors 152 31 4,703 196 26 5,096 634 26 16,486 982 27 26,285 Strobilurins 153 31 4,742 171 26 4,440 622 26 16,164 946 27 25,346 Sulfur 480 13 6,240 348 11 3,829 3,332 11 36,653 4160 11 46,722 Biologicals 54 14 750 8 12 100 27 17 461 89 15 1,311 SARs
0.3 17 5 0.3 17 5
Cell-Sig 45 22 981 93 18 1,675 171 17 2,902 309 18 5,558 Contact 102 14 1,431 250 12 3,001 121 17 2,052 473 14 6,484 Other 10 25 256 4 21 83 47 22 1,025 61 22 1,364 Multchem 36 31 1,114 41 26 1,078 80 26 2,090 157 27 4,282 Benzophenone 0 25 0.4 11 21 231 19 22 413 30 21 644 Total 1,031 20,217 1,123 19,533 5,052 78,250 7,206 118,000 Source: Calculated by the authors using Pesticide Use Reports, 2011, Cost and Return Studies
44
Table 13: Most Frequently Used Products for Treating Powdery Mildew by Chemical Category, 2011
Chemical Category Toxicity According to Label Product Name
Benzophenone Caution VIVANDO Biologicals Caution SERENADE MAX
Caution SONATA
Cell-Signaling Inhibitors Caution QUINTEC Contact Caution JMS STYLET-OIL
Caution KALIGREEN
Multichemical Formulations Caution LUNA EXPERIENCE
Caution INSPIRE SUPER
Caution QUADRIS TOP
Sterol Inhibitors Danger! VITICURE
Warning! RALLY 40 WSP
Strobilurins Caution PRISTINE FUNGICIDE
Caution SOVRAN FUNGICIDE
Caution FLINT FUNGICIDE
Sulfur Caution SULFUR products *Label indicates three levels of toxicity: highly toxic (Danger!), moderately toxic (Warning!) and low toxicity
(Caution). Source: California Department of Pesticide Regulation
45
Table 14: Elements of the Environmental Impact Quotient Abbreviation Description Range of possible
values SY Systemicity 13 C Chronic toxicity (long-term
health effects) 15
DT Dermal toxicity 15 F Toxicity to fish 15
D Toxicity to birds 15 Z Toxicity to bees 15 B Toxicity to beneficial arthropods 15
P Plant surface residue half-life 15 S Soil residue half-life 15 R Surface loss potential 15 L Groundwater and runoff potential 15 Source: http://www.nysipm.cornell.edu/publications/eiq/methods.asp
46
Table 15: Environmental Impact Quotient for Powdery Mildew Treatment Chemicals EIQ Per Pound of Chemical Chemical Category Chemical Name Total Farm Worker Consumer Ecology Benzophenone Metrafenone n/a n/a n/a n/a Biologicals Bacillus pumilus n/a n/a n/a n/a
Bacillus subtilis n/a n/a n/a n/a
Ampelomyces quisqualis n/a n/a n/a n/a
Cell signaling inhibitor Quinoxyfen 32 10 6 80 Contact materials Potassium bicarbonate 8 6 2 16
Petroleum distillates n/a n/a n/a n/a
Neem oil n/a n/a n/a n/a
Cinnamaldehyde n/a n/a n/a n/a
Multichemical Formulatios
Difenoconazole Cyprodinil
41.50 26.77
15.00 12.15
23.50 14.73
86.00 53.45
Sterol inhibitors Tebuconazole 40.33 20 31 70
Triflumizole 20.42 11.4 6.7 43.15
Myclobutanil 24.01 8.1 12.15 51.79
Fenarimol 18.1 12 15 27.3
Triadimefon 26.96 12.15 15.15 53.57
Strobilurins Azoxystrobin 26.92 8.1 6.05 66.62
Trifloxystrobin 29.78 12.15 10.23 66.95
Kresoxim-methyl 15.07 9 4.5 31.7
Pyraclostrobin 27.01 8.1 4.05 68.87
Boscalid 26.44 12.15 21.23 45.95
Sulfur compounds Sulfur 32.66 21.87 8.29 67.82
Lime-sulfur 67.67 108 19 76
SARs Harpin protein n/a n/a n/a n/a
L-glutamic acid n/a n/a n/a n/a
Other Mancozeb 25.72 20.25 8.13 48.79
Captan, other related 15.77 12 5 30.3
Benomyl 30.24 13.8 13.6 63.32
47
Table 16a: Per Acre Environmental Impact of Powdery Mildew (PM) Control for One Growing Season – Table Grapes
EIQ per pound of active ingredient
EIQ Per acre for one growing season
Pesticide Products Total Worker Consumer Environment Dose Number of Applications Total Worker Consumer Environment
lb of AI/acre
Table Grapes, Crimson Seedless. San Joaquin Valley South
PM Products Microthiol Flowable Sulfur 32.66 21.87 8.29 67.82 5.20 4 679.33 454.90 172.43 1410.66
Dusting Sulfur 32.66 21.87 8.29 67.82 24.50 8 6401.36 4286.52 1624.84 13292.72 Rally 24.01 8.10 12.15 51.79 0.10 3 7.20 2.43 3.65 15.54
Total PM products
7087.89 4743.85 1800.92 14718.91 Other Products
Abound 26.92 8.1 6.05 66.62 0.20 1 5.38 1.62 1.21 13.32 Ethrel 24.8 21.3 5.65 47.45 2.50 1 62.00 53.25 14.13 118.63 Kryocide 20.16 13.11 4.99 42.37 6.24 1 125.80 81.81 31.14 264.39 Lorsban 26.85 6 2 72.55 1.88 1 50.41 11.27 3.76 136.21 Neutral Zinc (sulfur 1%, Zinc 52%) 32.66 21.87 8.29 67.82 0.03 1 0.98 0.66 0.25 2.03 Provado 36.71 6.9 10.35 92.88 0.05 1 1.84 0.35 0.52 4.64 Roundup 15.33 8 3 35 1.00 1 15.33 8.00 3.00 35.00 Surflan 18.1 9 6 39.3 4.00 1 72.40 36.00 24.00 157.20 Vanguard 26.77 12.15 14.73 53.45 0.47 1 12.55 5.70 6.90 25.05
Total other products
346.69 198.64 84.90 756.48
PM EIQ as % of total EIQ
95 95 95 95
Sources: Grower budgets based on UC Davis Cost and Return Studies: http://coststudies.ucdavis.edu/files/GrapeWineVN2012.pdf, http://coststudies.ucdavis.edu/files/WinegrapeNC2012.pdf, http://coststudies.ucdavis.edu/files/grapewinewhitenc2008.pdf, http://coststudies.ucdavis.edu/files/grapecrimsonvs2007.pdf, http://coststudies.ucdavis.edu/files/grraistdsj06.pdf, http://coststudies.ucdavis.edu/files/graperaisogsj03.pdf, http://coststudies.ucdavis.edu/files/2013/GrapeWineSV2013.pdf DPR Pesticide Product Database available online: http://www.cdpr.ca.gov/dprdatabase.htm Environmental Impact Quotient, New York State IPM Program, http://www.nysipm.cornell.edu/publications/eiq
48
Table 16b: Per Acre Environmental Impact of Powdery Mildew (PM) Control for One Growing Season – Raisin Grapes
EIQ per pound of active ingredient
EIQ Per acre for one growing season
Pesticide Products Total Worker Consumer Environment Dose Number of Applications Total Worker Consumer Environment
Raisin Grapes, Tray Dried Thompson Seedless. San Joaquin Valley PM Products
Sulfur 32.66 21.87 8.29 67.82 24.50 5 3600.77 2411.17 913.97 7477.16 Rally 24.01 8.10 12.15 51.79 0.10 1 2.40 0.81 1.22 5.18 Flint 29.78 12.15 10.23 66.95 0.06 1 1.86 0.76 0.64 4.18
Total PM products
3605.03 2412.74 915.83 7486.52 Other Products
Abound 26.92 8.1 6.05 66.62 0.20 1 5.38 1.62 1.21 13.32 Kryocide 20.16 13.11 4.99 42.37 6.24 1 125.80 81.81 31.14 264.39 Lorsban 26.85 6 2 72.55 1.88 1 50.41 11.27 3.76 136.21 Neutral Zinc (sulfur 1%, Zinc 52%) 32.66 21.87 8.29 67.82 0.03 1 0.98 0.66 0.25 2.03 Provado 36.71 6.9 10.35 92.88 0.05 1 1.84 0.35 0.52 4.64 Roundup 15.33 8 3 35 1.00 2 30.66 16.00 6.00 70.00 Surflan 18.1 9 6 39.3 4.00 1 72.40 36.00 24.00 157.20
Total other products
287.47 147.69 66.87 647.80 PM EIQ as % of total EIQ
92 94 93 92
Raisin Grapes, DOV Selma Pete, DOVine, or FIESTA. San Joaquin Valley
PM Products Sulfur 32.66 21.87 8.29 67.82 24.50 5 3600.77 2411.17 913.97 7477.16
Rally 24.01 8.10 12.15 51.79 0.10 1 2.40 0.81 1.22 5.18 Flint 29.78 12.15 10.23 66.95 0.06 1 1.86 0.76 0.64 4.18
Total PM products
3605.03 2412.74 915.83 7486.52 Other Products
Neutral Zinc (sulfur 1%, Zinc 52%) 32.66 21.87 8.29 67.82 0.03 1 0.98 0.66 0.25 2.03 Provado 36.71 6.9 10.35 92.88 0.05 1 1.84 0.35 0.52 4.64
Total other products
2.82 1.00 0.77 6.68 PM EIQ as % of total EIQ
99.9 99.9 99.9 99.9
Sources: Grower budgets based on UC Davis Cost and Return Studies: http://coststudies.ucdavis.edu/files/GrapeWineVN2012.pdf, http://coststudies.ucdavis.edu/files/WinegrapeNC2012.pdf, http://coststudies.ucdavis.edu/files/grapewinewhitenc2008.pdf, http://coststudies.ucdavis.edu/files/grapecrimsonvs2007.pdf, http://coststudies.ucdavis.edu/files/grraistdsj06.pdf, http://coststudies.ucdavis.edu/files/graperaisogsj03.pdf, http://coststudies.ucdavis.edu/files/2013/GrapeWineSV2013.pdf DPR Pesticide Product Database available online: http://www.cdpr.ca.gov/dprdatabase.htm Environmental Impact Quotient, New York State IPM Program, http://www.nysipm.cornell.edu/publications/eiq/
49
Table 16c: Per Acre Environmental Impact of Powdery Mildew (PM) Control for One Growing Season - Winegrapes
EIQ per pound of active ingredient
EIQ Per acre for one growing season
Pesticide Products Total Worker Consumer Environment Dose Number of Applications Total Worker Consumer Environment
Winegrapes, Chardonnay. Central Coast. PM Products
Rally 24.01 8.10 12.15 51.79 0.10 2 4.80 1.62 2.43 10.36 Quintec 32.00 10.00 6.00 80.00 0.07 1 2.21 0.69 0.41 5.52 Flint 29.78 12.15 10.23 66.95 0.06 1 1.86 0.76 0.64 4.18 Stylet Oil 8.00 6.00 2.00 16.00 0.17 3 4.19 3.15 1.05 8.39
Total PM products
13.07 4.60 2.10 18.09 Other Products
Roundup 15.33 8 3 35 1.00 1 15.33 8.00 3.00 35.00 Surflan 18.1 9 6 39.3 4.00 1 72.40 36.00 24.00 157.20 Vanguard 26.77 12.15 14.73 53.45 0.47 1 12.55 5.70 6.90 25.05
Total other products
100.28 49.70 33.90 217.25
PM EIQ as % of total EIQ
7.69 8.4 5.8 7.6 Sources: Grower budgets based on UC Davis Cost and Return Studies: http://coststudies.ucdavis.edu/files/GrapeWineVN2012.pdf, http://coststudies.ucdavis.edu/files/WinegrapeNC2012.pdf, http://coststudies.ucdavis.edu/files/grapewinewhitenc2008.pdf, http://coststudies.ucdavis.edu/files/grapecrimsonvs2007.pdf, http://coststudies.ucdavis.edu/files/grraistdsj06.pdf, http://coststudies.ucdavis.edu/files/graperaisogsj03.pdf, http://coststudies.ucdavis.edu/files/2013/GrapeWineSV2013.pdf DPR Pesticide Product Database available online: http://www.cdpr.ca.gov/dprdatabase.htm Environmental Impact Quotient, New York State IPM Program, http://www.nysipm.cornell.edu/publications/eiq/
50
Figure 3: Share of Each PM Chemical Category in Annual PURE Scores from PM Management, 2011
Sterol Inhibitors
Strobilurins
Strobilurins
Sulfur
Sulfur
Biologicals Contact
Contact
Mult
0% 20% 40% 60% 80% 100%
Surface Water
Ground Water
Soil
Air
Bees Sterol Inhibitors
Strobilurins
Sulfur
Biologicals
SARs
Cell-Sig.
Contact
Other
Mult
Benzophenone

51