Embed Size (px)
Citation preview
V 17 no 5 bull MayJun 2014
The Value of Powdery Mildew Resistance in Grapes Evidence from California Kate B Fuller Julian M Alston and Olena S Sambucci
Powdery mildew-resistant grape varieties currently being developed could yield large benefits to California table raisin and wine grape growersmdash potentially allowing cost savings as high as $48 million per year
Also in this issue
How California Farms Measure Up in the 2012 Census of Agriculture Smaller in Size with Higher Value of Production
Emma C Knoesen and Rachael E Goodhue5
Assessing Environmental Impacts of Genetically Modified Seeds in Brazilian Agriculture
Renato Seixas and Joseacute Maria Silveira9
Powdery mildew (PM) is a fungal disease that can damage many crops On most plants PM
appears as white powdery spots on leaves shoots flowers or fruit which if untreated can spread over large areas of the leaves and stems and cause reduced yields and lower fruit quality Grape PM Erisiphe necator is the most prevashylent leaf-infecting disease for California grapes Across the state it accounts for 74 of grape pesticide use more than any other grape disease A range of funshygicides can help vineyard managers keep the disease in check in most years but these are costly and may have negative environmental and human health effects
For many affected crops such as melons squash and peas PM-resistant varieties have been successfully develshyoped PM-resistant grape varieties are currently being developed (eg the VitisGen project wwwvitisgenorg) We have developed detailed estimates of the differences in costs of production between conventional and PM-resistant varieties of table raisin and wine grapes using budgets for hypothetical ldquorepshyresentativerdquo individual vineyards
We use these differences in costs to estimate the potential benefits from PM resistance in grapes over several regions of California The potential benefits are large but depend critically on the lag until the resistant varieties
become available as well as the subshysequent rate of adoption by growers
Powdery Mildew-Resistant Varieties Powdery mildew resistance charactershyistics can be introduced using either conventional or transgenic approaches Some potential barriers to market acceptance arise when introducing new varieties developed using either type of technology especially for wine grapes where the use of traditional Vitis vinifera varieties predominates For table and raisin grapes these aspects are not as importantmdashmany currently popular varieties are relatively new
Conventional breeding entails crossshying vinifera varieties all of which are at least somewhat susceptible to PM with non-vinifera grapes and then back-crossshying to obtain a vine with very high vinif-era contentmdashperhaps greater than 99 However wines made with these hybrid grapes cannot be labeled with the vinif-era varietal name and could only be sold either without varietal labels or blended with wine made from a 100 vinifera varietal Even if wines made using grapes from transgenic PM-resistant plants could bear the traditional vinifera varishyetal name they would probably face significant market resistance because of popular views on genetically modified foods and would need to go through a substantial regulatory approval process
Giannini Foundation of Agricultural Economics bull University of California
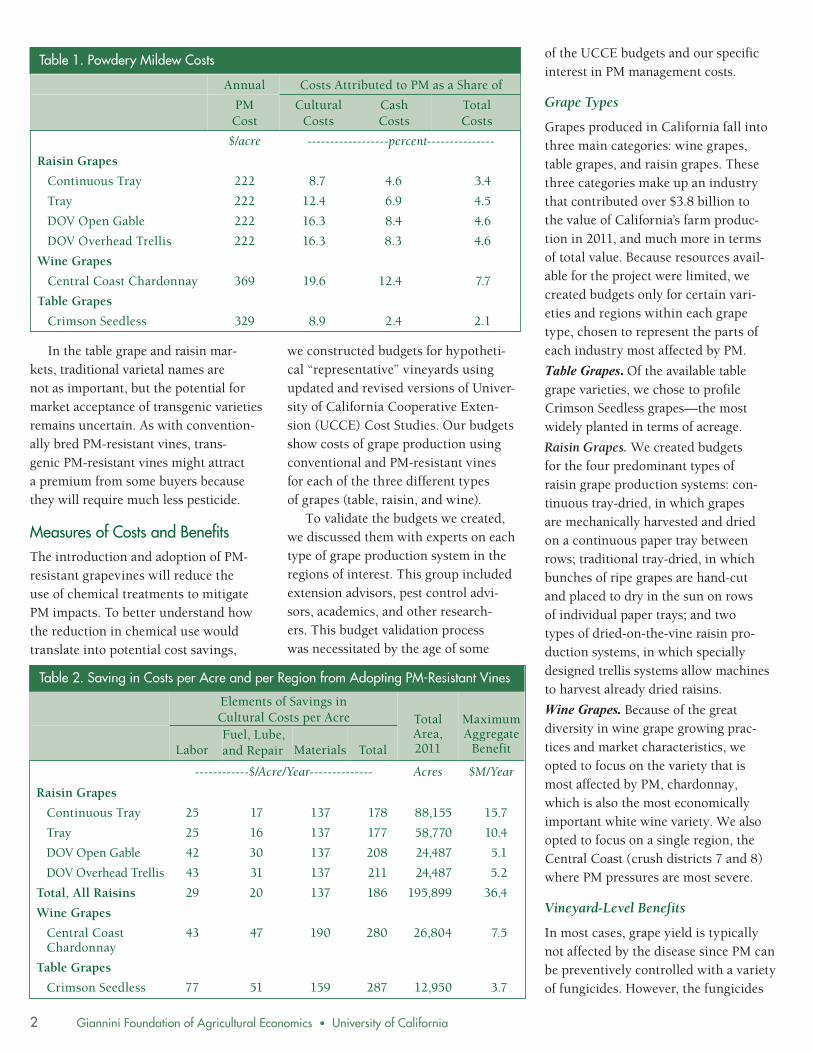
Table 1 Powdery Mildew Costs
Annual Costs Attributed to PM as a Share of
PM Cost
Cultural Costs
Cash Costs
Total Costs
$acre ------------------percent--------------shy
Raisin Grapes
Continuous Tray 222 87 46 34
Tray 222 124 69 45
DOV Open Gable 222 163 84 46
DOV Overhead Trellis 222 163 83 46
Wine Grapes
Central Coast Chardonnay 369 196 124 77
Table Grapes
Crimson Seedless 329 89 24 21
In the table grape and raisin marshykets traditional varietal names are not as important but the potential for market acceptance of transgenic varieties remains uncertain As with conventionshyally bred PM-resistant vines transshygenic PM-resistant vines might attract a premium from some buyers because they will require much less pesticide
Measures of Costs and Benefits The introduction and adoption of PM-resistant grapevines will reduce the use of chemical treatments to mitigate PM impacts To better understand how the reduction in chemical use would translate into potential cost savings
we constructed budgets for hypothetishycal ldquorepresentativerdquo vineyards using updated and revised versions of Univershysity of California Cooperative Extenshysion (UCCE) Cost Studies Our budgets show costs of grape production using conventional and PM-resistant vines for each of the three different types of grapes (table raisin and wine)
To validate the budgets we created we discussed them with experts on each type of grape production system in the regions of interest This group included extension advisors pest control advishysors academics and other researchshyers This budget validation process was necessitated by the age of some
Elements of Savings in Cultural Costs per Acre Total
Area 2011
Maximum Aggregate
Benefit Labor Fuel Lube and Repair Materials Total
Table 2 Saving in Costs per Acre and per Region from Adopting PM-Resistant Vines
------------$AcreYear-------------shy Acres $MYear
Raisin Grapes
Continuous Tray 25 17 137 178 88155 157
Tray 25 16 137 177 58770 104
DOV Open Gable 42 30 137 208 24487 51
DOV Overhead Trellis 43 31 137 211 24487 52
Total All Raisins 29 20 137 186 195899 364
Wine Grapes
Central Coast Chardonnay
43 47 190 280 26804 75
Table Grapes
Crimson Seedless 77 51 159 287 12950 37
of the UCCE budgets and our specific interest in PM management costs
Grape Types
Grapes produced in California fall into three main categories wine grapes table grapes and raisin grapes These three categories make up an industry that contributed over $38 billion to the value of Californiarsquos farm producshytion in 2011 and much more in terms of total value Because resources availshyable for the project were limited we created budgets only for certain varishyeties and regions within each grape type chosen to represent the parts of each industry most affected by PM
Table Grapes Of the available table grape varieties we chose to profile Crimson Seedless grapesmdashthe most widely planted in terms of acreage
Raisin Grapes We created budgets for the four predominant types of raisin grape production systems conshytinuous tray-dried in which grapes are mechanically harvested and dried on a continuous paper tray between rows traditional tray-dried in which bunches of ripe grapes are hand-cut and placed to dry in the sun on rows of individual paper trays and two types of dried-on-the-vine raisin proshyduction systems in which specially designed trellis systems allow machines to harvest already dried raisins
Wine Grapes Because of the great diversity in wine grape growing pracshytices and market characteristics we opted to focus on the variety that is most affected by PM chardonnay which is also the most economically important white wine variety We also opted to focus on a single region the Central Coast (crush districts 7 and 8) where PM pressures are most severe
Vineyard-Level Benefits
In most cases grape yield is typically not affected by the disease since PM can be preventively controlled with a variety of fungicides However the fungicides
2
3 Giannini Foundation of Agricultural Economics bull University of California
and the costs of applying them entail significant outlays for growers The combined cost of fungicide materishyals and their application amounts to between 87 of cultural costs for both continuous tray-dried raisin grapes and crimson seedless table grapes and 196 for Central Coast chardonnay wine grapes As a share of total cost of grape production PM treatments account for about 2 for Crimson Seedshyless table grapes and 8 for Central Coast chardonnay wine grapes (Table 1)
Table 2 shows differences in specific costs of productionmdashlabor materishyals and other costsmdashbetween various wine grape production systems using conventional and resistant grapes The difference in cost between the convenshytional and the resistant system does not simply equal the current cost of PM treatments Ending sulfur treatments may result in an erineum mite infestashytion so we assume a wettable sulfur treatment would be retained to treat the mites Additionally some non-PM treatments are typically applied along with PM treatments so the labor and fuel lube and tractor repair costs must be attributed to the non-PM treatshyments in full and can not be eliminated by adopting the resistant varieties
Cost savings from growing resisshytant vines versus conventional vary widely over types of grapes being produced Total annual cost savshyings range from $177 per acre in the case of traditional tray-dried raisin production up to $287 per acre for Crimson Seedless table grapes
Market-Level Benefits
We now scale up from the per-acre effects for ldquorepresentative vineyardsrdquo to area-wide effects for the regions we have selected the Central Coast for chardonshynay wine grapes and the San Joaquin Valley for Crimson Seedless table grapes and all types of raisin grapes Table 2 presents regional acreage and the total cost savings by production system if
Table 3 Total Present Value of Benefits from Adoption of PM-Resistant Varieties
Maximum Adoption Rate (A)
Lag (L+3 Years) 10 20 30 40
percent ---------------$ Millions-------------------shy
Raisins All Types
20 378 281 209 156
60 1134 844 628 467
100 1890 1406 1046 779
Wine Grapes Central Coast Chardonnay
20 78 58 43 32
60 234 174 129 96
100 389 290 216 160
Table Grapes Crimson Seedless
20 39 29 21 16
60 116 86 64 48
100 193 144 107 79
all growers in the region were to adopt a new resistant variety immediately
The largest total potential impact is in raisin grapes which would save $364 million per year if all growers converted all the acreagemdash195899 acres in the San Joaquin Valley in 2011mdashto PM-resistant varieties immediately The correspondshying annual cost savings for Central Coast chardonnay is $75 million (on 26804 acresmdashless than one-fifth that of raisins) and for Crimson Seedless it is $37 million (a high per-acre cost reducshytion of $287 per acre per year applied to a comparatively small total acreage of 12950 acres in 2011)
However a scenario in which resisshytant varieties become available immedishyately and all growers immediately adopt them is extremely unlikely In reality these new varieties will not become available for some time and if growshyers do adopt them they are likely to do so when the vines they currently have in the ground come to the end of their productive lifespans and have to be replaced anyway Hence we allow for various lags until vines become availshyable as well as various adoption rates
We also assume that once the vines become available adoption will increase slowly until it reaches its
maximum 20 years later Additionshyally growers typically do not begin to apply PM controls until the third year after planting so benefits will not be felt until three years after the RampD lag is over and adoption begins
Table 3 shows benefits from the resistant varieties over an infinite time horizon for different adoption rates (denoted A percent) and difshyferent lags (denoted L years) until the new varieties become available to growers Raisin grapes are likely to have the shortest lag as those resistant varieties are nearly fully developed a ten year RampD lag is possible for that category whereas resistant varieties of wine and table grapes could take significantly longer to be developed and become available to growers
The range of estimated benefits is substantial The present value of the benefit from PM-resistant vines for raisins ranges from as low as $156 million if the resistant vines become available in 40 years and are adopted by 20 of growers up to $189 million if they become available in 10 years and are adopted by 100 of growers The present value of the total benefits from PM-resistant vines ranges from $32 to $389 million
Giannini Foundation of Agricultural Economics bull University of California
for Central Coast chardonnay wine grapes and from $16 to $193 million for Crimson Seedless table grapes
Environmental Benefits
The availability and adoption of PM-resistant varieties would entail envishyronmental benefits as well Fuel lube and repair costs are a measure of tractor use Since tractors emit carbon dioxshyide fine particulate matter (PM 25) and a host of other pollutants curbing their use has been a topic of increasing conversation in the San Joaquin Valley where table and raisin grapes are grown and where air quality has become an issue of concern in recent years
Table 2 shows differences in fuel lube and repair costs that range from $16 per acre for traditional tray-dried raisin grape production to $51 per acre for Crimson Seedless table grapes The implication is that PM-resistant varieties would allow some reduction in vineyard operations with an attenshydant decrease in ambient pollution
The reduction in applications of chemical fungicides may also yield benshyefits to the environment and human health although much is unknown about these effects Sulfur the most heavily used agricultural chemical in California may cause respiratory illnesses and other adverse health effects However the kinds of respirashytory effects induced and what types of exposure cause them are unknown In soil bacteria slowly convert sulfur to sulfate which generally does not cause harm Other (relatively new) synthetic compounds used for PM treatshyment and prevention such as sterol inhibitors and strobilurns have not been reported as having negative envishyronmental or human health effects
Because of the large volume and frequency of applications controlling for PM results in the bulk of the envishyronmental impact from grape producshytion even though the fungicides used for PM control are less toxic to both
humans and the environment than many other pesticides The reduction of these environmental and human health costs is one of the benefits from growing PM-resistant varieties
Several measures of pesticide risk are available to examine the environmental impact of PM management These meashysures include the Environmental Impact Quotient (EIQ) which combines pestishycide hazards to farm workers consumers and the environment and the Pesticide Use Risk Evaluation (PURE) which is a California-specific index that quantishyfies the environmental risk to soil surshyface water ground water air and bees Using either measure sulfur accounts for a large share of environmental risk Environmental benefits from eliminatshying PM-related fungicide applications would accrue primarily to workers (reduced potential health risks) and through reduced harm to bees and soil
Conclusion Powdery mildew is a common disease that imposes large economic costs on California grape growers PM-resistant varieties of grapes could yield large economic benefits to grape producshyers in Californiamdashpotentially as high as $48 million per year in the subset of the industry covered by our analyshysismdashacross wine table and raisin grape-producing sectors Our estishymates of the cost savings attributable to PM-resistant varieties range widely across the different grape production systems with the greatest potential in the raisin grape industry Within a system the benefits are quite sensitive both to the RampD lag until the resistant varieties become available for adoption and to the maximum adoption rate
The measures of potential cost savshyings we present here represent only part of the economic picture for two reasons First they count only part of the potential cost savings We estimate only private cost savings for certain regions and do not include benefits
from reduced pesticide use or benefits for wine grapes other than chardonnay produced in the Central Coast region
On the other hand we have implicshyitly assumed prices of grapes grown using PM-resistant varieties would be the same as prices for grapes from the conventional varieties they would replace Grapes produced using nonshyvinifera or transgenic vines might well suffer a price discount compared with conventional alternatives and if the price discount is greater than the cost savings from resistance then it will not make economic sense for growers to adopt them Even if it is not prohibitive any price discount will offset the benshyefits from cost savings to some extent
Suggested Citation
Fuller KB JM Alston and OS Sambucci 2014 The Value of Powdery Mildew Resistance in Grapes Evidence from California ARE Update 17(5)1ndash4 University of California Giannini Foundation of Agricultural Economics
Kate Fuller is an assistant professorextension specialist in the Department of Agricultural Economics and Economics at Montana State University She can be reached at katefuller montanaedu Julian Alston is a professor in the ARE department and Director of the Robert Mondavi Institute Center for Wine Economics at UC Davis Olena Sambucci is a PhD candidate in the ARE department at UC Davis
For additional information the authors recommend
Fuller KB JM Alston and OS Sambucci 2014 ldquoThe Value of Powdery Mildew Resistance in Grapes Evidence from Californiardquo Robert Mondavi Institute Center for Wine Economics Working Paper 1401 httpvineconucdavis edupublicationscwe1401pdf
Davis RM WD Gubler and ST Koike 2008 ldquoPowdery Mildew on Vegetablesrdquo wwwipmucdavisedu PMGPESTNOTESpn7406html
University of California Cooperative Extension 2000ndash2011 Cost and Return Studies http coststudiesucdavisedu
4
5 Giannini Foundation of Agricultural Economics bull University of California
How California Farms Measure Up in the 2012 Census of Agriculture Smaller in Size with Higher Value of Production Emma C Knoesen and Rachael E Goodhue
The 2012 Census of Agriculture was released in early May 2014 Average farm size continues to grow in terms of acreage and market value of production However this trend is not universal across crop category or geographic region For the crop category of Land Used for Vegetables the average acreage allocation per farm reporting production in this category decreased while certain counties in California experienced an increase in the average acre allocation
Conducting an agriculture census has been a longstanding activshyity of the federal government
The 2012 Census of Agriculture was the twenty-eighth US agriculture census The first agriculture census was in 1840 and a new one has been conshyducted every five years since 1920 The aim of the census is to provide detailed information on US farms and ranches and their operators to the public busishynesses the government and analysts The census summarizes information at the national state and county levels Some information is not reported pubshylicly in order to maintain confidentialshyity regarding individual operations
The Census of Agriculture enables the comparison of California agriculture to US agriculture The 2012 census indicates that differences between the two regarding farm size by acreage and market value of agricultural products were consistent with the differences reported in 2007 and earlier recent
censuses We focus here on comparshying these characteristics in 2012
California had smaller farms on average by acreage with an avershyage farm size of 328 acres while the United States had an average of 434 acres Overall California had a larger percentage of small farms while the US had more large farms As seen in Table 1 which documents the size of farms by acreage in California and the United States a majority (65) of California farms in 2012 were under 50 acres Only 39 of farms in the United States were under 50 acres At the other end of the spectrum 15 of United States farms were over 500 acres compared to 10 in California
While California farms tended to be smaller in terms of acreage Califorshynia has more high-value crops which generate more revenue per acre These high-value crops mean that California farms tend to have a higher market value of agricultural products sold The average market value of producshytion per acre of farmland in California was $1667 compared to $289 in the United States as a whole in 2012
Table 2 (on page 6) reports the size of farms in 2012 by their market value of production before taxes or production costs California had a larger percentage of farms with a large market value of production Over a quarter of California farms had a market value of producshytion over $100000 in comparison to 19 nationally On average farms in California had a market value of proshyduction a little under three times the national average $547510 for California and $187097 for the United States
Evolution of California Agriculture The census also allows for the evaluation of the development of California agriculture over time because it is conducted every five years Here we compare the market value of agricultural products sold and the acreage of farms in 2007 and in 2012 Census data show that over this time period the average market value of production of California farms increased by 31 This increase was due to both a reduction in the total number of farms in California and an increase in the number of farms with a large market value of production
California United States
Table 1 Farm Size by Acres California and the United States 2012
Acres Number of Farms
Percentage of Farms
Number of Farms
Percentage of Farms
1 to 9 acres 24637 32 223634 11
10 to 49 acres 25811 33 589549 28
50 to 179 acres 13056 17 634047 30
180 to 499 acres 6649 9 346038 16
500 to 999 acres 3230 4 142555 7
1000 to 1999 acres 2040 3 91273 4
2000 acres or more 2434 3 82207 4
Average AcreageFarm 328 434
Source 2012 Census of Agriculture
Giannini Foundation of Agricultural Economics bull University of California
The total number of California farms fell from 81033 in 2007 to 77857 in 2012 At the same time the number of farms in the largest range of market value of production $500000 or more increased from 8649 to 9564 These trends were also apparent nationally
Comparing the pie charts in Figure 1 California farms with a large market value of production increased their share of the total market value of proshyduction of all California farms Even though they are only about one-eighth of California farms those with a market value of production over $500000 proshyduced a substantial majority of the total market value of production of California farmsmdash92 in 2012 a slight increase from 90 in 2007 California farmsrsquo market value as well as the percentage
California United States
Table 2 Farm Size by Market Value of Agricultural Products Sold CA and the US 2012
Market Value Number of Farms
Percentage of Farms
Number of Farms
Percentage of Farms
Less than $2500 19347 25 665311 32
$2500 to $4999 5904 8 231388 11
$5000 to $9999 7846 10 248616 12
$10000 to $24999 10265 13 271511 13
$25000 to $49999 7150 9 161939 8
$50000 to $99999 6698 9 133988 6
$100000 to $499999 11083 14 237328 11
$500000 or more 9564 12 159222 8
Average Market ValueFarm $547510 $187097
Source 2012 Census of Agriculture
Figure 1 Share of Total California Agricultural Production by Farm Size Category 2007 and 2012
$500000 or more
$50000 to $499999
Under $50000
2007 2012
of total revenue produced by these higher market value farms increased
As mentioned earlier California has a significant number of small farms by acreage and also in market value of production The majority of farms in both years had a market value of production under $50000mdash57 in 2012 and 59 in 2007 as seen in Figure 2 There is considerable hetshyerogeneity within this category
Of the farms with a market value of production under $50000 38 were under $2500 in 2012 compared to 42 in 2007 In both 2007 and 2012 14 of the farms with a market value of producshytion under $50000 had a market value of production between $25000 and $49999 While there are many small farms they do not produce a large part
of the total market value of producshytion of all California farms Within the category of market value of production under $50000 these farms produced 15 of the total market value of all Calishyfornia farms in 2007 and 11 in 2012
Variation Across Crop Category The census reports the number of farms and acres by crop category This information allows analysis of the land allocated to and the number of farms producing a specific crop Here we report changes in farms with orchards and farms with vegetable and melon production The definitions used in the census are important for this analysis For a given crop category the number of farms is all farms that reported producing that crop and the acres are the cumulative acres reported for that category If a farm harvested two or more crops in different categories from the same land the acres and the farm itself were counted in each crop category However if two or more crops in the category Land Used for Vegetables (LUV) which includes all vegetables and melons were harvested from the same acreage then the census only counts the acres once Land in Orchards (LO) includes all acreage with fruit trees citrus or other groves vineyards and nut trees of nonbearing and bearing age regardless of whether or not it was harvested
Over the five years between 2007 and 2012 LUV and LO experienced opposite changes in farm size and number As exhibited in Figure 3 the number of farms with LUV increased by 57 while acres allocated for vegetables or melons increased only 2 in 2012 the farms tended to alloshycate less acres to this category than in 2007 The average acres allocated as LUV per farm decreased from 251 acres in 2007 to 163 acres in 2012
In contrast the acres allocated as LO per farm grew in size The number of farms with LO decreased by 4 while
6
Giannini Foundation of Agricultural Economics bull University of California
acres in LO increased by 10 from 2007 to 2012 This change resulted in an increase in the average acres of LO per farm from 72 acres in 2007 to 82 acres in 2012 or an increase of 13
County by County Variation The census provides data on a county level as well These data enable the comparison of trends on the county state and national level Here we link the statewide trend of smaller acreage allocation per farm in LUV to developments in major vegetable-producing counties Of the top ten counties in LUV by acreage only six experienced a decrease in the average allocation of acres to LUV Fresno Kern San Joaquin Merced Yolo and Santa Barbara
Table 3 (on page 8) illustrates that four of the top ten vegetable-producing counties in 2012 realized an increase in average vegetable acreage per farm Monterey Imperial Riverside and Venshytura In Monterey County the number of farms with LUV increased from 202 in 2007 to 210 in 2012 while the acres allocated as LUV increased from 163237 acres to 189 644 in that same time As the county with the largest acreage of LUV in 2012 and the second largshyest in 2007 Monterey realized a 12 increase in the acre allocation per farm
A similar trend was seen in Impeshyrial County in which the number of farms with LUV increased from 86 to 105 and the acres allocated increased
Figure 2 Share of Total California Farms by Level of Sales 2007 and 2012
Less than $50000
Less than $50000
2007
2012
$500000 or more
Under $50000
$50000 to $499999
$25000 to $49999
$10000 to $24999
$5000 to $9999
$2500 to $4999
Less than $2500
from 68970 acres to 105979 acres from 2007 to 2012 In 2012 Farms with LUV in Imperial County allocated 1009 acres on average per farm to vegetables or melons the largest across all Calishyfornia counties Imperial County had the third most acres in LUV in 2012 and the fourth most in 2007 Imperial Countyrsquos average allocation per farm increased 26 from 2007 to 2012
Conclusion The Census of Agriculture is an important tool for analysts the government businesses and the public It enables the analysis of production agriculturersquos evolution over time and the comparison of agriculture in different geographic regions The 2012 Census of Agriculture indicates that California agriculture remains distinct
Figure 3 California Farms with Land Used for Vegetables and Land in Orchards
4545 35 35 Number 4040 3030 of Farms
35 35
Vegetables
0
Orchards
2007 2012
Num
ber
of F
arm
s (1
000
)
Num
ber
of F
arm
s (1
000
)
25
Acr
es (1
000
00) 25
20
15
Acres
Acr
es (1
000
00)
30
25
20
30
25
20
20
15 1515
1010 1010
55 55
00 2007 2012
7
0
Giannini Foundation of Agricultural Economics bull University of California
County
Number of Farms with
Land Used for Vegetables
Land Used for
Vegetables (Acres)
Share of CA Land Used for
Vegetables
Average Land Used for
Vegetables per Farm
Table 3 Land Used for Vegetables in the Top Ten Counties by Acreage in California 2012 and 2007
2012 Monterey 210 189644 19 903
Fresno 564 166810 17 296
Imperial 105 105979 11 1009
Kern 167 84962 9 509
San Joaquin 193 52651 5 273
Merced 223 51119 5 229
Yolo 114 43449 4 381
Santa Barbara 222 40594 4 183
Riverside 155 30529 3 197
Ventura 106 25027 3 236
All other 3996 194971 20 49
California 6055 985735 163
2007 Fresno 559 186565 19 334
Monterey 202 163237 17 808
Kern 138 77362 8 561
Imperial 86 68970 7 802
San Joaquin 181 66652 7 368
Merced 176 58671 6 333
Yolo 96 48034 5 500
Santa Barbara 145 42436 4 293
Kings 53 28982 3 547
Ventura 118 24458 3 207
All Other 2114 203646 21 96
California 3868 969013 251
Source 2012 Census of Agriculture
Some counties such as Imperial and Monterey with some of the largest total acreage of LUV experienced an increase in their average acre allocation per farm Other counties such as Fresno Santa Barbara and Yolo experienced a decrease in their average acre allocation to LUV per farm similar to the state trend The 2012 Census of Agriculture confirms that the agricultural landscape of California is diverse and general trends do not hold for all commodities
Suggested Citation
Knoesen EC and RE Goodhue 2014 How California Farms Measure Up in the 2012 Census of Agriculture Smaller in Size with Higher Value of Production ARE Update 17(5)5-8 University of California Giannini Foundation of Agricultural Economics
Emma Knoesen is a student research associate in the Department of Agriculture and Resource Economics at UC Davis and a sophomore at Scripps College Rachael Goodhue is a professor in the ARE department at UC Davis and a member of the Giannini Foundation of Agricultural Economics She may be contacted at goodhueprimalucdavisedu
For additional information the authors recommend
2012 Census of Agriculture wwwagcensususdaorg Publications2012 The site includes expanded descriptions of methodology and information
from US agriculture as a whole although in both cases farms continue to grow larger in both acreage and market value of production California tended to be smaller on average by acres than the rest of the country yet continued to have farms with higher market value of production from high-value crops Though the total number of farms in California decreased from 2007 to 2012 the total market value of production of California farms increased by just over one-quarter
However the trend towards larger
farms was not universal across all farm typesmdashat least not when measured in acres LO followed the national as well as state trend with the avershyage acreage allocated by each farm to orchard production growing by 13 Land Used for Vegetable followed a different trend with a smaller acre allocation per farm producing vegshyetables and melons in 2012 than in 2007 The number of acres per farm with LUV decreased just over 35
However this trend was not conshysistent in every county in California
on other states as well as previous censuses
8
9 Giannini Foundation of Agricultural Economics bull University of California
Assessing Environmental Impacts of Genetically Modified Seeds in Brazilian Agriculture Renato Seixas and Joseacute Maria Silveira
Using a farm-level dataset on geneshytically modified (GM) seed adoption and pesticide application in Brazil we find that Insect Resistant (IR) cotton reduces the environmental impact of insecticides but Herbicide Tolerant (HT) soybeans increase the environshymental impact of herbicides due to weak substitution among herbicides of different toxicity levels
Genetically modified (GM) seeds have been considered one of the major technological
innovations for agricultural systems and have been promoted as an effecshytive tool for controlling agricultural pests and expanding food supply Their relevance can also be measured by the wide span of controversial issues that have been raised by the related litshyerature such as intellectual property rights over organisms productivity effects economic returns consumer safety welfare and income distribushytion and environmental effects
On the environmental front benshyefits from adoption of GM seeds have been argued based on findings about pesticide use and agricultural pracshytices Insect Resistant (IR) cotton has been found to reduce the use of insecticides and therefore produce environmental health and safety gains Herbicide Tolerant (HT) soyshybeans have been found to change the mix of herbicides applied towards less toxic chemicals and to allow the use
of no-till cultivation techniques leadshying researchers to conclude that they also produce environmental benefits
This article addresses the envishyronmental impacts associated with pesticides use resulting from adopshytion of GM seeds in Brazil We innoshyvate relative to previous works on this topic by employing a broader measure of environmental impact that takes into account toxicity levels and risk of exposure in evaluating the effects of pesticides for different dimensions of agricultural systems Hence we are able to uncover envishyronmental impacts that have been hidden by the qualitative nature of the change in the mix of pesticides used
GM Seeds and Pesticides Use Since the mid 1990s when first-genshyeration GM seeds were commercially introduced adoption by farmers has grown steadily in industrialized and developing countries as they provide an alternative and more convenient way of controlling pest damage By 2008 133 million farmers dedicated 8 of total cropland (125 million ha) to the cultivation of GM seeds The leading countries in terms of share of cultivated area in 2009 were the United States (50) Argenshytina (17) Brazil (13) India (6) Canada (6) and China (3)
In Brazil the most recent nationwide survey on agricultural biotechnology adoption indicates that GM seeds acshycount for 918 (274 million ha) of soybean cultivated area 816 (124 million ha) of maize and 65 (071 million ha) of cotton-cultivated area The main traits that have been introshyduced in first-generation GM seeds correspond to HT and IR technologies
The focus of this article relies on HT soybeans and IR cotton
IR seeds are engineered to produce a natural toxin found in the soil bacterium Bacillus thuringiensis (Bt) which is lethal to a number of bollworm pests but not to mammals In other words the IR trait works as a substitute for insecticides that control bollworm infestations IR crops have been considered technically and economically efficient for producers allowing savings in labor and machinery used in insecticide applications This potential is higher in regions with high infestationsmdash typically less-developed countries in tropical weather regions with high rates of insecticide use Besides it has also been considered a more efficient tool for managing risk of pest attack allowing reduced expenditure on crop insurance The result in terms of the outcome of interest is straightforward less insecticide usage reduces associated environmental impact
Weeds are strong competitors with soybean plants for nutrients water and sunlight Weed control techniques have evolved from traditional mechanishycal methods to herbicide applications which were introduced in the 1960rsquos Soybean seeds engineered with HT traits were introduced in 1996 under the commercial name Roundup Readyreg They are the result of the transfer of part of the genetic code of a soil bacshyterium Agrobacterium tumefaciens which allows the plant to metabolize the herbicide glyphosate (Roundup) In 1998 soybean varieties tolerant to the herbicide glufosinate were introshyduced under the commercial name Liberty Linkreg These herbicides are considered less toxic than others and
Giannini Foundation of Agricultural Economics bull University of California
Insecticies (Kgha)
Insecticides +
(EIQ) Herbicides
(Kgha) Herbicides+
(EIQ)
Table 1 Estimates of Impact of IR Cotton and HT Soybeans on Quantity of Pesticides (Insecticides and Herbicides) and Environmental Impact (EIQ)
IR Cotton -0242 -0234 - -[0037] [0035] - -
HT Soybean - - 0442 0356
- - [0056] [0049]
N 120 120 170 170
r2 0913 0918 0755 0790 + Robust standard errors p lt 005 p lt 001 p lt 0001
Coefficients multiplied by 100 indicate approximate percentage variation
target a large variety of broad-leaf and grass weeds species but cause severe damage to conventional crops when applied after germination
By making the soybean plant less susceptible to damage caused by those chemicals the HT trait induces farmers to apply more of them The resulting environmental impact is ambiguous though farmers are induced to apply more of less toxic herbicides but the net effect depends on how much they substitute for more toxic ones Hence increasing the share of less toxic hershybicides in the quantity of pesticides applied is not enough to guarantee a reduction in environmental impacts associated with these chemicals
This discussion suggests that meashysuring environmental impacts associshyated with pesticide use is not straightshyforward For HT traits specifically the net effect on environmental impact is an open issue Economists who studied it have focused on the change in the mix
of herbicides to conclude that there are environmental gains allowed by the use of HT traits Nevertheless we argue that weak substitution might undermine this conclusion as we show in the analyshysis that follows on the next section
Empirical Strategy In the empirical analysis we use a unique farm-level dataset originated from a survey conducted by a private firm in Brazil The survey collected data on production revenue costs biotechnology adoption and pestishycides used Information on pesticide use was collected for harvest seasons 2009ndash2011 and covers 839 farms
The dataset is disaggregated by fields within a farm cultivated with conventional or GM seeds In other words for each farm we have potenshytially multiple observations related to fields cultivated with conventional or GM seeds This setup allows us to use within-farm variation for farmers
Table 2 Estimates of Effects of HT Trait on Quantity of Herbicides per Toxicity Level
Herbicides 1 (Kgha)
Herbicides 2 (Kgha)
Herbicides 3 (Kgha)
Herbicides 4 (Kgha)
HT Trait -0084 -0005 0635 0438
[0021] [0054] [0098] [0090]
N 168 168 168 168
r2 0887 0777 0855 0845
Robust standard errors in brackets p lt 005 p lt 001 p lt 0001
Note toxicity levels 1-4 in decreasing order (from more to less toxic) Herbicides based on glyphosate are considered of lower toxicity level
who plant both conventional and GM seeds to identify the effect of adopshytion on the environmental impact of pesticides This empirical strategy holds constant all farm-level characshyteristics that might simultaneously affect the choices of pesticide use and biotechnology adoption such as management skills inputoutput prices location weather shocks etc
The farms surveyed represent large operations with potentially large envishyronmental impacts associated with the scale of production and pesticide use For cotton growers the average total planted area is 2521 ha ranging from 60 ha to 28374 ha For soybean growshyers the average total planted area is 1240 ha ranging from 8 ha to 13500 ha In terms of experience farmers report an average of 224 and 294 years for cotton and soybeans respectively
We measure the environment impact as two outcome variables quantity (Kgha) of active ingredients of chemishycals and the Environmental Impact Quotient (EIQ) index This measure of environmental impact of pesticides was designed to capture risks associshyated with both toxicity levels and exposhysure to chemical pesticides on three components of agricultural systems farmworker consumer and ecological Hence the EIQ index provides a more complete picture than just the comshyposition of the mix of pesticides used allowing for an adequate weighting of pesticides with different toxicity levels
The use of the EIQ index represents a big advancement over previous studshyies which relied on an increased share of less toxic chemicals of the total quanshytity (Kgha) of herbicides applied in HT soybeans fields since this measure cannot capture environmental effects due to substitution between herbicides If the increase in the use of less toxic herbicides is not accompanied by a sufshyficient decrease in more toxic ones the new mix of herbicides induced by HT seeds can be more harmful than the one
10
11 Giannini Foundation of Agricultural Economics bull University of California
induced by conventional seeds The EIQ index calculated for field operations allows us to adequately weight pestishycides of different toxicity levels and gets around the difficulties of looking only at the quantity mix of pesticides used
Findings Our findings are summarized in Table 1 The dependent variables are logs of quantity (Kgha) of pesticides and of the EIQ index The indepenshydent variable of interest is a dummy indicator for adoption of IR cotton or HT soybeans Results show that adopshytion of IR cotton reduces the amount of active ingredients of insecticides used by 242 and the environmental impact index by 234 when compared with fields cultivated with conventional seeds In absolute terms this is equivashylent to a reduction of approximately 0956 Kgha of active ingredients
For HT soybeans although farmshyers use more of less toxic herbicides we estimate that the net environmenshytal impact is higher than for convenshytional seeds We find that adoption of HT seeds causes an increase of 442 of active ingredients (Kgha) and a corresponding 356 increase in the EIQ index when compared with fields cultivated with conshyventional seeds In absolute terms this corresponds to an increase of 0996 Kgha of active ingredients
Table 2 sheds light on the mechashynism that drives the results for HT soyshybeans It shows estimates of the impact of HT seeds on the quantity of active ingredients (Kgha) of herbicides of difshyferent toxicity levels The reductions in higher toxicity herbicides (columns 1 and 2) are very modest when comshypared to the increases in lower toxicity ones (columns 3 and 4) In absolute terms we estimate that the increase in the later is twelvefold the decrease in the former This result indicates that weak substitution among herbishycides of different toxicity levels causes
a net increase in the environmental impact associated with herbicides
Our results confirm the environshymental gains from IR cotton but suggest that the prior findings on the environshymental effects of HT soybeans have been misled by relying solely on the change in the mix of herbicides used
Conclusions In this article we analyze the envishyronmental effects related to the use of pesticides arising from adoption of IR cotton and HT soybean seeds Using within-farm variation across fields treated with conventional and GM seeds we find that IR cotton reduces the amount of insecticides applied to cotton crops HT soybeans on the other hand leads to more use of herbicides
Analysis using the EIQ index shows that IR cotton reduces the envishyronmental impact by about 23 in the treated fields compared to fields cultivated with conventional seeds This is consistent with the previous result on Kgha of insecticides and confirms the environmental impact-saving nature of the IR technology The resulting environmental effects for HT soybeans on the other hand are found to be negative The estimates imply that the impact of herbicides is increased by 356 compared to fields cultivated with conventional seeds
Looking at quantities of herbicides of different toxicity levels we see increases in the use of lower toxicity herbicides and very small reductions in higher toxicity ones This findshying indicates very weak substitution among herbicides which explains the higher environmental impact associshyated with these chemicals caused by adoption of HT soybeans
We believe this to be an imporshytant result for three reasons First it contributes to uncover environmental effects that have been hidden by the qualitative nature of the mix of herbishycides induced by the HT trait Second
environmental policy makers designshying policies for biotechnology adopshytion might consider this new evidence to differentiate among GM traits that produce positive or negative externalishyties Finally as the composition of the EIQ index suggests the environmental impact of pesticides can have multiple dimensions that might involve farmshyworker health and safety consumer safety and ecological impacts Hence the results on HT soybeans suggest additional avenues of work that should be taken to evaluate each of these possible channels since they can also affect other important outcomes
Suggested Citation
Seixas Renato and Joseacute Maria Silveira 2014 Assessing Environmental Impacts of Genetically Modified Seeds in Brazilian Agriculture ARE Update 17(5)9ndash11 University of California Giannini Foundation of Agricultural Economics
Renato Seixas is a PhD candidate in the ARE department at University of California Berkeley He can be contacted by email at rnlseixas berkeleyedu Joseacute Maria Silveira is a professor in the State University of Campinas Institute of Economics in Brazil This article is based on the paper ldquoMore of Less Isnrsquot Less of More Assessing Environmental Impacts of Genetically Modified Seeds in Brazilian Agriculturerdquo Financial support from CAPESFulbright PhD fellowship (grant 2256-08-8) is greatly acknowledged
For additional information the authors recommend
Celeres 2014 Biotech Newsletter Celeres Uberlacircndia (MG) Retrieved from wwwcelerescombr
Kovach J C Petzoldt J Degnil and J Tette 1992 ldquoA Method to Measure the Environmental Impact of Pesticidesrdquo Ithaca NY New York State Agricultural Experiment Station a division of the New York State College of Agriculture and Life Sciences Cornell University
Qaim M 2009 ldquoThe Economics of Genetically Modified Cropsrdquo Annual Review of Resource Economics 1 665 - 694 wwwannualreviews orgdoiabs101146annurev resource050708144203
Department of Agricultural and Resource Economics UC Davis One Shields Avenue Davis CA 95616 GPBS
Agricultural and Resource Economics
UPDATE
Co-Editors
Richard Sexton Sofia Berto Villas-Boas
David Zilberman
Managing Editor and Desktop Publisher
Julie McNamara
Published by the Giannini Foundation of Agricultural Economics
httpgianniniucopedu
ARE Update is published six times per year by the Giannini Foundation of Agricultural Economics University of California
Domestic subscriptions are available free of charge to interested parties To subscribe to ARE Update by mail contact
Julie McNamara Outreach Coordinator Giannini Foundation of Agricultural Economics Department of Agricultural and Resource Economics University of California One Shields Avenue Davis CA 95616 E-mail julieprimalucdavisedu Phone 530-752-5346
To receive notification when new issues of the ARE Update are available online submit an e-mail request to join our listserv to
julieprimalucdavisedu
Articles published herein may be reprinted in their entirety with the authorrsquos or editorsrsquo permission Please credit the Giannini Foundation of Agricultural
Economics University of California
ARE Update is available online httpgianniniucopeduare-update
The University of California is an Equal OpportunityAffirmative Action employer
Giannini Foundation of Agricultural Economics bull University of California
Table 1 Powdery Mildew Costs
Annual Costs Attributed to PM as a Share of
PM Cost
Cultural Costs
Cash Costs
Total Costs
$acre ------------------percent--------------shy
Raisin Grapes
Continuous Tray 222 87 46 34
Tray 222 124 69 45
DOV Open Gable 222 163 84 46
DOV Overhead Trellis 222 163 83 46
Wine Grapes
Central Coast Chardonnay 369 196 124 77
Table Grapes
Crimson Seedless 329 89 24 21
In the table grape and raisin marshykets traditional varietal names are not as important but the potential for market acceptance of transgenic varieties remains uncertain As with conventionshyally bred PM-resistant vines transshygenic PM-resistant vines might attract a premium from some buyers because they will require much less pesticide
Measures of Costs and Benefits The introduction and adoption of PM-resistant grapevines will reduce the use of chemical treatments to mitigate PM impacts To better understand how the reduction in chemical use would translate into potential cost savings
we constructed budgets for hypothetishycal ldquorepresentativerdquo vineyards using updated and revised versions of Univershysity of California Cooperative Extenshysion (UCCE) Cost Studies Our budgets show costs of grape production using conventional and PM-resistant vines for each of the three different types of grapes (table raisin and wine)
To validate the budgets we created we discussed them with experts on each type of grape production system in the regions of interest This group included extension advisors pest control advishysors academics and other researchshyers This budget validation process was necessitated by the age of some
Elements of Savings in Cultural Costs per Acre Total
Area 2011
Maximum Aggregate
Benefit Labor Fuel Lube and Repair Materials Total
Table 2 Saving in Costs per Acre and per Region from Adopting PM-Resistant Vines
------------$AcreYear-------------shy Acres $MYear
Raisin Grapes
Continuous Tray 25 17 137 178 88155 157
Tray 25 16 137 177 58770 104
DOV Open Gable 42 30 137 208 24487 51
DOV Overhead Trellis 43 31 137 211 24487 52
Total All Raisins 29 20 137 186 195899 364
Wine Grapes
Central Coast Chardonnay
43 47 190 280 26804 75
Table Grapes
Crimson Seedless 77 51 159 287 12950 37
of the UCCE budgets and our specific interest in PM management costs
Grape Types
Grapes produced in California fall into three main categories wine grapes table grapes and raisin grapes These three categories make up an industry that contributed over $38 billion to the value of Californiarsquos farm producshytion in 2011 and much more in terms of total value Because resources availshyable for the project were limited we created budgets only for certain varishyeties and regions within each grape type chosen to represent the parts of each industry most affected by PM
Table Grapes Of the available table grape varieties we chose to profile Crimson Seedless grapesmdashthe most widely planted in terms of acreage
Raisin Grapes We created budgets for the four predominant types of raisin grape production systems conshytinuous tray-dried in which grapes are mechanically harvested and dried on a continuous paper tray between rows traditional tray-dried in which bunches of ripe grapes are hand-cut and placed to dry in the sun on rows of individual paper trays and two types of dried-on-the-vine raisin proshyduction systems in which specially designed trellis systems allow machines to harvest already dried raisins
Wine Grapes Because of the great diversity in wine grape growing pracshytices and market characteristics we opted to focus on the variety that is most affected by PM chardonnay which is also the most economically important white wine variety We also opted to focus on a single region the Central Coast (crush districts 7 and 8) where PM pressures are most severe
Vineyard-Level Benefits
In most cases grape yield is typically not affected by the disease since PM can be preventively controlled with a variety of fungicides However the fungicides
2
3 Giannini Foundation of Agricultural Economics bull University of California
and the costs of applying them entail significant outlays for growers The combined cost of fungicide materishyals and their application amounts to between 87 of cultural costs for both continuous tray-dried raisin grapes and crimson seedless table grapes and 196 for Central Coast chardonnay wine grapes As a share of total cost of grape production PM treatments account for about 2 for Crimson Seedshyless table grapes and 8 for Central Coast chardonnay wine grapes (Table 1)
Table 2 shows differences in specific costs of productionmdashlabor materishyals and other costsmdashbetween various wine grape production systems using conventional and resistant grapes The difference in cost between the convenshytional and the resistant system does not simply equal the current cost of PM treatments Ending sulfur treatments may result in an erineum mite infestashytion so we assume a wettable sulfur treatment would be retained to treat the mites Additionally some non-PM treatments are typically applied along with PM treatments so the labor and fuel lube and tractor repair costs must be attributed to the non-PM treatshyments in full and can not be eliminated by adopting the resistant varieties
Cost savings from growing resisshytant vines versus conventional vary widely over types of grapes being produced Total annual cost savshyings range from $177 per acre in the case of traditional tray-dried raisin production up to $287 per acre for Crimson Seedless table grapes
Market-Level Benefits
We now scale up from the per-acre effects for ldquorepresentative vineyardsrdquo to area-wide effects for the regions we have selected the Central Coast for chardonshynay wine grapes and the San Joaquin Valley for Crimson Seedless table grapes and all types of raisin grapes Table 2 presents regional acreage and the total cost savings by production system if
Table 3 Total Present Value of Benefits from Adoption of PM-Resistant Varieties
Maximum Adoption Rate (A)
Lag (L+3 Years) 10 20 30 40
percent ---------------$ Millions-------------------shy
Raisins All Types
20 378 281 209 156
60 1134 844 628 467
100 1890 1406 1046 779
Wine Grapes Central Coast Chardonnay
20 78 58 43 32
60 234 174 129 96
100 389 290 216 160
Table Grapes Crimson Seedless
20 39 29 21 16
60 116 86 64 48
100 193 144 107 79
all growers in the region were to adopt a new resistant variety immediately
The largest total potential impact is in raisin grapes which would save $364 million per year if all growers converted all the acreagemdash195899 acres in the San Joaquin Valley in 2011mdashto PM-resistant varieties immediately The correspondshying annual cost savings for Central Coast chardonnay is $75 million (on 26804 acresmdashless than one-fifth that of raisins) and for Crimson Seedless it is $37 million (a high per-acre cost reducshytion of $287 per acre per year applied to a comparatively small total acreage of 12950 acres in 2011)
However a scenario in which resisshytant varieties become available immedishyately and all growers immediately adopt them is extremely unlikely In reality these new varieties will not become available for some time and if growshyers do adopt them they are likely to do so when the vines they currently have in the ground come to the end of their productive lifespans and have to be replaced anyway Hence we allow for various lags until vines become availshyable as well as various adoption rates
We also assume that once the vines become available adoption will increase slowly until it reaches its
maximum 20 years later Additionshyally growers typically do not begin to apply PM controls until the third year after planting so benefits will not be felt until three years after the RampD lag is over and adoption begins
Table 3 shows benefits from the resistant varieties over an infinite time horizon for different adoption rates (denoted A percent) and difshyferent lags (denoted L years) until the new varieties become available to growers Raisin grapes are likely to have the shortest lag as those resistant varieties are nearly fully developed a ten year RampD lag is possible for that category whereas resistant varieties of wine and table grapes could take significantly longer to be developed and become available to growers
The range of estimated benefits is substantial The present value of the benefit from PM-resistant vines for raisins ranges from as low as $156 million if the resistant vines become available in 40 years and are adopted by 20 of growers up to $189 million if they become available in 10 years and are adopted by 100 of growers The present value of the total benefits from PM-resistant vines ranges from $32 to $389 million
Giannini Foundation of Agricultural Economics bull University of California
for Central Coast chardonnay wine grapes and from $16 to $193 million for Crimson Seedless table grapes
Environmental Benefits
The availability and adoption of PM-resistant varieties would entail envishyronmental benefits as well Fuel lube and repair costs are a measure of tractor use Since tractors emit carbon dioxshyide fine particulate matter (PM 25) and a host of other pollutants curbing their use has been a topic of increasing conversation in the San Joaquin Valley where table and raisin grapes are grown and where air quality has become an issue of concern in recent years
Table 2 shows differences in fuel lube and repair costs that range from $16 per acre for traditional tray-dried raisin grape production to $51 per acre for Crimson Seedless table grapes The implication is that PM-resistant varieties would allow some reduction in vineyard operations with an attenshydant decrease in ambient pollution
The reduction in applications of chemical fungicides may also yield benshyefits to the environment and human health although much is unknown about these effects Sulfur the most heavily used agricultural chemical in California may cause respiratory illnesses and other adverse health effects However the kinds of respirashytory effects induced and what types of exposure cause them are unknown In soil bacteria slowly convert sulfur to sulfate which generally does not cause harm Other (relatively new) synthetic compounds used for PM treatshyment and prevention such as sterol inhibitors and strobilurns have not been reported as having negative envishyronmental or human health effects
Because of the large volume and frequency of applications controlling for PM results in the bulk of the envishyronmental impact from grape producshytion even though the fungicides used for PM control are less toxic to both
humans and the environment than many other pesticides The reduction of these environmental and human health costs is one of the benefits from growing PM-resistant varieties
Several measures of pesticide risk are available to examine the environmental impact of PM management These meashysures include the Environmental Impact Quotient (EIQ) which combines pestishycide hazards to farm workers consumers and the environment and the Pesticide Use Risk Evaluation (PURE) which is a California-specific index that quantishyfies the environmental risk to soil surshyface water ground water air and bees Using either measure sulfur accounts for a large share of environmental risk Environmental benefits from eliminatshying PM-related fungicide applications would accrue primarily to workers (reduced potential health risks) and through reduced harm to bees and soil
Conclusion Powdery mildew is a common disease that imposes large economic costs on California grape growers PM-resistant varieties of grapes could yield large economic benefits to grape producshyers in Californiamdashpotentially as high as $48 million per year in the subset of the industry covered by our analyshysismdashacross wine table and raisin grape-producing sectors Our estishymates of the cost savings attributable to PM-resistant varieties range widely across the different grape production systems with the greatest potential in the raisin grape industry Within a system the benefits are quite sensitive both to the RampD lag until the resistant varieties become available for adoption and to the maximum adoption rate
The measures of potential cost savshyings we present here represent only part of the economic picture for two reasons First they count only part of the potential cost savings We estimate only private cost savings for certain regions and do not include benefits
from reduced pesticide use or benefits for wine grapes other than chardonnay produced in the Central Coast region
On the other hand we have implicshyitly assumed prices of grapes grown using PM-resistant varieties would be the same as prices for grapes from the conventional varieties they would replace Grapes produced using nonshyvinifera or transgenic vines might well suffer a price discount compared with conventional alternatives and if the price discount is greater than the cost savings from resistance then it will not make economic sense for growers to adopt them Even if it is not prohibitive any price discount will offset the benshyefits from cost savings to some extent
Suggested Citation
Fuller KB JM Alston and OS Sambucci 2014 The Value of Powdery Mildew Resistance in Grapes Evidence from California ARE Update 17(5)1ndash4 University of California Giannini Foundation of Agricultural Economics
Kate Fuller is an assistant professorextension specialist in the Department of Agricultural Economics and Economics at Montana State University She can be reached at katefuller montanaedu Julian Alston is a professor in the ARE department and Director of the Robert Mondavi Institute Center for Wine Economics at UC Davis Olena Sambucci is a PhD candidate in the ARE department at UC Davis
For additional information the authors recommend
Fuller KB JM Alston and OS Sambucci 2014 ldquoThe Value of Powdery Mildew Resistance in Grapes Evidence from Californiardquo Robert Mondavi Institute Center for Wine Economics Working Paper 1401 httpvineconucdavis edupublicationscwe1401pdf
Davis RM WD Gubler and ST Koike 2008 ldquoPowdery Mildew on Vegetablesrdquo wwwipmucdavisedu PMGPESTNOTESpn7406html
University of California Cooperative Extension 2000ndash2011 Cost and Return Studies http coststudiesucdavisedu
4
5 Giannini Foundation of Agricultural Economics bull University of California
How California Farms Measure Up in the 2012 Census of Agriculture Smaller in Size with Higher Value of Production Emma C Knoesen and Rachael E Goodhue
The 2012 Census of Agriculture was released in early May 2014 Average farm size continues to grow in terms of acreage and market value of production However this trend is not universal across crop category or geographic region For the crop category of Land Used for Vegetables the average acreage allocation per farm reporting production in this category decreased while certain counties in California experienced an increase in the average acre allocation
Conducting an agriculture census has been a longstanding activshyity of the federal government
The 2012 Census of Agriculture was the twenty-eighth US agriculture census The first agriculture census was in 1840 and a new one has been conshyducted every five years since 1920 The aim of the census is to provide detailed information on US farms and ranches and their operators to the public busishynesses the government and analysts The census summarizes information at the national state and county levels Some information is not reported pubshylicly in order to maintain confidentialshyity regarding individual operations
The Census of Agriculture enables the comparison of California agriculture to US agriculture The 2012 census indicates that differences between the two regarding farm size by acreage and market value of agricultural products were consistent with the differences reported in 2007 and earlier recent
censuses We focus here on comparshying these characteristics in 2012
California had smaller farms on average by acreage with an avershyage farm size of 328 acres while the United States had an average of 434 acres Overall California had a larger percentage of small farms while the US had more large farms As seen in Table 1 which documents the size of farms by acreage in California and the United States a majority (65) of California farms in 2012 were under 50 acres Only 39 of farms in the United States were under 50 acres At the other end of the spectrum 15 of United States farms were over 500 acres compared to 10 in California
While California farms tended to be smaller in terms of acreage Califorshynia has more high-value crops which generate more revenue per acre These high-value crops mean that California farms tend to have a higher market value of agricultural products sold The average market value of producshytion per acre of farmland in California was $1667 compared to $289 in the United States as a whole in 2012
Table 2 (on page 6) reports the size of farms in 2012 by their market value of production before taxes or production costs California had a larger percentage of farms with a large market value of production Over a quarter of California farms had a market value of producshytion over $100000 in comparison to 19 nationally On average farms in California had a market value of proshyduction a little under three times the national average $547510 for California and $187097 for the United States
Evolution of California Agriculture The census also allows for the evaluation of the development of California agriculture over time because it is conducted every five years Here we compare the market value of agricultural products sold and the acreage of farms in 2007 and in 2012 Census data show that over this time period the average market value of production of California farms increased by 31 This increase was due to both a reduction in the total number of farms in California and an increase in the number of farms with a large market value of production
California United States
Table 1 Farm Size by Acres California and the United States 2012
Acres Number of Farms
Percentage of Farms
Number of Farms
Percentage of Farms
1 to 9 acres 24637 32 223634 11
10 to 49 acres 25811 33 589549 28
50 to 179 acres 13056 17 634047 30
180 to 499 acres 6649 9 346038 16
500 to 999 acres 3230 4 142555 7
1000 to 1999 acres 2040 3 91273 4
2000 acres or more 2434 3 82207 4
Average AcreageFarm 328 434
Source 2012 Census of Agriculture
Giannini Foundation of Agricultural Economics bull University of California
The total number of California farms fell from 81033 in 2007 to 77857 in 2012 At the same time the number of farms in the largest range of market value of production $500000 or more increased from 8649 to 9564 These trends were also apparent nationally
Comparing the pie charts in Figure 1 California farms with a large market value of production increased their share of the total market value of proshyduction of all California farms Even though they are only about one-eighth of California farms those with a market value of production over $500000 proshyduced a substantial majority of the total market value of production of California farmsmdash92 in 2012 a slight increase from 90 in 2007 California farmsrsquo market value as well as the percentage
California United States
Table 2 Farm Size by Market Value of Agricultural Products Sold CA and the US 2012
Market Value Number of Farms
Percentage of Farms
Number of Farms
Percentage of Farms
Less than $2500 19347 25 665311 32
$2500 to $4999 5904 8 231388 11
$5000 to $9999 7846 10 248616 12
$10000 to $24999 10265 13 271511 13
$25000 to $49999 7150 9 161939 8
$50000 to $99999 6698 9 133988 6
$100000 to $499999 11083 14 237328 11
$500000 or more 9564 12 159222 8
Average Market ValueFarm $547510 $187097
Source 2012 Census of Agriculture
Figure 1 Share of Total California Agricultural Production by Farm Size Category 2007 and 2012
$500000 or more
$50000 to $499999
Under $50000
2007 2012
of total revenue produced by these higher market value farms increased
As mentioned earlier California has a significant number of small farms by acreage and also in market value of production The majority of farms in both years had a market value of production under $50000mdash57 in 2012 and 59 in 2007 as seen in Figure 2 There is considerable hetshyerogeneity within this category
Of the farms with a market value of production under $50000 38 were under $2500 in 2012 compared to 42 in 2007 In both 2007 and 2012 14 of the farms with a market value of producshytion under $50000 had a market value of production between $25000 and $49999 While there are many small farms they do not produce a large part
of the total market value of producshytion of all California farms Within the category of market value of production under $50000 these farms produced 15 of the total market value of all Calishyfornia farms in 2007 and 11 in 2012
Variation Across Crop Category The census reports the number of farms and acres by crop category This information allows analysis of the land allocated to and the number of farms producing a specific crop Here we report changes in farms with orchards and farms with vegetable and melon production The definitions used in the census are important for this analysis For a given crop category the number of farms is all farms that reported producing that crop and the acres are the cumulative acres reported for that category If a farm harvested two or more crops in different categories from the same land the acres and the farm itself were counted in each crop category However if two or more crops in the category Land Used for Vegetables (LUV) which includes all vegetables and melons were harvested from the same acreage then the census only counts the acres once Land in Orchards (LO) includes all acreage with fruit trees citrus or other groves vineyards and nut trees of nonbearing and bearing age regardless of whether or not it was harvested
Over the five years between 2007 and 2012 LUV and LO experienced opposite changes in farm size and number As exhibited in Figure 3 the number of farms with LUV increased by 57 while acres allocated for vegetables or melons increased only 2 in 2012 the farms tended to alloshycate less acres to this category than in 2007 The average acres allocated as LUV per farm decreased from 251 acres in 2007 to 163 acres in 2012
In contrast the acres allocated as LO per farm grew in size The number of farms with LO decreased by 4 while
6
Giannini Foundation of Agricultural Economics bull University of California
acres in LO increased by 10 from 2007 to 2012 This change resulted in an increase in the average acres of LO per farm from 72 acres in 2007 to 82 acres in 2012 or an increase of 13
County by County Variation The census provides data on a county level as well These data enable the comparison of trends on the county state and national level Here we link the statewide trend of smaller acreage allocation per farm in LUV to developments in major vegetable-producing counties Of the top ten counties in LUV by acreage only six experienced a decrease in the average allocation of acres to LUV Fresno Kern San Joaquin Merced Yolo and Santa Barbara
Table 3 (on page 8) illustrates that four of the top ten vegetable-producing counties in 2012 realized an increase in average vegetable acreage per farm Monterey Imperial Riverside and Venshytura In Monterey County the number of farms with LUV increased from 202 in 2007 to 210 in 2012 while the acres allocated as LUV increased from 163237 acres to 189 644 in that same time As the county with the largest acreage of LUV in 2012 and the second largshyest in 2007 Monterey realized a 12 increase in the acre allocation per farm
A similar trend was seen in Impeshyrial County in which the number of farms with LUV increased from 86 to 105 and the acres allocated increased
Figure 2 Share of Total California Farms by Level of Sales 2007 and 2012
Less than $50000
Less than $50000
2007
2012
$500000 or more
Under $50000
$50000 to $499999
$25000 to $49999
$10000 to $24999
$5000 to $9999
$2500 to $4999
Less than $2500
from 68970 acres to 105979 acres from 2007 to 2012 In 2012 Farms with LUV in Imperial County allocated 1009 acres on average per farm to vegetables or melons the largest across all Calishyfornia counties Imperial County had the third most acres in LUV in 2012 and the fourth most in 2007 Imperial Countyrsquos average allocation per farm increased 26 from 2007 to 2012
Conclusion The Census of Agriculture is an important tool for analysts the government businesses and the public It enables the analysis of production agriculturersquos evolution over time and the comparison of agriculture in different geographic regions The 2012 Census of Agriculture indicates that California agriculture remains distinct
Figure 3 California Farms with Land Used for Vegetables and Land in Orchards
4545 35 35 Number 4040 3030 of Farms
35 35
Vegetables
0
Orchards
2007 2012
Num
ber
of F
arm
s (1
000
)
Num
ber
of F
arm
s (1
000
)
25
Acr
es (1
000
00) 25
20
15
Acres
Acr
es (1
000
00)
30
25
20
30
25
20
20
15 1515
1010 1010
55 55
00 2007 2012
7
0
Giannini Foundation of Agricultural Economics bull University of California
County
Number of Farms with
Land Used for Vegetables
Land Used for
Vegetables (Acres)
Share of CA Land Used for
Vegetables
Average Land Used for
Vegetables per Farm
Table 3 Land Used for Vegetables in the Top Ten Counties by Acreage in California 2012 and 2007
2012 Monterey 210 189644 19 903
Fresno 564 166810 17 296
Imperial 105 105979 11 1009
Kern 167 84962 9 509
San Joaquin 193 52651 5 273
Merced 223 51119 5 229
Yolo 114 43449 4 381
Santa Barbara 222 40594 4 183
Riverside 155 30529 3 197
Ventura 106 25027 3 236
All other 3996 194971 20 49
California 6055 985735 163
2007 Fresno 559 186565 19 334
Monterey 202 163237 17 808
Kern 138 77362 8 561
Imperial 86 68970 7 802
San Joaquin 181 66652 7 368
Merced 176 58671 6 333
Yolo 96 48034 5 500
Santa Barbara 145 42436 4 293
Kings 53 28982 3 547
Ventura 118 24458 3 207
All Other 2114 203646 21 96
California 3868 969013 251
Source 2012 Census of Agriculture
Some counties such as Imperial and Monterey with some of the largest total acreage of LUV experienced an increase in their average acre allocation per farm Other counties such as Fresno Santa Barbara and Yolo experienced a decrease in their average acre allocation to LUV per farm similar to the state trend The 2012 Census of Agriculture confirms that the agricultural landscape of California is diverse and general trends do not hold for all commodities
Suggested Citation
Knoesen EC and RE Goodhue 2014 How California Farms Measure Up in the 2012 Census of Agriculture Smaller in Size with Higher Value of Production ARE Update 17(5)5-8 University of California Giannini Foundation of Agricultural Economics
Emma Knoesen is a student research associate in the Department of Agriculture and Resource Economics at UC Davis and a sophomore at Scripps College Rachael Goodhue is a professor in the ARE department at UC Davis and a member of the Giannini Foundation of Agricultural Economics She may be contacted at goodhueprimalucdavisedu
For additional information the authors recommend
2012 Census of Agriculture wwwagcensususdaorg Publications2012 The site includes expanded descriptions of methodology and information
from US agriculture as a whole although in both cases farms continue to grow larger in both acreage and market value of production California tended to be smaller on average by acres than the rest of the country yet continued to have farms with higher market value of production from high-value crops Though the total number of farms in California decreased from 2007 to 2012 the total market value of production of California farms increased by just over one-quarter
However the trend towards larger
farms was not universal across all farm typesmdashat least not when measured in acres LO followed the national as well as state trend with the avershyage acreage allocated by each farm to orchard production growing by 13 Land Used for Vegetable followed a different trend with a smaller acre allocation per farm producing vegshyetables and melons in 2012 than in 2007 The number of acres per farm with LUV decreased just over 35
However this trend was not conshysistent in every county in California
on other states as well as previous censuses
8
9 Giannini Foundation of Agricultural Economics bull University of California
Assessing Environmental Impacts of Genetically Modified Seeds in Brazilian Agriculture Renato Seixas and Joseacute Maria Silveira
Using a farm-level dataset on geneshytically modified (GM) seed adoption and pesticide application in Brazil we find that Insect Resistant (IR) cotton reduces the environmental impact of insecticides but Herbicide Tolerant (HT) soybeans increase the environshymental impact of herbicides due to weak substitution among herbicides of different toxicity levels
Genetically modified (GM) seeds have been considered one of the major technological
innovations for agricultural systems and have been promoted as an effecshytive tool for controlling agricultural pests and expanding food supply Their relevance can also be measured by the wide span of controversial issues that have been raised by the related litshyerature such as intellectual property rights over organisms productivity effects economic returns consumer safety welfare and income distribushytion and environmental effects
On the environmental front benshyefits from adoption of GM seeds have been argued based on findings about pesticide use and agricultural pracshytices Insect Resistant (IR) cotton has been found to reduce the use of insecticides and therefore produce environmental health and safety gains Herbicide Tolerant (HT) soyshybeans have been found to change the mix of herbicides applied towards less toxic chemicals and to allow the use
of no-till cultivation techniques leadshying researchers to conclude that they also produce environmental benefits
This article addresses the envishyronmental impacts associated with pesticides use resulting from adopshytion of GM seeds in Brazil We innoshyvate relative to previous works on this topic by employing a broader measure of environmental impact that takes into account toxicity levels and risk of exposure in evaluating the effects of pesticides for different dimensions of agricultural systems Hence we are able to uncover envishyronmental impacts that have been hidden by the qualitative nature of the change in the mix of pesticides used
GM Seeds and Pesticides Use Since the mid 1990s when first-genshyeration GM seeds were commercially introduced adoption by farmers has grown steadily in industrialized and developing countries as they provide an alternative and more convenient way of controlling pest damage By 2008 133 million farmers dedicated 8 of total cropland (125 million ha) to the cultivation of GM seeds The leading countries in terms of share of cultivated area in 2009 were the United States (50) Argenshytina (17) Brazil (13) India (6) Canada (6) and China (3)
In Brazil the most recent nationwide survey on agricultural biotechnology adoption indicates that GM seeds acshycount for 918 (274 million ha) of soybean cultivated area 816 (124 million ha) of maize and 65 (071 million ha) of cotton-cultivated area The main traits that have been introshyduced in first-generation GM seeds correspond to HT and IR technologies
The focus of this article relies on HT soybeans and IR cotton
IR seeds are engineered to produce a natural toxin found in the soil bacterium Bacillus thuringiensis (Bt) which is lethal to a number of bollworm pests but not to mammals In other words the IR trait works as a substitute for insecticides that control bollworm infestations IR crops have been considered technically and economically efficient for producers allowing savings in labor and machinery used in insecticide applications This potential is higher in regions with high infestationsmdash typically less-developed countries in tropical weather regions with high rates of insecticide use Besides it has also been considered a more efficient tool for managing risk of pest attack allowing reduced expenditure on crop insurance The result in terms of the outcome of interest is straightforward less insecticide usage reduces associated environmental impact
Weeds are strong competitors with soybean plants for nutrients water and sunlight Weed control techniques have evolved from traditional mechanishycal methods to herbicide applications which were introduced in the 1960rsquos Soybean seeds engineered with HT traits were introduced in 1996 under the commercial name Roundup Readyreg They are the result of the transfer of part of the genetic code of a soil bacshyterium Agrobacterium tumefaciens which allows the plant to metabolize the herbicide glyphosate (Roundup) In 1998 soybean varieties tolerant to the herbicide glufosinate were introshyduced under the commercial name Liberty Linkreg These herbicides are considered less toxic than others and
Giannini Foundation of Agricultural Economics bull University of California
Insecticies (Kgha)
Insecticides +
(EIQ) Herbicides
(Kgha) Herbicides+
(EIQ)
Table 1 Estimates of Impact of IR Cotton and HT Soybeans on Quantity of Pesticides (Insecticides and Herbicides) and Environmental Impact (EIQ)
IR Cotton -0242 -0234 - -[0037] [0035] - -
HT Soybean - - 0442 0356
- - [0056] [0049]
N 120 120 170 170
r2 0913 0918 0755 0790 + Robust standard errors p lt 005 p lt 001 p lt 0001
Coefficients multiplied by 100 indicate approximate percentage variation
target a large variety of broad-leaf and grass weeds species but cause severe damage to conventional crops when applied after germination
By making the soybean plant less susceptible to damage caused by those chemicals the HT trait induces farmers to apply more of them The resulting environmental impact is ambiguous though farmers are induced to apply more of less toxic herbicides but the net effect depends on how much they substitute for more toxic ones Hence increasing the share of less toxic hershybicides in the quantity of pesticides applied is not enough to guarantee a reduction in environmental impacts associated with these chemicals
This discussion suggests that meashysuring environmental impacts associshyated with pesticide use is not straightshyforward For HT traits specifically the net effect on environmental impact is an open issue Economists who studied it have focused on the change in the mix
of herbicides to conclude that there are environmental gains allowed by the use of HT traits Nevertheless we argue that weak substitution might undermine this conclusion as we show in the analyshysis that follows on the next section
Empirical Strategy In the empirical analysis we use a unique farm-level dataset originated from a survey conducted by a private firm in Brazil The survey collected data on production revenue costs biotechnology adoption and pestishycides used Information on pesticide use was collected for harvest seasons 2009ndash2011 and covers 839 farms
The dataset is disaggregated by fields within a farm cultivated with conventional or GM seeds In other words for each farm we have potenshytially multiple observations related to fields cultivated with conventional or GM seeds This setup allows us to use within-farm variation for farmers
Table 2 Estimates of Effects of HT Trait on Quantity of Herbicides per Toxicity Level
Herbicides 1 (Kgha)
Herbicides 2 (Kgha)
Herbicides 3 (Kgha)
Herbicides 4 (Kgha)
HT Trait -0084 -0005 0635 0438
[0021] [0054] [0098] [0090]
N 168 168 168 168
r2 0887 0777 0855 0845
Robust standard errors in brackets p lt 005 p lt 001 p lt 0001
Note toxicity levels 1-4 in decreasing order (from more to less toxic) Herbicides based on glyphosate are considered of lower toxicity level
who plant both conventional and GM seeds to identify the effect of adopshytion on the environmental impact of pesticides This empirical strategy holds constant all farm-level characshyteristics that might simultaneously affect the choices of pesticide use and biotechnology adoption such as management skills inputoutput prices location weather shocks etc
The farms surveyed represent large operations with potentially large envishyronmental impacts associated with the scale of production and pesticide use For cotton growers the average total planted area is 2521 ha ranging from 60 ha to 28374 ha For soybean growshyers the average total planted area is 1240 ha ranging from 8 ha to 13500 ha In terms of experience farmers report an average of 224 and 294 years for cotton and soybeans respectively
We measure the environment impact as two outcome variables quantity (Kgha) of active ingredients of chemishycals and the Environmental Impact Quotient (EIQ) index This measure of environmental impact of pesticides was designed to capture risks associshyated with both toxicity levels and exposhysure to chemical pesticides on three components of agricultural systems farmworker consumer and ecological Hence the EIQ index provides a more complete picture than just the comshyposition of the mix of pesticides used allowing for an adequate weighting of pesticides with different toxicity levels
The use of the EIQ index represents a big advancement over previous studshyies which relied on an increased share of less toxic chemicals of the total quanshytity (Kgha) of herbicides applied in HT soybeans fields since this measure cannot capture environmental effects due to substitution between herbicides If the increase in the use of less toxic herbicides is not accompanied by a sufshyficient decrease in more toxic ones the new mix of herbicides induced by HT seeds can be more harmful than the one
10
11 Giannini Foundation of Agricultural Economics bull University of California
induced by conventional seeds The EIQ index calculated for field operations allows us to adequately weight pestishycides of different toxicity levels and gets around the difficulties of looking only at the quantity mix of pesticides used
Findings Our findings are summarized in Table 1 The dependent variables are logs of quantity (Kgha) of pesticides and of the EIQ index The indepenshydent variable of interest is a dummy indicator for adoption of IR cotton or HT soybeans Results show that adopshytion of IR cotton reduces the amount of active ingredients of insecticides used by 242 and the environmental impact index by 234 when compared with fields cultivated with conventional seeds In absolute terms this is equivashylent to a reduction of approximately 0956 Kgha of active ingredients
For HT soybeans although farmshyers use more of less toxic herbicides we estimate that the net environmenshytal impact is higher than for convenshytional seeds We find that adoption of HT seeds causes an increase of 442 of active ingredients (Kgha) and a corresponding 356 increase in the EIQ index when compared with fields cultivated with conshyventional seeds In absolute terms this corresponds to an increase of 0996 Kgha of active ingredients
Table 2 sheds light on the mechashynism that drives the results for HT soyshybeans It shows estimates of the impact of HT seeds on the quantity of active ingredients (Kgha) of herbicides of difshyferent toxicity levels The reductions in higher toxicity herbicides (columns 1 and 2) are very modest when comshypared to the increases in lower toxicity ones (columns 3 and 4) In absolute terms we estimate that the increase in the later is twelvefold the decrease in the former This result indicates that weak substitution among herbishycides of different toxicity levels causes
a net increase in the environmental impact associated with herbicides
Our results confirm the environshymental gains from IR cotton but suggest that the prior findings on the environshymental effects of HT soybeans have been misled by relying solely on the change in the mix of herbicides used
Conclusions In this article we analyze the envishyronmental effects related to the use of pesticides arising from adoption of IR cotton and HT soybean seeds Using within-farm variation across fields treated with conventional and GM seeds we find that IR cotton reduces the amount of insecticides applied to cotton crops HT soybeans on the other hand leads to more use of herbicides
Analysis using the EIQ index shows that IR cotton reduces the envishyronmental impact by about 23 in the treated fields compared to fields cultivated with conventional seeds This is consistent with the previous result on Kgha of insecticides and confirms the environmental impact-saving nature of the IR technology The resulting environmental effects for HT soybeans on the other hand are found to be negative The estimates imply that the impact of herbicides is increased by 356 compared to fields cultivated with conventional seeds
Looking at quantities of herbicides of different toxicity levels we see increases in the use of lower toxicity herbicides and very small reductions in higher toxicity ones This findshying indicates very weak substitution among herbicides which explains the higher environmental impact associshyated with these chemicals caused by adoption of HT soybeans
We believe this to be an imporshytant result for three reasons First it contributes to uncover environmental effects that have been hidden by the qualitative nature of the mix of herbishycides induced by the HT trait Second
environmental policy makers designshying policies for biotechnology adopshytion might consider this new evidence to differentiate among GM traits that produce positive or negative externalishyties Finally as the composition of the EIQ index suggests the environmental impact of pesticides can have multiple dimensions that might involve farmshyworker health and safety consumer safety and ecological impacts Hence the results on HT soybeans suggest additional avenues of work that should be taken to evaluate each of these possible channels since they can also affect other important outcomes
Suggested Citation
Seixas Renato and Joseacute Maria Silveira 2014 Assessing Environmental Impacts of Genetically Modified Seeds in Brazilian Agriculture ARE Update 17(5)9ndash11 University of California Giannini Foundation of Agricultural Economics
Renato Seixas is a PhD candidate in the ARE department at University of California Berkeley He can be contacted by email at rnlseixas berkeleyedu Joseacute Maria Silveira is a professor in the State University of Campinas Institute of Economics in Brazil This article is based on the paper ldquoMore of Less Isnrsquot Less of More Assessing Environmental Impacts of Genetically Modified Seeds in Brazilian Agriculturerdquo Financial support from CAPESFulbright PhD fellowship (grant 2256-08-8) is greatly acknowledged
For additional information the authors recommend
Celeres 2014 Biotech Newsletter Celeres Uberlacircndia (MG) Retrieved from wwwcelerescombr
Kovach J C Petzoldt J Degnil and J Tette 1992 ldquoA Method to Measure the Environmental Impact of Pesticidesrdquo Ithaca NY New York State Agricultural Experiment Station a division of the New York State College of Agriculture and Life Sciences Cornell University
Qaim M 2009 ldquoThe Economics of Genetically Modified Cropsrdquo Annual Review of Resource Economics 1 665 - 694 wwwannualreviews orgdoiabs101146annurev resource050708144203
Department of Agricultural and Resource Economics UC Davis One Shields Avenue Davis CA 95616 GPBS
Agricultural and Resource Economics
UPDATE
Co-Editors
Richard Sexton Sofia Berto Villas-Boas
David Zilberman
Managing Editor and Desktop Publisher
Julie McNamara
Published by the Giannini Foundation of Agricultural Economics
httpgianniniucopedu
ARE Update is published six times per year by the Giannini Foundation of Agricultural Economics University of California
Domestic subscriptions are available free of charge to interested parties To subscribe to ARE Update by mail contact
Julie McNamara Outreach Coordinator Giannini Foundation of Agricultural Economics Department of Agricultural and Resource Economics University of California One Shields Avenue Davis CA 95616 E-mail julieprimalucdavisedu Phone 530-752-5346
To receive notification when new issues of the ARE Update are available online submit an e-mail request to join our listserv to
julieprimalucdavisedu
Articles published herein may be reprinted in their entirety with the authorrsquos or editorsrsquo permission Please credit the Giannini Foundation of Agricultural
Economics University of California
ARE Update is available online httpgianniniucopeduare-update
The University of California is an Equal OpportunityAffirmative Action employer
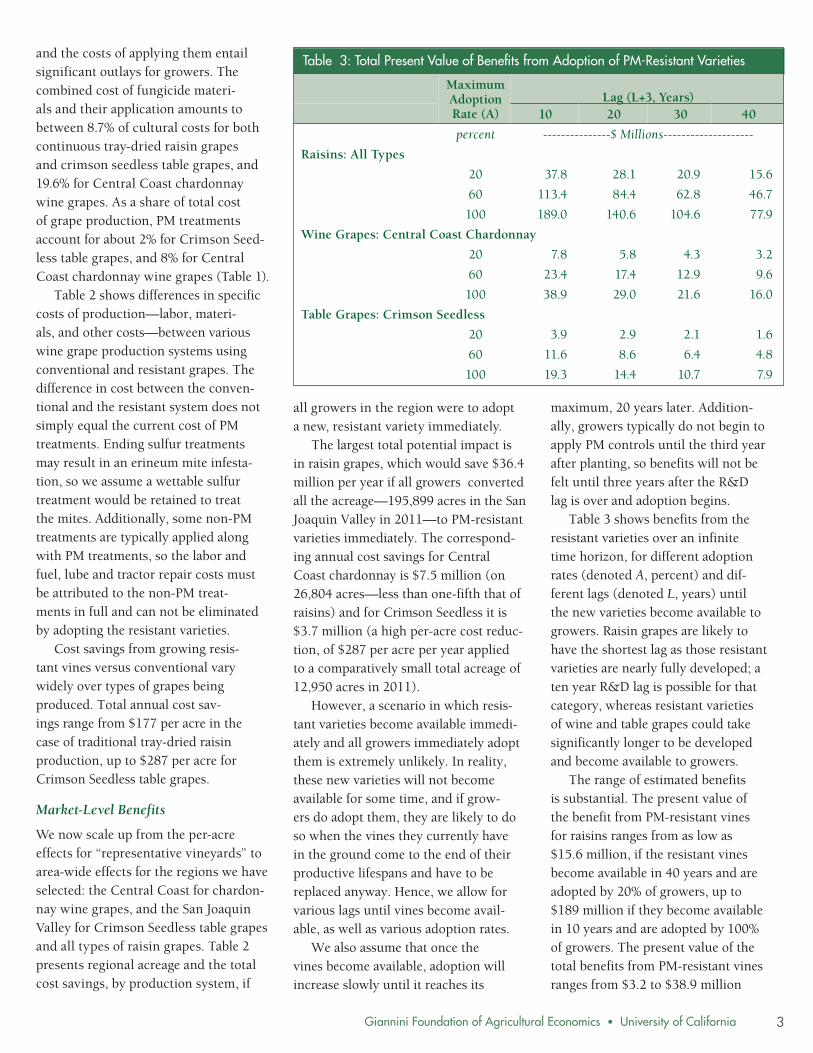
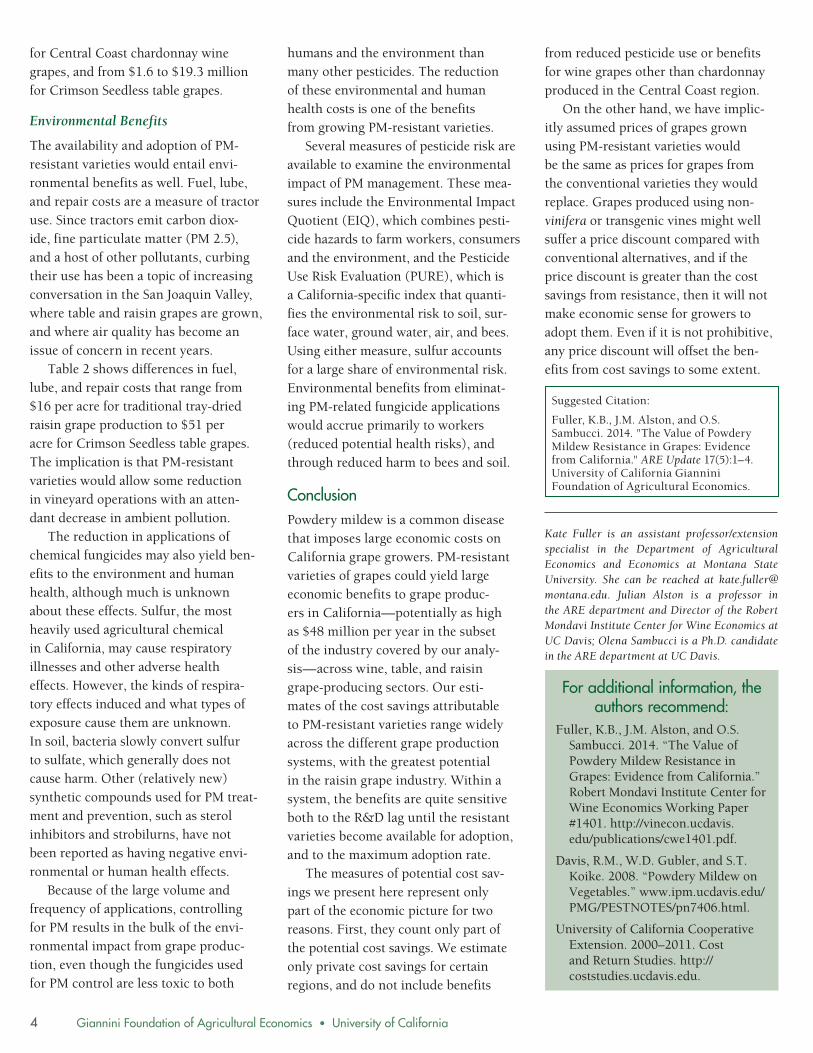
Giannini Foundation of Agricultural Economics bull University of California
for Central Coast chardonnay wine grapes and from $16 to $193 million for Crimson Seedless table grapes
Environmental Benefits
The availability and adoption of PM-resistant varieties would entail envishyronmental benefits as well Fuel lube and repair costs are a measure of tractor use Since tractors emit carbon dioxshyide fine particulate matter (PM 25) and a host of other pollutants curbing their use has been a topic of increasing conversation in the San Joaquin Valley where table and raisin grapes are grown and where air quality has become an issue of concern in recent years
Table 2 shows differences in fuel lube and repair costs that range from $16 per acre for traditional tray-dried raisin grape production to $51 per acre for Crimson Seedless table grapes The implication is that PM-resistant varieties would allow some reduction in vineyard operations with an attenshydant decrease in ambient pollution
The reduction in applications of chemical fungicides may also yield benshyefits to the environment and human health although much is unknown about these effects Sulfur the most heavily used agricultural chemical in California may cause respiratory illnesses and other adverse health effects However the kinds of respirashytory effects induced and what types of exposure cause them are unknown In soil bacteria slowly convert sulfur to sulfate which generally does not cause harm Other (relatively new) synthetic compounds used for PM treatshyment and prevention such as sterol inhibitors and strobilurns have not been reported as having negative envishyronmental or human health effects
Because of the large volume and frequency of applications controlling for PM results in the bulk of the envishyronmental impact from grape producshytion even though the fungicides used for PM control are less toxic to both
humans and the environment than many other pesticides The reduction of these environmental and human health costs is one of the benefits from growing PM-resistant varieties
Several measures of pesticide risk are available to examine the environmental impact of PM management These meashysures include the Environmental Impact Quotient (EIQ) which combines pestishycide hazards to farm workers consumers and the environment and the Pesticide Use Risk Evaluation (PURE) which is a California-specific index that quantishyfies the environmental risk to soil surshyface water ground water air and bees Using either measure sulfur accounts for a large share of environmental risk Environmental benefits from eliminatshying PM-related fungicide applications would accrue primarily to workers (reduced potential health risks) and through reduced harm to bees and soil
Conclusion Powdery mildew is a common disease that imposes large economic costs on California grape growers PM-resistant varieties of grapes could yield large economic benefits to grape producshyers in Californiamdashpotentially as high as $48 million per year in the subset of the industry covered by our analyshysismdashacross wine table and raisin grape-producing sectors Our estishymates of the cost savings attributable to PM-resistant varieties range widely across the different grape production systems with the greatest potential in the raisin grape industry Within a system the benefits are quite sensitive both to the RampD lag until the resistant varieties become available for adoption and to the maximum adoption rate
The measures of potential cost savshyings we present here represent only part of the economic picture for two reasons First they count only part of the potential cost savings We estimate only private cost savings for certain regions and do not include benefits
from reduced pesticide use or benefits for wine grapes other than chardonnay produced in the Central Coast region
On the other hand we have implicshyitly assumed prices of grapes grown using PM-resistant varieties would be the same as prices for grapes from the conventional varieties they would replace Grapes produced using nonshyvinifera or transgenic vines might well suffer a price discount compared with conventional alternatives and if the price discount is greater than the cost savings from resistance then it will not make economic sense for growers to adopt them Even if it is not prohibitive any price discount will offset the benshyefits from cost savings to some extent
Suggested Citation
Fuller KB JM Alston and OS Sambucci 2014 The Value of Powdery Mildew Resistance in Grapes Evidence from California ARE Update 17(5)1ndash4 University of California Giannini Foundation of Agricultural Economics
Kate Fuller is an assistant professorextension specialist in the Department of Agricultural Economics and Economics at Montana State University She can be reached at katefuller montanaedu Julian Alston is a professor in the ARE department and Director of the Robert Mondavi Institute Center for Wine Economics at UC Davis Olena Sambucci is a PhD candidate in the ARE department at UC Davis
For additional information the authors recommend
Fuller KB JM Alston and OS Sambucci 2014 ldquoThe Value of Powdery Mildew Resistance in Grapes Evidence from Californiardquo Robert Mondavi Institute Center for Wine Economics Working Paper 1401 httpvineconucdavis edupublicationscwe1401pdf
Davis RM WD Gubler and ST Koike 2008 ldquoPowdery Mildew on Vegetablesrdquo wwwipmucdavisedu PMGPESTNOTESpn7406html
University of California Cooperative Extension 2000ndash2011 Cost and Return Studies http coststudiesucdavisedu
4
5 Giannini Foundation of Agricultural Economics bull University of California
How California Farms Measure Up in the 2012 Census of Agriculture Smaller in Size with Higher Value of Production Emma C Knoesen and Rachael E Goodhue
The 2012 Census of Agriculture was released in early May 2014 Average farm size continues to grow in terms of acreage and market value of production However this trend is not universal across crop category or geographic region For the crop category of Land Used for Vegetables the average acreage allocation per farm reporting production in this category decreased while certain counties in California experienced an increase in the average acre allocation
Conducting an agriculture census has been a longstanding activshyity of the federal government
The 2012 Census of Agriculture was the twenty-eighth US agriculture census The first agriculture census was in 1840 and a new one has been conshyducted every five years since 1920 The aim of the census is to provide detailed information on US farms and ranches and their operators to the public busishynesses the government and analysts The census summarizes information at the national state and county levels Some information is not reported pubshylicly in order to maintain confidentialshyity regarding individual operations
The Census of Agriculture enables the comparison of California agriculture to US agriculture The 2012 census indicates that differences between the two regarding farm size by acreage and market value of agricultural products were consistent with the differences reported in 2007 and earlier recent
censuses We focus here on comparshying these characteristics in 2012
California had smaller farms on average by acreage with an avershyage farm size of 328 acres while the United States had an average of 434 acres Overall California had a larger percentage of small farms while the US had more large farms As seen in Table 1 which documents the size of farms by acreage in California and the United States a majority (65) of California farms in 2012 were under 50 acres Only 39 of farms in the United States were under 50 acres At the other end of the spectrum 15 of United States farms were over 500 acres compared to 10 in California
While California farms tended to be smaller in terms of acreage Califorshynia has more high-value crops which generate more revenue per acre These high-value crops mean that California farms tend to have a higher market value of agricultural products sold The average market value of producshytion per acre of farmland in California was $1667 compared to $289 in the United States as a whole in 2012
Table 2 (on page 6) reports the size of farms in 2012 by their market value of production before taxes or production costs California had a larger percentage of farms with a large market value of production Over a quarter of California farms had a market value of producshytion over $100000 in comparison to 19 nationally On average farms in California had a market value of proshyduction a little under three times the national average $547510 for California and $187097 for the United States
Evolution of California Agriculture The census also allows for the evaluation of the development of California agriculture over time because it is conducted every five years Here we compare the market value of agricultural products sold and the acreage of farms in 2007 and in 2012 Census data show that over this time period the average market value of production of California farms increased by 31 This increase was due to both a reduction in the total number of farms in California and an increase in the number of farms with a large market value of production
California United States
Table 1 Farm Size by Acres California and the United States 2012
Acres Number of Farms
Percentage of Farms
Number of Farms
Percentage of Farms
1 to 9 acres 24637 32 223634 11
10 to 49 acres 25811 33 589549 28
50 to 179 acres 13056 17 634047 30
180 to 499 acres 6649 9 346038 16
500 to 999 acres 3230 4 142555 7
1000 to 1999 acres 2040 3 91273 4
2000 acres or more 2434 3 82207 4
Average AcreageFarm 328 434
Source 2012 Census of Agriculture
Giannini Foundation of Agricultural Economics bull University of California
The total number of California farms fell from 81033 in 2007 to 77857 in 2012 At the same time the number of farms in the largest range of market value of production $500000 or more increased from 8649 to 9564 These trends were also apparent nationally
Comparing the pie charts in Figure 1 California farms with a large market value of production increased their share of the total market value of proshyduction of all California farms Even though they are only about one-eighth of California farms those with a market value of production over $500000 proshyduced a substantial majority of the total market value of production of California farmsmdash92 in 2012 a slight increase from 90 in 2007 California farmsrsquo market value as well as the percentage
California United States
Table 2 Farm Size by Market Value of Agricultural Products Sold CA and the US 2012
Market Value Number of Farms
Percentage of Farms
Number of Farms
Percentage of Farms
Less than $2500 19347 25 665311 32
$2500 to $4999 5904 8 231388 11
$5000 to $9999 7846 10 248616 12
$10000 to $24999 10265 13 271511 13
$25000 to $49999 7150 9 161939 8
$50000 to $99999 6698 9 133988 6
$100000 to $499999 11083 14 237328 11
$500000 or more 9564 12 159222 8
Average Market ValueFarm $547510 $187097
Source 2012 Census of Agriculture
Figure 1 Share of Total California Agricultural Production by Farm Size Category 2007 and 2012
$500000 or more
$50000 to $499999
Under $50000
2007 2012
of total revenue produced by these higher market value farms increased
As mentioned earlier California has a significant number of small farms by acreage and also in market value of production The majority of farms in both years had a market value of production under $50000mdash57 in 2012 and 59 in 2007 as seen in Figure 2 There is considerable hetshyerogeneity within this category
Of the farms with a market value of production under $50000 38 were under $2500 in 2012 compared to 42 in 2007 In both 2007 and 2012 14 of the farms with a market value of producshytion under $50000 had a market value of production between $25000 and $49999 While there are many small farms they do not produce a large part
of the total market value of producshytion of all California farms Within the category of market value of production under $50000 these farms produced 15 of the total market value of all Calishyfornia farms in 2007 and 11 in 2012
Variation Across Crop Category The census reports the number of farms and acres by crop category This information allows analysis of the land allocated to and the number of farms producing a specific crop Here we report changes in farms with orchards and farms with vegetable and melon production The definitions used in the census are important for this analysis For a given crop category the number of farms is all farms that reported producing that crop and the acres are the cumulative acres reported for that category If a farm harvested two or more crops in different categories from the same land the acres and the farm itself were counted in each crop category However if two or more crops in the category Land Used for Vegetables (LUV) which includes all vegetables and melons were harvested from the same acreage then the census only counts the acres once Land in Orchards (LO) includes all acreage with fruit trees citrus or other groves vineyards and nut trees of nonbearing and bearing age regardless of whether or not it was harvested
Over the five years between 2007 and 2012 LUV and LO experienced opposite changes in farm size and number As exhibited in Figure 3 the number of farms with LUV increased by 57 while acres allocated for vegetables or melons increased only 2 in 2012 the farms tended to alloshycate less acres to this category than in 2007 The average acres allocated as LUV per farm decreased from 251 acres in 2007 to 163 acres in 2012
In contrast the acres allocated as LO per farm grew in size The number of farms with LO decreased by 4 while
6
Giannini Foundation of Agricultural Economics bull University of California
acres in LO increased by 10 from 2007 to 2012 This change resulted in an increase in the average acres of LO per farm from 72 acres in 2007 to 82 acres in 2012 or an increase of 13
County by County Variation The census provides data on a county level as well These data enable the comparison of trends on the county state and national level Here we link the statewide trend of smaller acreage allocation per farm in LUV to developments in major vegetable-producing counties Of the top ten counties in LUV by acreage only six experienced a decrease in the average allocation of acres to LUV Fresno Kern San Joaquin Merced Yolo and Santa Barbara
Table 3 (on page 8) illustrates that four of the top ten vegetable-producing counties in 2012 realized an increase in average vegetable acreage per farm Monterey Imperial Riverside and Venshytura In Monterey County the number of farms with LUV increased from 202 in 2007 to 210 in 2012 while the acres allocated as LUV increased from 163237 acres to 189 644 in that same time As the county with the largest acreage of LUV in 2012 and the second largshyest in 2007 Monterey realized a 12 increase in the acre allocation per farm
A similar trend was seen in Impeshyrial County in which the number of farms with LUV increased from 86 to 105 and the acres allocated increased
Figure 2 Share of Total California Farms by Level of Sales 2007 and 2012
Less than $50000
Less than $50000
2007
2012
$500000 or more
Under $50000
$50000 to $499999
$25000 to $49999
$10000 to $24999
$5000 to $9999
$2500 to $4999
Less than $2500
from 68970 acres to 105979 acres from 2007 to 2012 In 2012 Farms with LUV in Imperial County allocated 1009 acres on average per farm to vegetables or melons the largest across all Calishyfornia counties Imperial County had the third most acres in LUV in 2012 and the fourth most in 2007 Imperial Countyrsquos average allocation per farm increased 26 from 2007 to 2012
Conclusion The Census of Agriculture is an important tool for analysts the government businesses and the public It enables the analysis of production agriculturersquos evolution over time and the comparison of agriculture in different geographic regions The 2012 Census of Agriculture indicates that California agriculture remains distinct
Figure 3 California Farms with Land Used for Vegetables and Land in Orchards
4545 35 35 Number 4040 3030 of Farms
35 35
Vegetables
0
Orchards
2007 2012
Num
ber
of F
arm
s (1
000
)
Num
ber
of F
arm
s (1
000
)
25
Acr
es (1
000
00) 25
20
15
Acres
Acr
es (1
000
00)
30
25
20
30
25
20
20
15 1515
1010 1010
55 55
00 2007 2012
7
0
Giannini Foundation of Agricultural Economics bull University of California
County
Number of Farms with
Land Used for Vegetables
Land Used for
Vegetables (Acres)
Share of CA Land Used for
Vegetables
Average Land Used for
Vegetables per Farm
Table 3 Land Used for Vegetables in the Top Ten Counties by Acreage in California 2012 and 2007
2012 Monterey 210 189644 19 903
Fresno 564 166810 17 296
Imperial 105 105979 11 1009
Kern 167 84962 9 509
San Joaquin 193 52651 5 273
Merced 223 51119 5 229
Yolo 114 43449 4 381
Santa Barbara 222 40594 4 183
Riverside 155 30529 3 197
Ventura 106 25027 3 236
All other 3996 194971 20 49
California 6055 985735 163
2007 Fresno 559 186565 19 334
Monterey 202 163237 17 808
Kern 138 77362 8 561
Imperial 86 68970 7 802
San Joaquin 181 66652 7 368
Merced 176 58671 6 333
Yolo 96 48034 5 500
Santa Barbara 145 42436 4 293
Kings 53 28982 3 547
Ventura 118 24458 3 207
All Other 2114 203646 21 96
California 3868 969013 251
Source 2012 Census of Agriculture
Some counties such as Imperial and Monterey with some of the largest total acreage of LUV experienced an increase in their average acre allocation per farm Other counties such as Fresno Santa Barbara and Yolo experienced a decrease in their average acre allocation to LUV per farm similar to the state trend The 2012 Census of Agriculture confirms that the agricultural landscape of California is diverse and general trends do not hold for all commodities
Suggested Citation
Knoesen EC and RE Goodhue 2014 How California Farms Measure Up in the 2012 Census of Agriculture Smaller in Size with Higher Value of Production ARE Update 17(5)5-8 University of California Giannini Foundation of Agricultural Economics
Emma Knoesen is a student research associate in the Department of Agriculture and Resource Economics at UC Davis and a sophomore at Scripps College Rachael Goodhue is a professor in the ARE department at UC Davis and a member of the Giannini Foundation of Agricultural Economics She may be contacted at goodhueprimalucdavisedu
For additional information the authors recommend
2012 Census of Agriculture wwwagcensususdaorg Publications2012 The site includes expanded descriptions of methodology and information
from US agriculture as a whole although in both cases farms continue to grow larger in both acreage and market value of production California tended to be smaller on average by acres than the rest of the country yet continued to have farms with higher market value of production from high-value crops Though the total number of farms in California decreased from 2007 to 2012 the total market value of production of California farms increased by just over one-quarter
However the trend towards larger
farms was not universal across all farm typesmdashat least not when measured in acres LO followed the national as well as state trend with the avershyage acreage allocated by each farm to orchard production growing by 13 Land Used for Vegetable followed a different trend with a smaller acre allocation per farm producing vegshyetables and melons in 2012 than in 2007 The number of acres per farm with LUV decreased just over 35
However this trend was not conshysistent in every county in California
on other states as well as previous censuses
8
9 Giannini Foundation of Agricultural Economics bull University of California
Assessing Environmental Impacts of Genetically Modified Seeds in Brazilian Agriculture Renato Seixas and Joseacute Maria Silveira
Using a farm-level dataset on geneshytically modified (GM) seed adoption and pesticide application in Brazil we find that Insect Resistant (IR) cotton reduces the environmental impact of insecticides but Herbicide Tolerant (HT) soybeans increase the environshymental impact of herbicides due to weak substitution among herbicides of different toxicity levels
Genetically modified (GM) seeds have been considered one of the major technological
innovations for agricultural systems and have been promoted as an effecshytive tool for controlling agricultural pests and expanding food supply Their relevance can also be measured by the wide span of controversial issues that have been raised by the related litshyerature such as intellectual property rights over organisms productivity effects economic returns consumer safety welfare and income distribushytion and environmental effects
On the environmental front benshyefits from adoption of GM seeds have been argued based on findings about pesticide use and agricultural pracshytices Insect Resistant (IR) cotton has been found to reduce the use of insecticides and therefore produce environmental health and safety gains Herbicide Tolerant (HT) soyshybeans have been found to change the mix of herbicides applied towards less toxic chemicals and to allow the use
of no-till cultivation techniques leadshying researchers to conclude that they also produce environmental benefits
This article addresses the envishyronmental impacts associated with pesticides use resulting from adopshytion of GM seeds in Brazil We innoshyvate relative to previous works on this topic by employing a broader measure of environmental impact that takes into account toxicity levels and risk of exposure in evaluating the effects of pesticides for different dimensions of agricultural systems Hence we are able to uncover envishyronmental impacts that have been hidden by the qualitative nature of the change in the mix of pesticides used
GM Seeds and Pesticides Use Since the mid 1990s when first-genshyeration GM seeds were commercially introduced adoption by farmers has grown steadily in industrialized and developing countries as they provide an alternative and more convenient way of controlling pest damage By 2008 133 million farmers dedicated 8 of total cropland (125 million ha) to the cultivation of GM seeds The leading countries in terms of share of cultivated area in 2009 were the United States (50) Argenshytina (17) Brazil (13) India (6) Canada (6) and China (3)
In Brazil the most recent nationwide survey on agricultural biotechnology adoption indicates that GM seeds acshycount for 918 (274 million ha) of soybean cultivated area 816 (124 million ha) of maize and 65 (071 million ha) of cotton-cultivated area The main traits that have been introshyduced in first-generation GM seeds correspond to HT and IR technologies
The focus of this article relies on HT soybeans and IR cotton
IR seeds are engineered to produce a natural toxin found in the soil bacterium Bacillus thuringiensis (Bt) which is lethal to a number of bollworm pests but not to mammals In other words the IR trait works as a substitute for insecticides that control bollworm infestations IR crops have been considered technically and economically efficient for producers allowing savings in labor and machinery used in insecticide applications This potential is higher in regions with high infestationsmdash typically less-developed countries in tropical weather regions with high rates of insecticide use Besides it has also been considered a more efficient tool for managing risk of pest attack allowing reduced expenditure on crop insurance The result in terms of the outcome of interest is straightforward less insecticide usage reduces associated environmental impact
Weeds are strong competitors with soybean plants for nutrients water and sunlight Weed control techniques have evolved from traditional mechanishycal methods to herbicide applications which were introduced in the 1960rsquos Soybean seeds engineered with HT traits were introduced in 1996 under the commercial name Roundup Readyreg They are the result of the transfer of part of the genetic code of a soil bacshyterium Agrobacterium tumefaciens which allows the plant to metabolize the herbicide glyphosate (Roundup) In 1998 soybean varieties tolerant to the herbicide glufosinate were introshyduced under the commercial name Liberty Linkreg These herbicides are considered less toxic than others and
Giannini Foundation of Agricultural Economics bull University of California
Insecticies (Kgha)
Insecticides +
(EIQ) Herbicides
(Kgha) Herbicides+
(EIQ)
Table 1 Estimates of Impact of IR Cotton and HT Soybeans on Quantity of Pesticides (Insecticides and Herbicides) and Environmental Impact (EIQ)
IR Cotton -0242 -0234 - -[0037] [0035] - -
HT Soybean - - 0442 0356
- - [0056] [0049]
N 120 120 170 170
r2 0913 0918 0755 0790 + Robust standard errors p lt 005 p lt 001 p lt 0001
Coefficients multiplied by 100 indicate approximate percentage variation
target a large variety of broad-leaf and grass weeds species but cause severe damage to conventional crops when applied after germination
By making the soybean plant less susceptible to damage caused by those chemicals the HT trait induces farmers to apply more of them The resulting environmental impact is ambiguous though farmers are induced to apply more of less toxic herbicides but the net effect depends on how much they substitute for more toxic ones Hence increasing the share of less toxic hershybicides in the quantity of pesticides applied is not enough to guarantee a reduction in environmental impacts associated with these chemicals
This discussion suggests that meashysuring environmental impacts associshyated with pesticide use is not straightshyforward For HT traits specifically the net effect on environmental impact is an open issue Economists who studied it have focused on the change in the mix
of herbicides to conclude that there are environmental gains allowed by the use of HT traits Nevertheless we argue that weak substitution might undermine this conclusion as we show in the analyshysis that follows on the next section
Empirical Strategy In the empirical analysis we use a unique farm-level dataset originated from a survey conducted by a private firm in Brazil The survey collected data on production revenue costs biotechnology adoption and pestishycides used Information on pesticide use was collected for harvest seasons 2009ndash2011 and covers 839 farms
The dataset is disaggregated by fields within a farm cultivated with conventional or GM seeds In other words for each farm we have potenshytially multiple observations related to fields cultivated with conventional or GM seeds This setup allows us to use within-farm variation for farmers
Table 2 Estimates of Effects of HT Trait on Quantity of Herbicides per Toxicity Level
Herbicides 1 (Kgha)
Herbicides 2 (Kgha)
Herbicides 3 (Kgha)
Herbicides 4 (Kgha)
HT Trait -0084 -0005 0635 0438
[0021] [0054] [0098] [0090]
N 168 168 168 168
r2 0887 0777 0855 0845
Robust standard errors in brackets p lt 005 p lt 001 p lt 0001
Note toxicity levels 1-4 in decreasing order (from more to less toxic) Herbicides based on glyphosate are considered of lower toxicity level
who plant both conventional and GM seeds to identify the effect of adopshytion on the environmental impact of pesticides This empirical strategy holds constant all farm-level characshyteristics that might simultaneously affect the choices of pesticide use and biotechnology adoption such as management skills inputoutput prices location weather shocks etc
The farms surveyed represent large operations with potentially large envishyronmental impacts associated with the scale of production and pesticide use For cotton growers the average total planted area is 2521 ha ranging from 60 ha to 28374 ha For soybean growshyers the average total planted area is 1240 ha ranging from 8 ha to 13500 ha In terms of experience farmers report an average of 224 and 294 years for cotton and soybeans respectively
We measure the environment impact as two outcome variables quantity (Kgha) of active ingredients of chemishycals and the Environmental Impact Quotient (EIQ) index This measure of environmental impact of pesticides was designed to capture risks associshyated with both toxicity levels and exposhysure to chemical pesticides on three components of agricultural systems farmworker consumer and ecological Hence the EIQ index provides a more complete picture than just the comshyposition of the mix of pesticides used allowing for an adequate weighting of pesticides with different toxicity levels
The use of the EIQ index represents a big advancement over previous studshyies which relied on an increased share of less toxic chemicals of the total quanshytity (Kgha) of herbicides applied in HT soybeans fields since this measure cannot capture environmental effects due to substitution between herbicides If the increase in the use of less toxic herbicides is not accompanied by a sufshyficient decrease in more toxic ones the new mix of herbicides induced by HT seeds can be more harmful than the one
10
11 Giannini Foundation of Agricultural Economics bull University of California
induced by conventional seeds The EIQ index calculated for field operations allows us to adequately weight pestishycides of different toxicity levels and gets around the difficulties of looking only at the quantity mix of pesticides used
Findings Our findings are summarized in Table 1 The dependent variables are logs of quantity (Kgha) of pesticides and of the EIQ index The indepenshydent variable of interest is a dummy indicator for adoption of IR cotton or HT soybeans Results show that adopshytion of IR cotton reduces the amount of active ingredients of insecticides used by 242 and the environmental impact index by 234 when compared with fields cultivated with conventional seeds In absolute terms this is equivashylent to a reduction of approximately 0956 Kgha of active ingredients
For HT soybeans although farmshyers use more of less toxic herbicides we estimate that the net environmenshytal impact is higher than for convenshytional seeds We find that adoption of HT seeds causes an increase of 442 of active ingredients (Kgha) and a corresponding 356 increase in the EIQ index when compared with fields cultivated with conshyventional seeds In absolute terms this corresponds to an increase of 0996 Kgha of active ingredients
Table 2 sheds light on the mechashynism that drives the results for HT soyshybeans It shows estimates of the impact of HT seeds on the quantity of active ingredients (Kgha) of herbicides of difshyferent toxicity levels The reductions in higher toxicity herbicides (columns 1 and 2) are very modest when comshypared to the increases in lower toxicity ones (columns 3 and 4) In absolute terms we estimate that the increase in the later is twelvefold the decrease in the former This result indicates that weak substitution among herbishycides of different toxicity levels causes
a net increase in the environmental impact associated with herbicides
Our results confirm the environshymental gains from IR cotton but suggest that the prior findings on the environshymental effects of HT soybeans have been misled by relying solely on the change in the mix of herbicides used
Conclusions In this article we analyze the envishyronmental effects related to the use of pesticides arising from adoption of IR cotton and HT soybean seeds Using within-farm variation across fields treated with conventional and GM seeds we find that IR cotton reduces the amount of insecticides applied to cotton crops HT soybeans on the other hand leads to more use of herbicides
Analysis using the EIQ index shows that IR cotton reduces the envishyronmental impact by about 23 in the treated fields compared to fields cultivated with conventional seeds This is consistent with the previous result on Kgha of insecticides and confirms the environmental impact-saving nature of the IR technology The resulting environmental effects for HT soybeans on the other hand are found to be negative The estimates imply that the impact of herbicides is increased by 356 compared to fields cultivated with conventional seeds
Looking at quantities of herbicides of different toxicity levels we see increases in the use of lower toxicity herbicides and very small reductions in higher toxicity ones This findshying indicates very weak substitution among herbicides which explains the higher environmental impact associshyated with these chemicals caused by adoption of HT soybeans
We believe this to be an imporshytant result for three reasons First it contributes to uncover environmental effects that have been hidden by the qualitative nature of the mix of herbishycides induced by the HT trait Second
environmental policy makers designshying policies for biotechnology adopshytion might consider this new evidence to differentiate among GM traits that produce positive or negative externalishyties Finally as the composition of the EIQ index suggests the environmental impact of pesticides can have multiple dimensions that might involve farmshyworker health and safety consumer safety and ecological impacts Hence the results on HT soybeans suggest additional avenues of work that should be taken to evaluate each of these possible channels since they can also affect other important outcomes
Suggested Citation
Seixas Renato and Joseacute Maria Silveira 2014 Assessing Environmental Impacts of Genetically Modified Seeds in Brazilian Agriculture ARE Update 17(5)9ndash11 University of California Giannini Foundation of Agricultural Economics
Renato Seixas is a PhD candidate in the ARE department at University of California Berkeley He can be contacted by email at rnlseixas berkeleyedu Joseacute Maria Silveira is a professor in the State University of Campinas Institute of Economics in Brazil This article is based on the paper ldquoMore of Less Isnrsquot Less of More Assessing Environmental Impacts of Genetically Modified Seeds in Brazilian Agriculturerdquo Financial support from CAPESFulbright PhD fellowship (grant 2256-08-8) is greatly acknowledged
For additional information the authors recommend
Celeres 2014 Biotech Newsletter Celeres Uberlacircndia (MG) Retrieved from wwwcelerescombr
Kovach J C Petzoldt J Degnil and J Tette 1992 ldquoA Method to Measure the Environmental Impact of Pesticidesrdquo Ithaca NY New York State Agricultural Experiment Station a division of the New York State College of Agriculture and Life Sciences Cornell University
Qaim M 2009 ldquoThe Economics of Genetically Modified Cropsrdquo Annual Review of Resource Economics 1 665 - 694 wwwannualreviews orgdoiabs101146annurev resource050708144203
Department of Agricultural and Resource Economics UC Davis One Shields Avenue Davis CA 95616 GPBS
Agricultural and Resource Economics
UPDATE
Co-Editors
Richard Sexton Sofia Berto Villas-Boas
David Zilberman
Managing Editor and Desktop Publisher
Julie McNamara
Published by the Giannini Foundation of Agricultural Economics
httpgianniniucopedu
ARE Update is published six times per year by the Giannini Foundation of Agricultural Economics University of California
Domestic subscriptions are available free of charge to interested parties To subscribe to ARE Update by mail contact
Julie McNamara Outreach Coordinator Giannini Foundation of Agricultural Economics Department of Agricultural and Resource Economics University of California One Shields Avenue Davis CA 95616 E-mail julieprimalucdavisedu Phone 530-752-5346
To receive notification when new issues of the ARE Update are available online submit an e-mail request to join our listserv to
julieprimalucdavisedu
Articles published herein may be reprinted in their entirety with the authorrsquos or editorsrsquo permission Please credit the Giannini Foundation of Agricultural
Economics University of California
ARE Update is available online httpgianniniucopeduare-update
The University of California is an Equal OpportunityAffirmative Action employer
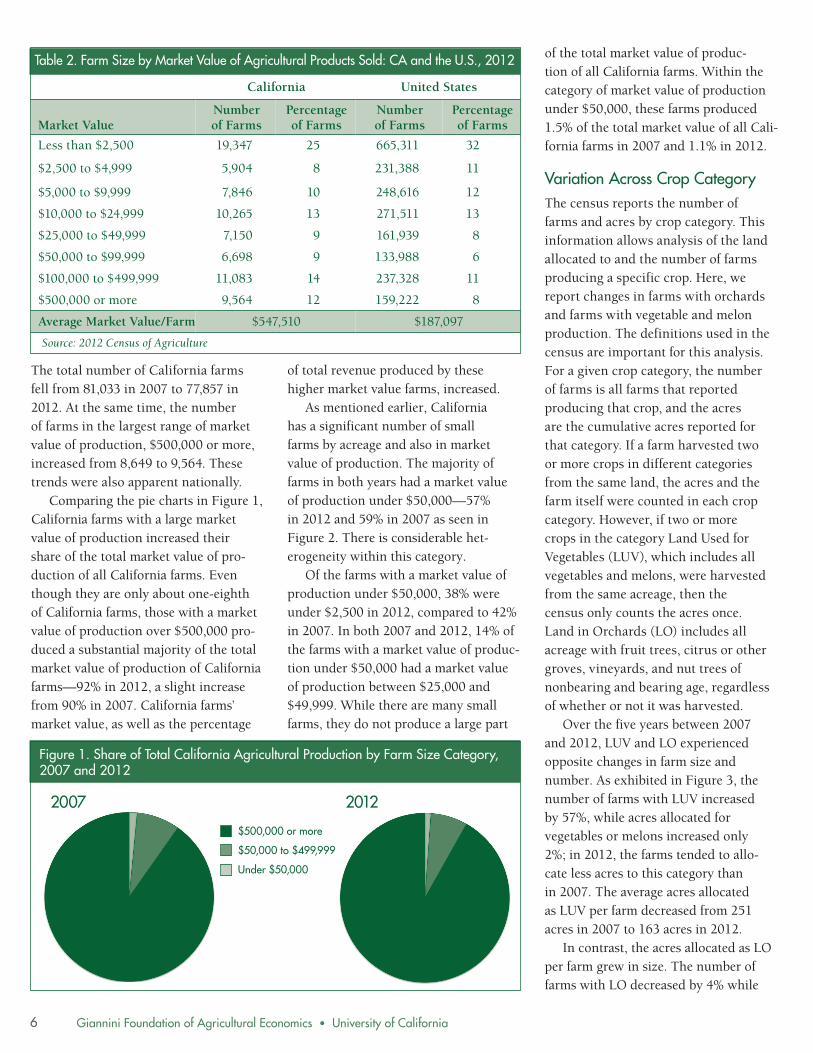
Giannini Foundation of Agricultural Economics bull University of California
The total number of California farms fell from 81033 in 2007 to 77857 in 2012 At the same time the number of farms in the largest range of market value of production $500000 or more increased from 8649 to 9564 These trends were also apparent nationally
Comparing the pie charts in Figure 1 California farms with a large market value of production increased their share of the total market value of proshyduction of all California farms Even though they are only about one-eighth of California farms those with a market value of production over $500000 proshyduced a substantial majority of the total market value of production of California farmsmdash92 in 2012 a slight increase from 90 in 2007 California farmsrsquo market value as well as the percentage
California United States
Table 2 Farm Size by Market Value of Agricultural Products Sold CA and the US 2012
Market Value Number of Farms
Percentage of Farms
Number of Farms
Percentage of Farms
Less than $2500 19347 25 665311 32
$2500 to $4999 5904 8 231388 11
$5000 to $9999 7846 10 248616 12
$10000 to $24999 10265 13 271511 13
$25000 to $49999 7150 9 161939 8
$50000 to $99999 6698 9 133988 6
$100000 to $499999 11083 14 237328 11
$500000 or more 9564 12 159222 8
Average Market ValueFarm $547510 $187097
Source 2012 Census of Agriculture
Figure 1 Share of Total California Agricultural Production by Farm Size Category 2007 and 2012
$500000 or more
$50000 to $499999
Under $50000
2007 2012
of total revenue produced by these higher market value farms increased
As mentioned earlier California has a significant number of small farms by acreage and also in market value of production The majority of farms in both years had a market value of production under $50000mdash57 in 2012 and 59 in 2007 as seen in Figure 2 There is considerable hetshyerogeneity within this category
Of the farms with a market value of production under $50000 38 were under $2500 in 2012 compared to 42 in 2007 In both 2007 and 2012 14 of the farms with a market value of producshytion under $50000 had a market value of production between $25000 and $49999 While there are many small farms they do not produce a large part
of the total market value of producshytion of all California farms Within the category of market value of production under $50000 these farms produced 15 of the total market value of all Calishyfornia farms in 2007 and 11 in 2012
Variation Across Crop Category The census reports the number of farms and acres by crop category This information allows analysis of the land allocated to and the number of farms producing a specific crop Here we report changes in farms with orchards and farms with vegetable and melon production The definitions used in the census are important for this analysis For a given crop category the number of farms is all farms that reported producing that crop and the acres are the cumulative acres reported for that category If a farm harvested two or more crops in different categories from the same land the acres and the farm itself were counted in each crop category However if two or more crops in the category Land Used for Vegetables (LUV) which includes all vegetables and melons were harvested from the same acreage then the census only counts the acres once Land in Orchards (LO) includes all acreage with fruit trees citrus or other groves vineyards and nut trees of nonbearing and bearing age regardless of whether or not it was harvested
Over the five years between 2007 and 2012 LUV and LO experienced opposite changes in farm size and number As exhibited in Figure 3 the number of farms with LUV increased by 57 while acres allocated for vegetables or melons increased only 2 in 2012 the farms tended to alloshycate less acres to this category than in 2007 The average acres allocated as LUV per farm decreased from 251 acres in 2007 to 163 acres in 2012
In contrast the acres allocated as LO per farm grew in size The number of farms with LO decreased by 4 while
6
Giannini Foundation of Agricultural Economics bull University of California
acres in LO increased by 10 from 2007 to 2012 This change resulted in an increase in the average acres of LO per farm from 72 acres in 2007 to 82 acres in 2012 or an increase of 13
County by County Variation The census provides data on a county level as well These data enable the comparison of trends on the county state and national level Here we link the statewide trend of smaller acreage allocation per farm in LUV to developments in major vegetable-producing counties Of the top ten counties in LUV by acreage only six experienced a decrease in the average allocation of acres to LUV Fresno Kern San Joaquin Merced Yolo and Santa Barbara
Table 3 (on page 8) illustrates that four of the top ten vegetable-producing counties in 2012 realized an increase in average vegetable acreage per farm Monterey Imperial Riverside and Venshytura In Monterey County the number of farms with LUV increased from 202 in 2007 to 210 in 2012 while the acres allocated as LUV increased from 163237 acres to 189 644 in that same time As the county with the largest acreage of LUV in 2012 and the second largshyest in 2007 Monterey realized a 12 increase in the acre allocation per farm
A similar trend was seen in Impeshyrial County in which the number of farms with LUV increased from 86 to 105 and the acres allocated increased
Figure 2 Share of Total California Farms by Level of Sales 2007 and 2012
Less than $50000
Less than $50000
2007
2012
$500000 or more
Under $50000
$50000 to $499999
$25000 to $49999
$10000 to $24999
$5000 to $9999
$2500 to $4999
Less than $2500
from 68970 acres to 105979 acres from 2007 to 2012 In 2012 Farms with LUV in Imperial County allocated 1009 acres on average per farm to vegetables or melons the largest across all Calishyfornia counties Imperial County had the third most acres in LUV in 2012 and the fourth most in 2007 Imperial Countyrsquos average allocation per farm increased 26 from 2007 to 2012
Conclusion The Census of Agriculture is an important tool for analysts the government businesses and the public It enables the analysis of production agriculturersquos evolution over time and the comparison of agriculture in different geographic regions The 2012 Census of Agriculture indicates that California agriculture remains distinct
Figure 3 California Farms with Land Used for Vegetables and Land in Orchards
4545 35 35 Number 4040 3030 of Farms
35 35
Vegetables
0
Orchards
2007 2012
Num
ber
of F
arm
s (1
000
)
Num
ber
of F
arm
s (1
000
)
25
Acr
es (1
000
00) 25
20
15
Acres
Acr
es (1
000
00)
30
25
20
30
25
20
20
15 1515
1010 1010
55 55
00 2007 2012
7
0
Giannini Foundation of Agricultural Economics bull University of California
County
Number of Farms with
Land Used for Vegetables
Land Used for
Vegetables (Acres)
Share of CA Land Used for
Vegetables
Average Land Used for
Vegetables per Farm
Table 3 Land Used for Vegetables in the Top Ten Counties by Acreage in California 2012 and 2007
2012 Monterey 210 189644 19 903
Fresno 564 166810 17 296
Imperial 105 105979 11 1009
Kern 167 84962 9 509
San Joaquin 193 52651 5 273
Merced 223 51119 5 229
Yolo 114 43449 4 381
Santa Barbara 222 40594 4 183
Riverside 155 30529 3 197
Ventura 106 25027 3 236
All other 3996 194971 20 49
California 6055 985735 163
2007 Fresno 559 186565 19 334
Monterey 202 163237 17 808
Kern 138 77362 8 561
Imperial 86 68970 7 802
San Joaquin 181 66652 7 368
Merced 176 58671 6 333
Yolo 96 48034 5 500
Santa Barbara 145 42436 4 293
Kings 53 28982 3 547
Ventura 118 24458 3 207
All Other 2114 203646 21 96
California 3868 969013 251
Source 2012 Census of Agriculture
Some counties such as Imperial and Monterey with some of the largest total acreage of LUV experienced an increase in their average acre allocation per farm Other counties such as Fresno Santa Barbara and Yolo experienced a decrease in their average acre allocation to LUV per farm similar to the state trend The 2012 Census of Agriculture confirms that the agricultural landscape of California is diverse and general trends do not hold for all commodities
Suggested Citation
Knoesen EC and RE Goodhue 2014 How California Farms Measure Up in the 2012 Census of Agriculture Smaller in Size with Higher Value of Production ARE Update 17(5)5-8 University of California Giannini Foundation of Agricultural Economics
Emma Knoesen is a student research associate in the Department of Agriculture and Resource Economics at UC Davis and a sophomore at Scripps College Rachael Goodhue is a professor in the ARE department at UC Davis and a member of the Giannini Foundation of Agricultural Economics She may be contacted at goodhueprimalucdavisedu
For additional information the authors recommend
2012 Census of Agriculture wwwagcensususdaorg Publications2012 The site includes expanded descriptions of methodology and information
from US agriculture as a whole although in both cases farms continue to grow larger in both acreage and market value of production California tended to be smaller on average by acres than the rest of the country yet continued to have farms with higher market value of production from high-value crops Though the total number of farms in California decreased from 2007 to 2012 the total market value of production of California farms increased by just over one-quarter
However the trend towards larger
farms was not universal across all farm typesmdashat least not when measured in acres LO followed the national as well as state trend with the avershyage acreage allocated by each farm to orchard production growing by 13 Land Used for Vegetable followed a different trend with a smaller acre allocation per farm producing vegshyetables and melons in 2012 than in 2007 The number of acres per farm with LUV decreased just over 35
However this trend was not conshysistent in every county in California
on other states as well as previous censuses
8
9 Giannini Foundation of Agricultural Economics bull University of California
Assessing Environmental Impacts of Genetically Modified Seeds in Brazilian Agriculture Renato Seixas and Joseacute Maria Silveira
Using a farm-level dataset on geneshytically modified (GM) seed adoption and pesticide application in Brazil we find that Insect Resistant (IR) cotton reduces the environmental impact of insecticides but Herbicide Tolerant (HT) soybeans increase the environshymental impact of herbicides due to weak substitution among herbicides of different toxicity levels
Genetically modified (GM) seeds have been considered one of the major technological
innovations for agricultural systems and have been promoted as an effecshytive tool for controlling agricultural pests and expanding food supply Their relevance can also be measured by the wide span of controversial issues that have been raised by the related litshyerature such as intellectual property rights over organisms productivity effects economic returns consumer safety welfare and income distribushytion and environmental effects
On the environmental front benshyefits from adoption of GM seeds have been argued based on findings about pesticide use and agricultural pracshytices Insect Resistant (IR) cotton has been found to reduce the use of insecticides and therefore produce environmental health and safety gains Herbicide Tolerant (HT) soyshybeans have been found to change the mix of herbicides applied towards less toxic chemicals and to allow the use
of no-till cultivation techniques leadshying researchers to conclude that they also produce environmental benefits
This article addresses the envishyronmental impacts associated with pesticides use resulting from adopshytion of GM seeds in Brazil We innoshyvate relative to previous works on this topic by employing a broader measure of environmental impact that takes into account toxicity levels and risk of exposure in evaluating the effects of pesticides for different dimensions of agricultural systems Hence we are able to uncover envishyronmental impacts that have been hidden by the qualitative nature of the change in the mix of pesticides used
GM Seeds and Pesticides Use Since the mid 1990s when first-genshyeration GM seeds were commercially introduced adoption by farmers has grown steadily in industrialized and developing countries as they provide an alternative and more convenient way of controlling pest damage By 2008 133 million farmers dedicated 8 of total cropland (125 million ha) to the cultivation of GM seeds The leading countries in terms of share of cultivated area in 2009 were the United States (50) Argenshytina (17) Brazil (13) India (6) Canada (6) and China (3)
In Brazil the most recent nationwide survey on agricultural biotechnology adoption indicates that GM seeds acshycount for 918 (274 million ha) of soybean cultivated area 816 (124 million ha) of maize and 65 (071 million ha) of cotton-cultivated area The main traits that have been introshyduced in first-generation GM seeds correspond to HT and IR technologies
The focus of this article relies on HT soybeans and IR cotton
IR seeds are engineered to produce a natural toxin found in the soil bacterium Bacillus thuringiensis (Bt) which is lethal to a number of bollworm pests but not to mammals In other words the IR trait works as a substitute for insecticides that control bollworm infestations IR crops have been considered technically and economically efficient for producers allowing savings in labor and machinery used in insecticide applications This potential is higher in regions with high infestationsmdash typically less-developed countries in tropical weather regions with high rates of insecticide use Besides it has also been considered a more efficient tool for managing risk of pest attack allowing reduced expenditure on crop insurance The result in terms of the outcome of interest is straightforward less insecticide usage reduces associated environmental impact
Weeds are strong competitors with soybean plants for nutrients water and sunlight Weed control techniques have evolved from traditional mechanishycal methods to herbicide applications which were introduced in the 1960rsquos Soybean seeds engineered with HT traits were introduced in 1996 under the commercial name Roundup Readyreg They are the result of the transfer of part of the genetic code of a soil bacshyterium Agrobacterium tumefaciens which allows the plant to metabolize the herbicide glyphosate (Roundup) In 1998 soybean varieties tolerant to the herbicide glufosinate were introshyduced under the commercial name Liberty Linkreg These herbicides are considered less toxic than others and
Giannini Foundation of Agricultural Economics bull University of California
Insecticies (Kgha)
Insecticides +
(EIQ) Herbicides
(Kgha) Herbicides+
(EIQ)
Table 1 Estimates of Impact of IR Cotton and HT Soybeans on Quantity of Pesticides (Insecticides and Herbicides) and Environmental Impact (EIQ)
IR Cotton -0242 -0234 - -[0037] [0035] - -
HT Soybean - - 0442 0356
- - [0056] [0049]
N 120 120 170 170
r2 0913 0918 0755 0790 + Robust standard errors p lt 005 p lt 001 p lt 0001
Coefficients multiplied by 100 indicate approximate percentage variation
target a large variety of broad-leaf and grass weeds species but cause severe damage to conventional crops when applied after germination
By making the soybean plant less susceptible to damage caused by those chemicals the HT trait induces farmers to apply more of them The resulting environmental impact is ambiguous though farmers are induced to apply more of less toxic herbicides but the net effect depends on how much they substitute for more toxic ones Hence increasing the share of less toxic hershybicides in the quantity of pesticides applied is not enough to guarantee a reduction in environmental impacts associated with these chemicals
This discussion suggests that meashysuring environmental impacts associshyated with pesticide use is not straightshyforward For HT traits specifically the net effect on environmental impact is an open issue Economists who studied it have focused on the change in the mix
of herbicides to conclude that there are environmental gains allowed by the use of HT traits Nevertheless we argue that weak substitution might undermine this conclusion as we show in the analyshysis that follows on the next section
Empirical Strategy In the empirical analysis we use a unique farm-level dataset originated from a survey conducted by a private firm in Brazil The survey collected data on production revenue costs biotechnology adoption and pestishycides used Information on pesticide use was collected for harvest seasons 2009ndash2011 and covers 839 farms
The dataset is disaggregated by fields within a farm cultivated with conventional or GM seeds In other words for each farm we have potenshytially multiple observations related to fields cultivated with conventional or GM seeds This setup allows us to use within-farm variation for farmers
Table 2 Estimates of Effects of HT Trait on Quantity of Herbicides per Toxicity Level
Herbicides 1 (Kgha)
Herbicides 2 (Kgha)
Herbicides 3 (Kgha)
Herbicides 4 (Kgha)
HT Trait -0084 -0005 0635 0438
[0021] [0054] [0098] [0090]
N 168 168 168 168
r2 0887 0777 0855 0845
Robust standard errors in brackets p lt 005 p lt 001 p lt 0001
Note toxicity levels 1-4 in decreasing order (from more to less toxic) Herbicides based on glyphosate are considered of lower toxicity level
who plant both conventional and GM seeds to identify the effect of adopshytion on the environmental impact of pesticides This empirical strategy holds constant all farm-level characshyteristics that might simultaneously affect the choices of pesticide use and biotechnology adoption such as management skills inputoutput prices location weather shocks etc
The farms surveyed represent large operations with potentially large envishyronmental impacts associated with the scale of production and pesticide use For cotton growers the average total planted area is 2521 ha ranging from 60 ha to 28374 ha For soybean growshyers the average total planted area is 1240 ha ranging from 8 ha to 13500 ha In terms of experience farmers report an average of 224 and 294 years for cotton and soybeans respectively
We measure the environment impact as two outcome variables quantity (Kgha) of active ingredients of chemishycals and the Environmental Impact Quotient (EIQ) index This measure of environmental impact of pesticides was designed to capture risks associshyated with both toxicity levels and exposhysure to chemical pesticides on three components of agricultural systems farmworker consumer and ecological Hence the EIQ index provides a more complete picture than just the comshyposition of the mix of pesticides used allowing for an adequate weighting of pesticides with different toxicity levels
The use of the EIQ index represents a big advancement over previous studshyies which relied on an increased share of less toxic chemicals of the total quanshytity (Kgha) of herbicides applied in HT soybeans fields since this measure cannot capture environmental effects due to substitution between herbicides If the increase in the use of less toxic herbicides is not accompanied by a sufshyficient decrease in more toxic ones the new mix of herbicides induced by HT seeds can be more harmful than the one
10
11 Giannini Foundation of Agricultural Economics bull University of California
induced by conventional seeds The EIQ index calculated for field operations allows us to adequately weight pestishycides of different toxicity levels and gets around the difficulties of looking only at the quantity mix of pesticides used
Findings Our findings are summarized in Table 1 The dependent variables are logs of quantity (Kgha) of pesticides and of the EIQ index The indepenshydent variable of interest is a dummy indicator for adoption of IR cotton or HT soybeans Results show that adopshytion of IR cotton reduces the amount of active ingredients of insecticides used by 242 and the environmental impact index by 234 when compared with fields cultivated with conventional seeds In absolute terms this is equivashylent to a reduction of approximately 0956 Kgha of active ingredients
For HT soybeans although farmshyers use more of less toxic herbicides we estimate that the net environmenshytal impact is higher than for convenshytional seeds We find that adoption of HT seeds causes an increase of 442 of active ingredients (Kgha) and a corresponding 356 increase in the EIQ index when compared with fields cultivated with conshyventional seeds In absolute terms this corresponds to an increase of 0996 Kgha of active ingredients
Table 2 sheds light on the mechashynism that drives the results for HT soyshybeans It shows estimates of the impact of HT seeds on the quantity of active ingredients (Kgha) of herbicides of difshyferent toxicity levels The reductions in higher toxicity herbicides (columns 1 and 2) are very modest when comshypared to the increases in lower toxicity ones (columns 3 and 4) In absolute terms we estimate that the increase in the later is twelvefold the decrease in the former This result indicates that weak substitution among herbishycides of different toxicity levels causes
a net increase in the environmental impact associated with herbicides
Our results confirm the environshymental gains from IR cotton but suggest that the prior findings on the environshymental effects of HT soybeans have been misled by relying solely on the change in the mix of herbicides used
Conclusions In this article we analyze the envishyronmental effects related to the use of pesticides arising from adoption of IR cotton and HT soybean seeds Using within-farm variation across fields treated with conventional and GM seeds we find that IR cotton reduces the amount of insecticides applied to cotton crops HT soybeans on the other hand leads to more use of herbicides
Analysis using the EIQ index shows that IR cotton reduces the envishyronmental impact by about 23 in the treated fields compared to fields cultivated with conventional seeds This is consistent with the previous result on Kgha of insecticides and confirms the environmental impact-saving nature of the IR technology The resulting environmental effects for HT soybeans on the other hand are found to be negative The estimates imply that the impact of herbicides is increased by 356 compared to fields cultivated with conventional seeds
Looking at quantities of herbicides of different toxicity levels we see increases in the use of lower toxicity herbicides and very small reductions in higher toxicity ones This findshying indicates very weak substitution among herbicides which explains the higher environmental impact associshyated with these chemicals caused by adoption of HT soybeans
We believe this to be an imporshytant result for three reasons First it contributes to uncover environmental effects that have been hidden by the qualitative nature of the mix of herbishycides induced by the HT trait Second
environmental policy makers designshying policies for biotechnology adopshytion might consider this new evidence to differentiate among GM traits that produce positive or negative externalishyties Finally as the composition of the EIQ index suggests the environmental impact of pesticides can have multiple dimensions that might involve farmshyworker health and safety consumer safety and ecological impacts Hence the results on HT soybeans suggest additional avenues of work that should be taken to evaluate each of these possible channels since they can also affect other important outcomes
Suggested Citation
Seixas Renato and Joseacute Maria Silveira 2014 Assessing Environmental Impacts of Genetically Modified Seeds in Brazilian Agriculture ARE Update 17(5)9ndash11 University of California Giannini Foundation of Agricultural Economics
Renato Seixas is a PhD candidate in the ARE department at University of California Berkeley He can be contacted by email at rnlseixas berkeleyedu Joseacute Maria Silveira is a professor in the State University of Campinas Institute of Economics in Brazil This article is based on the paper ldquoMore of Less Isnrsquot Less of More Assessing Environmental Impacts of Genetically Modified Seeds in Brazilian Agriculturerdquo Financial support from CAPESFulbright PhD fellowship (grant 2256-08-8) is greatly acknowledged
For additional information the authors recommend
Celeres 2014 Biotech Newsletter Celeres Uberlacircndia (MG) Retrieved from wwwcelerescombr
Kovach J C Petzoldt J Degnil and J Tette 1992 ldquoA Method to Measure the Environmental Impact of Pesticidesrdquo Ithaca NY New York State Agricultural Experiment Station a division of the New York State College of Agriculture and Life Sciences Cornell University
Qaim M 2009 ldquoThe Economics of Genetically Modified Cropsrdquo Annual Review of Resource Economics 1 665 - 694 wwwannualreviews orgdoiabs101146annurev resource050708144203
Department of Agricultural and Resource Economics UC Davis One Shields Avenue Davis CA 95616 GPBS
Agricultural and Resource Economics
UPDATE
Co-Editors
Richard Sexton Sofia Berto Villas-Boas
David Zilberman
Managing Editor and Desktop Publisher
Julie McNamara
Published by the Giannini Foundation of Agricultural Economics
httpgianniniucopedu
ARE Update is published six times per year by the Giannini Foundation of Agricultural Economics University of California
Domestic subscriptions are available free of charge to interested parties To subscribe to ARE Update by mail contact
Julie McNamara Outreach Coordinator Giannini Foundation of Agricultural Economics Department of Agricultural and Resource Economics University of California One Shields Avenue Davis CA 95616 E-mail julieprimalucdavisedu Phone 530-752-5346
To receive notification when new issues of the ARE Update are available online submit an e-mail request to join our listserv to
julieprimalucdavisedu
Articles published herein may be reprinted in their entirety with the authorrsquos or editorsrsquo permission Please credit the Giannini Foundation of Agricultural
Economics University of California
ARE Update is available online httpgianniniucopeduare-update
The University of California is an Equal OpportunityAffirmative Action employer
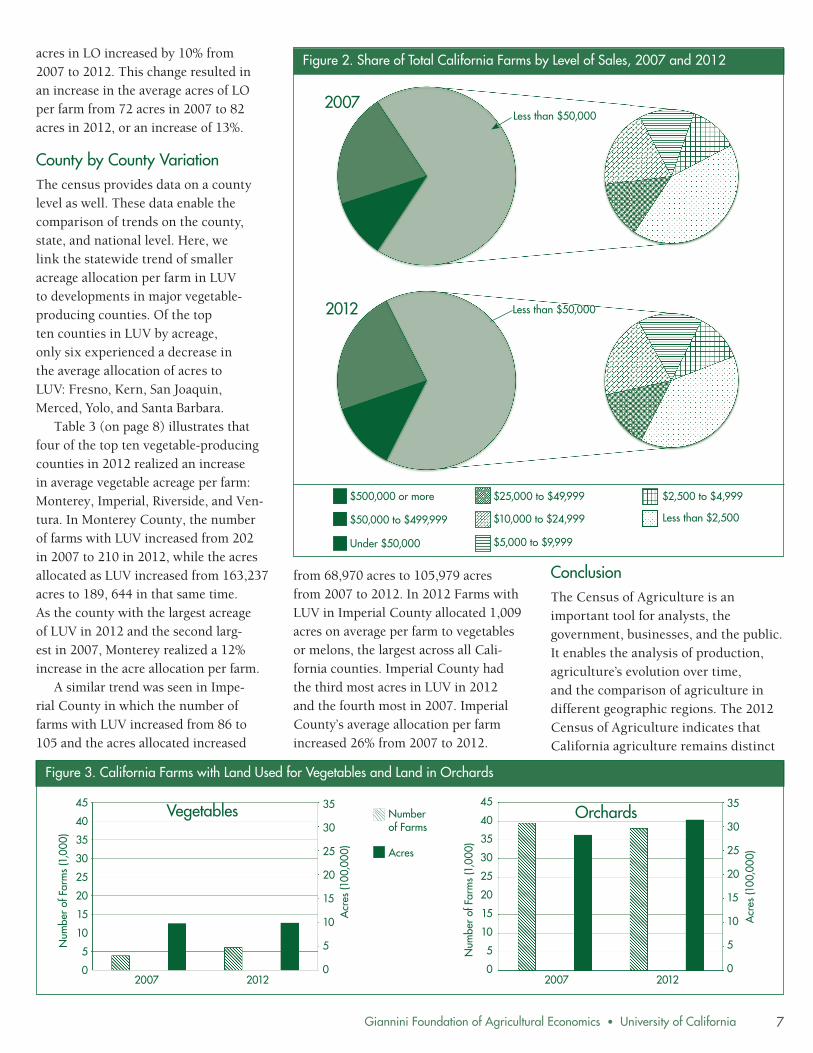
Giannini Foundation of Agricultural Economics bull University of California
acres in LO increased by 10 from 2007 to 2012 This change resulted in an increase in the average acres of LO per farm from 72 acres in 2007 to 82 acres in 2012 or an increase of 13
County by County Variation The census provides data on a county level as well These data enable the comparison of trends on the county state and national level Here we link the statewide trend of smaller acreage allocation per farm in LUV to developments in major vegetable-producing counties Of the top ten counties in LUV by acreage only six experienced a decrease in the average allocation of acres to LUV Fresno Kern San Joaquin Merced Yolo and Santa Barbara
Table 3 (on page 8) illustrates that four of the top ten vegetable-producing counties in 2012 realized an increase in average vegetable acreage per farm Monterey Imperial Riverside and Venshytura In Monterey County the number of farms with LUV increased from 202 in 2007 to 210 in 2012 while the acres allocated as LUV increased from 163237 acres to 189 644 in that same time As the county with the largest acreage of LUV in 2012 and the second largshyest in 2007 Monterey realized a 12 increase in the acre allocation per farm
A similar trend was seen in Impeshyrial County in which the number of farms with LUV increased from 86 to 105 and the acres allocated increased
Figure 2 Share of Total California Farms by Level of Sales 2007 and 2012
Less than $50000
Less than $50000
2007
2012
$500000 or more
Under $50000
$50000 to $499999
$25000 to $49999
$10000 to $24999
$5000 to $9999
$2500 to $4999
Less than $2500
from 68970 acres to 105979 acres from 2007 to 2012 In 2012 Farms with LUV in Imperial County allocated 1009 acres on average per farm to vegetables or melons the largest across all Calishyfornia counties Imperial County had the third most acres in LUV in 2012 and the fourth most in 2007 Imperial Countyrsquos average allocation per farm increased 26 from 2007 to 2012
Conclusion The Census of Agriculture is an important tool for analysts the government businesses and the public It enables the analysis of production agriculturersquos evolution over time and the comparison of agriculture in different geographic regions The 2012 Census of Agriculture indicates that California agriculture remains distinct
Figure 3 California Farms with Land Used for Vegetables and Land in Orchards
4545 35 35 Number 4040 3030 of Farms
35 35
Vegetables
0
Orchards
2007 2012
Num
ber
of F
arm
s (1
000
)
Num
ber
of F
arm
s (1
000
)
25
Acr
es (1
000
00) 25
20
15
Acres
Acr
es (1
000
00)
30
25
20
30
25
20
20
15 1515
1010 1010
55 55
00 2007 2012
7
0
Giannini Foundation of Agricultural Economics bull University of California
County
Number of Farms with
Land Used for Vegetables
Land Used for
Vegetables (Acres)
Share of CA Land Used for
Vegetables
Average Land Used for
Vegetables per Farm
Table 3 Land Used for Vegetables in the Top Ten Counties by Acreage in California 2012 and 2007
2012 Monterey 210 189644 19 903
Fresno 564 166810 17 296
Imperial 105 105979 11 1009
Kern 167 84962 9 509
San Joaquin 193 52651 5 273
Merced 223 51119 5 229
Yolo 114 43449 4 381
Santa Barbara 222 40594 4 183
Riverside 155 30529 3 197
Ventura 106 25027 3 236
All other 3996 194971 20 49
California 6055 985735 163
2007 Fresno 559 186565 19 334
Monterey 202 163237 17 808
Kern 138 77362 8 561
Imperial 86 68970 7 802
San Joaquin 181 66652 7 368
Merced 176 58671 6 333
Yolo 96 48034 5 500
Santa Barbara 145 42436 4 293
Kings 53 28982 3 547
Ventura 118 24458 3 207
All Other 2114 203646 21 96
California 3868 969013 251
Source 2012 Census of Agriculture
Some counties such as Imperial and Monterey with some of the largest total acreage of LUV experienced an increase in their average acre allocation per farm Other counties such as Fresno Santa Barbara and Yolo experienced a decrease in their average acre allocation to LUV per farm similar to the state trend The 2012 Census of Agriculture confirms that the agricultural landscape of California is diverse and general trends do not hold for all commodities
Suggested Citation
Knoesen EC and RE Goodhue 2014 How California Farms Measure Up in the 2012 Census of Agriculture Smaller in Size with Higher Value of Production ARE Update 17(5)5-8 University of California Giannini Foundation of Agricultural Economics
Emma Knoesen is a student research associate in the Department of Agriculture and Resource Economics at UC Davis and a sophomore at Scripps College Rachael Goodhue is a professor in the ARE department at UC Davis and a member of the Giannini Foundation of Agricultural Economics She may be contacted at goodhueprimalucdavisedu
For additional information the authors recommend
2012 Census of Agriculture wwwagcensususdaorg Publications2012 The site includes expanded descriptions of methodology and information
from US agriculture as a whole although in both cases farms continue to grow larger in both acreage and market value of production California tended to be smaller on average by acres than the rest of the country yet continued to have farms with higher market value of production from high-value crops Though the total number of farms in California decreased from 2007 to 2012 the total market value of production of California farms increased by just over one-quarter
However the trend towards larger
farms was not universal across all farm typesmdashat least not when measured in acres LO followed the national as well as state trend with the avershyage acreage allocated by each farm to orchard production growing by 13 Land Used for Vegetable followed a different trend with a smaller acre allocation per farm producing vegshyetables and melons in 2012 than in 2007 The number of acres per farm with LUV decreased just over 35
However this trend was not conshysistent in every county in California
on other states as well as previous censuses
8
9 Giannini Foundation of Agricultural Economics bull University of California
Assessing Environmental Impacts of Genetically Modified Seeds in Brazilian Agriculture Renato Seixas and Joseacute Maria Silveira
Using a farm-level dataset on geneshytically modified (GM) seed adoption and pesticide application in Brazil we find that Insect Resistant (IR) cotton reduces the environmental impact of insecticides but Herbicide Tolerant (HT) soybeans increase the environshymental impact of herbicides due to weak substitution among herbicides of different toxicity levels
Genetically modified (GM) seeds have been considered one of the major technological
innovations for agricultural systems and have been promoted as an effecshytive tool for controlling agricultural pests and expanding food supply Their relevance can also be measured by the wide span of controversial issues that have been raised by the related litshyerature such as intellectual property rights over organisms productivity effects economic returns consumer safety welfare and income distribushytion and environmental effects
On the environmental front benshyefits from adoption of GM seeds have been argued based on findings about pesticide use and agricultural pracshytices Insect Resistant (IR) cotton has been found to reduce the use of insecticides and therefore produce environmental health and safety gains Herbicide Tolerant (HT) soyshybeans have been found to change the mix of herbicides applied towards less toxic chemicals and to allow the use
of no-till cultivation techniques leadshying researchers to conclude that they also produce environmental benefits
This article addresses the envishyronmental impacts associated with pesticides use resulting from adopshytion of GM seeds in Brazil We innoshyvate relative to previous works on this topic by employing a broader measure of environmental impact that takes into account toxicity levels and risk of exposure in evaluating the effects of pesticides for different dimensions of agricultural systems Hence we are able to uncover envishyronmental impacts that have been hidden by the qualitative nature of the change in the mix of pesticides used
GM Seeds and Pesticides Use Since the mid 1990s when first-genshyeration GM seeds were commercially introduced adoption by farmers has grown steadily in industrialized and developing countries as they provide an alternative and more convenient way of controlling pest damage By 2008 133 million farmers dedicated 8 of total cropland (125 million ha) to the cultivation of GM seeds The leading countries in terms of share of cultivated area in 2009 were the United States (50) Argenshytina (17) Brazil (13) India (6) Canada (6) and China (3)
In Brazil the most recent nationwide survey on agricultural biotechnology adoption indicates that GM seeds acshycount for 918 (274 million ha) of soybean cultivated area 816 (124 million ha) of maize and 65 (071 million ha) of cotton-cultivated area The main traits that have been introshyduced in first-generation GM seeds correspond to HT and IR technologies
The focus of this article relies on HT soybeans and IR cotton
IR seeds are engineered to produce a natural toxin found in the soil bacterium Bacillus thuringiensis (Bt) which is lethal to a number of bollworm pests but not to mammals In other words the IR trait works as a substitute for insecticides that control bollworm infestations IR crops have been considered technically and economically efficient for producers allowing savings in labor and machinery used in insecticide applications This potential is higher in regions with high infestationsmdash typically less-developed countries in tropical weather regions with high rates of insecticide use Besides it has also been considered a more efficient tool for managing risk of pest attack allowing reduced expenditure on crop insurance The result in terms of the outcome of interest is straightforward less insecticide usage reduces associated environmental impact
Weeds are strong competitors with soybean plants for nutrients water and sunlight Weed control techniques have evolved from traditional mechanishycal methods to herbicide applications which were introduced in the 1960rsquos Soybean seeds engineered with HT traits were introduced in 1996 under the commercial name Roundup Readyreg They are the result of the transfer of part of the genetic code of a soil bacshyterium Agrobacterium tumefaciens which allows the plant to metabolize the herbicide glyphosate (Roundup) In 1998 soybean varieties tolerant to the herbicide glufosinate were introshyduced under the commercial name Liberty Linkreg These herbicides are considered less toxic than others and
Giannini Foundation of Agricultural Economics bull University of California
Insecticies (Kgha)
Insecticides +
(EIQ) Herbicides
(Kgha) Herbicides+
(EIQ)
Table 1 Estimates of Impact of IR Cotton and HT Soybeans on Quantity of Pesticides (Insecticides and Herbicides) and Environmental Impact (EIQ)
IR Cotton -0242 -0234 - -[0037] [0035] - -
HT Soybean - - 0442 0356
- - [0056] [0049]
N 120 120 170 170
r2 0913 0918 0755 0790 + Robust standard errors p lt 005 p lt 001 p lt 0001
Coefficients multiplied by 100 indicate approximate percentage variation
target a large variety of broad-leaf and grass weeds species but cause severe damage to conventional crops when applied after germination
By making the soybean plant less susceptible to damage caused by those chemicals the HT trait induces farmers to apply more of them The resulting environmental impact is ambiguous though farmers are induced to apply more of less toxic herbicides but the net effect depends on how much they substitute for more toxic ones Hence increasing the share of less toxic hershybicides in the quantity of pesticides applied is not enough to guarantee a reduction in environmental impacts associated with these chemicals
This discussion suggests that meashysuring environmental impacts associshyated with pesticide use is not straightshyforward For HT traits specifically the net effect on environmental impact is an open issue Economists who studied it have focused on the change in the mix
of herbicides to conclude that there are environmental gains allowed by the use of HT traits Nevertheless we argue that weak substitution might undermine this conclusion as we show in the analyshysis that follows on the next section
Empirical Strategy In the empirical analysis we use a unique farm-level dataset originated from a survey conducted by a private firm in Brazil The survey collected data on production revenue costs biotechnology adoption and pestishycides used Information on pesticide use was collected for harvest seasons 2009ndash2011 and covers 839 farms
The dataset is disaggregated by fields within a farm cultivated with conventional or GM seeds In other words for each farm we have potenshytially multiple observations related to fields cultivated with conventional or GM seeds This setup allows us to use within-farm variation for farmers
Table 2 Estimates of Effects of HT Trait on Quantity of Herbicides per Toxicity Level
Herbicides 1 (Kgha)
Herbicides 2 (Kgha)
Herbicides 3 (Kgha)
Herbicides 4 (Kgha)
HT Trait -0084 -0005 0635 0438
[0021] [0054] [0098] [0090]
N 168 168 168 168
r2 0887 0777 0855 0845
Robust standard errors in brackets p lt 005 p lt 001 p lt 0001
Note toxicity levels 1-4 in decreasing order (from more to less toxic) Herbicides based on glyphosate are considered of lower toxicity level
who plant both conventional and GM seeds to identify the effect of adopshytion on the environmental impact of pesticides This empirical strategy holds constant all farm-level characshyteristics that might simultaneously affect the choices of pesticide use and biotechnology adoption such as management skills inputoutput prices location weather shocks etc
The farms surveyed represent large operations with potentially large envishyronmental impacts associated with the scale of production and pesticide use For cotton growers the average total planted area is 2521 ha ranging from 60 ha to 28374 ha For soybean growshyers the average total planted area is 1240 ha ranging from 8 ha to 13500 ha In terms of experience farmers report an average of 224 and 294 years for cotton and soybeans respectively
We measure the environment impact as two outcome variables quantity (Kgha) of active ingredients of chemishycals and the Environmental Impact Quotient (EIQ) index This measure of environmental impact of pesticides was designed to capture risks associshyated with both toxicity levels and exposhysure to chemical pesticides on three components of agricultural systems farmworker consumer and ecological Hence the EIQ index provides a more complete picture than just the comshyposition of the mix of pesticides used allowing for an adequate weighting of pesticides with different toxicity levels
The use of the EIQ index represents a big advancement over previous studshyies which relied on an increased share of less toxic chemicals of the total quanshytity (Kgha) of herbicides applied in HT soybeans fields since this measure cannot capture environmental effects due to substitution between herbicides If the increase in the use of less toxic herbicides is not accompanied by a sufshyficient decrease in more toxic ones the new mix of herbicides induced by HT seeds can be more harmful than the one
10
11 Giannini Foundation of Agricultural Economics bull University of California
induced by conventional seeds The EIQ index calculated for field operations allows us to adequately weight pestishycides of different toxicity levels and gets around the difficulties of looking only at the quantity mix of pesticides used
Findings Our findings are summarized in Table 1 The dependent variables are logs of quantity (Kgha) of pesticides and of the EIQ index The indepenshydent variable of interest is a dummy indicator for adoption of IR cotton or HT soybeans Results show that adopshytion of IR cotton reduces the amount of active ingredients of insecticides used by 242 and the environmental impact index by 234 when compared with fields cultivated with conventional seeds In absolute terms this is equivashylent to a reduction of approximately 0956 Kgha of active ingredients
For HT soybeans although farmshyers use more of less toxic herbicides we estimate that the net environmenshytal impact is higher than for convenshytional seeds We find that adoption of HT seeds causes an increase of 442 of active ingredients (Kgha) and a corresponding 356 increase in the EIQ index when compared with fields cultivated with conshyventional seeds In absolute terms this corresponds to an increase of 0996 Kgha of active ingredients
Table 2 sheds light on the mechashynism that drives the results for HT soyshybeans It shows estimates of the impact of HT seeds on the quantity of active ingredients (Kgha) of herbicides of difshyferent toxicity levels The reductions in higher toxicity herbicides (columns 1 and 2) are very modest when comshypared to the increases in lower toxicity ones (columns 3 and 4) In absolute terms we estimate that the increase in the later is twelvefold the decrease in the former This result indicates that weak substitution among herbishycides of different toxicity levels causes
a net increase in the environmental impact associated with herbicides
Our results confirm the environshymental gains from IR cotton but suggest that the prior findings on the environshymental effects of HT soybeans have been misled by relying solely on the change in the mix of herbicides used
Conclusions In this article we analyze the envishyronmental effects related to the use of pesticides arising from adoption of IR cotton and HT soybean seeds Using within-farm variation across fields treated with conventional and GM seeds we find that IR cotton reduces the amount of insecticides applied to cotton crops HT soybeans on the other hand leads to more use of herbicides
Analysis using the EIQ index shows that IR cotton reduces the envishyronmental impact by about 23 in the treated fields compared to fields cultivated with conventional seeds This is consistent with the previous result on Kgha of insecticides and confirms the environmental impact-saving nature of the IR technology The resulting environmental effects for HT soybeans on the other hand are found to be negative The estimates imply that the impact of herbicides is increased by 356 compared to fields cultivated with conventional seeds
Looking at quantities of herbicides of different toxicity levels we see increases in the use of lower toxicity herbicides and very small reductions in higher toxicity ones This findshying indicates very weak substitution among herbicides which explains the higher environmental impact associshyated with these chemicals caused by adoption of HT soybeans
We believe this to be an imporshytant result for three reasons First it contributes to uncover environmental effects that have been hidden by the qualitative nature of the mix of herbishycides induced by the HT trait Second
environmental policy makers designshying policies for biotechnology adopshytion might consider this new evidence to differentiate among GM traits that produce positive or negative externalishyties Finally as the composition of the EIQ index suggests the environmental impact of pesticides can have multiple dimensions that might involve farmshyworker health and safety consumer safety and ecological impacts Hence the results on HT soybeans suggest additional avenues of work that should be taken to evaluate each of these possible channels since they can also affect other important outcomes
Suggested Citation
Seixas Renato and Joseacute Maria Silveira 2014 Assessing Environmental Impacts of Genetically Modified Seeds in Brazilian Agriculture ARE Update 17(5)9ndash11 University of California Giannini Foundation of Agricultural Economics
Renato Seixas is a PhD candidate in the ARE department at University of California Berkeley He can be contacted by email at rnlseixas berkeleyedu Joseacute Maria Silveira is a professor in the State University of Campinas Institute of Economics in Brazil This article is based on the paper ldquoMore of Less Isnrsquot Less of More Assessing Environmental Impacts of Genetically Modified Seeds in Brazilian Agriculturerdquo Financial support from CAPESFulbright PhD fellowship (grant 2256-08-8) is greatly acknowledged
For additional information the authors recommend
Celeres 2014 Biotech Newsletter Celeres Uberlacircndia (MG) Retrieved from wwwcelerescombr
Kovach J C Petzoldt J Degnil and J Tette 1992 ldquoA Method to Measure the Environmental Impact of Pesticidesrdquo Ithaca NY New York State Agricultural Experiment Station a division of the New York State College of Agriculture and Life Sciences Cornell University
Qaim M 2009 ldquoThe Economics of Genetically Modified Cropsrdquo Annual Review of Resource Economics 1 665 - 694 wwwannualreviews orgdoiabs101146annurev resource050708144203
Department of Agricultural and Resource Economics UC Davis One Shields Avenue Davis CA 95616 GPBS
Agricultural and Resource Economics
UPDATE
Co-Editors
Richard Sexton Sofia Berto Villas-Boas
David Zilberman
Managing Editor and Desktop Publisher
Julie McNamara
Published by the Giannini Foundation of Agricultural Economics
httpgianniniucopedu
ARE Update is published six times per year by the Giannini Foundation of Agricultural Economics University of California
Domestic subscriptions are available free of charge to interested parties To subscribe to ARE Update by mail contact
Julie McNamara Outreach Coordinator Giannini Foundation of Agricultural Economics Department of Agricultural and Resource Economics University of California One Shields Avenue Davis CA 95616 E-mail julieprimalucdavisedu Phone 530-752-5346
To receive notification when new issues of the ARE Update are available online submit an e-mail request to join our listserv to
julieprimalucdavisedu
Articles published herein may be reprinted in their entirety with the authorrsquos or editorsrsquo permission Please credit the Giannini Foundation of Agricultural
Economics University of California
ARE Update is available online httpgianniniucopeduare-update
The University of California is an Equal OpportunityAffirmative Action employer
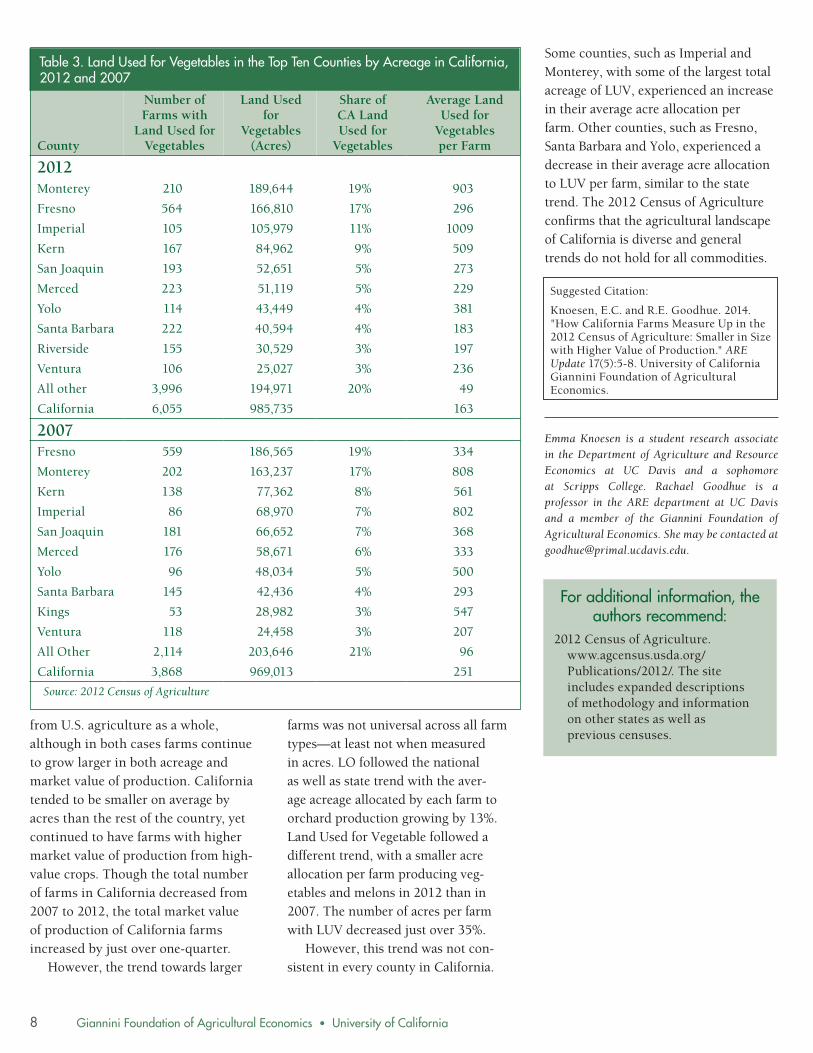
Giannini Foundation of Agricultural Economics bull University of California
County
Number of Farms with
Land Used for Vegetables
Land Used for
Vegetables (Acres)
Share of CA Land Used for
Vegetables
Average Land Used for
Vegetables per Farm
Table 3 Land Used for Vegetables in the Top Ten Counties by Acreage in California 2012 and 2007
2012 Monterey 210 189644 19 903
Fresno 564 166810 17 296
Imperial 105 105979 11 1009
Kern 167 84962 9 509
San Joaquin 193 52651 5 273
Merced 223 51119 5 229
Yolo 114 43449 4 381
Santa Barbara 222 40594 4 183
Riverside 155 30529 3 197
Ventura 106 25027 3 236
All other 3996 194971 20 49
California 6055 985735 163
2007 Fresno 559 186565 19 334
Monterey 202 163237 17 808
Kern 138 77362 8 561
Imperial 86 68970 7 802
San Joaquin 181 66652 7 368
Merced 176 58671 6 333
Yolo 96 48034 5 500
Santa Barbara 145 42436 4 293
Kings 53 28982 3 547
Ventura 118 24458 3 207
All Other 2114 203646 21 96
California 3868 969013 251
Source 2012 Census of Agriculture
Some counties such as Imperial and Monterey with some of the largest total acreage of LUV experienced an increase in their average acre allocation per farm Other counties such as Fresno Santa Barbara and Yolo experienced a decrease in their average acre allocation to LUV per farm similar to the state trend The 2012 Census of Agriculture confirms that the agricultural landscape of California is diverse and general trends do not hold for all commodities
Suggested Citation
Knoesen EC and RE Goodhue 2014 How California Farms Measure Up in the 2012 Census of Agriculture Smaller in Size with Higher Value of Production ARE Update 17(5)5-8 University of California Giannini Foundation of Agricultural Economics
Emma Knoesen is a student research associate in the Department of Agriculture and Resource Economics at UC Davis and a sophomore at Scripps College Rachael Goodhue is a professor in the ARE department at UC Davis and a member of the Giannini Foundation of Agricultural Economics She may be contacted at goodhueprimalucdavisedu
For additional information the authors recommend
2012 Census of Agriculture wwwagcensususdaorg Publications2012 The site includes expanded descriptions of methodology and information
from US agriculture as a whole although in both cases farms continue to grow larger in both acreage and market value of production California tended to be smaller on average by acres than the rest of the country yet continued to have farms with higher market value of production from high-value crops Though the total number of farms in California decreased from 2007 to 2012 the total market value of production of California farms increased by just over one-quarter
However the trend towards larger
farms was not universal across all farm typesmdashat least not when measured in acres LO followed the national as well as state trend with the avershyage acreage allocated by each farm to orchard production growing by 13 Land Used for Vegetable followed a different trend with a smaller acre allocation per farm producing vegshyetables and melons in 2012 than in 2007 The number of acres per farm with LUV decreased just over 35
However this trend was not conshysistent in every county in California
on other states as well as previous censuses
8
9 Giannini Foundation of Agricultural Economics bull University of California
Assessing Environmental Impacts of Genetically Modified Seeds in Brazilian Agriculture Renato Seixas and Joseacute Maria Silveira
Using a farm-level dataset on geneshytically modified (GM) seed adoption and pesticide application in Brazil we find that Insect Resistant (IR) cotton reduces the environmental impact of insecticides but Herbicide Tolerant (HT) soybeans increase the environshymental impact of herbicides due to weak substitution among herbicides of different toxicity levels
Genetically modified (GM) seeds have been considered one of the major technological
innovations for agricultural systems and have been promoted as an effecshytive tool for controlling agricultural pests and expanding food supply Their relevance can also be measured by the wide span of controversial issues that have been raised by the related litshyerature such as intellectual property rights over organisms productivity effects economic returns consumer safety welfare and income distribushytion and environmental effects
On the environmental front benshyefits from adoption of GM seeds have been argued based on findings about pesticide use and agricultural pracshytices Insect Resistant (IR) cotton has been found to reduce the use of insecticides and therefore produce environmental health and safety gains Herbicide Tolerant (HT) soyshybeans have been found to change the mix of herbicides applied towards less toxic chemicals and to allow the use
of no-till cultivation techniques leadshying researchers to conclude that they also produce environmental benefits
This article addresses the envishyronmental impacts associated with pesticides use resulting from adopshytion of GM seeds in Brazil We innoshyvate relative to previous works on this topic by employing a broader measure of environmental impact that takes into account toxicity levels and risk of exposure in evaluating the effects of pesticides for different dimensions of agricultural systems Hence we are able to uncover envishyronmental impacts that have been hidden by the qualitative nature of the change in the mix of pesticides used
GM Seeds and Pesticides Use Since the mid 1990s when first-genshyeration GM seeds were commercially introduced adoption by farmers has grown steadily in industrialized and developing countries as they provide an alternative and more convenient way of controlling pest damage By 2008 133 million farmers dedicated 8 of total cropland (125 million ha) to the cultivation of GM seeds The leading countries in terms of share of cultivated area in 2009 were the United States (50) Argenshytina (17) Brazil (13) India (6) Canada (6) and China (3)
In Brazil the most recent nationwide survey on agricultural biotechnology adoption indicates that GM seeds acshycount for 918 (274 million ha) of soybean cultivated area 816 (124 million ha) of maize and 65 (071 million ha) of cotton-cultivated area The main traits that have been introshyduced in first-generation GM seeds correspond to HT and IR technologies
The focus of this article relies on HT soybeans and IR cotton
IR seeds are engineered to produce a natural toxin found in the soil bacterium Bacillus thuringiensis (Bt) which is lethal to a number of bollworm pests but not to mammals In other words the IR trait works as a substitute for insecticides that control bollworm infestations IR crops have been considered technically and economically efficient for producers allowing savings in labor and machinery used in insecticide applications This potential is higher in regions with high infestationsmdash typically less-developed countries in tropical weather regions with high rates of insecticide use Besides it has also been considered a more efficient tool for managing risk of pest attack allowing reduced expenditure on crop insurance The result in terms of the outcome of interest is straightforward less insecticide usage reduces associated environmental impact
Weeds are strong competitors with soybean plants for nutrients water and sunlight Weed control techniques have evolved from traditional mechanishycal methods to herbicide applications which were introduced in the 1960rsquos Soybean seeds engineered with HT traits were introduced in 1996 under the commercial name Roundup Readyreg They are the result of the transfer of part of the genetic code of a soil bacshyterium Agrobacterium tumefaciens which allows the plant to metabolize the herbicide glyphosate (Roundup) In 1998 soybean varieties tolerant to the herbicide glufosinate were introshyduced under the commercial name Liberty Linkreg These herbicides are considered less toxic than others and
Giannini Foundation of Agricultural Economics bull University of California
Insecticies (Kgha)
Insecticides +
(EIQ) Herbicides
(Kgha) Herbicides+
(EIQ)
Table 1 Estimates of Impact of IR Cotton and HT Soybeans on Quantity of Pesticides (Insecticides and Herbicides) and Environmental Impact (EIQ)
IR Cotton -0242 -0234 - -[0037] [0035] - -
HT Soybean - - 0442 0356
- - [0056] [0049]
N 120 120 170 170
r2 0913 0918 0755 0790 + Robust standard errors p lt 005 p lt 001 p lt 0001
Coefficients multiplied by 100 indicate approximate percentage variation
target a large variety of broad-leaf and grass weeds species but cause severe damage to conventional crops when applied after germination
By making the soybean plant less susceptible to damage caused by those chemicals the HT trait induces farmers to apply more of them The resulting environmental impact is ambiguous though farmers are induced to apply more of less toxic herbicides but the net effect depends on how much they substitute for more toxic ones Hence increasing the share of less toxic hershybicides in the quantity of pesticides applied is not enough to guarantee a reduction in environmental impacts associated with these chemicals
This discussion suggests that meashysuring environmental impacts associshyated with pesticide use is not straightshyforward For HT traits specifically the net effect on environmental impact is an open issue Economists who studied it have focused on the change in the mix
of herbicides to conclude that there are environmental gains allowed by the use of HT traits Nevertheless we argue that weak substitution might undermine this conclusion as we show in the analyshysis that follows on the next section
Empirical Strategy In the empirical analysis we use a unique farm-level dataset originated from a survey conducted by a private firm in Brazil The survey collected data on production revenue costs biotechnology adoption and pestishycides used Information on pesticide use was collected for harvest seasons 2009ndash2011 and covers 839 farms
The dataset is disaggregated by fields within a farm cultivated with conventional or GM seeds In other words for each farm we have potenshytially multiple observations related to fields cultivated with conventional or GM seeds This setup allows us to use within-farm variation for farmers
Table 2 Estimates of Effects of HT Trait on Quantity of Herbicides per Toxicity Level
Herbicides 1 (Kgha)
Herbicides 2 (Kgha)
Herbicides 3 (Kgha)
Herbicides 4 (Kgha)
HT Trait -0084 -0005 0635 0438
[0021] [0054] [0098] [0090]
N 168 168 168 168
r2 0887 0777 0855 0845
Robust standard errors in brackets p lt 005 p lt 001 p lt 0001
Note toxicity levels 1-4 in decreasing order (from more to less toxic) Herbicides based on glyphosate are considered of lower toxicity level
who plant both conventional and GM seeds to identify the effect of adopshytion on the environmental impact of pesticides This empirical strategy holds constant all farm-level characshyteristics that might simultaneously affect the choices of pesticide use and biotechnology adoption such as management skills inputoutput prices location weather shocks etc
The farms surveyed represent large operations with potentially large envishyronmental impacts associated with the scale of production and pesticide use For cotton growers the average total planted area is 2521 ha ranging from 60 ha to 28374 ha For soybean growshyers the average total planted area is 1240 ha ranging from 8 ha to 13500 ha In terms of experience farmers report an average of 224 and 294 years for cotton and soybeans respectively
We measure the environment impact as two outcome variables quantity (Kgha) of active ingredients of chemishycals and the Environmental Impact Quotient (EIQ) index This measure of environmental impact of pesticides was designed to capture risks associshyated with both toxicity levels and exposhysure to chemical pesticides on three components of agricultural systems farmworker consumer and ecological Hence the EIQ index provides a more complete picture than just the comshyposition of the mix of pesticides used allowing for an adequate weighting of pesticides with different toxicity levels
The use of the EIQ index represents a big advancement over previous studshyies which relied on an increased share of less toxic chemicals of the total quanshytity (Kgha) of herbicides applied in HT soybeans fields since this measure cannot capture environmental effects due to substitution between herbicides If the increase in the use of less toxic herbicides is not accompanied by a sufshyficient decrease in more toxic ones the new mix of herbicides induced by HT seeds can be more harmful than the one
10
11 Giannini Foundation of Agricultural Economics bull University of California
induced by conventional seeds The EIQ index calculated for field operations allows us to adequately weight pestishycides of different toxicity levels and gets around the difficulties of looking only at the quantity mix of pesticides used
Findings Our findings are summarized in Table 1 The dependent variables are logs of quantity (Kgha) of pesticides and of the EIQ index The indepenshydent variable of interest is a dummy indicator for adoption of IR cotton or HT soybeans Results show that adopshytion of IR cotton reduces the amount of active ingredients of insecticides used by 242 and the environmental impact index by 234 when compared with fields cultivated with conventional seeds In absolute terms this is equivashylent to a reduction of approximately 0956 Kgha of active ingredients
For HT soybeans although farmshyers use more of less toxic herbicides we estimate that the net environmenshytal impact is higher than for convenshytional seeds We find that adoption of HT seeds causes an increase of 442 of active ingredients (Kgha) and a corresponding 356 increase in the EIQ index when compared with fields cultivated with conshyventional seeds In absolute terms this corresponds to an increase of 0996 Kgha of active ingredients
Table 2 sheds light on the mechashynism that drives the results for HT soyshybeans It shows estimates of the impact of HT seeds on the quantity of active ingredients (Kgha) of herbicides of difshyferent toxicity levels The reductions in higher toxicity herbicides (columns 1 and 2) are very modest when comshypared to the increases in lower toxicity ones (columns 3 and 4) In absolute terms we estimate that the increase in the later is twelvefold the decrease in the former This result indicates that weak substitution among herbishycides of different toxicity levels causes
a net increase in the environmental impact associated with herbicides
Our results confirm the environshymental gains from IR cotton but suggest that the prior findings on the environshymental effects of HT soybeans have been misled by relying solely on the change in the mix of herbicides used
Conclusions In this article we analyze the envishyronmental effects related to the use of pesticides arising from adoption of IR cotton and HT soybean seeds Using within-farm variation across fields treated with conventional and GM seeds we find that IR cotton reduces the amount of insecticides applied to cotton crops HT soybeans on the other hand leads to more use of herbicides
Analysis using the EIQ index shows that IR cotton reduces the envishyronmental impact by about 23 in the treated fields compared to fields cultivated with conventional seeds This is consistent with the previous result on Kgha of insecticides and confirms the environmental impact-saving nature of the IR technology The resulting environmental effects for HT soybeans on the other hand are found to be negative The estimates imply that the impact of herbicides is increased by 356 compared to fields cultivated with conventional seeds
Looking at quantities of herbicides of different toxicity levels we see increases in the use of lower toxicity herbicides and very small reductions in higher toxicity ones This findshying indicates very weak substitution among herbicides which explains the higher environmental impact associshyated with these chemicals caused by adoption of HT soybeans
We believe this to be an imporshytant result for three reasons First it contributes to uncover environmental effects that have been hidden by the qualitative nature of the mix of herbishycides induced by the HT trait Second
environmental policy makers designshying policies for biotechnology adopshytion might consider this new evidence to differentiate among GM traits that produce positive or negative externalishyties Finally as the composition of the EIQ index suggests the environmental impact of pesticides can have multiple dimensions that might involve farmshyworker health and safety consumer safety and ecological impacts Hence the results on HT soybeans suggest additional avenues of work that should be taken to evaluate each of these possible channels since they can also affect other important outcomes
Suggested Citation
Seixas Renato and Joseacute Maria Silveira 2014 Assessing Environmental Impacts of Genetically Modified Seeds in Brazilian Agriculture ARE Update 17(5)9ndash11 University of California Giannini Foundation of Agricultural Economics
Renato Seixas is a PhD candidate in the ARE department at University of California Berkeley He can be contacted by email at rnlseixas berkeleyedu Joseacute Maria Silveira is a professor in the State University of Campinas Institute of Economics in Brazil This article is based on the paper ldquoMore of Less Isnrsquot Less of More Assessing Environmental Impacts of Genetically Modified Seeds in Brazilian Agriculturerdquo Financial support from CAPESFulbright PhD fellowship (grant 2256-08-8) is greatly acknowledged
For additional information the authors recommend
Celeres 2014 Biotech Newsletter Celeres Uberlacircndia (MG) Retrieved from wwwcelerescombr
Kovach J C Petzoldt J Degnil and J Tette 1992 ldquoA Method to Measure the Environmental Impact of Pesticidesrdquo Ithaca NY New York State Agricultural Experiment Station a division of the New York State College of Agriculture and Life Sciences Cornell University
Qaim M 2009 ldquoThe Economics of Genetically Modified Cropsrdquo Annual Review of Resource Economics 1 665 - 694 wwwannualreviews orgdoiabs101146annurev resource050708144203
Department of Agricultural and Resource Economics UC Davis One Shields Avenue Davis CA 95616 GPBS
Agricultural and Resource Economics
UPDATE
Co-Editors
Richard Sexton Sofia Berto Villas-Boas
David Zilberman
Managing Editor and Desktop Publisher
Julie McNamara
Published by the Giannini Foundation of Agricultural Economics
httpgianniniucopedu
ARE Update is published six times per year by the Giannini Foundation of Agricultural Economics University of California
Domestic subscriptions are available free of charge to interested parties To subscribe to ARE Update by mail contact
Julie McNamara Outreach Coordinator Giannini Foundation of Agricultural Economics Department of Agricultural and Resource Economics University of California One Shields Avenue Davis CA 95616 E-mail julieprimalucdavisedu Phone 530-752-5346
To receive notification when new issues of the ARE Update are available online submit an e-mail request to join our listserv to
julieprimalucdavisedu
Articles published herein may be reprinted in their entirety with the authorrsquos or editorsrsquo permission Please credit the Giannini Foundation of Agricultural
Economics University of California
ARE Update is available online httpgianniniucopeduare-update
The University of California is an Equal OpportunityAffirmative Action employer
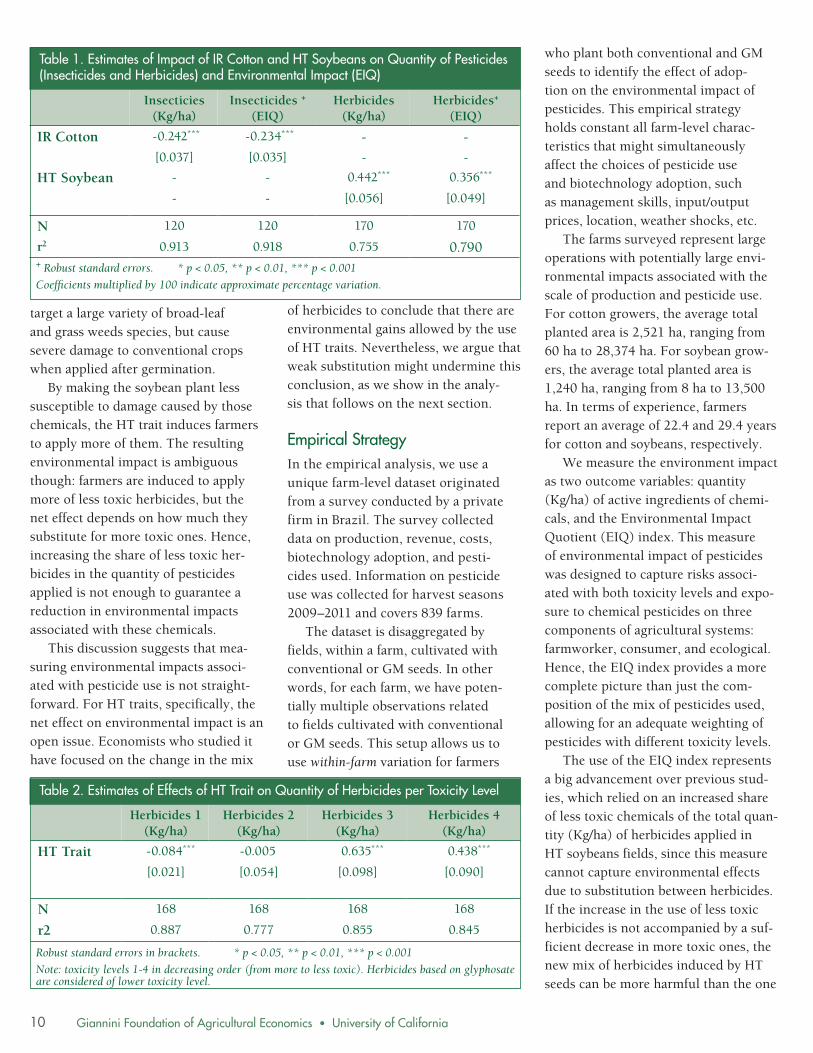