Embed Size (px)
Citation preview
The Demand for Automobile Insurance: Evidence from Underserved Areas in California
Melvin T. Stith, Jr. and Robert E. Hoyt University of Georgia
Brooks Hall 206 Terry College of Business
University of Georgia Athens, GA 30602-6255
Tel. (706) 542-4290 Fax (706) 542-4295
Email: [email protected]
July 19, 2012
1
The Demand for Automobile Insurance: Evidence from Underserved Areas in California
Abstract
Automobile insurance availability is a serious issue for motorists, regulators and the insurance industry. The costs imposed on the system by uninsured motorists are not trivial. In order to minimize these costs it is necessary to understand the factors that lead motorists to drive without insurance. This paper uses data reported to the California Department of Insurance, as well as demographic data collected at the ZIP code level, to analyze the demand for auto insurance in areas that the California Department of Insurance has designated as underserved. The results show that areas – as measured by ZIP codes – that are saddled with high poverty and areas that are predominately urban are more likely to have lower demand for automobile insurance. However, the fact that a certain area is predominately minority does not alone make it more likely to exhibit lower demand for automobile insurance.
Introduction
It has long been recognized that having access to affordable insurance is critical to everyday life in
American society. Insurance is even more important in the automobile context because many states have
mandated that motorists purchase insurance. As important as insurance is to the average American citizen, it is
even more essential for urban communities and has been for some time. In 1968, a federal advisory committee
observed:
Insurance is essential to revitalize our cities. It is a cornerstone of credit. Without insurance, banks and other financial institutions will not – and cannot make loans. New housing cannot be constructed, and existing housing cannot be repaired. New businesses cannot expand, or even survive. Without insurance, buildings are left to deteriorate; services, goods and jobs diminish. Efforts to rebuild our nation’s inner cities cannot move forward. Communities without insurance are communities without hope. (President’s National Advisory Panel, 1968).
As the preceding paragraphs illustrate, a better understanding of both the demand and availability of
insurance could have profound public policy implications; particularly if it led to a better understanding of the
availability – or lack thereof – of insurance in urban areas where it is so badly needed.
The need to understand the availability of insurance is especially urgent in the context of automobile
insurance. Because state law mandates automobile insurance in most states as a necessary prerequisite to
driving, not being able to secure insurance means that many otherwise qualified people do not have access to an
2
automobile. This reality can have severe implications for many minorities living in urban areas because they are
often denied opportunities for employment in suburban areas simply because they lack the transportation to get
to the job site (Raphael and Stoll, 2001). However, because car ownership rates for low skilled workers are
sensitive to small changes in operating costs, even a small change in cost or availability of auto insurance can
have a significant impact in opening opportunities for minorities everywhere, but especially in urban areas
(Raphael and Rice, 2000).
Statistics show that this access problem is particularly acute in California because so many people rely
on automobiles to get to work. According to the Census 2000 conducted by the U.S. Census Bureau,
10,432,462 workers over 16 years of age, which is 71.8% of all workers over 16, drive to work alone in a car,
truck or van. According to the 2000 census another 2,113,313 workers over 16, or 14.5% of all workers over
16, carpool to work in a car, truck or van. That means 12,545,775 workers over 16 years of age or 86.3% of all
workers over 16 rely on a car, truck or van to get to work. Only 1,979,547 workers over 16 or 13.7% of all
workers over 16 walk to work, use public transportation or work at home. These statistics illustrate how
important it is for people to have access to automobile insurance to allow them to get to work.
This problem of securing access to automobile insurance for those who perhaps need it the most was
one of the major reasons that led California to enact the provisions creating the ‘underserved’ designation. As
the California Department of Insurance (CDI) says on its website, “The purpose of the regulations is to address
the issue of availability and affordability of insurance in "underserved" communities and to promote anti-
discrimination so that all have equal access to insurance coverage in California.” California has placed
significant focus on addressing this problem of inadequate access to automobile insurance. It is doing this not
only through its creation of the underserved designation, but also through increasing the level of transparency in
the insurance industry by requiring insurers to publicly disclose data from home, personal auto, commercial
multiple peril and commercial fire policies in California, in all ZIP codes identified as "underserved". The
California Commissioner of Insurance collects and reports earned exposures for the affected lines, as well as the
number of agents and service offices in the underserved areas as a percentage of statewide totals for each
insurance company.
3
California is an ideal state in which to conduct this study for several reasons. Not only does it provide a
workable framework for studying these access issues through its creation of the underserved designation, it also
provides an unprecedented level of transparency discussed above that allows us to study the impact of
demographics on access to automobile insurance. Demographically, California also provides an excellent
laboratory in which to study why certain areas have issues with automobile insurance access. Besides being the
most heavily populated state in the United States with nearly 34 million residents, California provides a great
deal of diversity because it contains large numbers of different ethnic groups and it has many different levels of
income and education stratification. According to the most recent census taken in 2000, 26.2% of California
residents were born in foreign countries and 39.5% of California residents belong to families that speak a
language other than English in the home. For comparison purposes, 11.1% of United States residents were born
in foreign countries and 17.9% of all Americans belong to families that speak a language other than English in
the home. With respect to social diversity, 63.4% of California are white, 7.4% Black or African American,
12.3% Asian. Additionally, 32.4% identify themselves as Hispanic or Latino.
This study will present and then estimate a model of the demand for insurance in areas deemed
underserved by the California Department of Insurance, areas that are almost underserved and finally the state of
California as a whole. These three areas are used to determine whether there are factors that are affecting
demand differently in these three areas. Demographic data obtained from the 2000 United States Census is then
used to regress the insurance demand variable on various factors such as poverty, income, minority status and
whether the area is urban or rural.
The goal of this study is to attempt to pinpoint factors that exist in these almost underserved areas that
may be used to help lower the uninsured motorist rate in those areas that meet the full definition of underserved
as defined by the California Department of Insurance. These factors will help us to better explain why people
exhibit a demand for auto insurance. We will investigate potential barriers that need to be overcome so that
access to insurance is improved for all potential motorists whether or not they happen to live in underserved or
almost underserved areas.
Previous literature has focused on discrimination in insurance in the form of “redlining” that raises
prices and restricts the availability of coverage (Squires, DeWolfe, and DeWolfe, 1979; Squires, Velez, and
4
Taeuber, 1991). Harrington and Niehaus investigated whether racial discrimination affects market prices of auto
insurance in Missouri (Harrington and Niehaus, 1998). This paper employs a framework established by a state
government to examine factors that influence automobile insurance demand. This analysis will allow us to
provide direct advice to the state in order to improve the underserved framework so that California can better
effectuate its goal of increased access to automobile insurance for all Californians. Because of the degree of
specificity of the data that insurers are required to report in California, we are able to directly observe the
uninsured motorist rate in underserved communities and compare it to the uninsured motorist rate in California
as a whole. Because automobile insurance is mandatory under California law in order to drive, employing the
uninsured motorist rate allows us to use a very direct measure of auto insurance demand in order to investigate
insurance access rather than concentrating on insurance pricing or firm profits. This study will analyze those
factors that influence auto insurance demand at the ZIP code level while controlling for other factors that might
influence the results.
California Underserved Areas
California has promulgated regulations to “address the issue of availability and affordability of
insurance in ‘underserved’ communities and to promote anti-discrimination so that all have equal access to
insurance coverage in California.” These regulations require the California Department of Insurance to collect
and analyze data from home, personal auto, commercial multiple peril and commercial fire insurers in
California, in all ZIP codes identified as “underserved”. It is unclear whether California policy makers have
taken action based on this information. The results reported in this paper could assist them in deciding what
action to take to increase access to insurance in the state. Underserved ZIP codes, as defined by the California
regulations, are those in which:
1. The proportion of uninsured motorists is ten percentage points above the statewide average; 2. The per capita income of the community (as measured in the most recent U.S. Census), is below the
fiftieth (50th) percentile for California; and 3. The community (as measured in the most recent U.S. Census), is predominantly (2/3) minority (2004
Commissioner's Report on Underserved Communities).
5
The California Code of Regulations - §2646.6 provides that a predominately minority community can
be quantified as any community that is composed of two-thirds or more minorities. Minorities are those people
that fall into one or more of the following groups: American Indian or Alaskan Native, Asian or Pacific Islander,
African-American, or Latino.
The uninsured motorist rate is calculated by subtracting the number of insured vehicles in the ZIP code
from the number of registered vehicles in the ZIP code and dividing that difference by the number of registered
vehicles in the ZIP code. The estimated rate of uninsured motorists is based upon vehicle registration data
maintained by the California Department of Motor Vehicles (DMV) and data for private passenger liability
insurance reported to the California Department of Insurance (CDI) by insurers. Other methods of evaluating
rates of uninsured vehicles, such as studies based upon accident claims, may result in different estimates
(California Department of Insurance website).
These data reporting regulations have been in place since 1994. The regulations require insurers to file
data annually about where they are and are not writing homeowners, automobile, and commercial policies.
These statements, sometimes called “community service statements”, disclose the numbers of policies and
premiums in each ZIP code in California. The filings do not reveal individual policyholder information.
Pursuant to its authority under Proposition 103, the California Department of Insurance (CDI)
promulgated a regulation requiring the public disclosure of the data described above. In 1999, the insurance
industry led by State Farm sued claiming that the data constituted a trade secret. Consumers Union and the
Southern Christian Leadership Conference of Greater Los Angeles, represented by Public Advocates, intervened
in the case because they sought the data in order to track potential redlining abuses by insurers. The San
Francisco Superior Court ruled for the groups, finding that the public had a right to review the redlining data
under Proposition 103. In a unanimous decision, the First District Court of Appeals affirmed the ruling. While
the case was being decided, the CDI continued to collect the data from insurers, but did not make it public. On
April 26, 2003 in State Farm v. Garamendi (Case # S102251) the California Supreme Court unanimously ruled
that the state insurance commissioner did not exceed his statutory authority under Proposition 103 when he
promulgated the public disclosure regulation. The Court noted that regardless of whether the filings contain
6
trade secrets, the Commissioner’s regulation and Proposition 103 make those filings available for public
inspection.
ZIP codes are used as the relevant unit of analysis for several reasons. As discussed earlier, the CDI
uses them in their analysis and determination of underserved areas. Also, United States census data are reported
at the ZIP code level. Therefore, ZIP codes provide a comparable unit of measurement when analyzing the data
collected from the census and the CDI. Finally, ZIP codes represent the smallest geographic breakdown there is
for insurance data (Klein and Grace, 2001).
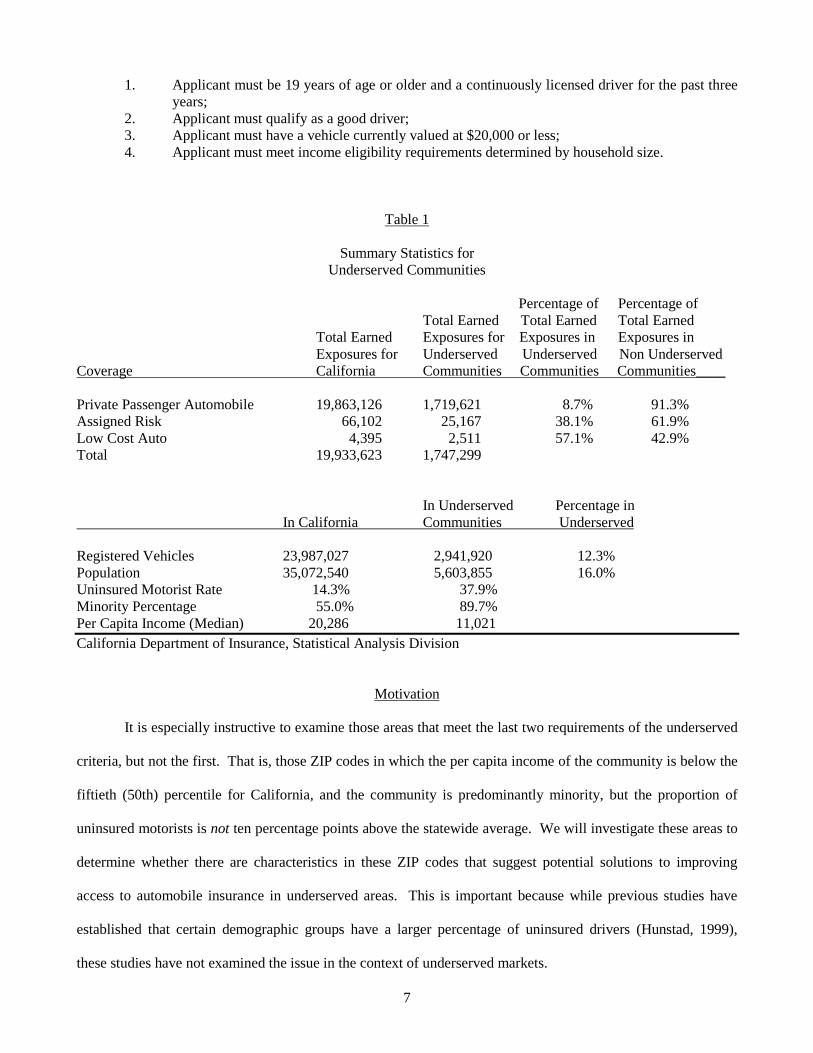
Table 1 contains summary data on the portion of drivers in underserved areas, as well as other relevant
data. The CDI defines the word “earned” in the term “earned exposure” as a condition where the exposure is
recognized by the insurance company after time has passed and the insurance company has delivered the
services promised under the insurance policy. Furthermore, an “exposure” is defined as the risk or loss potential
an insurance company assumes from its policyholder in exchange for premium (an automobile or home are
examples of exposures). “Assigned Risk” is an automobile insurance plan that covers individuals who cannot
obtain conventional automobile liability insurance usually because of adverse driving records. These individuals
are then placed in a residual insurance market. Insurance companies are assigned to write insurance for them, at
higher prices, in proportion to the premiums written in a particular state. These plans protect motorists who
suffer injury or property damage through the negligence of bad drivers who otherwise would not have insurance.
California maintains a Low Cost Automobile Insurance Program. The primary goal of this program is
to provide affordable liability only auto insurance so that drivers may meet the state’s automobile insurance
requirements. The state is concerned that too many low income drivers may remain uninsured without this
program because the standard insurance premiums are too expensive.
The Low Cost Automobile Insurance Program provides for the following maximum limits on the
offered policies:
Bodily Injury liability per person - $10,000; Bodily Injury liability per accident - $20,000; Property Damage liability per accident - $3,000.
In order to be eligible for the Low Cost Automobile Insurance Program the following conditions must
be met by all applicants:
7
1. Applicant must be 19 years of age or older and a continuously licensed driver for the past three years;
2. Applicant must qualify as a good driver; 3. Applicant must have a vehicle currently valued at $20,000 or less;
4. Applicant must meet income eligibility requirements determined by household size.
Table 1
Summary Statistics for Underserved Communities
Percentage of Percentage of Total Earned Total Earned Total Earned Total Earned Exposures for Exposures in Exposures in Exposures for Underserved Underserved Non Underserved Coverage California Communities Communities Communities____ Private Passenger Automobile 19,863,126 1,719,621 8.7% 91.3% Assigned Risk 66,102 25,167 38.1% 61.9% Low Cost Auto 4,395 2,511 57.1% 42.9% Total 19,933,623 1,747,299 In Underserved Percentage in In California Communities Underserved Registered Vehicles 23,987,027 2,941,920 12.3% Population 35,072,540 5,603,855 16.0% Uninsured Motorist Rate 14.3% 37.9% Minority Percentage 55.0% 89.7% Per Capita Income (Median) 20,286 11,021 California Department of Insurance, Statistical Analysis Division
Motivation
It is especially instructive to examine those areas that meet the last two requirements of the underserved
criteria, but not the first. That is, those ZIP codes in which the per capita income of the community is below the
fiftieth (50th) percentile for California, and the community is predominantly minority, but the proportion of
uninsured motorists is not ten percentage points above the statewide average. We will investigate these areas to
determine whether there are characteristics in these ZIP codes that suggest potential solutions to improving
access to automobile insurance in underserved areas. This is important because while previous studies have
established that certain demographic groups have a larger percentage of uninsured drivers (Hunstad, 1999),
these studies have not examined the issue in the context of underserved markets.
8
In particular we can assess whether consumers in underserved markets have lower demand for
insurance. We will construct a demand model to test various hypotheses related to the demand for insurance in
underserved areas. Combining these data with currently available census data may shed light on the reasons
that citizens are not purchasing automobile insurance even when they are mandated to do so by law.
By examining this equation we should be able to gain a better understanding of the unique challenges
encountered when attempting to provide affordable insurance to underserved communities so that there are
fewer ZIP codes on the underserved list when the commissioner delivers the next report. This is important
because costs imposed on society by uninsured motorists can be significant (Cole and McCullough, 2007). An
Insurance Research Council study found that approximately $2.4 billion, or 6.45% of all paid losses from injury
claims, were paid under uninsured motorist coverage in 1997 (Insurance Research Council, 1999). The costs to
individuals can be just as severe as the costs to society. In most states, including California, not having access
to auto insurance means not being able to drive. This has important ramifications in the context of employment
because there is a significant difference in employment rates between car owners and non car owners,
particularly in the African-American community (Raphael and Stoll, 2001).
Historical Motivation
The California Department of Insurance promulgated these regulations in part “to promote anti-
discrimination so that all have equal access to insurance coverage in California.” The CDI felt the need to
promulgate these regulations because there is an unfortunate legacy of racial and ethnic discrimination in the
United States that we are still grappling with today.
The legal history of these discrimination cases is a long one. Additional analysis conducted by the
authors details some of the most important cases in civil rights jurisprudence. This survey of legal precedent is
not meant to be completely exhaustive. Rather, this is meant to highlight some important cases in United States
history that illuminate why the CDI feels that it is important to promote anti-discrimination. It is important to
highlight some of the seminal cases in the jurisprudence of racial discrimination in the United States because
from 1938, when the National Association for the Advancement of Colored People (NAACP) won its first
Supreme Court victory in a school desegregation case, until the 1960’s when we again experienced a political
9
consensus favoring civil rights, the courts were virtually alone in articulating the importance of race
discrimination laws, as well as insisting on their enforcement.
As the cases detailed in the analysis conducted by the authors makes clear, equal access for all to all
opportunities is not only desirable it is a minimum requirement if all citizens are to be expected to participate
and fully contribute to the well being of society. This holds true whether the issue is access to a public
conveyance, access to equal education or access to affordable automobile insurance. The problem of race in
general and access in particular has long been a thorny one and difficult to resolve. In creating the underserved
designation and requiring the disclosure of the community service statements, the CDI is attempting to provide
some measure of relief to those who have been affected by discrimination, whether intentional or not.
California Automobile Insurance Financial Responsibility Requirements
The question of whether or not all citizens in California have adequate access to automobile insurance is
an important one because in California proof of “financial responsibility” is required to drive lawfully in the
state. Motorists are limited in the manner that they can prove their financial responsibility. The four types of
financial responsibility that will be accepted by the California Department of Motor Vehicles (DMV) are
provided below:
• A motor vehicle liability insurance policy; • A cash deposit of $35,000 with DMV; • A DMV issued self-insurance certificate; or • A surety bond for $35,000 from a company licensed to do business in California.
Obviously, the vast majority of California motorists will choose to purchase a motor vehicle liability
insurance policy to satisfy the financial responsibility requirement.
In 2006, the California Vehicle Financial Responsibility Law changed the way the Department of Motor
Vehicles verifies insurance for privately owned vehicles. Changes were made to ensure that vehicles driven on
California roads have liability insurance that provides financial responsibility for any damage or injury caused
by a traffic accident, regardless of fault, and to remove uninsured vehicles from the highways. Insurance
companies in California are required by law (California Vehicle Code (CVC) §6058) to electronically report
private-use vehicle insurance information to the DMV. Insurance companies are not required to electronically
report information for vehicles covered by “commercial” or “business” insurance policies. Customers whose
10
vehicles are covered by this type of policy will be required to submit paper proof of insurance when required for
registration renewal and when a vehicle is registered in their name for the first time in California. Law
enforcement and court personnel have electronic access to insurance status on DMV records.
Motorists in California must meet mandatory vehicle registration financial responsibility requirements.
Financial responsibility must be obtained and maintained on any vehicle operated or parked on California
roadways and must be provided as specified below:
• When requested by law enforcement; • When renewing vehicle registration (if requested); • Within 30 days of issuance of a registration card for a vehicle being registered in California for the first
time, or transfer of ownership; • Within 45 days of the cancellation of a policy for a currently registered vehicle; • When the vehicle is involved in a traffic accident.
Motorists must carry evidence of financial responsibility (proof of insurance) in their vehicles at all times.
California has set minimum liability insurance requirements for private passenger vehicles. The
requirements are as follows:
• $15,000 for injury/death to one person; • $30,000 for injury/death to more than one person; • $5,000 for damage to property.
Liability insurance compensates a person other than the policy holder for personal injury or property damage
(California Insurance Code §11580.1b).
California law has set forth a range of penalties in the event that any motorist fails to maintain financial
responsibility on a vehicle. If financial responsibility is not maintained the possible penalties are as follows:
• Registration of the vehicle will be subject to suspension. DMV will begin the process to suspend any motorist’s registration if: — Liability insurance is cancelled and a replacement policy is not submitted within 45 days; or — The motorist’s insurance company has not electronically provided evidence of insurance within
30 days of a registration card being issued on a vehicle being registered in California for the first time;
or — The motorist provides false evidence of insurance.
• The motorist may be cited. Failure to provide evidence of financial responsibility when requested by a peace officer may result in a citation with fines that could reach $1,000 or more. (DMV cannot clear or sign citations relating to financial responsibility. Only a court can clear or sign these citations.);
• The vehicle may be impounded. Failure to provide evidence of financial responsibility may result in the vehicle being impounded, in addition to any fines;
11
• The motorist may be personally liable for damages. If a motorist contributes to the cause of an accident and cannot provide evidence of financial responsibility, that motorist may be forced to compensate the other party for any injuries and damages.
As the foregoing discussion makes clear, the state of California is serious in insisting that motorists in
the state comply with the applicable financial responsibility laws. However, it remains true that many motorists
drive without meeting these financial responsibility laws. A California survey found that 10% of vehicle owners
in California owned an uninsured vehicle (Hunstad, 1999). Although there are a wide variety of reasons cited
by motorists for non-compliance, 80% of uninsured drivers in the survey cited non-use of the vehicle or the cost
of insurance as the main reason that they did not insure (Hunstad, 1999). Because insurance is the only practical
way for the vast majority of drivers to comply with the financial responsibility law, it is essential that they have
affordable access to auto insurance in their area.
Prior Literature
Prior literature has focused on the question of insurance demand. Browne and Hoyt (2000) estimate a
flood insurance demand model. They test whether different determinants factor into the decision to purchase
flood insurance. These determinants include price, income, recent flood experience, federal government
mitigation efforts, and increased federal disaster relief payments. Because they have both time series and cross
sectional data, they estimate their model as a fixed effects model. They estimate their model twice in order to
account for different definitions of insurance demand. The two definitions are the number of flood insurance
policies purchased per 1,000 population in a state during a year and the face amount of flood insurance in force
per capita in a state during a year. The number of flood insurance policies in force is a proxy for the number of
individuals and businesses that have bought flood insurance coverage. Therefore, it measures the portion of the
population that has purchased at least some amount of flood insurance. The face amount of flood insurance in
force reveals the total value insured in a state during a year.
For their price variable, they use the dollar value of premiums paid for flood insurance in the state
during the year divided by the dollar value of insurance in force (in thousands) in the state during the year. The
proxy they use for income is disposable personal income per 1,000 population. They also include a variable to
control for the effect that a recent flood might have on a person’s feeling about the likelihood of another flood.
12
They include this variable to account for the likelihood that an individual’s perception about the risk of loss may
influence the decision to buy insurance. This variable is defined as the dollar value of total flood damage (not
just insured losses) in the state during the preceding year.
They ultimately find that flood insurance purchases are positively related to income and negatively
related to price. Specifically they find that demand for flood insurance is relatively insensitive to changes in
price, but when demand is measured by the amount of insurance in force it becomes sensitive to changes in
price. They also find that those with higher income are more likely to purchase insurance and purchase greater
amounts of insurance than those with lower incomes. Therefore, this study reinforces the notion that as the level
of an individual’s income increases, the amount of insurance purchased by that individual is likely to increase.
Given the fact that auto insurance is mandatory in many states and flood insurance is not, it will be interesting to
expand this notion from the area of flood insurance to the area of auto insurance to determine if this relation still
holds true.
The theory of insurance demand has been investigated in other contexts as well. For example,
Kunreuther and Pauly (2004) construct an insurance demand model for low probability high loss events. They
seek to explain why people often don’t buy insurance against low probability high loss events even when it is
offered at favorable premiums. They model factors that an individual should consider in deciding whether to
consider the purchase of insurance. They show that there are search costs involved with collecting insurance
information. These search costs can discourage people from undertaking the type of analysis often necessary to
determine that buying insurance against low probability high loss events would often be in their best interest.
We can investigate this conclusion in the context of auto insurance by including the language isolated variable.
Families that are language isolated face greater search costs than those who aren’t because in America most
insurance information is written in English. Because these families face greater search costs they should buy
less insurance. Kunreuther and Pauly construct two models. In the first model insurers are sure about the
probability of loss while consumers are not. In the second model, both insurers and consumers are unsure about
the probability of loss.
There have also been several papers focused on the question of access, discrimination and potential
redlining in insurance markets. Regarding discrimination, Dane (2006) analyzes the potential racial
13
implications of using geographic rating territories in the homeowners insurance rating process. He notes that
insurance ratemaking has historically been premised on actuarial analysis of loss and claims data that are not
known to have racial implications. However, the one area where traditional insurance pricing procedures might
have racial consequences is the use of geography. Because many cities in the United States remain racially
segregated, there is the potential for racially identifiable neighborhoods in the same city to be charged different
rates. Pricing differentials at the small geographic level of the ZIP code have potentially significant racial
consequences because if two rating territories that have been created based on ZIP code have different base
rates, the chances that two different racial groups will be charged different base rates increases dramatically.
Because ZIP codes are so small geographically, generally there is not enough loss data at the ZIP code level to
justify the calculation of an actuarially sound base rate. Loss data at the ZIP code level is not credible enough to
be the sole basis for generating a base rate. We use the minority variable to try to investigate whether there are
any measurable differences in auto insurance demand between different ethnic groups.
Harrington and Niehaus (1998) investigate whether racial discrimination affects the pricing of auto
insurance at the market level. They contend that if insurers discriminate, then the expected loss ratio will be
lower in areas with a higher percentage of minorities. This would be consistent with higher expected profit
margins in these areas. They use ZIP code level data from Missouri for their study.
They define the loss ratio as the average claim costs in a particular ZIP code divided by the average
premium per exposure in a particular ZIP code. They use a model that has the log of the loss ratio as the
dependent variable and has the percentage of the total population in the ZIP code that is black as an independent
variable. The other independent variable is a vector of demographic and other factors. They find that loss ratios
are not significantly lower in ZIP codes with larger minority populations. They reason that this finding implies
that higher auto insurance premiums in urban areas are attributable to high claim costs in these areas and not to
discrimination.
Squires and Kubrin (2006) reach a different conclusion by examining the historical and ongoing
practices of racial profiling and other discriminatory actions in the property insurance industry. They detail how
important insurance is to people in their everyday life. They assert that households that confront the problem of
insurance availability tend to be located in inner city neighborhoods where there are high concentrations of non-
14
white residents. They contend that inner city residents must deal with a host of factors not relating to risk that
causes them to have insurance availability problems. They point out that insurers don’t know the cost of their
product when it is sold to the consumer because they can’t know whether or not any particular consumer will
ever file a claim. Therefore, the authors contend that as part of their underwriting practices, insurers use race as
a way to classify and price risks. Their contention is that many residents of urban areas are offered less
attractive insurance products for reasons unrelated to the actual risk that they pose to the insurance company.
They detail many factors that could have an adverse effect on the ability of urban residents to procure insurance.
These factors include agent location, underwriting guidelines, and the claims process. The authors advocate
state programs that would establish an affirmative obligation for insurers to provide insurance products and
investment activity in low and moderate income neighborhoods. They also urge the adoption of a federal
insurance disclosure requirement to force insurers to reveal the areas where they are writing their insurance
policies.
Klein and Grace (2001) analyze the urban homeowners insurance market in Texas to determine whether
insurance firms are redlining. They assess whether there is significant statistical evidence to prove the existence
of redlining. Their paper controls for other factors that affect market outcomes thereby avoiding the omitted
variable bias that occurs in prior literature because the effects of race are confounded with other factors
correlated with race. They begin by discussing the general conditions in urban insurance markets focusing on
the differences between metropolitan and nonmetropolitan areas. They compare data on insurance prices and
claim costs in the three largest Texas metropolitan areas with nonmetropolitan areas in the state. They find that
metropolitan homeowners pay higher average premiums for insurance than homeowners in nonmetropolitan
areas for both fire and multi-peril coverage. However, they do not conclude that metropolitan homeowners are
being overcharged because the loss costs in metropolitan areas are greater than the loss costs in nonmetropolitan
areas.
They examine claim costs because this is a prime way to determine the pricing efficiency in urban areas.
They assert that if claim costs are higher in areas with a higher concentration of minorities, then it is reasonable
to expect that these areas will have to pay higher prices for insurance. They ask whether the difference in claim
costs and other economic/demographic factors account for all of the difference in premiums or whether the
15
racial composition of an area has an additional effect that may be accounted for by recognizing the existence of
unfair discrimination. To investigate this question they use a model that has a dependent variable of average
claim costs. The independent variables include a variable to proxy for the sensitivity of claims costs to the
percentage of Blacks and Hispanics in a ZIP code. The other independent variables in the model include several
economic, demographic, and housing variables. They use variables to proxy for risk of loss, volatility in
homeowners’ claims, and supply of and demand for insurance.
They find no significant relation between claim costs and the percentage of minorities in a ZIP code.
They find that as owner occupancy increases, claim costs decrease. They also find that as the total wealth of the
ZIP code increases, average claim costs decrease. Furthermore, they find that the percentage of minorities in a
ZIP code is not statistically related to the loss ratio. These findings lead them to conclude that no statistical
evidence of redlining exists and that the risk of loss and the demand for insurance appear to primarily drive the
terms of insurance transactions.
Harrington and Niehaus (1992) analyze a California program that seeks to deal with insurance
unavailability and affordability problems in urban areas. The California program gives the insurance
commissioner discretion to adjust the allowable rate of return depending on the amount of business that an
insurer writes in inner city areas. After discussing possible sources of availability and affordability problems
and describing the California proposal, the authors conclude that the program suffers from severe defects. These
regulations would provide an incentive for some insurers to reduce quality or exit from the California market.
The authors contend that the regulations would also promote cross-subsidies that would make consumers in
other areas pay more to finance the urban areas.
Cole and McCullough (2007) investigate the uninsured motorist problem and provide a survey of some
possible solutions. They explain the gravity of this problem by noting how the uninsured motorist rate has been
increasing in recent years. They go on to detail the many different approaches that have been tried to deal with
this problem. The approaches include improving tracking techniques designed to enforce compulsory insurance
and financial responsibility laws, the availability of low-cost automobile insurance policies, the creation of
uninsured and underinsured motorist coverage, the implementation of no pay, no play laws, and proposals for
16
pay at the pump laws. The authors point out that increased understanding of the uninsured motorist problem
through future studies will help identify the most cost effective solutions.
This study follows in that tradition by examining the uninsured motorist problem through the prism of
access. California is attempting to help alleviate the uninsured motorist problem by providing its more
underserved citizens with increased access to much needed insurance. This study will contribute to that strategy
by focusing on identifying what factors lead to greater auto insurance demand. The results of this study will
help policymakers in the future as they design their own strategies to deal with the problem of the uninsured
motorist.
Econometric Model and Data
The data used in this study is cross-sectional in nature and we are interested in its impact in determining
whether these areas will be categorized as underserved or almost underserved. The models are estimated using
the method of ordinary least squares. We combine data from the US Census Bureau’s 2000 census and
insurance data for 2004 collected by the California Department of Insurance. Following Butler (1994), we log
the explanatory variable insurance demand to reduce the positive skewness in the regression’s error term.
Insurance demand is defined as (1 - uninsured motorist rate). The uninsured motorist rate is calculated by
subtracting the number of insured vehicles from the number of registered vehicles and dividing this difference
by the number of registered vehicles.
In order to investigate auto insurance demand it is necessary to examine certain factors that are likely to
have an affect on a typical consumer’s demand for auto insurance. In particular, we can focus on the question of
which factors have a greater influence in determining whether a particular area in California will end up meeting
the entire definition set forth by the California Department of Insurance and thereby be deemed underserved.
We follow Browne and Hoyt (2000) for the structure of the model and Klein and Grace (2001) for many
of the variables included in the final equation. The variables in the model were chosen based on demographic
relevance and previous literature. All of the demographic factors used in previous literature like Klein and
Grace (2001) that are relevant to the automobile insurance market have been included in the model used in this
study.
17
Other variables such as the theft and Asian variables are considered in separate analysis conducted by
the authors. The theft variable is not included in the main model because several counties did not report motor
vehicle theft data to the California Department of Justice. Therefore, including this variable in the main model
would have necessitated the omission of nearly 200 ZIP codes. The Asian variable is not included in the main
model because its inclusion would have introduced a significant level of multicollinearity into the model.
The model is specified as follows:
Log(Insurance Demand) = β0 + β1 (Urban) + β2 (Minority) + β3 (Per Capita Income) + β4 (Poverty)
+ β5 (Language Isolated) + β6 (High School) + β7 (Hispanic)
Urbanization
We include a binary variable to capture the effect that an urban ZIP code would have on the demand for
automobile insurance. Demand for automobile insurance in urban areas is different than the demand in rural
areas (Cummins and Tennyson, 1992). Using a binary variable is admittedly a crude measure of urbanization,
but it is the best possible measure that can be used. The difficulty is due to the nature of ZIP codes. ZIP codes
are a convenience for the United States Postal Service. They were invented for the sole purpose of allowing the
mail to be delivered more accurately and efficiently. They don’t necessarily have defined boundaries. ZIP
codes do not represent geographic regions; they generally correspond to address groups or delivery routes.
Consequently, ZIP code "areas" can overlap, be subsets of each other, or be artificial constructs with no
geographic area. Therefore, it is very difficult to calculate even basic statistics like square footage for many ZIP
codes. The difficulty this creates for our purposes is that we can’t calculate a reliable area for these ZIP codes to
compare against the population measure that we have from the census data. Therefore, we are reduced to using
the binary variable so that we have at least an approximation of urbanization in the model. The US Census
Bureau defines an urban area as: "Core census block groups or blocks that have a population density of at least
1,000 people per square mile (386 per square kilometer) and surrounding census blocks that have an overall
density of at least 500 people per square mile (193 per square kilometer)." Using this metric, ZIP codes in the
counties of San Francisco, Orange, Los Angeles, Alameda, San Mateo, Sacramento, Santa Clara, Contra Costa,
San Diego, and Santa Cruz all qualify as urban.
18
The expectation is that urbanization will have a negative impact on demand for automobile insurance
perhaps due to the fact that more people per capita live in these areas so accidents are more likely. It has also
been observed that automobile insurance claiming behavior is different in large metropolitan areas than in more
rural areas (Cummins and Tennyson, 1996). Also, the ratio of bodily injury claim frequency to property damage
claim frequency is usually much higher in urban areas. The ratio is more than twice as high in Los Angeles and
New York than their individual state averages and in Philadelphia the ratio is more than three times higher than
the state average (Hoyt, Mustard and Powell, 2006). This leads to higher premiums in urban areas because
claim costs are higher and higher premiums lead to lower demand for insurance (Harrington and Niehaus, 1992).
Minority
The variable Minority refers to the percentage of Blacks and non-Black Hispanics in a ZIP code. We
expect that a higher concentration of minorities in a ZIP code will have a negative effect on demand for
automobile insurance due perhaps to a lack of income and a lack of awareness about mandatory insurance laws.
Also, minorities tend to be more concentrated in urban areas. Therefore, the level of minorities in a ZIP code
may reflect the level of urbanization in the ZIP code. Ceteris paribus, urban ZIP codes will have higher
premiums than non urban ZIP codes due to higher claim costs (Harrington and Niehaus, 1998).
In other contexts it has been shown that there are disparities in access to insurance among different
racial groups. Weinick, Zuvekas, and Cohen studied trends in disparities and access to health care services. In
each of the years that they studied (1977-1996) they found that Hispanic and African Americans were
considerably more likely to lack a usual source of care than white Americans (Weinick, Zuvekas, and Cohen,
2000).
This variable will also be instructive in determining if the business practices of insurers in California are
resulting in a “disparate impact” against minorities. If a business practice has a disparate impact on minorities it
can be legally impermissible even if it is racially neutral on its face. If a policy or practice is shown to have
such an effect, even if it is unintended, then the policy or practice is illegal unless the insurer can show that there
is a compelling business justification for the policy or practice, and that no less discriminatory alternative exists
to achieve the same business purpose (Dane, 2006; Metropolitan Housing Development Corp. v. Village of
Arlington Heights, 558 F.2d 1283, 1977).
19
Income
From the 2000 census conducted by the United States Census Bureau we have data on per capita income
for each ZIP code. There is evidence in prior literature that supports the proposition that per capita income will
be positively correlated with insurance demand (Klein and Grace, 2001). Those households with more
discretionary income will likely have more willingness and certainly have more ability to purchase insurance.
Consumers with higher income are also more likely to have an understanding of the importance of purchasing
insurance and how such a purchase can protect them and their property. Higher income consumers will also be
more likely to have more wealth at risk from lawsuits and will therefore perceive the value of having liability
insurance (Harrington and Niehaus, 1992). In other contexts income has been found to play a role in access to
insurance. Income has been found to be a factor in explaining disparities in access to health care and health
insurance between ethnic minorities and whites. Income was found to be important in explaining disparities in
two main areas: having a usual source of care and family perceptions of access to health care (Zuvekas and
Taliaferro, 2003).
The income variable can also be used to investigate the question of whether automobile insurance in the
California market exhibits the characteristics of an inferior good. An inferior good is a good in which demand
decreases as a consumer’s income rises. With a normal good, the reverse is true. There is support in prior
literature for the proposition that insurance is an inferior good (Mossin, 1968). If insurance is in fact an inferior
good we will observe a negative correlation between insurance demand and the income variable. Because of
this conflict in the theory I am unsure whether the income variable will be positively or negatively correlated
with insurance demand.
Poverty
From the 2000 census conducted by the United States Census Bureau we have data on the percentage of
families living below the poverty level in each ZIP code. The rationale here is the reverse of the one made
above when dealing with those with high incomes. The percentage of families living in poverty should be
negatively correlated with insurance demand likely due to the fact that these families will have fewer funds to
spend on insurance (Klein & Grace, 2001). These families will also have little if any discretionary income and
20
probably will have a hard time affording insurance when they have to worry about having money to pay for
basic needs like food, clothing and shelter (Harrington and Niehaus, 1992).
This variable will also help us determine whether certain areas are underserved because they have a high
concentration of minorities or because the people in these areas don’t have enough money to pay for adequate
insurance (Squires, 2003). In essence, this variable will help us determine how much of the decreased demand
in underserved areas is due to uninsured, working poor drivers.
Language Isolated
From the 2000 census conducted by the United States Census Bureau we have data on the percentage of
households that are language isolated. Households are considered to be language isolated if English is not the
primary language spoken inside the home. This variable will allow us to identify the effect of language in
purchasing auto insurance. This is important because in California, uninsured motorists are more likely to be
Hispanic or African-American (Hunstad, 1999).
The percentage of families that are language isolated should also be negatively correlated with insurance
demand because these families are probably less likely to be aware of the necessity of purchasing auto
insurance. Language isolated families also may have a more difficult time shopping around and purchasing
insurance (Klein & Grace, 2001). For example, the internet is a vehicle that many people use to purchase
insurance. If the ultimate purchase is not done on the internet many consumers still use the internet as a tool for
researching their insurance needs and for comparison shopping. Since most – if not all – of the relevant
insurance websites are in English, being language isolated represents a significant barrier to properly using the
internet as a mechanism for purchasing insurance.
Language has been found to be an important factor in determining health care use. Previous studies
have shown that the use of heath care for English speaking Hispanic patients was not significantly different than
for non-Hispanic patients. However, Spanish speaking Hispanic patients were shown to be significantly less
likely to have had an array of health services than non-Hispanic white patients. These services included
physician visits, mental health visits, and influenza vaccinations (Fiscella, et al, 2002).
Language is also subjectively seen as a problem by many Latinos. One study that investigated access
barriers to health care found that 26% of Latino parents thought that language problems were the single greatest
21
barrier to obtaining heath care for their children. Another 15% said that the greatest obstacle was doctors and
nurses who don’t speak Spanish. Additionally, another 11% mentioned lack of interpreters as the biggest
problem (Flores et al, 1998).
High School Education
The percentage of adults with at least a high school education should be positively correlated with
insurance demand. This metric reveals which consumers are more educated. Those consumers with higher
education should better understand the necessity of buying insurance. Those consumers with less education may
also feel less comfortable buying insurance because purchasing insurance requires consumers to pay premiums
for a benefit that they may only realize in the future if at all. Consumers with less education may be less willing
to see this type of purchase as valuable (Klein & Grace, 2001). Previous studies have found that uninsured
drivers are more likely to have less than a high school education (Hunstad, 1999). This variable will allow us to
test that finding with our new data.
In other contexts education has been found to be a factor in explaining racial and ethnic disparities in
ambulatory care use (Zuvekas and Taliaferro, 2003). The education level of parents has also been found to have
an impact in explaining the likelihood of children having health insurance. Children were more likely to be
privately insured and less likely to be publicly insured or uninsured if their parents had a higher level of
education. Specifically, children who had parents with more than twelve years of education were most likely to
have private insurance and least likely to be uninsured (Weinick, Weigers, and Cohen, 1998).
Hispanic
The Hispanic variable reports the percentage of people in each ZIP code who claimed that they were of
Hispanic descent. On the 2000 United States Census form the Hispanic question is distinct from the race
question. Specifically, the Hispanic question asks respondents if they are Spanish, Hispanic, or Latino. A
separate question on race asks respondents what race they consider themselves. Both questions rely on self-
identification. Therefore, for purposes of the Census a person can be both Hispanic and black or Hispanic and
white or Hispanic and Asian or Hispanic and some other race (US Census Bureau, Census 2000). The Census
uses the terms “Hispanic” and “Latino” interchangeably. This study will only use the term “Hispanic” to avoid
any confusion.
22
California as a whole is home to 13,160,978 people who identify themselves as Hispanic, or 36.1% of
California’s total population (U.S. Census Bureau, 2006-2008 American Community Survey). This is more than
double the percentage of Hispanics found in the United States as a whole (15.1%). Because of the significantly
higher percentage of Hispanics in California, it is important to account for it separately in our analysis. It will
also be interesting to explore whether the Hispanic variable will be demonstrably different from the language
isolated variable in our analysis. Our priors are that the effect will be similar to the language isolated variable,
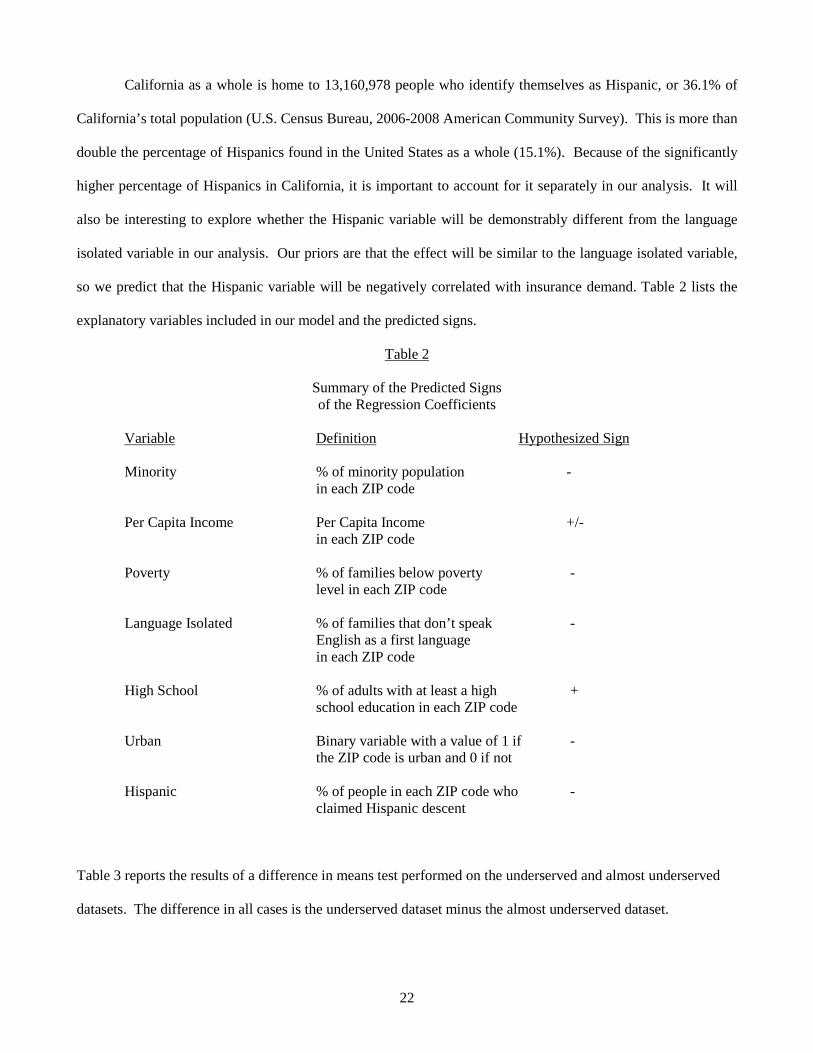
so we predict that the Hispanic variable will be negatively correlated with insurance demand. Table 2 lists the
explanatory variables included in our model and the predicted signs.
Table 2
Summary of the Predicted Signs of the Regression Coefficients
Variable Definition Hypothesized Sign
Minority % of minority population -
in each ZIP code
Per Capita Income Per Capita Income +/- in each ZIP code
Poverty % of families below poverty - level in each ZIP code
Language Isolated % of families that don’t speak - English as a first language
in each ZIP code
High School % of adults with at least a high + school education in each ZIP code
Urban Binary variable with a value of 1 if -
the ZIP code is urban and 0 if not
Hispanic % of people in each ZIP code who - claimed Hispanic descent
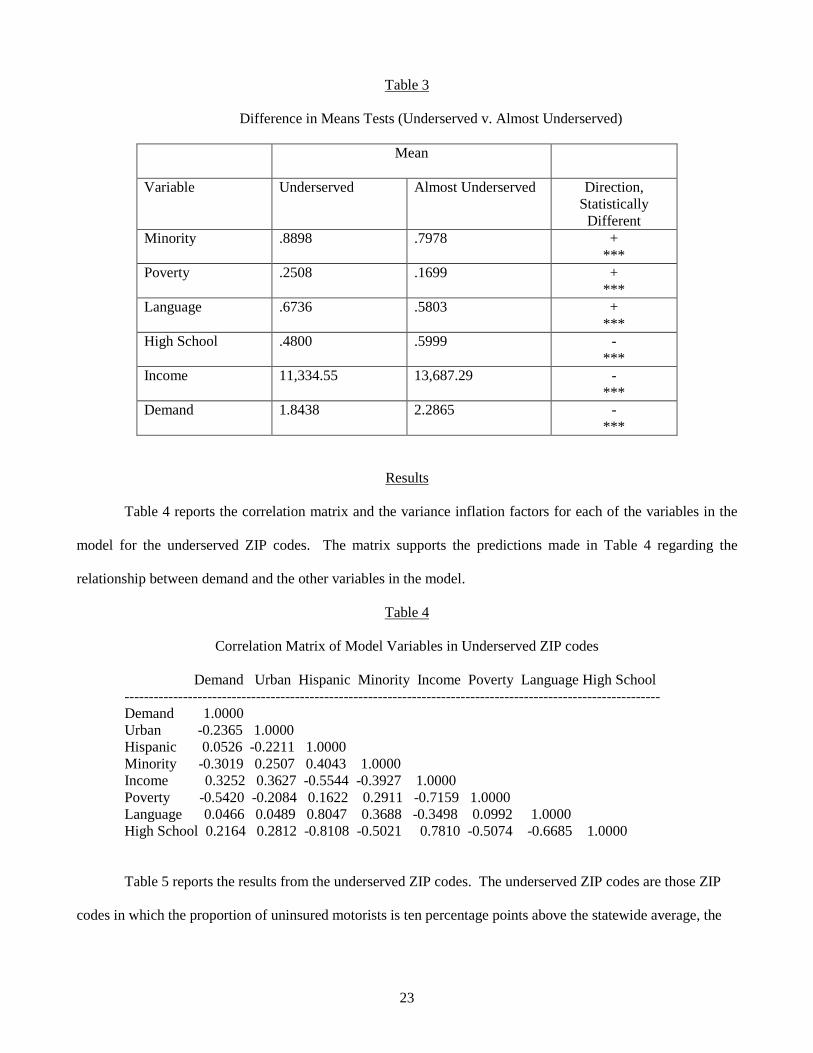
Table 3 reports the results of a difference in means test performed on the underserved and almost underserved
datasets. The difference in all cases is the underserved dataset minus the almost underserved dataset.
23
Table 3
Difference in Means Tests (Underserved v. Almost Underserved)
Mean
Variable Underserved Almost Underserved Direction, Statistically
Different Minority .8898 .7978 +
*** Poverty .2508 .1699 +
*** Language .6736 .5803 +
*** High School .4800 .5999 -
*** Income 11,334.55 13,687.29 -
*** Demand 1.8438 2.2865 -
***
Results
Table 4 reports the correlation matrix and the variance inflation factors for each of the variables in the
model for the underserved ZIP codes. The matrix supports the predictions made in Table 4 regarding the
relationship between demand and the other variables in the model.
Table 4
Correlation Matrix of Model Variables in Underserved ZIP codes
Demand Urban Hispanic Minority Income Poverty Language High School -------------------------------------------------------------------------------------------------------------- Demand 1.0000 Urban -0.2365 1.0000 Hispanic 0.0526 -0.2211 1.0000 Minority -0.3019 0.2507 0.4043 1.0000 Income 0.3252 0.3627 -0.5544 -0.3927 1.0000 Poverty -0.5420 -0.2084 0.1622 0.2911 -0.7159 1.0000 Language 0.0466 0.0489 0.8047 0.3688 -0.3498 0.0992 1.0000 High School 0.2164 0.2812 -0.8108 -0.5021 0.7810 -0.5074 -0.6685 1.0000
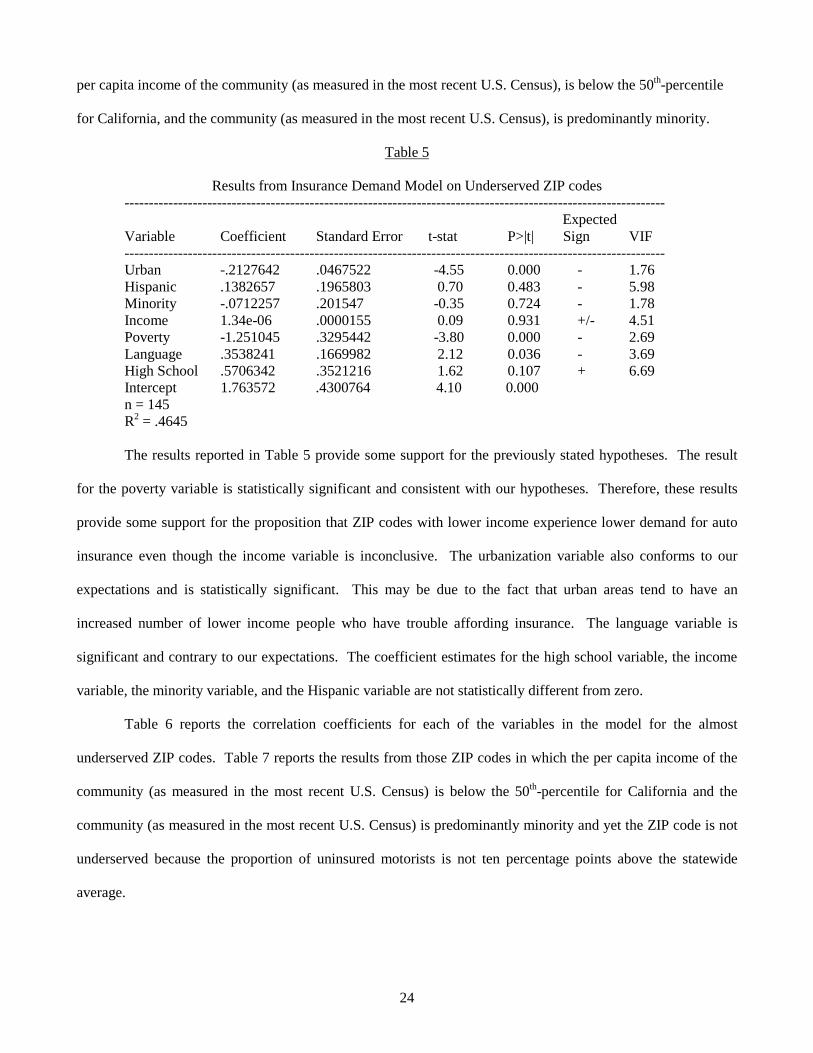
Table 5 reports the results from the underserved ZIP codes. The underserved ZIP codes are those ZIP
codes in which the proportion of uninsured motorists is ten percentage points above the statewide average, the
24
per capita income of the community (as measured in the most recent U.S. Census), is below the 50th-percentile
for California, and the community (as measured in the most recent U.S. Census), is predominantly minority.
Table 5
Results from Insurance Demand Model on Underserved ZIP codes ---------------------------------------------------------------------------------------------------------------
Expected Variable Coefficient Standard Error t-stat P>|t| Sign VIF --------------------------------------------------------------------------------------------------------------- Urban -.2127642 .0467522 -4.55 0.000 - 1.76 Hispanic .1382657 .1965803 0.70 0.483 - 5.98 Minority -.0712257 .201547 -0.35 0.724 - 1.78 Income 1.34e-06 .0000155 0.09 0.931 +/- 4.51 Poverty -1.251045 .3295442 -3.80 0.000 - 2.69 Language .3538241 .1669982 2.12 0.036 - 3.69 High School .5706342 .3521216 1.62 0.107 + 6.69 Intercept 1.763572 .4300764 4.10 0.000 n = 145 R2 = .4645
The results reported in Table 5 provide some support for the previously stated hypotheses. The result
for the poverty variable is statistically significant and consistent with our hypotheses. Therefore, these results
provide some support for the proposition that ZIP codes with lower income experience lower demand for auto
insurance even though the income variable is inconclusive. The urbanization variable also conforms to our
expectations and is statistically significant. This may be due to the fact that urban areas tend to have an
increased number of lower income people who have trouble affording insurance. The language variable is
significant and contrary to our expectations. The coefficient estimates for the high school variable, the income
variable, the minority variable, and the Hispanic variable are not statistically different from zero.
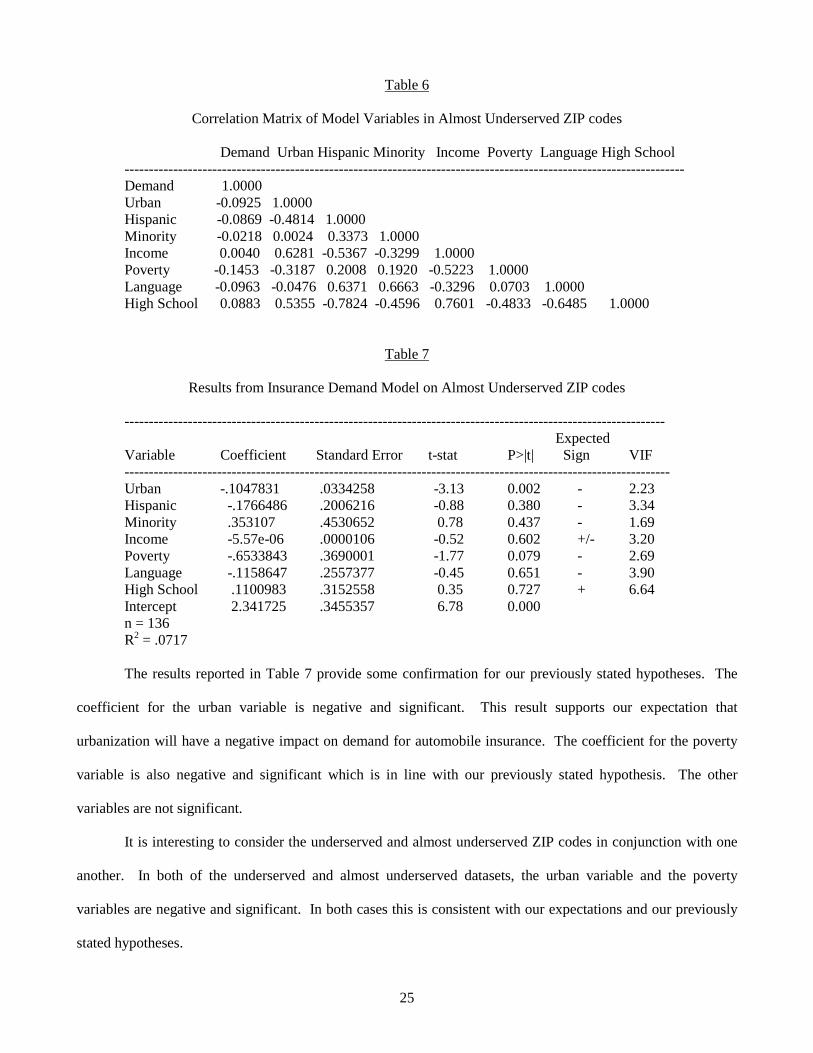
Table 6 reports the correlation coefficients for each of the variables in the model for the almost
underserved ZIP codes. Table 7 reports the results from those ZIP codes in which the per capita income of the
community (as measured in the most recent U.S. Census) is below the 50th-percentile for California and the
community (as measured in the most recent U.S. Census) is predominantly minority and yet the ZIP code is not
underserved because the proportion of uninsured motorists is not ten percentage points above the statewide
average.
25
Table 6
Correlation Matrix of Model Variables in Almost Underserved ZIP codes
Demand Urban Hispanic Minority Income Poverty Language High School ------------------------------------------------------------------------------------------------------------------- Demand 1.0000 Urban -0.0925 1.0000 Hispanic -0.0869 -0.4814 1.0000 Minority -0.0218 0.0024 0.3373 1.0000 Income 0.0040 0.6281 -0.5367 -0.3299 1.0000 Poverty -0.1453 -0.3187 0.2008 0.1920 -0.5223 1.0000 Language -0.0963 -0.0476 0.6371 0.6663 -0.3296 0.0703 1.0000 High School 0.0883 0.5355 -0.7824 -0.4596 0.7601 -0.4833 -0.6485 1.0000
Table 7
Results from Insurance Demand Model on Almost Underserved ZIP codes
--------------------------------------------------------------------------------------------------------------- Expected
Variable Coefficient Standard Error t-stat P>|t| Sign VIF ---------------------------------------------------------------------------------------------------------------- Urban -.1047831 .0334258 -3.13 0.002 - 2.23 Hispanic -.1766486 .2006216 -0.88 0.380 - 3.34 Minority .353107 .4530652 0.78 0.437 - 1.69 Income -5.57e-06 .0000106 -0.52 0.602 +/- 3.20 Poverty -.6533843 .3690001 -1.77 0.079 - 2.69 Language -.1158647 .2557377 -0.45 0.651 - 3.90 High School .1100983 .3152558 0.35 0.727 + 6.64 Intercept 2.341725 .3455357 6.78 0.000 n = 136 R2 = .0717
The results reported in Table 7 provide some confirmation for our previously stated hypotheses. The
coefficient for the urban variable is negative and significant. This result supports our expectation that
urbanization will have a negative impact on demand for automobile insurance. The coefficient for the poverty
variable is also negative and significant which is in line with our previously stated hypothesis. The other
variables are not significant.
It is interesting to consider the underserved and almost underserved ZIP codes in conjunction with one
another. In both of the underserved and almost underserved datasets, the urban variable and the poverty
variables are negative and significant. In both cases this is consistent with our expectations and our previously
stated hypotheses.
26
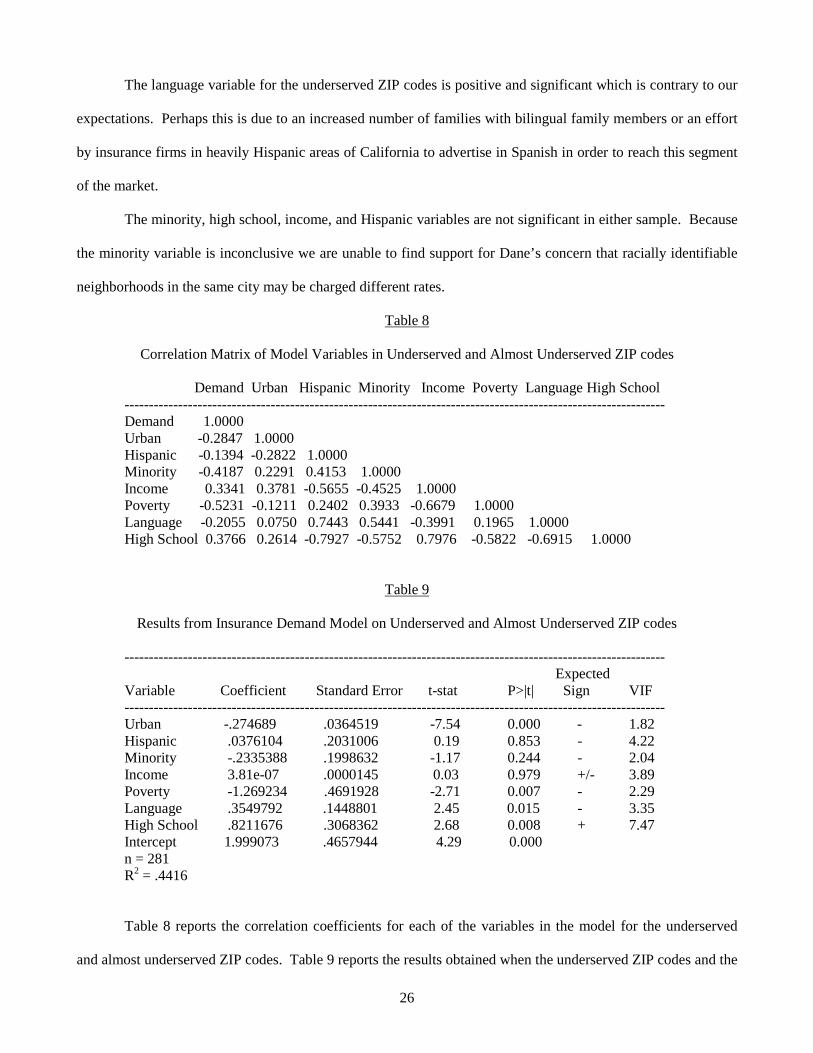
The language variable for the underserved ZIP codes is positive and significant which is contrary to our
expectations. Perhaps this is due to an increased number of families with bilingual family members or an effort
by insurance firms in heavily Hispanic areas of California to advertise in Spanish in order to reach this segment
of the market.
The minority, high school, income, and Hispanic variables are not significant in either sample. Because
the minority variable is inconclusive we are unable to find support for Dane’s concern that racially identifiable
neighborhoods in the same city may be charged different rates.
Table 8
Correlation Matrix of Model Variables in Underserved and Almost Underserved ZIP codes
Demand Urban Hispanic Minority Income Poverty Language High School --------------------------------------------------------------------------------------------------------------- Demand 1.0000 Urban -0.2847 1.0000 Hispanic -0.1394 -0.2822 1.0000 Minority -0.4187 0.2291 0.4153 1.0000 Income 0.3341 0.3781 -0.5655 -0.4525 1.0000 Poverty -0.5231 -0.1211 0.2402 0.3933 -0.6679 1.0000 Language -0.2055 0.0750 0.7443 0.5441 -0.3991 0.1965 1.0000 High School 0.3766 0.2614 -0.7927 -0.5752 0.7976 -0.5822 -0.6915 1.0000
Table 9
Results from Insurance Demand Model on Underserved and Almost Underserved ZIP codes
--------------------------------------------------------------------------------------------------------------- Expected
Variable Coefficient Standard Error t-stat P>|t| Sign VIF --------------------------------------------------------------------------------------------------------------- Urban -.274689 .0364519 -7.54 0.000 - 1.82 Hispanic .0376104 .2031006 0.19 0.853 - 4.22 Minority -.2335388 .1998632 -1.17 0.244 - 2.04 Income 3.81e-07 .0000145 0.03 0.979 +/- 3.89 Poverty -1.269234 .4691928 -2.71 0.007 - 2.29 Language .3549792 .1448801 2.45 0.015 - 3.35 High School .8211676 .3068362 2.68 0.008 + 7.47 Intercept 1.999073 .4657944 4.29 0.000 n = 281 R2 = .4416
Table 8 reports the correlation coefficients for each of the variables in the model for the underserved
and almost underserved ZIP codes. Table 9 reports the results obtained when the underserved ZIP codes and the
27
almost underserved ZIP codes are combined together into one sample. The urban variable continues to be
negative and significant indicating that people in urban areas are less likely to demand auto insurance. The
poverty variable is negative and significant. This result is consistent with what was observed previously and it
is also consistent with our expectations. The language variable continues to be positive and consistent which is
contrary to our expectations. The high school variable is positive and consistent which is what we expected. It
is interesting that the high school variable is significant in the combined dataset, but it is not significant in either
the underserved or almost underserved datasets when they are considered separately. An examination of the
minority, income, and Hispanic variables reveals that they are insignificant here like they were in the previous
specifications.
In order to provide further context, it is important to investigate the entire universe of California ZIP
codes. The remaining analysis will concentrate on all of the ZIP codes in California on which the California
Department of Insurance collected data and which had more than 200 residents as reported by the 2000 United
States Census. The hypotheses discussed above remain the same for the data containing all of the California
ZIP codes.
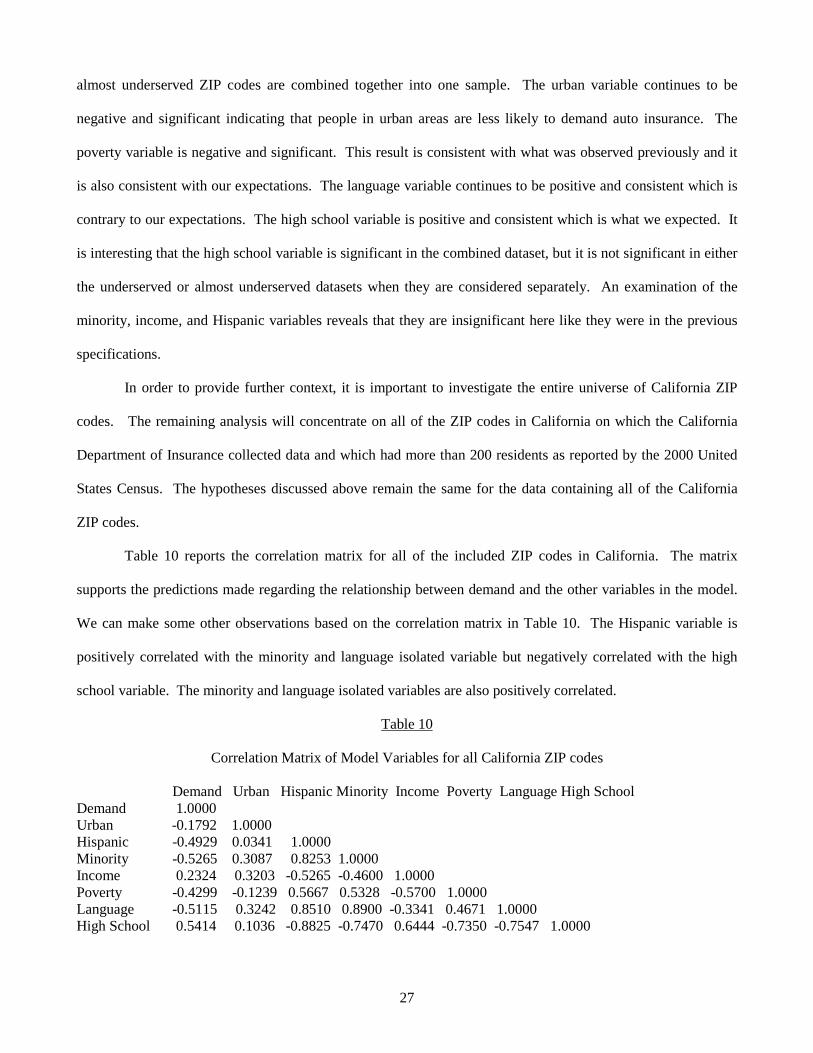
Table 10 reports the correlation matrix for all of the included ZIP codes in California. The matrix
supports the predictions made regarding the relationship between demand and the other variables in the model.
We can make some other observations based on the correlation matrix in Table 10. The Hispanic variable is
positively correlated with the minority and language isolated variable but negatively correlated with the high
school variable. The minority and language isolated variables are also positively correlated.
Table 10
Correlation Matrix of Model Variables for all California ZIP codes
Demand Urban Hispanic Minority Income Poverty Language High School Demand 1.0000 Urban -0.1792 1.0000 Hispanic -0.4929 0.0341 1.0000 Minority -0.5265 0.3087 0.8253 1.0000 Income 0.2324 0.3203 -0.5265 -0.4600 1.0000 Poverty -0.4299 -0.1239 0.5667 0.5328 -0.5700 1.0000 Language -0.5115 0.3242 0.8510 0.8900 -0.3341 0.4671 1.0000 High School 0.5414 0.1036 -0.8825 -0.7470 0.6444 -0.7350 -0.7547 1.0000
28
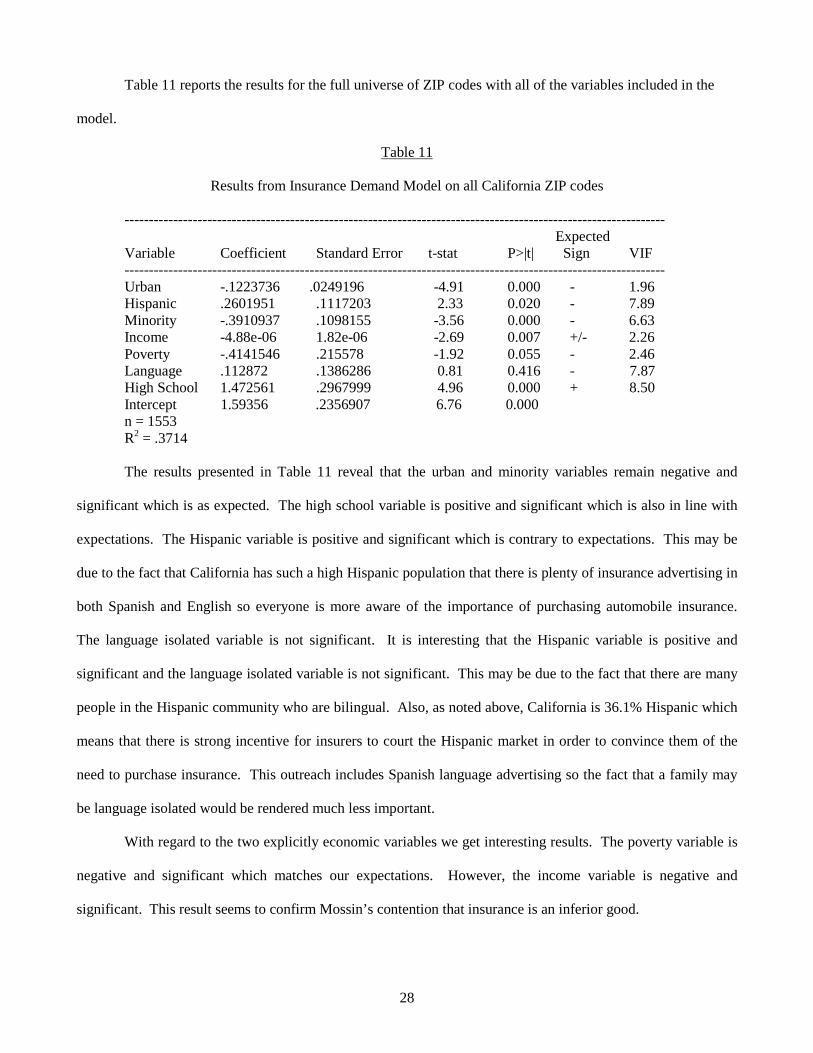
Table 11 reports the results for the full universe of ZIP codes with all of the variables included in the
model.
Table 11
Results from Insurance Demand Model on all California ZIP codes
--------------------------------------------------------------------------------------------------------------- Expected
Variable Coefficient Standard Error t-stat P>|t| Sign VIF --------------------------------------------------------------------------------------------------------------- Urban -.1223736 .0249196 -4.91 0.000 - 1.96 Hispanic .2601951 .1117203 2.33 0.020 - 7.89 Minority -.3910937 .1098155 -3.56 0.000 - 6.63 Income -4.88e-06 1.82e-06 -2.69 0.007 +/- 2.26 Poverty -.4141546 .215578 -1.92 0.055 - 2.46 Language .112872 .1386286 0.81 0.416 - 7.87 High School 1.472561 .2967999 4.96 0.000 + 8.50 Intercept 1.59356 .2356907 6.76 0.000 n = 1553 R2 = .3714
The results presented in Table 11 reveal that the urban and minority variables remain negative and
significant which is as expected. The high school variable is positive and significant which is also in line with
expectations. The Hispanic variable is positive and significant which is contrary to expectations. This may be
due to the fact that California has such a high Hispanic population that there is plenty of insurance advertising in
both Spanish and English so everyone is more aware of the importance of purchasing automobile insurance.
The language isolated variable is not significant. It is interesting that the Hispanic variable is positive and
significant and the language isolated variable is not significant. This may be due to the fact that there are many
people in the Hispanic community who are bilingual. Also, as noted above, California is 36.1% Hispanic which
means that there is strong incentive for insurers to court the Hispanic market in order to convince them of the
need to purchase insurance. This outreach includes Spanish language advertising so the fact that a family may
be language isolated would be rendered much less important.
With regard to the two explicitly economic variables we get interesting results. The poverty variable is
negative and significant which matches our expectations. However, the income variable is negative and
significant. This result seems to confirm Mossin’s contention that insurance is an inferior good.

29
Table 12 presents the results of several models. All of the models have insurance demand as the
dependent variable. The models have different independent variables in order to explore the interactions
between the variables. Specifically, there are some variables in the complete model that have relatively high
correlations. For example, in model 2, the High School variable was deleted because of its high correlation with
the Hispanic variable. In model 3, the Language variable was deleted because of its high correlation with both
the minority and the Hispanic variable. In model 4, the Language and High School variables were deleted
because of their high correlations with the Hispanic and Minority variables. In model 5, the Minority variable
was deleted because of its high correlation with the Hispanic, Language, and High School variables. All of the
regressions reported in Table 12 were performed on the dataset containing all of the California ZIP codes.
Table 12
Results from Selected Insurance Demand Models on all California ZIP codes Model 1 Model 2 Model 3 Model 4 Model 5 Model 6 Urban -.1223736 -.0736853 -.1156684 -.0808134 -.1582557 -.1231787 [.0249196]*** [.0319434]** [.0288837]*** [.0340751]** [.0207523]*** [.0251033]*** Hispanic .2601951 -.2808984 .2982317 -.348806 .1551071 .3214595 [.1117203]** [.092757]*** [.1307203]** [.0718988]*** [.1021099] [.1003049]*** Minority -.3910937 -.3359965 -.3433327 -.3965755 -.4290201 [.1098155]*** [.1078165]*** [.0711541]*** [.0802178]*** [.1000923]*** Income -4.88e-06 -2.57e-06 -4.62e-06 -2.84e-06 -3.53e-06 -4.63e-06 [1.82e-06]*** [5.79e-07]* [1.59e-06]*** [1.39e-06]** [1.56e-06]** [1.88e-06]*** Poverty -.4141546 -1.169928 -.4327324 -1.171048 -.5183771 [.215578]* [.1915749]*** [.2034048]** [.1949671]*** [.2033243]*** Language Isolated .112872 -.1390726 -.1426441 .1490397 [.1386286] [.1180199] [.0910867] [.1291406] High School 1.472561 1.434694 1.428258 1.693702 [.2967999]*** [.2658697]*** [.2921763]*** [.2200346]*** Intercept 1.59356 2.934575 1.619121 2.946239 1.553625 1.36007 Observations 1553 1553 1553 1553 1553 1553 R2 .3714 .3303 .3709 .3296 .3626 .3680 Note: The dependent variable is insurance demand. Standard errors appear in brackets below each coefficient estimate. ***,**, and * denote statistical significance at the 1, 5, and 10 percent levels respectively.
When examining the variables contained in the various models a few things are revealed. The first thing
that stands out is the Hispanic variable. Throughout all of the models the Hispanic variable displays a lack of
consistency. In three of the models it is positive and in two it is negative and in one it is insignificant. The
30
Hispanic variable is not only the sole one that demonstrates this level of inconsistency, it is the only one that
demonstrates any inconsistency at all. Every other variable is always positive or always negative.
The urban and minority variables are negative and consistent at the 1% level in every specification in
which they appear (except for the urban variable in model 2). The high school variable is positive and
consistent at the 1% level in every specification in which it appears. The poverty and language isolated
variables never change their sign but are insignificant in some specifications.
The income variable is negative and consistent in every specification. These results continue to indicate
that income has a negative correlation with automobile insurance demand when all ZIP codes in California are
considered. Therefore, the result found when considering the entire California market provides evidence in
agreement with previous literature that concluded that insurance is an inferior good.
Overall, with the previously noted exception of the Hispanic variable all of the other variables in the
different specifications demonstrated remarkable consistency. Table 12 suggests that even in the face of some
rather high correlation reported in Table 10 the results can be regarded with some degree of trust. This should
bolster our confidence when interpreting the effect of the various variables on automobile insurance demand.
With the exception of the Hispanic and the income variable, all of the remaining variables are in line with our
hypotheses.
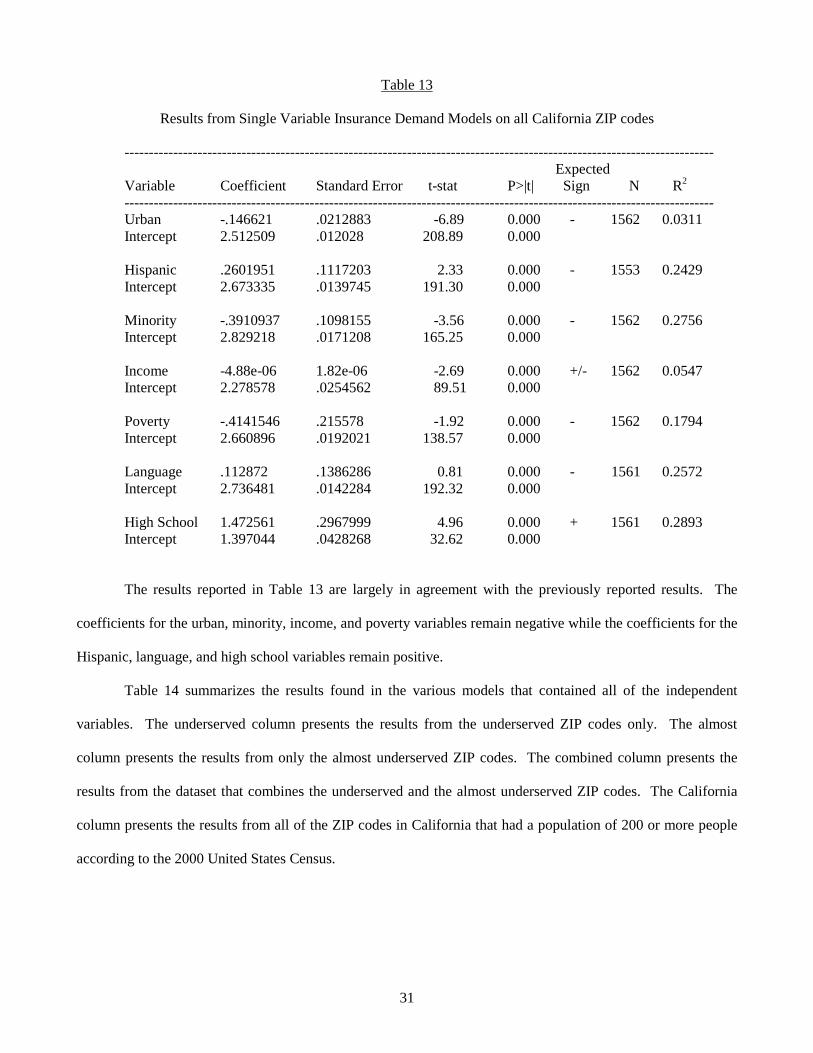
Table 13 presents the results when all of the variables in the main model are regressed against insurance
demand separately.
31
Table 13
Results from Single Variable Insurance Demand Models on all California ZIP codes
------------------------------------------------------------------------------------------------------------------------- Expected
Variable Coefficient Standard Error t-stat P>|t| Sign N R2 ------------------------------------------------------------------------------------------------------------------------- Urban -.146621 .0212883 -6.89 0.000 - 1562 0.0311 Intercept 2.512509 .012028 208.89 0.000
Hispanic .2601951 .1117203 2.33 0.000 - 1553 0.2429 Intercept 2.673335 .0139745 191.30 0.000
Minority -.3910937 .1098155 -3.56 0.000 - 1562 0.2756 Intercept 2.829218 .0171208 165.25 0.000
Income -4.88e-06 1.82e-06 -2.69 0.000 +/- 1562 0.0547 Intercept 2.278578 .0254562 89.51 0.000
Poverty -.4141546 .215578 -1.92 0.000 - 1562 0.1794 Intercept 2.660896 .0192021 138.57 0.000
Language .112872 .1386286 0.81 0.000 - 1561 0.2572 Intercept 2.736481 .0142284 192.32 0.000
High School 1.472561 .2967999 4.96 0.000 + 1561 0.2893 Intercept 1.397044 .0428268 32.62 0.000
The results reported in Table 13 are largely in agreement with the previously reported results. The
coefficients for the urban, minority, income, and poverty variables remain negative while the coefficients for the
Hispanic, language, and high school variables remain positive.
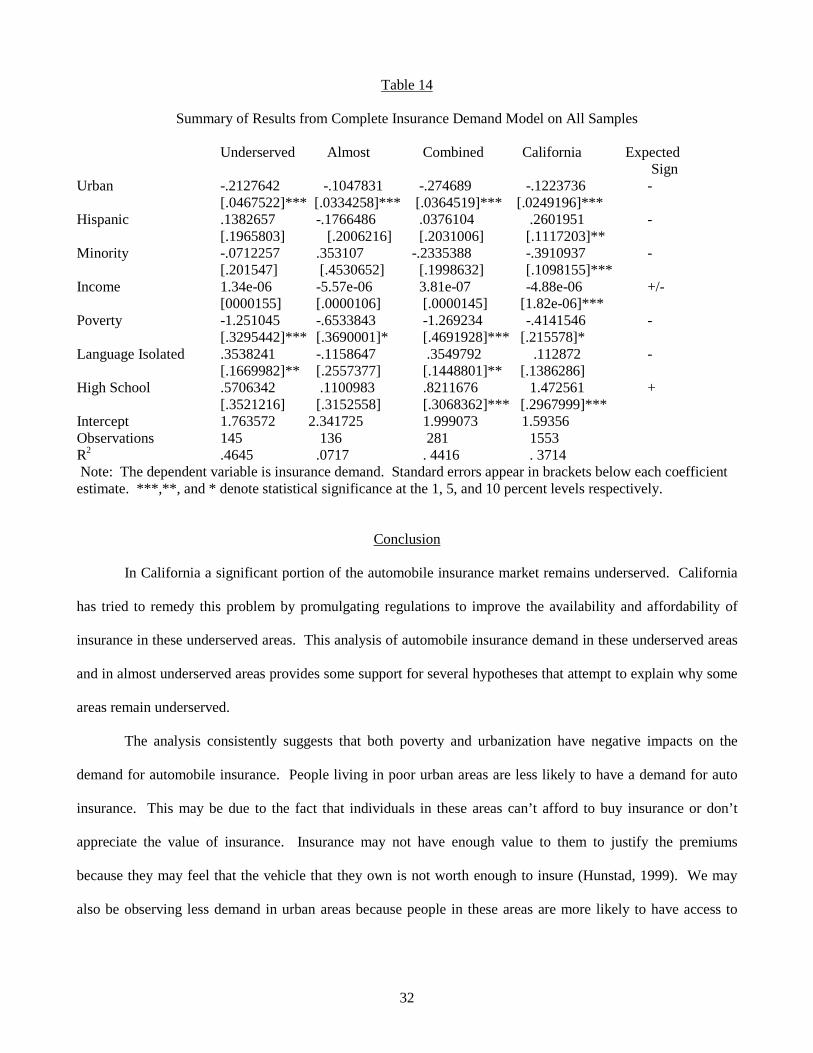
Table 14 summarizes the results found in the various models that contained all of the independent
variables. The underserved column presents the results from the underserved ZIP codes only. The almost
column presents the results from only the almost underserved ZIP codes. The combined column presents the
results from the dataset that combines the underserved and the almost underserved ZIP codes. The California
column presents the results from all of the ZIP codes in California that had a population of 200 or more people
according to the 2000 United States Census.
32
Table 14
Summary of Results from Complete Insurance Demand Model on All Samples
Underserved Almost Combined California Expected Sign Urban -.2127642 -.1047831 -.274689 -.1223736 - [.0467522]*** [.0334258]*** [.0364519]*** [.0249196]*** Hispanic .1382657 -.1766486 .0376104 .2601951 - [.1965803] [.2006216] [.2031006] [.1117203]** Minority -.0712257 .353107 -.2335388 -.3910937 - [.201547] [.4530652] [.1998632] [.1098155]*** Income 1.34e-06 -5.57e-06 3.81e-07 -4.88e-06 +/- [0000155] [.0000106] [.0000145] [1.82e-06]*** Poverty -1.251045 -.6533843 -1.269234 -.4141546 - [.3295442]*** [.3690001]* [.4691928]*** [.215578]* Language Isolated .3538241 -.1158647 .3549792 .112872 - [.1669982]** [.2557377] [.1448801]** [.1386286] High School .5706342 .1100983 .8211676 1.472561 + [.3521216] [.3152558] [.3068362]*** [.2967999]*** Intercept 1.763572 2.341725 1.999073 1.59356 Observations 145 136 281 1553 R2 .4645 .0717 . 4416 . 3714 Note: The dependent variable is insurance demand. Standard errors appear in brackets below each coefficient estimate. ***,**, and * denote statistical significance at the 1, 5, and 10 percent levels respectively.
Conclusion
In California a significant portion of the automobile insurance market remains underserved. California
has tried to remedy this problem by promulgating regulations to improve the availability and affordability of
insurance in these underserved areas. This analysis of automobile insurance demand in these underserved areas
and in almost underserved areas provides some support for several hypotheses that attempt to explain why some
areas remain underserved.
The analysis consistently suggests that both poverty and urbanization have negative impacts on the
demand for automobile insurance. People living in poor urban areas are less likely to have a demand for auto
insurance. This may be due to the fact that individuals in these areas can’t afford to buy insurance or don’t
appreciate the value of insurance. Insurance may not have enough value to them to justify the premiums
because they may feel that the vehicle that they own is not worth enough to insure (Hunstad, 1999). We may
also be observing less demand in urban areas because people in these areas are more likely to have access to
33
public transportation and therefore feel that they don’t need automobile insurance because they don’t drive as
much.
These findings provide evidence consistent with Harrington and Niehaus (1998). In underserved and
almost underserved areas the results suggest that the percentage of minorities present in a ZIP code has no
statistical effect on automobile insurance demand. Even though there is evidence that the minority status of a
ZIP code matters in assessing insurance demand for California as a whole; it is still consistent with the data to
assert that it is the economic condition of a particular ZIP code which has more impact on automobile insurance
demand.
The income level of a particular ZIP code was found to be inconclusive in helping to predict the level of
automobile demand except when considering California as a whole. When examining the entire state the level
of income of a ZIP code was found to be inversely related to insurance demand. In California as a whole, the
results suggest that the higher the income level in a particular ZIP code the lower the insurance demand. This
result confirms prior literature that contended that insurance is an inferior good. However, it is inconsistent with
Browne and Hoyt (2000).
The high school variable was found to be positively correlated with insurance demand in California as a
whole and in the combined sample. This result is consistent with expectations and with Klein & Grace (2001)
and Hunstad (1999).
Another factor that was observed to have an impact on insurance demand in underserved communities
was whether or not the household was language isolated. In the almost underserved ZIP codes and in California
as a whole this variable was inconclusive. However, in the underserved ZIP codes this variable was positive and
significant. It is useful to consider the language isolated variable in conjunction with the Hispanic variable.
These two factors should be somewhat related because after English the next most popular language spoken in
the home is Spanish. Like the language isolated variable, the Hispanic variable was contrary to expectations.
The Hispanic variable was positive for California as a whole. It was inconclusive in the other samples.
While this result was contrary to expectations, and previous research (Kunreuther and Pauly, 2004)
these findings may have important implications for California policymakers. The results of this study indicate
that being language isolated in underserved ZIP codes and Hispanic in California tends to make a household
34
have more demand for automobile insurance. Perhaps these language isolated households are still in
underserved ZIP codes despite their greater demand because they have more trouble than English speaking
households in understanding the details related to purchasing insurance. These details could involve not being
able to communicate with anyone at an insurance company, not knowing which of the many insurance
companies to choose from, and not understanding what types or amounts of insurance to purchase (Hunstad,
1999).
The goal of the California Department of Insurance in promulgating these regulations is to address the
issue of availability and affordability of automobile insurance in underserved communities. The strongest most
consistent results found in this study are most relevant for poverty stricken urban areas. The results suggest that
both poverty and urbanization are factors that lead to a lower demand for automobile insurance. Perhaps the
problem of low insurance demand in these areas could be partially remedied by outreach programs to better
educate people about the importance of automobile insurance. These programs could also help the public find
affordable insurance that would meet their needs. Vouchers or targeted subsidies could also be used to remedy
the problem of low automobile insurance demand in some urban areas.
Another idea would be to expand the Assigned Risk program in California. As currently constituted the
program only covers those who cannot obtain conventional automobile liability insurance. The usual reason that
they find it hard to get insurance is because of poor driving records. Insurance companies are then assigned to
write insurance for them usually at higher prices. It could be modified so that the insurance companies would
not charge unwarranted higher prices. If this program were expanded to cover those in urban areas that find it
hard to obtain insurance it could increase access to automobile insurance.
Another way to increase access to automobile insurance would be to increase the number of agents and
service offices in underserved areas. Because automobile insurance is still a localized market, having a greater
number of agents in underserved areas would likely increase demand in these areas. Potential customers in
these areas would have agents that were familiar with their communities and better able to help them find
insurance products that would fit their needs.
This research highlights some interesting results for Hispanics and language isolated families. Future
research could be devoted to determining why Hispanics and language isolated families actually have greater

35
demand for automobile insurance. Perhaps by studying this surprising result new ideas could be found to help
others increase their access to automobile insurance.

36
References
Aldrich, Howard E., and E. R. Auster. (1986). “Even Dwarfs Started Small: Liabilities of Age and Size and Their Strategic Implications,” Research in Organizational Behavior 8, 165-198.
Barnett, William P., and Terry L. Amburgey. (1990). “Do Larger Organizations Generate Stronger
Competition?” Organizational Evolution: New Directions 78-102. Best’s Insurance Reports Property/Casualty Vol. 1&2. (2005). Browne, Mark J., and Robert E. Hoyt. (2000). “The Demand for Flood Insurance: Empirical Evidence,”
Journal of Risk and Uncertainty 20:3, 291-306.
Butler, Richard. (1994). “Economic Determinants of Workers Compensation Trends,” Journal of Risk and Insurance 61:3, 383-401.
Carson, James, and Robert Hoyt. (2000). “Evaluating the Risk of Life Insurer Insolvency: Implications from the
US for the European Union,” Journal of Multinational Financial Management 10, 297-314. Choi, Byeongyong Paul, and Mary A. Weiss. (2005). “An Empirical Investigation of Market Structure,
Efficiency, and Performance in Property-Liability Insurance,” Journal of Risk and Insurance 72:4, 635-673. Cole, Cassandra R., and Kathleen A. McCullough. (2007). “A Review of Some Possible Solutions to the
Uninsured Motorist Problem,” CPCU eJournal 60:11, 1-9. Cummins, J. David, Dan M. McGill, Howard E. Winklevoss, and Robert A. Zelten. (1974). “Consumer
Attitudes Toward Auto and Homeowners Insurance,” Philadelphia, PA: University of Pennsylvania. Cummins, J. David, and Sharon Tennyson. (1996). “Moral Hazard in Insurance Claiming: Evidence from
Automobile Insurance,” Journal of Risk and Uncertainty 12:1, 29-50. Dane, Stephen M. (2006). “The Potential for Racial Discrimination by Homeowners Insurers Through the Use
of Geographic Rating Territories,” National Association of Insurance Commissioners. Fiscella, Kevin, Peter Franks, Mark P. Doescher, and Barry G. Saver. (2002). “Disparities in Health Care by
Race, Ethnicity, and Language Among the Insured,” Medical Care 40:1, 52-59. Flores, Glenn, Milagros Abreu, Mary Anne Olivar, and Beth Kastner. (1998). “Access Barriers to Health Care
for Latino Children,” Arch Pediatr Adolesc Med 152, 1119-1125. Grabowski, Henry, W. Kip Viscusi, and William N. Evans. (1989). “Price and Availability Tradeoffs of
Automobile Regulation,” Journal of Risk and Insurance 56:2, 275-299. Gutter, Michael S., and Charles B. Hatcher. (2008). “Racial Differences in the Demand for Life Insurance,” The
Journal of Risk and Insurance 75:3, 677-689. Harrington, Scott E., and Greg Niehaus. (1992). “Dealing with Insurance Availability and Affordability
Problems in Inner Cities: An Analysis of the California Proposal,” Journal of Insurance Regulation 10:4, 564-584.
Harrington, Scott E., and Greg Niehaus. (1998). “Race, Redlining, and Automobile Insurance Prices,” Journal
of Business 73:3, 439-469.
37
Hoyt, Robert E., David B. Mustard, and Lawrence S. Powell. (2006). “The Effectiveness of State Legislation in Mitigating Moral Hazard: Evidence from Automobile Insurance,” Journal of Law and Economics 49:2, 427-450.
Hunstad, Lyn (1999). “Characteristics of Uninsured Motorist,” California Department of Insurance 1-99. Insurance Research Council. (1999). Uninsured Motorists, Malvern, PA: Insurance Research Council. Kelly, Mary, and Si Li. (2008). “The Impact of Rate Regulation on the Performance of the Canadian
Property/Casualty Insurance Industry”. Kleffner, Anne E., and Neil A. Doherty. (1996). “Costly Risk Bearing and the Supply of Catastrophic
Insurance,” Journal of Risk and Insurance 63:4, 657-671. Klein, Robert W., and Martin F. Grace. (2001). “Urban Homeowners Insurance Markets in Texas: A Search for
Redlining,” Journal of Risk and Insurance 68:4, 581-614. Kunreuther, Howard, and Mark Pauly. (2004). “Neglecting Disaster: Why Don’t People Insure Against Large
Losses?” Journal of Risk and Uncertainty 28:1, 5-21. Lamm-Tennant, Joan, and Laura T. Starks. (1993). “Stock Versus Mutual Ownership Structures: The Risk
Implications” Journal of Business 66:1, 29-46. Mayers, David, and Clifford W. Smith. (1990). “On the Corporate Demand for Insurance: Evidence from the
Reinsurance Market” Journal of Business 63:1, 19-39. Metropolitan Housing Development Corp. v. Village of Arlington Heights, 558 F.2d 1283, 1977. Mossin, Jan. (1968). “Aspects of Rational Insurance Purchasing,” Journal of Political Economy 76, 553-568. Nelson, Richard R. and Sidney G. Winter. (1982). An Evolutionary Theory of Economic Change. Cambridge,
MA: Belknap Press of Harvard University Press. Ranger-Moore, James. (1997). “Bigger May Be Better, But Is Older Wiser? Organizational Age and Size In the
New York Life Insurance Industry,” American Sociological Review 62, 903-920. Raphael, Steven, and Lorien Rice. (2000). “Car Ownership, Employment, and Earnings.” Unpublished
Manuscript. Raphael, Steven, and Michael A. Stoll. (2001). “Can Boosting Minority Car-Ownership Rates Narrow Inter-
Racial Employment Gaps?” Brookings-Wharton Papers on Urban Affairs. Schultz, Jay D. (1995). “An Analysis of Agent Location and Homeowners Insurance Availability,” Journal of
Insurance Regulation, 65-89. Solis, Julia M., Gary Marks, Melinda Garcia, and David Shelton. (1990). “Acculturation, Access to Care, and
Use of Preventive Services by Hispanics: Findings from HHNAES 1982-1984,” American Journal of Public Health, 80 (Suppl):11-19.
Sommer, David W. (1996). “The Impact of Firm Risk on Property-Liability Insurance Prices,” Journal of Risk
and Insurance, 63:3, 501-514.
38
Squires, Gregory D. (2003). “Racial Profiling, Insurance Style: Insurance Redlining and the Uneven Development of Metropolitan Areas.” Journal of Urban Affairs 25:4, 391-410.
Squires, Gregory D., Ruthanne Dewolfe, and Alan S. Dewolfe. (1979). “Urban Decline or Disinvestment:
Uneven Development, Redlining and the Role of the Insurance Industry.” Social Problems 27:1, 79–95. Squires, Gregory D., and Charis E. Kubrin. (2006). “Racial Profiling, Insurance Style.” Privileged Places:
Residence, and the Structure of Opportunity, Ch.4. Squires, Gregory D., William Velez, and Karl E. Taeuber. (1991). “Insurance Redlining, Agency Location, and
the Process of Urban Disinvestment.” Urban Affairs Quarterly 26:4, 567-588. Stone, Geoffrey R., Louis M. Seidman, Cass R. Sunstein, and Mark V. Tushnet. (1991). Constitutional Law 2nd
ed. Weinick, Robin M., Margaret E. Weigers, and Joel W. Cohen. (1998). “Children’s Health Insurance, Access to
Care, and Health Status: New Findings.” Health Affairs 17:2, 127-136. Weinick, Robin M., Samuel H. Zuvekas, and Joel W. Cohen. (2000). “Racial and Ethnic Differences in Access
to and Use of Health Care Services, 1977 to 1996.” Medical Care Research and Review 57:1, 36-54. Witt, Robert C. (1979). “An Economic Appraisal of Territorial Pricing Issues in Automobile Insurance.” The
Journal of Risk and Insurance, 46:1, 33-60. Zuvekas, Samuel H., and Gregg S. Taliaferro. (2003). “Pathways to Access: Health Insurance, the Health Care
Delivery System, and Racial/Ethnic Disparities, 1996-1999.” Health Affairs 22:2, 139-153.