Embed Size (px)
Citation preview

THE DEVELOPMENT OF LISTENING AND READING COMPREHENSION
SCREENING MEASURES TO INFORM INSTRUCTIONAL DECISIONS FOR
END-OF-SECOND-GRADE STUDENTS
A Dissertation
by
SUZANNE HUFF CARREKER
Submitted to the Office of Graduate Studies of Texas A&M University
in partial fulfillment of the requirements for the degree of
DOCTOR OF PHILOSOPHY
May 2011
Major Subject: Curriculum and Instruction
THE DEVELOPMENT OF LISTENING AND READING COMPREHENSION
SCREENING MEASURES TO INFORM INSTRUCTIONAL DECISIONS FOR
END-OF-SECOND-GRADE STUDENTS
A Dissertation
by
SUZANNE HUFF CARREKER
Submitted to the Office of Graduate Studies of Texas A&M University
in partial fulfillment of the requirements for the degree of
DOCTOR OF PHILOSOPHY
Approved by:
Chair of Committee, R. Malatesha Joshi Committee Members, G. Reid Lyon Erin McTigue Dennie L. Smith Bruce Thompson Head of Department, Dennie L. Smith
May 2011
Major Subject: Curriculum and Instruction
iii
ABSTRACT
The Development of Listening and Reading Comprehension Screening Measures
to Inform Instructional Decisions for End-of-Second-Grade Students. (May 2011)
Suzanne Huff Carreker, B.A., Hood College;
M.S., Texas A&M University
Chair of Advisory Committee: Dr. R. Malatesha Joshi
The premise of the Simple View of Reading is that reading comprehension is the product
of two components – decoding and language comprehension. Each component is
necessary but not sufficient. To support teachers in identifying end-of-second-grade
students who may have difficulties in one or both of the components, parallel listening
comprehension and reading comprehension screening measures were developed and
investigated in two preliminary pilot studies and one large-scale administration. The first
pilot study, conducted with 41 end-of-second-grade students, established administration
times for the listening comprehension screening (LCS) and the reading comprehension
screening (RCS) and confirmed the appropriateness of the 75 items on each of the
measures. The second pilot study, conducted with 12 end-of-second- grade students with
varying reading levels, demonstrated that the LCS and RCS could differentiate readers
with good comprehension from readers with poor comprehension. The large-scale
administration, conducted with 699 end-of-second-grade students, aided in the
development of shorter final versions of the LCS and RCS and provided data to
iv
determine the score reliability and validity of the final versions of the measures, each of
which had 42 items.
Item response theory (IRT) was used to identify the most apposite and
discriminating items for use on the final versions of the LCS and RCS. Score reliability
(Cronbach‟s alpha) on the final LCS was estimated to be .89 and was estimated to be .93
on the final RCS. Various sources provided content and criterion-related validity
evidence. In particular, criterion-related validity evidence included strong correlations
with the Gates-MacGinitie Reading Tests and strong sensitivity, specificity, and positive
predictive indices. Construct validity evidence included group differentiation and a
confirmatory factor analysis (CFA), all of which supported a single underlying construct
on the LCS and a single underlying construct on the RCS. In a subset of 214 end-of-
second-grade students from the larger study, partial correlation and structural equation
modeling (SEM) analyses supported the discriminant validity of the LCS and RCS as
measures of comprehension. The listening and reading comprehension screening
measures will assist second-grade teachers in identifying student learning needs that
cannot be identified with reading-only comprehension tests.

v
To Larry, my rock,
for his unwavering support, patience, and occasional prods
To James, one of my greatest teachers,
for his incredible insights and willingness to think through analyses with me
To Elsa, one of my greatest teachers,
for her ready ear and her astute and devoted counsel that kept me sane
To Corey, the new member of our family,
for his good-hearted and gentle graciousness

vi
ACKNOWLEDGEMENTS
I have been a traveler on a journey. And what a journey it has been! A journey is rarely a
solitary happening. A journey often begins with an idea that needs a champion. I thank
Malt Joshi for resolutely championing this journey and bringing it to fruition. Studying
the exploits of those who have gone before is enormously helpful. I thank Reid Lyon for
his generosity and many kindnesses as well as for his vision and for fighting the good
fight to make the journeys of individuals like me more informed and productive.
Equipment and flexibility are essential on a journey. I thank Erin McTigue for equipping
me with new views and other possibilities. Reassurance that the journey can be
completed keeps the spirit, mind, and body going. I thank Dennie Smith for his
enthusiasm and his confidence in me. The sine qua non is the self-realization that the
journey will be completed. I thank Bruce Thompson for his wisdom and his laconic yet
genuine support that lead me to know my journey would be completed with competency
and clarity.
Along my journey, I had many well-wishers who cheered, provided solace and
sustenance, and kept me moving. I thank my family – Larry, James, Elsa, and Corey –
and my father, whose love and support were immeasurable. I thank Regina Boulware-
Gooden for faithfully being there at all times for anything and Sally McCandless for her
energy and organizational skills. I thank Mary Lou Slania for reminding me to breathe
deeply and often and Ann Thornhill for her steadfast encouragement. I thank Fredda
Parker for her early tutelage and Carolyn Wickerham, Lenox Reed, and Kay Allen for
mentoring the possibility of this journey long ago. I thank Sally Day for her critical
vii
review and fellow traveler Barbara Conway for her camaraderie. I thank Irene
McDonald for her careful proofreading, and Elisa Barnes, Linda Corbett, Jeremy Creed,
Katy Farmer, Mary French, Ginger Holland, Maricela Jimenez, Rai Thompson,
Catherine Scott, Tarsy Wagner, and Mary Yarus for lending their time and considerable
talents. I thank Neuhaus Education Center for supporting my journey in ways too
numerous to count. And each day, I thank the two angels who sat on my shoulders
throughout the journey – on one shoulder, my mother, who always insisted on
perseverance and excellence, and on the other, Nancy La Fevers, who taught me about
the importance and wonder of language.
Now, my journey is finished – but in a larger sense, the journey never really
ends. The experiences, insights, and knowledge I gained will take me in new and
exciting directions. And if, as Tim Cahill suggested, “A journey is best measured in
friends than miles,” then it has indeed been an incredible journey that will live on in the
many friends and family who were part of it!
viii
TABLE OF CONTENTS
Page
ABSTRACT………………………………………………………………………...
DEDICATION……………………………………………………………………...
ACKNOWLEDGEMENTS…..…………………………………………………….
TABLE OF CONTENTS…………………………………………………………....
LIST OF TABLES…………………………………………………………………..
LIST OF FIGURES…………………………………………………………………
CHAPTER
I INTRODUCTION…………………………………………………….
Validity of the Simple View of Reading……………………………... Models for Identifying Students with Reading Deficits……………… The Statement of the Problem………………………………………... The Purpose of the Present Study……………………………………. The Organization of the Present Study……………………………..... The Significance of the Present Study…………………...…………...
II THE DEVELOPMENT AND VALIDATION OF LISTENING AND READING COMPREHENSION SCREENING MEASURES TO INFORM INSTRUCTIONAL DECISIONS………..…………….
The Simple View of Reading…………………………………………. Assessing Reading Comprehension………………………………….... The Purpose of the Present Study………………..………………….... Method………………………………………………………..………. Results………………………………………………………….……... Discussion…………………………………………………….………..
III THE DISCRIMINANT VALIDITY OF PARALLEL COMPREHENSION SCREENING MEASURES…...……..………. Causes of Poor Reading Comprehension………………………….….. Identifying Causes of Poor Reading Comprehension……………….... Listening and Reading Comprehension Screening Measures...…….....
iii
v
vi
viii
x
xii
1
2 3 7 8 9 9
11
11 13 18 19 25 46
50
51 52 54
ix
CHAPTER The Purpose of the Present Study…………………………………….. Method………………………………………………………………... Results……………………………………………………………….... Discussion……………………………………………………………..
IV SUMMARY AND DISCUSSION...…………………………………..
Listening and Reading Comprehension Screening Measures……….... The Trustworthiness and Usefulness of the LCS and RCS………….... Conclusions and Future Steps……………………………………….....
REFERENCES…………………………………………………………………. ....... .
APPENDIX A: EXTENDED LITERATURE REVIEW…………………………..
APPENDIX B: ADDITIONAL METHODOLOGY AND RESULTS…………….
VITA………………………………………………………………………………. .. .
Page
57 58 61 78
81
82 83 87
91
107
137
161
x
LIST OF TABLES
TABLE Page 1 Means, Standard Deviations, and Ranges for the Second Pilot
Study……………………………………………………………..........
2 Coefficient Alphas for Subgroups on the Preliminary and Final Comprehension Screenings……………………………………………
3 Means, Standard Deviations, and Ranges on All Assessments………..
4 Correlations of the LCS and RCS with Other Reading-Related Assessments…………………………………………………….…......
5 Matrices for Predicting At-Risk Readers from the Final RCS or LCS Scores………………………………………………………………….
6 Values of Predictive Indices Using Reading-Related Measures and the Final RCS or LCS……………………………………………........
7 Means and Standard Deviations on Reading-Related Measures for Each Subgroup………………………………………………..............
8 Variance-Covariance and Correlation Matrices Among the Observed Variables on a Two-Factor Model Based on Maximum Likelihood Estimation…………………………………………………………….
9 Assessment Means and Standard Deviations for Participants with ITBS Scores (n = 71)............................................................................
10 Correlations of Assessment Scores for Participants with ITBS
Scores (n = 71)……………………………………..……………….... 11 Assessment Means and Standard Deviations for Participants with
SAT-10 Scores (n = 143).……………………………………...….….
12 Correlation Matrix for Participants with SAT-10 Scores (n = 143)….
13 Zero-Order and First-Order Partial Correlations……..........................
14 Fit Indices of SEM Models…...……………………………………...
26
32
34
35
37
39
41
43
62
63
64
65
68
73
xi
TABLE Page B1 Table of Specifications for Items on the Preliminary LCS and RCS..... B2 Orders of Administration of Additional Reading-Related
Assessments…………………………………………………………… B3 Characteristics of Items on the Preliminary Listening Comprehension
Screening……………………………………………………………… B4 Characteristics of Items on the Preliminary Reading Comprehension
Screening……………………………………………………………… B5 Raw Scores, Cumulative Frequencies, and Frequencies……………… B6 Raw Score Conversion Table for the Final LCS……………………… B7 Raw Score Conversion Table for the Final RCS……………………… B8 Raw Score Conversion Table for Total LCS and RCS………………..
138
139
148
149
151
152
153
154
xii
LIST OF FIGURES
FIGURE Page 1 A confirmatory factor analysis investigating the relationships among
two factors and eight observed variables. Standardized estimates are displayed………………………………..………….............................
2 Models 1 and 2 investigate relationships between latent and
observed variables………………………………………………….... 3 Model 3 presents relationships of scores on the SAT-10 to scores on
RCS and Model 4 presents relationships of scores on the SAT-10 to scores on G-M. Model 4 lacks model fit. Standardized estimates are displayed.……………………………………………………………..
B1 Scree plot of the preliminary listening comprehension screening
(LCS) using a principal components analysis………………………... B2 Scree plot of the preliminary reading comprehension screening
(RCS) using a principal components analysis………………………... B3 Item characteristic curves (ICCs) illustrate the relative difficulty and
discrimination of two items. Item 2 is more difficult and discriminating than Item 1……………………………………………
B4 An item information curve provides graphic information about an
item. The item represented by this information curve has a large a value and small item variance and is a highly discriminating item. Maximum information for the item is found under the apex of the curve………………………………………………………………..…
B5 The confidence intervals on the item characteristic curve (ICC)
represent different ability levels. At all ability levels, the model-data fit is good……………………………………………………………..
B6 Graph of Mahalanobis distances and chi-squares to verify
multivariate normality for a confirmatory factor analysis…………… B7 A CFA model with equality constraints…………………………….... B8 A CFA model without equality constraints…………………………...
44
75
76
141
142
145
146
147
155
156
157

xiii
FIGURE Page
B9 A third CFA model…………………………………………………… B10 A fourth CFA model………………………………………………….. B11 Graph of Mahalanobis distances and chi-squares to verify
multivariate normality for structural equation modeling analyses…....
158
159
160
1
CHAPTER I
INTRODUCTION
The Simple View of Reading (SVR; Gough & Tunmer, 1986; Hoover & Gough, 1990)
proposes that reading comprehension is the product of decoding and language
comprehension. With adequate decoding skills, a reader transforms symbols on a printed
page into spoken words. With adequate language comprehension skills, a reader connects
meaning to the words. Therefore, skilled reading comprehension is dependent on
instruction that develops accurate and automatic decoding skills and adequate language
comprehension. However, not all students will demonstrate the same instructional needs,
and valid measures are needed to inform instructional decisions based on student strengths
and weaknesses.
Hoover and Gough (1990) described reading comprehension as an equation of
R = D x L, where R is reading comprehension, D is decoding, and L is language
comprehension. The equation suggests an interaction between decoding and language
comprehension that accounts for most of the variance in reading comprehension.
Whenever either decoding or language comprehension is impaired (i.e., 0), reading
comprehension will be zero because any number times zero equals zero. Hoover and
Gough suggested that poor reading comprehension is reflected by: 1) intact decoding
skills but weak language comprehension, 2) intact language comprehension but weak
decoding skills, or 3) weaknesses in both components.
This dissertation follows the style and format of Scientific Studies of Reading.
2
Validity of the Simple View of Reading
Several studies have tested the SVR (Gough & Tunmer, 1986) hypothesis of an
interaction between two independent components. For example, Oakhill, Cain, and Bryant
(2003) documented that in the early reading development of 7- and 8-year-olds, the two
components of the SVR were indeed dissociable and necessary, as the authors could
identify poor readers with no decoding deficits and poor readers with no language
comprehension deficits. Similarly, in a longitudinal investigation, Catts, Adlof, and Ellis
Weismer (2006) identified poor readers with only decoding deficits, poor readers with
only language comprehension deficits, and poor readers with both decoding and language
comprehension deficits. Catts et al. concluded that all readers should be “…classified
according to a system derived from the simple view of reading” (p. 290), so that the most
appropriate instruction can be given.
A cross-validation of the SVR (Hoover & Gough, 1990) with typically developing
and poor readers in Grades 2, 3, 6, and 7 was conducted by Chen and Velluntino (1997).
Chen and Velluntino presented an equation that was both additive and multiplicative:
R = D + L + (D x L), because most of the variance in reading comprehension was
not accounted for by decoding and language comprehension in a multiplicative equation
alone in their study. However, Savage (2006) was unable to support an additive-plus-
product model as Chen and Velluntino suggested. In a study with older poor readers,
Savage reported that an additive equation (i.e., R = D + L) best described reading
comprehension.
Although the relative contributions of decoding and language comprehension to
reading comprehension may vary (Catts, Hogan, & Adlof, 2005), results from various
3
studies are consistent that both decoding and language comprehension are necessary for
skilled reading comprehension. For younger children, the two components can be used
dependably to identify the deficits of poor readers (Aaron, Joshi, & Williams, 1999; Catts,
Hogan, & Fey, 2003; Kendeou, Savage, & van den Broek, 2009). As Savage (2006)
noted, “The simple model may also provide a basic conceptual framework for designing
appropriate school-based early teaching and learning interventions that target both
decoding and wider linguistic comprehension skills to appropriate degrees” (p. 144). That
is, teachers can precisely determine a reader‟s needs and adjust instruction to meet those
needs if teachers have thorough knowledge of the components and effective instructional
methods (Brady & Moats, 1997). Additionally, valid content measures (i.e., screenings,
tests, progress monitors) are essential to informed instructional decisions (Cutting &
Scarborough, 2006; Good & Kiminski, 1996).
Models for Identifying Students with Reading Deficits
Early identification and intervention of reading deficits are critical to the prevention of
reading failure (Lyon, 1996; McCardle, Scarborough, & Catts, 2001; Snow, Burns, &
Griffin, 1998). Students who experience difficulties in reading in the early grades
continue to be poor readers in later grades (Lyon, 1996). Lyon noted that “longitudinal
studies have shown that, of those children who are reading disabled in third grade,
approximately 74% continue to read significantly below grade level in the ninth grade” (p.
64). Juel (1988) reported that the probability of students who were good readers in Grade
1 remaining good readers in Grade 4 was .87, but conversely, the probability of students
who were poor readers in Grade 1 remaining poor readers in Grade 4 was .88. The
4
Individuals with Disabilities Education Improvement Act (IDEIA; 2004) offered two
models for the identification of students at risk for reading failure: the discrepancy model
and the Response to Intervention (RTI) model.
The Discrepancy Model
The Education for All Handicapped Children Act of 1975 (Public Law 94-142) included
the description of difficulties in learning that were not primarily the result of other
handicapping conditions, such as sensory impairment, injury, or mental retardation.
Consequently, a student with learning disabilities (LD) was identified by a discrepancy
between expected achievement and actual achievement or “unexpected
underachievement” (Aaron & Joshi, 2009). Until recently (Individuals with Disabilities
Education Improvement Act [IDEIA], 2004), the prevailing identification of LD had used
test scores and cut-points to document that a student‟s achievement was not
commensurate with his or her cognitive abilities (i.e., the discrepancy model or IQ
discrepancy).
However, identification of LD based on test scores and cut-points disregards 1)
the dimensional nature of LD, that is, abilities and disabilities are on a continuum and are
not all or none (Aaron, 1997; Francis, Fletcher, Stuebing et al., 2005), and 2) the
measurement error of the assessment instruments that are used (Fletcher, Denton, &
Francis, 2005; Francis, Fletcher, Stuebing et al., 2005). This means that a student could be
denied eligibility for special education services because his or her scores do not meet the
cut-point due to either a lack of severity of the disability or measurement error.
Additionally, the assessment of LD is often only one measure in time (Francis, Fletcher,
5
Stuebing et al., 2005). There can be fluctuations in student performance over time,
Francis, Fletcher, Stuebing et al. contended, just as there are fluctuations in blood pressure
over time due to a variety of factors. A one-time measure of student performance may not
present a valid profile of the student‟s abilities or achievement. Finally, efficacious
intervention is often postponed until a student‟s achievement is discrepant, and the
student, most likely, has experienced reading failure (Aaron, 1997); hence, the
discrepancy model has been labeled the “wait-to-fail” model (Fuchs & Fuchs, 2006).
The Response to Intervention Model
Response to Intervention (RTI) was introduced as an alternative to the discrepancy model
(IDEIA, 2004). The RTI model, proposed to ameliorate problems with the discrepancy
model, has two purposes: 1) improvement of student reading achievement, and 2)
identification of students with LD (Fletcher & Vaughn, 2009). In an RTI model,
appropriate intervention begins in the general education classroom as soon as difficulty in
acquiring any requisite reading skill (e.g., phonemic awareness, word recognition,
fluency, text comprehension) is detected. There is no need for a diagnosis of LD or an
official educational plan.
RTI uses universal literacy screenings to identify students who may be at risk for
reading failure. Students identified as at risk are given intense intervention with
continuous progress monitoring, which provides an historic record of student performance
over time (Francis, Fletcher, Stuebing et al., 2005). Instruction is adjusted or discontinued
as needed (Good & Kiminski, 1996). Only students who do not respond to the
intervention are referred for further evaluation (Fuchs & Fuchs, 2006).
6
The RTI model characterizes unexpected underachievement as a response to
intervention that is consistently poorer than would be expected from a reference group of
students (Fletcher, Denton et al., 2005; Fletcher, Francis, Morris, & Lyon, 2005).
However, a criticism of the RTI model is that if a student‟s unexpected underachievement
is determined in comparison to the relative progress of his or her reference group, then the
student‟s disability is dependent upon the cognitive abilities of the reference group
(Reynolds & Shaywitz, 2009). Hence, the unexpected underachievement is not an intra-
individual difference.
Recently, a longitudinal study empirically documented that there is unexpected
underachievement in readers with LD (Ferrer, Shaywitz, Holahan, Marchione, &
Shaywitz, 2009). In the study, students who as kindergarteners were assessed as at risk
and continued to struggle with reading into adulthood showed continuing growth in IQ,
although reading achievement was not commensurate with IQ development as would be
expected. Without a measure of an intra-individual unexpected underachievement, a
student may not receive the most appropriate instruction (Kavale, 2005; Kavale,
Kauffman, Bachmeier, & LeFevers, 2008).
However, many frequently used screenings and progress monitors for measuring
the early literacy skills of second-grade students (e.g., Dynamic Indicators of Basic Early
Literacy Skills [DIBELS], Good & Kiminski, 2002; Texas Primary Reading Inventory
[TPRI], University of Texas System & Texas Education Agency, 2006) do not provide
subtests that would enable the identification of an intra-individual unexpected
underachievement. Using either DIBELS or TPRI, for example, teachers can identify
students who have difficulties with decoding and reading comprehension. However, there
7
is no way to differentiate difficulties with reading comprehension that are the result of
decoding deficits only or the result of decoding and language comprehension deficits. For
example, if a student does poorly on both the decoding and reading comprehension
measures (i.e., orally reading a passage and retelling the passage or answering questions
about the passage), is the student‟s poor reading comprehension the result of poor
decoding, or in addition to poor decoding, is there also a language comprehension deficit?
The addition of parallel listening and reading comprehension screening measures
to frequently used early literacy screenings would aid more definitive differentiation of
student needs. The contrast of listening and reading comprehension could identify
unexpected underachievement by distinguishing poor reading comprehension caused
primarily by decoding and poor reading comprehension caused by language
comprehension deficits. The distinction would better inform instructional decisions to
improve reading comprehension.
The Statement of the Problem
In a recent study of children ages 4 and 6 in the US and Canada, Kendeou, Savage, et al.
stated that their findings “…provide important support for the generality and validity of
the SVR framework as a model of reading” (2009, p. 365). Other studies (e.g., Catts et al.,
2006; Chen & Velluntino, 1997; Oakhill et al., 2003) have documented that both decoding
and language comprehension are necessary for skilled reading comprehension. Early
literacy screenings and progress monitors are readily available to assess decoding skills,
beginning with phonological and phonemic awareness (e.g., DIBELS, TPRI).

8
Language comprehension as measured through listening comprehension is highly
correlated to reading comprehension (Joshi et al., 1998) and is a better predictor of
reading comprehension than IQ (Stanovich, 1991a). However, commonly used early
literacy screenings for second-grade students do not include assessments of listening
comprehension that could better differentiate student needs and inform instructional
decisions. In sum, it is difficult to assess students with listening comprehension deficits
that will adversely affect reading comprehension or to identify students who have intact
listening comprehension and poor decoding skills.
The Purpose of the Present Study
The purpose of the present study was to report the development and validation of parallel
group-administered listening comprehension and reading comprehension screening
measures that focus on inferential questioning for end-of-second-grade students.
Differences in student performance on the two measures should identify students with
deficits in decoding, listening comprehension, or both decoding and listening
comprehension, so appropriate instruction can be planned. The present study was
designed to answer the following questions:
1) What is the technical adequacy of parallel group-administered listening and
reading comprehension screening measures that general classroom teachers
can use to inform instructional decisions for end-of-second-grade students?
2) Can the listening and reading comprehension screening measures be
differentiated from the Gates-MacGinitie Reading Tests as a definitive
assessment of reading comprehension for classroom use?
9
The Organization of the Present Study
Chapter II is a manuscript that details the development of the listening and reading
comprehension screening measures and presents data used to refine and validate the
measures. Chapter III is a second manuscript that presents data used to investigate the
discriminant validity of the screening measures. Chapter IV presents discussion and
conclusions. An extended literature review that includes 1) the empirical evidence for the
SVR (Gough & Tunmer, 1986) and the use of SVR to identify different kinds of poor
readers, 2) the components of reading comprehension, and 3) standardized assessments of
reading comprehension is found in Appendix A. Additional methodology and results are
found in the Appendix B.
The Significance of the Present Study
In her presidential address at the 12th annual meeting of the Society of the Scientific Study
of Reading in Toronto, Williams urged researchers to be diligent about “decomposing the
constructs of comprehension and evaluating the potential benefits of isolating some
specific components for assessment” (2006, p. 139). Williams concluded that the act of
decomposing the constructs of comprehension would not only aid development of new
assessments, but would guide effective instructional practices.
Gough and Tunmer (1986) and Hoover and Gough (1990) decomposed the
constructs of reading comprehension and contended that literacy is the contrast between
listening comprehension and reading comprehension, because the limit on reading
comprehension is the limit on listening comprehension; that is, any increase in listening
comprehension is an automatic increase in reading comprehension, assuming the reader
10
can decode the words (Hoover & Gough, 1990). The development of listening and
reading comprehension screening measures would assist teachers and schools in
identifying the cause(s) of students‟ poor comprehension.
Chall (1983) emphasized that basic literacy skills need to be in place by the end of
third grade to insure successful transition from the “learning-to-read” stages to the
“reading-to-learn” stages of reading development. When teachers and schools have
definitive student profiles at the end of second grade, the most appropriate instruction can
be designed for the beginning of third grade for students who are experiencing difficulties
in reading: These students then will not fall behind in reading or any subject that requires
reading.
11
CHAPTER II
THE DEVELOPMENT AND VALIDATION OF LISTENING AND READING
COMPREHENSION SCREENING MEASURES TO INFORM
INSTRUCTIONAL DECISIONS
The Simple View of Reading (SVR; Gough & Tunmer, 1986; Hoover & Gough, 1990) is a
parsimonious conceptual framework for understanding the components required for
comprehending written language (Chen & Velluntino, 1997; Savage, 2006). According to
the SVR model, reading comprehension is the product of decoding and linguistic (i.e.,
language) comprehension. Without the ability to decode symbols accurately and quickly,
a reader‟s understanding may be adversely affected by incorrect word identification or by
limited availability of cognitive resources for accessing and processing meaning (e.g.,
LaBerge & Samuels, 1974; Paris, Carpenter, Paris, & Hamilton, 2005; Perfetti, 1985).
Conversely, without facility in understanding and integrating myriad levels of spoken
language, a reader receives little reward for his or her decoding efforts (e.g., Cain &
Oakhill, 2007; Nathan & Stanovich, 1991; Nation, 2005). Hence, efficiency in both
decoding and language comprehension is necessary for skilled reading comprehension
(Gough & Tunmer, 1886; Hoover & Gough, 1990).
The Simple View of Reading
The SVR model was formulated by Gough and Tunmer (1986) and validated by Hoover
and Gough (1990) in a study of bilingual readers in Grades 1-4. Hoover and Gough
12
described reading comprehension as an equation of R = D x L, where R is reading
comprehension, D is decoding, and L is language comprehension. Decoding
and language comprehension are independent components. Both components
are necessary but not sufficient alone. The equation suggests an interaction between
decoding and language comprehension that accounts for most of the variance in reading
comprehension. Whenever either decoding or language comprehension is impaired (i.e.,
0), reading comprehension will be zero, because any number times zero equals zero.
The simplicity of the SVR model (Gough & Tunmer, 1986; Hoover & Gough,
1990) may unintentionally obfuscate the complexity of the components needed for skilled
reading comprehension. Numerous underlying processes constitute each component that
is, in turn, subject to countless influences. But as Molé noted, “…we have learned that
better theories tend to be no more complicated than necessary to explain the world around
us, in all its wondrous complexity” (2003, p. 47).
Gough and Tunmer (1986) and Hoover and Gough (1990) did not presume that
reading is not a highly complicated task. Rather, the authors suggested that a difficulty
with reading comprehension involves one or both components. Namely, poor reading
comprehension reflects one of three profiles: 1) adequate decoding skills but weak
language comprehension, 2) adequate language comprehension but weak decoding skills,
or 3) weak decoding skills and language comprehension (Gough & Tunmer, 1986;
Hoover & Gough, 1990). If teachers have thorough knowledge of the components and
effective instructional methods, teachers can determine a reader‟s needs and adjust
instruction to meet those needs (Brady & Moats, 1997).
13
Assessing Reading Comprehension
Assessing reading comprehension is challenging, because reading comprehension is
comprised of two components (Gough & Tunmer, 1986; Oakhill, Cain, & Bryant, 2003),
each of which is an amalgamation of diverse underlying processes, and each of which can
be influenced by multiple variables (e.g., interest, motivation, self-efficacy; Snow, 2002).
Thoughtful consideration is needed to determine potential barriers to skilled reading
comprehension. A second challenge is that many reading comprehension tests do not
include assessment of language comprehension, measure the same competencies (Cutting
& Scarborough, 2006; Nation & Snowling, 1997), or even measure reading
comprehension (Keenan & Betjemann, 2006). As Keenan and Betjemann suggested:
It is important to know exactly what a test is measuring, because these tests are
used both to identify specific deficits in a child‟s skills and to tailor remediation
efforts. Thus, it is important to know whether content validity is a problem in the
reading comprehension tests that are being used for diagnosis. (p. 364)
Assessing Decoding
Decoding can be defined as transforming symbols on a printed page into their spoken
equivalents through sounding out or instant recognition (Ehri, 2005). As suggested by the
SVR (Gough & Tunmer, 1986), difficulties with decoding can adversely affect
comprehension. Difficulties in decoding could include 1) inability to detect individual
speech sounds or phonemes in spoken words (i.e., phonological processing, phonemic
awareness; Liberman, Shankweiler, & Liberman, 1989; National Institute of Child Health
and Human Development [NICHD], 2000), 2) inability to connect sounds to letters
14
accurately (NICHD, 2000), 3) inability to recognize words held in memory quickly (Ehri,
2005; Wolf, Bowers, & Greig, 1999), and 4) inability to read grade-level connected text at
a rate that maintains attention and facilitates the processing of meaning (i.e., fluency;
LaBerge & Samuels, 1974; Perfetti,1985).
Because poor decoding can adversely affect reading comprehension, it is
important to assess whether poor decoding is interfering with reading comprehension.
For example, if a reader with poor comprehension is unable to read connected text
commensurate with his or her grade-level peers (i.e., measured as words correct per
minute), it is then necessary to measure lower-level decoding skills, such as word
recognition or phonemic awareness. In this case, decoding skills could be contributing to
poor comprehension. On the other hand, if a reader with poor reading comprehension is
able to read connected text at a rate commensurate with or above his or her grade-level
peers, poor decoding skills as a hindrance to skilled reading comprehension can be
eliminated.
Assessing Language Comprehension
As suggested by the SVR (Gough & Tunmer, 1986), poor reading comprehension can
arise from difficulties with language comprehension as measured through listening
comprehension. Hoover and Gough (1990) contended that a major distinction between
listening comprehension and reading comprehension is that information for reading
comprehension is obtained through graphic representations of spoken words. Studies
correlating listening comprehension with reading comprehension have documented
correlation coefficients that ranged from .45 to .82 (cf. Joshi, Williams, & Wood, 1998).
15
Stanovich (1991b) suggested that listening comprehension is a better measure of reading
comprehension than IQ.
If listening comprehension is compared to reading comprehension and listening
comprehension is greater, then poor reading comprehension may be the result of poor
decoding skills. This profile often manifests “unexpected underachievement” and could
be indicative of dyslexia (Lyon, Shaywitz, & Shaywitz, 2003). Conversely, students with
hyperlexia (Healy, 1982; Healy, Abram, Horwitz, & Kessler, 1982) may demonstrate poor
language and reading comprehension and intact decoding skills. Yuill and Oakhill (1991)
reported that 10% of 7- to 11-year-olds in the UK had adequate decoding skills but
specific reading comprehension deficits. However, “garden-variety” poor readers (Gough
& Tunmer, 1986) or students with language learning disabilities (Catts, Hogan, & Fey,
2003) would have poor language and reading comprehension and poor decoding skills.
Lastly, students with good reading comprehension but poor listening comprehension may
have attention issues (Aaron, Joshi, & Phipps, 2004).
Of course, identifying poor language comprehension is only a starting point. A
difficulty with language comprehension may stem from multiple causes, such as
inadequate vocabulary, insufficient prior or background knowledge, inability to integrate
information, poor working memory, lack of sensitivity to causal structures, or inability to
identify semantic relationships (Kendeou, Savage, & van den Broek, 2009; Nation, 2005;
Yuill & Oakhill, 1991). Oakhill (1984) and Cain and Oakhill (1999) noted that when text
was available, readers with poor comprehension were comparable to their peers with good
comprehension in answering literal questions (i.e., answers are explicitly stated in the
text), but readers with poor comprehension had greater difficulty with inferential
16
questions (i.e., answers are not explicitly stated in the text) than their peers regardless of
the availability of the text. Yuill and Oakhill (1991) reported that the ability to make
inferences best differentiated students with good or poor comprehension at all ages. The
ability to make inferences is developmental. Ackerman and McGraw (1991) noted that
second-graders make different kinds of inferences but not necessarily fewer inferences
than older students.
Standardized Comprehension Tests
Standardized reading comprehension tests can be useful in identifying students with poor
comprehension; however, some reading comprehension tests may not actually assess
reading comprehension. For example, Keenan and Betjemann (2006) reported that
students could do well on the Gray Oral Reading Test-Third and Fourth Editions (GORT-
3 and -4; Wiederholt & Bryant, 1992, 2001) without reading the passages.
Several commonly used standardized reading comprehension tests do not assess
the same competencies (Cutting & Scarborough, 2006; Keenan, Betjemann, & Olson,
2009; Nation & Snowling, 1997). For example, Cutting and Scarborough found that the
variance accounted for by decoding and oral language on the GORT-3 (Wiederholt &
Bryant, 1992), the Gates-MacGinitie Reading Tests-Revised (G-M; MacGinitie,
MacGinitie, Maria, Dreyer, & Hughes, 2006), and the Wechsler Individual Achievement
Test (WIAT; Wechsler, 1992) were quite different. Skills and abilities related to language
comprehension accounted for less of the variance on the WIAT than on the other tests.
Nation and Snowling (1997) compared the results of two tests commonly used in
the UK – The Suffolk Reading Scale (Hagley, 1987) and The Neale Analysis of Reading
17
Ability (Neale, 1989) – and found that the formats of the reading comprehension tests
influenced student performance. The cloze-procedure format of the former test was more
dependent on decoding, whereas the passage-reading/question-answering format of the
latter test was more dependent on language comprehension. Francis, Fletcher, Catts, and
Tomblin (2005) confirmed the strong decoding relationship with the cloze-procedure
format.
Tests that specifically assess listening comprehension are usually administered
individually and often require specialized training or user qualifications. For example, the
Woodcock-Johnson III Diagnostic Reading Battery (WJ-III DRB; Woodcock, Mather, &
Shrank, 2006) is administered individually and has a subtest for listening comprehension
that is separate from the subtest for passage (i.e., reading) comprehension. However, to
purchase the WJ-III DRB, the user must meet and document appropriate qualifications
(Riverside Publishing, 2006).
Cain and Oakhill suggested, “…it would be prudent to assess both reading and
listening comprehension wherever possible, particularly when reading assessment is
conducted for diagnostic and remediation purposes” (2006, p. 700). Because standard
reading comprehension tests may not even measure comprehension, and listening
comprehension tests are often not available to classroom teachers, a group-administered
listening comprehension screening (LCS) and a group-administered reading
comprehension screening (RCS) were developed to assist teachers in determining
students‟ decoding and language comprehension needs. The contrast between student
performance on the LCS and the RCS will inform instructional decisions. Presumably, if
decoding and language comprehension are intact, a reader should perform well on both
18
screening measures. If a reader performs well on the LCS and not on the RCS, the reader
has intact language comprehension but may have difficulties in decoding. A reader who
performs poorly on both measures may have difficulties with decoding and language
comprehension. A comparison of the reader‟s decoding skills on another decoding
measure would clarify whether the reader‟s difficulties are the result of poor language
comprehension or both poor decoding and language comprehension. End of second grade
was targeted, because it is important to know which students may need additional
instruction to be ready to move to the “reading-to-learn” stages of reading development,
which begin at the end of third grade (Chall, 1983).
The Purpose of the Present Study
The purpose of the present study was to discuss the development of the LCS and RCS and
present data from two pilot studies and one large-scale administration of the LCS and
RCS that were conducted to refine and validate the measures. The first pilot study was
carried out in two second-grade classrooms (n = 41). The goal of the first pilot study was
twofold: 1) to determine if any items were too easy or too difficult and 2) to determine the
time required to administer each screening measure. A second pilot study involved 12
second-grade students with varying reading levels. The goal of this pilot study was to
determine if the participants‟ performance on the screening measures matched their
reading levels. The goals of the large-scale administration with 699 second-grade students
were 1) to identify the most apposite and discriminating items on the preliminary
screening measures, so shorter versions of the comprehension screening measures could
be constructed and 2) to validate the screening measures.
19
Method
Participants
In the first pilot study, the preliminary comprehension screening measures were
administered in two general education second-grade classrooms in a large urban school
district. Thirty-eight participants were Hispanic and three participants were Black/African
American. The second pilot study involved 12 White/European American participants
from one second-grade general education classroom.
The participants in the large-scale administration of the LCS and RCS were 699
end-of-second-grade students from 42 classrooms in nine schools in the southwestern
region of the US. Approximately 900 participants were recruited. Only participants for
whom parental permission was obtained were included in the study. The final sample was
overly representative of at-risk students and was 36.2% White/European American,
35.9% Hispanic, 20.6% Black/African American, and 7.3% Asian American or belonging
to other racial and ethnic groups. The present sample included 337 girls and 356 boys,
with 6 participants unidentified. The age of the participants ranged from 6.8 to 10.5 years
(M = 8.3, SD = .46). Sixty-one percent of the participants were eligible for free or
reduced-price meal programs.
Measures
The preliminary LCS and RCS. The preliminary LCS and RCS each contained
75 multiple-choice items. Each item had a stem consisting of a sentence, a group of
sentences, or a short passage followed by one keyed response and three foils. A content-
by-process table of specifications was created before the development of the screening
20
measures. The items were written by the author of the present study, using the table of
specifications and with assistance from two master reading specialists.
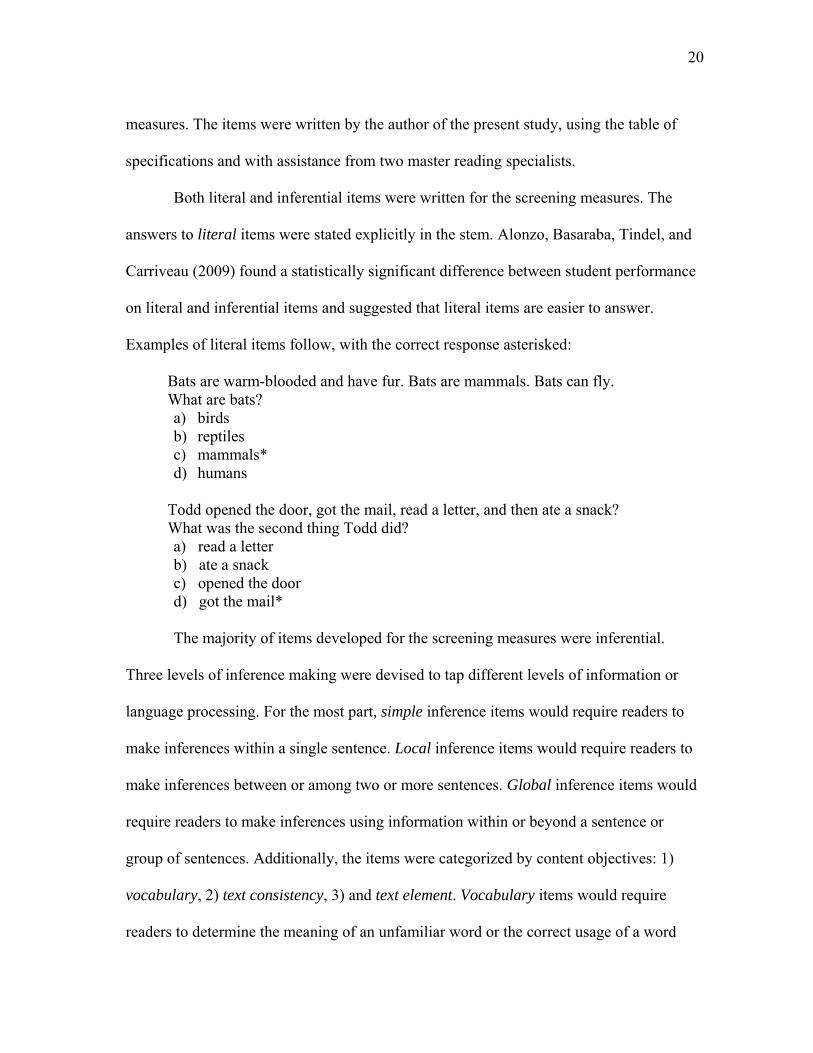
Both literal and inferential items were written for the screening measures. The
answers to literal items were stated explicitly in the stem. Alonzo, Basaraba, Tindel, and
Carriveau (2009) found a statistically significant difference between student performance
on literal and inferential items and suggested that literal items are easier to answer.
Examples of literal items follow, with the correct response asterisked:
Bats are warm-blooded and have fur. Bats are mammals. Bats can fly. What are bats? a) birds b) reptiles c) mammals* d) humans
Todd opened the door, got the mail, read a letter, and then ate a snack? What was the second thing Todd did? a) read a letter b) ate a snack c) opened the door d) got the mail*
The majority of items developed for the screening measures were inferential.
Three levels of inference making were devised to tap different levels of information or
language processing. For the most part, simple inference items would require readers to
make inferences within a single sentence. Local inference items would require readers to
make inferences between or among two or more sentences. Global inference items would
require readers to make inferences using information within or beyond a sentence or
group of sentences. Additionally, the items were categorized by content objectives: 1)
vocabulary, 2) text consistency, 3) and text element. Vocabulary items would require
readers to determine the meaning of an unfamiliar word or the correct usage of a word
21
with multiple meanings (Cain & Oakhill, 2007; Ouellette, 2006). Text consistency items
would require readers to detect inconsistencies or to maintain consistency when anaphoric
pronouns or interclausal connectors were present (Cain & Oakhill, 2007). Text element
items would require readers to demonstrate understanding of a sequence of events, the
main idea, or causal relationships (Cain & Oakhill, 2007). Examples of items written for
the screening measures follow, with the correct response asterisked:
Simple/Text Consistency Marta baked a cake, and she gave a piece to Maria, Kelly, and Sally. Who cut the cake? a) Maria b) Sally c) Marta* d) Kelly
Local/Text Element The hummingbird is a small bird. The hummingbird can flap its wings 90 times in one minute. A hummingbird can live 5 years. The best title is: a) The Tiny Flapper* b) The Old Digger c) The Hungry Eater d) The Joyful Singer
Global/Vocabulary What is the meaning of predators in this sentence? The squid squirts ink to keep it safe from predators. a) friends b) survivors c) buddies d) enemies*
During the writing of the items, grade-level vocabulary lists and basal series were
consulted to determine appropriate vocabulary words and topics. Decoding skills were
limited to skills, concepts, and sight words that were appropriate for end-of-second-grade
readers. A panel of master reading specialists who had experience with both teaching
second-grade students and explicit, systematic reading instruction reviewed 182 possible
22
items for: 1) accuracy of content, 2) grammar, 3) adherence to the table of specifications,
4) grade-level appropriateness of content, vocabulary, and decoding skills, 5) item-
construction flaws (e.g., nonrandom positioning of keyed responses, verb tenses or
articles that provide clues, more than one plausible answer), and 6) offensiveness or bias
(Crocker & Algina, 2008). The panel suggested the elimination of 32 items and revision
of 20 items.
Two master reading specialists further evaluated and eliminated items. Then the
specialists confirmed the literal items and categorized inferential items by level of
inference making. The items were distributed randomly between the two preliminary
screening measures, maintaining similar balances of item types and content objectives on
the two measures. Ultimately, each preliminary version of the screening measure
contained 75 items; 55 items on each measure were unique but similar to items on the
other measure; 20 items on the two measures were common. On each measure, there were
8 literal items, 17 simple inference items, 25 local inference items, and 25 global
inference items. There was an equal number (25) of content-objective items on each
measure.
Additional assessments. The LCS and RCS were developed as group-
administered screenings. Group-administered assessments are more economical in terms
of time and ecological in terms of how reading comprehension is usually measured. The
participants completed five group-administered reading-related assessments in addition to
the LCS and RCS for use in establishing the validity of the LCS and RCS.
Gates-MacGinitie Reading Tests, Level 2. The G-M (MacGinitie et al., 2006)
consisted of three subtests – decoding, (G-M D), vocabulary (G-M V), and reading
23
comprehension (G-M RC). For the decoding subtest, participants viewed a picture and
chose the one word from four orthographically similar words that matched the picture
(e.g., a picture showed a girl wearing a hooded jacket; the choices were hoed, hood, heed,
hoard). For the vocabulary subtest, participants viewed a picture and chose the one word
from four choices that matched the meaning implied by the picture. For the reading
comprehension subtest, participants read a sentence or short passage and chose the one
picture from three choices that matched the meaning of the sentence or passage. The score
reliability on the decoding, vocabulary, and reading comprehension subtests for the
present sample were estimated to be, respectively, .92, .92, and .87 (Cronbach‟s alpha).
An alternate form of the G-M reading comprehension subtest (MacGinitie et al.,
2006) was used as a listening comprehension test. Participants listened to passages that
were read aloud and responded as described above; however, the text was deleted and
only the pictures were available for the participants to view. The score reliability on the
G-M listening comprehension (G-M LC) for the present sample was estimated to be .78
(Cronbach‟s alpha).
Test of Silent Word Reading Fluency (TOSWRF). The TOSWRF (Mather,
Hammill, Allen, & Roberts, 2004) measured participants‟ recognition of printed words.
On the TOSWRF, words of increasing difficulty were arranged in rows with no spaces
between the words. Participants had 3 minutes to draw slashes between as many words as
possible. Because the data on the TOSWRF were not dichotomous, Kuder-Richardson
Formula 21 was used to estimate score reliability for the present sample (r = .90).
24
Design
Pilot administrations of the preliminary screening measures. The preliminary
versions of the LCS and RCS were administered in two small pilot studies in mid-to-late
March. In the first pilot study, the LCS was administered in one classroom (n = 20). The
examiner orally read item stems and choices to the participants. The participants could
view only the choices in their test booklets. At the same time, another examiner
administered the RCS in a second classroom (n = 21). Participants silently read the stems
and the choices on the RCS. The examiner recorded the completion time of each
participant as he or she completed the RCS.
In the second pilot study, the classroom teacher selected four participants who
were reading above grade level, four participants who were reading at grade level, and
four participants who were reading below grade level. The classroom teacher based the
selection of participants on reading achievement data and current performance. The
participants completed the LCS as described above in one morning session, and
completed the RCS as described above in a second session the following morning.
Large-scale administration of the preliminary LCS and RCS. In the large-
scale administration, participants completed the preliminary LCS and RCS in separate
sessions from mid-April to mid-May. Three different versions of both screening measures
were developed (i.e., LCS1, LCS2, and LCS3 and RCS1, RCS2, and RCS3). Each version
of the LCS contained the same items, but the items were reordered. Likewise, each
version of the RCS contained the same items, but the items were reordered. The
reordering of items on the screening measures ensured that fatigue did not influence
performance on items that appeared toward the end of the screening measures.
25
To ensure that participants were listening on the LCS and not reading, only the
choices for a single item appeared on a page in the participants‟ LCS test booklets. For a
few items with lengthy stems, the stems were also included. The examiner orally read the
items to the participants only one time. The examiner paused 5-6 seconds after finishing
one item before reading the next item. Three items appeared on each page of the RCS test
booklets. Participants read the items silently to complete the RCS.
In each classroom, the participants completed the LCS and RCS and the additional
assessments over a three-day period during one 90-minute session each day. The
assessments were administered in one of six randomly assigned orders. The examiners
were all master reading specialists who had completed specific training on the
administration of all assessments, with particular emphasis on the administration of the
LCS and G-M LC to ensure consistent administration. On the first day of testing in the
classrooms, the examiners engaged the participants by inviting them to become
researchers to help teachers learn how to teach other second-grade students. The
examiners carefully explained all procedures. The classroom teachers assisted the
examiners and helped monitor the participants. In some classrooms, an observer was also
present. Examiners and observers reported that overall the participants were cooperative
and worked appropriately.
Results
Pilot Studies of the LCS and RCS
The goal of the first pilot study was to examine the difficulty of the items and the
administration times for the measures. Based on the pilot, items that were too easy or too
26
difficult were rewritten. Participants completed the LCS within 45 minutes. The
completion time on the RCS ranged from 12 to 55 minutes (M = 33, SD = 11.35). The
administration times from this pilot study were incorporated into the large-scale
administration.
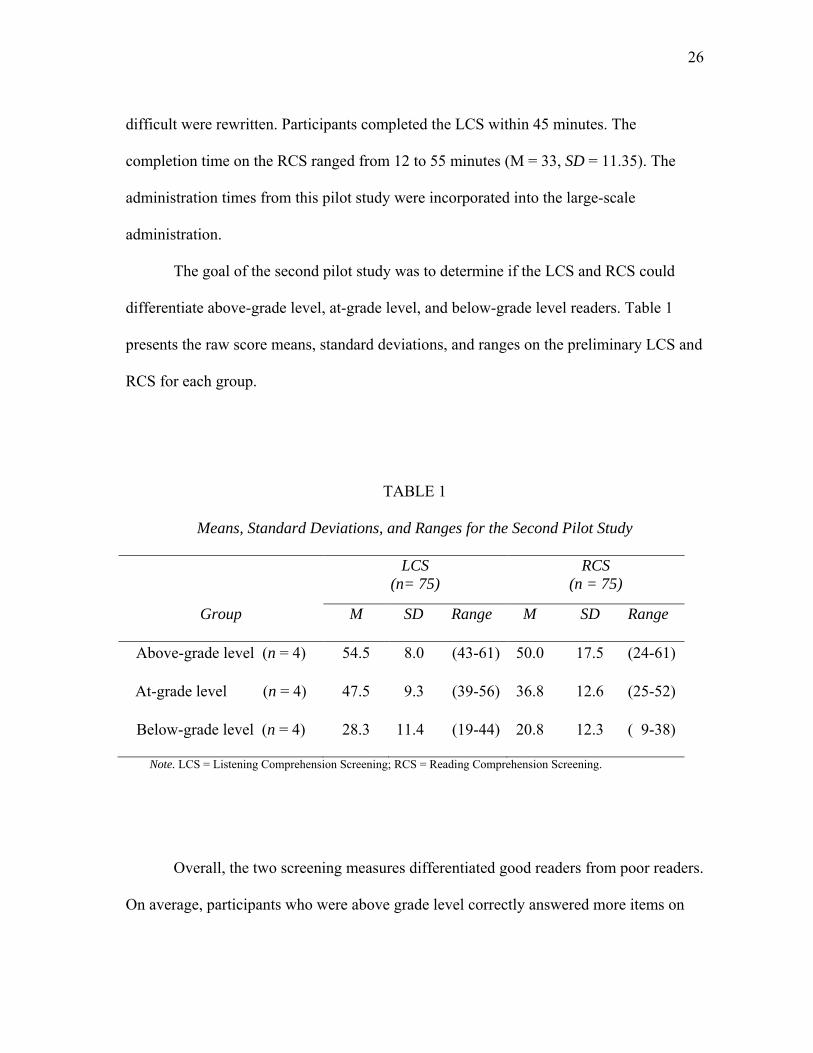
The goal of the second pilot study was to determine if the LCS and RCS could
differentiate above-grade level, at-grade level, and below-grade level readers. Table 1
presents the raw score means, standard deviations, and ranges on the preliminary LCS and
RCS for each group.
TABLE 1
Means, Standard Deviations, and Ranges for the Second Pilot Study
LCS
(n= 75)
RCS
(n = 75)
Group M SD Range M SD Range
Above-grade level (n = 4) 54.5 8.0 (43-61) 50.0 17.5 (24-61)
At-grade level (n = 4) 47.5 9.3 (39-56) 36.8 12.6 (25-52)
Below-grade level (n = 4) 28.3 11.4 (19-44) 20.8 12.3 ( 9-38)
Note. LCS = Listening Comprehension Screening; RCS = Reading Comprehension Screening.
Overall, the two screening measures differentiated good readers from poor readers.
On average, participants who were above grade level correctly answered more items on
27
both screening measures than the other two groups, and the participants who were at
grade level answered more items correctly than the participants in the below-grade level
group. Statistically significant differences were found among the groups on a MANOVA
(Wilks‟ λ = .309, F(2, 9) = 3.189; p = .042, 2 = .69).
Construction of the Final Versions of the LCS and RCS
Calibration of item responses. Item response theory (IRT) was used to calibrate
participants‟ responses on the LCS and RCS in the large-scale administration. IRT, which
is also known as latent traits theory, provides models for comparisons, independent of the
test or the examinees. IRT relies on the assumption that there is one latent trait or ability
that influences an examinee‟s response to a given item (Hambleton & Swaminathan,
1985). Predictions of an examinee‟s responses will be accurate only if there is one single
underlying trait (Hambleton & Swaminathan, 1985). Before the calibration of the items,
principal components analyses were conducted on the LCS and RCS data. Examination of
scree plots generated from the analyses confirmed that the assumption of
unidimensionality was met on the preliminary LCS and the preliminary RCS.
For the present study, both one- and two-parameter IRT logistic models were used.
A one-parameter model (1P) provides an examinee or person ability estimate (θ or theta)
and an item difficulty estimate (b value). A two-parameter model (2P) adds an item
discrimination estimate (a value).
Selection of items for the final LCS and RCS. The aim of the preliminary
versions of the LCS and the RCS was to determine the best items for identifying students
who are at risk for reading failure. The most appropriate and discriminating items needed
28
to be identified, so that shorter versions of the LCS and RCS could be constructed for
classroom use. After the calibration of the items, each item was evaluated for inclusion on
the final versions of the LCS and RCS using IRT-based criteria.
The p-values of the items on the 1P and 2P models were examined. A statistically
non-significant p-value indicates that the null hypothesis of model-data fit is not rejected.
Items with p-values > .05 were desirable because these items indicated good model fit.
Items with p-values that were >.05 on both the 1P and 2P models were most favored. The
larger p-values on both models confirmed that the model-data fit was not an artifact of the
2P model analysis.
The ability scales on the IRT models were set as z-score scales, with a mean of 0
and a standard deviation of 1.0. The majority of items considered for selection had b
values (i.e., difficulty estimates) on the 2P model between -1.0 and 0.5, with a b value of
0 being average. Items with a values (i.e., discrimination estimates) larger than 1.0
provided more discriminating information and were favored over less discriminating
items with a values less than 1.0.
Two-parameter item information curves, bell-shaped graphic representations of
items, were examined. The steepness of an item information curve is greatest when the a
value is large and item variance at each ability level is small, which means the standard
error of measurement is small (Hambleton & Swaminathan, 1985). Items with steep item
information curves were favored for selection for the final versions of the LCS and RCS.
When the a value of an item is small and item variance is large, an item information curve
resembles a straight line. Items with such information curves were given low priority in
the item selection process.
29
Finally, the overall model-data fit of an item at each ability level was examined.
Items with the best overall fit at each ability level on the 2P model were favored. All IRT-
based criteria were used to evaluate the items, but items did not need to meet all the
criteria.
Although IRT-based criteria were the primary determinants, item types were also a
consideration during the selection process. There were four types of items written for the
preliminary LCS and RCS; however, only three types were included on the final versions:
1) simple, 2) local, and 3) global. Only six literal items, the fourth item type on the
preliminary measures, survived the selection process and were subsumed as simple items
on the final versions of the LCS or RCS. The discarded literal items were not
discriminating enough to be useful.
The content objectives for the items focused on competencies readers need at the
word and sentence levels (i.e., determining the meaning of an unfamiliar word or
choosing the correct meaning of a word with multiple meanings, resolving anaphoric
pronouns and interclausal connectors) and at the discourse level (i.e., , monitoring
comprehension, understanding elements of text structure; Cain & Oakhill, 2007). The
final versions of the LCS and RCS contained mixed distributions of inference-making and
content-objective items. There were 42 items on the final versions of the LCS and RCS.
All items were unique, with no common items between the two measures.
Interpreting scores on the LCS and RCS. The scores on the final version of the
LCS and the final version of the RCS were recalibrated using the 2P IRT model. A
regression of LCS ability estimates on items correct was performed (R2 = .95). A
conversion chart with raw scores to ability estimates, standard scores based on a normal
30
distribution, Normal Curve Equivalents (NCEs), and percentiles was then created for the
LCS to aid users‟ test score interpretation. A regression of RCS ability estimates on items
correct was performed (R2 = .95), and raw scores on the RCS were converted to ability
scores, standard scores, NCEs, and percentiles.
Student scores on the two measures can determine instructional needs. For
example, if a student has a raw score of 16 on the LCS, which falls in the 22nd percentile,
and a raw score of 13 on the RCS, which fell in the 24th percentile. The low scores on
both measures would assume inadequate language comprehension. To determine if
inadequate decoding skills were also interfering with the student‟s reading
comprehension, a comparison of the student‟s decoding skills on another measure of
decoding would confirm if the student needed explicit language comprehension
instruction and decoding instruction or only explicit language comprehension instruction.
Users can also examine large differences between LCS and RCS scores to
determine instructional needs. For example, a student has a raw score of 34 on the LCS
and a raw score of 20 on the RCS. On the LCS, the student‟s raw score converts to an
NCE of 73 that fell in the 84th percentile. On the RCS, the student‟s raw score converts to
an NCE of 44 that fell in the 42nd percentile. The difference between the two scores
suggested that the student‟s language comprehension was more than adequate, but he or
she would need explicit decoding instruction to develop full proficiency in reading
comprehension. If only the RCS score of the student was examined, the student would
appear to be an average reader; however, the comparison of the scores on the RCS and the
LCS demonstrated the student‟s “unexpected underachievement.”
31
Test Score Reliability and Validity of the LCS and RCS
The trustworthiness and usefulness of a measurement instrument are linked inextricably to
test score reliability and validity. Test score reliability is the consistency with which
scores on a measurement instrument measure an underlying construct (Thompson, 2002).
Of course, for scores on an instrument to be consistent in measuring a construct, the
instrument must to some degree measure that construct, which is the notion of test score
validity. Thompson suggested, “When measurements yield scores measuring „nothing,‟
the scores are said to be „unreliable‟” (p. 4).
Score reliability. The score reliability (Cronbach‟s alpha) for the present sample
on the preliminary LCS was estimated to be .91, and on the final version of the LCS,
score reliability was estimated to be .89. The score reliability for the present sample on
the preliminary RCS was estimated to be .94 and .93 on the final version. A minimum
reliability coefficient of .80 is recommended for the scores on a measure to be considered
reliable (Gregory, 2011; Urbina, 2004); however, a reliability coefficient of .90 or greater
on a measure is greatly desirable (Aiken, 2000). The scores on both versions of the LCS
and the RCS can be considered to be reliable based on the reported coefficient alphas, all
of which exceeded the minimum .80 value. Three of the four coefficient alphas exceeded
the highly desired .90 value.
To ensure that the LCS and the RCS were not overly biased toward any
subgroups represented in the sample, reliability coefficients were estimated for different
subgroups within the present sample (Gregory, 2011; Wagner, Torgesen, & Rashotte,
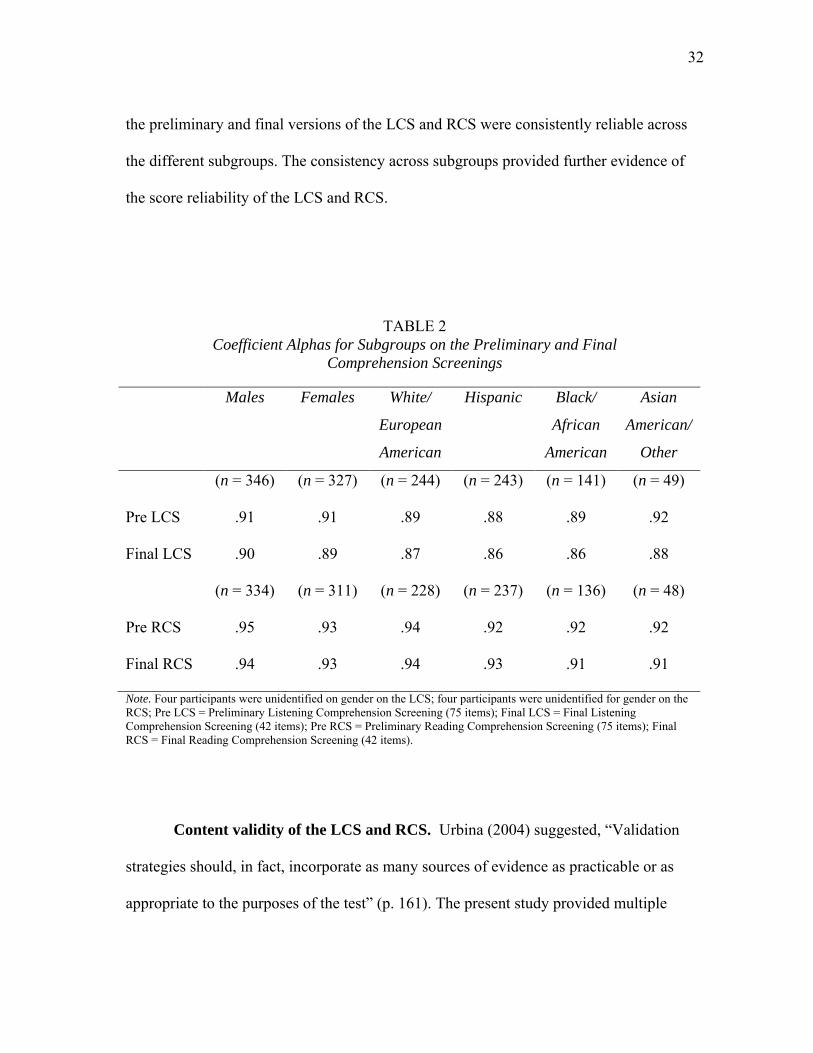
1999). Table 2 presents the reliability coefficients for different subgroups represented in
the present sample. Limited variation in the coefficient alphas suggested that the scores on
32
the preliminary and final versions of the LCS and RCS were consistently reliable across
the different subgroups. The consistency across subgroups provided further evidence of
the score reliability of the LCS and RCS.
TABLE 2
Coefficient Alphas for Subgroups on the Preliminary and Final
Comprehension Screenings
Males Females White/
European
American
Hispanic Black/
African
American
Asian
American/
Other
Pre LCS
Final LCS
(n = 346)
.91
.90
(n = 327)
.91
.89
(n = 244)
.89
.87
(n = 243)
.88
.86
(n = 141)
.89
.86
(n = 49)
.92
.88
Pre RCS
Final RCS
(n = 334)
.95
.94
(n = 311)
.93
.93
(n = 228)
.94
.94
(n = 237)
.92
.93
(n = 136)
.92
.91
(n = 48)
.92
.91
Note. Four participants were unidentified on gender on the LCS; four participants were unidentified for gender on the RCS; Pre LCS = Preliminary Listening Comprehension Screening (75 items); Final LCS = Final Listening Comprehension Screening (42 items); Pre RCS = Preliminary Reading Comprehension Screening (75 items); Final RCS = Final Reading Comprehension Screening (42 items).
Content validity of the LCS and RCS. Urbina (2004) suggested, “Validation
strategies should, in fact, incorporate as many sources of evidence as practicable or as
appropriate to the purposes of the test” (p. 161). The present study provided multiple
33
sources of evidence for different aspects of validity – specifically, content validity,
criterion-related validity, and construct validity. Content validity is the extent to which
scores on a test measure what the test is supposed to measure (Thompson, 2002). The
review of the content by experts and face validity provided evidence of content validity.
Review of content by experts. A panel of master reading specialists reviewed the
items 1) to ensure that some level of inference making was needed to answer the items
correctly and 2) to determine if the decoding skills, vocabulary level, and background
knowledge required to answer the items were appropriate for end-of-second-grade
students. Two master reading specialists then independently evaluated and categorized the
remaining items by level of inferencing and content objectives. The inter-rater reliability
for the two specialists was high (Agreement = 93%).
Face validity. Face validity, in short, is that a test that measures a particular
content looks like a test that measures that content. As Gregory (2011) stated, “From a
public relations standpoint, it is crucial that tests possess face validity – otherwise those
who take the test may be dissatisfied and doubt the value of the psychological testing” (p.
113). The LCS and RCS have the multiple-choice format frequently used in testing
comprehension.
Criterion-related validity of the LCS and RCS. Criterion-related validity
subsumes predictive and concurrent validity. Predictive validity predicts performance on
tests that measure the same constructs (Urbina, 2004). Concurrent validity concerns how
well scores on tests that measure the same constructs and that are administered at
approximately the same time correlate (Springer, 2010). To provide evidence of
concurrent validity, additional assessments of reading-related skills were administered at
34
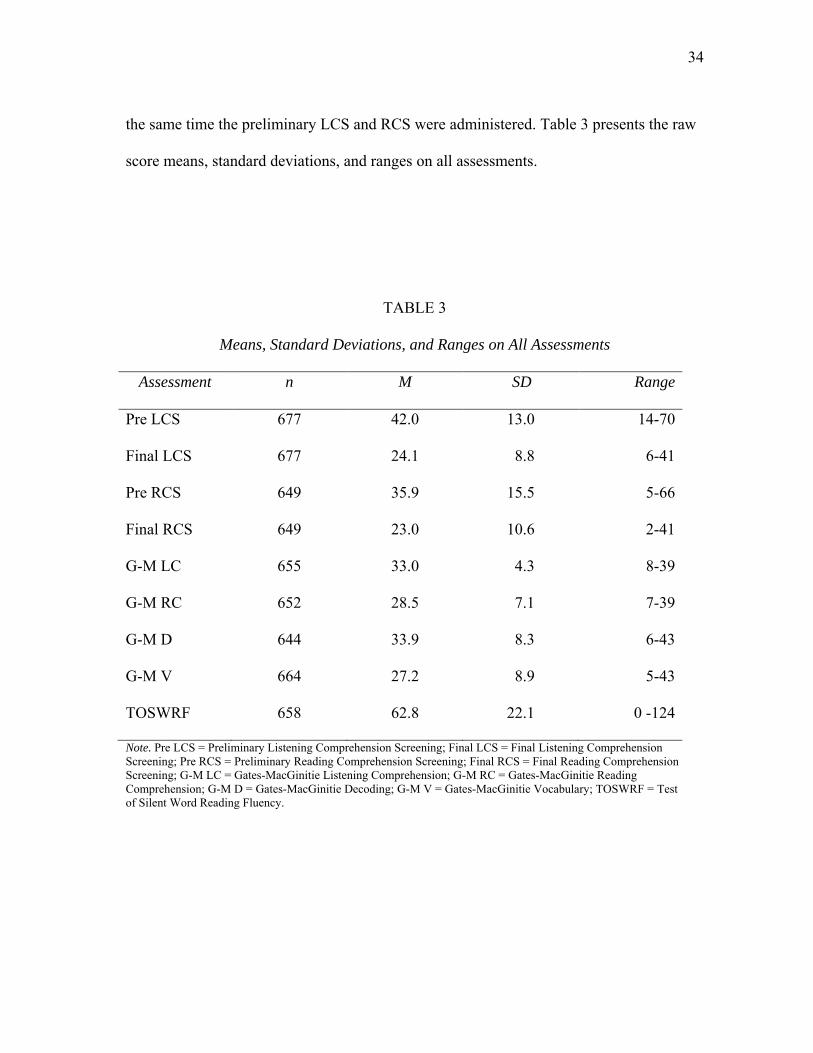
the same time the preliminary LCS and RCS were administered. Table 3 presents the raw
score means, standard deviations, and ranges on all assessments.
TABLE 3
Means, Standard Deviations, and Ranges on All Assessments
Assessment n M SD Range
Pre LCS 677 42.0 13.0 14-70
Final LCS 677 24.1 8.8 6-41
Pre RCS 649 35.9 15.5 5-66
Final RCS 649 23.0 10.6 2-41
G-M LC 655 33.0 4.3 8-39
G-M RC 652 28.5 7.1 7-39
G-M D 644 33.9 8.3 6-43
G-M V 664 27.2 8.9 5-43
TOSWRF 658 62.8 22.1 0 -124
Note. Pre LCS = Preliminary Listening Comprehension Screening; Final LCS = Final Listening Comprehension Screening; Pre RCS = Preliminary Reading Comprehension Screening; Final RCS = Final Reading Comprehension Screening; G-M LC = Gates-MacGinitie Listening Comprehension; G-M RC = Gates-MacGinitie Reading Comprehension; G-M D = Gates-MacGinitie Decoding; G-M V = Gates-MacGinitie Vocabulary; TOSWRF = Test of Silent Word Reading Fluency.
35
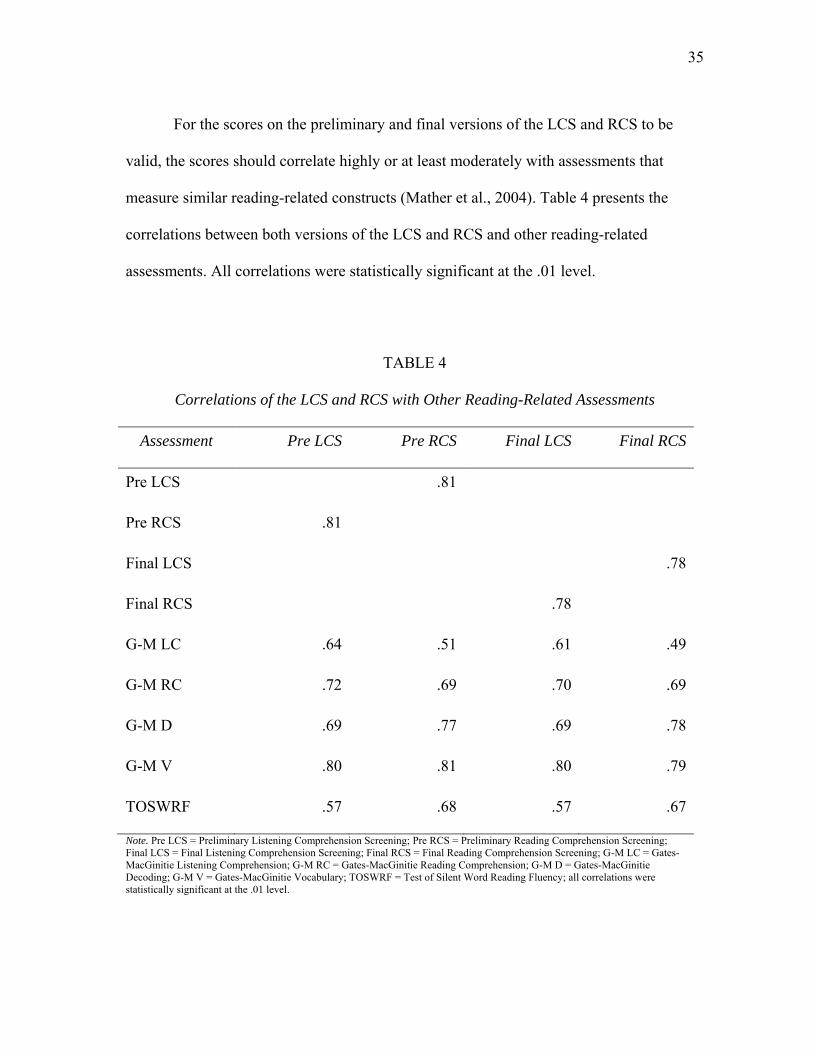
For the scores on the preliminary and final versions of the LCS and RCS to be
valid, the scores should correlate highly or at least moderately with assessments that
measure similar reading-related constructs (Mather et al., 2004). Table 4 presents the
correlations between both versions of the LCS and RCS and other reading-related
assessments. All correlations were statistically significant at the .01 level.
TABLE 4
Correlations of the LCS and RCS with Other Reading-Related Assessments
Assessment Pre LCS Pre RCS Final LCS Final RCS
Pre LCS .81
Pre RCS .81
Final LCS .78
Final RCS .78
G-M LC .64 .51 .61 .49
G-M RC .72 .69 .70 .69
G-M D .69 .77 .69 .78
G-M V .80 .81 .80 .79
TOSWRF .57 .68 .57 .67
Note. Pre LCS = Preliminary Listening Comprehension Screening; Pre RCS = Preliminary Reading Comprehension Screening; Final LCS = Final Listening Comprehension Screening; Final RCS = Final Reading Comprehension Screening; G-M LC = Gates- MacGinitie Listening Comprehension; G-M RC = Gates-MacGinitie Reading Comprehension; G-M D = Gates-MacGinitie Decoding; G-M V = Gates-MacGinitie Vocabulary; TOSWRF = Test of Silent Word Reading Fluency; all correlations were statistically significant at the .01 level.
36
Correlations of the LCS and RCS with other reading assessments ranged from .49
to .81. Correlations were high where expected and lower where expected. For example,
because the LCS and RCS were designed to measure the ability to make inferences, the
correlation coefficients with the preliminary and final versions of the LCS and RCS were
large, .81 and .78, respectively. Additionally, both versions of the LCS and RCS were
highly correlated with G-M RC, a measure of reading comprehension, and G-M V, a
measure of vocabulary. However, because reading comprehension requires decoding and
word recognition skills that listening comprehension does not, the correlation coefficients
associated with decoding and word recognition, as measured on the G-M D and
TOSWRF, were larger with the RCS than with the LCS. For the same reason, the
correlation coefficient associated with the RCS and G-M LC was smaller than the
coefficient associated with the LCS and G-M LC. The correlations provided evidence of
concurrent validity.
Prediction of at-risk readers. To investigate how well the final LCS and RCS
could predict at-risk readers, three different indices – the sensitivity index, the specificity
index, and the positive predictive value – were computed. The participants in the present
sample were categorized as “poor” readers (i.e., bottom 25%) or “good” readers (i.e., top
25%) on the LCS and RCS and three other criterion measures. The participants in the
middle 50% of each measure were categorized as “average” readers and were not
included in the computations (cf. Mather et al., 2004). All measures had normal
distributions. Three 2-by-2 frequency matrices of “poor” readers and “good” readers
(RCS x TOSWRF, RCS x G-M RC, and LCS x G-M LC) were constructed. Table 5
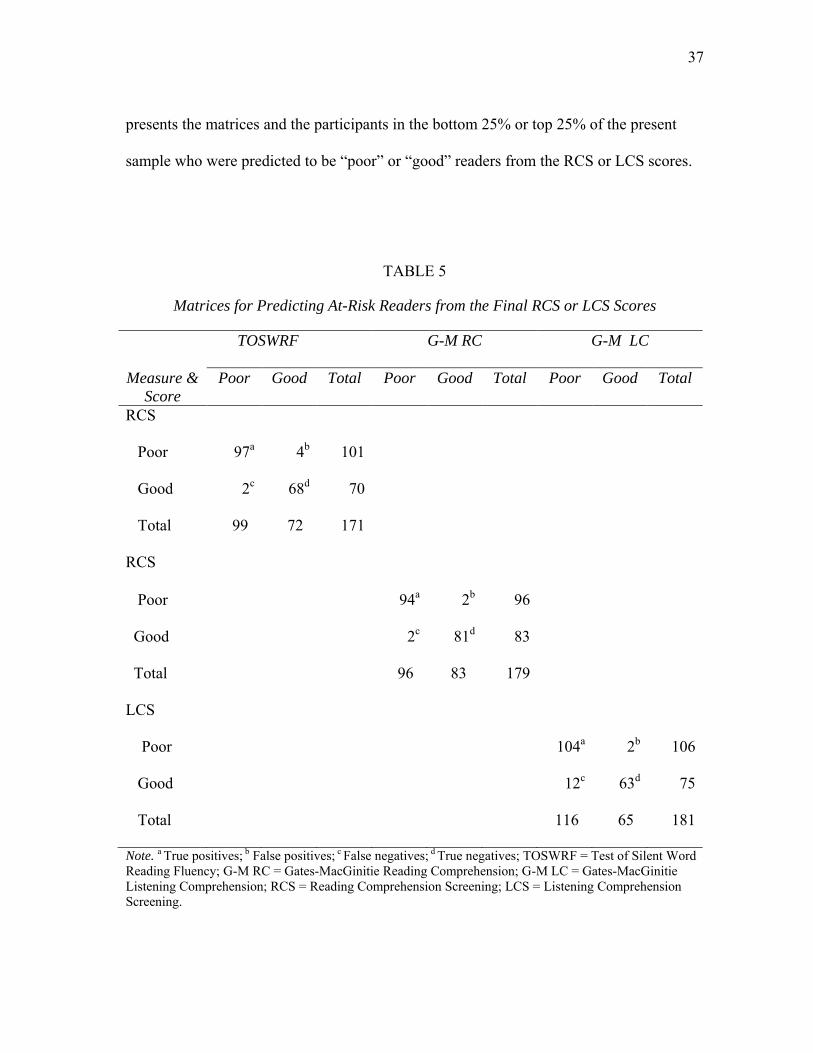
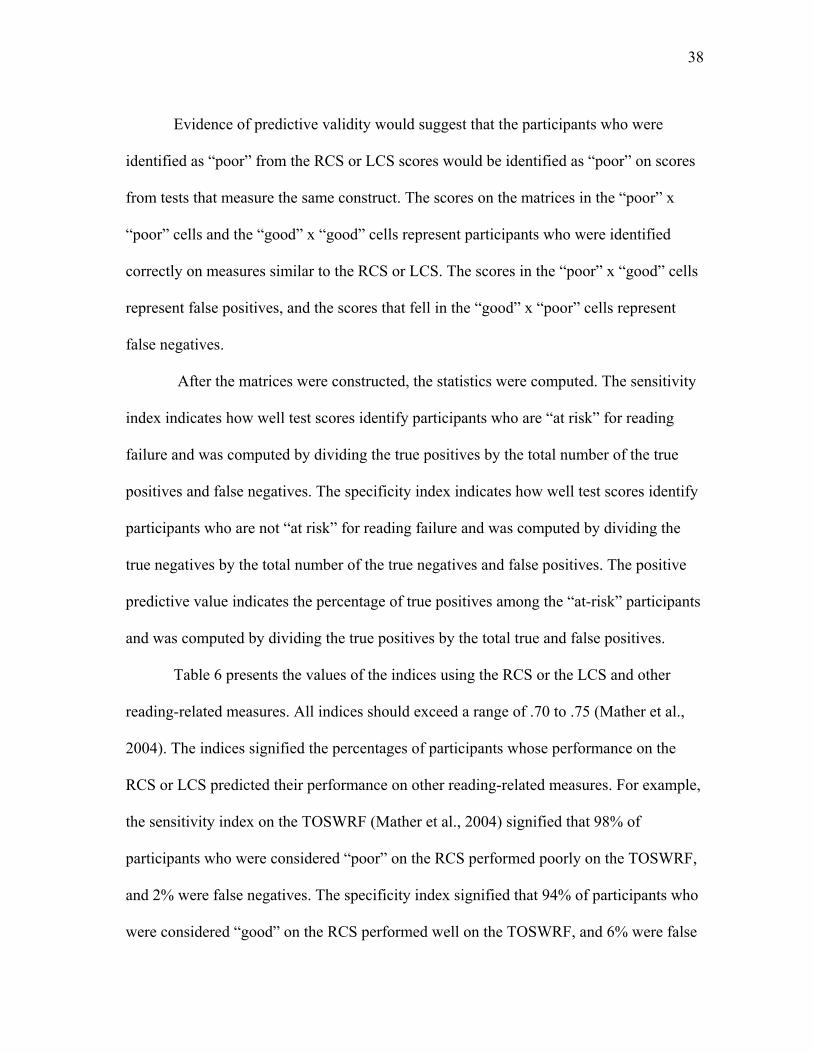
37
presents the matrices and the participants in the bottom 25% or top 25% of the present
sample who were predicted to be “poor” or “good” readers from the RCS or LCS scores.
TABLE 5
Matrices for Predicting At-Risk Readers from the Final RCS or LCS Scores
TOSWRF G-M RC G-M LC
Measure &
Score
Poor Good Total Poor Good Total Poor Good Total
RCS
Poor 97a 4b 101
Good 2c 68d 70
Total 99 72 171
RCS
Poor 94a 2b 96
Good 2c 81d 83
Total 96 83 179
LCS
Poor 104a 2b 106
Good 12c 63d 75
Total 116 65 181
Note. a True positives; b False positives; c False negatives; d True negatives; TOSWRF = Test of Silent Word Reading Fluency; G-M RC = Gates-MacGinitie Reading Comprehension; G-M LC = Gates-MacGinitie Listening Comprehension; RCS = Reading Comprehension Screening; LCS = Listening Comprehension Screening.
38
Evidence of predictive validity would suggest that the participants who were
identified as “poor” from the RCS or LCS scores would be identified as “poor” on scores
from tests that measure the same construct. The scores on the matrices in the “poor” x
“poor” cells and the “good” x “good” cells represent participants who were identified
correctly on measures similar to the RCS or LCS. The scores in the “poor” x “good” cells
represent false positives, and the scores that fell in the “good” x “poor” cells represent
false negatives.
After the matrices were constructed, the statistics were computed. The sensitivity
index indicates how well test scores identify participants who are “at risk” for reading
failure and was computed by dividing the true positives by the total number of the true
positives and false negatives. The specificity index indicates how well test scores identify
participants who are not “at risk” for reading failure and was computed by dividing the
true negatives by the total number of the true negatives and false positives. The positive
predictive value indicates the percentage of true positives among the “at-risk” participants
and was computed by dividing the true positives by the total true and false positives.
Table 6 presents the values of the indices using the RCS or the LCS and other
reading-related measures. All indices should exceed a range of .70 to .75 (Mather et al.,
2004). The indices signified the percentages of participants whose performance on the
RCS or LCS predicted their performance on other reading-related measures. For example,
the sensitivity index on the TOSWRF (Mather et al., 2004) signified that 98% of
participants who were considered “poor” on the RCS performed poorly on the TOSWRF,
and 2% were false negatives. The specificity index signified that 94% of participants who
were considered “good” on the RCS performed well on the TOSWRF, and 6% were false
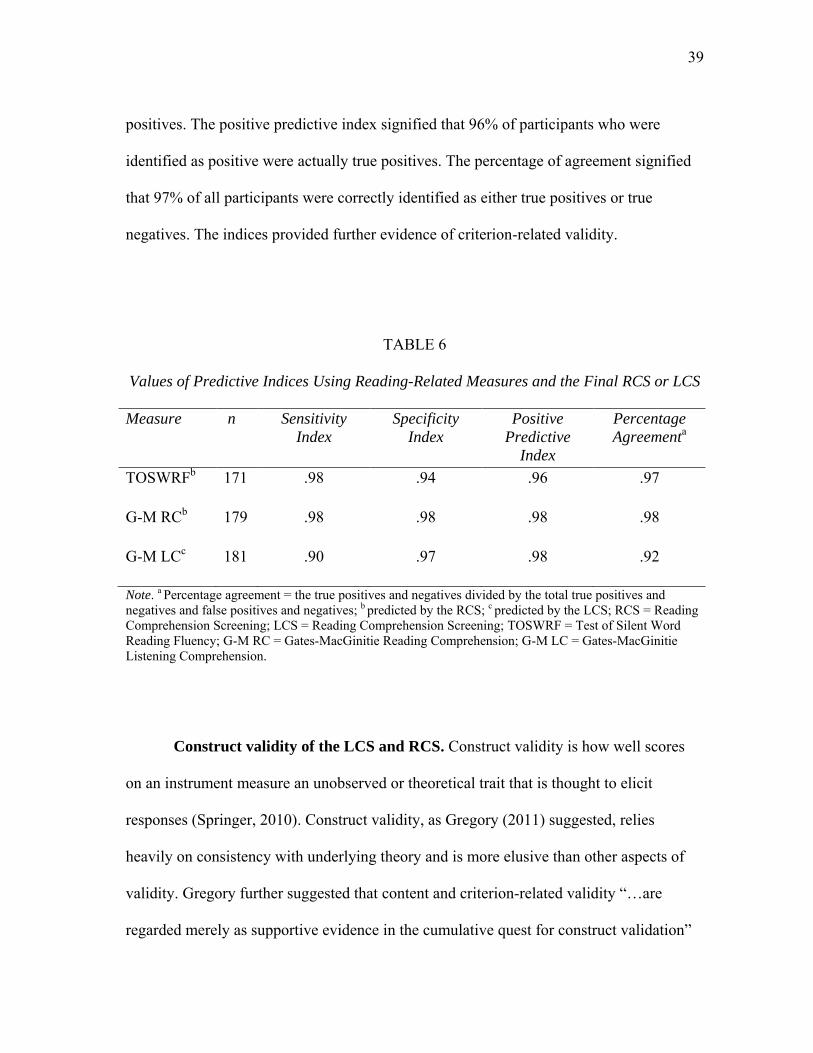
39
positives. The positive predictive index signified that 96% of participants who were
identified as positive were actually true positives. The percentage of agreement signified
that 97% of all participants were correctly identified as either true positives or true
negatives. The indices provided further evidence of criterion-related validity.
TABLE 6
Values of Predictive Indices Using Reading-Related Measures and the Final RCS or LCS
Measure n Sensitivity
Index
Specificity
Index
Positive
Predictive
Index
Percentage
Agreementa
TOSWRFb 171 .98 .94 .96 .97
G-M RCb 179 .98 .98 .98 .98
G-M LCc 181 .90 .97 .98 .92
Note. a Percentage agreement = the true positives and negatives divided by the total true positives and negatives and false positives and negatives; b predicted by the RCS; c predicted by the LCS; RCS = Reading Comprehension Screening; LCS = Reading Comprehension Screening; TOSWRF = Test of Silent Word Reading Fluency; G-M RC = Gates-MacGinitie Reading Comprehension; G-M LC = Gates-MacGinitie Listening Comprehension.
Construct validity of the LCS and RCS. Construct validity is how well scores
on an instrument measure an unobserved or theoretical trait that is thought to elicit
responses (Springer, 2010). Construct validity, as Gregory (2011) suggested, relies
heavily on consistency with underlying theory and is more elusive than other aspects of
validity. Gregory further suggested that content and criterion-related validity “…are
regarded merely as supportive evidence in the cumulative quest for construct validation”
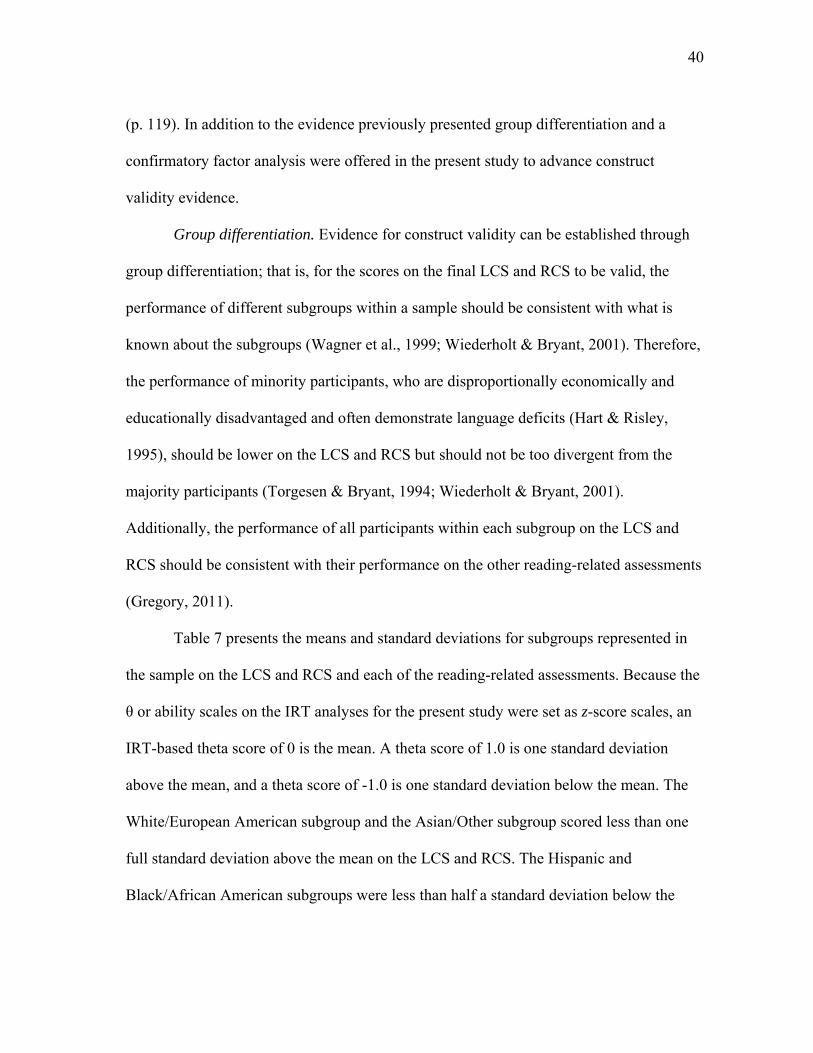
40
(p. 119). In addition to the evidence previously presented group differentiation and a
confirmatory factor analysis were offered in the present study to advance construct
validity evidence.
Group differentiation. Evidence for construct validity can be established through
group differentiation; that is, for the scores on the final LCS and RCS to be valid, the
performance of different subgroups within a sample should be consistent with what is
known about the subgroups (Wagner et al., 1999; Wiederholt & Bryant, 2001). Therefore,
the performance of minority participants, who are disproportionally economically and
educationally disadvantaged and often demonstrate language deficits (Hart & Risley,
1995), should be lower on the LCS and RCS but should not be too divergent from the
majority participants (Torgesen & Bryant, 1994; Wiederholt & Bryant, 2001).
Additionally, the performance of all participants within each subgroup on the LCS and
RCS should be consistent with their performance on the other reading-related assessments
(Gregory, 2011).
Table 7 presents the means and standard deviations for subgroups represented in
the sample on the LCS and RCS and each of the reading-related assessments. Because the
θ or ability scales on the IRT analyses for the present study were set as z-score scales, an
IRT-based theta score of 0 is the mean. A theta score of 1.0 is one standard deviation
above the mean, and a theta score of -1.0 is one standard deviation below the mean. The
White/European American subgroup and the Asian/Other subgroup scored less than one
full standard deviation above the mean on the LCS and RCS. The Hispanic and
Black/African American subgroups were less than half a standard deviation below the
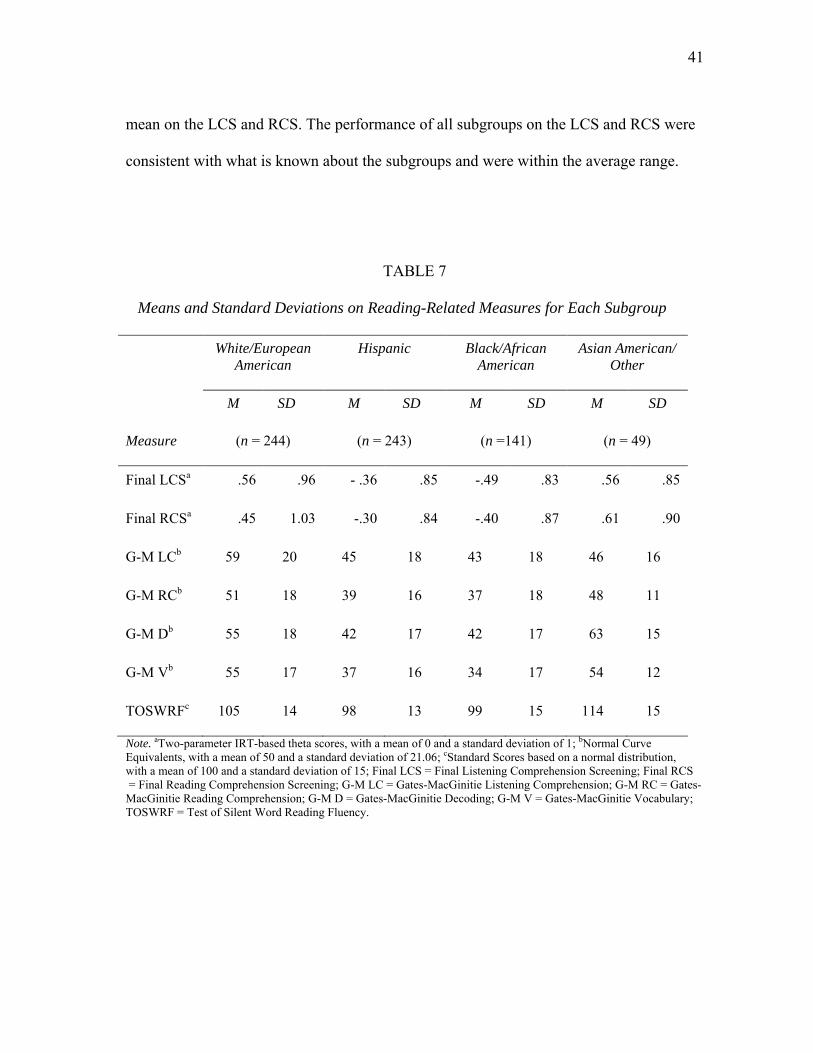
41
mean on the LCS and RCS. The performance of all subgroups on the LCS and RCS were
consistent with what is known about the subgroups and were within the average range.
TABLE 7
Means and Standard Deviations on Reading-Related Measures for Each Subgroup
White/European
American
Hispanic
Black/African
American
Asian American/
Other
M SD M SD M SD M SD
Measure (n = 244) (n = 243) (n =141) (n = 49)
Final LCSa .56 .96 - .36 .85 -.49 .83 .56 .85
Final RCSa .45 1.03 -.30 .84 -.40 .87 .61 .90
G-M LCb 59 20 45 18 43 18 46 16
G-M RCb 51 18 39 16 37 18 48 11
G-M Db 55 18 42 17 42 17 63 15
G-M Vb 55 17 37 16 34 17 54 12
TOSWRFc 105 14 98 13 99 15 114 15
Note. aTwo-parameter IRT-based theta scores, with a mean of 0 and a standard deviation of 1; bNormal Curve Equivalents, with a mean of 50 and a standard deviation of 21.06; cStandard Scores based on a normal distribution, with a mean of 100 and a standard deviation of 15; Final LCS = Final Listening Comprehension Screening; Final RCS = Final Reading Comprehension Screening; G-M LC = Gates-MacGinitie Listening Comprehension; G-M RC = Gates-MacGinitie Reading Comprehension; G-M D = Gates-MacGinitie Decoding; G-M V = Gates-MacGinitie Vocabulary; TOSWRF = Test of Silent Word Reading Fluency.
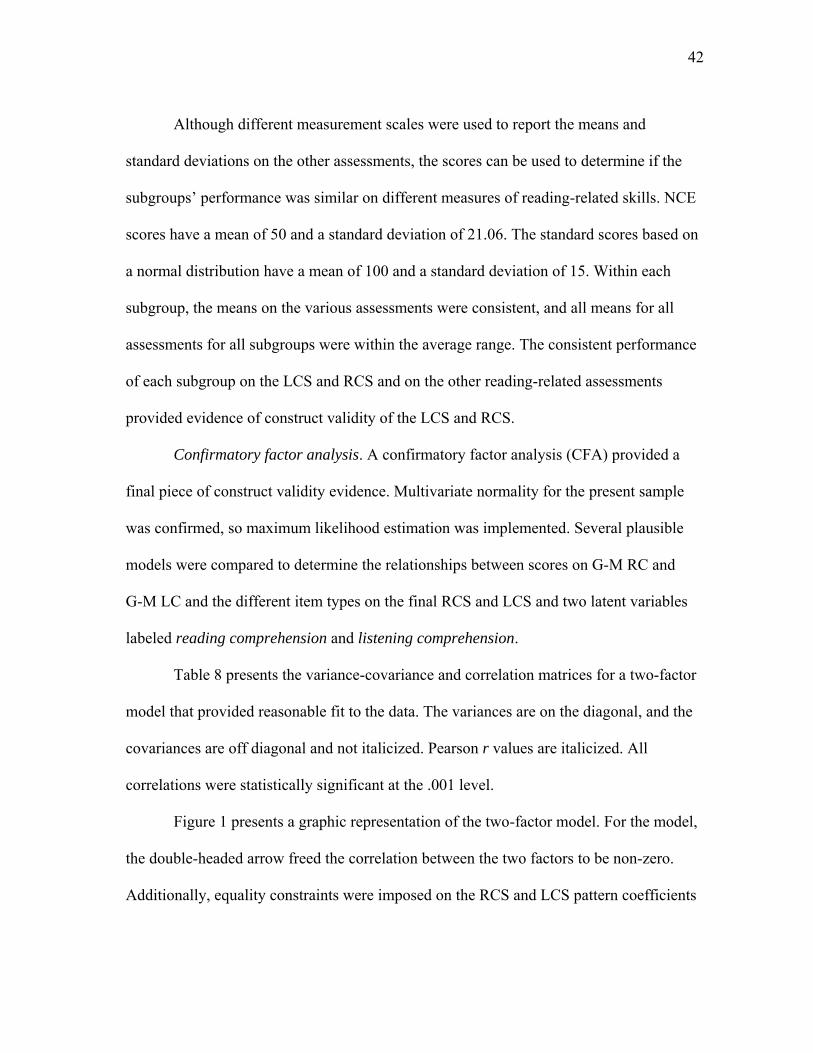
42
Although different measurement scales were used to report the means and
standard deviations on the other assessments, the scores can be used to determine if the
subgroups‟ performance was similar on different measures of reading-related skills. NCE
scores have a mean of 50 and a standard deviation of 21.06. The standard scores based on
a normal distribution have a mean of 100 and a standard deviation of 15. Within each
subgroup, the means on the various assessments were consistent, and all means for all
assessments for all subgroups were within the average range. The consistent performance
of each subgroup on the LCS and RCS and on the other reading-related assessments
provided evidence of construct validity of the LCS and RCS.
Confirmatory factor analysis. A confirmatory factor analysis (CFA) provided a
final piece of construct validity evidence. Multivariate normality for the present sample
was confirmed, so maximum likelihood estimation was implemented. Several plausible
models were compared to determine the relationships between scores on G-M RC and
G-M LC and the different item types on the final RCS and LCS and two latent variables
labeled reading comprehension and listening comprehension.
Table 8 presents the variance-covariance and correlation matrices for a two-factor
model that provided reasonable fit to the data. The variances are on the diagonal, and the
covariances are off diagonal and not italicized. Pearson r values are italicized. All
correlations were statistically significant at the .001 level.
Figure 1 presents a graphic representation of the two-factor model. For the model,
the double-headed arrow freed the correlation between the two factors to be non-zero.
Additionally, equality constraints were imposed on the RCS and LCS pattern coefficients
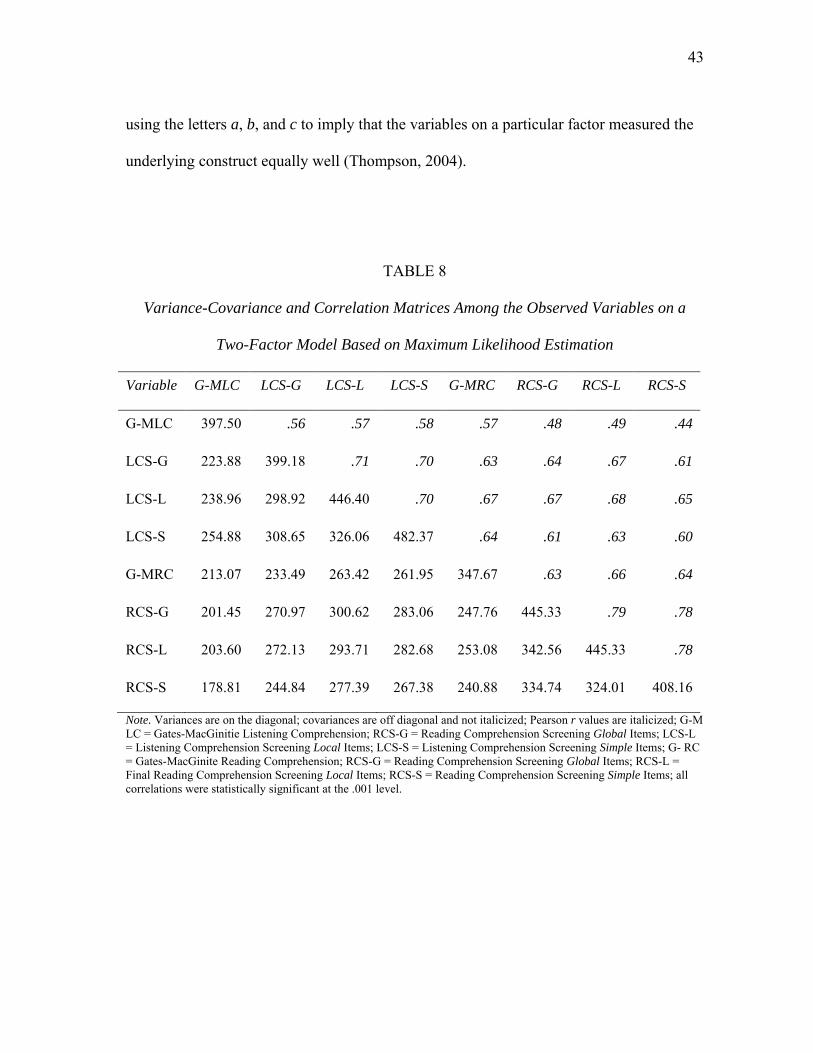
43
using the letters a, b, and c to imply that the variables on a particular factor measured the
underlying construct equally well (Thompson, 2004).
TABLE 8
Variance-Covariance and Correlation Matrices Among the Observed Variables on a
Two-Factor Model Based on Maximum Likelihood Estimation
Variable G-MLC LCS-G LCS-L LCS-S G-MRC RCS-G RCS-L RCS-S
G-MLC 397.50 .56 .57 .58 .57 .48 .49 .44
LCS-G 223.88 399.18 .71 .70 .63 .64 .67 .61
LCS-L 238.96 298.92 446.40 .70 .67 .67 .68 .65
LCS-S 254.88 308.65 326.06 482.37 .64 .61 .63 .60
G-MRC 213.07 233.49 263.42 261.95 347.67 .63 .66 .64
RCS-G 201.45 270.97 300.62 283.06 247.76 445.33 .79 .78
RCS-L 203.60 272.13 293.71 282.68 253.08 342.56 445.33 .78
RCS-S 178.81 244.84 277.39 267.38 240.88 334.74 324.01 408.16
Note. Variances are on the diagonal; covariances are off diagonal and not italicized; Pearson r values are italicized; G-M LC = Gates-MacGinitie Listening Comprehension; RCS-G = Reading Comprehension Screening Global Items; LCS-L = Listening Comprehension Screening Local Items; LCS-S = Listening Comprehension Screening Simple Items; G- RC = Gates-MacGinite Reading Comprehension; RCS-G = Reading Comprehension Screening Global Items; RCS-L = Final Reading Comprehension Screening Local Items; RCS-S = Reading Comprehension Screening Simple Items; all correlations were statistically significant at the .001 level.
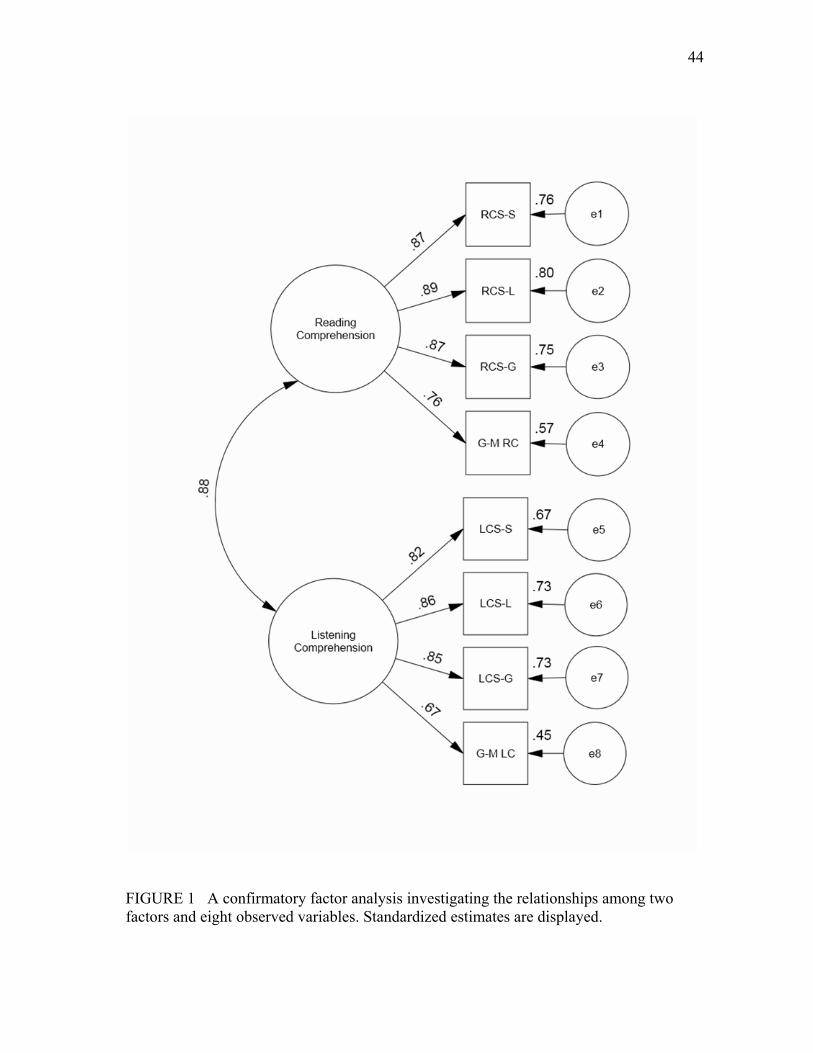
44
FIGURE 1 A confirmatory factor analysis investigating the relationships among two factors and eight observed variables. Standardized estimates are displayed.
45
The latent variables in the model were highly correlated. The model suggested that
the factor reading comprehension influenced G-M RC (MacGinitie et al., 2006) and the
three RCS variables. The RCS variables appeared to have stronger relationships with the
factor. Likewise, the factor listening comprehension influenced G-M LC and the three
LCS variables, and the LCS variables appeared to have stronger relationships with the
factor.
The model yielded 2 of 112.293 with 22 degrees of freedom, with a 2/df ratio of
5.1. To evaluate model fit, the following statistics were consulted: a) the comparative fit
index (CFI), which compares the fit of a hypothesized model relative to a null model with
perfectly uncorrelated variables, b) the normed fit index (NFI), which compares the 2 of a
hypothesized model relative to a null model, and c) the goodness-of-fit index (GFI), which
estimates the overall variance and covariance accounted for by a hypothesized model. The
values on these indices (CFI = .975, NFI = .969, GFI = .953) suggested good model fit.
Lastly, the root-mean-square error of approximation (RMSEA) was .083. An RMSEA
estimate of .08 or less is acceptable for good model fit, with a value greater than .10 a
poor fit (Stevens, 2009).
In evaluating results, Klem (2000) suggested three considerations: theoretical
implications, statistical criteria, and fit indices. The CFA model was in keeping with the
Simple View of Reading (Gough & Tunmer, 1986), which proposes that listening and
reading comprehension involve almost identical processes and abilities. The estimates
seemed appropriate, and the various indices indicated a reasonable model fit. Overall,
CFA analysis provided further evidence of construct validity.
46
Discussion
Decoding is a necessary but not sufficient component of reading. Gough and Tunmer
stated that decoding is, “…the ability to rapidly derive a representation from printed input
that allows access to the appropriate entry in the mental lexicon, and thus, the retrieval of
semantic information at the word level” (1986, p. 130). Of course, this definition assumes
that once a word is decoded there is adequate language comprehension, which is also a
necessary but not sufficient component of reading (Gough& Tunmer, 1986). As Snow
stated, “…the child with limited vocabulary knowledge, limited world knowledge, or both
will have difficulty comprehending texts that presuppose such knowledge, despite an
adequate development of word-recognition and phonological-decoding skills” (2002, p.
23). Assessing students‟ strengths and weaknesses in the components of reading ensures
that correct instructional decisions will be made.
The purpose of the present study was to discuss the development and validation of
the listening comprehension screening (LCS) and the reading comprehension screening
(RCS) to inform instructional decisions for end-of-second-grade students. All items on the
LCS and RCS required inference making within a sentence, among sentences, or beyond a
sentence or groups of sentences. By presenting items through listening and reading, a
contrast in performance on the two measures can better elucidate whether a student‟s
difficulties with reading comprehension stem from inadequate language comprehension
(e.g., inability to make inferences), inadequate decoding skills, or both.
One- and two-parameter logistic IRT models were used to calibrate the responses
of 699 end-of-second-grade students on the preliminary versions of the LCS and RCS.
IRT-based criteria were used to choose items for shorter final versions of the LCS and
47
RCS. Because IRT assumes that one latent trait or ability influences an examinee‟s
response to a given item (Hambleton & Swaminathan, 1985), it can be assumed that
students‟ responses on the LCS were influenced by a single latent trait, listening
comprehension, and the responses on the RCS were influenced by a single latent trait,
reading comprehension. A confirmatory factor analysis provided evidence of these latent
traits or constructs. Further research can confirm whether the LCS and RCS measure these
traits better than other reading comprehension assessments.
Validation is an ongoing process that requires multiple sources. Accordingly, the
present study offered other sources of evidence of test score validity. Evidence for content
validity was provided by a review of items on both the LCS and RCS by expert reading
specialists. Evidence for concurrent validity was supplied by strong correlations of the
LCS and RCS with other assessments of reading-related skills, where such correlations
were expected. Evidence for predictive validity was offered by strong sensitivity,
specificity, and positive predictive indices. Additional construct validity was presented
through student performance on the LCS and RCS and other assessments that was
consistent across and within different subgroups represented in the study and a CFA that
suggested.
Score reliability (Cronbach‟s alpha) on the preliminary version of the LCS was
estimated to be .91, and .89 on the shorter final version. On the preliminary version of the
RCS, score reliability was .94, and .93 on the shorter final version. All told, the reliability
and validity evidence suggested that the scores on the LCS and RCS are reliable and
valid; therefore, the LCS and RCS hold great promise for informing instructional
decisions for end-of-second-grade students.
48
Limitations
A limitation of the present study is that the sample was not representative of the U.S.
population. The actual demographics differed greatly from the reported demographics in
the 42 classrooms. How well the LCS and RCS will generalize to a population that is a
more representative cannot be determined. A next step is to develop norms for the LCS
and RCS with samples that better reflect the U.S. population.
A second limitation is that even though the LCS and RCS will definitively identify
students with poor language comprehension, the exact cause of the poor language
comprehension will not be readily evident. Further investigation will be needed to
determine whether poor language comprehension stems from poor vocabulary, lack of
background knowledge, poor working memory, or poor language processing. A follow-up
study examining the performance of students with poor language comprehension on the
different types of items on the preliminary and final LCS and RCS may demonstrate that
certain items are helpful in determining the exact cause of poor language comprehension.
Although any explicit language comprehension instruction (e.g., increasing oral language
and background knowledge or teaching inference making) will be beneficial, knowing the
exact cause will aid the planning of more targeted instruction.
A third limitation of the present study is more a caution than a limitation. The LCS
and RCS were designed for use with end-of-second-grade students. Chall (1983)
emphasized that basic literacy skills need to be in place by the end of third grade to ensure
successful transition from the “learning-to-read” stages to the “reading-to-learn” stages of
reading development. If student needs can be determined at the end of second grade, then
class placements and other decisions can be made to ensure that students receive the most
49
appropriate instruction from day one of third grade. However, developmentally, students
at the end of second grade are more adept at listening comprehension than reading
comprehension and are still developing automaticity in decoding (Chall, 1983; Ehri,
2005). Therefore, discrepancies in listening comprehension and reading comprehension as
measured on the LCS (high) and RCS (lower) may be presumed to represent normal
developmental progress in learning to read when, in fact, such discrepancies could
indicate a learning disability (e.g., dyslexia).
This is not to suggest that the LCS and RCS be used to diagnose dyslexia or other
learning disabilities. Rather, if students obtain substantially discrepant scores on the LCS
compared to the RCS (i.e., one standard deviation or more), then explicit decoding
instruction is not only appropriate – such instruction is necessary. The same scenario is
true with students who demonstrate low performance on both the LCS and RCS; these
students will require explicit language comprehension instruction, and possibly, explicit
decoding instruction. Ultimately, a student‟s response to appropriate instruction, informed
by the LCS and RCS, will aid the determination of a learning disability.
50
CHAPTER III
THE DISCRIMINANT VALIDITY OF PARALLEL
COMPREHENSION SCREENING MEASURES
Unlike learning to speak, learning to read is not a natural phenomenon (Gough &
Hillinger, 1980) and requires systematic and explicit instruction (cf. National Institute of
Child Health and Human Development [NICHD], 2000). Adams (2010) suggested that
the human brain is wired for speech, which is the “human birdsong,” whereas reading is
an invention of humankind that evolved over 8,000 years. Adams further proposed that to
evolve, the invention of reading required myriad insights (e.g., symbols represent
meaning, letters represent speech sounds, spaces aid word recognition, sentences frame
meaning, paragraphs support the flow of discourse), and these early evolutionary insights
mirror the understandings that are required for the development of skilled reading.
For reading instruction to be productive, instruction must foster the awareness of
requisite insights and advance their manifestations. Furthermore, potential hindrances to
skilled reading must be identified and remediated. The purpose of the present article was
to explore whether parallel listening and reading comprehension screening measures and
the Gates-MacGinite Reading Tests (MacGinitie, MacGinitie, Maria, Dreyer, & Hughes,
2006) could be differentiated as measures of reading comprehension to inform
instructional decisions for end-of-second-grade students.
51
Causes of Poor Reading Comprehension
The Simple View of Reading (SVR; Gough & Tunmer, 1986; Hoover & Gough, 1990)
holds that skilled reading, as demonstrated by intact reading comprehension, is the
product of decoding times language comprehension. Both components are necessary but
not sufficient alone. The definitive goal of decoding instruction is the facile translation of
printed words into spoken equivalents. Decoding begins with the reader‟s appreciation
that spoken words are composed of phonemes or speech sounds. The reader who
possesses awareness of speech sounds in spoken words will realize that printed or written
words are composed of individual letters or groups of letters that represent the individual
speech sounds in spoken words. Thorough knowledge of sound-symbol correspondences
and repeated exposures build words in memory (Adams, 1990; Ehri, 2005). Words held in
memory can be recognized without conscious effort on the reader‟s part (Ehri, 2005;
Wolf, Bowers, & Greig, 1999).
In addition to knowledge of sound-symbol correspondences, knowledge of the
syllabic and morphemic segments of written language facilitates the reading of longer
words. Eventually, instant recognition of mono- and multi-syllabic words leads to fluent
oral reading, which is the equivalent of speaking and vital to processing meaning
(LaBerge & Samuels, 1974; Perfetti, 1985). Poor decoding can result from one or more
sources and can adversely affect reading comprehension (Gough & Tunmer, 1986);
therefore, it is important to assess whether poor decoding at any level is interfering with
reading comprehension.
Assuming that decoding is not interfering with skilled reading comprehension,
then a deficit in language comprehension is likely the cause (Gough & Tunmer, 1986).
52
Language comprehension is, as Gough and Tunmer offered, “…the ability to take lexical
information (i.e., semantic information at the word level) and derive sentence and
discourse interpretations” through listening (p. 131). As seen in the definition, language
comprehension requires abilities and processes at the word, sentence, and discourse
levels. Because language and reading comprehension involve almost the same abilities
and processes (Gough & Tunmer, 1986), it is logical to assume that difficulties
experienced with language comprehension would also be experienced with reading
comprehension. Just as with decoding, poor language comprehension may result from one
or more sources (e.g., inadequate vocabulary, insufficient background knowledge, poor
working memory, inability to identify semantic relationships; Kendeou, Savage, & van
den Broek, 2009; Nation, 2005; Yuill & Oakhill, 1991).
An ability that best differentiates readers with good comprehension from readers
with poor comprehension is inference making (Cain & Oakhill, 2007; Yuill & Oakhill,
1991). Important requirements for inference making include use of the context to
determine the meaning or correct usage of a word (Ouellette, 2006; Cain & Oakhill,
2007), anaphoric resolution of pronouns and interclausal connectives (i.e., understanding
so and because), and integration of information within a sentence or text, using
vocabulary and prior knowledge (Cain & Oakhill, 2007; Oakhill & Cain, 2007).
Identifying Causes of Poor Reading Comprehension
Identification of the exact cause of poor reading comprehension is necessary so that the
most appropriate instruction can be designed. Universal literacy screenings identify
students who may be at risk for reading failure. However, many frequently used
53
screenings and progress monitors for measuring the literacy skills of second-grade
students (e.g., Dynamic Indicators of Basic Early Literacy Skills [DIBELS], Good &
Kiminski, 2002; Texas Primary Reading Inventory [TPRI], University of Texas System &
Texas Education Agency, 2006) do not provide subtests that would enable the
identification of students with intact language comprehension and weak decoding skills.
Using either DIBELS or TPRI, for example, teachers can assess students‟
phonemic awareness, word recognition, fluency, and text comprehension and can identify
students who have difficulties with decoding or reading comprehension. However, there is
no way to differentiate deficits with reading comprehension that are the result of decoding
deficits only or the result of decoding and language comprehension deficits. If a student
does poorly on both the decoding and reading comprehension measures (i.e., orally
reading a passage and retelling the passage or answering questions about the passage), is
the student‟s poor reading comprehension the result of poor decoding, or in addition to
poor decoding, is there also a language comprehension deficit?
Standardized tests of reading comprehension may aid in the identification of
students with poor reading comprehension. However, Kendeou, van den Broek, White,
and Lynch suggested that standardized tests “…have been designed for students who have
mastered decoding skills and are widely criticized as invalid measures of comprehension”
(2009, p. 775), which means poor reading comprehension measured on standardized tests
may simply reflect poor decoding skills. Nation and Snowling (1997) and Francis,
Fletcher, Catts, and Tomblin (2005) found that test formats measured different skills; for
example, students with poor comprehension but good decoding skills perform less well on
passage tests than on tests with cloze-procedure formats. Keenan, Betjemann, and Olson
54
(2009) found tests with short passages were more influenced by decoding, because less
text support is available to aid the examinee in decoding an unfamiliar word. Cutting and
Scarborough (2006) found standardized tests do not always assess the same competencies
or skills. Similarly, Keenan et al. (2009) found standardized tests may measure different
competencies based on age or ability. Therefore, it is important to understand what
competencies reading comprehension tests actually assess for what age or ability and how
the tests are formatted so that the exact deficit can be identified.
Even with a clear understanding of the competencies a test assesses or awareness
of the test format, Francis et al. (2005) noted shortcomings of reading comprehension
tests that are constructed using classical test theory. Classical test theory holds that an
observed score (X) is equal to a hypothetical measure of the population true score (T),
plus or minus measurement error (E), or X = T E. The true score is never known and, as
Francis et al. stated, “There is no necessary implication that this score reflects some
underlying latent ability. Although such a possibility is not ruled out, neither is it
required” (p. 374). The authors also contended that modern test theory, such as latent
traits theory or item response theory (IRT), can estimate the ability of individuals and the
difficulty of items. Additionally, factor analytic models, such as confirmatory factor
analysis and structural equation modeling, can better specify underlying latent abilities
that will lead to better assessment of reading comprehension.
Listening and Reading Comprehension Screening Measures
Listening comprehension is highly correlated with reading comprehension (cf. Joshi,
Williams, & Wood, 1998). Both listening comprehension and reading comprehension
55
involve almost identical processes and abilities, with the exception that decoding is
needed for reading comprehension (Hoover & Gough, 1990). Consequently, a contrast
between listening comprehension and reading comprehension abilities should delineate
poor reading comprehension that is the result of poor decoding skills, the result of poor
language comprehension, or the result of poor decoding skills and poor language
comprehension. Additionally, the ability to make inferences has been reported to be the
best determinant of good or poor reading comprehension (Cain & Oakhill, 2007).
Therefore, valid listening and reading comprehension screening measures that focus on
inferential questioning should differentiate groups of readers and their instructional needs.
Two parallel screening measures – the listening comprehension screening (LCS)
and the reading comprehension screening (RCS) – were developed (Carreker, in
preparation). The LCS and RCS were designed to identify end-of-second-grade students
with poor decoding skills, poor language comprehension, or poor decoding skills and poor
language comprehension that may interfere with proficient reading comprehension. Poor
decoding skills would be suspect by a contrast of a high LCS score and a low RCS score.
Poor language comprehension would be suspect if scores on both the LCS and RCS were
low and performance on an independent decoding test was adequate. Poor language
comprehension and poor decoding skills would be suspect if scores on the LCS and RCS
and an independent decoding test were low. By identifying the underlying cause of
students‟ difficulties with reading comprehension, the teacher can provide targeted
instruction that will remediate the cause of the reading comprehension difficulties.
The items on the LCS and RCS were written to tap the examinee‟s ability to make
inferences at three different levels: 1) simple inferences – integration of information
56
within a single sentence, 2) local inferences – integration of information among several
sentences, and 3) global inferences – integration of background knowledge with
information in a sentence or group of sentences. Additionally, the items were written to
measure three different content objectives: 1) vocabulary – the meaning of unfamiliar
words or the correct usage of words with multiple meanings, 2) text consistency –
detection of inconsistencies or maintenance of consistency when anaphoric pronouns or
interclausal connectors are present, and 3) text element – sequence of events, main idea, or
causal relationships (Cain & Oakhill, 2007). The preliminary LCS and RCS each had 75
multiple-choice items. Examples of items follow, with the asterisk denoting the correct
response:
Simple/Text Consistency Marta baked a cake, and she gave a piece to Maria, Kelly, and Sally. Who cut the cake? e) Maria f) Sally g) Marta* h) Kelly Local/Text Element The hummingbird is a small bird. The hummingbird can flap its wings 90 times in one minute. A hummingbird can live 5 years. The best title is: e) The Tiny Flapper* f) The Old Digger g) The Hungry Eater h) The Joyful Singer Global/Vocabulary What is the meaning of predators in this sentence? The squid squirts ink to keep it safe from predators. e) friends f) survivors g) buddies h) enemies*
57
To validate the LCS and RCS, both measures were administered to 699 end-of-
second-grade students (Carreker, in preparation). The item responses on the LCS and RCS
were calibrated using one- and two-parameter IRT logistic models. The 75 items on both
the preliminary LCS and RCS were evaluated using IRT-based criteria, such as p values
on both models, b values (difficulty) on the two-parameter (2P) model, a values
(discrimination), and overall fit of the 2P model at each ability level. The most
discriminating items with b values from approximately -1.0 to .5 and good overall model
fit at each ability level were chosen for the final versions of the LCS and RCS.
Additionally, there was a mixed distribution of items types and content objectives among
the selected items. The final versions of both the LCS and RCS contained 42 items.
The Purpose of the Present Study
In the validation study (Carreker, in preparation), score reliability (Cronbach‟s alpha) was
estimated to be .89 on the final version of the LCS and .93 on the final version of the
RCS. A confirmatory factor analysis provided evidence that the final LCS measured a
single latent trait, listening comprehension, and the final RCS measured a single latent
trait, reading comprehension. Concurrent validity evidence suggested that the final
versions of the LCS and RCS correlated well with the Gates-MacGinitie Reading Tests,
Level Two (G-M; MacGinitie et al., 2006). The purpose of the present study was to
explore whether scores on the final LCS and RCS are commensurate with scores on the
G-M LC and G-M RC or whether the different tests can be differentiated as
comprehension measures to inform instructional decisions for end-of-second-grade
students.
58
Method
Participants
The participants in the present study (n = 214) were not recruited. The participants were
from the study (n = 699) to validate the LCS and RCS (Carreker, in preparation) and were
enrolled in two districts in the southwestern region of the US that administered either the
Iowa Tests of Basic Skills (ITBS; Iowa Testing Programs, 2008) or the Stanford
Achievement Test Series, Tenth Edition (SAT-10; Harcourt Assessments, 2003). Only
participants from the larger study who had taken second-grade ITBS or SAT-10 and had
parental permission for the release of the achievement test data were included in the
present study.
The participants in the study who had completed the ITBS (n = 71) were 43.7%
White/European American, 33.8% Hispanic, 19.7% Black/African American, and 2.8%
Asian American or belonging to other racial and ethnic groups. The participants in this
group included 32 girls and 39 boys. The age of the participants ranged from 7.7 to 9.7
years (M = 8.4, SD = .51).
The participants in the present study who had completed the SAT-10 (n = 143)
was 44.1% White/European American, 19.5% Hispanic, 24.5% Black/African American,
and 11.9% Asian American or belonging to other racial and ethnic groups. The
participants in this group included 83 girls and 59 boys, with 1 participant unidentified.
The age of the participants ranged from 6.8 to 9.8 years (M = 8.3, SD = .49).
59
Study Design
Measures. In the larger study (Carreker, in preparation), multiple measures were
administered to the participants in addition to the LCS and RCS. Score reliability
(Cronbach‟s alpha) on the final version of the LCS for participants who completed the
ITBS was estimated to be .90 and on the final version of the RCS was estimated to be .93.
Score reliability for participants who completed the SAT-10 was estimated to be .89 on
the LCS and .92 on the RCS.
G-M Reading Tests, Level 2 (MacGinitie et al., 2000). The three subtests of the G-
M were administered. For the decoding subtest (G-M D), participants chose the one word
from four orthographically similar words that matched a picture. For the vocabulary
subtest (G-M V), participants chose the one word from four choices that matched the
meaning of a picture. For the reading comprehension subtest (G-M RC), participants read
sentences and passages silently and chose one picture from three choices that matched the
meaning of the sentences or passages. For the Participant who completed the ITBS, the
score reliability consistency (Cronbach‟s alpha) on the G-M RC was estimated to be .89.
For the participants who completed the SAT-10 score reliability was: .92 on decoding, .92
on vocabulary, and .87 on reading comprehension.
An alternate form of the G-M RC was used as a listening comprehension test (G-
M LC). Participants listened to passages that were read aloud and responded as described
above; however, the text was deleted and only the pictures were available for the
participants to view. Score reliability (Cronbach‟s alpha) on the G-M LC for the
Participants who completed the ITBS was estimated to be .68 and estimated to be .78 for
the participants who completed the SAT-10.
60
Test of Silent Word Reading Fluency (Mather, Hammill, Allen, & Roberts, 2004).
On the TOSWRF, students had 3 minutes to draw slashes between words that had no
space boundaries. Because the data on the TOSWRF were not dichotomous, Kuder-
Richardson Formula 21 was used to estimate score reliability for the total sample (r =
.90).
Achievement tests. In addition to the group-administered tests of reading-related
skills, scores from subtests on the Stanford Achievement Test Series, Tenth Edition (SAT-
10; Harcourt Assessments, 2003) or the Iowa Tests of Basic Skills (ITBS; Iowa Testing
Programs, 2008) were used to investigate the relationships between the LSC and RCS and
the G-M LC and G-M RC. Because raw data were not available, score reliability on the
various subtests for the present samples could not be estimated.
Procedures. The preliminary LCS and RCS, the G-M, and the standardized
achievement tests (ITBS or SAT-10) were group administered within a three-month
period. The SAT-10 and ITBS subtests were administered by school district personnel
over the course of a week.
Data collection for the other assessments took place over a three-day period during
one 90-minute session each day. The examiners were all master reading specialists who
had completed specific training on the administration of all assessments. Particular
emphasis was placed on the procedures for the LCS and G-M LC to ensure consistency in
administration. The assessments were administered in one of six randomly assigned
orders. The procedures determined by the publishers were used to administer the G-M
reading comprehension, decoding, and vocabulary subtests.
61
To ensure that participants were listening to the items on the LCS and not reading,
only one item was displayed per page in the participants‟ LCS test booklets, and only the
choices for a single item appeared on a page. For a few items with lengthy stems, the
stems also appeared in the participants‟ test booklets. The items were read to the
participants only one time. The examiner paused 5-6 seconds after finishing one item
before reading the next item. The administration time of the LCS was approximately 45
minutes. Three items appeared on each page of the RCS test booklets. Students read the
stems and choices silently to complete the measure. Students completed the RCS within
35 minutes.
Analyses. To investigate the discriminant validity of the final versions of the LCS
and RCS, different analyses were conducted. First, partial correlation analyses were
performed to estimate the relationships between two measures of listening or reading
comprehension while controlling for a third measure. Secondly, structural equation
modeling (SEM) was used to estimate the relationships between different measured and
unmeasured listening and reading comprehension variables.
Results
Descriptives and Correlations
Table 9 presents the standard score means and standard deviations for the 71 participants
in the present study who completed the ITBS. The LCS and RCS and G-M scores are
reported as Normal Curve Equivalents (NCEs), with a mean of 50 and a standard
deviation of 21.06. The scores on the ITBS listening comprehension subtest (ITBS-LC)
and the ITBS reading comprehension test (ITBS-RC) are reported as developmental
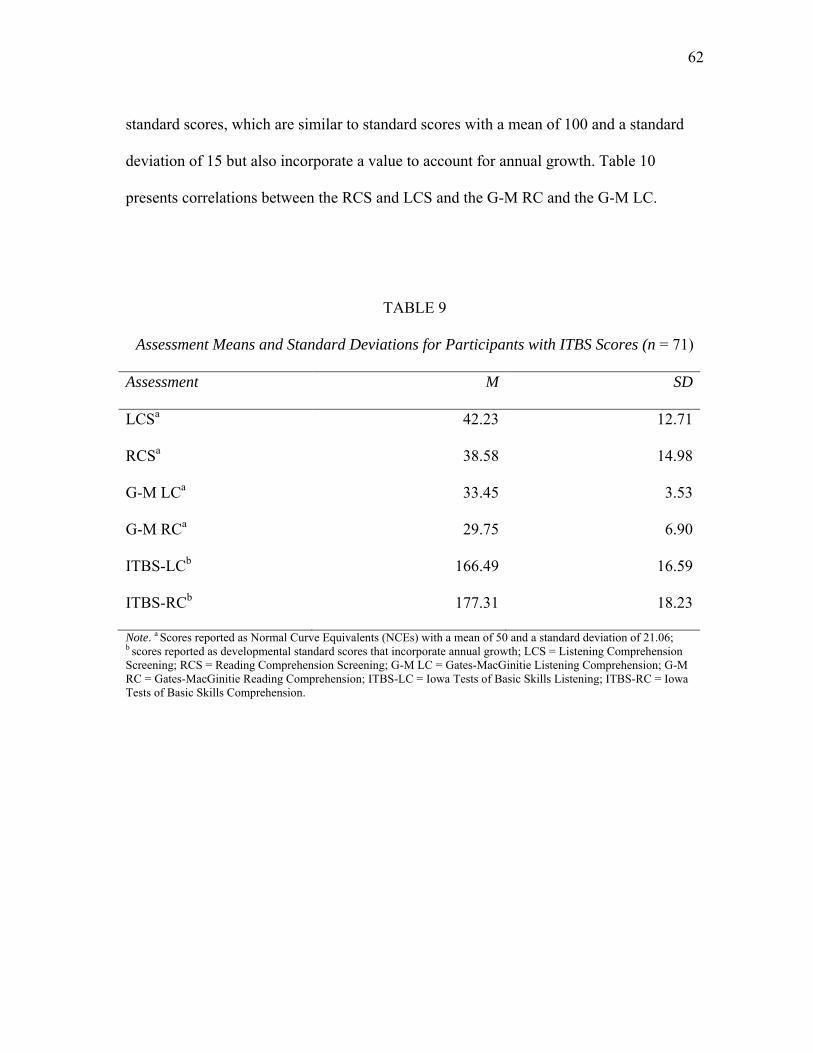
62
standard scores, which are similar to standard scores with a mean of 100 and a standard
deviation of 15 but also incorporate a value to account for annual growth. Table 10
presents correlations between the RCS and LCS and the G-M RC and the G-M LC.
TABLE 9
Assessment Means and Standard Deviations for Participants with ITBS Scores (n = 71)
Assessment M SD
LCSa 42.23 12.71
RCSa 38.58 14.98
G-M LCa 33.45 3.53
G-M RCa 29.75 6.90
ITBS-LCb 166.49 16.59
ITBS-RCb 177.31 18.23
Note. a Scores reported as Normal Curve Equivalents (NCEs) with a mean of 50 and a standard deviation of 21.06; b scores reported as developmental standard scores that incorporate annual growth; LCS = Listening Comprehension Screening; RCS = Reading Comprehension Screening; G-M LC = Gates-MacGinitie Listening Comprehension; G-M RC = Gates-MacGinitie Reading Comprehension; ITBS-LC = Iowa Tests of Basic Skills Listening; ITBS-RC = Iowa Tests of Basic Skills Comprehension.
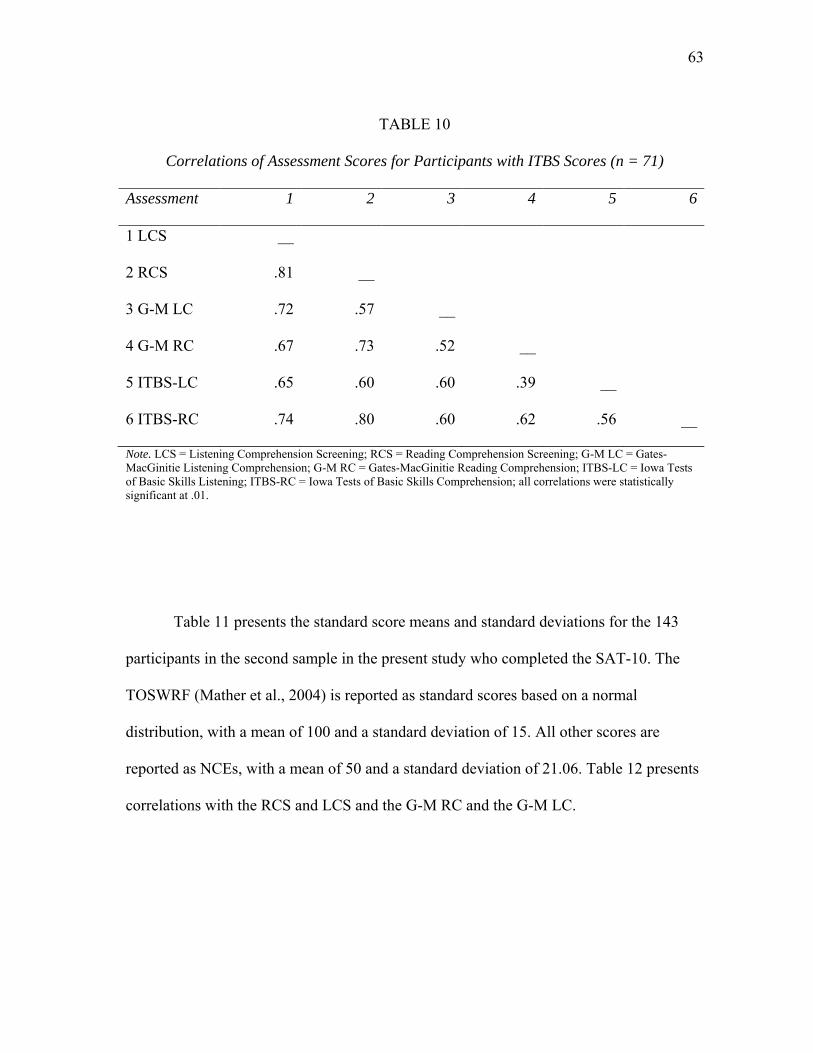
63
TABLE 10
Correlations of Assessment Scores for Participants with ITBS Scores (n = 71)
Assessment 1 2 3 4 5 6
1 LCS __
2 RCS .81 __
3 G-M LC .72 .57 __
4 G-M RC .67 .73 .52 __
5 ITBS-LC .65 .60 .60 .39 __
6 ITBS-RC .74 .80 .60 .62 .56 __
Note. LCS = Listening Comprehension Screening; RCS = Reading Comprehension Screening; G-M LC = Gates-MacGinitie Listening Comprehension; G-M RC = Gates-MacGinitie Reading Comprehension; ITBS-LC = Iowa Tests of Basic Skills Listening; ITBS-RC = Iowa Tests of Basic Skills Comprehension; all correlations were statistically significant at .01.
Table 11 presents the standard score means and standard deviations for the 143
participants in the second sample in the present study who completed the SAT-10. The
TOSWRF (Mather et al., 2004) is reported as standard scores based on a normal
distribution, with a mean of 100 and a standard deviation of 15. All other scores are
reported as NCEs, with a mean of 50 and a standard deviation of 21.06. Table 12 presents
correlations with the RCS and LCS and the G-M RC and the G-M LC.
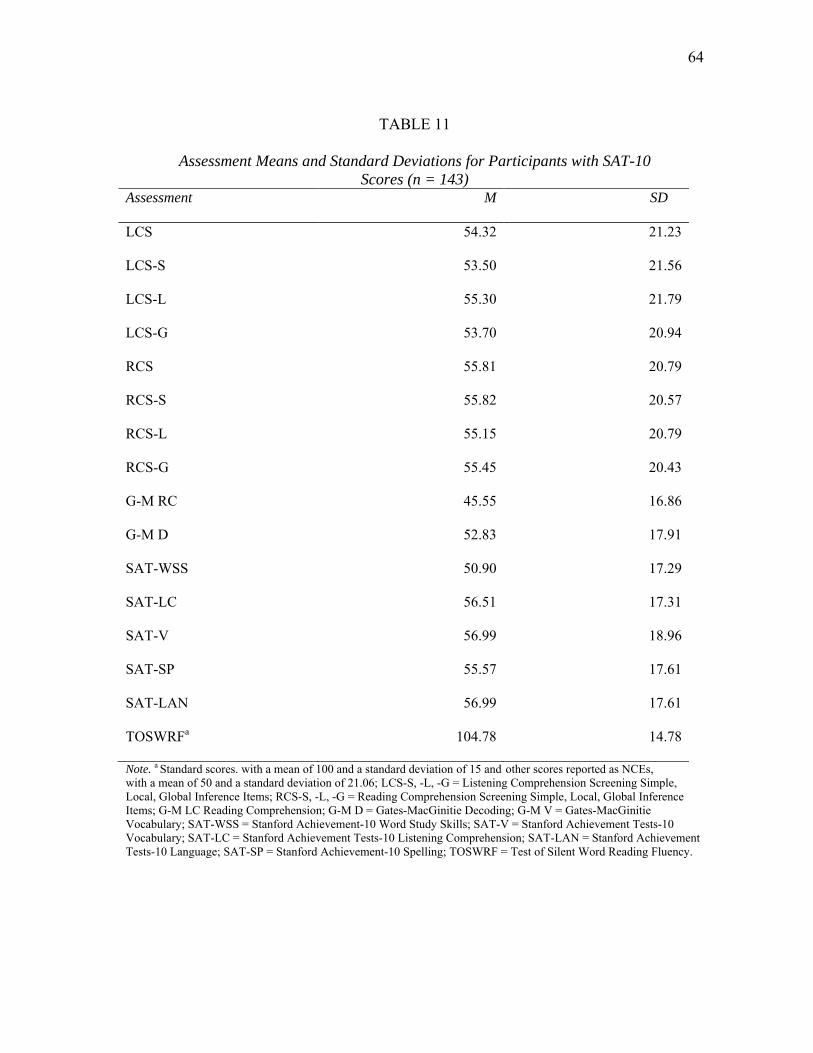
64
TABLE 11
Assessment Means and Standard Deviations for Participants with SAT-10
Scores (n = 143) Assessment M SD
LCS 54.32 21.23
LCS-S 53.50 21.56
LCS-L 55.30 21.79
LCS-G 53.70 20.94
RCS 55.81 20.79
RCS-S 55.82 20.57
RCS-L 55.15 20.79
RCS-G 55.45 20.43
G-M RC 45.55 16.86
G-M D 52.83 17.91
SAT-WSS 50.90 17.29
SAT-LC 56.51 17.31
SAT-V 56.99 18.96
SAT-SP 55.57 17.61
SAT-LAN 56.99 17.61
TOSWRFa 104.78 14.78
Note. a Standard scores. with a mean of 100 and a standard deviation of 15 and other scores reported as NCEs, with a mean of 50 and a standard deviation of 21.06; LCS-S, -L, -G = Listening Comprehension Screening Simple, Local, Global Inference Items; RCS-S, -L, -G = Reading Comprehension Screening Simple, Local, Global Inference Items; G-M LC Reading Comprehension; G-M D = Gates-MacGinitie Decoding; G-M V = Gates-MacGinitie Vocabulary; SAT-WSS = Stanford Achievement-10 Word Study Skills; SAT-V = Stanford Achievement Tests-10 Vocabulary; SAT-LC = Stanford Achievement Tests-10 Listening Comprehension; SAT-LAN = Stanford Achievement Tests-10 Language; SAT-SP = Stanford Achievement-10 Spelling; TOSWRF = Test of Silent Word Reading Fluency.
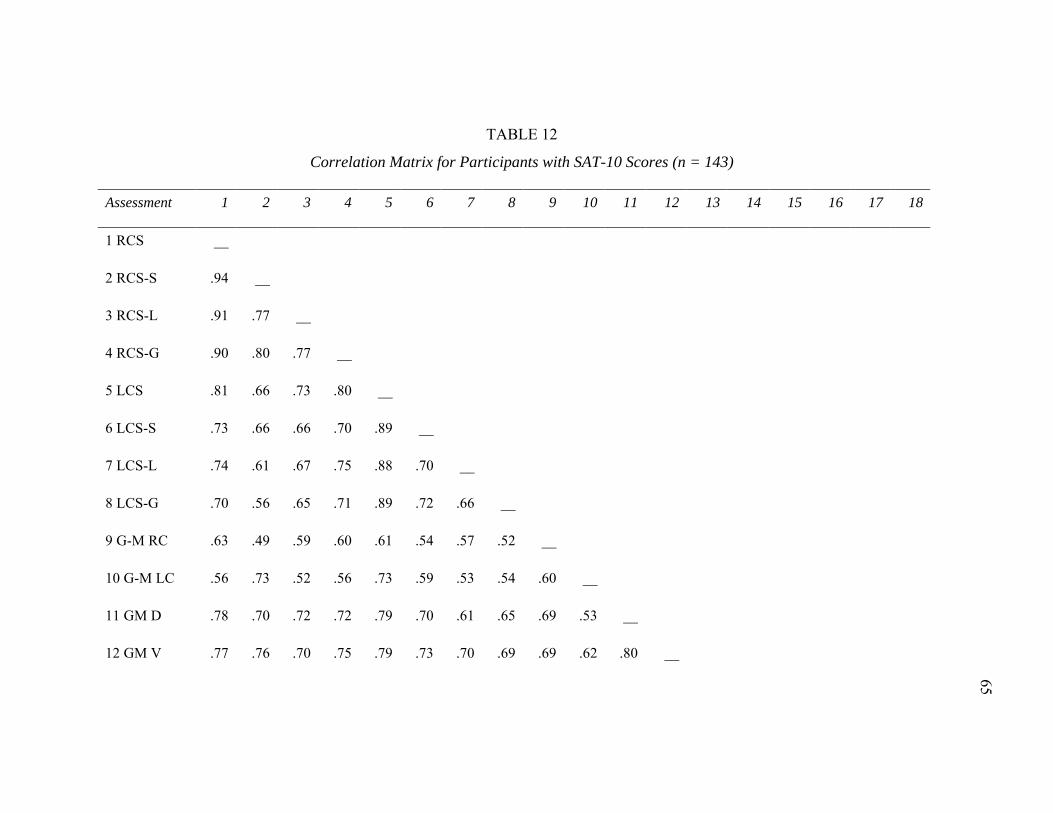
65
TABLE 12
Correlation Matrix for Participants with SAT-10 Scores (n = 143)
Assessment 1 2 3 4 5 6 7 8 9 10 11 12 13 14 15 16 17 18
1 RCS __
2 RCS-S .94 __
3 RCS-L .91 .77 __
4 RCS-G .90 .80 .77 __
5 LCS .81 .66 .73 .80 __
6 LCS-S .73 .66 .66 .70 .89 __
7 LCS-L .74 .61 .67 .75 .88 .70 __
8 LCS-G .70 .56 .65 .71 .89 .72 .66 __
9 G-M RC .63 .49 .59 .60 .61 .54 .57 .52 __
10 G-M LC .56 .73 .52 .56 .73 .59 .53 .54 .60 __
11 GM D .78 .70 .72 .72 .79 .70 .61 .65 .69 .53 __
12 GM V .77 .76 .70 .75 .79 .73 .70 .69 .69 .62 .80 __
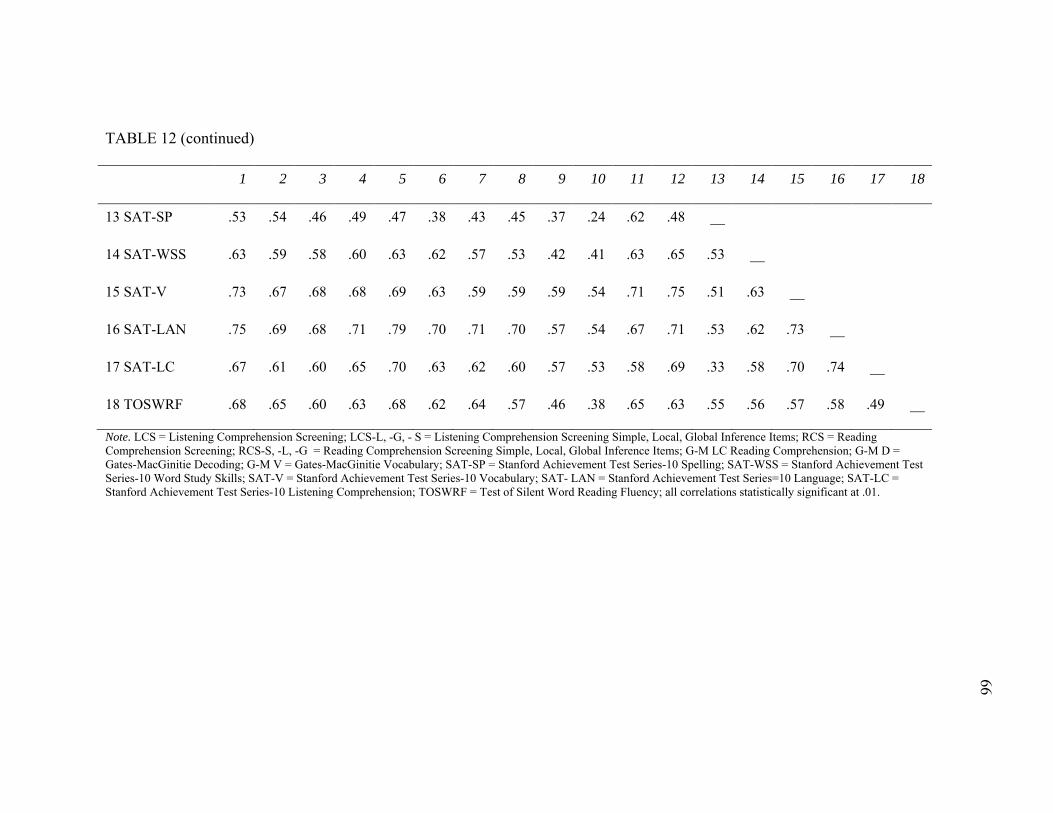
66
TABLE 12 (continued)
1 2 3 4 5 6 7 8 9 10 11 12 13 14 15 16 17 18
13 SAT-SP .53 .54 .46 .49 .47 .38 .43 .45 .37 .24 .62 .48 __
14 SAT-WSS .63 .59 .58 .60 .63 .62 .57 .53 .42 .41 .63 .65 .53 __
15 SAT-V .73 .67 .68 .68 .69 .63 .59 .59 .59 .54 .71 .75 .51 .63 __
16 SAT-LAN .75 .69 .68 .71 .79 .70 .71 .70 .57 .54 .67 .71 .53 .62 .73 __
17 SAT-LC .67 .61 .60 .65 .70 .63 .62 .60 .57 .53 .58 .69 .33 .58 .70 .74 __
18 TOSWRF .68 .65 .60 .63 .68 .62 .64 .57 .46 .38 .65 .63 .55 .56 .57 .58 .49 __
Note. LCS = Listening Comprehension Screening; LCS-L, -G, - S = Listening Comprehension Screening Simple, Local, Global Inference Items; RCS = Reading Comprehension Screening; RCS-S, -L, -G = Reading Comprehension Screening Simple, Local, Global Inference Items; G-M LC Reading Comprehension; G-M D = Gates-MacGinitie Decoding; G-M V = Gates-MacGinitie Vocabulary; SAT-SP = Stanford Achievement Test Series-10 Spelling; SAT-WSS = Stanford Achievement Test Series-10 Word Study Skills; SAT-V = Stanford Achievement Test Series-10 Vocabulary; SAT- LAN = Stanford Achievement Test Series=10 Language; SAT-LC = Stanford Achievement Test Series-10 Listening Comprehension; TOSWRF = Test of Silent Word Reading Fluency; all correlations statistically significant at .01.
67
Partial Correlations
To determine students‟ reading achievement at the end of second grade, teachers needed
measurement instruments to help inform their instruction. A question posed by the
present study was whether scores on the LCS and RCS are commensurate with scores on
the G-M. To provide evidence of discriminant validity of the scores on the LCS and RCS
for the present study, partial correlation analyses were conducted.
A partial correlation analysis investigates the correlation between two variables
while considering the effects of a third variable. The analysis determines how two
variables would correlate if the variables were not correlated to the third variable. For
example, the RCS and G-M RC are measures of reading comprehension as is ITBS-RC.
Because ITBS-RC, G-M RC, and the RCS are measures of reading comprehension, the
variables should be correlated. These would be zero-order correlations. The expectation
would be that the zero-order correlation of any two of the variables should not change
appreciably if the effects of the third variable are removed (i.e., first-order partial
correlation). In other words, the correlation of two variables is not due to the third
variable. If the zero-order correlation changes appreciably when the effects of the third
variable are removed, then correlation between the two variables is due to the effects of
the third variable.
Partial correlations with listening comprehension measures. The first partial
correlations were conducted using scores on ITBS-LC (n = 71) and the SAT-LC (n =
143) and the LCS and G-M LC. Table 13 presents the zero-order correlations and first-
order partial correlations between the various measures of listening comprehension.
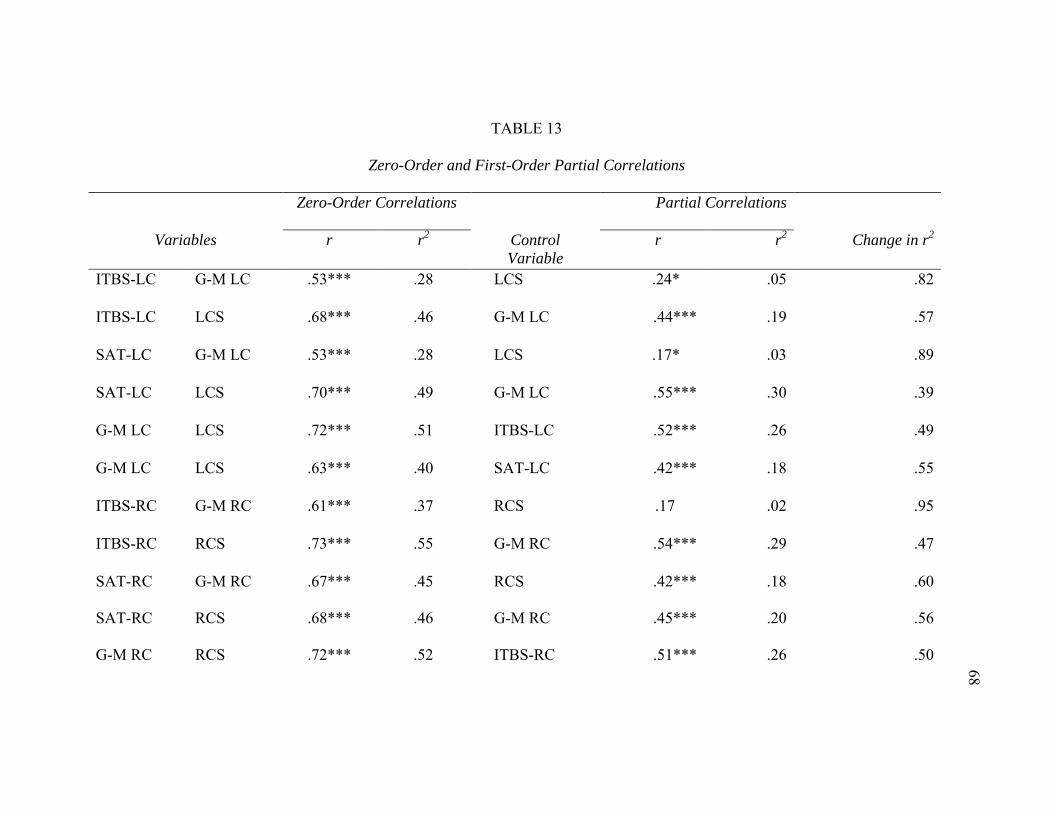
68
TABLE 13
Zero-Order and First-Order Partial Correlations
Zero-Order Correlations Partial Correlations
Variables r r2
Control
Variable
r r2
Change in r2
ITBS-LC G-M LC .53*** .28 LCS .24* .05 .82
ITBS-LC LCS .68*** .46 G-M LC .44*** .19 .57
SAT-LC G-M LC .53*** .28 LCS .17* .03 .89
SAT-LC LCS .70*** .49 G-M LC .55*** .30 .39
G-M LC LCS .72*** .51 ITBS-LC .52*** .26 .49
G-M LC LCS .63*** .40 SAT-LC .42*** .18 .55
ITBS-RC G-M RC .61*** .37 RCS .17 .02 .95
ITBS-RC RCS .73*** .55 G-M RC .54*** .29 .47
SAT-RC G-M RC .67*** .45 RCS .42*** .18 .60
SAT-RC RCS .68*** .46 G-M RC .45*** .20 .56
G-M RC RCS .72*** .52 ITBS-RC .51*** .26 .50
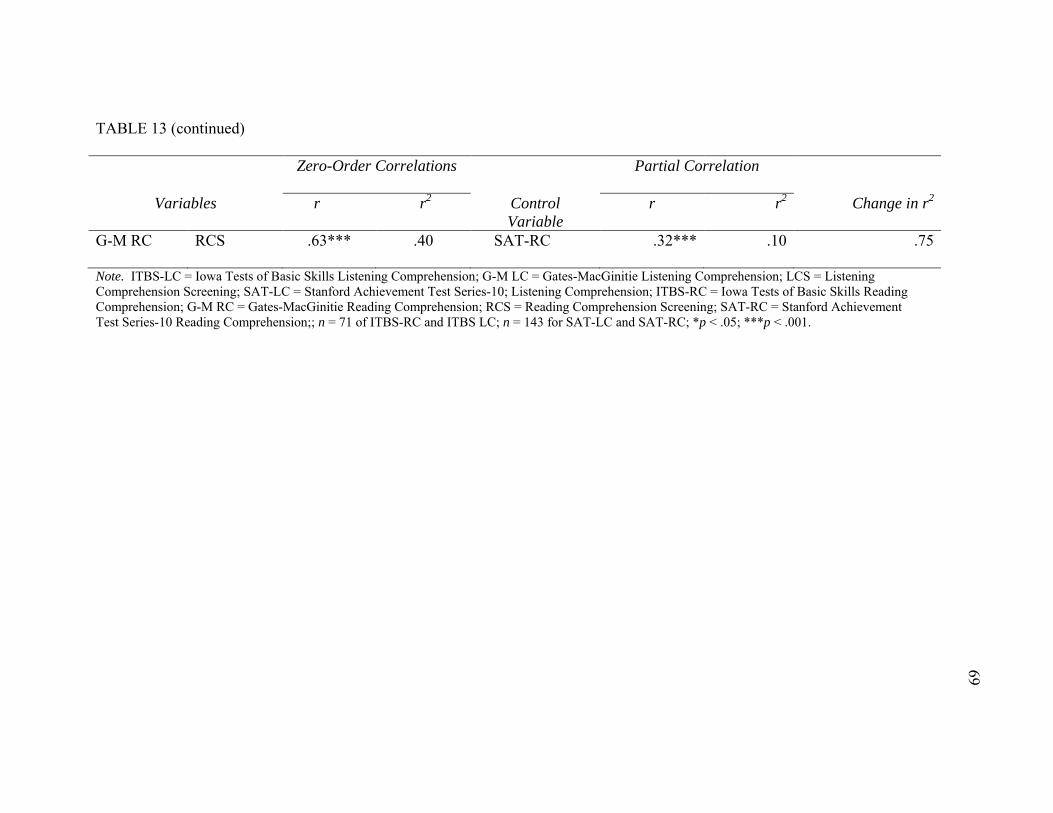
69
TABLE 13 (continued)
Zero-Order Correlations Partial Correlation
Variables r r2
Control
Variable
r
r2
Change in r2
G-M RC RCS .63*** .40 SAT-RC .32*** .10 .75
Note. ITBS-LC = Iowa Tests of Basic Skills Listening Comprehension; G-M LC = Gates-MacGinitie Listening Comprehension; LCS = Listening Comprehension Screening; SAT-LC = Stanford Achievement Test Series-10; Listening Comprehension; ITBS-RC = Iowa Tests of Basic Skills Reading Comprehension; G-M RC = Gates-MacGinitie Reading Comprehension; RCS = Reading Comprehension Screening; SAT-RC = Stanford Achievement Test Series-10 Reading Comprehension;; n = 71 of ITBS-RC and ITBS LC; n = 143 for SAT-LC and SAT-RC; *p < .05; ***p < .001.
70
As seen in Table 13, both ITBS-LC and G-M LC were correlated with the LCS, r
= .68 and r = .72, respectively. When the effects of the LCS were removed, the variance
accounted for by the relationship of ITBS-LC and G-M LC was 5%, an 82% change in r2.
ITBS-LC and the LCS were both correlated with G-M LC, r = .53 and r = .72. When the
effects of G-M LC were removed, the correlation between ITBS-LC and the LCS was
19%, a 57% change in r2. The common variance of the LCS and G-M LC was 26% when
the effects of ITBS were removed, 49% change in r2.
Both SAT-LC and G-M LC were correlated with the LCS, r = .70 and r = .63,
respectively. When the effects of the LCS were removed, the variance accounted for by
the relationship of SAT-LC and G-M LC was only 3%, an 89% change in r2. SAT-LC
and the LCS were both correlated with G-M LC, r = .53 and r = .63. When the effects of
G-M LC were removed, the correlation between SAT-LC and LCS was 30%, a 39%
change in r2.
The partial correlation analyses also suggested that the LCS shared common
information with the ITBS-LC and SAT-LC, which G-M LC did not share. As previously
mentioned, G-M LC was created from an alternate form of a G-M reading comprehension
test (i.e., Form S) and was not standardized as a listening comprehension measure.
Partial correlations with reading comprehension measures. ITBS-RC
correlated with G-M RC and the RCS, r = .61 and r = .73, respectively. When the effects
of the RCS were removed, only 2% of the variance was accounted for by the relationship
of ITBS-RC and G-M RC, a 95% change in r2. ITBS-RC and the RCS correlated with
G-M RC, r = .61 and r = .72, respectively. When the effects of G-M RC were removed,
29% of the variance was still accounted for by the relationship of ITBS-RC and RCS, a
71
change in r2 of only 47%. From these data, it would seem that the RCS shared more
information with ITBS-RC than did the G-M RC.
A different scenario emerged with the SAT-RC data. SAT-RC and G-M RC were
correlated with the RCS, r = .68 and r = .63, respectively. There was a 45% shared
variance between SAT-RC and G-M RC. When the effects of the RCS were removed,
18% of the variance was accounted for by the relationship of SAT-RC and G-M RC, a
60% change in r2. Similarly, there was a 46% shared variance between SAT-RC and the
RCS, both of which correlated with G-M RC, r = .67 and r = .63, respectively. When the
effects of G-M RC were removed, 20% of the variance was still accounted for by the
relationship of SAT-RC and the RCS, a 56% change in r2. When the effects of SAT-RC
were removed, the correlation between the RCS and G-M RC was 10%, a change of 75%
in r2.
In sum, the partial correlations suggested that relative to ITBS, the LCS and RCS
were at least moderately correlated. Additionally, the LCS and RCS shared a larger
common variance with ITBS-LC and ITBS-RC, (i.e., 19% and 29%, respectively) than
G-M LC or G-MRC (i.e., 5% and 2%, respectively) and would be better predictors of
performance on the ITBS. These results would provide evidence of discriminant validity
of the LCS and RCS. The partial correlations conducted relative to the SAT-10 indicated
that the correlation between the LCS and SAT-LC were at least moderate. The LCS
shared a 30% common variance with SAT-LC, which was greater than the variance SAT-
LC and G-M LC shared (3%). Here, the LSC would be a better predictor of performance
on the SAT-LC. However, the results also showed that even though the RCS and G-M
72
RC shared approximately the same variance with SAT-RC (i.e., 20% and 18%,
respectively), the two measures shared a common variance of only a 10%.
Structural Equation Modeling
To investigate the discriminant validity of the RCS further, the scores on the three
subtests of the LCS and the RCS (simple, local, and global inferential items) and the
three subtests that constitute the total G-M (reading comprehension, decoding, and
vocabulary) were examined using structural equation modeling (SEM). Scores from the
SAT-10 were also used.
SEM uses squares or rectangles to represent observed variables and circles or
ovals to represent latent variables. Single- and doubled-headed arrows represent
relationships between observed and/or latent variables. Klem (2000) described SEM as a
hybrid of factor analysis and path analysis:
The measurement part of the model corresponds to factor analysis and depicts
the relationships of the latent variables to the observed variables. The structural
part of the model corresponds to path analysis and depicts the direct and indirect
effects the latent variables on each other. In ordinary path analysis one models
the relationships between observed variables, whereas in SEM one models the
relationships between factors. (p. 230)
Maruyama (1998) suggested that SEM can be used to examine how well measured
variables explain an outcome variable as well as which latent variables are important in
predicting.
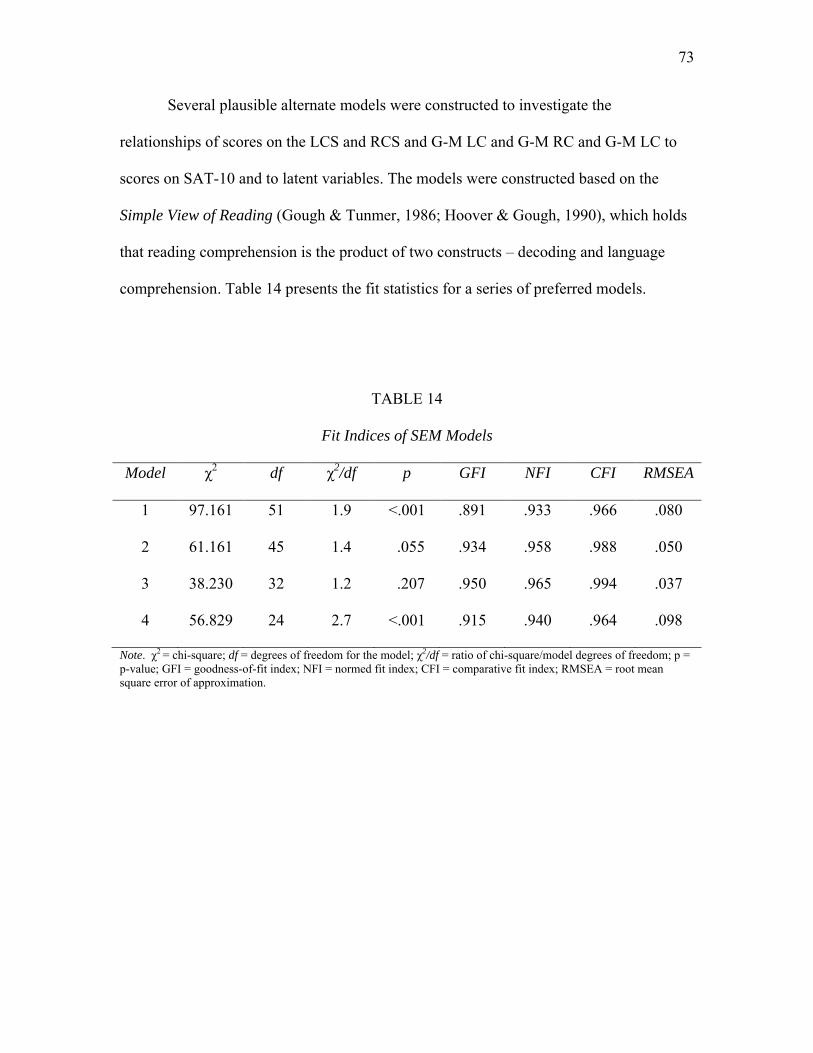
73
Several plausible alternate models were constructed to investigate the
relationships of scores on the LCS and RCS and G-M LC and G-M RC and G-M LC to
scores on SAT-10 and to latent variables. The models were constructed based on the
Simple View of Reading (Gough & Tunmer, 1986; Hoover & Gough, 1990), which holds
that reading comprehension is the product of two constructs – decoding and language
comprehension. Table 14 presents the fit statistics for a series of preferred models.
TABLE 14
Fit Indices of SEM Models
Model χ2
df χ2/df p GFI NFI CFI RMSEA
1 97.161 51 1.9 <.001 .891 .933 .966 .080
2 61.161 45 1.4 .055 .934 .958 .988 .050
3 38.230 32 1.2 .207 .950 .965 .994 .037
4 56.829 24 2.7 <.001 .915 .940 .964 .098
Note. χ2 = chi-square; df = degrees of freedom for the model; χ2/df = ratio of chi-square/model degrees of freedom; p = p-value; GFI = goodness-of-fit index; NFI = normed fit index; CFI = comparative fit index; RMSEA = root mean square error of approximation.
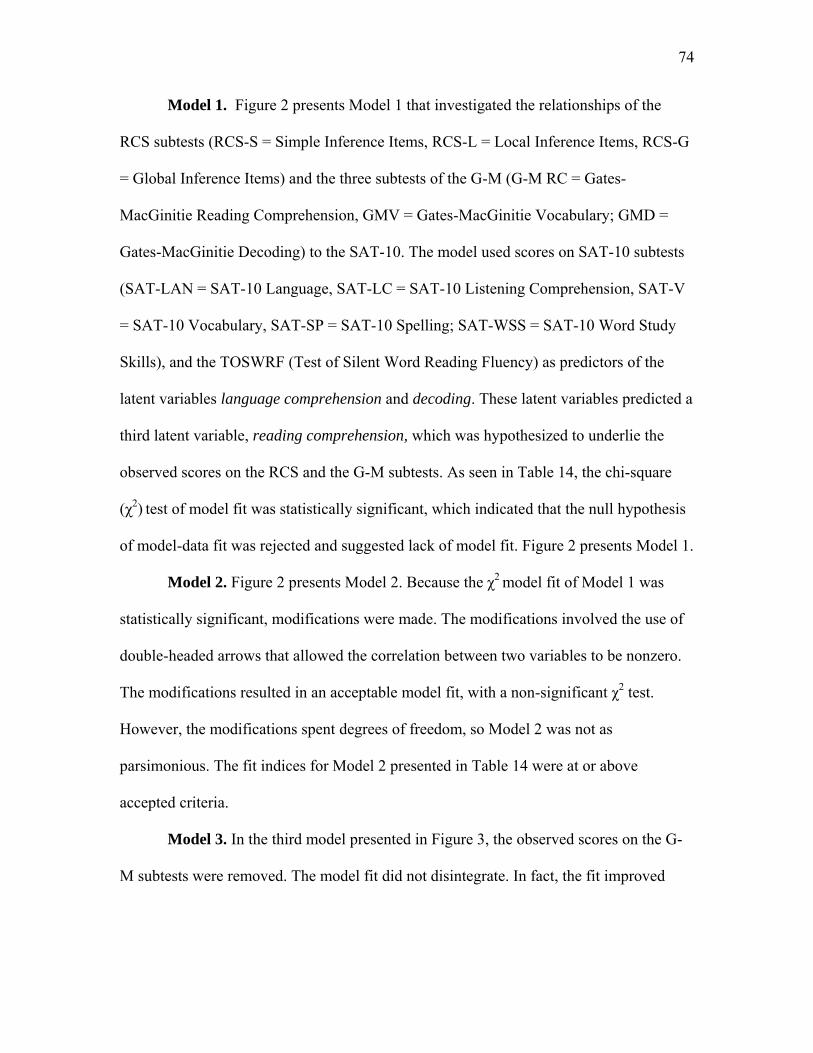
74
Model 1. Figure 2 presents Model 1 that investigated the relationships of the
RCS subtests (RCS-S = Simple Inference Items, RCS-L = Local Inference Items, RCS-G
= Global Inference Items) and the three subtests of the G-M (G-M RC = Gates-
MacGinitie Reading Comprehension, GMV = Gates-MacGinitie Vocabulary; GMD =
Gates-MacGinitie Decoding) to the SAT-10. The model used scores on SAT-10 subtests
(SAT-LAN = SAT-10 Language, SAT-LC = SAT-10 Listening Comprehension, SAT-V
= SAT-10 Vocabulary, SAT-SP = SAT-10 Spelling; SAT-WSS = SAT-10 Word Study
Skills), and the TOSWRF (Test of Silent Word Reading Fluency) as predictors of the
latent variables language comprehension and decoding. These latent variables predicted a
third latent variable, reading comprehension, which was hypothesized to underlie the
observed scores on the RCS and the G-M subtests. As seen in Table 14, the chi-square
(χ2) test of model fit was statistically significant, which indicated that the null hypothesis
of model-data fit was rejected and suggested lack of model fit. Figure 2 presents Model 1.
Model 2. Figure 2 presents Model 2. Because the χ2 model fit of Model 1 was
statistically significant, modifications were made. The modifications involved the use of
double-headed arrows that allowed the correlation between two variables to be nonzero.
The modifications resulted in an acceptable model fit, with a non-significant χ2 test.
However, the modifications spent degrees of freedom, so Model 2 was not as
parsimonious. The fit indices for Model 2 presented in Table 14 were at or above
accepted criteria.
Model 3. In the third model presented in Figure 3, the observed scores on the G-
M subtests were removed. The model fit did not disintegrate. In fact, the fit improved
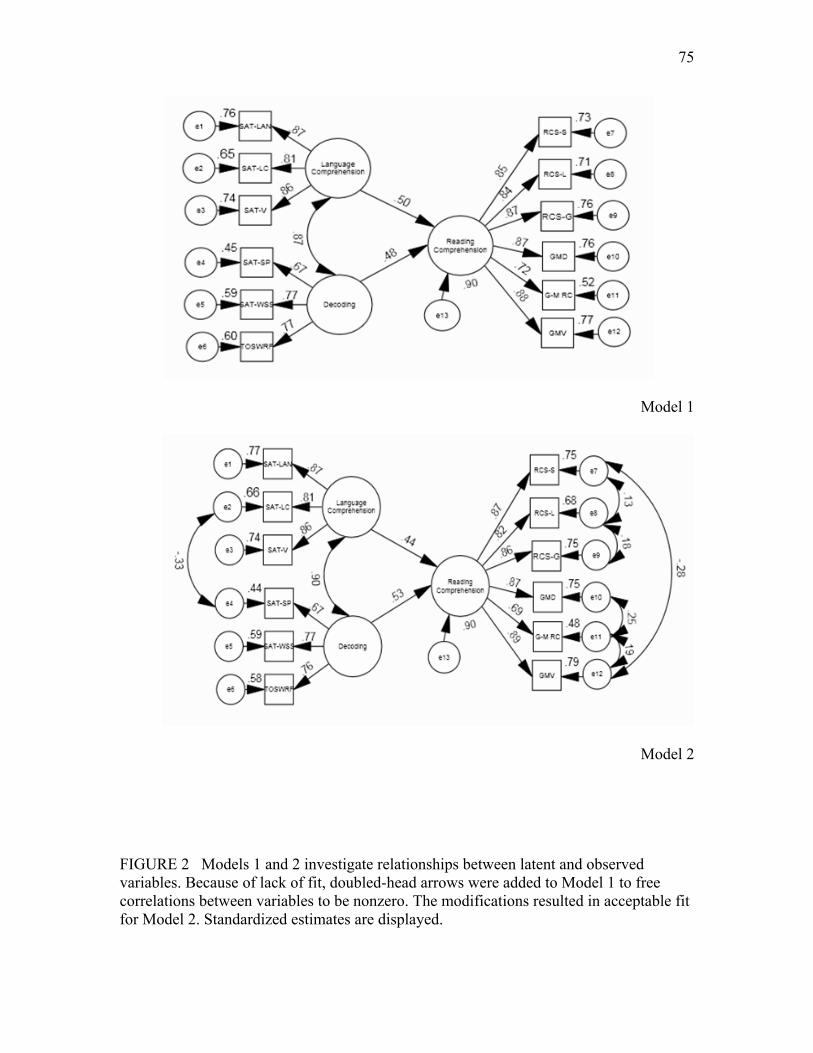
75
Model 1
Model 2
FIGURE 2 Models 1 and 2 investigate relationships between latent and observed variables. Because of lack of fit, doubled-head arrows were added to Model 1 to free correlations between variables to be nonzero. The modifications resulted in acceptable fit for Model 2. Standardized estimates are displayed.
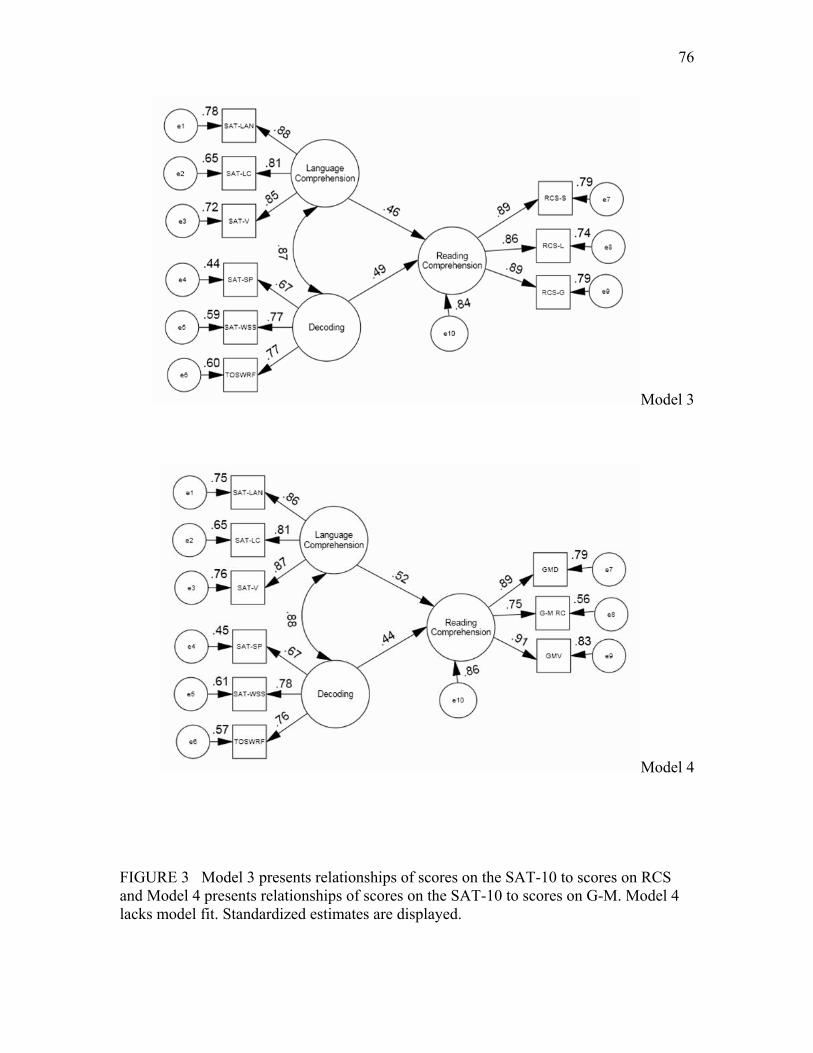
76
Model 3
Model 4
FIGURE 3 Model 3 presents relationships of scores on the SAT-10 to scores on RCS and Model 4 presents relationships of scores on the SAT-10 to scores on G-M. Model 4 lacks model fit. Standardized estimates are displayed.
77
without the modifications used in Model 2. The χ2 test was non-significant. The fit
indices for Model 3 presented in Table 14 were all above accepted criteria.
Model 4. Figure 3 also presents the fourth model. In Model 4, the observed scores
on the RCS subtests were removed. The χ2 test was non-significant, which would indicate
lack of model fit. Additionally, as presented in Table 14, the root-mean-square error of
approximation (RMSEA) was approaching .01, which would indicate poor model fit. In
Model 2, the effects of the measured variables associated with the latent variables
language comprehension and decoding were strong ( .69). The relationships of language
comprehension and decoding to reading comprehension were .44 and .53, respectively.
The relationships of reading comprehension to the observed variables were strong ( .69).
Estimates in the model to consider are 1) the correlation coefficient of language
comprehension and decoding, and 2) the variance accounted for by the model. The
correlation of .90 between language comprehension and decoding would suggest that the
two latent variables were not distinguishable factors. However, the correlations between
the factors were smaller in Models 3 and 4, .87 and .88, respectively. In all models, the
predictors were scores from SAT-10 subtests. More and varied predictors in future
studies with larger sample sizes could help to differentiate the two factors.
The variance of reading comprehension accounted for by Model 1 was only 10%.
When the effects of the G-M subtests were removed, the variance accounted by Model 4
for was 14%. When the effects of the RCS subtests were removed, the variance of
reading comprehension accounted for by Model 3 was 16%. The variance of reading
comprehension accounted for by Models 3 and 4 were relative to the SAT-10. Again,
more and varied predictors in future studies with larger sample sizes would provide a
78
more exact understanding of how much of the variance of reading comprehension can be
accounted for by the RCS under different circumstances.
The contrast of Models 3 and 4 provided evidence of the discriminant validity of
the RCS. The addition of LCS subtest and G-M LC to Model 1 or 2 would have provided
more evidence of the discriminant validity of the LCS. However, such an analysis was
not possible in the present study. To add three variables on the LCS and two variables on
the G-M LC to Model 1 or 2 would have exceeded the recommended case/variable ratio
for an SEM analysis. In general, to have confidence in SEM results, it is recommended
that there are a minimum of 10 cases per observed variable (Klem, 2000), with more than
10 cases per variable being preferred (Thompson, 2000). There were 12 variables in
Models 1 and 2. To add four variables, for example, would have reduced the ratio to
about eight cases per observed variable for the present sample and limited the evidence of
discriminant validity. Therefore, future investigations of the discriminant validity of the
LCS as evidenced by a SEM or other factorial analysis are needed.
Discussion
Learning to read requires innumerable insights, abilities, and skills. Learning to read is
not easy and is not a natural act (Gough & Hillinger, 1980). That said, the SVR (Gough
& Tunmer, 1986) does not undermine the complexity of learning to read; rather, the SVR
provides a conceptual framework for designing instruction and pinpointing difficulties
students may experience in learning to read. To identify deficiencies and adjust
instruction to remediate the deficiencies, a teacher needs data. However, reading
comprehension assessments that can provide those data do not always measure the same
79
competencies. This does not make any one test inherently good or bad or one test better
than another. Simply, care must to be taken to choose the right tests for the intended
purpose or purposes. Cain and Oakhill (2006) noted, “No assessment tool is perfect.
However, awareness of the strengths and weaknesses of each one will guide our selection
of the most appropriate assessment for our needs and also our interpretation of test
scores” (p. 699).
The intent of the present study was to investigate the discriminant validity of the
LCS and RCS. Partial correlations conducted with scores from the ITBS provided
evidence of the discriminant validity of the LCS. Partial correlations conducted with
scores from the SAT-10 provided evidence of the discriminant validity of the LCS.
Partial correlations supported the discriminant validity of the RCS. However,
partial correlation analyses with scores on the SAT-10 did not fully support the evidence
of the discriminant validity of the RCS. Further investigation conducted with SEM
analyses provided further promising evidence. In the SEM analyses, the removal of the
RCS subtest from a model that investigated the effects of the RCS and G-M subtests on
the variance accounted of reading comprehension produced a model with acceptable fit.
When the effects of the G-M subtest were removed, the produced model lacked fit with
the data. In sum, the partial correlations and SEM analyses, supported evidence of the
discriminant validity of the LCS and RCS.
With many frequently used early literacy screening measures and standardized
tests, there is no way to identify a student‟s “unexpected underachievement.” In other
words, if assessments of decoding and reading comprehension are not accompanied with
a listening comprehension measure, then a student may look like an average reader when,
80
in fact, the student may be functioning well below his or her potential. The contrast
between performance on the LCS and RCS will identify students with this profile. The
ability to identify such student profiles raises the accountability bar from grade-level
achievement to full-potential achievement. Additionally, this profile could be an
indication of dyslexia. Although performance on the LCS and RCS alone is not sufficient
for a definitive diagnosis of dyslexia, such performance certainly would aid the
identification of a student who could be at risk for dyslexia. Future research is needed to
empirically document the contrast of LCS scores and RCS scores.
Limitations
A limitation of the present study is that the sample was not representative of the U.S.
population. It is not known how well the LCS and RCS will generalize to a population
that is a more representative cannot be determined. A next step is to develop norms for
the LCS and RCS with samples that better reflect the U.S. population. Because test score
validation is an ongoing process, further administration would provide further evidence
of the discriminant validity of the LCS and RCS.
81
CHAPTER IV
SUMMARY AND DISCUSSION
The premise of the Simple View of Reading (Gough & Tunmer, 1986) is that reading
comprehension is comprised of two separable yet necessary components – decoding and
language comprehension. In a recent study that used the SVR framework with children in
the US and Canada, Kendeou, Savage, et al. (2009) stated:
…our argument is that the D [decoding] and LC [language comprehension]
constructs are general features of reading comprehension. For this reason the D
and LC constructs are evident in factorial analysis of the diverse measures of
these constructs undertaken independently by two research teams in different
countries. In this sense, the present findings provide important support for the
generality and validity of the SVR framework as a model of reading and as a
guiding principle for policy makers seeking to employ maximally effective
interventions in the field. (p. 365)
The study by Kendeou, Savage, et al. (2009) suggested that student strengths and
weaknesses in decoding and language comprehension should inform appropriate
instructional decisions to assist students in developing proficiency in reading
comprehension. As Francis et al. (2006) surmised:
It makes little sense to focus instruction exclusively on strategies for
comprehension with students whose word reading skills are deficient or who have
inadequate knowledge of meaning of the words used in the text. Alternately, it
makes little sense to focus time and instructional attention on comprehension
82
strategies with students who are already strategic readers but whose
comprehension is hampered by failures of fluency or word knowledge.
(p. 302)
Hence, assessment of students‟ strengths and weaknesses is critical to ensuring that the
correct instructional decisions are made.
Two manuscripts presented studies that reported the development and validation
of a listening comprehension screening (LCS) and a reading comprehension screening
(RCS). The studies were designed to answer the following questions:
1) What is the technical adequacy of parallel group-administered listening and
reading comprehension screening measures that general classroom teachers
can use to inform instructional decisions for end-of-second-grade students?
2) Can the listening and reading comprehension screening measures be
differentiated from the Gates-MacGinitie Reading Tests (G-M; MacGinitie et
al., 2006) as a definitive assessment of reading comprehension for classroom
use?
Listening and Reading Comprehension Screening Measures
Aaron, Joshi, and Williams (1999) noted that when students were identified by their
relative strengths and weaknesses in decoding or language comprehension and instruction
was targeted to students‟ weaknesses, gains in reading comprehension were observed.
Difficulties with decoding can be determined with a comparison of students‟ performance
in listening comprehension and reading comprehension. A discrepancy between high
listening comprehension and low reading comprehension would suggest weaknesses in
83
decoding. Poor language comprehension would be suggested by low performance in both
listening and reading comprehension.
So, it would seem that the comparison of language comprehension and reading
comprehension is important in identifying students‟ needs. However, standardized
reading comprehension assessments may not provide measures that assess language
comprehension. Evaluation of language comprehension on purely reading-based
comprehension measures can be compromised by inefficient decoding skills.
Therefore, parallel group-administered listening comprehension and reading
comprehension screening measures were developed to assess end-of-second-grade
students‟ decoding skills and language comprehension, particularly the ability to make
inferences. Group-administered tests are more economical in terms of time and ecological
in terms of how reading comprehension is usually measured. End-of-second-grade was
targeted because third grade is a watershed year, where students transition from the
“learning-to-read” stages of reading development to the “reading-to-learn” stages (Chall,
1983). If the instructional needs of students are known at the end of second grade, then
placements and other decisions can be made so that students receive the most appropriate
instruction from the commencement of third grade.
The Trustworthiness and Usefulness of LCS and RCS
Test Score Reliability and Validity
The first manuscript described the development of the LCS and RCS. Preliminary
versions of each measure contained 75 items that required examinees to make inferences
within, among, or beyond a sentence or group of sentences. The preliminary versions of
the LCS and RCS were administered to 699 end-of-second-grade students. The items on
84
the preliminary LCS and RCS were calibrated using one- and two-parameter logistic item
response theory (IRT) models. Using IRT-based criteria, the items were evaluated for
inclusion on the final shorter versions of the LCS and RCS.
The first manuscript also presented evidence of the trustworthiness of the final
versions of the LCS and RCS. The score reliability (Cronbach‟s alpha) of the final
version of the LCS was estimated to be .89, and the score reliability of the final version
of the RCS was estimated to be .93. Various aspects of test score validity – content,
criterion-related (concurrent and predictive), and construct – were examined. The
evidence suggested that the scores on the final LCS and RCS were reliable and valid. A
confirmatory factor analysis advanced evidence of a single underlying construct for each
measure. In sum, the evidences suggested that LCS and RCS are promising tools for the
identifying student strengths and weaknesses.
Discriminant Validity of the LCS and RCS
To examine whether the LCS and RCS determine student strengths and weaknesses
commensurately with the Gates-MacGinitie Reading Tests (G-M; MacGinitie et al.,
2006), partial correlations and structural equation modeling analyses were performed and
were reported in the second manuscript. Seventy-one participants in the study had
completed the Iowa Tests of Basic Skills (ITBS). Partial correlation analyses using scores
on the ITBS provided evidence of discriminant validity. While controlling for a third
variable, the variance accounted for by the relationship of the LCS and ITBS was larger
than the relationship of the G-M LC and ITBS. The same was true with the relationships
of the RCS and the ITBS. The LCS and RCS common variances with the G-M LC and
85
G-M RC were 26%. The partial correlation analyses with ITBS scores provided evidence
of the discriminant validity of the LCS and RCS.
One-hundred forty-three participants had completed the Stanford Achievement
Test Series, Tenth Edition (SAT-10). Scores on the SAT-10 were used for comparison
with the RCS and the G-M RC. The results of partial correlation analyses suggested that
the scores on the LCS demonstrated evidence of discriminant validity. The evidence of
discriminant validity of the RCS was less decisive.
However, structural equation modeling (SEM) was used to further investigate
scores on the RCS subtests and scores on the three subtests of the G-M (reading
comprehension, decoding, and vocabulary) using SEM analyses. A comparison of two
models provided further evidence of the discriminant validity of the RCS.
Use of the LCS and RCS
The intent of the LCS and RCS was to inform instructional decisions. Scoring scales
were created to aid in the identification of students who may have weaknesses in
decoding, language comprehension, or both. The scales contain IRT-ability scores,
standard scores based on a normal distribution (i.e., mean of 100 with a standard
deviation of 15), Normal Curve Equivalents (i.e., NCEs; mean of 50 with a standard
deviation of 21.06), and percentile ranks.
Attention needs to be directed to students whose scores fall below the 40th
percentile on either or both the LCS and RCS. The 40th percentile represents the cut-point
between average and low and below average performance. Although many students who
fall just below the 40th percentile may not be “at-risk,” the intent of the LCS and RCS is
86
to inform instruction and not to determine eligibility or ineligibility for special services or
to diagnose a learning disability. If students are not in the average range, only instruction
that is targeted to the students‟ instructional needs will move them to the average range or
above. Ultimately, students‟ response to instruction will determine if the instruction is
appropriate or necessary.
Although, the contrast of scores on the LCS and RCS will identify a student‟s
decoding deficits, the exact cause of the decoding deficit will not be readily evident.
Fortunately, a robust body of research has delineated how to assess and teach decoding
skills and underlying processes (cf. NICHD, 2000; Wagner, Torgesen, & Rashotte, 1999;
Wanzek & Vaughn, 2007). The use of the LCS and RCS as a whole-class screening
instrument and supplemented with one of readily available decoding assessments would
be an effective screening battery for identifying decoding deficits and pinpointing
underlying causes.
Low performance on both the LCS and RCS is an indication of inadequate
language comprehension, but the exact cause of the language comprehension deficit will
not be readily evident. Unfortunately, the research delineating the underlying processes
and assessment of language comprehension is not as robust or as clearly defined as is the
body of research for decoding and further research is needed. For now, students who
demonstrate difficulties in language comprehension more than likely would benefit from
instruction that increases oral language and background knowledge. Additionally,
instruction as outlined in Yuill and Oakhill (1988) would be beneficial in improving
students‟ ability to integrate information and make inferences.
87
Despite the inability to pinpoint exact causes of decoding and language
comprehension deficits, the LCS and RCS can provide information not available on other
measures. When used as a supplement to other measures, the LCS and RCS can inform
instructional decisions for end-of-second-grade students that will lead to reading success.
Conclusions and Future Steps
Reading comprehension is the ultimate goal of reading instruction. Proficient reading
comprehension is essential to academic achievement and economic opportunity as well as
quality of life. Third grade is a pivotal year for reading development. If the most
appropriate instruction to meet each student‟s needs is begun on day one of third grade,
then students will accomplish the critical goal of “learning to read” (Chall, 1983). The
LCS and RCS can provide data to inform instructional decisions for end-of-second-grade
and beginning-of-third-grade students to ensure reading success.
A number of future steps emerged from the analyses in the studies presented in
the two manuscripts. A first step involves the limitation that the samples in the studies
were not representative of the U.S. population. Hence, it is not known how well the
results of the studies will generalize to a population that is more representative. New
norms established through further administrations of the final versions of the LCS and
RCS to populations that are representative of the U.S. population will aid in generalizing
the results. Additionally, because validation is an ongoing process, the future
administrations will provide more evidence to promote the test score validity of the LCS
and RCS.
88
Students who have low scores on both the LCS and RCS have language
comprehension deficits that may or may not be accompanied by decoding deficits. The
SVR holds that language comprehension and decoding are necessary components of
comprehension but not sufficient alone (Gough & Tunmer, 1986). However, technology
is advancing to a point where decoding is not the sole means of obtaining information
from a printed page. Through different technologies, the reader can listen to a
computerized rendering of a printed page. This is not to say that decoding instruction
does not need to be taught; this is to say that the role of decoding is changing with
technological advances. What will not change with technological advancements is the
need for language comprehension whether the reader is reading or listening. Although the
LCS and RCS can identify students with language comprehension deficits, the exact
cause is not readily apparent. A second important step is to define students‟ language
comprehension deficits at a more granular level.
One solution to pinpointing the underlying cause of a language comprehension
deficit is to couple the LCS and RCS results with other tests of language comprehension.
For example, August, Francis, Hsu, and Snow (2006) recently determined to construct a
reading comprehension assessment – Diagnostic Assessment of Reading (DARC) – that
specifically would measure text memory, text access, knowledge access, and knowledge
integration. The authors controlled the readability of texts and the vocabulary and
background knowledge needed to read and answer true-false questions. Through a series
of latent variable models, the authors differentiated the DARC as a reading
comprehension assessment that was dependent on language processing with a limited
dependence on decoding and word recognition (Francis et al., 2006). If a student
89
performs poorly on the LCS and the RCS, inadequate language comprehension can be
assumed. Coupling the LCS and RCS with an assessment like the DARC would help to
identify the underlying cause of the student‟s language comprehension deficit. If the
student also performs poorly on the DARC, poor language processing is most likely the
cause.
Another solution to isolating the underlying causes of a student‟s language
comprehension difficulties would involve careful examination of participants‟ responses
to all items on the preliminary and final versions of the LCS and RCS. Examining the
responses of participants at different ability levels on the LCS and RCS may give clues as
to what items are difficult for whom and why. Understanding why items are difficult and
for whom the items are difficult might aid the identification of an underlying cause and
inform the instruction that would be most beneficial for students with poor language
comprehension.
A third future step is to adapt the LCS and RCS to computerized testing. Adaptive
computerized testing capitalizes on IRT by matching item difficulty with examinee
ability. The examinee‟s ability is estimated and items with difficulty levels that are close
to the examinee‟s ability are presented. The computer continues to generate items until a
certain number of items have been answered, a certain score has been attained, or there
are no more items left. Not every examinee needs to answer every item. Advantages of
adaptive computerized testing are 1) an examinee‟s ability can be estimated, 2) fewer
items can be presented, and 3) administration and scoring can be accomplished
independently from the teacher. Nonetheless, whether on paper or ultimately presented
on a computer, the LCS and RCS show promise for providing teachers with data that will

90
inform instructional decisions for end-of-second-grade students that will lead to reading
success.
The final versions of the LCS and RCS and the scoring scales are available gratis
at www.readingteachersnetwork.org.
91
REFERENCES
Aaron, P. G. (1997). The impending demise of the discrepancy formula. Review of
Educational Research, 67, 461-502.
Aaron, P. G., & Joshi, R. M. (2009). Why the component model of reading should drive
instruction. Perspectives, 35(4), 35-44.
Aaron, P. G., Joshi, R. M., & Phipps, J. (2004). A cognitive tool to diagnose
predominantly inattentive ADHD behavior. Journal of Attention Disorders, 7,
125-135.
Aaron, P. G., Joshi, R. M., & Williams, K. A. (1999). Not all reading disabilities are the
same. Journal of Learning Disabilities, 32(2), 120-132.
Ackerman, B. P., & McGraw, M. (1991). Constraints on the causal inferences of children
and adults in comprehension stories. Journal of Experimental Child Psychology,
51, 364-394.
Adams. M. J. (1990). Beginning to read: Thinking and learning about print. Cambridge,
MA: MIT Press.
Adams, M. J. (2010, October). Learning to read: What’s hard developmentally was also
hard historically. Paper presented at the 61st Annual Conference of The
International Dyslexia Association, Phoenix, AZ.
Aiken, L. R. (2000). Psychological testing and assessment (8th ed.). Needham Heights,
MA: Allyn & Bacon.
Alonzo, J., Basaraba, D., Tindel, G., & Carriveau, R. S. (2009). They read, but how well
do they understand?: An empirical look at the nuances of measuring reading
comprehension. Assessment of Effective Instruction, 35, 34-44.
92
Anmarkrud, Ø., & Bråten, A. (2009). Motivation for reading comprehension. Learning
and Individual Differences, 19, 252-256.
August, D., Francis, D. J., Hsu, H.-Y. A., & Snow, C. (2006). Assessing reading
comprehension in bilinguals. The Elementary School Journal, 107, 221-238.
Baumann, J. F. (2009). Intensity in vocabulary instruction and effects on reading
comprehension. Topics in Language Disorders, 29, 312–328.
Beck, I. L., McKeown, M. G., & Kucan, L. (2002). Bringing words to life: Robust
vocabulary instruction. New York: Guilford Press.
Blachman, B. A., Fletcher, J. M., Cloman, S. M., Schatschneider, C., Francis, D. J.,
Shaywitz, B. A. et al. (2004). Effects of intensive reading remediation for second
and third graders and a 1-year follow-up. Journal of Educational Psychology,
96(3), 444–461.
Bowyer-Crane, C., & Snowling, M. J. (2005). Assessing children‟s inference generation:
What do tests of reading comprehension measure? British Journal of Educational
Psychology, 75, 189–201.
Brady, S., & Moats, L. C. (1997). Informed instruction for reading success: Foundations
for teacher preparation: A position paper of The Orton Dyslexia Society.
Baltimore, MD: The Orton Dyslexia Society.
Bruck, M. (1990). Word-recognition skills of adults with childhood diagnoses of
dyslexia. Developmental Psychology, 46, 439-454.
Cain, K., & Oakhill, J. (1999). Inference making ability and its relation to comprehension
failure in young children. Reading and Writing, 11, 489–503.
93
Cain, K., & Oakhill, J. (2006). Assessment matters: Issues in the measurement of reading
comprehension. British Journal of Educational Psychology, 76, 697–708.
Cain, K., & Oakhill, J. (2007). Reading comprehension difficulties. In K. Cain, & J.
Oakhill (Eds.), Children’s comprehension problems in oral and written language:
A cognitive perspective (pp.41-75). New York: Guildford Press.
Cain, K., Oakhill, J. V., Barnes, M. A., & Bryant, P. (2001). Comprehension skill,
inference-making ability, and their relation to knowledge. Memory & Cognition,
29, 850-859.
Cain, K., Oakhill, J. V., & Elbro, C. (2003). The ability to learn new word meanings from
context by school-age children with and without language comprehension
difficulties. Journal of Child Language, 30, 681-694.
Carr, S., & Thompson, B. (1996). The effects of prior knowledge and schema activation
strategies on the inferential comprehension of children with or without learning
disabilities. Learning Disability Quarterly, 19, 48-61.
Castles, A., Coltheart, M., Wilson, K., Valpied, J., & Wedgewood, J. (2009). The genesis
of reading ability: What helps children learn letter-sound correspondences?
Journal of Experimental Child Psychology, 104, 68-88.
Catts, H. W., Adolf, S. M., & Ellis Weismer, S. (2006). Language deficits in poor
comprehenders: A case for the simple view of reading. Journal of Speech
Language, and Hearing Research, 49, 278-298.
Catts, H. W., Hogan, T. P., & Adlof, S. (2005). Developmental changes in reading and
reading disabilities. In H. W. Catts & A. G. Kamhi (Eds.), The connections
between language and reading disabilities (pp. 25-40). New York: Erlbaum.
94
Catts, H. W., Hogan, T. P., & Fey, M. E. (2003). Sub-grouping poor readers on the basis
of individual difference in reading related abilities. Journal of Learning
Disabilities, 36(3), 151-164.
Chall, J. S. (1983). Stages of reading development. New York: McGraw-Hill.
Chen, R., & Velluntino, F. R. (1997). Prediction of reading ability: A cross-validation
study of the simple view of reading. Journal of Literacy Research, 29, 1-24.
Crocker, L., & Algina, J. (2008). Introduction to classical & modern test theory. Mason,
OH: Cengage Learning.
Cunningham, A. E., & Stanovich, K. E. (1997). Early reading acquisition and its relation
to reading experience and ability 10 years later. Developmental Psychology, 33,
934-945.
Cutting, L. E., & Scarborough, H. S. (2006). Prediction of reading comprehension:
Relative contributions of word recognition, language proficiency, and other
cognitive skills can depend on how comprehension is measured. Scientific Studies
of Reading, 10, 277-300.
Ehri, L. C. (2005). Learning to read words: Theories, findings and issues. Scientific
Studies of Reading, 9, 167-188.
Fan, X. (1998). Item response theory and classical test theory: An empirical comparison
of their item/person statistics. Educational and Psychological Measurement, 58,
357-381.
Ferrer, E., Shaywitz, B. A., Holahan, J. M., Marchione, K., & Shaywitz, S. E. (2009).
Uncoupling of reading and IQ over time: Empirical evidence for a definition of
dyslexia. Association for Psychological Science, 21, 93-101.
95
Fletcher, J. M., Denton, C., & Francis, D. J. (2005). Validity of alternative approaches for
the identification of learning disabilities: Operationalizing unexpected
underachievement. Journal of Learning Disabilities, 38, 545-552
Fletcher, J. M., Francis, D., Morris, R. D., & Lyon, G. R. (2005). Evidence-based
assessment of learning disabilities in children and adolescents. Journal of Clinical
Child and Adolescent Psychology, 34, 506-522.
Fletcher, J. M., & Vaughn, S. (2009). Response to intervention: Preventing and
remediating academic difficulties. Child Development Perspectives, 3, 30-37.
Francis, D. J., Fletcher, J. M., Catts, H. W., & Tomblin, J. B. (2005). Dimensions
affecting the assessment of reading comprehension. In S. G. Paris & S. A. Stahl
(Eds.), Children’s reading comprehension and assessment (pp. 369-394).
Mahwah, NJ: Erlbaum.
Francis, D. J., Fletcher, J. M., Stuebing, G., Lyon, G. R., Shaywitz, B. A., & Shaywitz, S.
E. (2005). Psychometric approaches to the identification of LD: IQ and
achievement scores are not sufficient. Journal of Learning Disabilities, 38(2), 98-
108.
Francis, D. J., Snow, C. E., August, D., Carlson, C. D., Miller, J., & Iglesias, A. (2006).
Measures of reading comprehension: A latent variable analysis of the diagnostic
assessment of reading comprehension. Scientific Studies of Reading, 10, 301-322.
Freebody, P., & Anderson, R. C. (1983). Effects of vocabulary difficulty, text cohesion,
and schema availability on reading comprehension. Reading Research Quarterly,
18, 277-294.
96
Fuchs, D., & Fuchs, L. S. (2006). Introduction to response to intervention: What, why,
and how valid is it? Reading Research Quarterly, 1, 93-99.
Good, R. H., & Kiminski, R. A. (1996). Assessment for instructional decisions: Toward a
proactive/prevention model of decision-making for early literacy skills. School
Psychology, 11, 326-336.
Good, R. H., & Kiminski, R. A. (2002). Dynamic indicators of basic early literacy skills
(DIBELS). Eugene, OR: Institute for the Development of Education Achievement.
Gough, P. B., & Hillinger, M. L. (1980). Learning to read: An unnatural act. Bulletin of
the Orton Society, 30, 179–196.
Gough, P. B., & Tunmer, W. E. (1986) Decoding, reading, and reading disability.
Remedial and Special Education, 7, 6-10.
Gregory, R. J. (2011). Psychological testing: History, principles, and applications (6th
ed.). Boston, MA: Pearson.
Hagley, F. (1987). The Suffolk reading scale. Windsor, UK: NFER-Nelson.
Hambleton, R. K., & Swaminathan, H. (1985). Item response theory: Principles and
applications. Boston, MA: Kluwer-Nijhoff Publishing.
Hambleton, R. K., Swaminathan, H., & Rogers, J. (1991). Fundamentals of item response
theory. Newbury Park, CA: Sage.
Hart, B., & Risley, T. R. (1995). Meaningful differences in the everyday experience of
young American children. Baltimore MD: Brookes Publishing Co.
Harcourt Assessments (2003). Stanford achievement test series, tenth edition. San
Antonio, TX: Pearson Assessment & Information.
97
Healy, J. M. (1982). The enigma of hyperlexia. Reading Research Quarterly, 17, 319-
338.
Healy, J. M., Abram, D. M., Horwitz, S. J., & Kessler, J. W. (1982). A study of
hyperlexia. Brain and Language, 17, 1-23.
Henard, D. H. (2000). Item response theory. In L. H. Grimm & P. R. Yarnold (Eds.),
Reading and understanding more multivariate statistics (pp. 309-330).
Washington, DC: American Psychological Association.
Henry, M. K. (1988). Beyond phonics: Integrating decoding and spelling instruction
based on word origin and structure. Annals of Dyslexia, 38, 259-277.
Henry, M. K. (2003). Unlocking literacy: Effective decoding and spelling instruction.
Baltimore, MD: Paul H. Brookes Publishing Co.
Hoover, W. A., & Gough, P. B. (1990). The simple view of reading. Reading and
Writing, 2, 127-160.
Individuals with Disabilities Education Improvement Act of 2004, II.R. 1350, 108.
Iowa Testing Programs. (2008). Iowa tests of basic skills. Rolling Meadows, IL:
Riverside Publishers.
Joshi, R. M., Williams, K. A., & Wood, J. R. (1998). Predicting reading comprehension
from listening comprehension: Is this the answer to the I.Q. debate? In C. Hulme
& R. M. Joshi (Eds.), Reading and spelling: Development and disorder (pp. 319-
327). Mahwah, NJ: Lawrence Erlbaum Associates.
Juel, C. (1988). Learning to read and write: A longitudinal study of 54 children from first
to fourth grades. Journal of Educational Psychology, 80, 437-447.
98
Kavale, K. A. (2005). Identifying specific learning disability: Is responsiveness to
intervention the answer? Journal of Learning Disabilities, 38(6), 553-562.
Kavale, K. A., Kauffman, A. S., Bachmeier, R. J., & LeFevers, G. B. (2008). Response-
to- intervention: Separating the rhetoric of self-congratulation from the reality of
specific learning disability identification. Learning Disability Quarterly, 31, 135-
150.
Keenan, J., & Betjemann, R. (2006). Comprehending the Gray Oral Reading Test without
reading it: Why comprehension tests should not include passage-independent
items. Scientific Studies of Reading, 10, 363-380.
Keenan, J., Betjemann, R, & Olson, R. (2009). Reading comprehension tests vary
in the skills they assess: Differential dependence on decoding and oral
comprehension. Scientific Studies of Reading, 12, 281–300.
Kendeou, P., Savage, R., & van den Broek, P. (2009). Revisiting the simple view of
reading. British Journal of Educational Psychology, 79, 353-370.
Kendeou, P., van den Broek, P., White, M. J., & Lynch, J. S. (2009). Predicting reading
comprehension in early elementary school: The independent contributions of oral
language and decoding skills. Journal of Educational Psychology, 101, 765-778.
Klem, L. (2000). Structural equation modeling. In L. G. Grimm & P. R. Yarnold (Eds.),
Reading and understanding more multivariate statistics (pp. 227-260).
Washington, DC: American Psychological Association.
Kintsch, W., & Kintsch, E. (2005). Comprehension. In S. G. Paris & S. A. Stahl (Eds.),
Children’s reading comprehension and assessment (pp. 71-92). Mahwah, NJ:
Erlbaum.
99
LaBerge, D., & Samuels, S. J. (1974). Toward a theory of automatic information
processing in reading. Cognitive Psychology, 6, 293-323.
Liberman, I. Y., Shankweiler, D., & Liberman, A. M. (1989). The alphabetic principle
and learning to read. In D. Shankweiler & I. Y. Liberman (Eds.), Phonology and
reading disabilities: Solving the reading puzzle (pp. 1-33). Ann Arbor: University
of Michigan Press.
Lyon, G. R. (1996, Spring). Learning disabilities. The Future of Children 6(4), 54-76.
Lyon, G. R., Shaywitz, S. E., & Shaywitz, B. A. (2003). A definition of dyslexia. Annals
of Dyslexia, 53, 1-14.
MacGinitie, W. H., MacGinitie, R. K., Maria, K., Dreyer, L. G., & Hughes, K. A. (2006).
Gates-MacGinitie reading tests. Itasca, IL: Riverside Publishing.
Maruyama, G. M (1998). Basics of structural equation modeling. Thousand Oaks, CA:
Sage.
Mather, N., Hammill, D. D., Allen, A. A., & Roberts, R. (2004). Test of silent word
reading fluency. Austin, TX: Pro-Ed.
Mathes, P. G., Denton, C. A., Fletcher, J. M., Anthony, J. L., Francis, D. J., &
Schatschneider, C. (2005). The effects of theoretically different instruction and
student characteristics on the skills of struggling readers. Reading Research
Quarterly, 40, 148-182.
McCardle, P., Scarborough, H. S., & Catts, H. W. (2001). Predicting, explaining, and
preventing children‟s reading difficulties. Learning Disabilities Research &
Practice, 16, 230-239.
100
McKeown, M. G., Beck, I. L., Sinatra, G. M., & Loxterman, J. A. (1992). The
contribution of prior knowledge and coherent text to comprehension. Reading
Research Quarterly, 27, 79-93.
McKinley, R., & Mills, C. (1989). Item response theory: Advances in achievement and
attitude measurement. In B. Thompson (Ed.), Advances in social science
methodology (pp. 71-135). Greenwich, CT: JAI Press.
Molé, P. (2003). Ockham‟s razor cuts both ways: The uses and abuses of simplicity in
scientific theories. Skeptic, 10(1), 40–47.
Nagy, W., Berninger, V. W., & Abbott, R. D. (2006). Contributions of morphology
beyond phonology to the literacy outcomes of upper elementary and middle
school students. Journal of Educational Psychology, 1, 134-147.
Nathan, R. G., & Stanovich, K. E. (1991). The causes and consequences of differences in
fluency. Theory into Practice, 30(3), 176-184.
Nation, K. (2005). Children‟s reading comprehension difficulties. In M. Snowling & C.
Hulme (Eds.), The science of reading: A handbook (pp. 248-266). Boston, MA:
Blackwell Synergy.
Nation, K., & Snowling, M. (1997). Assessing reading difficulties: The validity and
utility of current measures of reading skill. British Journal of Educational
Psychology, 67, 359-370.
National Institute of Child Health and Human Development (NICHD). (2000). Report of
the National Reading Panel. Teaching children to read: An evidence-based
assessment of the scientific research literature on reading and its implications for
101
reading instruction: Reports of the subgroups (NIH Publication No. 00-4754).
Washington, DC: U.S. Government Printing Office.
Neale, M. D. (1989). Neale analysis of reading ability, revised. Windsor, UK: NFER-
Nelson.
Oakhill, J. V. (1983). Instantiation in skilled and less-skilled comprehenders. Quarterly
Journal of Experimental Psychology, 35A, 441-450.
Oakhill, J. V. (1984). Inferential and memory skills in children‟s comprehension of
stories. British Journal of Educational Psychology, 54, 31-39.
Oakhill, J. V., & Cain, K. (2007). Introduction to comprehension development. In K.
Cain, & J. Oakhill (Eds.), Children’s comprehension problems in oral and written
language: A cognitive perspective (pp. 3-40). New York: Guildford Press.
Oakhill, J. V., Cain, K., & Bryant, P. E. (2003). The dissociation of word reading and text
comprehension: Evidence from component skills. Language and Cognitive
Processes, 18, 443-468.
Ouellette, G. (2006). What‟s meaning got to do with it: The role of vocabulary in word
reading and reading comprehension. Journal of Educational Psychology, 98, 554-
566.
Paris, S. G., Carpenter, R. D., Paris, A. D., & Hamilton, E. E. (2005). Spurious and
genuine correlations of children‟s reading comprehension. In S. A. Stahl (Eds.),
Children’s comprehension and assessment (pp. 131-169). Mahwah, NJ: Erlbaum.
Perfetti, C. A. (1985). Reading ability. New York: Oxford University Press.
102
Pressley, M., Brown, R., El-Dinary, P., & Afflerbach, P. (1995). The comprehension
instruction that students need: Instruction fostering constructively responsive
reading. Learning Disabilities Research and Practice, 10, 215-224.
Rapp, D. N. (2008). How do readers handle incorrect information during reading?
Memory & Cognition, 36, 688-701.
Reynolds, C. R., & Shaywitz, S. (2009). Response to intervention: Ready or not? Or,
from wait-to-fail to watch-them-fail. School Psychology Quarterly, 24(2), 130-
145.
Riverside Publishing. (2006). Test purchasers qualification form. Retrieved December
21, 2009, from http://www.riverpub.com/pdfs/qform.pdf
Roth, F. P., Speece, D. L. & Cooper, D. H. (2002). A longitudinal analysis of the
connection between oral language and early reading. Journal of Educational
Research, 95, 259-272.
Samuels, S. J. (1979, January). The method of repeated readings. The Reading Teacher,
32, 403-408.
Savage, R. (2006). Reading comprehension is not always the product of nonsense word
decoding and linguistic comprehension: Evidence from teenagers who are
extremely poor readers. Scientific Studies of Reading, 10, 143-164.
Scarborough, H. S., & Brady, S. A. (2002). Toward a common terminology for talking
about speech and reading: A glossary of „phon‟ words and some related terms.
Journal of Literacy Research, 34, 299-336.
103
Share, D. L., & Stanovich, K. E. (1995). Cognitive processes in early reading
development: Accommodating individual differences into a model of acquisition.
Issues in Education, 1(1), 1-57.
Snow, C. E. (2002). Reading for understanding: Toward an R&D program in reading
comprehension. Santa Monica, CA: RAND Corporation.
Snow, C. E., Burns, M. S., & Griffin, P. (Eds.). (1998). Preventing reading difficulties in
young children. Washington, DC: National Academy Press.
Springer, K. (2010). Education research: A contextual approach. Hoboken, NJ: Wiley &
Sons.
Stanovich, K. E. (1980). Toward an interactive-compensatory model of individual
differences in the development of reading fluency. Reading Research Quarterly,
16, 32-17.
Stanovich, K. E. (1986). Matthew effects in reading: Some consequences of individual
differences in the acquisition of literacy. Reading Research Quarterly, 21, 360-
407.
Stanovich, K. E. (1991a). Discrepancy definitions of reading disability: Has intelligence
led us astray? Reading Research Quarterly, 26, 7-29.
Stanovich, K. E. (1991b). Explaining the difference between the dyslexic and the garden-
variety poor reader: The phonological-core variable-difference model. Journal of
Learning Disabilities, 21, 590-604.
Sternberg, R. J. (1987). Most vocabulary is learned from context. In M. G. McKeown &
M. E. Curtis (Eds.), The nature of vocabulary acquisition (pp. 89-105). Hillsdale,
NJ: Erlbaum.
104
Storch, S.A., & Whitehurst, G. (2002). Oral language and code-related precursors to
reading: Evidence from a longitudinal structure model. Developmental
Psychology, 38, 934-947.
Swanson, H. L., Howard, C. B., & Sáez, L. (2007). Reading comprehension and working
memory in children with learning disabilities in reading. In K. Cain, & J. Oakhill
(Eds.), Children’s comprehension problems in oral and written language: A
cognitive perspective (pp. 157-189). New York: Guildford Press.
Swanson, H. L., & O‟Connor, R. (2009). The role of working memory and fluency
practice on the reading comprehension of students who are dysfluent readers.
Journal of Learning Disabilities, 42, 548-575.
Thompson, B. (2000). Ten commandments of structural equation modeling. In L. G.
Grimm & P. R. Yarnold (Eds.), Reading and understanding more multivariate
statistics (pp. 261-284). Washington, DC: American Psychological Association.
Thompson, B. (Ed.). (2002). Score reliability: Contemporary thinking on reliability
issues. Newbury Park, CA: Sage.
Thompson, B. (2004). Exploratory and confirmatory factor analysis: Understanding
concepts and applications. Washington, DC: American Psychological
Association.
Torgesen, J. K., & Bryant, B. R. (1994). TOPA-2+ Test of phonological awareness-
second edition: PLUS. East Moline, IL: LinguiSystems, Inc.
Torgesen, J. K., & Hudson, R. F. (2006). Reading fluency: Critical issues for struggling
readers. In S. J. Samuels & A. E. Farstrup (Eds.), What research has to say about
105
fluency instruction (pp. 130-158). Newark, DE: International Reading
Association.
University of Texas System and Texas Education Agency. (2006). Texas primary reading
inventory. Austin, TX: Authors.
Urbina, S. (2004). Essentials of psychological testing. Hoboken, NJ: Wiley & Sons, Inc.
Wagner, R., Torgesen, J., & Rashotte, C. (1999). CTOPP: Comprehensive test of
phonological processing. Austin, TX: Pro-Ed.
Wanzek, J., & Vaughn, S. (2007). Research-based implications from extensive early
reading interventions. School Psychology Review, 36, 541-561.
Wechsler, D. L. (1992). Manual for the Wechsler intelligence scale for children – III. San
Antonio, TX: Psychology Corporation.
Wiederholt, J. L., & Bryant, B. R. (1992). Gray oral reading test, third edition. Austin,
TX: PRO-ED.
Wiederholt, J. L., & Bryant, B. R. (2001). GORT 4: Gray oral reading test examiner’s
manual. Austin, TX: PRO-ED.
Williams, J. P. (2006). Stories, studies, and suggestions about reading. Scientific Studies
of Reading, 10, 121-142.
Wolf, M. A., Bowers, P., & Greig, P. (1999). The “double deficit hypothesis” for the
developmental dyslexias. Journal of Educational Psychology, 91(3), 1-24.
Wood, F. B., Flowers, L., & Grigorenko, E. (2001). On the functional neuroanatomy of
fluency or why walking is just as important to reading as talking is. In M. Wolf
(Ed.), Dyslexia, fluency, and the brain. Timonium, MD: York Press.

106
Woodcock, R., Mather, N., & Schrank, R. A. (2006). Woodcock-Johnson III diagnostic
reading battery. Rolling Meadows, IL: Riverside Publishing.
Yuill, N., & Oakhill, J. (1988). Effects of inference awareness on poor reading
comprehension. Applied Cognitive Psychology, 2, 33-45.
Yuill, N. M., & Oakhill, J. V. (1991). Children’s problems in text comprehension. New
York: Cambridge University Press.

107
APPENDIX A
EXTENDED LITERATURE REVIEW
108
The Simple View of Reading model (SVR; Gough & Tunmer, 1986; Hoover & Gough,
1990) provides a conceptual framework for understanding the two essential components
– decoding and language comprehension – needed for skilled reading comprehension
(Savage, 2006). That is, for a person to comprehend written language, symbols on the
printed page must be transformed into spoken words and meaning must be connected to
those words. Decoding and language comprehension are separable components; both
components are necessary but not sufficient alone (Gough & Tunmer, 1986). This chapter
will review 1) the empirical evidence for the SVR (Gough & Tunmer, 1986) and the use
of SVR to identify different kinds of poor readers, 2) the components of reading
comprehension, and 3) standardized assessments of reading comprehension.
The Simple View of Reading
The SVR was formulated by Gough and Tunmer (1986). Hoover and Gough (1990)
proposed an equation that described reading comprehension as R = D x L, where R is
reading comprehension, D is decoding, and L is language comprehension. The equation
suggests an interaction between two components that accounts for most of the variance in
reading comprehension. Both components are necessary for skilled reading
comprehension but not sufficient alone. An impaired component equals zero. Reading
comprehension will be zero if either one of the components is impaired, because any
number times zero equals zero.
Hoover and Gough (1990) validated the theory in a study with 254 bilingual
readers in Grades 1-4. With hierarchical multiple regression analyses, Hoover and Gough
found that most of the variance in reading comprehension was accounted for by the
109
product of decoding and language comprehension: Grade 1 = .71; Grade 2 = .72; Grade 3
= .83; and Grade 4 = .82. An additive equation added further variance, ranging from .02
in Grades 1 and 3 to .07 in Grade 4. The authors contended that even with the variance
accounted for by the additive equation, a multiplicative equation better described the
interaction effect, in which reading comprehension is zero if either component is zero.
The authors predicted and found that as reading comprehension skill decreased, the
aggregate of decoding and language comprehension decreased, suggesting the
multiplicative equation addressed reading comprehension better than the additive
equation. Additionally, Hoover and Gough predicted and found that as decoding skills
increased, reading comprehension increased proportionally with increases in language
comprehension, again suggesting that the multiplicative equation better represented
reading comprehension than an additive equation.
Validation Studies of the SVR
Several studies have tested the SVR‟s hypothesis (Gough & Tunmer, 1986) of the
interaction between two independent components. For example, Oakhill et al. (2003)
documented that, in the early reading development of 102 7- and 8-year-olds, the two
components of the SVR were dissociable and necessary, because the authors were able to
identify poor readers with no decoding deficits and poor readers with no language
comprehension deficits. Similarly, Catts et al. (2006) evaluated and followed 84 poor
readers from kindergarten to Grade 8. There were eighth-grade students with language
comprehension deficits who had intact phonological and decoding skills and eighth-grade
students with poor decoding who demonstrated the opposite pattern. The double
110
dissociation was also demonstrated with these students as kindergarteners, second
graders, and fourth graders. Catts et al. also found students with mixed deficits, both
decoding and language comprehension. The authors concluded that all readers should be
“…classified according to a system derived from the simple view of reading” (p. 290), so
that the most appropriate instruction can be given. However, Catts et al. noted that in the
early grades students with poor comprehension and students with poor decoding are not
as clearly differentiated on the basis of reading comprehension.
A cross-validation of the SVR (Gough & Tunmer, 1986) with typically
developing and poor readers in Grades 2 (n = 163), Grade 3 (n = 131), Grade 6 (n = 129),
and Grade 7 (n = 37) was conducted by Chen and Velluntino (1997). Chen and
Velluntino supported a “weaker but more complex version” (p. 3) of the SVR, because
most of the variance in reading comprehension was not accounted for by decoding and
language comprehension in a multiplicative equation alone. The equation that Chen and
Velluntino presented was both additive and multiplicative: R = D + L + (D x L). In their
equation, the additive portion accounted for the substantive variance in reading
comprehension and, under certain circumstances, the multiplicative portion accounted for
the unique variance. For example, Chen and Velluntino found that the multiplicative
portion accounted for an additional 3% of the variance for some readers in Grade 7.
Chen and Velluntino surmised that the multiplicative equation may have been
more appropriate in the Hoover and Gough study (1990), because the data involved
bilingual students, some of whom could have had decoding skills but zero language
comprehension. Additionally, the students in the Hoover and Gough data were in Grade 4

111
and below, where decoding has a greater impact on reading comprehension. A zero in
decoding in the early grades could result in zero reading comprehension.
In a study with 56 teenage poor readers, Savage (2006) was unable to support the
additive-plus-product equation Chen and Velluntino (1997) suggested. Instead, Savage
found with older students an additive equation (i.e., R = D + L) best described reading
comprehension. Older students who had difficulties with decoding, Savage suggested,
began to develop compensatory skills that did not fully involve decoding to comprehend
text. For example, to determine unfamiliar words, these students might have relied on
context-based strategies. This means that even though decoding was impaired (i.e., 0),
students still had some understanding of the text; therefore, a multiplicative equation did
not explain reading comprehension for these students because reading comprehension
was not zero.
Savage‟s (2006) findings supported Bruck‟s (1990) “minimal threshold levels for
word-recognition skill” (p. 450). That is, once certain levels of word recognition have
been achieved, older students support their weaker decoding skills with their stronger
language comprehension skills. Savage‟s findings also supported Stanovich‟s (1980)
interactive-compensatory model that assumes that readers compensate weak skills with a
heavy reliance on other knowledge sources; for example, students with weaker decoding
skills rely heavily on context to decode unfamiliar words.
Use of the SVR to Identify Poor Readers
Although the relative contributions of decoding and language comprehension to reading
comprehension may vary, results from various studies are in agreement that decoding and
112
language comprehension are necessary for skilled reading comprehension. For younger
readers, the two components can be used dependably to identify the deficits of poor
readers (Aaron, 1997; Aaron et al., 1999; Catts et al., 2003). In a recent study that used
the SVR (Gough & Tunmer, 1986) framework with children of ages 4 and 6 in the US
and Canada, Kendeou, Savage, et al. (2009) stated:
…our argument is that the D and LC [language comprehension] constructs are
general features of reading comprehension. For this reason, the D and LC
constructs are evident in factorial analysis of the diverse measures of these
constructs undertaken independently by two research teams in different countries.
In this sense, the present findings provide important support for the generality and
validity of the SVR framework as a model of reading and as a guiding principle
for policy makers seeking to employ maximally effective interventions in the
field. (p. 365)
Aaron et al. (1999) investigated the individual strengths and weaknesses of the
two components in 139 students with varied reading abilities in Grades 3, 4, and 6. An
exploratory factor analysis confirmed two dissociable components – decoding and
language comprehension – across the sample. Within the sample, Aaron et al. identified
subgroups of poor readers: a) good decoding and poor language comprehension skills, b)
poor decoding and good language comprehension skills, and c) poor decoding and
language comprehension skills. Two other samples of selected poor readers in the study
demonstrated weaknesses in one or both components. A smaller fourth subgroup of
students demonstrated difficulties in orthography and processing speed, suggesting that
reading rate could be a third component of reading comprehension.
113
Aaron (1997) referred to the focus on assessing the individual strengths and
weaknesses of the two components of reading as the Reading Component Model. The
Reading Component Model predicts that there are, as demonstrated by Aaron et al.
(1999), different kinds of poor readers. Knowledge of students‟ strengths and weaknesses
in decoding and language comprehension informs instruction. In their study, Aaron et al.
noted that when students were identified by their relative strengths and weaknesses and
instruction was targeted at the students‟ weaknesses, gains in reading comprehension
were observed. Aaron et al. further noted that those poor readers who were identified as
LD based on the discrepancy model tended to have weaknesses only in decoding. If such
results were generalized, the authors contended, it could be concluded that all poor
readers have weaknesses in decoding only, which is not the case.
Catts et al. (2003) replicated the studies of Aaron (1997) and Aaron et al. (1999)
with a group of 183 poor readers who were participating in a longitudinal investigation,
in which 604 students were tested and followed from Grades K to 4. The data for the
Catts et al. study focused on second-grade data from the larger longitudinal investigation.
Poor readers did show definite individual differences in their strengths and weaknesses in
decoding and listening comprehension but distinctly homogeneous subgroups of poor
readers did not emerge from the second-grade data.
Consequently, Catts et al. (2003) determined arbitrary but standard boundaries for
the subgroups, with poor performance on the variables demarcated by z scores of -1 or
below. As a result of the boundaries, subgroups similar to those identified by Aaron et al.
(1999) emerged: a) adequate decoding and poor language comprehension (i.e.,
hyperlexia; 15.4%); b) poor decoding and adequate language comprehension (i.e.,
114
dyslexia; 35.5%); and c) poor decoding and language comprehension (i.e., language
learning disabilities [LLD]; 35.7%). Catts et al. also identified an unpredicted subgroup
of nonspecific poor readers (13.4%), who were above cut-off scores in decoding and
language comprehension but had below cut-off scores in reading comprehension. In
theory, this subgroup would falsify the SVR (i.e., if R = D x L and D ≠ 0 and L ≠ 0, then
R cannot equal 0; Gough & Tunmer, 1986). However, Catts et al. observed that the fourth
group represented the smallest percentage of poor readers and proposed that the
emergence of the subgroup was most likely due to measurement error or other variables
beyond decoding and listening comprehension. Of note in the study is that although 70%
of the poor readers had difficulties with decoding, 50% of the poor readers had
difficulties with language comprehension.
In sum, the SVR (Gough & Tunmer, 1986) provides a framework for thinking
about the components of reading comprehension. Deficits in one or both components can
hinder skilled reading comprehension. The model can be used to identify students‟
strengths and weaknesses in the components. Descriptions of the components follow.
The Components of Reading
Following the SVR‟s (Gough & Tunmer, 1986) hypothesis of reading comprehension,
poor decoding skills may adversely affect reading comprehension. Fortunately, a robust
body of research has defined and delineated how to assess and teach decoding skills and
underlying processes (cf. NICHD, 2000; Wagner, Torgesen, & Rashotte, 1999; Wanzek
& Vaughn, 2007).
115
Also in keeping with the SVR (Gough & Tunmer, 1986), poor language
comprehension can negatively affect reading comprehension. Two recent and seminal
documents, the Report of the National Reading Panel (NRP; National Institute of Child
Health and Human Development [NICHD], 2000) and the RAND Reading Study Group
(Snow, 2002), have provided guidance on teaching text comprehension and have
reviewed current research on comprehension. However, the research delineating the
underlying processes and assessment of language and reading comprehension is not as
robust or as clearly defined as is the body of research for decoding. It is also important to
note that difficulties in one or both components may be accompanied or caused by other
influences, such as self-esteem, self-efficacy, interest, attention, cultural and language
issues, complexity of the text, and purpose for reading (NICHD, 2000; Snow, 2002).
Decoding
Decoding begins with the reader‟s appreciation that spoken words are composed of
phonemes. Phonological awareness involves the reader‟s sensitivity to the sound
structure of spoken language, such as rhyming, counting words in sentences, counting
syllables in words, and identifying specific sounds in a syllable. The key element of
phonological awareness is the ability to perceive the constituent phonemes of a spoken
word (Adams, 1990); for example, the word mat is constituted with the phonemes /m/,
/ă/, /t/. Technically, phonemes are abstractions of speech sounds that are influenced by
surrounding phonemes (Scarborough & Brady, 2002). Co-articulation makes it difficult
to truly isolate individual phonemes. However, for practical and instructional purposes,
the terms phonemes and speech sounds can be used synonymously. The ability to
116
perceive phonemes in spoken words is known as phonemic awareness and can and should
be taught. The importance of phonological and phonemic awareness training in learning
to decode has been well documented (e.g., Adams, 1990; Liberman, Shankweiler, &
Liberman., 1989; NICHD, 2000).
Recently, Castles, Coltheart, Wilson, Valpied, and Wedgewood (2009)
investigated the benefit of phonemic awareness training to preschoolers before teaching
letter-sound correspondences. In a study with 76 preschoolers, one group of preschoolers
was given 6 weeks of intensive phonemic awareness training followed by 6 weeks of
letter-sound training. A second group of preschoolers was given 6 weeks of intensive
letter recognition training followed by 6 weeks of letter-sound training. A comparison
group received 12 weeks of letter-sound training. Castles et al. found that although the
group with pure early phonemic awareness training made statistically significant gains in
phonemic awareness, the training did not enhance their knowledge of letter-sound
correspondences to a greater degree than the other two groups. Hence, the authors
reported there was little benefit in providing phonemic awareness training to preschoolers
prior to teaching letter-sound correspondences. But given the small sample size of the
Castles et al. study and lack of longitudinal data, the preponderance of evidence has
supported phonemic awareness training for young children. As McCardle et al. (2001)
noted:
…there is ample evidence that phonological deficits contribute heavily to the
development of reading difficulties of many children, and the feasibility of such
training has been demonstrated. Fortunately, many intervention programs for
addressing phonological weaknesses in preschool, kindergarten, and first grade
117
have been shown to be effective, particularly in the word-recognition strands of
reading. (p. 237)
In addition to the awareness of speech sounds in spoken words, the reader must
realize that printed or written words are composed of individual letters or groups of
letters (i.e., graphemes) that represent the individual speech sounds in spoken words (i.e.,
the alphabetic principle). The specific correspondences of sounds to letters must be
explicitly taught and practiced (Adams, 1990; Blachman et al., 2004; NICHD, 2000).
Mathes et al. (2005) studied the effects of two different approaches to explicit decoding
instruction – proactive and responsive. The proactive instruction was highly scripted and
systematic. Responsive instruction had no predetermined scope and sequence. Instead,
teachers responded to student needs and designed instruction accordingly. Both
instructional approaches were effective. In a meta-analysis, Wanzek and Vaughn (2007)
identified the Mathes et al. study as one of 18 effective or promising interventions for
struggling readers.
Eventually, words are built into memory through thorough knowledge of sound-
symbol correspondences and repeated exposures (Adams, 1990; Ehri, 2005). When
words are held in memory, the reader can instantly recognize words without any
conscious effort (Ehri, 2005; Wolf, Bowers, & Greig, 1999). Accurate and automatic
word recognition supports comprehension through correct word identification, and
cognitive resources that are not needed to identify words can be used to process meaning
(LaBerge & Samuels, 1974; Perfetti, 1985).
There is reciprocity between decoding and comprehension. Accurate and
automatic decoding supports comprehension and comprehension, specifically language or
118
listening comprehension, supports decoding. For example, new sound-symbol
correspondences can be acquired through reading connected text. In reading connected
text, the reader may activate what Share and Stanovich (1995) referred to as the "self-
teaching mechanism" (p. 17). To read an unknown word, the reader uses all known
sound-symbol correspondences in the word (e.g., the reader read center as /kĕn tər/). The
reader uses his or her phonological awareness to approximate a pronunciation of the
unknown word that matches a word in the reader‟s listening vocabulary (e.g., /kĕn tər/ is
not a familiar word but the word sounds like /sĕn tər/, which is a familiar word). The
reader uses this approximation in the text, and using his or her language comprehension
(e.g., vocabulary, syntax) the reader is able to confirm the correct pronunciation and
meaning of the unknown word. In activating the self-teaching mechanism, the reader
acquires knowledge of a new sound-symbol correspondence within the previously
unknown word (i.e., c before e is pronounced /s/). Granted, the reader may not master a
concept after a single experience, but such experiences help the reader become reflective
and self-efficacious.
Knowledge of sound-symbol correspondences is needed for the reader to
successfully read one-syllable base words, whereas that knowledge and knowledge of the
syllabic and morphemic segments of written language facilitates the reading of longer
words. Syllables are speech units of language that contain one vowel sound and can be
represented in written language as words (e.g., mad, top, sit) or parts of words (e.g., mu,
hin, rea, loi) with a single vowel or pair of vowels representing the vowel sound.
Awareness of syllables helps the reader perceive the natural divisions of longer words to
aid recognition (Adams, 1990). Morphemes are meaning-carrying units of language.
119
With knowledge of morphemes, the reader can focus on units of letters that recur in
words. For example, the reader sees tract in tractor, attractive, and subtraction. The
reader does not need to sound out every letter in an unknown word (Henry, 1988).
Morphemes also allow the reader to infer the meanings of unfamiliar words (Henry,
1988, 2003; Nagy, Berninger, & Abbott, 2006).
The reciprocity of decoding and comprehension can be observed with fluency.
Fluency is the ability to quickly decode or recognize words in connected text in a manner
that achieves adequate speed for maintaining attention and processing meaning. Snow
(2002) referred to fluency “as both an antecedent to and a consequence of
comprehension” (p. 13). As an antecedent to comprehension, the reader must have
thorough knowledge and automatic use of the decoding skills previously presented to
recognize words instantly. Poor phonological processing (Lyon, Shaywitz, & Shaywitz,
2003; Scarborough & Brady, 2002) or poor naming speed (Wolf et al., 1999) may
interfere with instant word recognition and result in slow, labored reading. It should be
noted that for struggling readers, fluency is difficult to remediate (Torgesen & Hudson,
2006). However, when words on the printed page can be instantly recognized, the
reader‟s attention and cognitive reserves are available for processing meaning (LaBerge
& Samuels, 1974; Perfetti, 1985).
As a consequence of comprehension, the reader, as Stanovich (1986) suggested,
reads more; and more practice in reading increases fluency as well as vocabulary and
background knowledge that further increase fluency. Fluency as a consequence of
comprehension also can be observed in the prosodic flow of oral reading. The reader who
understands what he or she is reading reads with appropriate phrasing and intonation
120
(Samuels, 1979) and sounds as if he or she is speaking. Recently, Swanson and O‟Connor
(2009) suggested that prosody in oral reading requires the coordination and control of
multiple processes, and coordination and control may be related to working memory.
Because the goal of fluency is to aid comprehension and because comprehension
of text aids fluency by allowing students to anticipate what is to come in the text (Wood,
Flowers, & Grigorenko, 2001), prior or background knowledge should be activated
before the initial reading of the passage. Comprehension should be assessed, informally
or formally, during and after reading. The role of fluency is to free cognitive resources to
process meaning and to further comprehension. However, Paris, Carpenter, Paris, and
Hamilton (2005) cautioned that:
…oral language fluency may only be a proxy measure for other influences on
reading development. This makes oral reading fluency a positive predictor of
reading difficulties, but it does not mean that fluency is the cause of the difficulty.
When causal status is erroneously inferred from the predictive relation, remedial
intervention may be prescribed for the predictor variable. This reasoning is
unscientific and inaccurate…. (p. 138)
In sum, the ultimate goal of decoding instruction is the facile translation of printed
words into spoken equivalents. When language comprehension is combined with
thorough knowledge of sound-symbol correspondences, syllables, and morphemes, the
skilled reader should be able to identify words that are part of his or her listening
vocabulary (Adams, 1990; Perfetti, 1985). Ultimately, fluent oral reading is the
equivalent of speaking and vital to processing meaning, but lack of fluency may not be
121
the cause of reading comprehension difficulties. Underlying language comprehension
deficits may be interfering with reading comprehension (Paris et al., 2005).
Language Comprehension
Hoover and Gough (1990) contended that reading comprehension requires almost the
same abilities and processes as language comprehension, with the exception that
information for reading comprehension is obtained through graphic representations of
spoken words. Additionally, Hoover and Gough contended that literacy (defined as
reading only) was the contrast between language comprehension and reading
comprehension. That is, the limit on reading comprehension is the limit on language
comprehension; any increase in language comprehension is an automatic increase in
reading comprehension, assuming the reader can decode the words. Increases in decoding
skills alone, the authors further argued, would not increase reading comprehension
without a concomitant increase in language comprehension. Therefore, it cannot be
assumed that reading interventions that improve decoding skills will also improve
reading comprehension (Paris et al., 2005). Certainly, poor comprehension that is solely
the result of inaccurate or inefficient decoding (i.e., the presence of adequate language
comprehension) should improve with intensive, explicit decoding instruction.
Assuming that decoding is not interfering with skilled reading comprehension,
then a deficit in language comprehension is very likely the cause. A difficulty with
language comprehension may stem from multiple causes, such as inadequate vocabulary,
insufficient background knowledge, inability to integrate information, poor working
memory, lack of sensitivity to causal structures, or inability to identify semantic
122
relationships (Kendeou, et al., 2009; Nation, 2005; Yuill & Oakhill, 1991). Language
comprehension is, as Gough and Tunmer (1986) offered, “…the ability to take lexical
information (i.e., semantic information at the word level) and derive sentence and
discourse interpretations” through listening (p. 131). As seen in the definition, language
comprehension requires abilities and processes at word, sentence, and discourse levels.
Because language and reading comprehension involve almost the same abilities and
processes (Gough & Tunmer, 1986), it is logical to assume that difficulties experienced
with language comprehension would also be experienced with reading comprehension.
Vocabulary. At all levels of comprehension, rapid access to word meanings is
important. Freebody and Anderson (1983) observed that sixth-graders‟ performance on
reading comprehension tasks was poorer when the vocabulary was more difficult. In a
longitudinal investigation, Ouellette (2006) found that breadth of vocabulary (i.e.,
receptive vocabulary) predicted typically developing fourth-grade readers‟ decoding
skills and depth of vocabulary knowledge (i.e., the ability to express or produce
definitions) predicted their reading comprehension.
Roth, Speece, and Cooper (2002) and Kendeou, van den Broek, White, and Lynch
(2009) found that oral language and semantic abilities were the best predictors of reading
comprehension between kindergarten and second grade, over code-related abilities. In a
longitudinal investigation of 626 Head Start children, Storch and Whitehurst (2002)
reported that 95% of the variance of oral language in kindergarten was predicted by
preschool oral language, and 98% of the variance of oral language in Grades 1 and 2 was
accounted for by oral language ability in kindergarten. These results render the Hart and
Risley study (1995) all the more sobering. Hart and Risley found that at age 3
123
preschoolers from professional families were exposed to 30,000,000 more words than
preschoolers in welfare families.
Although there is a strong link between vocabulary and comprehension, the link is
complicated in terms of how to teach vocabulary. As Snow (2002) noted, “…this
relationship between vocabulary knowledge and comprehension is extremely complex,
confounded, as it is, by the complexity of relationships among vocabulary knowledge,
conceptual and cultural knowledge, and instructional opportunities” (p. 35). Moreover,
Baumann (2009) suggested that it is difficult to quantify the requisite intensity for
vocabulary instruction, because linguistic skills are more difficult to teach as discrete and
countable skills than are decoding skills.
The NRP (NICHD, 2000) documented improved reading comprehension through
the direct instruction of vocabulary. Effective vocabulary instruction, according to the
NRP, involves rich contexts, multiple exposures, and active engagement of the learners.
For example, Beck, McKeown, and Kucan (2002) found that selecting meaningful and
useful words from content-learning materials, presenting definitions in everyday
language, providing practices in multiple contexts, and engaging students in determining
examples and non-examples of vocabulary words positively impacted vocabulary and
reading comprehension growth. Additionally, the NRP reported that the majority of
vocabulary words are learned incidentally in different contexts and through use of word-
learning strategies, such as learning about morphemes or how to use contextual clues to
determine the meanings of unfamiliar words. Cunningham and Stanovich (1997)
emphasized that most vocabulary growth is a result of reading volume.
124
Prior Knowledge. Prior knowledge supports comprehension (Snow, 2002);
however, the role of prior knowledge is not obvious. As Rapp (2008) suggested:
To fully understand the role of prior knowledge, we need to know when readers
rely on what they know and when they do not, as well as when they update their
prior knowledge and when they fail to do so. (pp. 698-699)
Rapp investigated the role of prior knowledge and text content in a study with 63
undergraduate students, who were timed as they read several passages that contained
information that would not match the students‟ prior knowledge (i.e., inaccurate
information). Rapp found that students maintained a steady pace when inaccurate
information was followed by supportive text. Students slowed down considerably when
reading inaccurate information that was followed by ambiguous support text or when
suspenseful text suggested a plausible but inaccurate outcome. The slowdowns suggested
that prior knowledge aided the readers in noticing discrepant information, but the readers‟
ability to notice was influenced by the nature of the text content. Similarly, McKeown,
Beck, Sinatra, and Loxterman (1992) reported that prior knowledge coupled with
coherent text was most useful in improving reading comprehension.
Carr and Thompson (1996) investigated the effects of prior knowledge and the
activation of that knowledge on reading comprehension. In the study, 32 fifth and eighth
graders without LD and 16 eighth grades with LD read 16 passages. Half the passages
contained topics that were familiar to the students and the other half contained unfamiliar
topics. For half of the passages, the examiner prompted student activation of prior
knowledge. Students were expected to self-activate prior knowledge for the other half of
the passages. The authors found that the performance of students with or without LD was
125
better on passages with familiar topics. Performance on passages with unfamiliar topics
for all students was enhanced when prior knowledge was activated by the examiner‟s
prompting.
In a study with students in Grade 9, Anmarkrud and Bråten (2009) found that
motivation constructs, as measured by an inventory of reading motivation, accounted for
additional variance in predicting reading comprehension. The authors suggested that
although reading strategies, such as activating prior knowledge, are important, an
emphasis on motivation to read is equally important. Kintsch and Kintsch (2005)
suggested that:
The reader‟s background knowledge and motivation are further factors in
comprehension: comprehension is easy when the domain knowledge is high. In
addition, motivation and interest influence comprehension, both directly and
indirectly (in that students are most likely to have good domain knowledge in
areas in which they are interested). (p. 84)
Inference Making. At the word, sentence, and discourse levels of
comprehension, inference making is important. Ackerman and McGraw (1991)
conducted a study with typically developing second graders, fifth graders, and college
students to determine how and when students made inferences. The second graders were
more dependent on the number of clues, the position of information in the text, the
number of inferences, and the constraint not to guess; therefore, they made different
kinds of inferences than the older students, depending on the situation. Second graders
did not make fewer inferences.
126
Yuill and Oakhill (1991) reported that students with poor comprehension had
difficulties making inferences, and the ability to make inferences best differentiated
students with good or poor comprehension at all ages. In a study of 7- and 8-year-old
poor readers, Yuill and Oakhill (1988) demonstrated that inference making can be taught.
The authors reported statistically significant gains in the inference-making skills of
students who were given 6 weeks of awareness training that involved lexical inferencing,
question generation, and prediction. For example, lexical inferencing involved students
choosing a word from a short sentence, giving information about the word, and tying that
word to another word in the sentence. The students also generated who, what, when,
where, why questions about a short passage, where the answers to some questions would
be directly stated and some answers would be inferred. In a prediction task, a sentence in
a short passage was hidden; students had to determine the content of the sentence based
on the surrounding sentences. Students in the study who were given either intensive
decoding or reading comprehension training did not make statistically significant gains in
inference making.
Comprehension assessments measure understanding, using different types of
questions. Using a one-parameter Rasch model, Alonzo, Basaraba, Tindel, and Carriveau
(2009) examined the relative difficulties of three types of questions – literal, inferential,
and evaluative. The answers to literal questions were stated explicitly in the text.
Inferential questions required students to look across the text to find the answers.
Evaluative questions required students to tap into real-world knowledge beyond the text.
The participants were 605 third-grade students. There were 400 unique questions. Each
question was answered by 50 to 120 students. Each student read 5 of 20 passages and
127
answered 35 literal, 35 inferential, and 30 evaluative questions. Alonzo et al. found there
was a statistically significant difference between student performance on literal and
inferential questions, suggesting that literal questions were much easier to answer. There
was no statistically significant difference between student performance on inferential and
elaborative questions.
Oakhill (1984) and Cain and Oakhill (1999) noted that when text was available, 7-
and 8-year-old readers with poor comprehension were comparable to their peers with
good comprehension in answering literal questions, but readers with poor comprehension
had greater difficulty making inferences than their peers regardless of the availability of
the text. Bowyer-Crane and Snowling (2005) found that both 9-year-old poor and
typically developing readers had difficulties with questions that required real-world
knowledge or emotional outcomes, but the difficulties were more pronounced with the
poor readers.
Important requirements for inference making include use of the context to
determine the meaning or correct usage of a word, anaphoric resolution of pronouns and
interclausal connectives (i.e., understanding so and because), and integration of
information within a sentence or sentences, using vocabulary and background knowledge
(Cain & Oakhill, 2007). For example, when the listener or reader encounters an
unfamiliar word, he or she can use the meanings of surrounding words and background
knowledge to inform meaning (Sternberg, 1987). An example of using the context
follows: “Her clothes were filthy and needed to be washed.” The reader infers that dirty
clothes need to be washed; therefore, filthy means dirty. Oakhill (1983) and Cain,
128
Oakhill, and Elbro (2003) found that readers with poor comprehension were less able to
use the context to inform meanings of words, a vital skill for text comprehension.
In listening and reading, anaphors require the listener or reader to refer back to a
previous reference to maintain coherence (Cain & Oakhill, 2007). For example, “Maria
saw Mark at the store, and she waved to him.” The reader infers that she refers to Maria
and him refers to Mark. Interclausal connectives, such as so or because, require the
listener or reader to refer back to a previous reference and determine the relationship
between two propositions (Cain & Oakhill, 2007). For example, note the different causal
relationships between, “Claudia had to wash the dishes, so she didn‟t get her homework
done” and “Claudia had to wash the dishes, because she didn‟t get her homework done.”
In both listening and reading, information is integrated within a sentence and
across several sentences. An example of integrating information follows: “It was early in
the morning. The sun sparkled on the freshly fallen snow as Mary ran to catch the school
bus.” The reader infers that the season is most likely winter based on the freshly fallen
snow; Mary is on her way to school because it is morning; and Mary is late because she is
running. The reader integrates information within the discourse and draws on his or her
real-world or background knowledge.
Working Memory. Working memory aids the reader in integrating information.
Working memory holds onto information in short-term memory and simultaneously
processes that information with new incoming information (Swanson & O‟Connor,
2009). Cain, Oakhill, Barnes, and Bryant (2001) investigated the role of available
knowledge on the inference making of 7- and 8-year-old good and poor readers. All
students had adequate decoding skills, but the poor readers had specific comprehension
129
deficits. The students were taught information about the planet Gan; for example, bears
on Gan have blue fur, the rivers flow with orange juice, and turtles have ice skates on
their feet. The students were tested on this knowledge base before they were given
passages that required the knowledge.
The authors (Cain et al., 2001) found that poor readers who demonstrated facility
with the needed knowledge base still made fewer inferences. Neither lack of available
knowledge nor failure to recall the knowledge base accounted for the smaller quantity of
inferences. The authors concluded that poor readers who failed to make inferences did
not have the working memory needed to integrate the information needed to make
inferences. Swanson, Howard, and Sáez (2007) noted, “WM [working memory] plays a
major role because (1) it holds recently processed information to make connections to the
latest input, and (2) it maintains the gist of information for the construction of an overall
representation of the text” (p. 160).
Comprehension Monitoring. Coherence at the discourse level is aided by
working memory and comprehension monitoring. Pressley, Brown, El-Dinary, and
Afflerbach (1995) defined comprehension monitoring as “the awareness of whether one
is understanding or remembering text being processed” (p. 218). When an inconsistency
occurs in spoken or written discourse, the disruption should cause the listener to ask for
clarification or for the reader to stop and “fix” the problem. The NRP (NICHD, 2000)
identified comprehension monitoring as a useful addition to other strategies that are used
to improve text comprehension. Comprehension monitoring may involve the reader
asking questions, such as “does this make sense?” and “what do I have to do to make the
text make sense?” For example, if the text does not make sense, the reader may need to
130
reread a sentence or a paragraph, or the reader may need to look up an unfamiliar word in
the dictionary.
Understanding Story Structure. Different genres of texts have different
structures. Snow (2002) suggested that knowing the structure of the text provides the
reader with a plan. If the reader understands the structure of the text that is being read, he
or she knows what to anticipate while reading and has a means of organizing and
retaining relevant information (Snow, 2002).
The NRP (NICHD, 2000) noted that story structure is widely used in teaching
narrative texts. Story structure involves teaching the elements that constitute the
structure. In narrative text, the structure involves a setting, characters, a goal or problem,
a sequence of events, and then the achievement of the goal or resolution of the problem.
The main idea is often captured in a title. The NRP also noted that teaching story
structure is more helpful for poor readers than skilled readers.
In sum, language comprehension is comprised of many underlying processes and
abilities. Vocabulary, prior knowledge, integrating information, understanding story
structure, monitoring information, and working memory are important to comprehension,
both language and reading. The ability to make inferences best differentiates students
with good or poor comprehension at all ages.
Standardized Reading Comprehension Tests
Standardized tests of reading comprehension may aid in the identification of students
with poor comprehension. However, Kendeou, van den Broek, et al. (2009) suggested
that standardized tests “…have been designed for students who have mastered decoding
131
skills and are widely criticized as invalid measures of comprehension” (p. 775).
Standardized reading comprehension tests may appear to be invalid measures of reading
comprehension, because these tests do not always assess the same competencies. Tests
often reflect the author‟s view of what constitutes reading comprehension (Keenan &
Betjemann, 2006). It is important to understand what competencies reading
comprehension tests actually assess and how the tests are formatted (Nation & Snowling,
1997), so that exact deficits of students can be identified and the most appropriate
instruction can be designed for the students.
Cutting and Scarborough (2006) reviewed three commonly used reading
comprehension assessments–the Gates-MacGinitie Reading Test, Revised (G-M;
MacGinitie, MacGinitie, Maria, Dreyer, & Hughes, 2006), the Gray Oral Reading Test-
Third Edition (GORT-3; Wiederholt & Bryant, 1992), and the Wechsler Individual
Achievement Test (WIAT; Wechsler, 1992). The unique contributions of decoding and
oral language to reading comprehension varied across tests. For example, the variance
accounted for by decoding in the WIAT was 12%, but the variance accounted for by
decoding in the GORT-3 was 8% and in the G-M was only 6%. The variance accounted
for by oral language was 15% for the G-M and only 9% for the WIAT and the GORT-3.
A student who has poor comprehension but adequate decoding skills could do better on
the WIAT than the other two reading comprehension tests, because decoding accounted
for more variance on the WIAT than on the other tests. Skills related to listening
comprehension, such as oral language and vocabulary, accounted for less of the variance
on the WIAT than on the other two tests.
132
Keenan and Betjemann (2006) reported the effects of passage-independent
questions found on the GORT-3 and GORT-4 (Wiederholt & Bryant, 1992, 2001).
Serendipitously, Keenan and Betjemann noted there were students who had difficulties
with decoding, but nonetheless were able to answer nearly all the questions on the GORT
correctly. In a study conducted specifically to measure the validity of the comprehension
portion of the GORT-3 and GORT-4, Keenan and Betjemann reported that students who
participated in the passageless-administration of the GORT answered questions with
above-chance accuracy. The questions that the students could answer without reading the
passages (i.e., passage independent) contained commonsensical information and did not
require the vocabulary, background knowledge, and inference making that the passage-
dependent questions required. Additionally, there were fewer passage-dependent
questions on the tests; therefore, it was difficult to determine exactly what was being
measured.
Nation and Snowling (1997) examined two tests of reading comprehension used
extensively in the UK and reported that test format influenced student performance. The
Neale Analysis of Reading Ability (Neale, 1989) is an individually administered reading
tests, on which students read short stories aloud and answer literal and inferential
questions about the stories. The Suffolk Reading Scale (Hagley, 1987) is a group-
administered, cloze-procedure test. Students read sentences and choose from one keyed
response and three or four foils (i.e., incorrect answers). Nation and Snowling compared
the performance of 7- to 10-year-olds (n = 184) on both reading comprehension tests to
three measures of decoding and a measure of listening comprehension. Student
performance on the Suffolk Reading Scale was more dependent on decoding ability;
133
therefore, the performance of students with poor comprehension and good decoding
skills were comparable to typically developing students on the test. Student performance
on the Neale Analysis of Reading Ability was more dependent on language
comprehension; therefore, students with poor comprehension and good decoding skills
scored well below the typically developing students on the test. Although both tests
purported to measure reading comprehension, student performance varied as a result of
the test formats and demands on listening comprehension.
Francis et al. (2006) determined to construct a reading comprehension assessment
that would specifically measure the text memory, text access, knowledge
access, and knowledge integration of Spanish-speaking English Language Learners (n =
192). The authors controlled the readability and the vocabulary and background
knowledge needed to read and answer the true-false questions on the Diagnostic
Assessment of Reading (DARC). The DARC and the Woodcock-Johnson Language
Proficiency Battery, Revised were administered to the students. To establish the
discriminant validity of the DARC, the authors used confirmatory factor analysis.
Through a series of four latent variable models, the authors were able to differentiate the
DARC as a reading comprehension assessment that was dependent on language
processing with limited dependence on word recognition.
Francis, Fletcher, Catts, and Tomblin (2005) noted the shortcomings of reading
comprehension assessments that are constructed using classical test theory. For example,
classical test theory holds that an observed score (X) is equal to a hypothetical measure
of the population true score (T), plus or minus measurement error (E), which is the
difference between the observed score and the true score, or X = T E. The true score is
134
never known and, as Francis, Fletcher, Catts, et al. stated, “there is no implication that
this score reflects some underlying latent ability” (p. 374). Modern test theory, such as
item response theory (IRT) or latent traits theory, can estimate the ability of individuals
and the difficulty of items.
In sum, reading comprehension assessments do not always measure the same
competencies. This does not make any one test inherently good or bad or one test better
than another. Simply, care must to be taken to choose the right tests for the intended
purpose. As Cain and Oakhill (2006) suggested, “No assessment tool is perfect. However,
awareness of the strengths and weaknesses of each one will guide our selection of the
most appropriate assessment for our needs and also our interpretation of test scores” (p.
699). Modern test theory holds promise for the development of better or more precise
reading comprehension assessments.
Summary of the Literature Review
The SVR (Gough & Tunmer, 1986; Hoover & Gough, 1990) provides a framework for
understanding the two components of reading comprehension. Numerous studies have
documented that both components are requisite for skilled reading comprehension.
Decoding enables meaning to be lifted from the printed page and begins with phonemic
awareness. Phonemic awareness allows the beginning reader to perceive the individual
sounds or phonemes in spoken words that will be represented in printed words with
letters or groups of letters (i.e., graphemes). Although adequate phonemic awareness does
not guarantee skilled reading, evidence suggested that lack of phonemic awareness can be
detrimental to the acquisition of skilled reading (NICHD, 2000). The connections of
135
phonemes to graphemes require explicit instruction. Additionally, knowledge of larger
units of written and spoken language, such as syllables and morphemes, aids the rapid
recognition of words. When words are instantly recognized and reading is fluent,
attention and cognitive resources are available for processing meaning. In short, decoding
is necessary but not sufficient for skilled reading comprehension.
Language comprehension is also a necessary but not sufficient component of
skilled reading comprehension. As Snow (2002) stated, “…the child with limited
vocabulary knowledge, limited world knowledge or both will have difficulty
comprehending texts that presuppose such knowledge, despite an adequate development
of word-recognition and phonological-decoding skills” (p. 23). As important as
vocabulary and prior knowledge are to language comprehension, more critical skills are
the abilities to integrate information and make inferences within a sentence and across
sentences in discourse. Monitoring comprehension, understanding story structure, and
working memory are also needed for skilled reading comprehension.
When assessing students‟ strengths and weaknesses in the components, it is
critical to know what reading comprehension tests are measuring to ensure that correct
interpretations and appropriate instructional decisions will be made. Difficulties in one or
both components may be accompanied or caused by other influences, such as self-esteem,
self-efficacy, motivation, attention, cultural and language issues, complexity and
coherence of the text, and purpose for reading (NICHD, 2000; Snow, 2002). As Snow
(2002), suggested, “comprehension entails three elements:
The reader [bullets and italics in the original] who is doing the
comprehending
136
The text that is to be comprehended
The activity in which comprehension is a part” (p.11).
Ultimately, all three elements need to be considered in determining students‟ reading
comprehension.

137
APPENDIX B
ADDITIONAL METHODOLOGY AND RESULTS
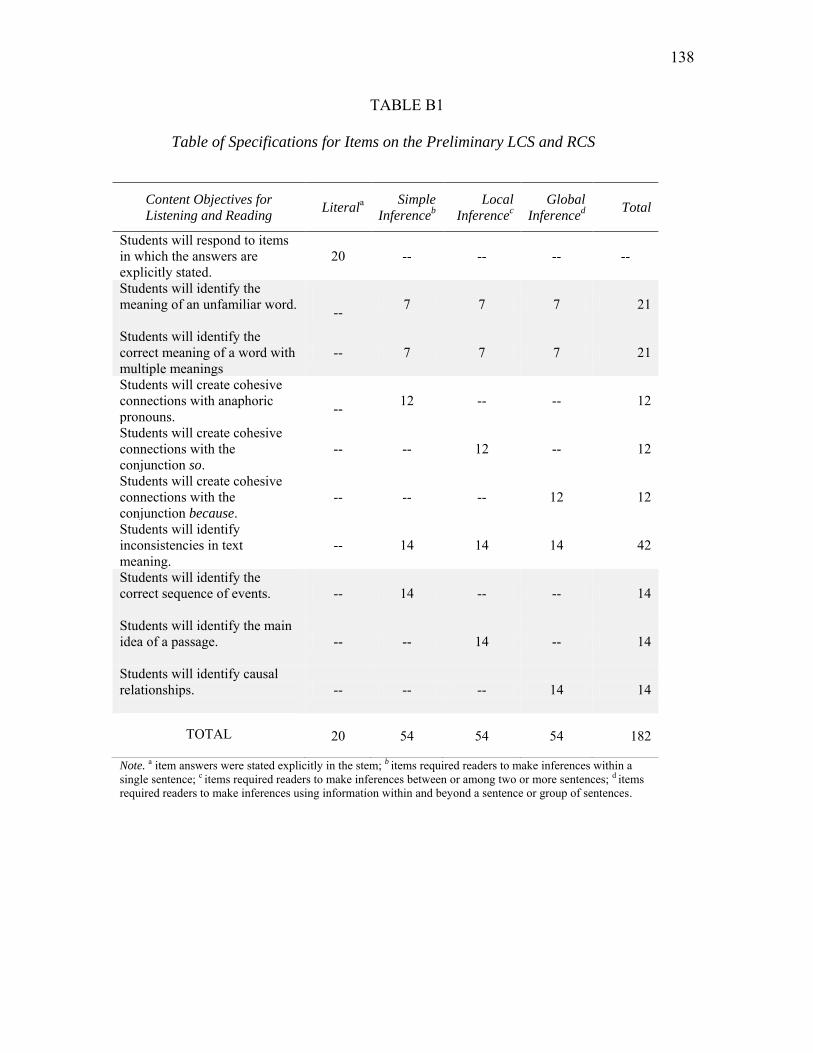
138
TABLE B1
Table of Specifications for Items on the Preliminary LCS and RCS
Note. a item answers were stated explicitly in the stem; b items required readers to make inferences within a single sentence; c items required readers to make inferences between or among two or more sentences; d items required readers to make inferences using information within and beyond a sentence or group of sentences.
Content Objectives for
Listening and Reading Literal
a Simple
Inferenceb
Local
Inferencec
Global
Inferenced
Total
Students will respond to items in which the answers are explicitly stated.
20
-- -- -- --
Students will identify the meaning of an unfamiliar word.
-- 7 7 7 21
Students will identify the correct meaning of a word with multiple meanings
-- 7 7 7 21
Students will create cohesive connections with anaphoric pronouns.
-- 12 -- -- 12
Students will create cohesive connections with the conjunction so.
-- -- 12 -- 12
Students will create cohesive connections with the conjunction because.
-- -- -- 12 12
Students will identify inconsistencies in text meaning.
-- 14 14 14 42
Students will identify the correct sequence of events.
-- 14 -- -- 14
Students will identify the main idea of a passage.
-- -- 14 -- 14
Students will identify causal relationships.
-- -- -- 14 14
TOTAL
20 54 54 54 182
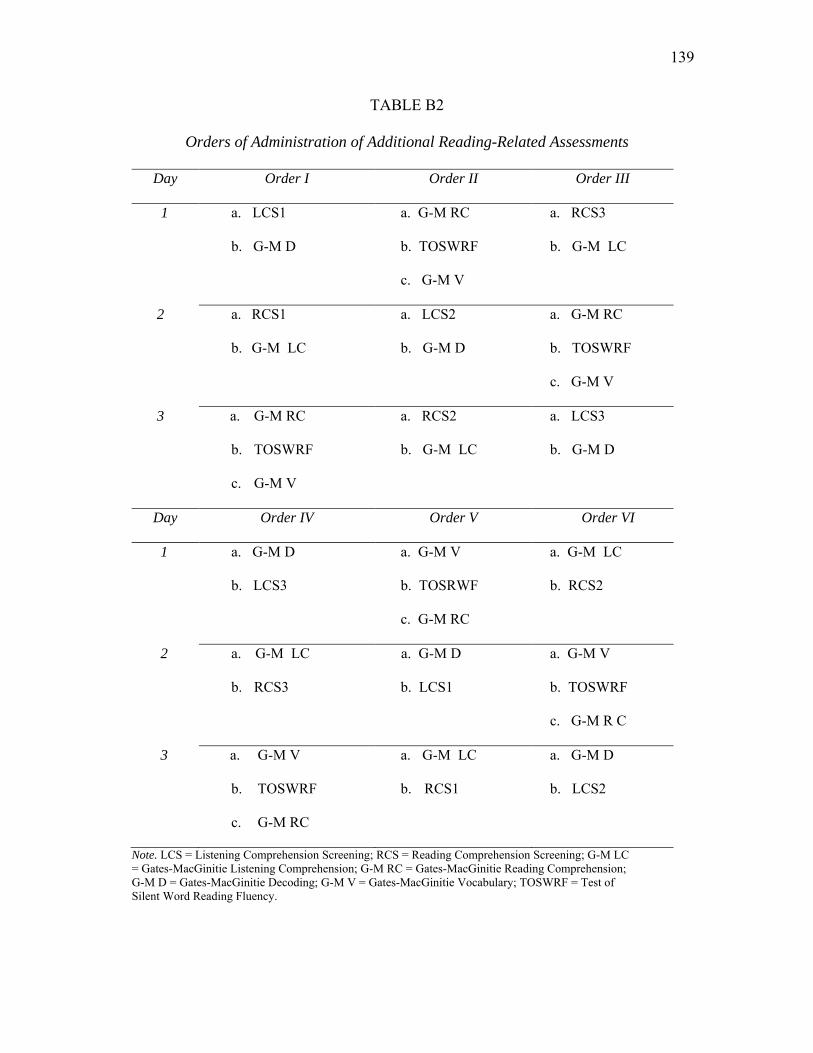
139
TABLE B2
Orders of Administration of Additional Reading-Related Assessments
Day Order I Order II Order III
1 a. LCS1
b. G-M D
a. G-M RC
b. TOSWRF
c. G-M V
a. RCS3
b. G-M LC
2 a. RCS1
b. G-M LC
a. LCS2
b. G-M D
a. G-M RC
b. TOSWRF
c. G-M V
3 a. G-M RC
b. TOSWRF
c. G-M V
a. RCS2
b. G-M LC
a. LCS3
b. G-M D
Day Order IV Order V Order VI
1 a. G-M D
b. LCS3
a. G-M V
b. TOSRWF
c. G-M RC
a. G-M LC
b. RCS2
2 a. G-M LC
b. RCS3
a. G-M D
b. LCS1
a. G-M V
b. TOSWRF
c. G-M R C
3 a. G-M V
b. TOSWRF
c. G-M RC
a. G-M LC
b. RCS1
a. G-M D
b. LCS2
Note. LCS = Listening Comprehension Screening; RCS = Reading Comprehension Screening; G-M LC = Gates-MacGinitie Listening Comprehension; G-M RC = Gates-MacGinitie Reading Comprehension; G-M D = Gates-MacGinitie Decoding; G-M V = Gates-MacGinitie Vocabulary; TOSWRF = Test of Silent Word Reading Fluency.
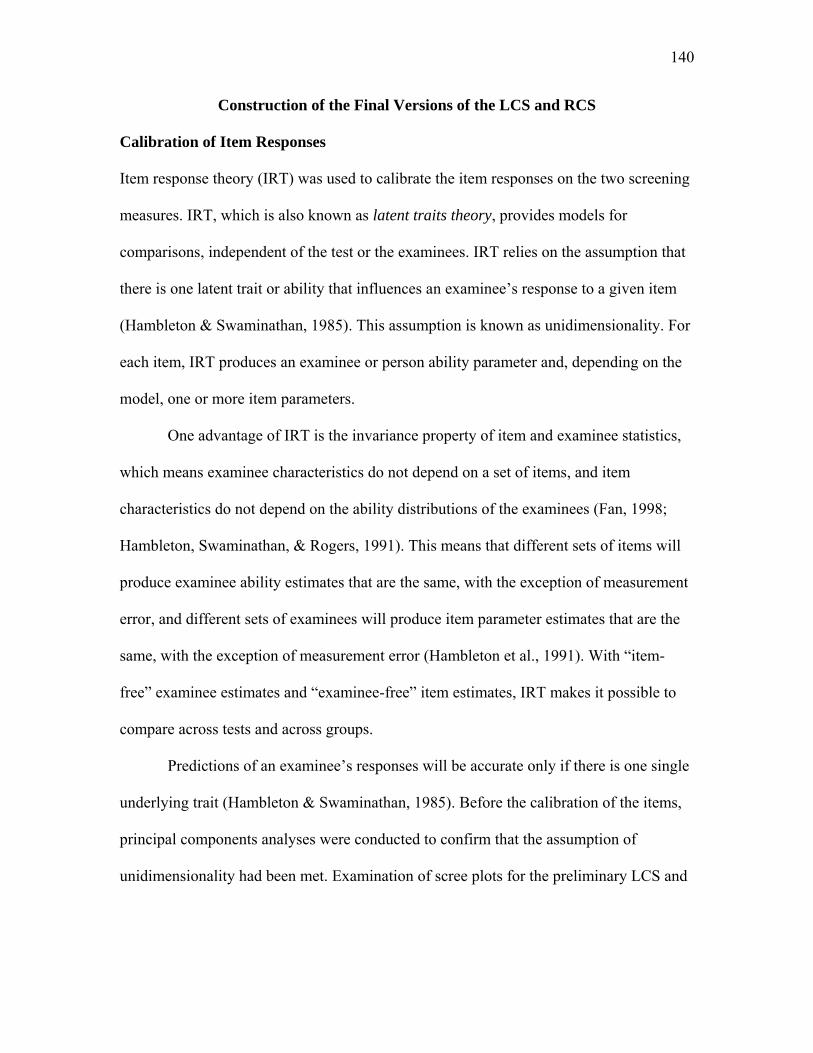
140
Construction of the Final Versions of the LCS and RCS
Calibration of Item Responses
Item response theory (IRT) was used to calibrate the item responses on the two screening
measures. IRT, which is also known as latent traits theory, provides models for
comparisons, independent of the test or the examinees. IRT relies on the assumption that
there is one latent trait or ability that influences an examinee‟s response to a given item
(Hambleton & Swaminathan, 1985). This assumption is known as unidimensionality. For
each item, IRT produces an examinee or person ability parameter and, depending on the
model, one or more item parameters.
One advantage of IRT is the invariance property of item and examinee statistics,
which means examinee characteristics do not depend on a set of items, and item
characteristics do not depend on the ability distributions of the examinees (Fan, 1998;
Hambleton, Swaminathan, & Rogers, 1991). This means that different sets of items will
produce examinee ability estimates that are the same, with the exception of measurement
error, and different sets of examinees will produce item parameter estimates that are the
same, with the exception of measurement error (Hambleton et al., 1991). With “item-
free” examinee estimates and “examinee-free” item estimates, IRT makes it possible to
compare across tests and across groups.
Predictions of an examinee‟s responses will be accurate only if there is one single
underlying trait (Hambleton & Swaminathan, 1985). Before the calibration of the items,
principal components analyses were conducted to confirm that the assumption of
unidimensionality had been met. Examination of scree plots for the preliminary LCS and
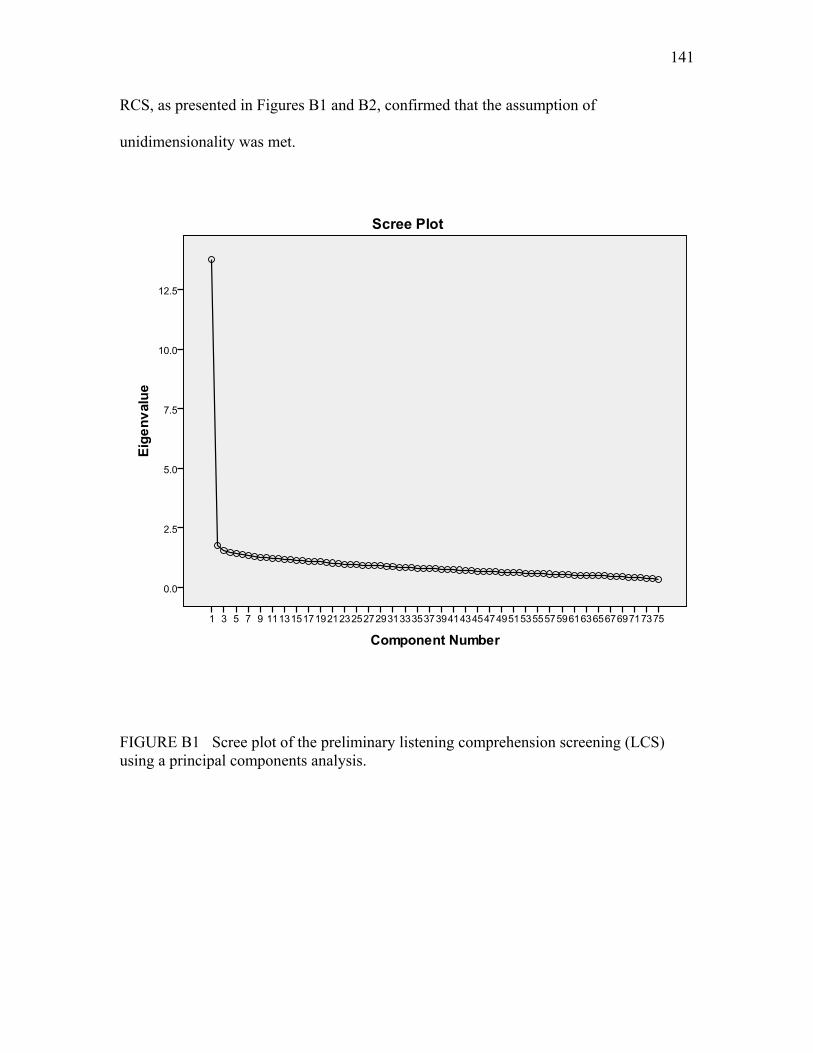
141
RCS, as presented in Figures B1 and B2, confirmed that the assumption of
unidimensionality was met.
FIGURE B1 Scree plot of the preliminary listening comprehension screening (LCS) using a principal components analysis.
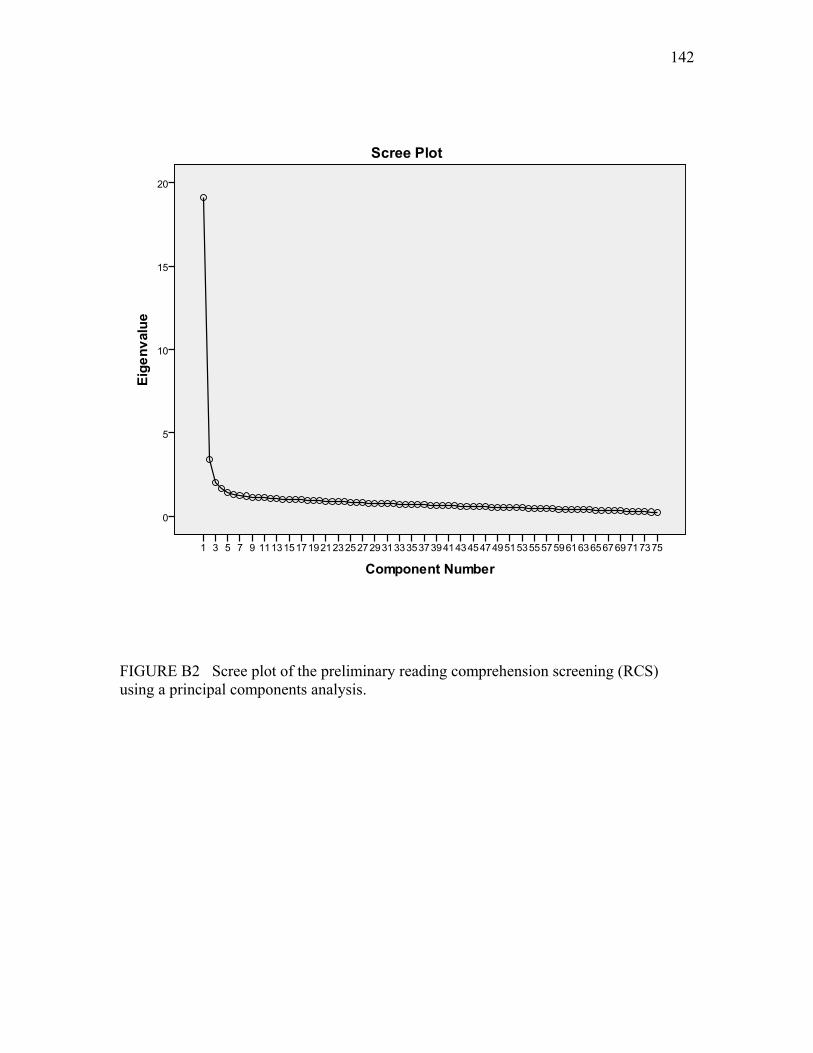
142
FIGURE B2 Scree plot of the preliminary reading comprehension screening (RCS) using a principal components analysis.
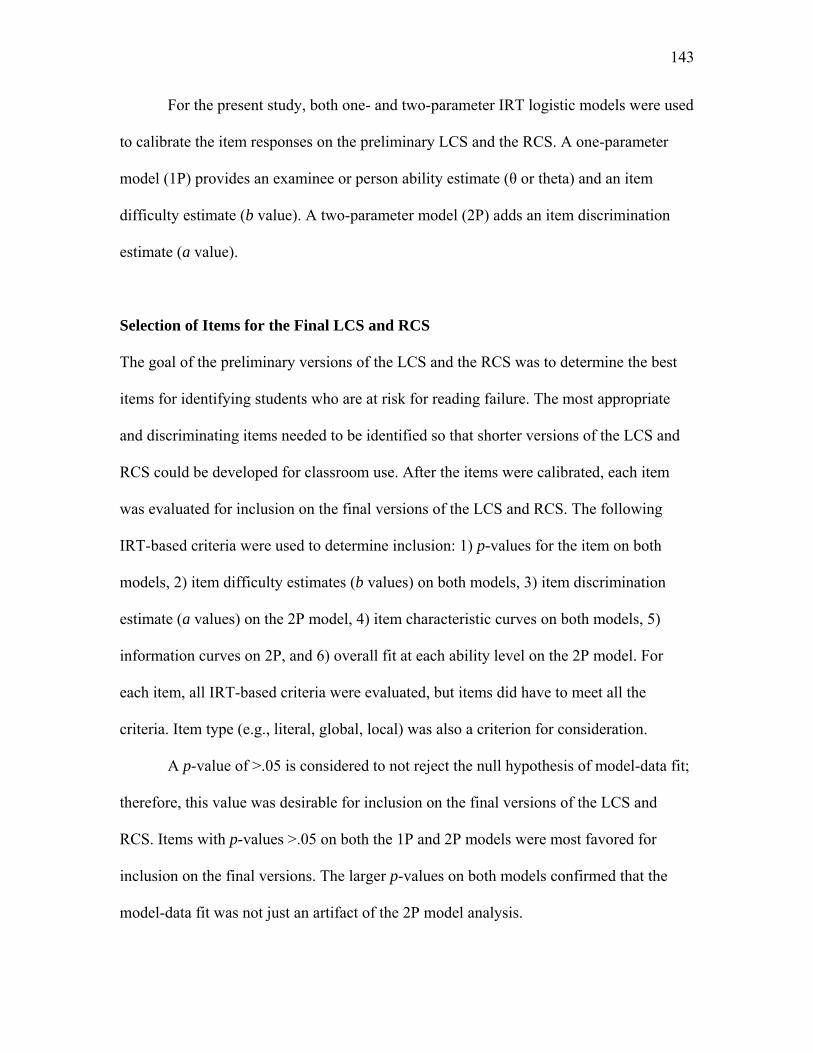
143
For the present study, both one- and two-parameter IRT logistic models were used
to calibrate the item responses on the preliminary LCS and the RCS. A one-parameter
model (1P) provides an examinee or person ability estimate (θ or theta) and an item
difficulty estimate (b value). A two-parameter model (2P) adds an item discrimination
estimate (a value).
Selection of Items for the Final LCS and RCS
The goal of the preliminary versions of the LCS and the RCS was to determine the best
items for identifying students who are at risk for reading failure. The most appropriate
and discriminating items needed to be identified so that shorter versions of the LCS and
RCS could be developed for classroom use. After the items were calibrated, each item
was evaluated for inclusion on the final versions of the LCS and RCS. The following
IRT-based criteria were used to determine inclusion: 1) p-values for the item on both
models, 2) item difficulty estimates (b values) on both models, 3) item discrimination
estimate (a values) on the 2P model, 4) item characteristic curves on both models, 5)
information curves on 2P, and 6) overall fit at each ability level on the 2P model. For
each item, all IRT-based criteria were evaluated, but items did have to meet all the
criteria. Item type (e.g., literal, global, local) was also a criterion for consideration.
A p-value of >.05 is considered to not reject the null hypothesis of model-data fit;
therefore, this value was desirable for inclusion on the final versions of the LCS and
RCS. Items with p-values >.05 on both the 1P and 2P models were most favored for
inclusion on the final versions. The larger p-values on both models confirmed that the
model-data fit was not just an artifact of the 2P model analysis.
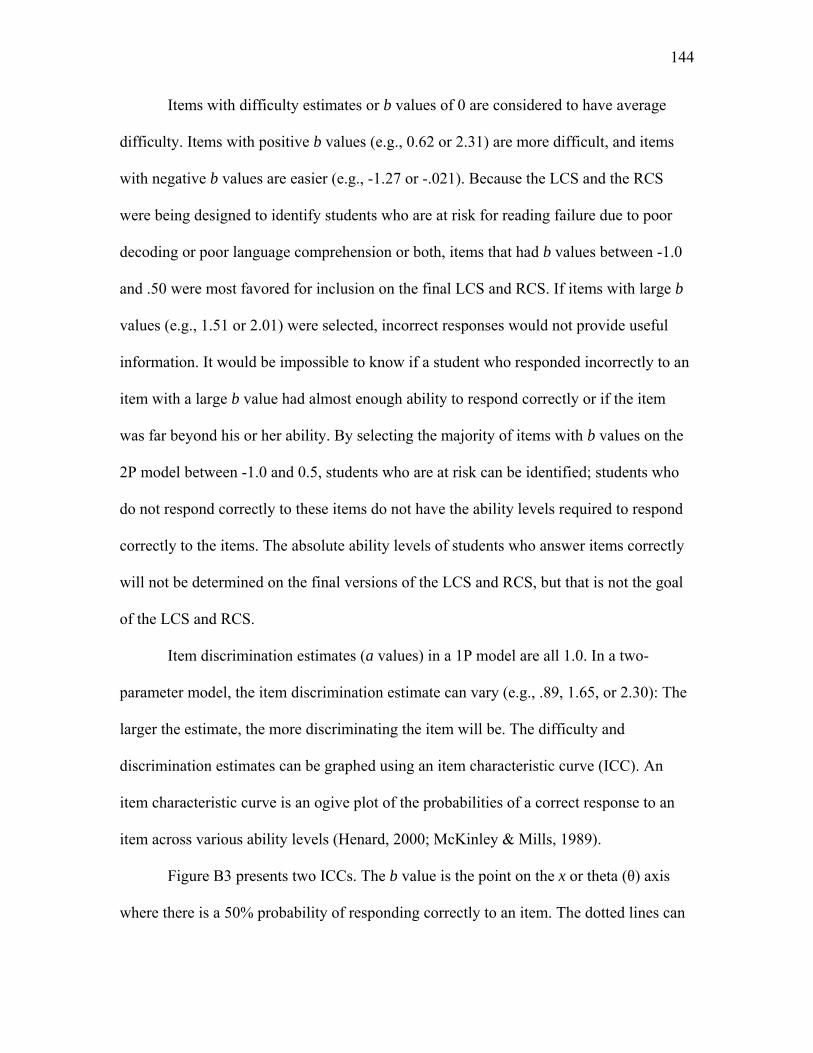
144
Items with difficulty estimates or b values of 0 are considered to have average
difficulty. Items with positive b values (e.g., 0.62 or 2.31) are more difficult, and items
with negative b values are easier (e.g., -1.27 or -.021). Because the LCS and the RCS
were being designed to identify students who are at risk for reading failure due to poor
decoding or poor language comprehension or both, items that had b values between -1.0
and .50 were most favored for inclusion on the final LCS and RCS. If items with large b
values (e.g., 1.51 or 2.01) were selected, incorrect responses would not provide useful
information. It would be impossible to know if a student who responded incorrectly to an
item with a large b value had almost enough ability to respond correctly or if the item
was far beyond his or her ability. By selecting the majority of items with b values on the
2P model between -1.0 and 0.5, students who are at risk can be identified; students who
do not respond correctly to these items do not have the ability levels required to respond
correctly to the items. The absolute ability levels of students who answer items correctly
will not be determined on the final versions of the LCS and RCS, but that is not the goal
of the LCS and RCS.
Item discrimination estimates (a values) in a 1P model are all 1.0. In a two-
parameter model, the item discrimination estimate can vary (e.g., .89, 1.65, or 2.30): The
larger the estimate, the more discriminating the item will be. The difficulty and
discrimination estimates can be graphed using an item characteristic curve (ICC). An
item characteristic curve is an ogive plot of the probabilities of a correct response to an
item across various ability levels (Henard, 2000; McKinley & Mills, 1989).
Figure B3 presents two ICCs. The b value is the point on the x or theta (θ) axis
where there is a 50% probability of responding correctly to an item. The dotted lines can
145
be traced from 50% on the y or probability axis to each ICC and then down to the θ axis.
Because the b value of Item 1 is 0, the item is easier than Item 2, which has a b value
greater than 0. The a value is the slope of an ICC. Because the slope of the ICC for Item
2 is steeper than the slope of the ICC for Item 1, Item 2 is more discriminating than Item
1. The ICCs and a values were consulted for item selection. Items with steeper slopes
(i.e., a value greater than one) have more discriminating information and were favored
over less discriminating items.
FIGURE B3 Item characteristic curves (ICCs) illustrate the relative difficulty and discrimination of two items. Item 2 is more difficult and discriminating than Item 1.
In addition to the ICCs, item information curves and overall model-data fit at each
ability level were also consulted to determine the best items to include on the final
versions of the LCS and RCS. The Figure B4 presents a bell-shaped item information
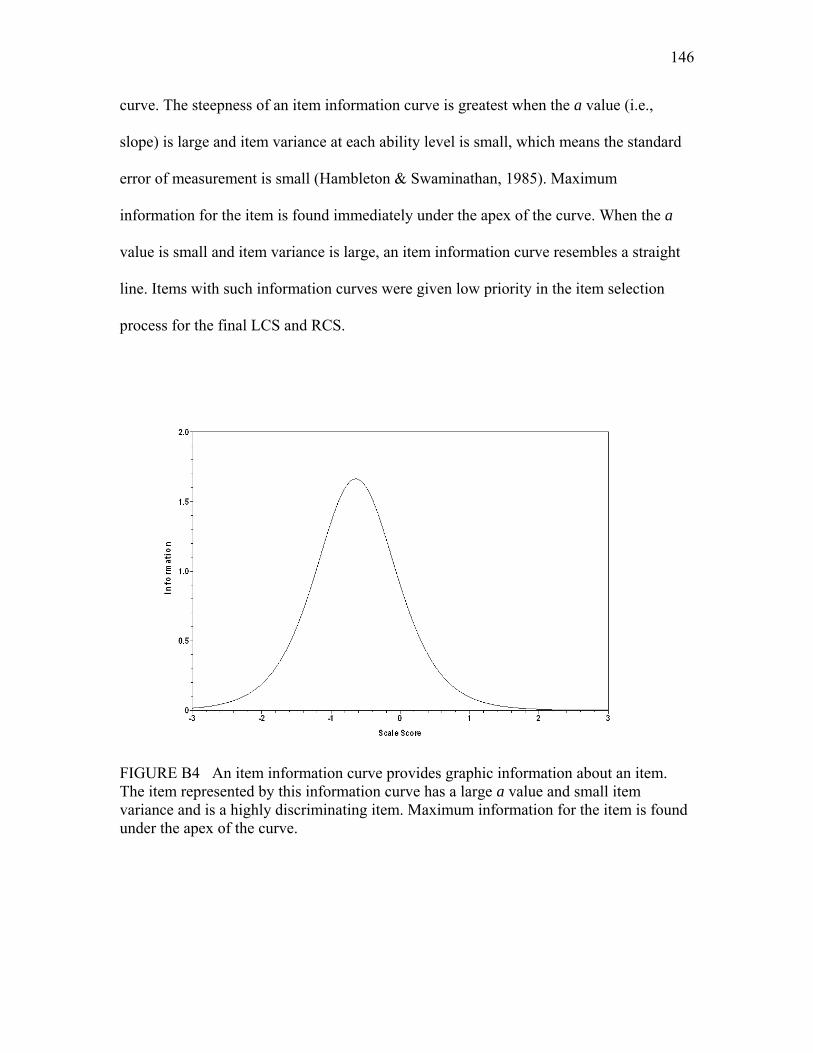
146
curve. The steepness of an item information curve is greatest when the a value (i.e.,
slope) is large and item variance at each ability level is small, which means the standard
error of measurement is small (Hambleton & Swaminathan, 1985). Maximum
information for the item is found immediately under the apex of the curve. When the a
value is small and item variance is large, an item information curve resembles a straight
line. Items with such information curves were given low priority in the item selection
process for the final LCS and RCS.
FIGURE B4 An item information curve provides graphic information about an item. The item represented by this information curve has a large a value and small item variance and is a highly discriminating item. Maximum information for the item is found under the apex of the curve.
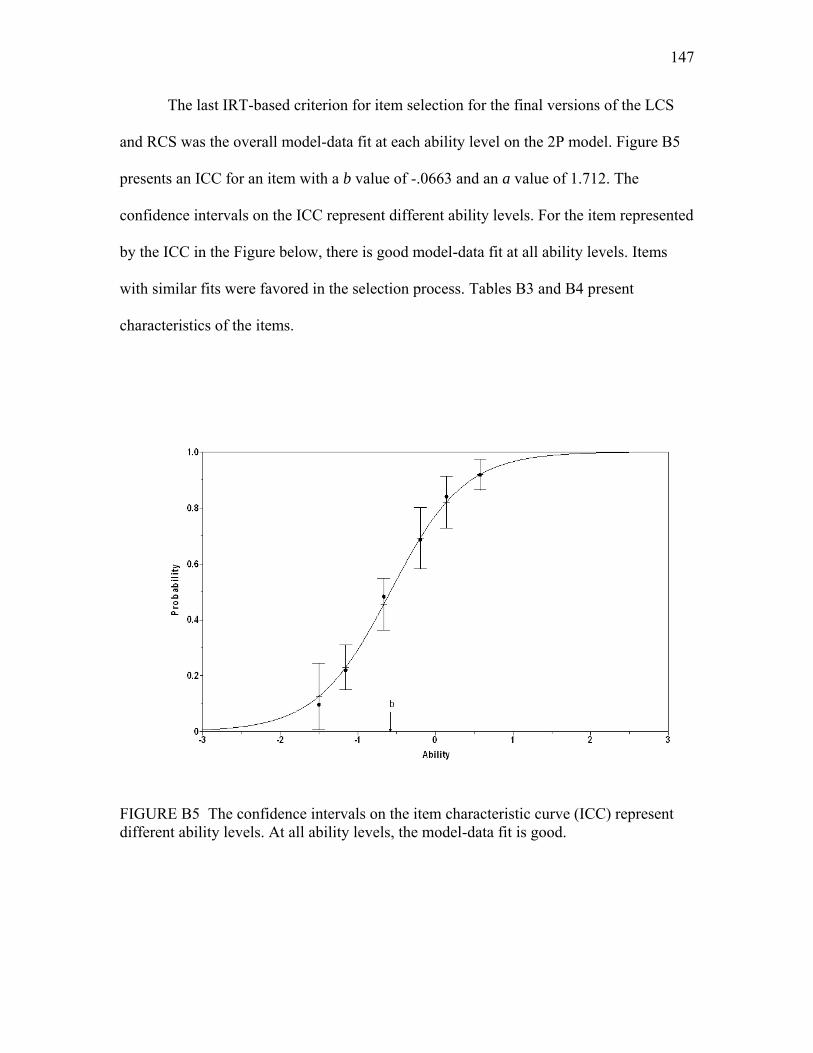
147
The last IRT-based criterion for item selection for the final versions of the LCS
and RCS was the overall model-data fit at each ability level on the 2P model. Figure B5
presents an ICC for an item with a b value of -.0663 and an a value of 1.712. The
confidence intervals on the ICC represent different ability levels. For the item represented
by the ICC in the Figure below, there is good model-data fit at all ability levels. Items
with similar fits were favored in the selection process. Tables B3 and B4 present
characteristics of the items.
FIGURE B5 The confidence intervals on the item characteristic curve (ICC) represent different ability levels. At all ability levels, the model-data fit is good.

148
TABLE B3
Characteristics of Items on the Preliminary Listening Comprehension Screening
b p a b p a
Item 1P 2P 1P/2P 2P Item 1P 2P 1P/2P 2P
1 -1.14 -1.26 .35/.32 0.77 39 -1.38 -1.26 .62/.40 0.99
2 0.10 0.10 .06/.17 0.80 40 -0.35 -0.29 .01/.98 1.33
3 -0.84 -0.77 .26/.83 1.00 41 -1.26 -0.98 .06/.38 1.29
4 0.38 0.47 .27/.31 0.66 42 -0.63 -0.54 .08/.85 1.11
5 -0.63 -0.59 .40/.12 0.98 43 -0.13 -0.13 .53/.15 0.95
6 0.52 0.61 .03/.12 0.70 44 0.13 0.10 .19/.72 1.02
7 0.05 0.02 .18/.76 1.31 45 -0.43 -0.46 .74/.39 0.82
8 -0.71 -0.54 .01/.38 1.37 46 -0.84 -0.92 .08/.20 0.78
9 -0.51 -0.44 .16/.68 1.11 47 0.34 0.30 .62/.39 1.00
10 1.05 2.06 .01/.64 0.40 48 0.13 0.08 .01/.14 1.34
11 -0.10 -0.10 .01/.03 1.20 49 -0.51 -0.50 .54/.68 0.91
12 -2.16 -1.72 .10/.44 1.19 50 -1.13 -2.24 .01/.21 0.39
13 0.17 0.15 .72/.53 0.94 51 0.38 0.55 .07/.80 0.55
14 -0.67 -1.02 .01/.54 0.53 52 -1.44 -1.12 .04/.87 1.26
15 1.78 1.69 .42/.29 0.93 53 -0.94 -0.65 .01/.97 1.71
16 -1.82 -1.60 .01/.04 1.03 54 0.43 0.54 .46/.87 0.66
17 1.02 1.07 .22/.11 0.80 55 0.07 0.05 .22/.72 1.07
18 -1.16 -0.81 .01/.89 1.59 56 0.34 0.47 .01/.01 0.57
19 -2.06 -1.34 .01/.89 1.71 57 -0.39 -0.47 .78/.56 0.70
20 -0.25 -0.25 .17/.27 0.93 58 0.48 1.03 .01/.01 0.36
21 0.32 0.37 .25/.09 0.71 59 -0.92 -0.67 .01/.08 1.46
22 -1.15 -0.84 .01/.77 1.46 60 2.39 6.14 .01/.41 0.30
23 -0.04 -0.05 .46/.64 0.65 61 -0.74 -0.78 .21/.07 0.82
24 0.47 0.82 .01/.63 0.46 62 -0.68 -0.47 .01/.85 1.78
25 -1.26 -1.33 .68/.90 0.82 63 -0.14 -0.22 .01/.01 0.50
26 -0.11 -0.15 .03/.54 0.58 64 0.73 0.61 .07/.58 1.09
27 -0.74 -0.51 .01/.58 1.73 65 -1.24 -0.82 .01/.80 1.78
28 -0.89 -0.74 .12/.97 1.17 66 -1.42 -1.53 .38/.56 0.79
29 -1.16 -1.14 .50/.66 0.90 67 -0.20 -0.27 .06/.52 0.61
30 -0.83 -0.76 .27/.62 1.01 68 -0.71 -1.07 .21/.72 0.53
31 -0.27 -0.28 .61/.18 0.86 69 0.18 0.17 .98/.92 0.87
32 0.65 0.52 .01/.06 1.15 70 -0.29 -0.62 .01/.03 0.35
33 -1.12 -0.82 .01/.37 1.43 71 -1.31 -1.53 .47/.80 0.72
34 0.38 1.71 .01/.01 0.17 72 -0.70 -0.68 .02/.17 0.91
35 -0.34 -0.31 .10/.21 1.02 73 -0.66 -0.73 .20/.34 0.78
36 0.57 0.67 .06/.10 0.70 74 0.02 0.03 .01/.59 0.45
37 -1.84 -1.33 .02/.12 1.43 75 -0.11 -0.10 .01/.28 1.59
38 1.08 1.81 .01/.06 0.47
Note. Underlined items indicate items for inclusion on the final LCS and RCS; 1P = one-parameter model; 2P = two-parameter model; b = item difficulty estimate; p = p-value; a = item discrimination estimate.
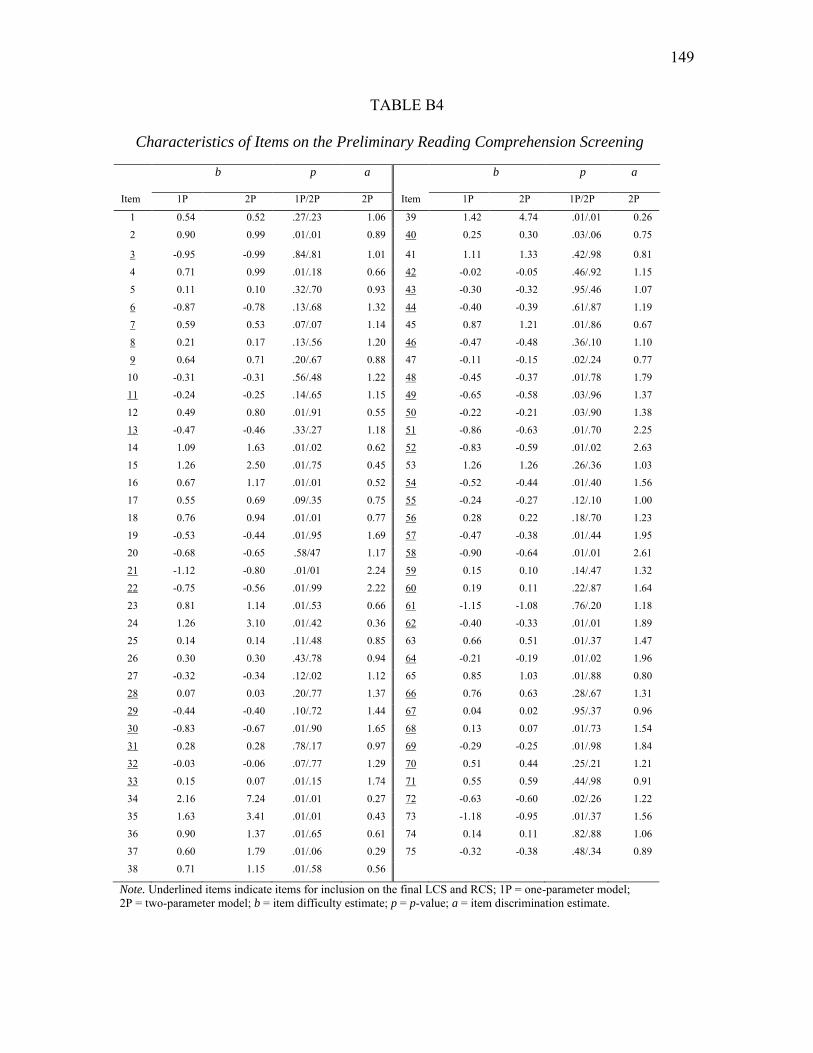
149
TABLE B4
Characteristics of Items on the Preliminary Reading Comprehension Screening
b p a b p a
Item 1P 2P 1P/2P 2P Item 1P 2P 1P/2P 2P
1 0.54 0.52 .27/.23 1.06 39 1.42 4.74 .01/.01 0.26
2 0.90 0.99 .01/.01 0.89 40 0.25 0.30 .03/.06 0.75
3 -0.95 -0.99 .84/.81 1.01 41 1.11 1.33 .42/.98 0.81
4 0.71 0.99 .01/.18 0.66 42 -0.02 -0.05 .46/.92 1.15
5 0.11 0.10 .32/.70 0.93 43 -0.30 -0.32 .95/.46 1.07
6 -0.87 -0.78 .13/.68 1.32 44 -0.40 -0.39 .61/.87 1.19
7 0.59 0.53 .07/.07 1.14 45 0.87 1.21 .01/.86 0.67
8 0.21 0.17 .13/.56 1.20 46 -0.47 -0.48 .36/.10 1.10
9 0.64 0.71 .20/.67 0.88 47 -0.11 -0.15 .02/.24 0.77
10 -0.31 -0.31 .56/.48 1.22 48 -0.45 -0.37 .01/.78 1.79
11 -0.24 -0.25 .14/.65 1.15 49 -0.65 -0.58 .03/.96 1.37
12 0.49 0.80 .01/.91 0.55 50 -0.22 -0.21 .03/.90 1.38
13 -0.47 -0.46 .33/.27 1.18 51 -0.86 -0.63 .01/.70 2.25
14 1.09 1.63 .01/.02 0.62 52 -0.83 -0.59 .01/.02 2.63
15 1.26 2.50 .01/.75 0.45 53 1.26 1.26 .26/.36 1.03
16 0.67 1.17 .01/.01 0.52 54 -0.52 -0.44 .01/.40 1.56
17 0.55 0.69 .09/.35 0.75 55 -0.24 -0.27 .12/.10 1.00
18 0.76 0.94 .01/.01 0.77 56 0.28 0.22 .18/.70 1.23
19 -0.53 -0.44 .01/.95 1.69 57 -0.47 -0.38 .01/.44 1.95
20 -0.68 -0.65 .58/47 1.17 58 -0.90 -0.64 .01/.01 2.61
21 -1.12 -0.80 .01/01 2.24 59 0.15 0.10 .14/.47 1.32
22 -0.75 -0.56 .01/.99 2.22 60 0.19 0.11 .22/.87 1.64
23 0.81 1.14 .01/.53 0.66 61 -1.15 -1.08 .76/.20 1.18
24 1.26 3.10 .01/.42 0.36 62 -0.40 -0.33 .01/.01 1.89
25 0.14 0.14 .11/.48 0.85 63 0.66 0.51 .01/.37 1.47
26 0.30 0.30 .43/.78 0.94 64 -0.21 -0.19 .01/.02 1.96
27 -0.32 -0.34 .12/.02 1.12 65 0.85 1.03 .01/.88 0.80
28 0.07 0.03 .20/.77 1.37 66 0.76 0.63 .28/.67 1.31
29 -0.44 -0.40 .10/.72 1.44 67 0.04 0.02 .95/.37 0.96
30 -0.83 -0.67 .01/.90 1.65 68 0.13 0.07 .01/.73 1.54
31 0.28 0.28 .78/.17 0.97 69 -0.29 -0.25 .01/.98 1.84
32 -0.03 -0.06 .07/.77 1.29 70 0.51 0.44 .25/.21 1.21
33 0.15 0.07 .01/.15 1.74 71 0.55 0.59 .44/.98 0.91
34 2.16 7.24 .01/.01 0.27 72 -0.63 -0.60 .02/.26 1.22
35 1.63 3.41 .01/.01 0.43 73 -1.18 -0.95 .01/.37 1.56
36 0.90 1.37 .01/.65 0.61 74 0.14 0.11 .82/.88 1.06
37 0.60 1.79 .01/.06 0.29 75 -0.32 -0.38 .48/.34 0.89
38 0.71 1.15 .01/.58 0.56
Note. Underlined items indicate items for inclusion on the final LCS and RCS; 1P = one-parameter model; 2P = two-parameter model; b = item difficulty estimate; p = p-value; a = item discrimination estimate.
150
Raw Score Conversions on the LCS and RCS
The scores on the final version of the LCS and the final version of the RCS were
recalibrated using the 2P IRT logistic model. A regression of LCS ability estimates on
items correct was performed (R2 = .95). A conversion scale of raw scores to ability
estimates was then created for the LCS using the following formula:
Ŷ = a + b(x)
where a (the intercept) = -2.690, b (the slope) = .111, x was the number of items correct
out of 42, and Ŷ (y-hat) was the predicted person ability score based on items correct. A
regression of RCS ability estimates on items correct was performed. The R2 was .95. The
same formula was used to create a raw score scale for the RCS, where a = -2.111 and b =
.092.
Standard scores and percentiles were also calculated for the final versions of the
LCS and RCS. Standard scores based on a normal distribution were determined by
multiplying the ability score by a standard deviation of 15 and adding a mean of 100.
Normal Curve Equivalents (NCEs) were determined by multiplying the ability score by a
standard deviation of 21.06 and adding a mean of 50.
To determine percentiles or percentile ranks, the raw scores were ranked from
smallest to largest. The percentiles were then determined using the following formula:
PR = cfi + .5(fi) x 100% N
where PR was percentile rank, cfi was the cumulative frequency of all scores below the
score of interest, fi was the frequency of the score of interest, and N was the total number
of scores. Tables B5, B6, B7, and B8 present raw score conversion data.
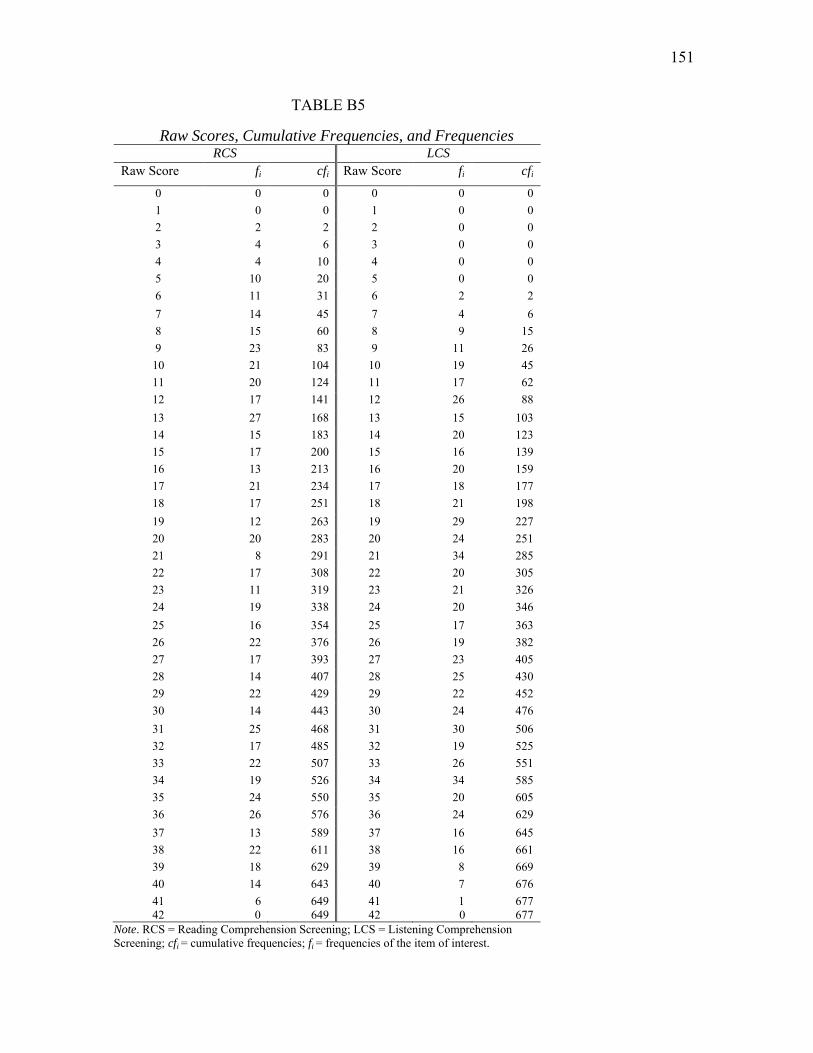
151
TABLE B5
Raw Scores, Cumulative Frequencies, and Frequencies RCS LCS
Raw Score fi cfi Raw Score fi cfi
0 0 0 0 0 0 1 0 0 1 0 0 2 2 2 2 0 0 3 4 6 3 0 0 4 4 10 4 0 0 5 10 20 5 0 0 6 11 31 6 2 2 7 14 45 7 4 6 8 15 60 8 9 15 9 23 83 9 11 26 10 21 104 10 19 45 11 20 124 11 17 62 12 17 141 12 26 88 13 27 168 13 15 103 14 15 183 14 20 123 15 17 200 15 16 139 16 13 213 16 20 159 17 21 234 17 18 177 18 17 251 18 21 198 19 12 263 19 29 227 20 20 283 20 24 251 21 8 291 21 34 285 22 17 308 22 20 305 23 11 319 23 21 326 24 19 338 24 20 346 25 16 354 25 17 363 26 22 376 26 19 382 27 17 393 27 23 405 28 14 407 28 25 430 29 22 429 29 22 452 30 14 443 30 24 476 31 25 468 31 30 506 32 17 485 32 19 525 33 22 507 33 26 551 34 19 526 34 34 585 35 24 550 35 20 605 36 26 576 36 24 629 37 13 589 37 16 645 38 22 611 38 16 661 39 18 629 39 8 669 40 14 643 40 7 676 41 6 649 41 1 677 42 0 649 42 0 677
Note. RCS = Reading Comprehension Screening; LCS = Listening Comprehension Screening; cfi = cumulative frequencies; fi = frequencies of the item of interest.
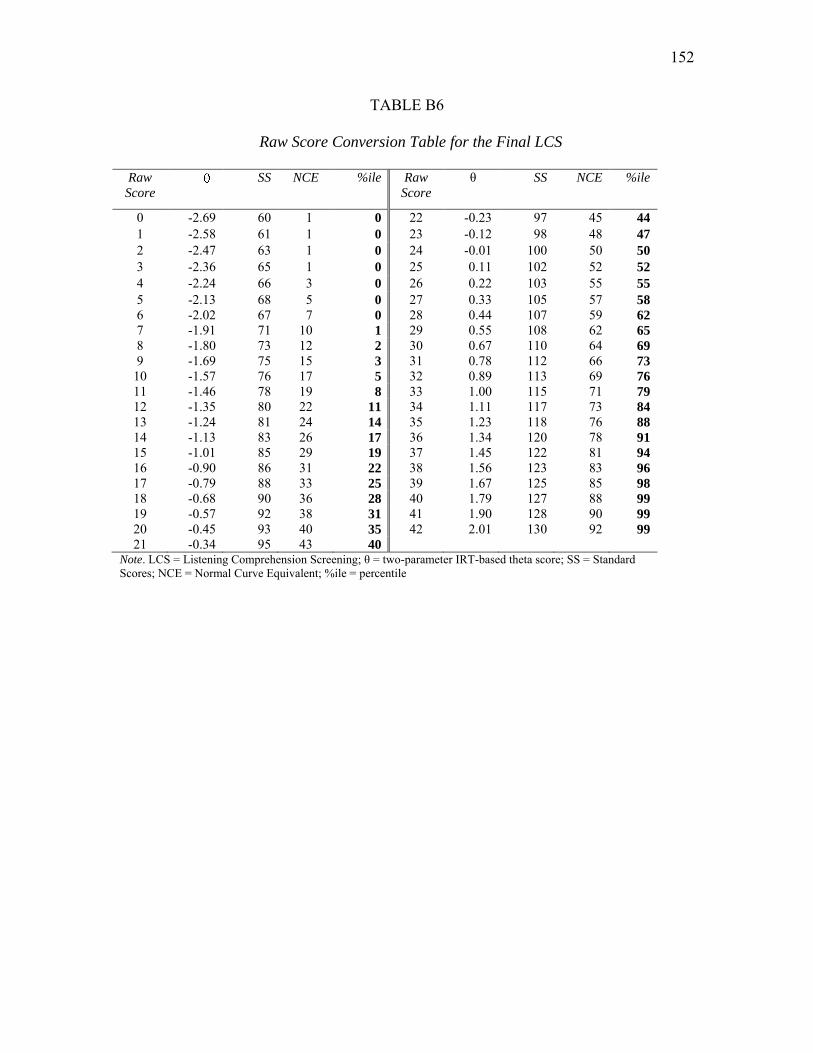
152
TABLE B6
Raw Score Conversion Table for the Final LCS
Raw
Score SS NCE %ile Raw
Score
θ SS NCE %ile
0 -2.69 60 1 0 22 -0.23 97 45 44
1 -2.58 61 1 0 23 -0.12 98 48 47
2 -2.47 63 1 0 24 -0.01 100 50 50
3 -2.36 65 1 0 25 0.11 102 52 52
4 -2.24 66 3 0 26 0.22 103 55 55
5 -2.13 68 5 0 27 0.33 105 57 58
6 -2.02 67 7 0 28 0.44 107 59 62
7 -1.91 71 10 1 29 0.55 108 62 65
8 -1.80 73 12 2 30 0.67 110 64 69
9 -1.69 75 15 3 31 0.78 112 66 73
10 -1.57 76 17 5 32 0.89 113 69 76
11 -1.46 78 19 8 33 1.00 115 71 79
12 -1.35 80 22 11 34 1.11 117 73 84
13 -1.24 81 24 14 35 1.23 118 76 88
14 -1.13 83 26 17 36 1.34 120 78 91
15 -1.01 85 29 19 37 1.45 122 81 94
16 -0.90 86 31 22 38 1.56 123 83 96
17 -0.79 88 33 25 39 1.67 125 85 98
18 -0.68 90 36 28 40 1.79 127 88 99
19 -0.57 92 38 31 41 1.90 128 90 99
20 -0.45 93 40 35 42 2.01 130 92 99
21 -0.34 95 43 40 Note. LCS = Listening Comprehension Screening; θ = two-parameter IRT-based theta score; SS = Standard Scores; NCE = Normal Curve Equivalent; %ile = percentile
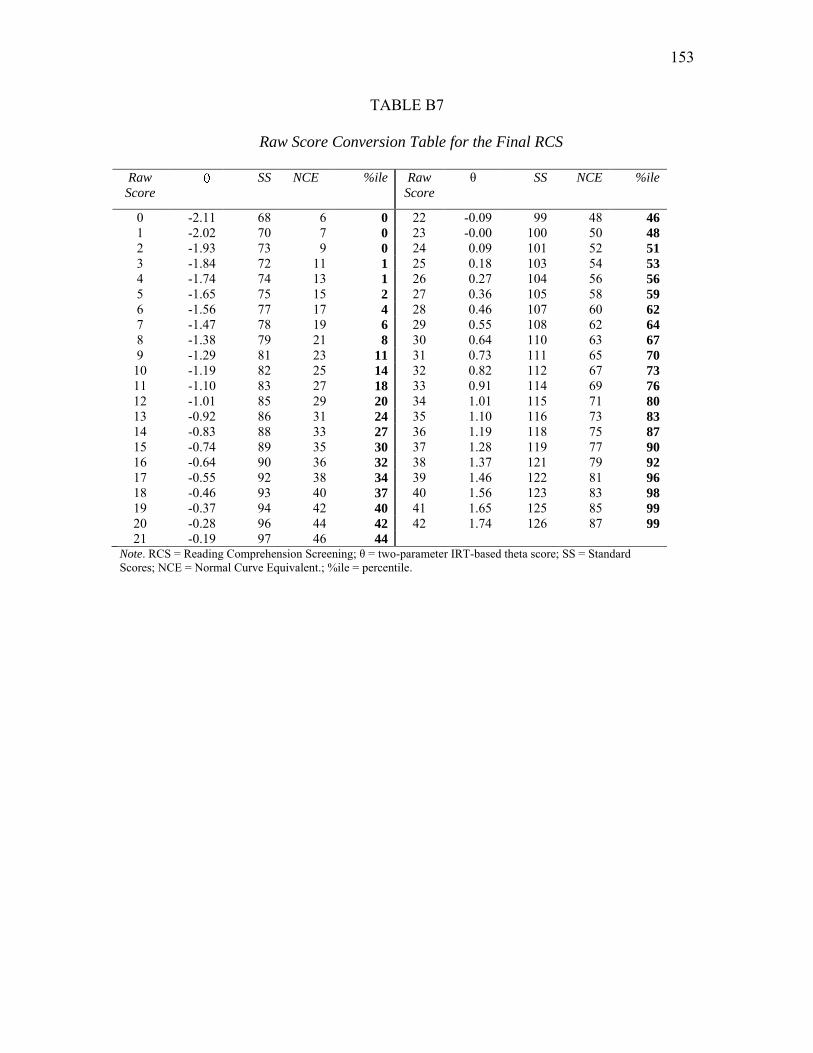
153
TABLE B7
Raw Score Conversion Table for the Final RCS
Raw
Score SS NCE %ile Raw
Score
θ SS NCE %ile
0 -2.11 68 6 0 22 -0.09 99 48 46
1 -2.02 70 7 0 23 -0.00 100 50 48
2 -1.93 73 9 0 24 0.09 101 52 51
3 -1.84 72 11 1 25 0.18 103 54 53
4 -1.74 74 13 1 26 0.27 104 56 56
5 -1.65 75 15 2 27 0.36 105 58 59
6 -1.56 77 17 4 28 0.46 107 60 62
7 -1.47 78 19 6 29 0.55 108 62 64
8 -1.38 79 21 8 30 0.64 110 63 67
9 -1.29 81 23 11 31 0.73 111 65 70
10 -1.19 82 25 14 32 0.82 112 67 73
11 -1.10 83 27 18 33 0.91 114 69 76
12 -1.01 85 29 20 34 1.01 115 71 80
13 -0.92 86 31 24 35 1.10 116 73 83
14 -0.83 88 33 27 36 1.19 118 75 87
15 -0.74 89 35 30 37 1.28 119 77 90
16 -0.64 90 36 32 38 1.37 121 79 92
17 -0.55 92 38 34 39 1.46 122 81 96
18 -0.46 93 40 37 40 1.56 123 83 98
19 -0.37 94 42 40 41 1.65 125 85 99
20 -0.28 96 44 42 42 1.74 126 87 99
21 -0.19 97 46 44 Note. RCS = Reading Comprehension Screening; θ = two-parameter IRT-based theta score; SS = Standard Scores; NCE = Normal Curve Equivalent.; %ile = percentile.
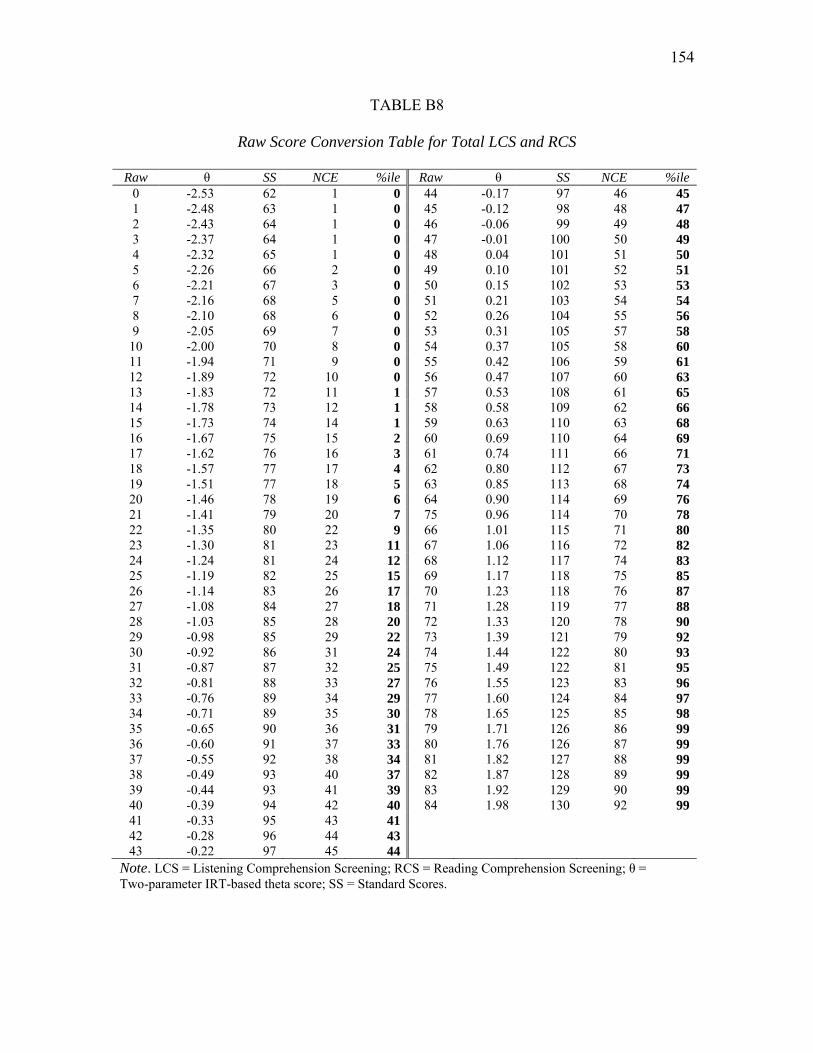
154
TABLE B8
Raw Score Conversion Table for Total LCS and RCS
Raw θ SS NCE %ile Raw θ SS NCE %ile
0 -2.53 62 1 0 44 -0.17 97 46 45
1 -2.48 63 1 0 45 -0.12 98 48 47
2 -2.43 64 1 0 46 -0.06 99 49 48
3 -2.37 64 1 0 47 -0.01 100 50 49
4 -2.32 65 1 0 48 0.04 101 51 50
5 -2.26 66 2 0 49 0.10 101 52 51
6 -2.21 67 3 0 50 0.15 102 53 53
7 -2.16 68 5 0 51 0.21 103 54 54
8 -2.10 68 6 0 52 0.26 104 55 56
9 -2.05 69 7 0 53 0.31 105 57 58
10 -2.00 70 8 0 54 0.37 105 58 60
11 -1.94 71 9 0 55 0.42 106 59 61
12 -1.89 72 10 0 56 0.47 107 60 63
13 -1.83 72 11 1 57 0.53 108 61 65
14 -1.78 73 12 1 58 0.58 109 62 66
15 -1.73 74 14 1 59 0.63 110 63 68
16 -1.67 75 15 2 60 0.69 110 64 69
17 -1.62 76 16 3 61 0.74 111 66 71
18 -1.57 77 17 4 62 0.80 112 67 73
19 -1.51 77 18 5 63 0.85 113 68 74
20 -1.46 78 19 6 64 0.90 114 69 76
21 -1.41 79 20 7 75 0.96 114 70 78
22 -1.35 80 22 9 66 1.01 115 71 80
23 -1.30 81 23 11 67 1.06 116 72 82
24 -1.24 81 24 12 68 1.12 117 74 83
25 -1.19 82 25 15 69 1.17 118 75 85
26 -1.14 83 26 17 70 1.23 118 76 87
27 -1.08 84 27 18 71 1.28 119 77 88
28 -1.03 85 28 20 72 1.33 120 78 90
29 -0.98 85 29 22 73 1.39 121 79 92
30 -0.92 86 31 24 74 1.44 122 80 93
31 -0.87 87 32 25 75 1.49 122 81 95
32 -0.81 88 33 27 76 1.55 123 83 96
33 -0.76 89 34 29 77 1.60 124 84 97
34 -0.71 89 35 30 78 1.65 125 85 98
35 -0.65 90 36 31 79 1.71 126 86 99
36 -0.60 91 37 33 80 1.76 126 87 99
37 -0.55 92 38 34 81 1.82 127 88 99
38 -0.49 93 40 37 82 1.87 128 89 99
39 -0.44 93 41 39 83 1.92 129 90 99
40 -0.39 94 42 40 84 1.98 130 92 99
41 -0.33 95 43 41
42 -0.28 96 44 43
43 -0.22 97 45 44
Note. LCS = Listening Comprehension Screening; RCS = Reading Comprehension Screening; θ = Two-parameter IRT-based theta score; SS = Standard Scores.
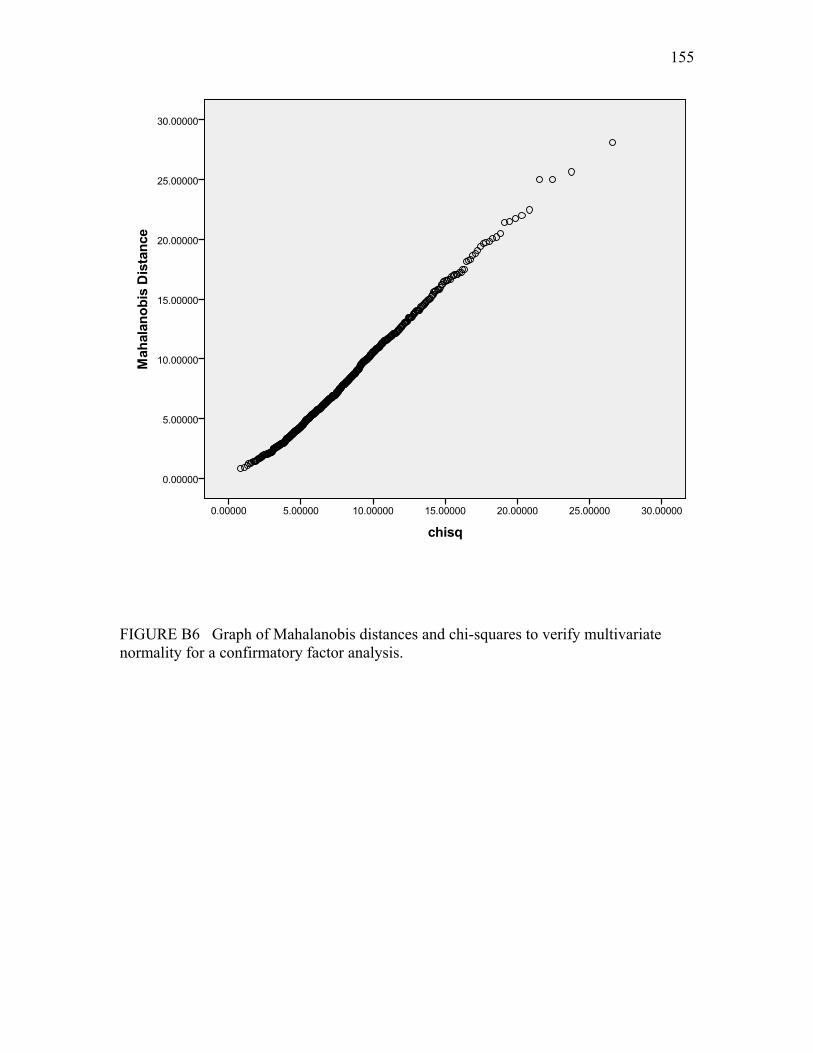
155
FIGURE B6 Graph of Mahalanobis distances and chi-squares to verify multivariate normality for a confirmatory factor analysis.
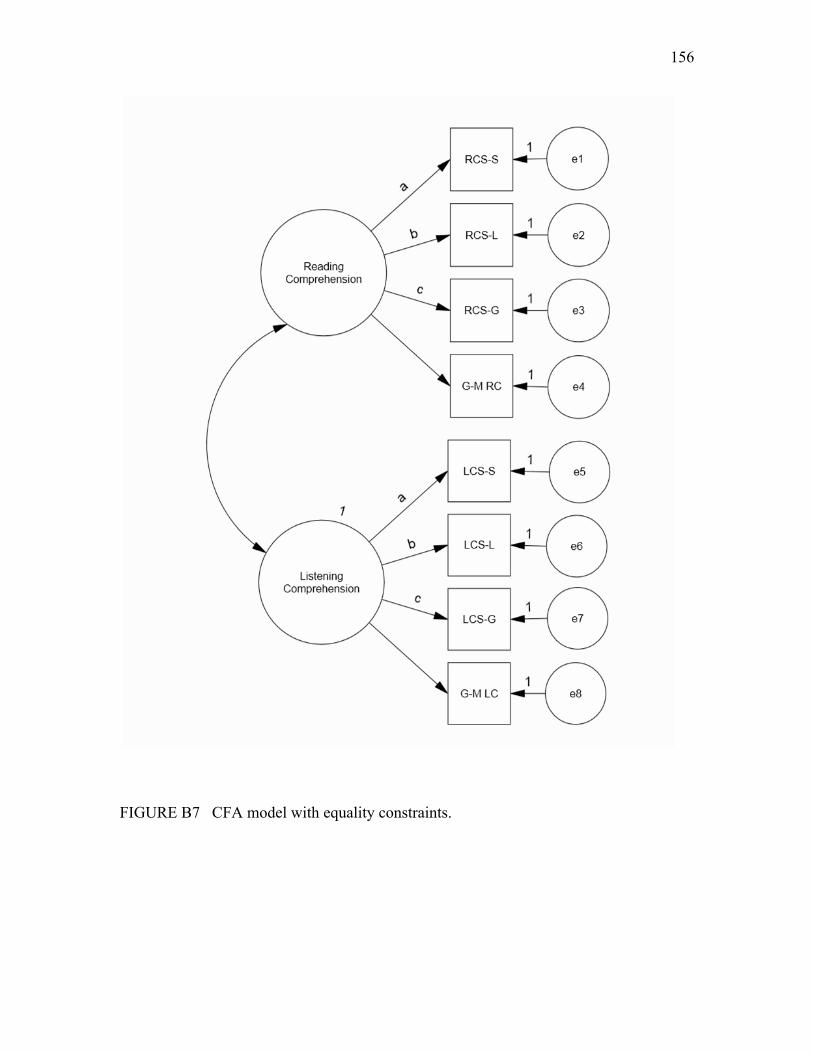
156
FIGURE B7 CFA model with equality constraints.
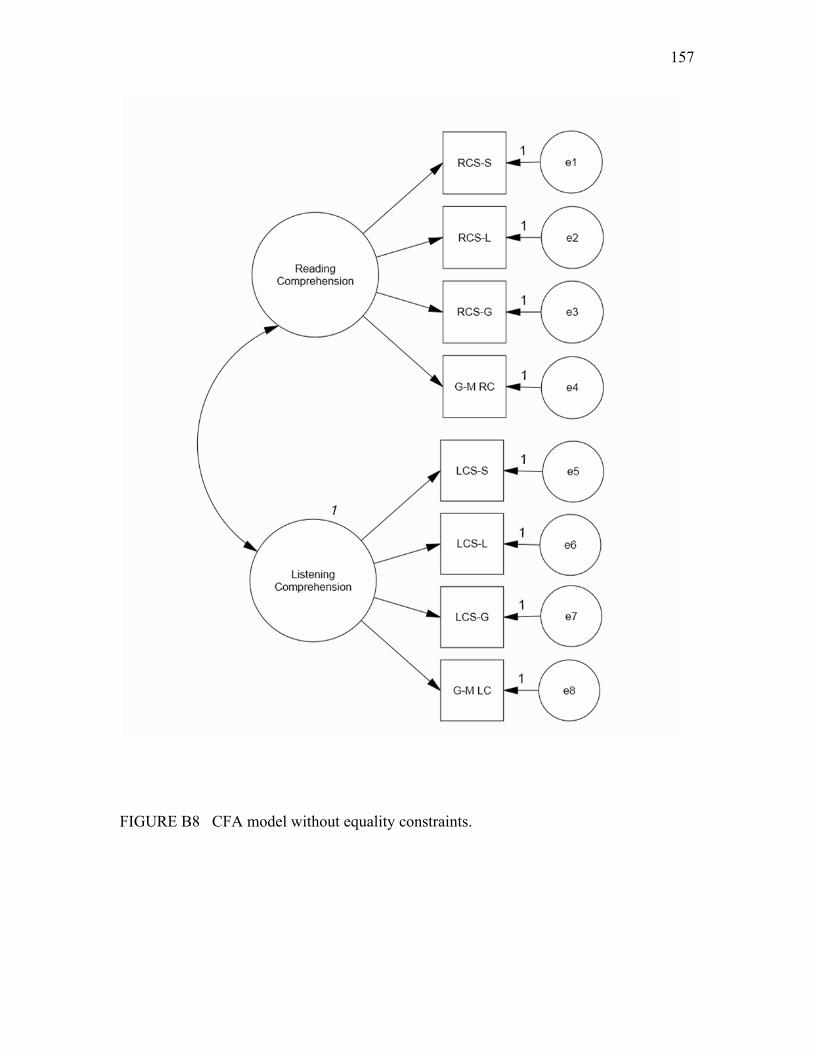
157
FIGURE B8 CFA model without equality constraints.
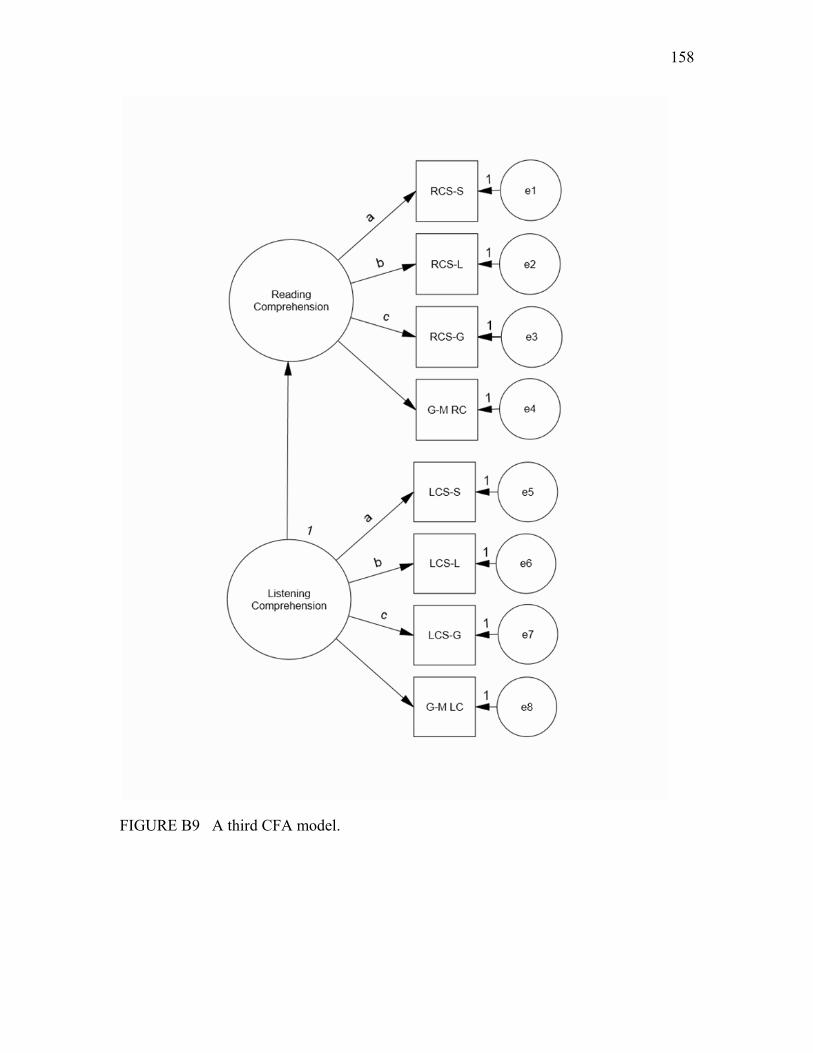
158
FIGURE B9 A third CFA model.
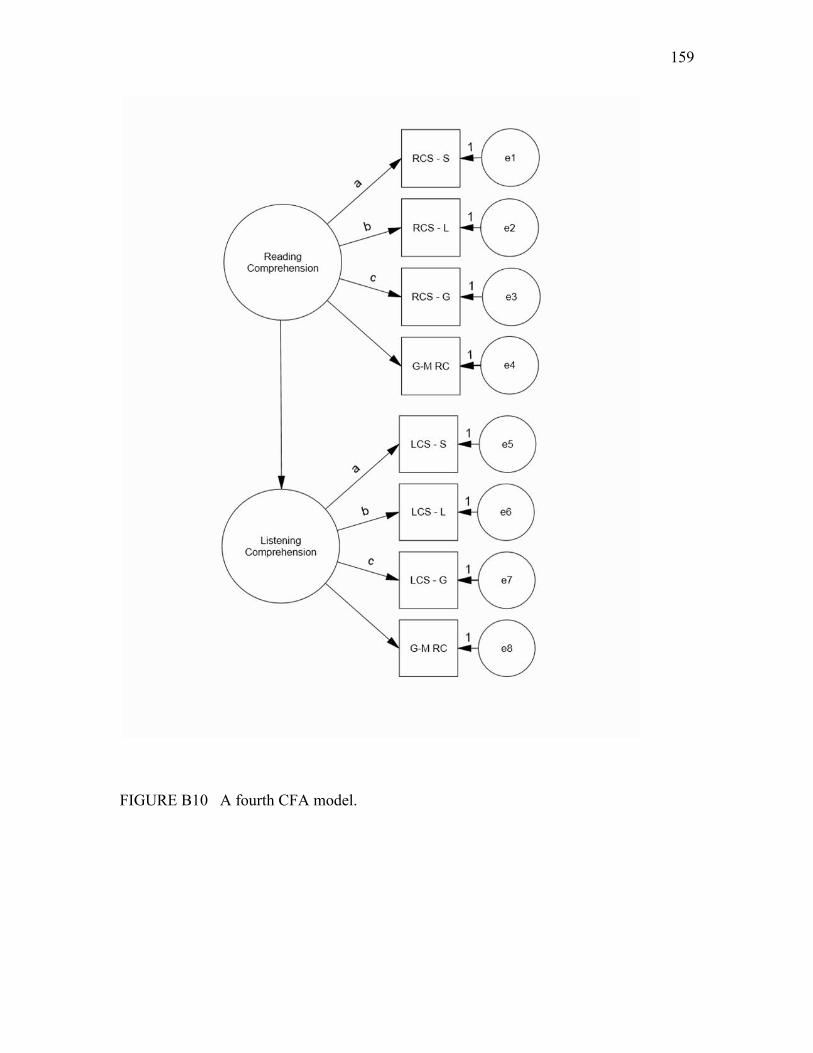
159
FIGURE B10 A fourth CFA model.
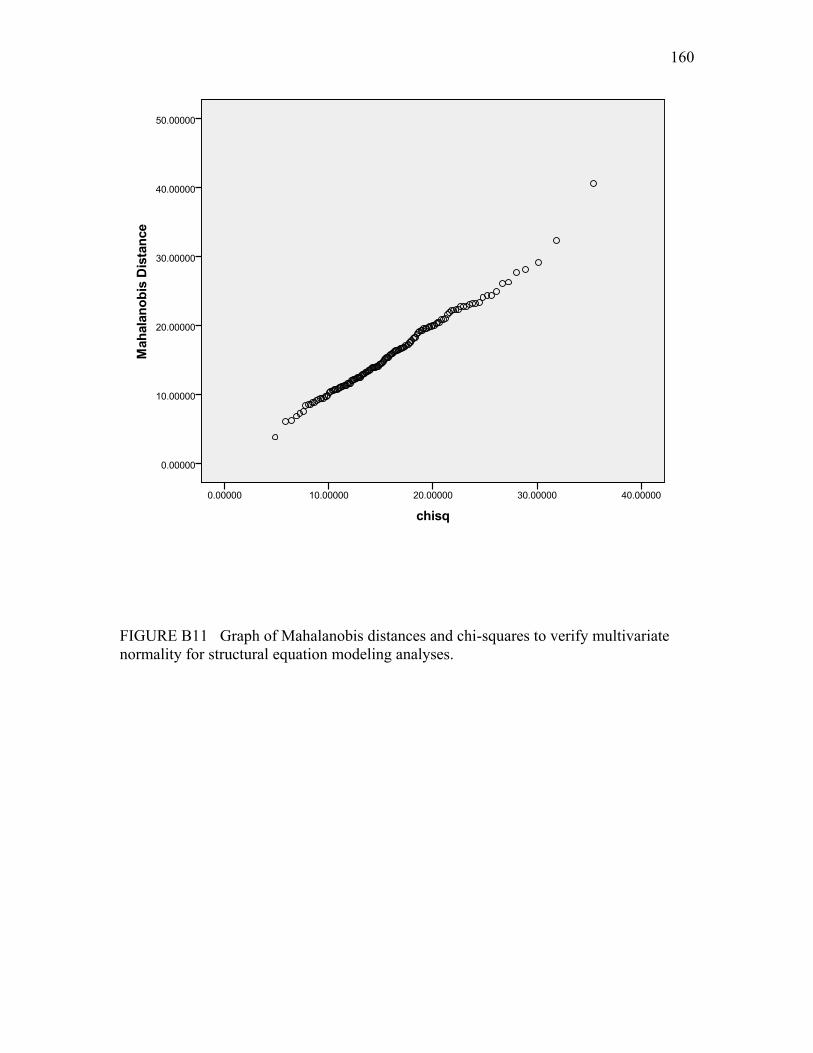
160
FIGURE B11 Graph of Mahalanobis distances and chi-squares to verify multivariate normality for structural equation modeling analyses.
161
VITA
Suzanne Huff Carreker, Neuhaus Education Center, 4433 Bissonnet, Bellaire, TX 77401
Educational Experience
Ph.D., Texas A&M University, Curriculum and Instruction, 2011
M.S., Texas A&M University, Curriculum and Instruction, 2007
B.A., Hood College, Special Education, 1976
Professional Experience
V. P., Research and Program Development, Neuhaus Education Center, 2006 to present
Instructor and Director of Teacher Development, Neuhaus Education Center, 1987-2006
Classroom Teacher and Consultant, The Briarwood School, Houston, TX, 1976-1987
Selected Publications
Carreker, S., & Birsh, J. R. (2011). Multisensory teaching of basic language skills activity
book (2nd ed.). Baltimore, MD: Brookes Publishing Co.
Carreker, S. (2011). Teaching reading: Accurate decoding and fluency. In J. R. Birsh
(Ed.), Multisensory teaching of basic language skills (3nd ed.). Baltimore, MD:
Brookes Publishing Co.
Carreker, S., Joshi, R. M., & Boulware-Gooden, R. (2010). Spelling-related teacher
knowledge and the impact of professional development on Identifying appropriate
instructional activities. Learning Disability Quarterly, 33, 148-158.
Joshi, R. M., Treiman, R., Carreker, S., & Moats, L. C. (2008/2009). How words cast
their spell: Spelling instruction focused on language, not memory, improves reading
and writing. American Educator, 32(4), 6-16, 42-43.


![Welcome [chongfu.moe.edu.sg] · 2019-03-01 · Listening Comprehension (Abt 35 min) Listening Comprehension MCQ 20 10% 3 Listening Comprehension (Abt 35 min) Listening Comprehension](https://img.pdfslide.net/doc/110x75/5f540e2f88cbf0034723ba34/welcome-2019-03-01-listening-comprehension-abt-35-min-listening-comprehension.jpg)