Embed Size (px)
Citation preview

Rochester Institute of TechnologyRIT Scholar Works
Theses Thesis/Dissertation Collections
5-1-1991
The Effects of blanket tension and squeeze pressureon slur and doubling using conventional andcompressable blankets in sheetfed offsetlithographyAlexander M. Voutsas
Follow this and additional works at: http://scholarworks.rit.edu/theses
This Thesis is brought to you for free and open access by the Thesis/Dissertation Collections at RIT Scholar Works. It has been accepted for inclusionin Theses by an authorized administrator of RIT Scholar Works. For more information, please contact [email protected].
Recommended CitationVoutsas, Alexander M., "The Effects of blanket tension and squeeze pressure on slur and doubling using conventional andcompressable blankets in sheetfed offset lithography" (1991). Thesis. Rochester Institute of Technology. Accessed from

The Effects of Blanket Tension and Squeeze Pressure on Slur and
Doubling Using Conventional and Compressible Blankets in Sheetfed
Offset Lithography
by
Alexander M. Voutsas Jr.
A thesis submitted in partial fulfillment of the
requirements for the degree of Master of Science in the
School of Printing Management and Sciences in the College
of Graphic Arts and Photography of the
Rochester Institute of Technology
May 1991
Thesis Advisor: Professor Clifton Frazier

School of Printing Management and SciencesRochester Institute of Technology
Rochester, New York
Certificate of Approval
Master's Thesis
This is to certify that the Master's Thesis of
Alexander M. Voutsas Jr.
With a major in Printing Technologyhas been approved by the Thesis Committee as satisfactoryfor the thesis requirements for the Master of Science degree
at the convocation of
May 1991
Thesis Committee:
Cliff FrazierThesis Advisor
Joseph L. NogaGraduate Program Coordinator
Miles SouthworthDirector or Designate

The Effects of Blanket Tension and Squeeze Pressure on Slur and
Doubling Using Conventional and Compressible Blankets in Sheetfed
Offset Lithography
I, Alexander M Voutsas Jr. hereby grant permission to the Wallace Memorial Library
of R.I.T. to reproduce my thesis in whole or in part. Any reproduction will not be for
commercial use or profit.
May 1991

I dedicate my thesis to Platon
in

Acknowledgments
I would like to thank the following people for their help, advice, and tolerance that
they showed to me from the inception to the completion of this thesis:
Wiiliam Moore, Joe Byers, Bob Andrew; Reeves Bros. Inc. Wiiliam Eisner, Clifton
Frasier, Charles Layne, Ching Chen, Dave Cohen, Sven Ahrenkilde, Franz Sigg,
Eric Sanderson, Barbara Giordano, Bob Hacker II, the R.I.T. Web Press crew,
Elfreda and John Mott, Steve Clark, Jim Manning, the R.I.T. Center for Quality and
Applied Statistics, Kelly LaForest, Katrin Eisman, Anastasia Constantacatos, John
Voutsas. I also thank the Vasil family for their support.
IV

TABLE OF CONTENTS
LIST OF FIGURES viii
LIST OF TABLES x
ABSTRACT xi
Chapters
1. INTRODUCTION 1
The Problem 1
Background 2
Conventional Blankets 4
Compressible Blankets 6
Compressible Layer 6
Surface Topography of Blankets 7
Blanket Performance Standards 8
Chapter 1 Endnotes 9
2. THEORETICAL BASES 12
Packing 12
Cylinder 12
Plate-to-Blanket Settings 1 2
True Rolling Theory 14
Equal Diameter Theory 17
Compressible Layer Construction 17
Microspheres 1 8
Blanket Tension 20
Response Variables 22
Dot Gain 22
Slur 23
Doubling 24
Murray-Davies Equation 24
Chapter 2 Endnotes 27
3. REVIEW OF THE LITERATURE 29
Chapter 3 Endnotes 31

TABLE OF CONTENTS (continued)
4. HYPOTHESES 32
5. METHODOLODGY 33
Blankets 35
Blanket Packing 35
Blanket Tensioning 37
Paper. 38
Ink 38
Plate 42
Targets 42
GATF Ladder Target 42
RIT Experimental Doubling Target 43
UGRAWedge Target 45
Analysis 46
Instumentation andEquipment 48
Chapters Endnotes 50
6. THE RESULTS 52
7. SUMMARY AND CONCLUSIONS 55
OtherObservations 57
8. RECOMENDATIONS FOR FURTHER STUDY. 58
9. BIBLIOGRAPHY. 60
APPENDIX A 65
Factor Breakdown and Slur Values of Obtained Data 66
Factor Breakdown and Total Dot Gain Values of Obtained Data 69
APPENDIX B 72
ANOVA for Obtained Slur Values 73
Fisher Test for Slur Values 75
ANOVA for Obtained Total Dot Gain Values 76
Fisher Test for Total Dot Gain Values 78
VI

TABLE OF CONTENTS (continued)APPENDIX C 79
Histograms of Slur Values 80
Histograms of Dot Gain Values 83
APPENDIX D 87
Table 7- Mean Values of Dot Gain 88
Table 8- Mean Values of Slur. 89
APPENDIX E 90
Press Sheet Sample
VII

LIST OF FIGURES
1. Cylinder arrangement in sheetfed offset lithography. 3
2. The 'ductorandknife'
roller 6
3. Compressible blanket construction 6
4. The parts of a blanket cylinder 13
5. Bearer contact arrangement 15
6. Bearer clearance arrangement 15
7. Relationship of two gears meshing 16
8. Blanket'bulge'
characteristics for conventional and
compressible blankets 16
9. Four methods of compressible layer construction 19
10. Packing versus squeeze pressure for conventional and
compressible blankets 21
1 1 . Packing versus dot gain for conventional and
compressible blankets 21
12. Dot gain characteristics 23
13. T-bar lockup system 39
14. Single reel rod lockup system 40
15. Double reel rod lockup system 41
16. GATF Ladder target 43
VIM

LIST OF FIGURES (continued)
17. R.I.T. Experimental Doubling Target 44
18. UGRAWedge target 46
IX

LIST OF TABLES
1 . Factor Breakdown and Slur Values of Obtained Data 66
2. Factor Breakdown and Total Dot Gain Values of Obtained Data 69
3. ANOVA for Obtained Slur Values 73
Fisher Test for Slur Values 75
4. ANOVA for Obtained Total Dot Gain Values 76
Fisher Test for Total Dot Gain Values 78
5. Histograms of Slur Values 80
6. Histograms of Dot Gain Values 84
7. Mean Values of Dot Gain 88
8. Mean Values of Slur. 89

Abstract
Dot gain is a printing characteristic which has an effect on printing quality, if it
is not controlled. It refers to the physical increase in size for a printed dot during the
transfer process between the film and the printed sheet. The purpose of this
experiment was to determine whether varying squeeze pressure and blanket
tension settings significantly affected directional dot gain (slur and doubling),
therefore printing quality, using conventional and compressible types of offset
lithographic blankets.
The experiment was performed on the second unit of a two-color Heidelberg
MOZP sheetfed offset lithographic press, bypassing the first unit. Directional dot
gain was evaluated by density readings taken from four RIT Experimental Doubling
Targets.
An analysis of variance (ANOVA) was performed to determine whether
statistically significant differences in dot gain values occured. It was found that
squeeze pressure was a significant factor contributing to the magnitude of slur for
both types of blankets, while blanket tension was not. The Fisher test determined
that each of the squeeze pressure settings (.006 in. and .008 in. for conventional
blankets, .006 in. and .012 in. for compressible blankets) contributed the most
towards the difference in dot gain values, while the type of blanket and the different
settings of squeeze pressure also contributed to dot gain.
Visual examination of the press sheets revealed that directional dot gain
occurred at the higher squeeze pressure settings for both conventional and
compressible blankets. When both squeeze pressure and blanket tension settings
increased, larger dot gain values were detected on conventional blankets. As

blanket tension settings increased, dot gain decreased in compressible blankets,
since the increased tension decreased the squeeze pressure, by thinning out the
blanket.This trend was also noticed on the conventional blankets at the low
squeeze pressure setting.
XII

CHAPTER 1
INTRODUCTION
The Problem
Dot gain is a printing characteristic which has an effect on printing quality if
its magnitude is not controlled. Dot gain refers to the physical increase in size for a
printed dot that occurs during the transfer process from the film to the printed sheet.
The main factors which are assumed to cause dot gain are squeeze pressure (the
pressure that exists between the plate and the blanket due to varying packing
levels of each), blanket tension (the tension applied on the blanket around its
cylinder), the type of blanket, type of ink, and the type of paper used.
The purpose of this experiment was to determine whether varying squeeze
pressure and blanket tension significantly affected directional dot gain, therefore
printing quality, using conventional and compressible offset lithographic blankets.
This experiment was performed on the second unit of a two color Heidelberg
MOZP sheetfed offset lithographic press, bypassing the first unit. Only one color ink
(black) was used in order to minimize the variables in this experiment.
The interest in this study arose from the fact that little research has been
published on offset lithographic blankets, and furthermore, the experiments that
have been done did not study the concept of tension and its effect on dot gain.

Background
Of all printing done in North America today, 47% is produced via the lithographic
process.1 The lithographic process exists in two forms, direct and offset. Direct
lithography, as its name implies, prints directly from the image carrier to the
substrate, like for instance with stone lithography. Offset lithography, on the other
hand, incorporates the use of an offset blanket which consists of two-to-four layers
or plies of cotton cloth laminated together coated with many thin layers of rubber.
The inked image is transferred to the substrate from the image carrier via the
blanket, hence the term offset lithography. Offset lithography produces a higher
volume of printing than direct lithography, because of its better quality and its
versatility in substrate use.
Before the advent of offset lithography, quality printing containing fine line
work and halftones could only be achieved through the use of premium printing
papers. All printing was done directly from the image carrier to the substrate,
hence, the need for papers with a very smooth and uniform surface. With the
introduction of the offset proocess, which incorporated a rubber blanket, quality
printing could be achieved on almost any substrate type (printable matter) because
of the pliable nature of the rubber, which allowed the blanket to mold itself onto the
paper. This allowed for longer run lengths, due to less wear on the plate by running
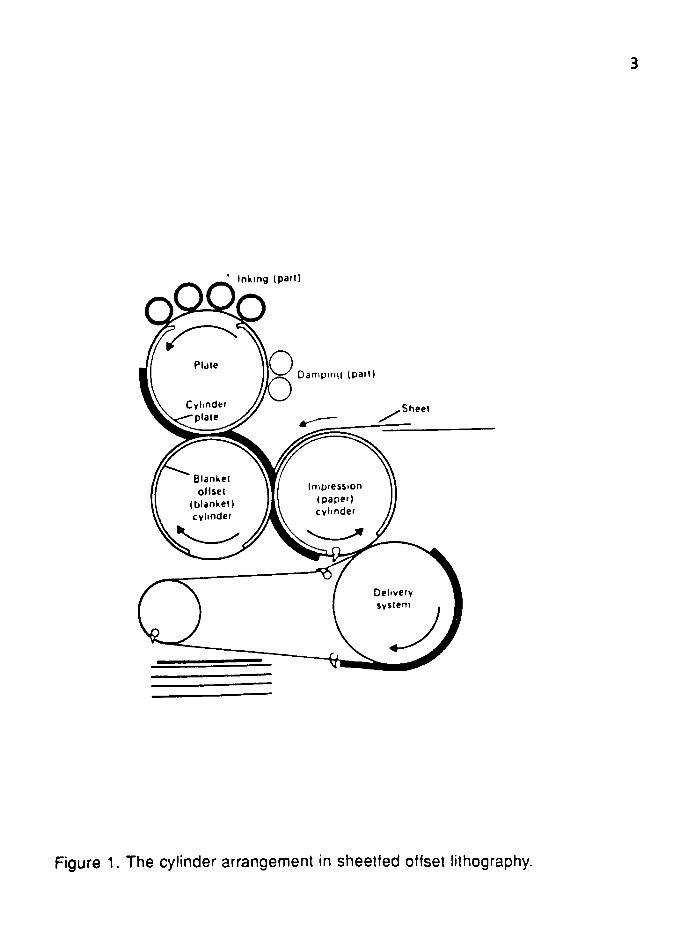
the blanket against the substrate (Figure. 1).
In addition to transferring ink from the image carrier to the substrate, the
offset blanket performs the function of dampening the press vibrations, which are
present in any mechanical process. Vibrations present during the transfer of ink
from plate to blanket, or blanket to substrate disrupt the uniform transfer of ink film
'
Inking (pan)
Figure 1. The cylinder arrangement in sheetfed offset lithography.

4
and cause print streaks, parallel to the lead edge (front) of thecylinder.2 Some
sources of vibration are the shock caused by the inking and dampening rollers
which are in contact with the rotating plate cylinder, the plate and blanket cylinders
rotating against one another, gears of the cylinders meshing incorrectly (the correct
fitting of the gear teeth), and ducting rollers in the inking and dampening systems
which are in contact with their respective fountains (the area from which rollers
receive ink and dampening solution). When properly set and maintained, these
sources of vibration are minimized. However, as presses age and wear out,
vibrations can become amplified and can have a negative effect on the final print.
The offset blanket can help in this respect by dampening these vibrations and
allowing the ink film to transfer evenly. There are two types of blankets available
which will perform this function, conventional and compressible.
Conventional Blankets
The conventional blanket consists of three or four layers or plies of fabric
which are laminated together with a specially formulated rubber adhesive
compound, and are commonly referred to as the carcass. The carcass provides for
a flexible, yet stable base, and enables the blanket to be tensioned around its
cylinder.3 "The main role of the fabric is to strengthen and stabilize the blanket so
that it can be mounted under tension without tearing orstretching."4 The fabric is
woven especially for this application and has a "greater concentration of the length
ways'warp'
threads than the widthways 'weft'. Since the warp yarn is spun from
selected long staple fibres, the cloth is very strong along its length."5 For this
5
reason, when blankets are cut from a roll, it is necessary to make sure that the
warp direction in the fabric is oriented in such a way that it will go around the
cylinder, when the blanket is mounted. Because of the 'overunder'
construction of
the warp and weft threads, and the degree of twist given to yarn during spinning,
woven fabrics are normally highly elastic. "Blanket fabric has this stretch removed
after weaving by a special finishing process. This ensures that the blanket will not
creep under the forces of printing or need constant retensioning."6
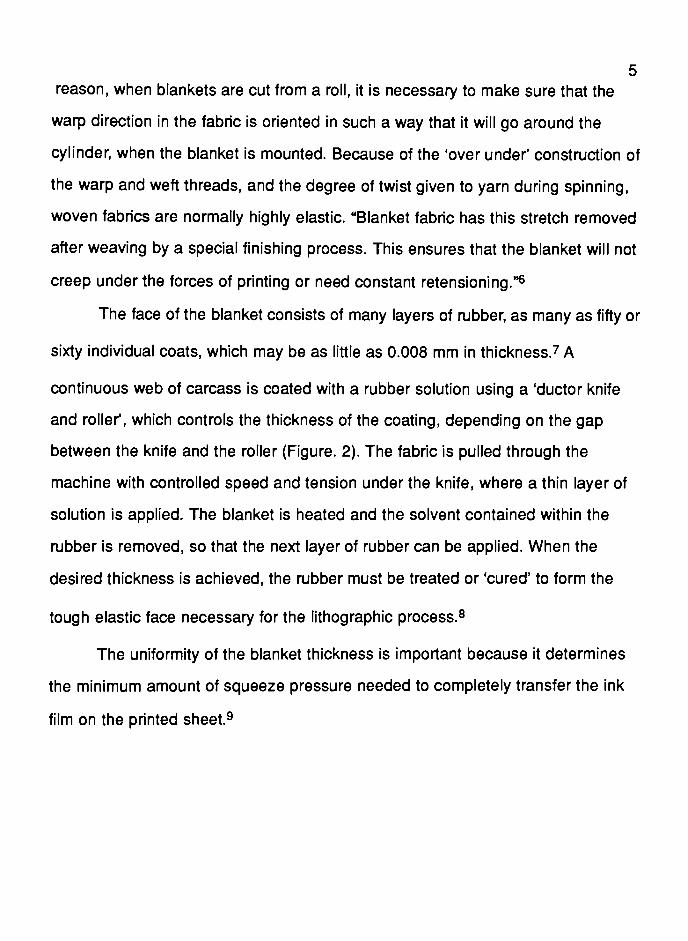
The face of the blanket consists of many layers of rubber, as many as fifty or
sixty individual coats, which may be as little as 0.008 mm in thickness.7 A
continuous web of carcass is coated with a rubber solution using a 'ductor knife
and roller", which controls the thickness of the coating, depending on the gap
between the knife and the roller (Figure. 2). The fabric is pulled through the
machine with controlled speed and tension under the knife, where a thin layer of
solution is applied. The blanket is heated and the solvent contained within the
rubber is removed, so that the next layer of rubber can be applied. When the
desired thickness is achieved, the rubber must be treated or'cured'
to form the
tough elastic face necessary for the lithographic process.8
The uniformity of the blanket thickness is important because it determines
the minimum amount of squeeze pressure needed to completely transfer the ink
film on the printed sheet.9

Due! knife
Duel roller
Drip tray
Figure 2. The 'ductor andknife'
roller
Cross section o/ blanket: (A) rubber print-bearing surlace; (B) compressible layer; (Qadhesive; (D) high-strength, low-stretch stabilising labnc.
Figure 3. Compressible blanket construction

Compressible Blankets
A compressible blanket shares the same construction characteristics as the
conventional blanket just described. It does, however, have an additional
compressible layer built into the carcass which has a compressible nature, hence
the term, 'compressibleblanket'
(Figure. 3). Compressibility is important, since it
allows the blanket to adjust to pressure irregularities, and also helps dampen
vibration during printing. The compressible layer also affects the way in which the
blanket deforms when under pressure, at the printing nip. Conventional blankets
flow laterally when pressure is applied, while the compressible compress vertically.
"When pressure is applied to a conventional blanket (with solid rubber
interplies), the material flows away from the pressure lines at the cylinder nips,
creating bulge formations immediately in front of them, which distorts the
blanket surfaces. The effect of this is that the blanket cylinder diameter changes,
and with it the print length. This is because solid rubber cannot be reduced in
volume and is subject to lateral flow."10
When the same pressure is applied to a blanket containing a compressible
layer, "it should compress uniformly, without distortion, with the layer containing
the millions of minute voids allowing uniform compression to take place. As
these voids beneath the area under pressure reduce in volume, they permit
vertical compression to take place at the cylindernips."11
Compressible Laver
The compressible layer can be manufactured in a variety of ways, each
imparting a unique property to the compressible characteristicsof the blanket. Most

8
commonly, "a cellular layer containing air and gas bubbles is incorporated to
increase compressibility above the conventional level."12This is known as the
microsphere process. There are four different methods in manufacturing the
compressible layer; 'microspheres', 'salt leach', 'blowingagent'
and 'impregnated
fabric'. The manufacturing process of these methods is confidential and is known
only to the corresponding manufacturers. The'microspheres'
method, can produce
a compressible layer with a 'closedcell'
structure and which is superior to the open
'saltleached'
or'blown'
structure (see chapter 2).13
Surface Topography of Blankets
The surface topography (smoothness) of the blanket is described as either
'cast'
or 'ground*. During the'curing'
or vulcanization (a process during which heat
uniformly applied, transforms the soft rubber of the blanket into a a tough, resilient,
solvent-resistant compound), a specific surface-structured paper is mounted on a
cylinder, and is brought in contact with the rubber. The pattern of this paper is
transferred onto the blanket face. This is known as a'cast'
surface. The second way
to control the surface topography of a blanket is to build the blanket to a greater
thickness than is desired, and'grind'
the blanket back down to that specified
thickness. The result is a blanket face which is generally smoother than a'cast'
blanket, and one which exhibits less caliper (thickness) variation.
The surface topography of a blanket will ultimately affect the 'printquality'
attainable with a particular blanket, and its sheet release characteristics (how fast a
sheet is released from the blanket). A rougher blanket affords better
releasecharacteristics at the expense of print quality, while a smoother surface

9
yields better dot-for-dot reproduction, yet tends to promote problems associated
with poor sheet release.14However, the influence of surface topography of the
blanket on sheet release is marginal compared to factors such as blanket
hardness, resistance to solvent penetration (used for blanket cleaning), and
construction of the carcass (discussed later), all of which have a greater bearing on
the release properties of the blanket.15
Blanket Performance Standards
The packing latitude for a compressible blanket is between 0.004 in. and 0.006 in.
above bearer, as compared to 0.002 in. and 0.004 in. above bearer for the
conventional blankets. The first compressible blanket was introduced in 1962 by
WR. Grace, and utilized a compressible paper layer to achieve compressibility.
Since then, many advances have been made in the compressible blanket
technology that revolve mainly around how the compressible layer is made, rather
than the changes in the actual design of the blanket. Some of the characteristics by
which a blanket should be evaluated are its hardness, resiliency, smoothness,
resistance to solvent penetration, quick paper release (how fast a blanket 'spitsout'
the printed sheet), resistance to stretching, and resistance toabrasions.16
Since its introduction, the compressible blanket has become in most market
segments, the blanket of choice among printers. Its ability to, withstand larger
packing latitudes, resist smashes (collapsing of the carcass, due to excessive
pressure), resist cut marks from stock edges, and minimize or even eliminate
mechanical shortcomings caused by the machinery (such as gear streaks, worn out
bearings, inadequate roller settings), makes it favorable.

10
Endnotes for Chapter 1
1 Michael H. Bruno, "Printing Process Trends", Critical Trends for the 1990's- A report to the Graphic Arts Industry. December 1989, p.55.
2GATF Staff, "Solving Sheeted OffsetProblems."
Graphic Arts Technical
Foundation. 1981, p.16.
3John Smith, Technical Aspects of OffsetBlankets."
Australasian Printer
Magazine. December 1985/January 1986, p. 10.
4E. R. Sutton, The Technology of LithoBlankets,"
The British Ink Maker.
February 1971, p.76.
5lbid
6lbid
7Anon, "BlanketCoverage,"
Printing World. May 20, 1987, p.46.
8Neville Chamberlain, "New Developments in OffsetBlankets,"
Australasian
Printer Magazine. December 1980, p.22.
9Geoffrey Leslie, "What aboutBlankets?,"
Australasian Printer Magazine.
November 1986, p11.
1 ^Neville Chamberlain, "New Developments in OffsetBlankets,"
Australasian Printer Magazine. December 1980, p.18.
11Anon, "Blankets and Rollers- Challenge to
Manufacturers."
Printing
Equipment and Materials. February 1979, p.28.
1 2E. R. Sutton, Technology of LithoBlankets,"
The British ink Maker.
February 1971, p.74.

1
1 3A. S. Porter, "Lithographic Presswork", 2d ed., Graphic Arts TechnicalFoundation. 1982, p.303.
14Bob Foley, "Blankets andRollers."
Printing World. September 22, 1982,
p.25.
1 5John Smith, Technical Aspects of OffsetBlankets,"
Australasian Printer
Magazine. December 1985/January 1986, p.9.
1 6A. S. Porter, "Lithographic Presswork", 2d ed., Graphic Arts Technical
Foundation. 1982, p.303.

12
CHAPTER 2
THEORETICAL BASIS
Packing
The way in which packing is distributed between the plate and blanket
cylinders depends on whether the 'true rolling'or the 'equaldiameter'
theory is
employed. These theories refer to which of the two cylinders (plate/blanket) will be
overpacked to provide the necessary squeeze pressure. That also affects the
image length.
Cylinder
The lithographic offset blanket is mounted on a cylinder. The cylinder and
the blanket together dampen press vibrations, and transfer ink from the plate to the
substrate. This cylinder is comprised of the following components: a) the cylinder
body, which is the main part, b) the bearers, which are located on the two outer
ends of the cylinder body, c) the undercut, which is a recess between the cylinder
body and the bearers. There is a gap on the cylinder body which separates the
lead (front) from the tail (back) edge of the blanket, and allows an area within which
the blanket
can be mounted (Figure.4). The bearers serve as a reference for the packing that is
required under the blanket, and which depends on the thickness (caliper) of the
blanket and the packing recommendations for each press.
Plate-to-blanket setting
There are two types of plate-to-blanket cylinder settings: a) bearer contact

13
Recess (undercut I
Figure 4. The parts of a blanket cylinder
14
(Figure.5), and b) bearer clearance ( Figure.6). Bearer contact presses are
preferred because the bearers: a) insure proper gear meshing, since the bearer
diameter is equal to the pitch circle (working) diameter of the gear (Figure.7). If the
gears are over or under meshed (how they fit with one another), then vibration,
backlash (slippage), and/or speed variation could result. This interrupts the
continuous and uniform flow of ink, and results in variations in ink film thickness,
which can create streaks on the printed sheet. These streaks are parallel to the
lead edge, and the space between them is equal to the distance between two gear
teeth: hence the term 'gear streaks'1, b) provide continuous rolling pressure
between the cylinders, particularly when the cylinder gaps face one another, c)
serve as a dependable reference for cylinder packing.2
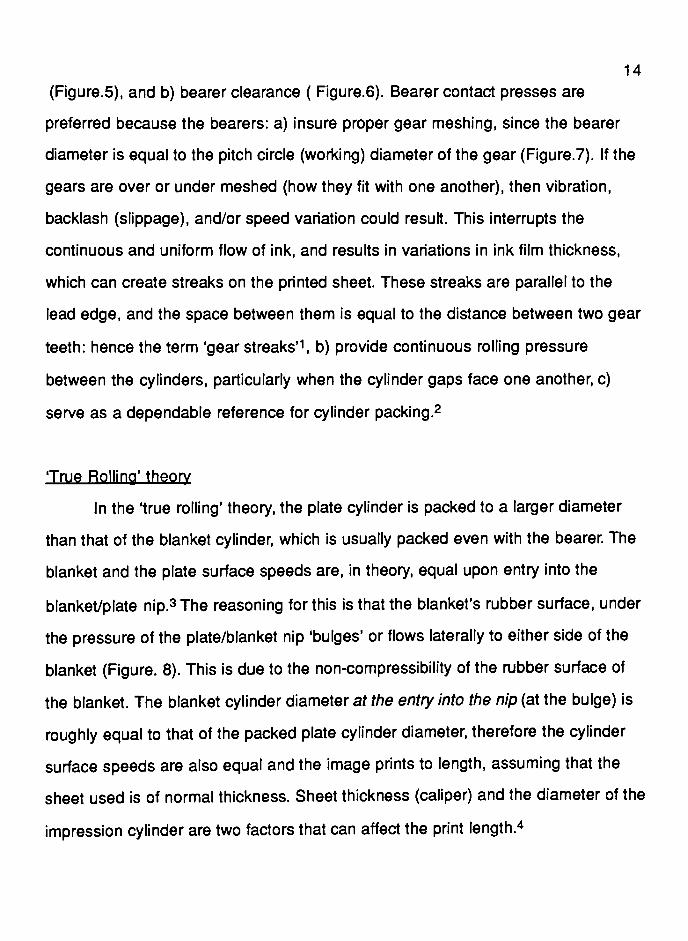
TrueRolling'
theory
In the 'truerolling'
theory, the plate cylinder is packed to a larger diameter
than that of the blanket cylinder, which is usually packed even with the bearer. The
blanket and the plate surface speeds are, in theory, equal upon entry into the
blanket/plate nip.3 The reasoning for this is that the blanket's rubber surface, under
the pressure of the plate/blanket nip'bulges'
or flows laterally to either side of the
blanket (Figure. 8). This is due to the non-compressibility of the rubber surface of
the blanket. The blanket cylinder diameter at the entry into the nip (at the bulge) is
roughly equal to that of the packed plate cylinder diameter, therefore the cylinder
surface speeds are also equal and the image prints to length, assuming that the
sheet used is of normal thickness. Sheet thickness (caliper) and the diameter of the
impression cylinder are two factors that can affect the printlength.4

15
RECESS
XPLATE CYLINDER
BODY SETTING
BLANKET CYLINDER
-CONTACT
Figure 5. Bearer contact arrangement
RECESS
XPLATE CYLINDER
BODY SETTING
BLANKET CYLINDER
CLEARANCE
Figure 6. Bearer Clearance arrangement

16
Piicn c.rcit
Ajatnaum
Deatnaum
Figure 7. Relationship of two gears meshing
Lateral Mow resulting from pressure
(j) Compression ot conventional
blanket
Vertical compression
(6) Compression Olanket
Figure 8. Blanket'bulge'
characteristics in conventional and compressible blankets

17
'EqualDiameter'
theory
The other method, the 'equaldiameter'
theory, prints a slightly longer
impression. In fact, the plate is packed even with the bearer, and the blanket is
packed above the bearer, so that the necessary squeeze pressure is achieved
exclusively by the packing of the blanket. The two cylinders (plate and impression),
have equal diameters ar the center of the nip, and therefore have equal surface
speeds.5'Bulging'
occurs on the blanket surface and this directly affects the
diameter of the blanket cylinder. Since the diameter of the blanket cylinder is
greater than that of the plate, its surface speed becomes higher. This results in a
longer impression than the original. If the speeds are significantly different, due to
improper packing of the cylinders, and meshing of the cylinder gears is not exact,
slippage can occur. This will result in slur and gear streaks on the printed sheet.
Fortunately, blankets are resilient and elastic enough to allow for some variation in
surface speeds and packing differences between the cylinders.6 As a result,
regardless of whether the 'truerolling'
or 'equaldiameter'
theory is employed, the
quality of the resulting impression will appear equal. It is only the print length which
will be different, and yet it will not be discernible to the eye.
Compressible Layer Construction
As mentioned earlier, the two types of blankets, conventional and
compressible, differ only in the compressible layer. The carcass of both blankets
however, is made of similar fabric construction (usually cotton, because of its
resistance to stretch, its strength, and resilience). It is important and it is expected
that blankets have low stretch characteristics, so that desirable tensions could be

18
set and maintained. The compressible layer is composed of natural rubbers
(Figure 9). This layer is coated onto the fabric, and could then be expanded, by
heat, for example. The idea is to create voids containing air that will compress
under pressure. The design of the voids is either the'closed-cell'
or'open-cell'
type.7 There are four known ways to manufacture the compressible layer. In
addition to the way in which they are manufactured, they vary in the percentage of
void content. The oldest is the 'impregnated cellulosefiber'
process (70% void,
30% solid), which lacks flexibility, and special care has to be taken to avoid
wrinkles, and withstand solvent attacks. This was followed by the Porvair salt leach
process (70% void content). As the compressible material is applied onto the
carcass, heat and water force the salt out of the layer. This creates the
interconnecting, 'opencell'
construction previously mentioned. The blowing agent
process (10-20% void content), gives off gases at high temperatures, whilevoid-
size control has been proven to be problematic.8 The most recent development in
compressible layer technology is the microsphere.
Microspheres
Microspheres (40-50% void content), are simply small compressible 'beads'.
within which air has been captured. They are then mixed into the rubber solution
which is applied onto trhe carcass of the blanket. Microspheres are of the 'closed
cell'
construction. The 'closedcell'
voids are considered superior to the 'opencell'
type, because their recovery time from the compression of the blanket is quicker.9
This is due to the vertical displacement of the microsphere, within which air is

19
BLOWING LAYER
10-20 Void commit
--
_
*- --
-W- -mj~ -W~ t
SALT LEACH LAYER
70 Void content
v^
PAPER FIBRE MATRIXMICRO SPHERE VCHDS
40-50 Votd content
Figure 9. Four methods of compressible layer construction

20
contained, as opposed to the 'opencell'
structure. In the 'opencell'
design, air
circulates in and out of the interconnected cell structure in the compressible layer,
during each blanket revolution, and thus requires more time for its recovery. The
faster recovery of microspheres nevertheless, is achieved at the expense of
compressibility. As pressure on the blanket increases, air within the microsphere is
compressed, and thus absorbs this pressure, which is what the compressible layer
is trying to minimize. An advantage of using a compressible blanket is that it is
more resistant to smashing and that there is a reduced lateral flow, as opposed to
the conventional type (Figure. 10).
"Even though we've got more packing, all we're doing is closing up the
voids in the compressible layer and not having to distort the blanket
laterally in the printing nip (sic) we can have higher amounts of squeeze
with lower printing pressure and greater packing latitude with
compressible blankets than with conventional blankets."10
Packing latitudes vary according to the characteristics and thickness of the
compressible layer (Figure. 11). Excessive pressure due to severe overpacking
can, however, alter the desirable characteristics of the compressible blanket in a
negative way, by subtracting its compresibility, as well as increasing the
magnitude of dot gain on the printed sheet.
Blanket Tension
Tensioning of the blanket is the amount of torque applied on the blanket
around its cylinder. Optimum tensioning is usually achieved through trial and error
for each given press and blanket combination, since there is variation in blanket
lockup systems (mounting systems of plates and blankets), and tensioning devices.
Too little tensioning will result in blanket slack which could result in doubling. Too
much tension could result in a change in the natural characteristics of the blanket,

21
200
0 05 0 10 0 IS 0 20 0 25 0 30 1 35
Figure 10. Packing versus squeeze for conventional and compressible blankets
Figure 11. Packing versus dot gain for conventional and compressible blankets

22
especially the compressible ones, by limiting their compression and resiliency, as
well as stressing the carcass. The blanket also loses its natural crimp of the warp
yarns in the fabric plies which contributes to the overall resiliency of the carcass.11
High tension levels could also have an effect on ink transfer (the uniformity and
quantity of transfer of ink, from the plate to the blanket), smash resistance and
recovery (resistance to collapsing of the carcass under high pressures, and the
time that is needed to fully recover from such a collapse), and dot gain. The effects
of overtensioning are more obvious in compressible blankets, where the voids may
be compressed to the point where the compressible layer loses its unique
characteristics.12 It was expected that as blanket tension and squeeze preesure
settings increased, directional dot gain would increase as well, using both types of
blankets.
Response Variables
Dot Gain
Dot gain is the increase in size of the printed dot that occurs during the
transfer process from film to the final printed sheet. This increase in size is
expressed as a percentage of the original size. There is mechanical and optical dot
gain. Mechanical dot gain is the actual, physical increase in dot size, while optical
dot gain is a visual interpretation of the printed image which depends upon the
opacity or translucency of the paper surface, and the surface of the paper (ie.
glossy, matte surfaces). Optical dot gain is caused by the diffusion of light within the
paper. Only a fraction of the total light entering the paper is reflected back. The dot
appears larger because there is a shadow around that dot. Screen ruling (lines of
23
dots /inch) also affect the surface characteristics of the paper. A fine screen ruling
increases the apparent dot size more than a coarse screen ruling.13
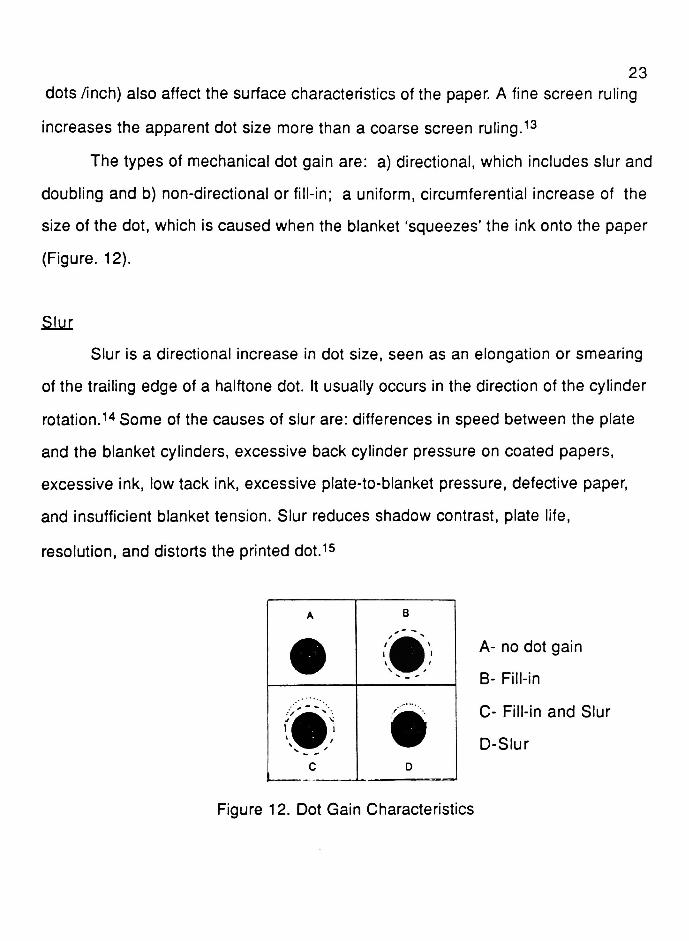
The types of mechanical dot gain are: a) directional, which includes slur and
doubling and b) non-directional or fill-in; a uniform, circumferential increase of the
size of the dot, which is caused when the blanket'squeezes'
the ink onto the paper
(Figure. 12).
Slur
Slur is a directional increase in dot size, seen as an elongation or smearing
of the trailing edge of a halftone dot. It usually occurs in the direction of the cylinder
rotation.14 Some of the causes of slur are: differences in speed between the plate
and the blanket cylinders, excessive back cylinder pressure on coated papers,
excessive ink, low tack ink, excessive plate-to-blanket pressure, defective paper,
and insufficient blanket tension. Slur reduces shadow contrast, plate life,
resolution, and distorts the printeddot.15
A B
C..
D
A- no dot gain
B- Fill-in
C- Fill-in and Slur
D-Slur
Figure 12. Dot Gain Characteristics
24
Doubling
Doubling refers to the double image of a dot which is out of register with
itself. The direction of misregistration can occur in any direction. Doubling "varies
relative to the full strength true dot".16 Doubling is generally not considered a
blanket-related problem (except when the blanket is loose). On a multi color press,
the still wet ink transfers to the blanket of the next printing unit and transfers back to
the next sheet, but out of register. Some causes of doubling are, wavy or tight
edged paper, loose cylinders, varying positioning of plate against the blanket,
and.worn out bearings,17 Poor stability of the blanket face may also affect the
relationship between plate and blanket cylinders and cause doubling. It tends to
increase the highlight density, decreases print contrast, and decreases the
sharpness of the image. On a sheetfed press it can occur at the trail edge of a sheet
of paper due to a premature contact of the the paper with theblanket.18
The Murray-Davies Equation
The Murray-Davies Equation is used to represent the relationship of a dot
area to the density of a printed dot. The density of a halftone tint was based on the
inked dot area and the reflectivity of the ink itself. It is the reflectivity of the ink that is
considered to be the solid ink density.With the use of this equation it is possible to
determine the dot gain values. Dot gain is the difference between the value of the
original dot area and the value of the dot area on the printed sheet. Given that:

li = the intensity of the incident light and
It = the intensity of transmitted light, then
Transmittance =lt-5-li, and
Opacity =lh-lt= 1/T.
Density= log1 0 1/T
1
D= log
1-a(1-r)
where: D = Density of the tint
a = (1 -T)- % dot area of ink dot on paper
r = Reflecting power of the ink
The equation used to determine the densities of the tints is stated below:
Dt= log [ 1-a (1-10Ds)]
The equation used to solve for the dot area thus takes the form:19
1-10"Dt
a=
1-10-Ds
where: Dt= density of the tint
Ds= density of the solid

26
The above equation assumes that the reflectance of the paper is perfect. Therefore,
the densitometer should use the paper as the point of reference for calibration.

27
Endnotes for Chapter 2
1 GATF Staff, "Solving Sheeted OffsetProblems,"
Graphic Arts Technical
Foundation. 1981, p.16.
2A. S. Porter, "LithographicPresswork," 2d
ed., Graphic Arts and Technical
Foundation. 1980, p.52.
3Gong Zongzhi and Wu Jinzhi, The Optimal Analysis of the Cylinder
Packing in the OffsetPress."
TAGA Proceedings.lQfifl p.240.
4 Ibid
5lbid
6John MacPhee and Larry E. Lester, "Some New Ideas on Pinpointing theCause of Horizontal Streaks", TAGA Proceedings. 1 986, p.84.
7Geoffrey Leslie, "Blankets and the Control of Dot Gain", Australasian Printer
Magazine.Vol. 38, No. 10, November/December 1987, p. 14.
8Neville Chamberlain, "New Developments in OffsetBlankets,"
Australasian
Printer Magazine. December 1980, p. 17.
9Neville Chamberlain, "New Developments in OffsetBlankets,"
Australasian
Printer Magazine. December 1980, p. 18.
10Anon, "Blankets and PrintQuality."
Graphic Arts Monthly Magazine.Vol.58.
No. 2, February 1986, p. 11 2.
11 Neville Chamberlain, "New Developments in OffsetBlankets,"
Australasian Printer Magazine. December 1980, p.22.
1 2R. C. Jenner, "Developments in the OffsetBlanket,"
The British Ink Maker.
August 1974, p.178

28
13 Miles Southworth, F. Quality Control Scanner. Vol.1 . No.2. 1981, p.4
14Milton Pearson, Irving Pobboravski and Chester Daniels, "Instrumentation
for the Measurement of Slur and Fill-in on a Lithographic WebPress,"
TAGA
Proceedings. 1979, p.163
15William H. Bureau, "What the Printer Should Know AboutPaper."
Graphic
Arts Technical Foundation. 1983, p.215.
16 Ibid p.190
1 7 Ibid
1 8 E.H. Treff,"An Engineer's View of Dot Gain on aWeb Offset Press",A PIA Annual Meeting, San Francisco, May 10, 1988 p.11
19 Miles Southworth, F. Quality Control Scanner. Vol.1 . No.2 1981, p.7

29
CHAPTER 3
REVIEW OF THE LITERATURE
Much of the blanket-related literature reviewed, has concentrated on the
physical characteristics of offset lithographic blankets, without emphasizing the
press set-up and press conditions. 'FOGRA', the German printing research
organization, provided some useful information on blankets.1 Its articles presented
information related to differences in blanket types, compression, and smash
characteristics. It was indicated that blanket smoothness and hardness played an
important role in sheet release and dot reproduction; hence the choice of a
'ground'
blanket for this experiment (see chapter 2).2Tritton (PIRA) noted that
blankets were the second
major cause for dot gain, following inks, and that overpacking amplified the small
differences that ordinarily existed between conventional and compressible
blankets.3 In the same report it was noted that lower tack inks are more susceptible
to showing changes in printing, due to squeeze pressure changes for example,
and ultimately in dot gain.4A study done by Pobboravsky, Pearson, and Daniels,
however indicated that changes in dot gain could occur without the solid ink
density beingaffected.5
In a study by DiPaoli a comparison was made between conventional and
compressible blankets in terms of solid ink density and dot gain. The results
indicated that conventional blankets showed higher dot gain values at the same
levels of solid ink density, than the compressible type (Figure.13).6
Different blanket tension settings and squeeze pressure levels have not
30
been tested simultaneously, in order to study the significance of these factors in
terms of dot gain (print quality). In a published report, Warren Rhodes reported on
the ink transfer and print quality. When density and sharpness were checked, a
relationship between density and slur could bee seen. It was noted that the amount
of ink which is transferred onto the paper is affected by the contact of the blanket
with the paper, as well as the pressure that exists between these two. These
pressures depend upon the blanket hardness, the packing, and the back cylinder
pressure. If a sheet has coarse surface characteristics, more squeeze pressure will
be needed for a more complete ink transfer, which will result in an increase in fill-in
and slur. So in order to isolate the effect of blanket tension and squeeze pressure
on print quality, it was noted that a smooth coated paper would aid the effort.7
A report, by William W. Walker, indicated that coated paper is more sensitive
to changes in pressure than uncoated paper, a quality that justified one reason why
coated paper was used for this experiment.8As mentioned in chapter 2, the
compressible blanket is able to withstand wider packing latitude, while maintaining
lower pressure levels at the nip, due to the nature of the compressible layer.
Information on the RIT Experimental Doubling target has been included in
the thesis by Amal A. Ba'adarani titled "A Study on Doubling in the Offset Printing
Process."9By using this target, dot gain can be detected in any occurring direction.
The Reeves Brothers Company, a blanket manufacturer, which supplied the
blankets for this experimentation, pointed out that randomizing tension levels on
the same blanket would be limiting for this experiment since the fabric material of
the blanket would not recover to its original length, and would thus jeopardize
tension testing at lower settings, using the same, already stretchedblanket.10

31
Endnotes for Chapter 3
1 Dietmar Loibl, "Mechanisches und drucktechnisches Verhalten vonOffsetdrucktuchern."
FOGRA Mitteilunoen Nr. 93, Nov 1977.
2Warren, L. Rhodes, The Influence of Offset Blankets on Print Quality and
Ink Transfer International Bulletin June 1958, p.119.
3K.T. Tritton "Modifying the Dot Gain Characteristics of Sheeted OffsetPresses."
Pira Research Report. No. 163 c, 1981, p.29.
4lbid, p.24.
5Milton, Pearson; Irving,.Pobborovski,; and Chester, Daniels, "Application of
a dynamic Measurement Technique for the Investigation of Dot Gain in Web Offset
Lithography."
TAGA Proceedings. 1989, p.488.
8Alan, DePaoli,. The Effect of printing Conditions on Dot Gain - An Offset
NewspaperStudy."
TAGA Proceedings..1981. p.35
7Warren L. Rhodes, The Influences of Offset Blankets on Print Quality and
InkTransfer"
International Bulletin. June 1958 p.119.
8William C. Walker, The Printing Smoothness ofPaper."
Advances in
Printing Technology. Pergamon Press, Vol. 3., 1963, p.204.
9Amal A. Ba'adarani, "A Study on Doubling in the Offset PrintingProcess,"
Maser Thesis. Rochester Institute of Technology, 1989.
10Telephone conversation with Mr.William Moore, Reeves Brothers Co.,
Spartanburg S.C.

32
CHAPTER 4
HYPOTHESES
The two factors that were tested simultaneously at different levels on an offset
lithographic press were squeeze pressure and blanket tension. These factors were
tested on two types of offset lithographic blankets; conventional and compressible.
Both types were used in order to study their comparative reactions, and their effect
on the quality of the final print. There were four hypotheses to these factors, and
they are stated below:
1. There is no statistically significant difference in dot gain (doubling , slur) as
squeeze pressure changes (from 0.006 in. to 0.008 in.), when using a
conventional blanket.
2. There is no statistically significant difference in dot gain (doubling , slur) as
squeeze pressure changes (from 0.006 in. to 0.012 in.) when using a
compressible blanket.
3. There is no statistically significant difference in dot gain (doubling, slur) at
blanket tensions of (15, 30, 45 in/lbs), when using a conventional blanket.
4. There is no statistically significant difference in dot gain (doubling, slur) at
blanket tensions of (15, 30, 45 in/lbs) when using a compressible blanket.

33
CHAPTER 5
METHODOLOGY
The methodology used in this experiment was designed to tackle the following:
1. To examine how conventional and compressible blankets react to
different squeeze pressures and blanket tension settings.
2. To determine whether there is any statistically significant difference in
dot gain as squeeze pressure and blanket tension settings change
3. To identify the difference between conventional and compressible
blankets when faced with the same physical challenges such as
tension and packing changes.
4. To determine which differences in dot gain values were statistically
significant.
In order to examine the effect on directional dot gain (slur, doubling) from
tension and squeeze pressure on two different types of blankets, two packing
settings and three tension settings were tested during this experiment; a total of
twelve conditions. Each press run was 300 impressions long. This amounted to a
total of 3600 sheets. The press speed was set at 5500 impressions per hour.
Sampling for every press run was done by pulling one sheet for every 20 printed; a

34
total of fourteen samples. The Murray-Davies equation was used to calculate the
dot gain values.1 The statistical method which was used to determine the
acceptance or rejection of the hypotheses, was the analysis of variance (ANOVA).
A confidence level of 95% was used to determine whether there was any
statistically significant difference between the means. For the statistical differences
that were found to be significant, the Fisher test was used to determine where these
differences occurred. The experiment was performed on a two-color Heidelberg
MOZP sheetfed offset press, using the second unit and bypassing the first. The
targets that were used in this experiment were the RIT Experimental Doubling
Target, the Ladder target, and the UGRA Wedge.
The order of the twelve press runs was as follows:
1. CV1a 7. CM1a
2. CV2a 8. CM2a
3. CV3a 9. CM3a
4. CV1b 10. CM1b
5. CV2b 11. CM2b
6. CV3b 12. CM3b
where: CM= compressible
CV = conventional
1 , 2, 3 = blanket tension settings in ascending order (15,30,45 in/lbs)
a, b = hi/low packing levels, respectively
(0.006 in. and 0.008 in. for CV, 0.006 in. and 0.012 in. for CM)

35
Blankets
Both conventional and compressible blankets were utilized in this
experiment, in order to determine whether blanket tension and squeeze pressure
have similar effects on both types. Ground surface (vs. cast) blankets were used,
since their smooth surface was less likely to restrict the lateral flow of ink, caused
by increased pressure between the plate and blanket cylinder surfaces. The
blankets that were used for this experiment were donated by Reeves Brothers
Incorporated. The two types of blankets used were the G-44 (conventional) and the
2004 (compressible). Using a micrometer (L.S. Starrett Co. #256), these blankets
were tested for uniform thickness (caliper). When a blanket does not have a
uniform thickness (blanket + packing), pressure must be applied at the thinnest
area of the blanket, in order to print adequately, which would then result in
excessive pressure elsewhere. Blanket thickness variation could result in
scumming, poor ink transfer, fill-in, and platewear.2
Blanket Packing
The squeeze pressure settings were .006 in. and .008 in. for the
conventional blanket, and were accomplished as follows: for the lower squeeze
pressure setting, the blanket cylinder was packed even with the blanket bearer. The
plate cylinder was packed to .006 in. above the plate bearer for a squeeze
pressure of .006 in. An additional .002 in. was added to the blanket cylinder, for the
higher squeeze pressure setting of .008 in. For the compressible blankets, squeeze
pressure settings were .006 in. and .012 in., and were accomplished as follows: for
the lower squeeze pressure (.006 in.) the plate cylinder was packed to .006 in.

36
above the bearer, while the blanket cylinder was packed even with bearer. For the
higher squeeze pressure (.012 in.), .006 in. were added to the blanket cylinder. At
the end of the entire press run it was noted that the press specifications called for a
5:1 plate-to-blanket packing ratio. Due to this, three conditions were reprinted.
These conditions involved the conventional blanket, using the low squeeze
pressure setting, and all three of the blanket tension settings. The reason for
reprinting only these three conditions was because the higher level of squeeze
pressure (.008 in.) met the press specifications (.006 in. above the bearer of the
plate and .002 in. above the bearer of the blanket). No adjustments were made to
the back cylinders as the squeeze pressure increased. None of the conditions that
involved compressible blankets were reprinted, since their compressible layers are
made to withstand pressure variations, such as the ones experienced during this
experiment. The data which were drawn from the three reprinted conditions
replaced those of the original three. Thus, the data from the original conditions
were omitted in this statistical analysis. Correct packing was checked with a
packing gauge (Baldwin G81-2).3lt is an instrument whose one end rests on the
bearer of the blanket or the plate, and the other end (moving spring) rests on the
face of the blanket or the plate respectively. The difference in height between the
two, expressed in possitive or negative values indicates whether the packing level
is either above or below the bearer respectively. The compressible blankets used
were of the 'opencell'
construction design (salt leach). Once the blankets were
checked for squareness, they were mounted appropriately. Mounting procedures
were important, because tension should be allocated evenly around the blanket,
37
whose elasticity (blanket's) may prove limiting for this procedure (tensioning),
should these procedeures fail to be carried out correctly.
Blanket tensioning
The blanket tension settings were 15, 30, 45 in/lbs.4 These settings were
chosen so that they represented a significant change in printing response without
being unrealistic. They were set by using a torque wrench (Craftsman #44441).
After the blankets were run for three minutes and conformed better around the
blanket cylinder, they were retorqued to the desired setting.5The torque wrench
settings are usually affected by the press type, size, and lockup system used. When
blanket tension settings are too low, doubling (discussed in chapter 2) would
occur, while too much tension will eventually rupture the carcass, and would make
the blanket useless. The strength of a pressman, the type of blanket, and the
blanket cylinder gear ratios, affect the designated levels of tensioning (too much
tensioning may thin out the blanket and thus affect the packing set up, in terms of
squeeze pressure).
The bars that run across the tail and lead edges of the blanket, and are
clamped in the cylinder gaps, are called the clamp bars, and are part of the lockup
system (the mechanism used to securely fasten the blanket's edges within the
cylinder gap). Three examples are, the T-bar (Figure.13), the single-reel rod
(Figure.14), and the double-reel rod, used by the Heidelberg presses (Figure.15).

38
Paper
The paper which was used for this experiment was Piedmont Gloss, coated,
80lbs, C2S Text, 916960, with dimensions of 19x25 in. There were 3600 sheets
printed for this experiment - 300 sheets for each of the twelve press runs. The
coated paper was used because any variation on the press sheet would become
more apparent than using an uncoated sheet. Because of an existing curl in the
paper, there was a problem feeding the sheets through the press, and thus the
press would jam. These stoppages affected the balance of the water with the ink,
and time was needed to re-establish this balance. The curl did not cause
doubling.since the paper was printed on the second unit. It did, however, influence
the smooth flow of the press runs.
ink
The ink which was used was Marathon Hardy- Black, with a tack level of ten,
as indicated by the manufacturer. The decision to use a relatively low tack ink was
because the higher the ink tack, the'cleaner'
the ink would pull from the plate. A
lower tack ink is more susceptible to show less than optimal experimental
conditions than a higher tack ink. Pressure increases, along with the use of a
smooth blanket face, aids the ink to spread laterally, encouraging mechanical dot
gain or fill-in (see chapter 2).
The solid ink density level on the printed sheets was 1 .65 0.05 as they
came off the press (drying eventually decreased the density). The density levels
were checked with an X-Rite 408 densitometer. It was desirable to have an ink film
thick enough to make changes during the press runs more visible.

39
BLANKETCAPSCRE
packing
Figure 13. T-bar lockup system

40BLANKET
LOCKUP NUT
RATCHET PAWL-DISENGAGEDRATCHET PAWL-ENGAGED
PAWL STUD
TRAILING ECGE LEADING EDGE
3LANKET LOCKUP ROD \ / RETAINING LEDGE
VIEW BB
A <,
Jrn 1
0J1 '
OPERATING SIDE
T1 CYLINDER
LEAOING EDGE
OF BLANKET
TRAILING EDGE OF BLANKET
LEAOING ANO TRAILING
EDGES OF BLANKET
LOCKED UP ON CYLINDER
Figure 14. Single reel rod lockup system

Barring Holes
Figure 15. Double reel rod lockup system

42
pjaj
The plate which was used was a Viking G-1, an aqueous plate, made by 3M.
The term'aqueous'
refers to the use of a water-based solution for developing the
exposed plates (unexposed areas are soluble, while exposed are insoluble),
instead of using one which is solvent-based. It is a medium running plate with a life
of about 120,000 impressions before significant wear occurs. It was exposed
according to manufacturer's directions; a visual solid step at .45 density,
corresponding to a step 3 on the tone reproduction scale of the UGRA Wedge
(discussed later in this chapter).6 The plate was washed and gummed between
each treatment combination. The same plate was used for all runs so that any
potential variation from different plates would be eliminated (plate burning,
mounting, and variation in physical makeup).
Targets
In order to gather the necessary information from this experiment and
eventually evaluate the raw data , printing test targets such as the GATF Ladder
target, the RIT Experimental Doubling target, and the UGRAWedge, were used.
GATF ladder target
The ladder target is designed to show any printing variation which could
occur around the blanket cylinder, such as slur. It is comprised of three strips each
0.25 inches wide. The center strip is made of horizontal (parallel to the lead edge),
equally-spaced lines, while the two outer strips have vertical lines. The lines are
the equivalent of a 50% screen tint of 150 lines per inch. Any directional dot gain
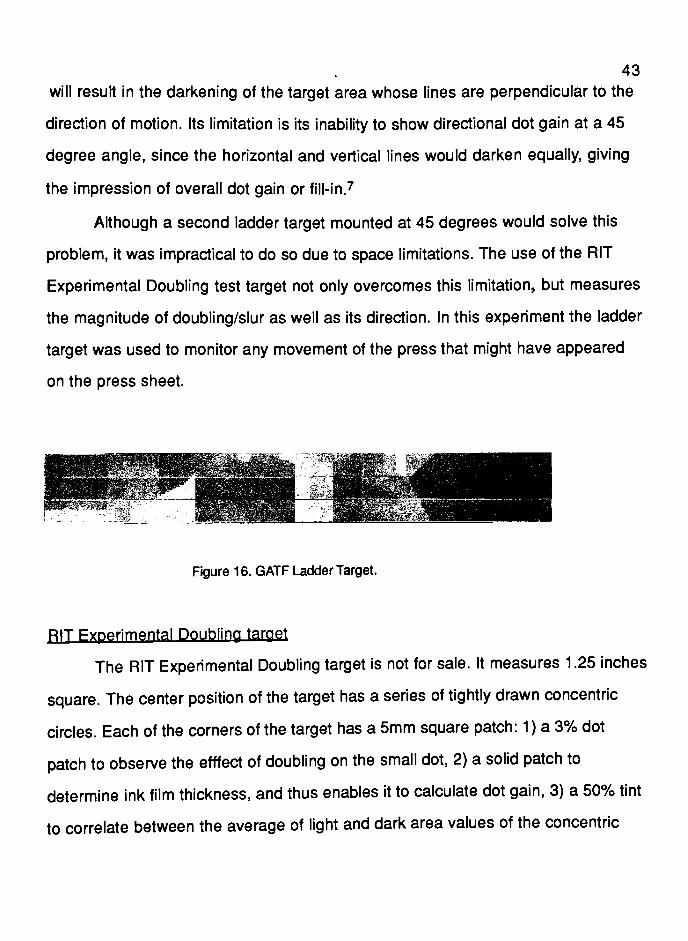
43
will result in the darkening of the target area whose lines are perpendicular to the
direction of motion. Its limitation is its inability to show directional dot gain at a 45
degree angle, since the horizontal and vertical lines would darken equally, giving
the impression of overall dot gain or fill-in.7
Although a second ladder target mounted at 45 degrees would solve this
problem, it was impractical to do so due to space limitations. The use of the RIT
Experimental Doubling test target not only overcomes this limitation, but measures
the magnitude of doubling/slur as well as its direction. In this experiment the ladder
target was used to monitor any movement of the press that might have appeared
on the press sheet.
Figure 16. GATF Ladder Target.
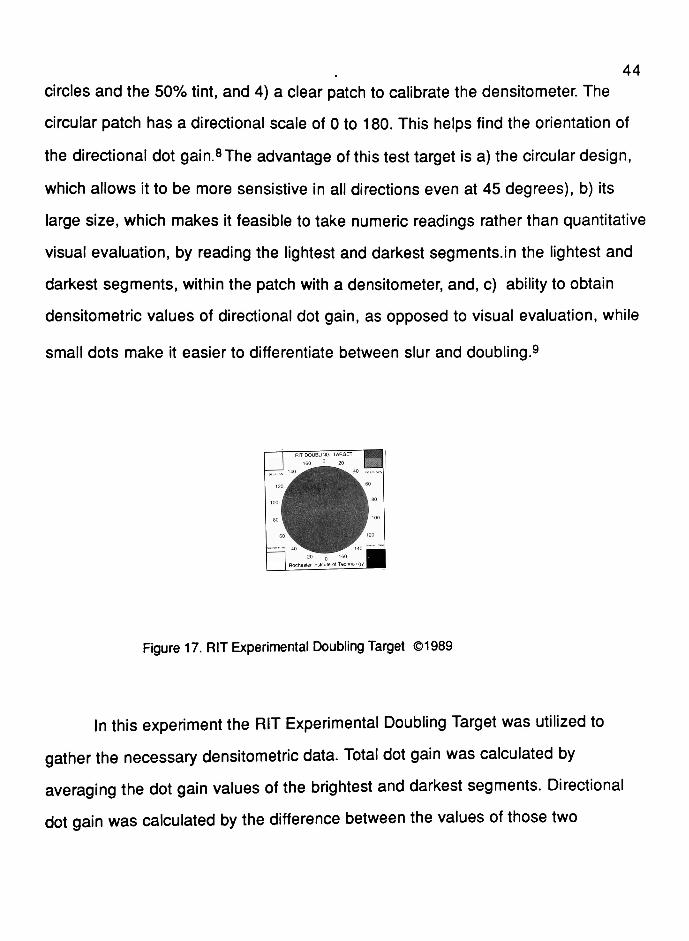
RIT Experimpntal Doubling target
The RIT Experimental Doubling target is not for sale. It measures 1.25 inches
square. The center position of the target has a series of tightly drawn concentric
circles. Each of the corners of the target has a 5mm square patch: 1 ) a 3% dot
patch to observe the efffect of doubling on the small dot, 2) a solid patch to
determine ink film thickness, and thus enables it to calculate dot gain, 3) a 50% tint
to correlate between the average of light and dark area values of the concentric
44
circles and the 50% tint, and 4) a clear patch to calibrate the densitometer. The
circular patch has a directional scale of 0 to 180. This helps find the orientation of
the directional dot gain.8The advantage of this test target is a) the circular design,
which allows it to be more sensistive in all directions even at 45 degrees), b) its
large size, which makes it feasible to take numeric readings rather than quantitative
visual evaluation, by reading the lightest and darkest segments.in the lightest and
darkest segments, within the patch with a densitometer, and, c) ability to obtain
densitometric values of directional dot gain, as opposed to visual evaluation, while
small dots make it easier to differentiate between slur and doubling.9
RIT DOUBLING TARGET !
160 20 jiBLin J 140^^ ^^ 40 ,
Jkm wL\T
100 jH|
80 WU
6o^H ^LW :i
<*..40^^^H ^^^r 140
200
160 [Rocnesler Institute of Technology |
Figure 17. RIT Experimental Doubling Target 1989
In this experiment the RIT Experimental Doubling Target was utilized to
gather the necessary densitometricdata. Total dot gain was calculated by
averaging the dot gain valuesof the brightest and darkest segments. Directional
dot gain was calculated by the difference between the values of those two

45
segments. A solid ink bar positioned on the tail edge of the printed sheet measured
the solid ink density of the printed sheets. It measures three inches wide and as
long as the length of the printed sheet.
UGRA Wedge target
The UGRAWedge main function is to control the platemaking process, but is
also used to evaluate tone reproduction, slur and doubling (directional dot gain). It
measures 174mm long and 14mm wide.10 It is made up of five elements:
1. a continuous tone wedge, intended to show differences in exposure, 2. circular
to check resolution, in order to control exposure, 3. a 60 lines/cm halftone wedge
(screen angle-45 degrees), used for evaluating tone reproduction, 4. slur and
doubling patches (screen ruling of 48 lines/cm), with patches of 0, 45, and 90
degrees, which help aid the density measurements of slur and doubling, and a
small dot patch (screen ruling of 60 lines/cm), on which there are two sets of dot
patches: .5, 1, 2, 3, 4, 5, and 95, 96, 97, 98, 99, 99.5% dot patterns, which help to
identify how the small dots print from the plate to the paper, as well as to identify a
characteristiccurve.11
In this experiment, the UGRA Wedge target was used to verify proper plate making.
9 5% 99% 98% 97% 96% 95%
Figure 18. UGRAWedge 1982

46
Analysis
As previously mentioned, sampling for every press run was done by pulling
one sheet for every 20 printed, for a total of fourteen samples per press run. Once
the samples were gathered, densitometric readings were taken from each of the
twelve doubling test targets on each press sheet. The measuring instrumen was a
COSAR Autosmart system, a densitometer whose readings are immediately stored
in a computer (IBM compatible), and through which dot gain calculations were
performed, using the Murray-Davies equation. The data were used to calculate dot
gain were drawn from areas of the RIT Experimental Doubling Target. Since the
angle of directional dot gain happened to be always zero it was easy to take
automatic densitometric readings off the light and dark segments of the target.
There were five readings that were taken from each target; the 50% tint
square, the zero segment on the concentric circle area, the solid patch, the ninety
degree segment on the concentric circle area, and the solid patch once more. The
values that were calculated were the dot gain of the 50% tint, the dot gain of the
zero degree segment, and the dot gain of the ninety degree segment of the
concentric circle area of the target. Of the twelve targets on each press sheet, the
middle four were chosen to be analyzed. The decision for this selection was based
on the fact that twelve targets would have been an overkill, so the presence of the
remainder were there for reference. The four targets were picked on the basis that
variation from the lead edge (front) to the tail edge (back) of the press sheet would
reveal more interesting results than if the targets ran across the printed sheet
(mechanical variation across the printed sheet is almost always present to some
degree). The average total dot gain and the directional dot gain (slur) values of the

47
targets of all the press runs were then calculated. The total dot gain values were
calculated by averaging the dot gain values of the 0 and 90 degree areas of the
concentric circle area of the target. The slur values were the difference of these two
areas. Even though dot gain values could have been derived from both the circular
patch and the 50% patch, the first was chosen to be used for the dot gain
calculations, since densitometric readings were measured better. The resulting dot
gain values were higher than those which would have been calculated with the
50% patch. This is due to the difference in screen ruling. Higher screen ruling
results in higher dot gain values. From these mean values an analysis of variance
(ANOVA) was used to detrermine whether there was any statistically significant
difference between the mean values of the four targets. After finding that there was
no significant difference between the mean values of the four targets, the values of
one target were chosen to be used for the the final statistical analysis in this
experiment.
The data were stored in LOTUS 1-2-3 computer program. The statistical
analysis was performed using the MINITAB computer program. The analysis of
variance (ANOVA) was used to either accept or reject the fourhypotheses.12 The
value of the F ratio, a derivative of the analysis of variance, was used as the
criterion for either accepting or rejecting each of the nullhypotheses.13The level of
confidence using the ANOVA method was set at 95%. A value of F which was less
than 2.34 resulted in the acceptance of the null hypothesis (the number was found
after looking up an f-testtable).14
Any values greater than 2.34 resulted in the
rejection of the null hypothesis. The derivation of the F value is based on the
degrees of freedom, in terms of a) the number of samples per press run, b) the

48
combination of the degrees of freedom of the three dimensions that were tested
(blanket type, blanket tension, squeeze pressure), and c) the confidence level
(95% for this experiment). Since ANOVA only identifies whether or not there is any
statistically significant differences, and not, where these significant differences
occurred, the Fisher test was used, once there was an indication that significant
differences existed. The calculations were performed with the aid of the MINITAB
program using a VAX computer. Two separate sets of data were used, one for each
blanket, in order to test the four hypotheses.
Instrumentation and Equipment
The instuments and equipment which were used for this experiment are listed
below:
Densitometers:
- X-Rite 408 - for on press SID readings
-COSAR Autosmart System (LOTUS 1-2-3)
Packing Gauge- Baldwin G81-2
Torque Wrench- Craftsman # 44441
VAX computer (MINITAB)
Apple Macintosh computer (Mac Write)
Press: -Heidelberg MOZP 19x25.5 in., Two color, Type: BAE 2-0, Serial # 16689
Blankets: -Conventional- Reeves G-4
Compressible- Reeves 2004
Plate: 3M- Viking G-1 ,aqueous
Paper: Piedmont Gloss, 80 lbs, coated, Text (25x38 inches), # 916960
Ink: Marathon Hardy black, tack-10

49
RIT Experimental Doubling Target (not for sale)
Ladder Target
UGRAWedge Target
SPS 50x Magnifier
Hand held calculator

50
Endnotes for Chapter 5
1Geoffrey Hyatt, "Factors Affecting the Strength and Openability of Tight-
Backed, Adhesive-Bound, Hard CoverVolumes,"
Master Thesis. Rochester Institute
of Technology, 1988, pp.7-12
2Neville Chamberlain, "New Developments in OffsetBlankets,"
Australasian
Printer Magazine. December 1980, p.22.
^Charles W., Latham,."Packing Gauge ImprovesAccuracy."
Lithographic
Technical Foundation Research Progress Report. No. 78. January 1959, pp. 1-4.
4Anon, "Precide Tensioning, Thickness Checks can Eliminate BlanketProblems."
American Printer Magazine. December 1987, p.65.
^Anon, "Precise Tightening, Thickness Checks can Eliminate BlanketProblems."
American Printer Magazine. December 1987, p.66.
6Anon.,UGRA Plate Control Wedge- Directions for use,1982, p.10
7Harry H. Hull, The GATF Ladder Target - A New Test Image,", Graphic Arts
Technical Foundation Research Progress Report No. 99. October 1973.
8Amal A. Ba'adarani, "A Study on Doubling on thge Offset PrintingProcess,"
Master Thesis. Rochester Institute of Technology, 1989, pp.23-25.
9lbid
10Anon.,UGRA Plate Control Wedge- Directions for use, 1982, p.10
11Ibid, p.10
1 2David R. Anderson, Dennis R. Sweeney ,Thomas A. Williams, "Statistics
Concepts and Applications. 2d ed., West Publishing Company, St. Paul,

51
1986, p.477-479
1 3lbid, p.563
1 4Roger C.Pfaffenberger, James H. Patterson, Statistical Methods for
Business and Economics. S^ed., Irwin Press Honewood, 111.1987, p. 11 65

52
CHAPTER 6
THE RESULTS
The data from this experiment have been gathered from measurements taken
from the four targets on each press sheet.This data were read and stored using the
COSAR Autosmart System(a combination of a densitometer connected to an IBM
compatible computer. An analysis of variance (ANOVA) was performed with the aid
of the MINITAB program.
Initially, an analysis of variance was performed in order to determine whether
any significant differences existed throughout the twelve runs, between the four
targets. It was determined that no significant difference existed in the mean values
of the four targets. Thus, the values of one target were selected to be used for the
statistical analysis of the experiment. The data of the one target were analyzed with
the use of the MINITAB program, using a VAX computer. The analysis of variance
(ANOVA) was used to determine which of the four hypotheses should be accepted
and which should be rejected, depending on the F value for each hypothesis
(Appendix B). The values of total dot gain and slur are included in the Appendix A.
Histograms are also displayed showing the distribution of the slur and total dot
gain values at every level of blanket tension, squeeze pressure, and the distinction
of the blanket type used (Appendix C)

53
First Hypothesis
Statistical analysis proved that there is a significant difference in total dot gain
and directional dot gain (in terms of slur), between the squeeze pressure settings of
0.006 in. and 0.008 in., when using conventional blankets (Tables 1, 2- Appendix
A). The F value was calculated to be 1120.06. Since this value was vastly greater
than 2.34, the null hypothesis was rejected. A visual examination indicated that
directional dot gain occurred at the higher squeeze pressure settings with an
orientation of 40, 50, and 60 degrees for blanket tension settings of 15, 30, 45 in/lbs
respectively.
Second Hvpothsis
The analysis of the data indicated that significant differences occurred, when
using two different squeeze pressure levels (.006 in. and 012 in.), on compressible
blankets. The F value was calculated at 1 26.44. This value is much greater than
2.34, and therefore the null hypothesis was rejected. The Fisher test indicated that
the significant differences of the dot gain values was primarily attributed to each of
the squeeze pressure settings, followed by the combination of the blanket type with
the higher squeeze pressure level (Table 2- Appendix-A). Directional dot gain
occurred when the squeeze pressure setting was .012 in, with an orientation of 40
degrees for all blanket tension settings of the compressible blankets.
Third Hypothesis
The statistical analysis for this hypothesis showed no significant differences in
dot gain values, when different blanket tension settings were used (15, 30, 45

54
in/lbs), on a conventional blanket. The F-value was calculated at 1.16. This value
was less than 2.34, and thus, the null hypothesis was not rejected. Directional dot
gain became more obvious as the setting of blanket tension increased, at a
squeeze pressure of .008 in.
Fourth Hypothesis
There was no significant differences in the dot gain values, when using
different blanket tension settings (15,30,45 in/lbs), on compressible blankets. The
F-value was calculated at 2.07. This was less than 2.34, and thus the null
hypothesis was not rejected. The results showed that the increase of blanket
tension increased the dot gain of the conventional blankets while it decreased for
the compressible blankets (Tables 7, 8- Appendix-D).

55
CHAPTER 7
SUMMARY AND CONCLUSIONS
In summary, four hypotheses were tested in this experiment. All four hypotheses
were stated in the form of a null hypothesis.
The first hypothesis stated that there is no statistically significant difference in
dot gain (slur, doubling) as squeeze pressure changes (.006 in. and .008 in.), when
using a conventional blanket. After analyzing the data, the F-value indicated that
squeeze pressure was a significant factor contributing to dot gain (slur). In fact, it
was the single most significant factor for these differences. Directional dot gain
occurred with an orientation of 40, 50, and 60 degrees on the RIT Experimental
Doubling target, when the squeeze pressure was set at .008 in.
The second hypothesis stated that there is no significant difference in dot
gain (slur, doubling) as squeeze pressure changes (.006 in. and .012 in.), when
using a compressible blanket. It was expected that the differences would be
smaller than those exhibited by the conventional blankets, which they were. The
results indicated that the differences were significant. The null hypothesis was thus
rejected. In the statistical analysis the values of total dot gain were also tested so
that they could be compared to the slur values (Appendix B).
When squeeze pressure was set at .006 in. for both conventional and
compressible blankets, the differences in total dot gain and slur values were small.
This was not true for the values generated with the higher squeeze pressure
settings (.008 in. and .012 in.). The values corresponding to each type of blanket
differred, and can be distinguished when shown on a histogram (Appendix C).

56
The third hypothesis stated that there is no statistically significant difference
in dot gain (slur, doubling), at blanket tension settings of 15, 30, 45 in/lbs, when
using a conventional blanket. The blanket tension, proved to contribute very little to
dot gain, compared to squeeze pressure. Directional dot gain increased as blanket
tension settings increased with an orientation of 40, 50, and 60 degrees on the RIT
Experimental Doubling target, at a squeeze pressure of .008 in.
The fourth hypothesis stated that there is no statistically significant difference
in dot gain (slur, doubling), at blanket tension settings of 15, 30, 45 in/lbs, when
using a compressible blanket. The results did show, however, that there was
statistically significant difference in the total dot gain values (F value= 20.94). A
histogram depicts a bimodal distribution of the samples, for values of slur and total
dot gain (Table 5, 6- Appendix C).
From the results it can be seen that as blanket tension and squeeze
pressure settings increased, so did the dot gain values for conventional blankets
(Tables 7, 8- Appendix-D).
With the use of compressible blankets, dot gain values increased when
squeeze pressure was changed from .006 in. to .012 in. However, at both squeeze
pressure setting, an increase in blanket tension resulted in a decrease of the dot
gain values. The average change in slur values that resulted from the difference in
the two squeeze pressure settings were 6.42 for the conventional blankets (.006 in.
and .008 in.), and 1.30 for the compressible blankets (.006 in. and .012 in.).

57
In conclusion, blanket tension did not prove to be a significant factor of dot
gain for the conditions set in this experiment. On the other hand, squeeze pressure
was clearly a very significant factor of dot gain. Compressible blankets were more
tolerant to increased blanket tension than conventional blankets. Conventional
blankets displayed a significant increase in dot gain, which can be attributed to the
lack of resiliency of these blankets at higher tension settings.
Directional dot gain occurred on both types of blankets, at the higher
squeeze pressure settings (.008 in. and .012 in.). The conventional type displayed
an increasing magnitude of doubling as blanket tension increased. The orientation
was 40, 50, and 60 degrees on the RIT Experimental Doubling target. In the
compressible blankets, doubling was consistant at every blanket tension settings,
and occurred at a 40 degree angle of the RIT Experimental Doubling target.
Other observations drawn from this experiment:
The dot gain values throughout the experiment were higher than those
recommended by Heidelberg ( approx. 20%). This increase can be attributed to the
RIT Experimental Doubling target. From studies done by Amal Ba'adarani, it was
shown that the concentric circle area generated higher values than the 50% tint on
the same target. The reason for this was not stated. It was suggested that the
screen ruling may have been the cause. For the purpose of this experiment, only
the concentric circle area of this target was used to generate and analyze the data,
and was sufficient for the tests in this experiment. The visual examination of the
small dots on the targets was done with the aid of a 50x magnifier, since it was not
easy to see the effects with anything less powerful.

58
CHAPTER 8
RECOMMENDATIONS FOR FURTHER STUDY
The following recommendations may prove to be useful in understanding
the behavior ofblanket tension on offset lithographic presses:
Press Size
The size of the press may be a contributing factor in the magnitude of the
resulting dot gain. By the same token, the size of the gears of the press cylinders
have an effect on the gear ratio, and therefore, the setting of ideal squeeze
pressure and blanket tension settings. The blanket of a small press cannot require
the same tension setting as that of a larger one.
The Physics of Tension
An interesting study can be done to determine how effective blanket tension
is around a blanket cylinder. A tension setting of 30 in/lbs may be effective in the
areas closest to the cylinder gap, but not in the area directly opposite this gap.
Identifying physical properties of blanket tension and its uniformity around a
blanket may lend more credence to dot gain patterns, and thus, print quality.
Standardization of Toroue Wrenches
A standardization and calibration technique for torque wrenches would help
establish a more scientific approach to blanket tension setting by pressmen.
Although this experiment did not show that tension was a significant factor in
directional dot gain, a larger press or in different circumstances it could, and in that

59
case it may be wise to be more careful with the use of a torque wrench, in order to
refine the method of blanket tensioning.

60
BIBLIOGRAPHY

61
BIBLIOGRARPHY
Anderson, David R.; Sweeney, Dennis, and Williams, Thomas A. Statistics
Concepts and Applications. 2d ed. St. Paul, West Publishing Company1986.
Anon. "Blankets andRollers."
Printing Eguipment and Materials. February 1979.
Anon. "Blankets and PrintQuality."
Graphic Arts Monthly. February 1986.
Anon. "BlanketCoverage."
Printing World. May 20, 1987.
Anon. "Precise Tensioning, Thickness Checks Can Eliminate BlanketProblems."
American Printer Magazine. December 1987.
Anon. The Influence of Inks and blankets on the Printing Characteristics of a
Sheetfed LithoPress."
Pack and Print. November 1982.
Arnamo, A. and Johansson, R. "Dot Density and Analysis in WebOffset."
Pira/IARIGAI International Conference on Applied Lithographic Technology.
Paper 17. London. October 7-9 1970.
Ba'adarani, Amal A. "A Study on Doubling in the Offset PrintingProcess."
Master
Thesis. Rochester Institute of Technology, 1989.
Bruno, Michael H. "Printing ProcessTrends."
Critical Trends for the 1990's - A
Report for the Graphic Arts Industry. December 1989.
Bureau, William H. "What the Printer Should Know AboutPaper."
Graphic
ArtsTechnical Foundation. 1983.
Chamberlain, Neville. "New Developments in OffsetBlankets."
Australasian Printer
Magazine. December 1980.
Clapper, F. R. and Yule J. A. C. The Effect of Multiple Internal Reflections on the
Densities of Halftone Prints onPaper."
Journal of the Optical Society of
America. No. 7. 1953.
DePaoli, Alan. The Effect of printing Conditions on Dot Gain - An Offset
NewspaperStudy."
TAGA Proceedinos.1981

62
Foley, Bob. "Blankets and Rollers - Challenge toManufacturers."
Printing World.
September 22, 1982.
GATF Staff. "Solving Sheeted OffsetProblems."
Graphic Arts Technical Foundation.
1981.
Hull, Harry H. "A Gripper-to-Tail SlurTarget."
GATF Research Report
PlQgi2S,1971.
Hull, Harry H. The GATF Ladder Target - A New TestImage."
Graphic Arts
Technical Foundation Research Progress Report. No 99. Oct. 1973.
Hyatt, Geoffrey. "Factors Affecting the Strength and Openability of Tight-Backed,
Adhesive-Bound, Hard CoverVolumes."
Master Thesis.Rochester Institute of
Technology. 1988.
Jenner, R. C. "Developments in the OffsetBlanket."
The British Ink Maker. August
1974.
Jorgensen, George W. The LTF Star Target for Ink Spread and ResolutionMeasurements."
Graphic Arts Foundation Research Progress Report. No. 52.
February 1961.
Latham, Charles. "Packing Gauge ImprovesAccuracy."
Lithographic Technical
Foundation Research Progress Report. No. 78. January 1959.
Laubman, Gerd. "Die Richtige desGummituches."
FOGRA Mitteilunoe.. Nr. 94.
December 1977.
Leslie, Geoffrey. "What AboutBlankets."
Australasian Printer magazine. November
1986.
Loibl, Dietmar. "Mechanisches und Drucktechnisches Verhalten VonOffesetrirucktuchern."
FOGRA Mitteilunoen. Nr. 93. November 1977.
MacPhee, John. "Some Ideas on Pinpointing the Cause of HorizontalStreaks."
TAGA Proceedings. 1986.
Mason, Robert L; Gunst, Richard; and Hess, James L Statistical Design and
Analysis of Experiments. John Wiley & Sons. 1989.

63
Milliken, George and Johnson, Dallas. "Analysis of MessyData."
Lifetime Learning
Publication- vol. 1 : Designed Fyperiments 1 984.
Pearson, Milton.; Pobboravski, Irving.; and Daniels, Chester. "Application of a
dynamic Measurement Technique for the Investigation of Dot Gain in WebOffset
Lithography."
TAGA Proceedings.. 1989.
Pearson, Milton.; Pobboravski, Irving.; and Daniels, Chester. "Instrumentation forThe Measurement of Slur and Fill-in on a Lithographic Web
Press."
TAGA
Proceedings. 1979.
Porter, A. S. "LithographicPresswork."
Graphic Arts Technical Foundation. 1980.
Rhodes, Warren. "Influence of Offset Blankets on Print Quality and InkTransfer."
International Bulletin.June 1958.
Sigg, Franz. "A Few Things About Microlines Most People Do NotKnow."
TAGA
Proceedings. 1988.
Sigg, Franz. "A New Densitometric Quality Control System for OffsetPrinting."
TAGA Proceedings. 1 970.
Smith, John. "Technical Aspects of OffsetBlankets."
Australasian Printer Magazine.
December 1985/January 1986.
Smith, J. M. "The Influence of Physical Properties on BlanketPerformance."
Pira
Seminar S14 - Offset Lithographic Blankets - a Technical Update.
Southworth, Miles, F. Quality Control Scanner. Vol. 1, No.2. 1981.
Sutton, E. R. Technology of LithoBlankets."
The British Ink Maker. February 1971.
Tollenaar, D. "Remarks on Ink Transfer". IARIGAI12th International Conference
Versailles, France, June 1973 1974
Tritton, K. T. "Modifying the Dot Gain Characteristics of Sheetfed OffsetPresses."
Pira Research Report PR4. November 1981.
Tyma, Louis, S. et al. "Bearers- A Necessary
Evil?"
TAGA Proceedings. 1 982.
Voglesong, William. "Standard Performance Material forDensitometry."
TAGA
Proceedings. 1989.

64
Walker, William, and Carmack, Robert F. The Printing Smoothness ofPaper."
Advances in Printing Technology. Pergamon Press, Vol. 3. 1963.
Warner, Richard D. The GATF Dot Gain Scale-II"GATF Annual Research Report.
1983/1984.
Williams, C. H. "Lithographic ProcessInks."
Inklings. No.120, 1982.
Witte, Dan. "Blankets Remain Stable in the Face ofChange."
Hioh Volume Printing.
June 1981.
Ynostroza, Roger. "A New Look at an OldFriend."
Graphic Arts Monthly. October
1984.
Zonghi, Gong, and Jinzhi Wu. The Optical Analysis of the Cylinder Packing in the
OffsetPress."
TAGA Proceedings. 1 988.

65
APPENDIX A

66
Table 1. Factor Breakdown and Slur Values.
C11 Ci12 C13 C14 C15 C16 C17 C18
1 1 1 0.49 2 3 0.26
2 1 2 6.88 2 4 2.33
3 1 1 0.55 2 3 0.95
4 1 2 7.06 2 4 2.05
5 1 1 0.16 2 3 0.00
6 1 2 5.89 2 4 2.30
7 1 1 0.58 2 3 0.53
8 1 2 7.21 2 4 2.73
9 1 1 0.32 2 3 0.69
10 1 2 7.74 2 4 2.42
11 1 1 0.47 2 3 0.49
12 1 2 7.02 2 4 2.42
13 1 1 1.25 2 3 0.65
14 1 2 7.47 2 4 1.53
15 1 1 1.28 2 3 0.65
16 1 2 7.28 2 4 0.26
17 1 1 0.45 2 3 1.22
18 1 2 8.17 2 4 1.69
19 1 1 0.85 2 3 0.17
20 1 2 7.91 2 4 2.54
21 1 1 0.29 2 3 0.09 Conventional Blankets:
22 1 2 8.10 2 4 1.85
23 1 1 0.26 2 3 0.63 C11: Blanket tension
24 1 2 7.48 2 4 2.61 C12: Conventional
25 1 1 0.61 2 3 0.23 C13: Squeeze pressure
26 1 2 7.23 2 4 2.42 C14: Slur values
27 1 1 0.36 2 3 0.43
28 I 2 7.79 2 4 3.11
29 2 1 1 0.23 2 2 3 0.40
30 2 I 2 5.08 2 2 4 0.36
31 2 I 1 0.85 2 2 3 0.63
32 2 I 2 6.05 2 2 4 1.64
33 2 I 1 0.16 2 2 3 0.81 Compressible Blankets:
34 2 I 2 4.52 2 2 4 1.18
35 2 I 1 0.29 2 2 3 0.70 C15: Blanket tension
36 2 I 2 5.94 2 2 4 1.26 C16: Compressible
37 2 I 1 0.91 2 2 3 0.44 C17: Squeeze pressure
38 2 I 2 5.59 2 2 4 1.39 C18: Slur values
39 2 I 1 0.72 2 2 3 0.33
40 2 I 2 4.54 2 2 4 1.05

67
Table 1. Factor Breakdown and Slur Va ues. [continued)C11 C12 C13 C14 C15 C16 C17 C18
41 2 1 1 0.33 2 2 3 0.57
42 2 1 2 5.00 2 2 4 0.75
43 2 1 1 0.81 2 2 3 0.37
44 2 1 2 5.53 2 2 4 2.18
45 2 1 0.49 2 2 3 0.70
46 2 2 5.34 2 2 4 0.89
47 2 I 1 0.03 2 2 3 0.16
48 2 I 2 5.53 2 2 4 1.40
49 2 I 1 0.32 2 2 3 0.13
50 2 I 2 6.32 2 2 4 1.68
51 2 I 1 0.07 2 2 3 0.13
52 2 I 2 5.73 2 2 4 1.65
53 2 I 1 0.58 2 2 3 0.67
54 2 1 2 6.40 2 2 4 2.24
55 2 1 1 0.00 2 2 3 0.44
56 2 1 2 5.13 2 2 4 1.69
57 3 1 1 0.07 3 2 3 0.66
58 3 1 2 8.55 3 2 4 2.12
59 3 1 1 0.13 3 2 3 0.09
60 3 1 2 8.29 3 2 4 0.98
61 3 1 1 2.14 3 2 3 0.83
62 3 1 2 8.07 3 2 4 1.90
63 3 1 1 0.44 3 2 3 0.54 Conventional Blankets:
64 3 1 2 7.49 3 2 4 1.94
65 3 1 1 0.55 3 2 3 0.57 C11: Blanket tension
66 3 1 2 7.80 3 2 4 1.45 C12: Conventional
67 3 1 1 0.78 3 2 3 0.31 C13: Squeeze pressure
68 3 1 2 7.65 3 2 4 1.68 C14: Slur values
69 3 1 1 0.10 3 2 3 0.57
70 3 1 2 7.73 3 2 4 1.38
71 3 1 1 0.54 3 2 3 0.57
72 3 1 2 7.81 3 2 4 0.78
73 3 1 1 0.88 3 2 3 0.23 Compressible Blankets:
74 3 1 2 7.46 3 2 4 1.12
75 3 1 1 0.64 3 2 3 1.22 C15: Blanket tension
76 3 1 2 7.35 3 2 4 1.22 C16: Compressible
77 3 1 1 0.00 3 2 3 0.00 C17: Squeeze pressure
78 3 1 2 7.87 3 2 4 1.55 C18: Slur values
79 3 1 1 0.81 3 2 3 0.78
80 3 1 2 7.66 3 2 4 1.94

68
Table 1. Factor Breakdown and Slur Values, (continued)C11 C12 C13 C14 C15 C16 C17 C18
81 3 1 1 0.00 3 2 3 0.14
82 3 1 2 8.12 3 2 4 2.16
83 3 1 1 0.84 3 2 3 0.14
84 3 1 2 8.51 3 2 4 1.73

69
Table 2. Factor Breakdown and Total Dot Gain'
Values.
C11 C12 C13 C14 C15 C16 C17 C18
1 1 1 30.42 2 3 34.58
2 1 2 39.07 2 4 36.50
3 1 1 30.75 2 3 35.28
4 1 2 40.00 2 4 35.87
5 1 1 30.71 2 3 34.54
6 1 2 39.08 2 4 35.97
7 1 1 31.15 2 3 34.81
8 1 2 39.52 2 4 35.93
9 1 1 31.47 2 3 34.56
10 1 2 39.56 2 4 36.06
11 1 1 31.87 2 3 35.02
12 1 2 39.80 2 4 35.63
13 1 1 30.05 2 3 34.60
14 1 2 39.53 2 4 36.04
15 1 1 31.29 2 3 33.96
16 1 2 39.59 2 4 36.13
17 1 1 31.10 2 3 35.04
18 1 2 39.08 2 4 36.40
19 1 1 31.24 2 3 34.50
20 1 2 39.67 2 4 36.36
21 1 1 30.88 2 3 34.27 Conventional Blanket
22 1 2 40.00 2 4 36.18
23 1 1 31.36 2 3 34.28 C11: Blanket tension
24 1 2 39.76 2 4 35.85 C12: Conventional
25 1 1 31.33 2 3 34.58 C13: Squeeze level
26 1 2 39.14 2 4 36.31 C14: Dot gain values
27 1 1 31.07 2 3 34.90
28 1 2 39.66 2 4 35.54
29 2 1 1 31.52 2 2 3 31.31
30 2 1 2 42.31 2 2 4 34.87
31 2 1 1 30.78 2 2 3 32.45
32 2 1 2 40.65 2 2 4 34.87
33 2 1 1 31.59 2 2 3 31.67 Compressible Blankets:
34 2 1 2 40.39 2 2 4 34.90
35 2 1 1 31.42 2 2 3 31.52 C15: Blanket tension
36 2 1 2 40.92 2 2 4 34.80 C16: Compresssible
37 2 1 1 31.19 2 2 3 32.01 C17: Squeeze pressure
38 2 1 2 40.92 2 2 4 34.50 C18: Dot gain values
39 2 1 1 31.53 2 2 3 31.46
40 2 1 2 42.37 2 2 4 34.93

70
abUi 2. Factor Breakdown and Total Dot Gain
C11 C12 C13 C14 C15 C16 C17'
C18
41 2 1 1 31.03 2 2 3 31.19
42 2 1 2 41.19 2 2 4 35.03
43 2 1 1 31.92 2 2 3 31.18
44 2 1 2 41.71 2 2 4 34.95
45 2 1 1 30.98 2 2 3 31.71
46 2 1 2 41.86 2 2 4 34.73
47 2 1 1 31.50 2 2 3 31.46
48 2 1 2 41.81 2 2 4 34.75
49 2 1 1 32.89 2 2 3 31.54
50 2 1 2 41.86 2 2 4 34.61
51 2 1 1 31.83 2 2 3 32.33
52 2 1 2 42.15 2 2 4 34.67
53 2 1 1 31.49 2 2 3 31.87
54 2 1 2 42.14 2 2 4 34.55
55 2 1 1 31.95 2 2 3 31.73
56 2 1 2 41.59 2 2 4 34.36
57 3 1 1 32.44 3 2 3 30.71
58 3 1 2 40.85 3 2 4 35.09
59 3 1 1 31.55 3 2 3 31.04
60 3 1 2 40.85 3 2 4 35.07
61 3 1 1 31.56 3 2 3 30.82
62 3 1 2 41.03 3 2 4 34.98
63 3 1 1 30.93 3 2 3 30.31
64 3 1 2 41.44 3 2 4 34.80
65 3 1 1 30.72 3 2 3 31.02
66 3 I 2 41.07 3 2 4 35.18
67 3 I 1 30.22 3 2 3 31.35
68 3 I 2 41.24 3 2 4 34.10
69 3 I 1 30.78 3 2 3 30.86
70 3 I 2 41.29 3 2 4 34.25
71 3 I 1 30.98 3 2 3 30.31
72 3 2 41.08 3 2 4 34.83
73 3 1 30.63 3 2 3 30.79
74 3 2 41.14 3 2 4 34.91
75 3 1 1 30.33 3 2 3 30.76
76 3 1 2 40.88 3 2 4 34.40
77 3 1 1 30.75 3 2 3 31.36
78 3 1 2 41.19 3 2 4 34.62
79 3 1 1 30.65 3 2 3 30.98
80 3 1 2 41.23 3 2 4 34.83
Values, (continued)
Conventional Blankets:
C11: Blanket tension
C12: Conventional
C13: Squeeze pressure
C14: Dot gain values
Compressible Blankets:
C15: Blanket tension
C16: Compressible
C17: Squeeze pressure
C18: Dot gain values

. 71
Table 2. Factor Breakdown and Total Dot Gain Values. (continued)C11 C12 C13 C14 C15 C16 C17 C18
81 3 1 1 30.01 3 2 3 30.07
82 3 1 2 41.33 3 2 4 35.41
83 3 1 1 30.70 3 2 3 30.5684 3 1 2 41.12 3 2 4 34.89

72
APPENDIX B

73
Table 3. Analysis of Variance for Slur Values
Analysis of Variance of Tension on Conventional Blankets
SOURCE DF SS MS F ptension 2 25.6 12.8 1.16 0.319
ERROR 81 896.5 11.1
TOTAL 83 922.2
LEVEL N MEAN STDEV + + + +
1 28 3.970 3.498 (*
)2 28 2.946 2.620 (
*
)3 28 4.224 3.755 (
*
)+-
+ + +
POOLED STDEV = 3.327 2.4 3.6 4.8 6.0 (slur)
Analysis of Variance of Tension on Compressible Blankets
SOURCE DF SS MS F P
tensions 2 2.531 1.266 2.07 0.132
ERROR 81 49.419 0.610
TOTAL 83 51.951
LEVEL N MEAN STDEV + + +
1 28 1.3304 0.9997 (*
)2 28 0.9229 0.6126 (
*
)3 28 1.0214 0.6751 (
*
)+ + +
POOLED STDEV = 0.7811 0.90 1.20 1.50 (slur)
Analysis of Variance of Squeeze Pressure on Conventional Blankets
SOURCE DF SS MS F P
squeeze 1 859.264 859.264 1120.06 0.000
ERROR 82 62.907 0.767
TOTAL 83 922.171

74
LEVEL N MEAN STDEV + + +
1 42 0.5150 0.4162 (-*)2 42 6.9117 1.1667 (-*)
+ + +
POOLED STDEV = 0.8759 2.0 4.0 6.0 (slur)
Analysis of Variance of Squeeze Pressure on Compressible Blankets
SOURCE DF SS MS F psqueezes 1 31.513 31.513 126.44 0.000
ERROR 82 20.438 0.249
TOTAL 83 51 .951
LEVEL N MEAN STDEV - + +-+
+--
3 42 0.4790 0.2995 (--*--)4 42 1.7040 0.6394 (--*--)
+ + ++..
POOLED STDEV = 0.4992 0.50 1.00 1.50 2.00 (slur)

75
FISHER TESTS ON SLUR.
Fisher Test of Squeeze Pressure on Conventional Blankets
Nominal level = 0.0500
Family error rate = 0.0500Individual error rate = 0.0500
Critical value = 1 .989
Intervals for (mean of column group)- (mean of row group)
1
2 -6.7768
-6.0165
Fisher Test of Squeeze Pressure on Compressible Blankets
Nominal level = 0.0500
Family error rate = 0.0500
Individual error rate = 0.0500
Critical value = 1 .989
Intervals for (mean of column group)- (mean of row group)
3
4 -1.4417
-1.008

76
Table 4. Analysis of Variance for Total Dot Gain Values.
Analysis of Variance on Tension-Conventional Blankets
SOURCE DF SS MS F ptension 2 21.5 0.7 0.45 0.638
ERROR 81 1921.2 23.7
TOTAL 83 1942.7
LEVEL N MEAN STDEV --
+ + +
1 28 35.146 4.249 (*
)2 28 36.350 5.066 (
*
)3 28 36.000 5.238 (
*
)+ + +
STDEV = 4.870 34.5 36.0 37.5 (total dot gain)
Analysis of Variance on Tension-Compressible Blankets
SOURCE DF SS MS F P
tensions 2 104.78 52.39 20.94 0.000
ERROR 81 202.66 2.50
TOTAL 83 307.43
LEVEL N MEAN STDEV --+ ++- +----
1 28 35.346 0.786 (.-*.-)2 28 33.213 1.595 (.*-)
3 28 32.796 2.084 (-*-)+ + +
+.
POOLED STDEV = 1.582 32.4 33.6 34.8 36.0 (total dot gain)

77
Analysis of Variance on Squeeze Pressure-Conventional Blankets
SOURCE DF SS MS F psqueeze 1 1836.62 1836.62 1420.04 0.000
ERROR 82 1942.68
LEVEL N MEAN STDEV + + +
1 42 31.156 0.599 (*)2 42 40.508 1.493 (*)
+ + +
POOLED STDEV = 1.137 33.0 36.0 39.0 (total dot gain)
Analysis of Variance Squeeze Pressure-Compressible Blankets
SOURCE DF SS MS F P
squeezes 1 169.60 169.60 100.90 0.000
ERROR 82 137.83 1.68
TOTAL 83 307.48
LEVEL N MEAN STDEV -+ + ++-
3 42 32.364 1.707 (*)4 42 35.206 0.670 (---*)
-+ + + +
POOLED STDEV = 1.296 32.0 33.0 34.0 35.0 (total dot gain)

78
FISHER TESTS ON DOT GAIN.
Fisher Test for Squeeze Pressure on Conventional Blankets
Nominal level = 0.0500
Family error rate = 0.0500Individual error rate = 0.0500
Critical value = 1 .989
Intervals for (mean of column group)- (mean of row group)
1
2 -9.846
-8.858
Fisher Test for Squeeze Pressure on Compressible Blankets
Nominal level = 0.0500
Family error rate = 0.0500
Individual error rate = 0.0500
Critical value = 1 .989
Intervals for (mean of column group)- (mean of row group)
3
4 -3.405
-2.279

79
APPENDIX C

Table 5. HISTOGRAMS OF SLUR VALUES.
Histogram of Slur Values for Conventional Blankets (CV)
Midpoint Frequency(A% slur)
0 23
1 18
2 1
3 0
4 0
5 6
**********************
*****************
6 9
7 11
8 14
9 2
******
*********
***********
**************
**
Histogram of Slur for Compressibe Blankets (CM)
FrequencyMidpoint
(A% slur)
0
Fr(
23
1 34
2 23
3 4
4 0
5 0
6 0
7 0
8 0
9 0
**********************
********************************
**********************
****

81
Histogram of Slur for Tensions 15 in/lbs (for CV and CM combined)Midpoint Frequency(A% slur)
0 16****************
1 13*************
2 9*********
3 4****
4 0
5 0
6 1*
7 8********
8 5*****
******************
******************
******
Histogram of Slur for Tensions 30 in/lbs (for CV and CM combined)
Midpoint Frequency(A% slur)
0 18
1 18
2 6
3 0
4 0
5 6
6 8
7 0
8 0
9 0
Histogram of Slur for Tensions 45 in/lbs (for CV and CM combined)
Midpoint Frequency(A% slur)
0 12
******
********
1 21
2 9
3 0
4 0
5 0
6 0
7 3
8 9
9 2
************
*********************
*********
***
*********
*

82
Histogram of Slur for Squeeze Pressure (CV=.006 in. CM=.006 in.)
FrequencyMidpoint Frc-
(A% slur)
0 44
1 39
2 1
3 0
4 0
5 0
6 0
7 0
8 0
9 0
*********************************************
***************************************
Histogram of Slur for Squeeze Pressure (CV=.008 in. CM=.012 in.)
Midpoint Frequency(A% slur)
0 2
1 13
2 23
3 4
4 0
5 6
6 9
7 11
8 14
9 2
**
**************
**********************
****
******
*********
***********
**************
**

Table 6. HISTOGRAMS OF TOTAL DOT GAIN VALUES.
Histogram of Dot Gain for Conventional Blankets (CV)
Midpoint Frequency(A% d. gain)
30 5*****
31 25*************************
32 11***********
33 1*
34 0
35 1*
36 1*
37 0
39 4****
40 10**********
41 17*****************
42 9*********
Histogram of Dot Gain for Compressible Blankets (CM)
Midpoint Freqilency
(A% d. gain)
30 1*
30.5 4****
31 9*********
31.5 10**********
32 2**
32.5 2**
33 0
33.5 0
34 2**
34.5 17*****************
35 21*********************
35.5 4*****
36 8********
36.5 4****

84
Histogram of Dot Gain for Tensions 15 in/lbs (CV and CM combined)
Midpoint Frequency(A% d. gain)
30 2**
31 11*
32 1*
33 0
34 3***
35 11***********
36 14**************
37 1*
38 0
39 4****
40 9*********
41 0
42 0
Histogram of Dot Gain for Tensions 30 in/lbs (CV and CM combined)
Midpoiint Frequency(A% d. gain)
30 0
31 11***********
32 16****************
33 1*
34 1*
35 1**************
36 0
37 0
38 0
39 0
40 1*
41 3***
42 9*********
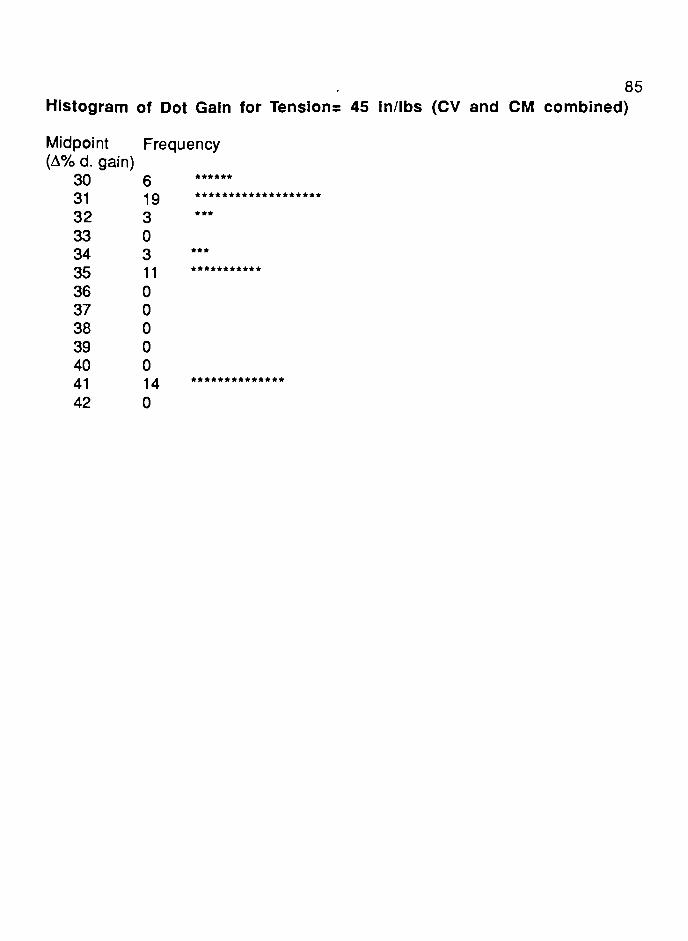
85
Histogram of Dot Gain for Tensions 45 in/lbs (CV and CM combined)
Midpoint Frequency(A% d. gain)
30 6******
31 19*******************
32 3***
33 0
34 3***
35 11***********
36 0
37 0
38 0
39 0
40 0
41 14**************
42

86
Histogram of Dot Gain for Squeeze Pressure (CV and CM= .006 in)
Midpoint
(A% d. gain)30
Frequency
p********
31 41*****************************************
32 20********************
33 1*
34 3***
35 11***********
36 0
37 0
38 0
39 0
40 0
41 0
42 0
Histogram of Dot Gain for Squeeze Pressure (CVs.008 in. CM=.012 in)
Midpoint
(A% d. gain)
30
Frequency
0
31 0
32 0
33
34
35
0
4
25
****
*************************
36 14**************
37 1*
38
39
40
41
0
4
10
17
****
**********
*****************
42 9*********

87
APPENDIX D

TABLE 7. MEAN VALUES OF DOT GAIN
88
Squeeze_Pressure"
o
CO
LU
ir>
.O
oCO
V)
in
CONVENTIONAL
BLANKET
COMPRESSIBLE
BLANKET
.006 IN.008.IN
.006 IN.012 IN
in
in
31.05 39.24 34.64 36.06
35.15 35.35
CO
S
31.55 41.16 31.69 34.75
36.35 33.22
o
: %::::.
o
30.88 41.12 30.78 34.81
36.00 32.80
31.16 40.51 32.37 35.21
^^^?^^|^| 33,79

TABLE 8. MEAN VALUES OF SLUR
89
Squeeze_Pressure"
o
c/)
zLUr-
.Q
CO
oCO
to
X)
in
CONVENTIONAL
BLANKET
COMPRESSIBLE
BLANKET
.006 IN .008.IN.006 IN
.012 IN
is
o
.58 7.37 .50 2.33
3.97 1.42-: ':;-:
-..
<0
0
;i;1r~;?::-:r
.41 5.48 .46 1.38
2.80.92
to
| .49 j 7.88 .47 1.64
4. 39 1.06
.49 6.91 .48 1.78
3.72 113

90
APPENDIX E