Embed Size (px)
Citation preview
Indian J.Sci.Res.1(2) : 445-452, 2014 ISSN : 0976-2876 (Print)
ISSN:2250-0138(Online)
__________________________________ 1Corresponding author
THE EFFECTS OF MILLING PARAMETERS ON SURFACE ROUGHNESS OF
STAINLESS STEEL X22 CR MO V 12 1
MOHAMMAD KHORAN1a, POUYAN GHABEZI
b AND EISA KHORAN
c
aLecturer of Esfarayen university, Esfarayen. Iran
bYoung Researchers and Elites club, Science and Research Branch, Islamic Azad University, Tehran, Iran, cMaster student of Material Engineering, Bahonar University of Kerman, Kerman, Iran
ABSTRACT Stainless Steels have several uses in different industries and include an extensive area of steels, and because of many
differences between mechanical and physical properties of different kinds of stainless steels, it is still necessary to
study this type of steels. The surface roughness has been regarded by many researchers since many years ago,
because of its high importance in the efficiency of final product, and also because it is considered as a main parameter
in examining machinability of metals. In this paper, the experimental reports about optimizing roughness of final
surface in milling stainless steel X22 Cr MoV 12 1, has been carried out using multiple regression technique and
ANN(Artificial Neural network). The second order mathematical model has been attained from input parameters of
process including cutting speed; Feed rate, radial and axial depths of cut. Each of these inputs of the research has
been studied in 3 levels and for this purpose totally 81 experiments have been performed. After measuring the surface
roughness caused by milling, the obtained model has been used for scrutinizing the effects of different parameters,
and also for predicting the optimal milling parameters in order to obtain ideal surface Roughness.
KEYWORDS: Stainless Steel, Milling Parameters, Multiple Regression, Artificial Neural Network, Surface Roughness.
The reason for choosing stainless steels in
industry is usually their high strength and resistance
against impact, and also unique capability of these
steels in resistance against corrosion and heat.
Machinability of different kinds of stainless steels
varies diversely in different usages of them and this
fact is a ground for machining these steels. Since
physical and mechanical properties of each type of
these steels differ with those of each other, so their
machinability are different too
Martensiticstainless steel X22 CrMoV 12 1 is a
Ferromagnetic steel and belongs to the group of
stainless steels resistant against heat and creep
which is used in pressure pipes, boilers,
airspaceequipment, manufacturing reactors,
components of turbines, and also in screws and nuts
which work in high temperatures. Because of high
toughness, low heat transfer, and high degree of
work hardening, stainless steels are known as
hardlymachinable materials(Paro, 2001). The most
important features which influence the behavior of
machining stainless steels are:
• Stainless steels have higher tensile strength and
higher median between yield strength and failure
strength, comparing with low and medium carbon
steels. Hence the needed energy for machining
stainless steels is more than that for cutting
ordinary steels.
• Austenitic stainless steels have high work
hardening rate and low heat transfer. High
hardening work rate results in increment of
consumed energy in comparison with carbonic
non-hardened steels, and also low heat transfer of
these steels causes increasing the heat slope of
chips, and increasing produced heat in the region
of secondary transformation leads toincrement of
temperature in common interface of chip and
tools which consequently raises the rate of wear
(wear is considerably function of temperature).
• Some groups of high carbon stainless steels
which contain remarkable amount of free
particles of carbide are hardly machining, since
because of existence these particles, the ground
hardness increases and also results in rigorous
wear of the cutting tool.
Surface roughness of stainless steels 304 and 316
using two carbide tools coatedby Titanium Nitride
and Aluminum Oxide has been studied (Ciftici,
2006). His report showed that in both cases by
increasing cutting speed the surface roughness and
machining force reach to a minimum measure and
then by more increment of this speed they increase.
The cause of decrement of surface roughness is that
the built-up edge did not form, and the cause of
decreasing the force is decrement of contact area
and shear strain in the Flowing area as a result of
raising temperature. Increasing in both roughness
and force are caused by tool wearing.
(Razfar,Zinati,2011) have studied the optimization
of surface roughness resulted from process of
turning and milling (facemilling) Martensitic
stainless steel 420 (X20Cr13). Through performing
81 examinations, which were implemented for
three levels of four input parameters __ insert
edgeradius, cutting speed, Feed rate and cutting
depth__, (Suresh et al) have predicted and
MOHAMMAD KHORAN ET AL.: THE EFFECTS OF MILLING PARAMETERS ON SURFACE ROUGHNESS OF
STAINLESS STEEL…
Indian J.Sci.Res.1(2) : 445-452, 2014
446
optimized machining parameters in order to
achieve to minimum measure of surface roughness.
(Oktem, 2009) have accomplished a comprehensive
study on surface roughness during milling process
with the purpose of optimization and modeling.His
studied materials were AISI 1040 and carbide tool
with TIALN coating. (Korkut et al, 2004) studied
machinability of Austenitic stainless steel 304 by
multi-layer coatedcemented carbide tool. They
reported in their researches that by increasing
cutting speed the surface roughness decreases and
described the failure in forming built-up edge and
softening the workpiece as causes of this
decrement. (Hasan et al, 2008) investigated surface
roughness of stainless steel 440C in turning process
and declared that because of special nature of this
steel, during machining its function is
unpredictable. In turning Martensitic stainless steel,
one should consider that by choosing medial
cutting speed and high Feed rate and cutting depth,
the measure of produced heat is so little that does
not result in wearing. (Bruni et al, 2006) studied
effects of using three cooling methods __i.e. MQL
technique, dry technique and applying cooling __
on the stainless steel 420B. They observed that
these three methods have no meaningful difference
with together in their influences on wearing, but
using cooling liquid leads to minimal surface
roughness. They explained that why cooling liquid
and MQL technique have no effect on wearing:
when dry machining is applied, the resulted heat
leads to softening the transformation zone and so to
decreasing roughness and tool wear, and on the
other hand increment in temperature causes more
tool wear (since heat softens the tool). But if
cooling takes place, heat caused softening does not
occur and also easier material flowing, which
causes more roughness and tool wear, does not
happen. (Alauddin et al, 1995)offered a
mathematical model for predicting surface
roughness during milling process, based on
response surfaces methodology. (Shaoo et
al)implemented a research on machining by end
milling tool and optimization surface roughness
using response surface methodology. (Chen J.
C.)Studied the effects of cutting speed, Feed rate,
and cutting depth on surface roughness in
machining by end milling on aluminum worked
piece.
Reviewing the literature of modeling surface
roughness showed that numerous studies on this
parameter have been implemented. In this paper a
second order model on the basis of various
experimental measurements has been developed, in
order to introduce a model for scrutinizing the
effects of different parameters on the surface
roughness. Cutting speed, Feed rate, axial and
radial depths of cut have been considered as input
parameters, and surface roughness as output one.
SURFACE ROUGHNESS
Surface roughness is an important parameter
of quality of workpiece surface and has so much
effect on final function and production cost of
pieces, and also on mechanical properties such as
fatigue life, corrosion resistance, creep resistance
and …, and on the other features of the piece like
as friction, lubrication, electrical conductivity and
so on. Hence, many researches have been carried
out on modeling surface roughness and optimizing
and controlling the parameters in order to find ideal
surface roughness through choosing correctly the
machining parameters.
Surface roughness is one of the irregular aspect of
workpiece which is resulted from machining
processes. There are different ways for explaining
surface roughness. One of them is mean roughness
which is shown commonly by��. ��is defined as the difference value calculated according to mean
line.
METHODOLOGY
Multiple Regression
The multiple regression is an expansion of
regression analysis which predicts several
independent variables in equation. In other
words,formodeling and analyzing the problems
whose answersare influenced by several variables,
and their goal is optimizing the output, one can
determine the relationships between independent
and dependent variables by using this method. In
most problems the form of relationship between
response and independent variables is unknown.
So, the first step is finding a proper approximation
for correct functional relationship between response
Y and a group of controllable variables
(��� ��� � � ��). Commonly when the response function is unknown or nonlinear, a second order
model such as following one is applied:
(1)
Or
MOHAMMAD KHORAN ET AL.: THE EFFECTS OF MILLING PARAMETERS ON SURFACE ROUGHNESS OF
where ε represents error and is the difference
between response Y and expected answer
constant value of regression formula. For
fitting a formula containing input variables by
minimizing residual error measured by sum of
squares of deviances between real and expected
answers, the minimum mean squares technique is
used. After modeling, the regression should be
formed, and checked according to calculated
coefficients orequations of the model or, ultimately,
statistical meaningfulness.
Artificial neural network
An ANN is an algorithm that can learn and
remember experiential knowledge. The massively
simple and connected artificial neurons are used to
simulate the ability of a biological brain. The
architecture of ANN is made of an input layer, a
hidden layer and an output layer. Each layer has a
set of neurons that has the same function. A neuron
is an information process unit. The basic aspects of
the neuron model are illustrated in below. The
mathematical model of a neuron is represented
Eq.(3).
Where x1,x2,…,xp are the input information, w
wk2,…,wkp are weight for neurons k, u
combiner, θkthe threshold value, f the activation
function, and yk the output of neuron. As has been
said there are three layers in an ANN; that is, an
input layer, a hidden layer and an output layer.
Each layer has a set of neurons that has the same
function. The activation functions used in this study
are the logsig-logsig-logsig transfer function. The
weights and threshold values will be modified as
the network input one training sample. The back
propagation neural network (BPN) that is a kind of
ANN has been used in this paper because of its
good agreement behavior in prediction for complex
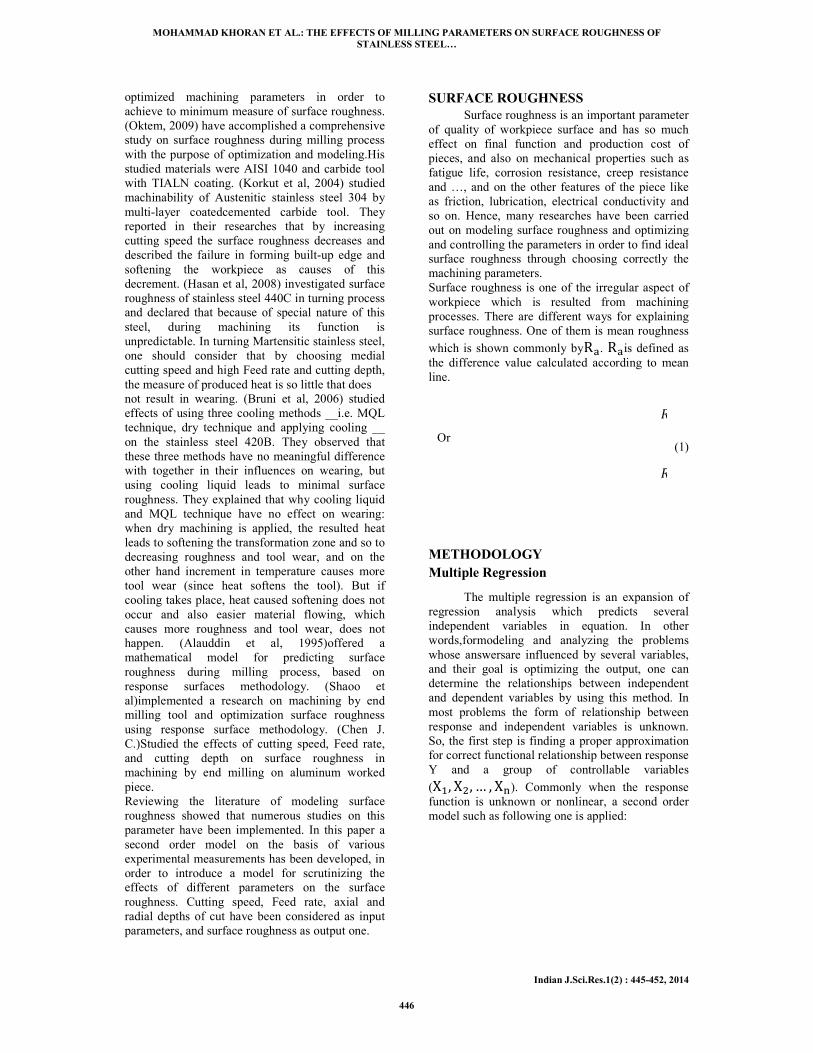
problems. The structure of BPN is illustrated in
Fig. 1.
MOHAMMAD KHORAN ET AL.: THE EFFECTS OF MILLING PARAMETERS ON SURFACE ROUGHNESS OF
STAINLESS STEEL…
Indian J.Sci.Res.1(2) : 445
where ε represents error and is the difference
answer. is the
constant value of regression formula. For curve
g input variables by
measured by sum of
squares of deviances between real and expected
answers, the minimum mean squares technique is
used. After modeling, the regression should be
ked according to calculated
coefficients orequations of the model or, ultimately,
An ANN is an algorithm that can learn and
remember experiential knowledge. The massively
l neurons are used to
simulate the ability of a biological brain. The
architecture of ANN is made of an input layer, a
hidden layer and an output layer. Each layer has a
set of neurons that has the same function. A neuron
e basic aspects of
the neuron model are illustrated in below. The
mathematical model of a neuron is represented in
(3)
are the input information, wk1,
are weight for neurons k, uk the
the threshold value, f the activation
the output of neuron. As has been
said there are three layers in an ANN; that is, an
input layer, a hidden layer and an output layer.
Each layer has a set of neurons that has the same
function. The activation functions used in this study
transfer function. The
weights and threshold values will be modified as
the network input one training sample. The back-
propagation neural network (BPN) that is a kind of
NN has been used in this paper because of its
good agreement behavior in prediction for complex
problems. The structure of BPN is illustrated in
Figure 1: BPN that used in this paper
The BPN includes two phases. The first one is
called the training process that can update the
weight values and threshold values for each neuron
by giving the training patterns obtained from
experiments. The second one is called the recalling
process that can read the well-trained weight values
and threshold values from the training process and
has the prediction ability.
PROCEDURE OF EXPERIMENT
Design of Experiment
There are many factors for machining a
specific material in milling process with
milling which one can suggest. Anyway, reviewing
the literature shows that four machining factors
have significant effect on output parameters of
process. In order to study effects of input
parameters on milling process perfectly, each of
cutting rate, Feed rate, radial and axial
were changed in three levels in full factorial
manner, and so 34=81 experiments have been
considered and the tests have been executed in this
research. In table 1 design levels of the experiment
are shown.
Table 1: Design levels of Experiment
Level 2 Level 1
100 40 Vc
0.04 0.02 fz
1 0.5 ap
2.5 1 ae
EQUIPMENT
For executing experiments we have used
HARTFORD-VMC1000 milling machine
CNCwith the controller FANUC
machine CNC has maximum spindle speed 6000
(rpm) and maximal Feed rate 10000 (mm/min).
Through reviewing the literature of
the TiN coated tools lead to lesser machining forces
MOHAMMAD KHORAN ET AL.: THE EFFECTS OF MILLING PARAMETERS ON SURFACE ROUGHNESS OF
Indian J.Sci.Res.1(2) : 445-452, 2014
BPN that used in this paper
The BPN includes two phases. The first one is
called the training process that can update the
weight values and threshold values for each neuron
by giving the training patterns obtained from
experiments. The second one is called the recalling
trained weight values
and threshold values from the training process and
PROCEDURE OF EXPERIMENT
There are many factors for machining a
specific material in milling process with end
which one can suggest. Anyway, reviewing
shows that four machining factors
have significant effect on output parameters of
In order to study effects of input
parameters on milling process perfectly, each of
rate, radial and axial depths of cut
were changed in three levels in full factorial
=81 experiments have been
have been executed in this
design levels of the experiment
Design levels of Experiment
Level 3
160
0.06
1.5
4
For executing experiments we have used
milling machine
with the controller FANUC-OM. This
spindle speed 6000
rate 10000 (mm/min).
itwas found that
the TiN coated tools lead to lesser machining forces
(2)
MOHAMMAD KHORAN ET AL.: THE EFFECTS OF MILLING PARAMETERS ON SURFACE ROUGHNESS OF
due to lower friction coefficient of this coatin
so the selected tool wasflathead two-lip
with TiN coated carbide insert with diameter 16
mm which, in order to be sureof correctness of
results,after every three machining passes were
replaced. It should be noticed that because of high
quality of used inserts, during removal of chips,
they were not struck by nicking or wearing.
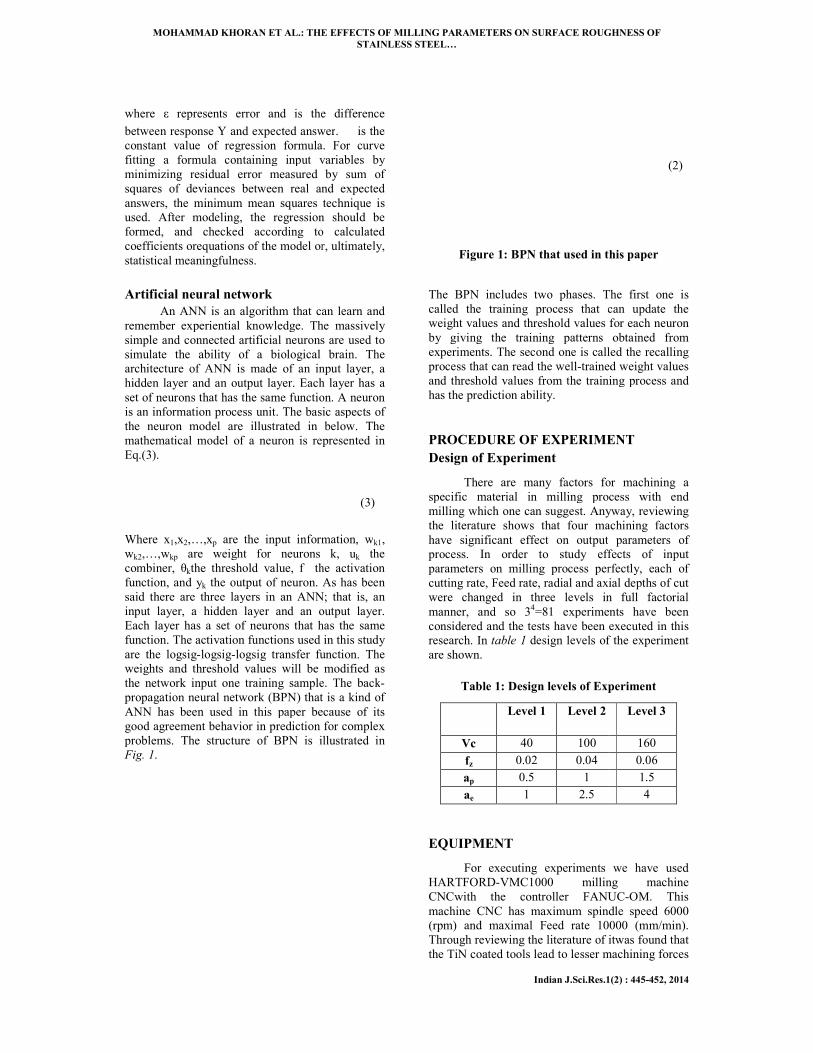
Measuring the roughness was performed by
roughness tester Mahr model Pocket Surf PSI.
Roughness testing of each test was implemented
three times and their average was considered as
roughness measure used in regression.
Figure 2:Mahr Roughness tester
Materials
Experimental tests were performed on cubic
blocks with dimensions
of Martensitic stainless steel. Chemical
composition and properties of this steel are shown
in tables 2 and 3, respectively.
Table 2: Chemical composition of stainless steel
X22 CrMoV 12 1
V Mo Cr C
0.25 0.8 11 0.18 Min
0.35 1.2 12.5 0.24 Max
Table 3: Properties of stainless steel X22 CrMoV
12 1
Haedness Tensile
Stress
[MPa]
Yield
Stress
[MPa]
302 HB 800-1050 600-700
RESULTS AND DISCUSSION
The effects of cutting parameters
response variable were discovered.
designed experiments, surface roughness
measured and its mean value was used
regression model.In order to develop second order
MOHAMMAD KHORAN ET AL.: THE EFFECTS OF MILLING PARAMETERS ON SURFACE ROUGHNESS OF
STAINLESS STEEL…
Indian J.Sci.Res.1(2) : 445
e to lower friction coefficient of this coating, and
lip end milling
with TiN coated carbide insert with diameter 16
correctness of
results,after every three machining passes were
It should be noticed that because of high
removal of chips,
they were not struck by nicking or wearing.
Measuring the roughness was performed by
roughness tester Mahr model Pocket Surf PSI.
Roughness testing of each test was implemented
three times and their average was considered as
Mahr Roughness tester
Experimental tests were performed on cubic
mm, made
of Martensitic stainless steel. Chemical
composition and properties of this steel are shown
Table 2: Chemical composition of stainless steel
Ni V
0.3 0.25
0.8 0.35
Table 3: Properties of stainless steel X22 CrMoV
Density
(kg/dm3)
7.7
of cutting parameters on the
response variable were discovered. From 81
designed experiments, surface roughness was
as used to obtain
In order to develop second order
model between input and output parameters, the
software Minitab was applied.71 tests were selected
randomly for developing model and remaining 10
tests were used to examine efficiency of prepared
model. This second order model is as following:
Ra = 0.07974 - (0.0002186 Vc) + (1.29 fz)
+ (0.0569 ap) + (0.00560 ae) – (0.00280
Vc×fz) - (0.000162 Vc×ap) - (0.000055
Vc×ap) + (4.54 Vc2) + (4.54 fz
2)
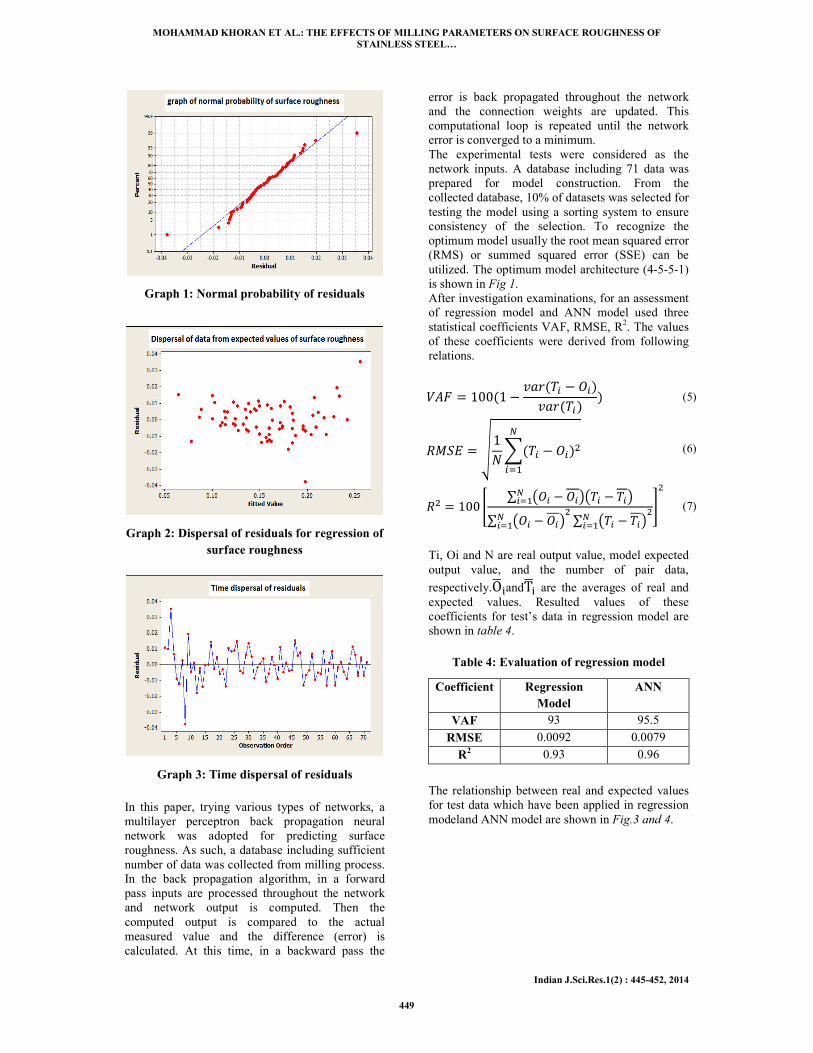
Generally all results of regression analysis
authentic if the premises of regression, i.e. the
condition that variance of residu
independent and constant, be true.
common method for examining this premises, is to
probe different kinds of graphs of residu
examining normality of distribution of residu
one can the normal probability graphs. If
distribution is normal, values of residu
straight line direction; else, some regular deviances
would be observed. In specifying straightness of
pattern of points around a straight line, the
emphasis is on the central values of the graph and
the modest deviances are not commonly significant.
The graph of residuals’ dispersal from expected
values or from input variables was used for
scrutinizing the condition ofunchan
variance of residuals. If these graphs have a
specific pattern or structure too, the condition of
unchangeability of variance of residu
disproved. Also, the graph of residu
according to time periods in which they have
collected is used to investigate the independence of
residuals. Existence of a specific pattern and
structure in this graph means the refusal of
independence condition. Before offering the results
of analysis, in order to be sure of
premises of regression, three introduced graphs
would be overviewed. As one can see in normal
probability graph there is no significant deviance
and also the graph of dispersal of residu
in time intervals in which they are collected lacks a
given pattern or structure. Consequently the
normality and independence conditions of residuals
are authentic. Dispersal of residuals versus
expected values does not have a specific structure
and so we can declare that the condition that the
variance of residuals is a constant value is correct
too.
MOHAMMAD KHORAN ET AL.: THE EFFECTS OF MILLING PARAMETERS ON SURFACE ROUGHNESS OF
Indian J.Sci.Res.1(2) : 445-452, 2014
model between input and output parameters, the
71 tests were selected
randomly for developing model and remaining 10
tests were used to examine efficiency of prepared
This second order model is as following:
(0.0002186 Vc) + (1.29 fz)
(0.00280
(0.000055
(4)
all results of regression analysis are
s of regression, i.e. the
condition that variance of residuals is normal,
independent and constant, be true. The most
common method for examining this premises, is to
probe different kinds of graphs of residuals. For
normality of distribution of residuals
one can the normal probability graphs. If
distribution is normal, values of residuals lie in a
direction; else, some regular deviances
In specifying straightness of
round a straight line, the
alues of the graph and
the modest deviances are not commonly significant.
s’ dispersal from expected
or from input variables was used for
utinizing the condition ofunchangeability of
If these graphs have a
specific pattern or structure too, the condition of
unchangeability of variance of residuals will be
he graph of residuals’ dispersal
in which they have been
ed to investigate the independence of
s. Existence of a specific pattern and
structure in this graph means the refusal of
independence condition. Before offering the results
of analysis, in order to be sure of credibility of
mises of regression, three introduced graphs
would be overviewed. As one can see in normal
probability graph there is no significant deviance
the graph of dispersal of residuals’ values
time intervals in which they are collected lacks a
attern or structure. Consequently the
normality and independence conditions of residuals
Dispersal of residuals versus
expected values does not have a specific structure
and so we can declare that the condition that the
is a constant value is correct
MOHAMMAD KHORAN ET AL.: THE EFFECTS OF MILLING PARAMETERS ON SURFACE ROUGHNESS OF
STAINLESS STEEL…
Indian J.Sci.Res.1(2) : 445-452, 2014
449
Graph 1: Normal probability of residuals
Graph 2: Dispersal of residuals for regression of
surface roughness
Graph 3: Time dispersal of residuals
In this paper, trying various types of networks, a
multilayer perceptron back propagation neural
network was adopted for predicting surface
roughness. As such, a database including sufficient
number of data was collected from milling process.
In the back propagation algorithm, in a forward
pass inputs are processed throughout the network
and network output is computed. Then the
computed output is compared to the actual
measured value and the difference (error) is
calculated. At this time, in a backward pass the
error is back propagated throughout the network
and the connection weights are updated. This
computational loop is repeated until the network
error is converged to a minimum.
The experimental tests were considered as the
network inputs. A database including 71 data was
prepared for model construction. From the
collected database, 10% of datasets was selected for
testing the model using a sorting system to ensure
consistency of the selection. To recognize the
optimum model usually the root mean squared error
(RMS) or summed squared error (SSE) can be
utilized. The optimum model architecture (4-5-5-1)
is shown in Fig 1.
After investigation examinations, for an assessment
of regression model and ANN model used three
statistical coefficients VAF, RMSE, R2. The values
of these coefficients were derived from following
relations.
�� ����� � ������ � ���������� � (5)
��� ������� � ������ � (6)
� ��� ! " #�� � ��$#�� � ��$�� �" #�� � ��$�" #�� � ��$��� ��� � %� (7)
Ti, Oi and N are real output value, model expected
output value, and the number of pair data,
respectively.&'(and)'( are the averages of real and expected values. Resulted values of these
coefficients for test’s data in regression model are
shown in table 4.
Table 4: Evaluation of regression model
ANN Regression
Model
Coefficient
95.5 93 VAF
0.0079 0.0092 RMSE
0.96 0.93 R2
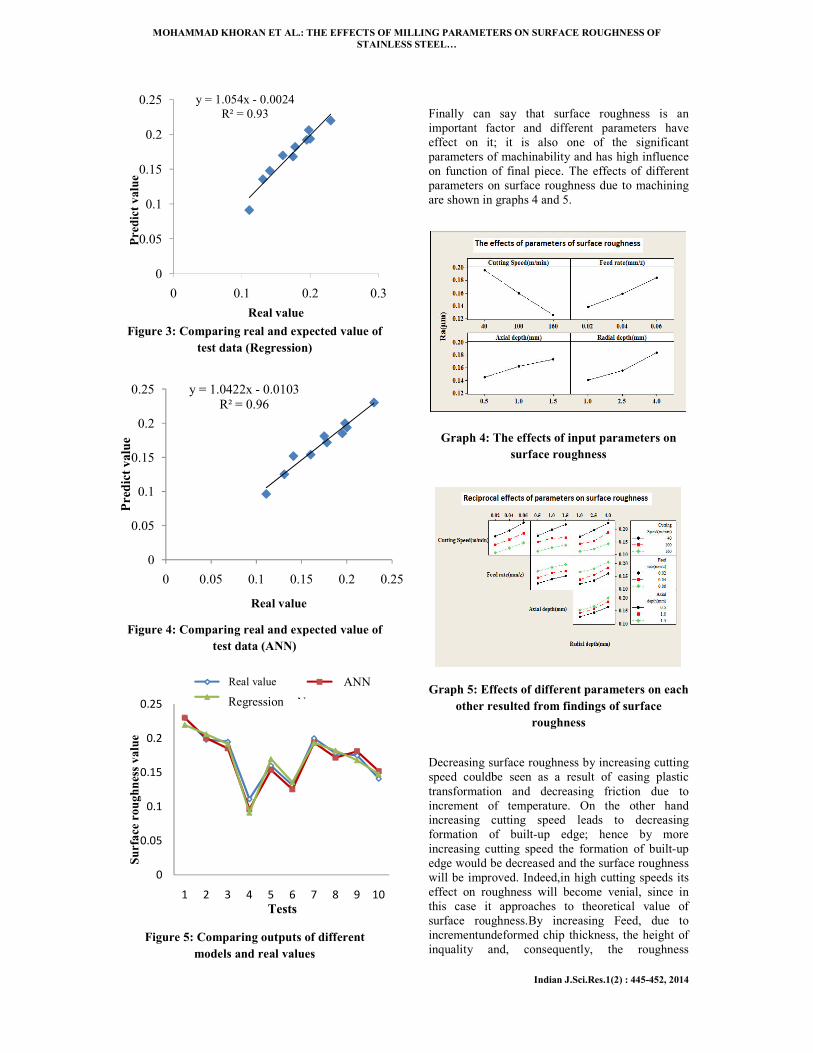
The relationship between real and expected values
for test data which have been applied in regression
modeland ANN model are shown in Fig.3 and 4.
MOHAMMAD KHORAN ET AL.: THE EFFECTS OF MILLING PARAMETERS ON SURFACE ROUGHNESS OF
STAINLESS STEEL…
Indian J.Sci.Res.1(2) : 445-452, 2014
Figure 3: Comparing real and expected value of
test data (Regression)
Figure 4: Comparing real and expected value of
test data (ANN)
Figure 5: Comparing outputs of different
models and real values
Finally can say that surface roughness is an
important factor and different parameters have
effect on it; it is also one of the significant
parameters of machinability and has high influence
on function of final piece. The effects of different
parameters on surface roughness due to machining
are shown in graphs 4 and 5.
Graph 4: The effects of input parameters on
surface roughness
Graph 5: Effects of different parameters on each
other resulted from findings of surface
roughness
Decreasing surface roughness by increasing cutting
speed couldbe seen as a result of easing plastic
transformation and decreasing friction due to
increment of temperature. On the other hand
increasing cutting speed leads to decreasing
formation of built-up edge; hence by more
increasing cutting speed the formation of built-up
edge would be decreased and the surface roughness
will be improved. Indeed,in high cutting speeds its
effect on roughness will become venial, since in
this case it approaches to theoretical value of
surface roughness.By increasing Feed, due to
incrementundeformed chip thickness, the height of
inquality and, consequently, the roughness
y = 1.054x - 0.0024
R² = 0.93
0
0.05
0.1
0.15
0.2
0.25
0 0.1 0.2 0.3
Predict value
Real value
y = 1.0422x - 0.0103
R² = 0.96
0
0.05
0.1
0.15
0.2
0.25
0 0.05 0.1 0.15 0.2 0.25
Predict value
Real value
0
0.05
0.1
0.15
0.2
0.25
1 2 3 4 5 6 7 8 9 10
Surface roughness value
Tests
AN
Real value
Regression
ANN
MOHAMMAD KHORAN ET AL.: THE EFFECTS OF MILLING PARAMETERS ON SURFACE ROUGHNESS OF
STAINLESS STEEL…
Indian J.Sci.Res.1(2) : 445-452, 2014
451
increase. The values of axial depth of cut have no
significant effect on surface quality and increasing
radial depth of cut results in increment of
roughness of machining surface and so its effect is
more considerable than that of axial depth of cut.
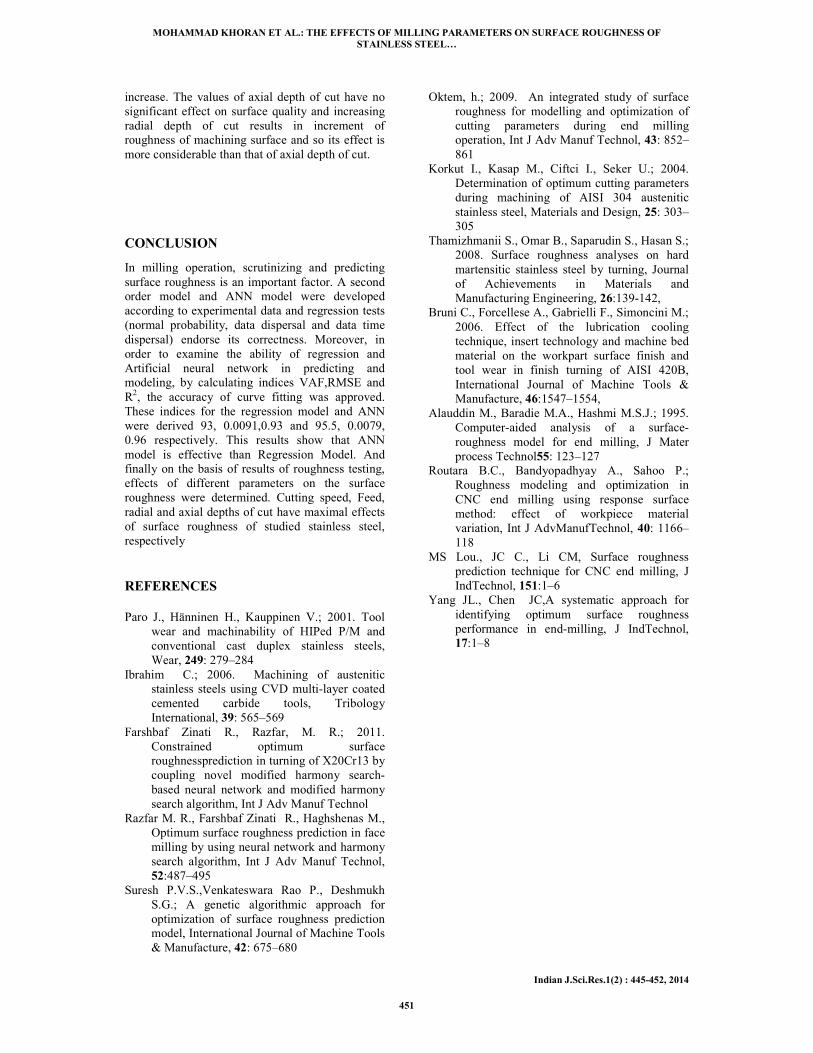
CONCLUSION
In milling operation, scrutinizing and predicting
surface roughness is an important factor. A second
order model and ANN model were developed
according to experimental data and regression tests
(normal probability, data dispersal and data time
dispersal) endorse its correctness. Moreover, in
order to examine the ability of regression and
Artificial neural network in predicting and
modeling, by calculating indices VAF,RMSE and
R2, the accuracy of curve fitting was approved.
These indices for the regression model and ANN
were derived 93, 0.0091,0.93 and 95.5, 0.0079,
0.96 respectively. This results show that ANN
model is effective than Regression Model. And
finally on the basis of results of roughness testing,
effects of different parameters on the surface
roughness were determined. Cutting speed, Feed,
radial and axial depths of cut have maximal effects
of surface roughness of studied stainless steel,
respectively
REFERENCES
Paro J., Hänninen H., Kauppinen V.; 2001. Tool
wear and machinability of HIPed P/M and
conventional cast duplex stainless steels,
Wear, 249: 279–284
Ibrahim C.; 2006. Machining of austenitic
stainless steels using CVD multi-layer coated
cemented carbide tools, Tribology
International, 39: 565–569
Farshbaf Zinati R., Razfar, M. R.; 2011.
Constrained optimum surface
roughnessprediction in turning of X20Cr13 by
coupling novel modified harmony search-
based neural network and modified harmony
search algorithm, Int J Adv Manuf Technol
Razfar M. R., Farshbaf Zinati R., Haghshenas M.,
Optimum surface roughness prediction in face
milling by using neural network and harmony
search algorithm, Int J Adv Manuf Technol,
52:487–495
Suresh P.V.S.,Venkateswara Rao P., Deshmukh
S.G.; A genetic algorithmic approach for
optimization of surface roughness prediction
model, International Journal of Machine Tools
& Manufacture, 42: 675–680
Oktem, h.; 2009. An integrated study of surface
roughness for modelling and optimization of
cutting parameters during end milling
operation, Int J Adv Manuf Technol, 43: 852–
861
Korkut I., Kasap M., Ciftci I., Seker U.; 2004.
Determination of optimum cutting parameters
during machining of AISI 304 austenitic
stainless steel, Materials and Design, 25: 303–
305
Thamizhmanii S., Omar B., Saparudin S., Hasan S.;
2008. Surface roughness analyses on hard
martensitic stainless steel by turning, Journal
of Achievements in Materials and
Manufacturing Engineering, 26:139-142,
Bruni C., Forcellese A., Gabrielli F., Simoncini M.;
2006. Effect of the lubrication cooling
technique, insert technology and machine bed
material on the workpart surface finish and
tool wear in finish turning of AISI 420B,
International Journal of Machine Tools &
Manufacture, 46:1547–1554,
Alauddin M., Baradie M.A., Hashmi M.S.J.; 1995.
Computer-aided analysis of a surface-
roughness model for end milling, J Mater
process Technol55: 123–127
Routara B.C., Bandyopadhyay A., Sahoo P.;
Roughness modeling and optimization in
CNC end milling using response surface
method: effect of workpiece material
variation, Int J AdvManufTechnol, 40: 1166–
118
MS Lou., JC C., Li CM, Surface roughness
prediction technique for CNC end milling, J
IndTechnol, 151:1–6
Yang JL., Chen JC,A systematic approach for
identifying optimum surface roughness
performance in end-milling, J IndTechnol,
17:1–8

Indian J.Sci.Res.1(2) : 445-452, 2014 ISSN : 0976-2876 (Print)
ISSN:2250-0138(Online)
__________________________________ 1Corresponding author


![Optimization of Milling Process Parameters using Taguchi ...[1] Optimization of gadget parameters of CNC Milling device for moderate metal using Taguchi layout and Single to Noise](https://img.pdfslide.net/doc/110x75/5ebc5074cce4ae63170ccc7a/optimization-of-milling-process-parameters-using-taguchi-1-optimization-of.jpg)