Embed Size (px)
Citation preview
Tehnički vjesnik 26, 5(2019), 1297-1304 1297
ISSN 1330-3651 (Print), ISSN 1848-6339 (Online) https://doi.org/10.17559/TV-20180715085107 Original scientific paper
Optimization Parameters of Milling Process of Mould Material for Decreasing Machining Power and Surface Roughness Criteria
Trung-Thanh NGUYEN, Quoc-Hoang PHAM, Xuan-Phuong DANG, Tat-Khoa DOAN, Xuan-Hung LE
Abstract: Improving milling performances is an effective solution to decrease the costs required. This paper addressed a multi-response optimization to simultaneously decrease the machining power consumed Pm, arithmetical roughness Ra, and ten-spot roughness Rz. The Grey-Response Surface Method-Multi Island Genetic Algorithm (GRMA) consisting of grey relational analysis (GRA), response surface method (RSM), and multi-island genetic algorithm (MA) was proposed to predict the optimal parameters and yield optimum milling performances. The experimental trials were conducted with the support of a CNC milling center. The influences of spindle speed (S), depth of cut (ap), feed rate (fz), and tip radius (r) were explored using GRA. The nonlinear relationship between machining parameters and grey grade (GG) model was developed using RSM. Finally, two optimization techniques, including desirability approach (DA) and MA were performed to observe the optimal values. The results indicated that the machining power was greatly affected by processing factors and the radius has a significant impact on the roughness criteria. The measured reductions using optimal parameters of Pm, Ra, and Rz are approximately 77.05%, 50.00%, and 58.02%, respectively, as compared to initial settings. The GRMA can be considered as an effective approach to generate reliable values of processing conditions and technological performances in the milling process.
Keywords: cutting parameters; Grey Relational Analysis (GRA); milling; Multi-Island Genetic Algorithm (MA); optimization; Response Surface Method (RSM)
1 INTRODUCTION
The important task of the machining process is to save energy consumed and improve quality products. The first solution primarily focuses on improved hardware [1] and advanced technologies [2]. The second method is to optimize processing conditions to ensure technical aims. Apparently, parameter-based optimization is inexpensive and has better sustainable development, as compared to hardware upgrades. Improving the technical responses should be performed firstly in existing machines; hence, the second solution is an intelligent choice. Consequently, the selection of optimal factors has a significant role to meet the technical requirements (i.e. acceptable energy consumption and quality).
Enhancing technical outputs of the milling processes using optimal parameters has been widely analyzed in works published. Former researchers have attempted to minimize the surface roughness for the machining process of stainless 316 [3], AISI 1019 [4], and EN 353 material [5]. Similarly, cutting parameters were optimized in an effort to decrease the roughness value in the milling processes of Al alloy [6-8], SKD61 [9], and AISI H13 [10]. Recently, investigators solved the trade-off among multi-responses regarding surface quality, energy consumed, and processing efficiency. The technological responses included are cutting energy [11], tool wear [12], cutting force [13-16], residual stress [17], material removal rate [18], and machining time [19]. Additionally, the surface geometry [20], chip formation [21, 22], micro-hardness, and microstructure [23] were considered as important technical outputs. Furthermore, production costs could be decreased by carefully selecting process parameters [24]. The factors optimized are processing parameters (depth of cut, speed, feed rate, and width of cut), tool geometry (tip radius, rake angle, and relief angle), and workpiece properties. It can be stated that the multi-objective optimization of milling processes is more practical, as compared to the mono-objective approach. Unfortunately, the deficiencies of the works published with respect to milling process optimization can be listed as bellow:
Most of the former investigators have attempted to decrease the average surface roughness (Ra). The selection of optimal factors for simultaneously minimizing surface properties, such as Ra and ten-spot average roughness Rz has still been rarely considered.
Parameter-based optimization for decreasing the machining power and surface properties has not been performed in the aforementioned works, resulting in an unrealistic optimization of the milling process.
The optimum setting of machining factors may have inefficient results due to strong conflicts among the objective considered.
To fulfill the mentioned research gaps, a milling parameter-based optimization has been considered in this paper for decreasing the power consumption and surface criteria. The material, namely SKD61 steel, is chosen as the analyzed workpiece due to wide applications in molding, automotive, aerospace, and marine industry. The GRMA integrating grey relational analysis (GRA) [25], response surface method (RSM) [26], and multi-island genetic algorithm (MA) [27, 28, and 29] are adopted to explore the impacts of machining conditions on the milling performances, generate the grey grade model, and identify the globally optimal solution.
2 MATERIALS AND METHODS
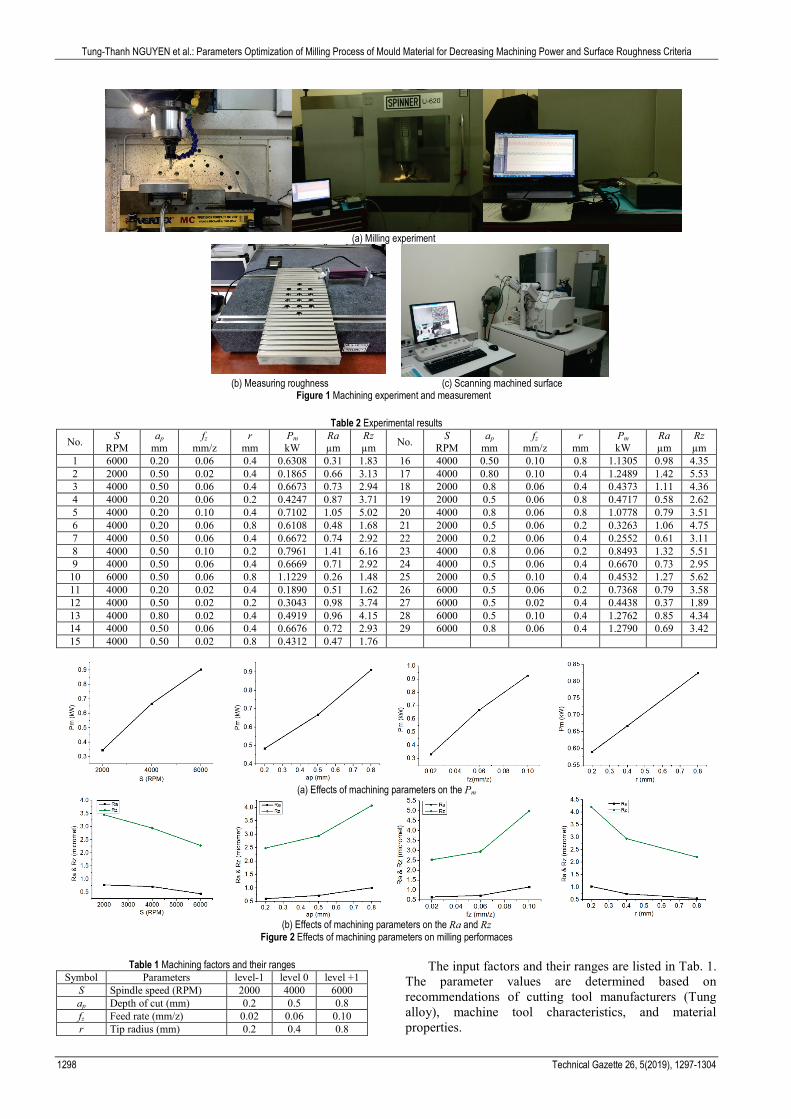
A milling machine, namely spinner U-620 is used to perform the milling runs. The cutting tool has a diameter of 12 mm. Two inserts are mounted on the tool holder, as shown in Fig. 1a. The workpiece is attached to the dynamometer with the aid of 14 bolts. The precision vise is used to clamp the dynamometer system. The size of the workpiece is 350×150×25 mm. The dynamometer used to measure the cutting forces is a Kistler 9257B. A roughness tester Mitutoyo SJ-301 is adopted to measure the values of the surface properties in the feed direction (Fig. 1b). A scanning electron microscope, entitled Nano Nova 450 is employed to explore the surface morphology, as shown in Fig. 1c.
Tung-Thanh NGUYEN et al.: Parameters Optimization of Milling Process of Mould Material for Decreasing Machining Power and Surface Roughness Criteria
1298 Technical Gazette 26, 5(2019), 1297-1304
(a) Milling experiment
(b) Measuring roughness (c) Scanning machined surface
Figure 1 Machining experiment and measurement
Table 2 Experimental results
No. S RPM
ap mm
fz mm/z
r mm
Pm kW
Ra µm
Rz µm No. S
RPM ap
mm fz
mm/z r
mm Pm kW
Ra µm
Rz µm
1 6000 0.20 0.06 0.4 0.6308 0.31 1.83 16 4000 0.50 0.10 0.8 1.1305 0.98 4.35 2 2000 0.50 0.02 0.4 0.1865 0.66 3.13 17 4000 0.80 0.10 0.4 1.2489 1.42 5.53 3 4000 0.50 0.06 0.4 0.6673 0.73 2.94 18 2000 0.8 0.06 0.4 0.4373 1.11 4.36 4 4000 0.20 0.06 0.2 0.4247 0.87 3.71 19 2000 0.5 0.06 0.8 0.4717 0.58 2.62 5 4000 0.20 0.10 0.4 0.7102 1.05 5.02 20 4000 0.8 0.06 0.8 1.0778 0.79 3.51 6 4000 0.20 0.06 0.8 0.6108 0.48 1.68 21 2000 0.5 0.06 0.2 0.3263 1.06 4.75 7 4000 0.50 0.06 0.4 0.6672 0.74 2.92 22 2000 0.2 0.06 0.4 0.2552 0.61 3.11 8 4000 0.50 0.10 0.2 0.7961 1.41 6.16 23 4000 0.8 0.06 0.2 0.8493 1.32 5.51 9 4000 0.50 0.06 0.4 0.6669 0.71 2.92 24 4000 0.5 0.06 0.4 0.6670 0.73 2.95
10 6000 0.50 0.06 0.8 1.1229 0.26 1.48 25 2000 0.5 0.10 0.4 0.4532 1.27 5.62 11 4000 0.20 0.02 0.4 0.1890 0.51 1.62 26 6000 0.5 0.06 0.2 0.7368 0.79 3.58 12 4000 0.50 0.02 0.2 0.3043 0.98 3.74 27 6000 0.5 0.02 0.4 0.4438 0.37 1.89 13 4000 0.80 0.02 0.4 0.4919 0.96 4.15 28 6000 0.5 0.10 0.4 1.2762 0.85 4.34 14 4000 0.50 0.06 0.4 0.6676 0.72 2.93 29 6000 0.8 0.06 0.4 1.2790 0.69 3.42 15 4000 0.50 0.02 0.8 0.4312 0.47 1.76
(a) Effects of machining parameters on the Pm
(b) Effects of machining parameters on the Ra and Rz
Figure 2 Effects of machining parameters on milling performaces
Table 1 Machining factors and their ranges Symbol Parameters level-1 level 0 level +1
S Spindle speed (RPM) 2000 4000 6000 ap Depth of cut (mm) 0.2 0.5 0.8 fz Feed rate (mm/z) 0.02 0.06 0.10 r Tip radius (mm) 0.2 0.4 0.8
The input factors and their ranges are listed in Tab. 1. The parameter values are determined based on recommendations of cutting tool manufacturers (Tung alloy), machine tool characteristics, and material properties.
Tung-Thanh NGUYEN et al.: Parameters Optimization of Milling Process of Mould Material for Decreasing Machining Power and Surface Roughness Criteria
Tehnički vjesnik 26, 5(2019), 1297-1304 1299
The power consumption Pm (kW) is calculated using the following equation:
( )2 2 2
60000 60000x y z cc c
m
F F F VF VP+ + ⋅⋅
= = (1)
where Fx, Fy, and Fz (N) are considered as the milling forces in x, y, and z directions, respectively. Vc (m/min) denotes the cutting speed.
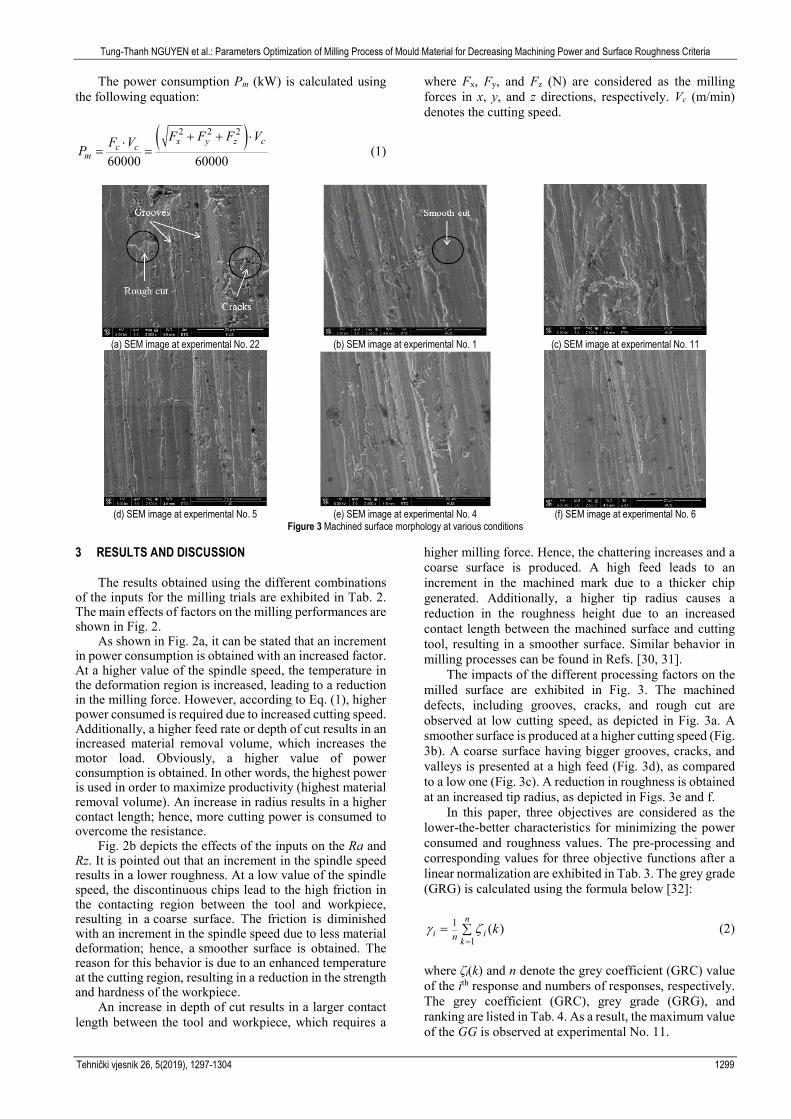
(a) SEM image at experimental No. 22 (b) SEM image at experimental No. 1 (c) SEM image at experimental No. 11
(d) SEM image at experimental No. 5 (e) SEM image at experimental No. 4 (f) SEM image at experimental No. 6
Figure 3 Machined surface morphology at various conditions
3 RESULTS AND DISCUSSION The results obtained using the different combinations
of the inputs for the milling trials are exhibited in Tab. 2. The main effects of factors on the milling performances are shown in Fig. 2.
As shown in Fig. 2a, it can be stated that an increment in power consumption is obtained with an increased factor. At a higher value of the spindle speed, the temperature in the deformation region is increased, leading to a reduction in the milling force. However, according to Eq. (1), higher power consumed is required due to increased cutting speed. Additionally, a higher feed rate or depth of cut results in an increased material removal volume, which increases the motor load. Obviously, a higher value of power consumption is obtained. In other words, the highest power is used in order to maximize productivity (highest material removal volume). An increase in radius results in a higher contact length; hence, more cutting power is consumed to overcome the resistance.
Fig. 2b depicts the effects of the inputs on the Ra and Rz. It is pointed out that an increment in the spindle speed results in a lower roughness. At a low value of the spindle speed, the discontinuous chips lead to the high friction in the contacting region between the tool and workpiece, resulting in a coarse surface. The friction is diminished with an increment in the spindle speed due to less material deformation; hence, a smoother surface is obtained. The reason for this behavior is due to an enhanced temperature at the cutting region, resulting in a reduction in the strength and hardness of the workpiece.
An increase in depth of cut results in a larger contact length between the tool and workpiece, which requires a
higher milling force. Hence, the chattering increases and a coarse surface is produced. A high feed leads to an increment in the machined mark due to a thicker chip generated. Additionally, a higher tip radius causes a reduction in the roughness height due to an increased contact length between the machined surface and cutting tool, resulting in a smoother surface. Similar behavior in milling processes can be found in Refs. [30, 31].
The impacts of the different processing factors on the milled surface are exhibited in Fig. 3. The machined defects, including grooves, cracks, and rough cut are observed at low cutting speed, as depicted in Fig. 3a. A smoother surface is produced at a higher cutting speed (Fig. 3b). A coarse surface having bigger grooves, cracks, and valleys is presented at a high feed (Fig. 3d), as compared to a low one (Fig. 3c). A reduction in roughness is obtained at an increased tip radius, as depicted in Figs. 3e and f.
In this paper, three objectives are considered as the lower-the-better characteristics for minimizing the power consumed and roughness values. The pre-processing and corresponding values for three objective functions after a linear normalization are exhibited in Tab. 3. The grey grade (GRG) is calculated using the formula below [32]:
1
1 ( )n
i ikn
kγ ζ=
= ∑ (2)
where ζi(k) and n denote the grey coefficient (GRC) value of the ith response and numbers of responses, respectively. The grey coefficient (GRC), grey grade (GRG), and ranking are listed in Tab. 4. As a result, the maximum value of the GG is observed at experimental No. 11.
Tung-Thanh NGUYEN et al.: Parameters Optimization of Milling Process of Mould Material for Decreasing Machining Power and Surface Roughness Criteria
1300 Technical Gazette 26, 5(2019), 1297-1304
Table 3 Pre-processed and deviation results
No. Pre-processed data xi(k) Deviation sequences Δ0i(k) Pm (kW) Ra (µm) Rz (µm) Pm (kW) Ra (µm) Rz (µm)
1 0.593318078 0.956896552 0.925213675 0.406681922 0.043103448 0.074786325 2 1.000000000 0.655172414 0.647435897 0.000000000 0.344827586 0.352564103 3 0.559908467 0.594827586 0.688034188 0.440091533 0.405172414 0.311965812 4 0.781967963 0.474137931 0.523504274 0.218032037 0.525862069 0.476495726 5 0.520640732 0.318965517 0.243589744 0.479359268 0.681034483 0.756410256 6 0.611624714 0.810344828 0.957264957 0.388375286 0.189655172 0.042735043 7 0.560000000 0.586206897 0.692307692 0.440000000 0.413793103 0.307692308 8 0.442013730 0.00862069 0.000000000 0.557986270 0.99137931 1.000000000 9 0.560274600 0.612068966 0.692307692 0.439725400 0.387931034 0.307692308
10 0.142883295 1.000000000 1.000000000 0.857116705 0.000000000 0.000000000 11 0.997711670 0.784482759 0.970085470 0.002288330 0.215517241 0.029914530 12 0.892173913 0.379310345 0.517094017 0.107826087 0.620689655 0.482905983 13 0.720457666 0.396551724 0.429487179 0.279542334 0.603448276 0.570512821 14 0.559633867 0.603448276 0.690170940 0.440366133 0.396551724 0.30982906 15 0.776018307 0.818965517 0.940170940 0.223981693 0.181034483 0.05982906 16 0.135926773 0.379310345 0.386752137 0.864073227 0.620689655 0.613247863 17 0.027551487 0.000000000 0.134615385 0.972448513 1.000000000 0.865384615 18 0.770434783 0.267241379 0.384615385 0.229565217 0.732758621 0.615384615 19 0.738947368 0.724137931 0.756410256 0.261052632 0.275862069 0.243589744 20 0.184164760 0.543103448 0.566239316 0.815835240 0.456896552 0.433760684 21 0.872036613 0.310344828 0.301282051 0.127963387 0.689655172 0.698717949 22 0.937116705 0.698275862 0.651709402 0.062883295 0.301724138 0.348290598 23 0.393318078 0.086206897 0.138888889 0.606681922 0.913793103 0.861111111 24 0.560183066 0.594827586 0.685897436 0.439816934 0.405172414 0.314102564 25 0.755881007 0.129310345 0.115384615 0.244118993 0.870689655 0.884615385 26 0.496292906 0.543103448 0.551282051 0.503707094 0.456896552 0.448717949 27 0.764485126 0.905172414 0.912393162 0.235514874 0.094827586 0.087606838 28 0.002562929 0.49137931 0.388888889 0.997437071 0.50862069 0.611111111 29 0.000000000 0.629310345 0.585470085 1.000000000 0.370689655 0.414529915
Table 4 GRC and GRG results
No. GRC GRG Rank No. GRC GRG Rank Pm (kW) Ra (µm) Rz (µm) Pm (kW) Ra (µm) Rz (µm) 1 0.551461 0.920635 0.869888 0.780662 4 16 0.366549 0.446154 0.449136 0.420613 26 2 1.000000 0.591837 0.586466 0.726101 7 17 0.339570 0.333333 0.366197 0.346367 29 3 0.531863 0.552381 0.615789 0.566678 13 18 0.685340 0.405594 0.448276 0.51307 19 4 0.696348 0.487395 0.512035 0.565259 23 19 0.656985 0.644444 0.672414 0.657948 9 5 0.510538 0.423358 0.397959 0.443952 24 20 0.379987 0.522523 0.535469 0.479326 21 6 0.562825 0.725000 0.921260 0.736362 5 21 0.796225 0.420290 0.417112 0.544542 16 7 0.531915 0.547170 0.619048 0.566044 15 22 0.888284 0.623656 0.589421 0.700453 8 8 0.472596 0.335260 0.333333 0.380396 28 23 0.451801 0.353659 0.367347 0.390935 27 9 0.532070 0.563107 0.619048 0.571408 11 24 0.532019 0.552381 0.614173 0.566191 14
10 0.368428 1.000000 1.000000 0.789476 3 25 0.671936 0.364780 0.361111 0.465942 22 11 0.995444 0.698795 0.943548 0.879263 1 26 0.498153 0.522523 0.527027 0.515901 18 12 0.822604 0.446154 0.508696 0.592484 10 27 0.679796 0.840580 0.850909 0.790428 2 13 0.641402 0.453125 0.467066 0.520531 12 28 0.333904 0.495726 0.450000 0.426543 25 14 0.531708 0.557692 0.617414 0.568938 17 29 0.333333 0.574257 0.546729 0.484773 20 15 0.690625 0.734177 0.89313 0.772644 5
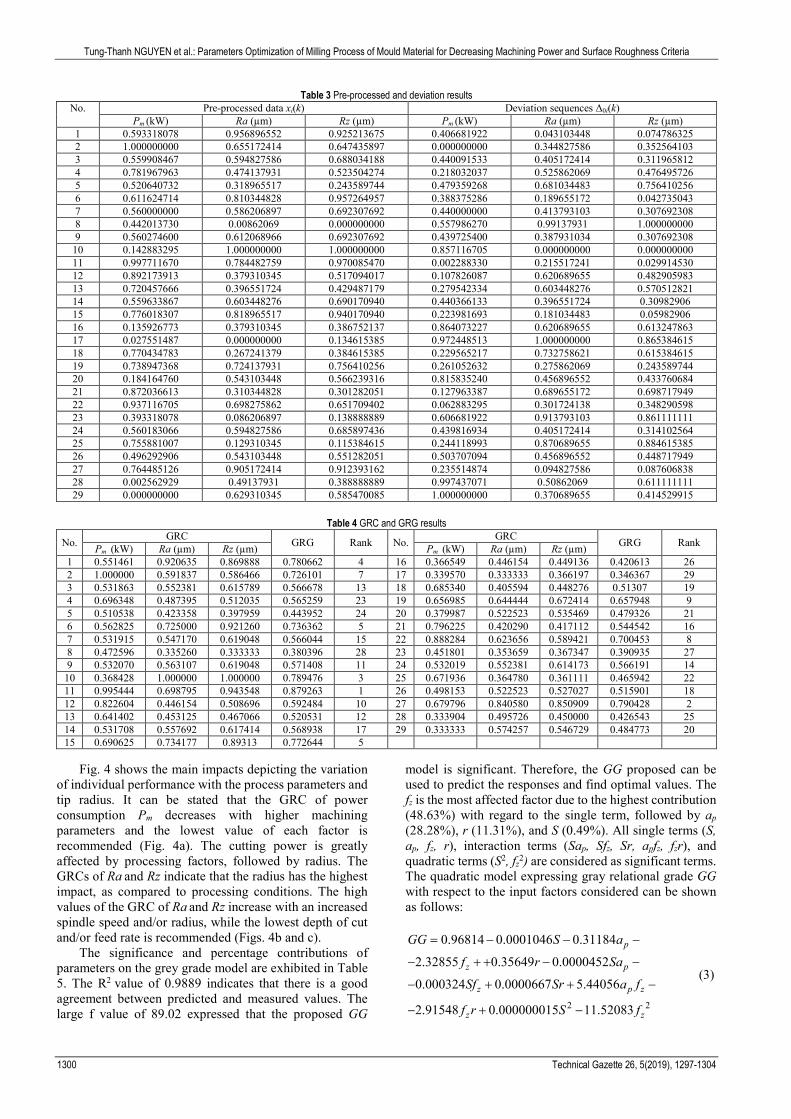
Fig. 4 shows the main impacts depicting the variation of individual performance with the process parameters and tip radius. It can be stated that the GRC of power consumption Pm decreases with higher machining parameters and the lowest value of each factor is recommended (Fig. 4a). The cutting power is greatly affected by processing factors, followed by radius. The GRCs of Ra and Rz indicate that the radius has the highest impact, as compared to processing conditions. The high values of the GRC of Ra and Rz increase with an increased spindle speed and/or radius, while the lowest depth of cut and/or feed rate is recommended (Figs. 4b and c).
The significance and percentage contributions of parameters on the grey grade model are exhibited in Table 5. The R2 value of 0.9889 indicates that there is a good agreement between predicted and measured values. The large f value of 89.02 expressed that the proposed GG
model is significant. Therefore, the GG proposed can be used to predict the responses and find optimal values. The fz is the most affected factor due to the highest contribution (48.63%) with regard to the single term, followed by ap (28.28%), r (11.31%), and S (0.49%). All single terms (S, ap, fz, r), interaction terms (Sap, Sfz, Sr, apfz, fzr), and quadratic terms (S2, fz
2) are considered as significant terms. The quadratic model expressing gray relational grade GG with respect to the input factors considered can be shown as follows:
2 2
0.96814 0.0001046 0.31184
2.32855 0.35649 0.0000452
0.000324 0.0000667 5.44056
2.91548 0.000000015 11.52083
p
z p
z p z
z z
GG S a
f r Sa
Sf Sr a f
f r S f
= − − −
− + + − −
− + + −
− + −
(3)
Tung-Thanh NGUYEN et al.: Parameters Optimization of Milling Process of Mould Material for Decreasing Machining Power and Surface Roughness Criteria
Tehnički vjesnik 26, 5(2019), 1297-1304 1301
(a) GRC for Pm
(b) GRC for Ra
(c) GRC for Rz
Figure 4 GRC for milling responses
Table 5 ANOVA results for the grey grade modelSource Sum of Squares Mean Square F-Value p-value Remark Contri. Model 0.55944 0.03996 89.015530 < 0.0001 Significant
S 0.00269 0.00269 5.996340 0.0281 Significant 0.49 ap 0.15662 0.15662 348.90015 < 0.0001 Significant 28.28 fz 0.26929 0.26929 599.87931 < 0.0001 Significant 48.63 r 0.06262 0.06262 139.49141 < 0.0001 Significant 11.31
Sap 0.00294 0.00294 6.556620 0.0226 Significant 0.53 Sfz 0.00269 0.00269 5.991780 0.0282 Significant 0.49 Sr 0.00641 0.00641 14.28703 0.0020 Significant 1.16 apfz 0.01705 0.01705 37.97967 < 0.0001 Significant 3.08 apr 0.00171 0.00171 3.809920 0.0712 Insignificant 0.31 fzr 0.00490 0.00490 10.90645 0.0052 Significant 0.88 S2 0.02365 0.02365 52.69381 < 0.0001 Significant 4.27 ap
2 0.00052 0.00052 1.163220 0.2990 Insignificant 0.09 fz
2 0.00220 0.00220 4.909730 0.0438 Significant 0.40 r2 0.00045 0.00045 1.008780 0.3322 Insignificant 0.08
R-Squared: 0.9889
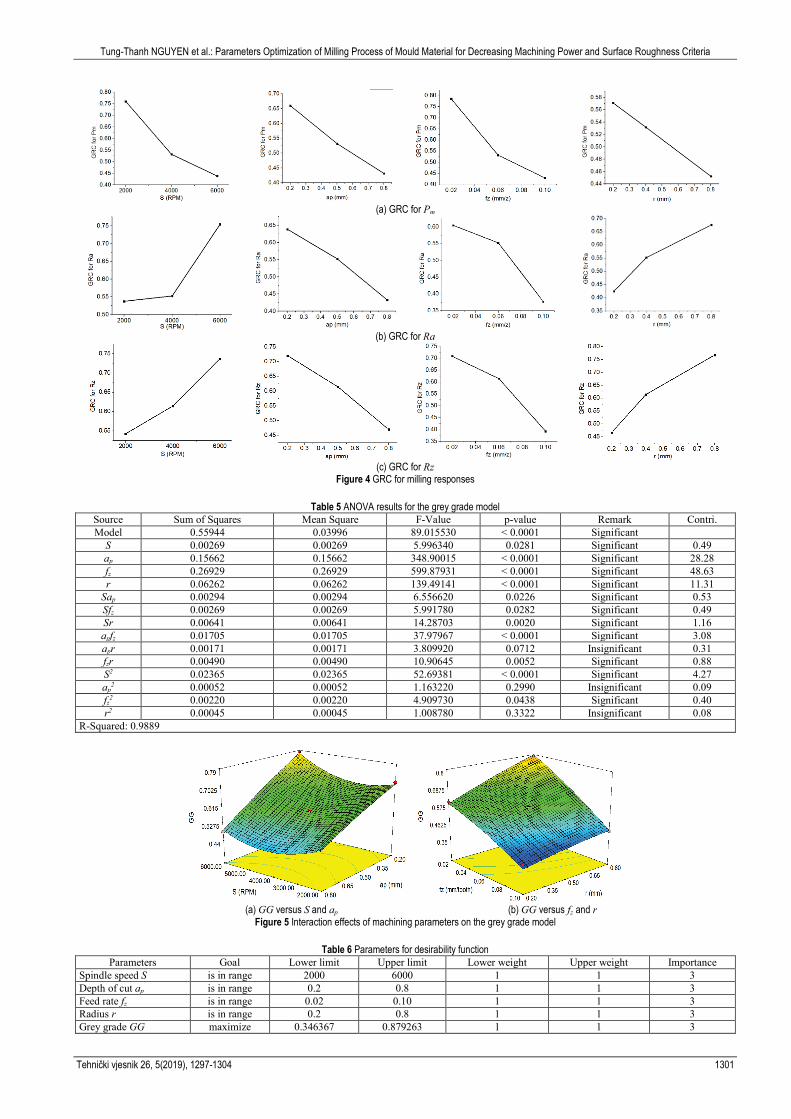
(a) GG versus S and ap (b) GG versus fz and r
Figure 5 Interaction effects of machining parameters on the grey grade model
Table 6 Parameters for desirability function Parameters Goal Lower limit Upper limit Lower weight Upper weight Importance
Spindle speed S is in range 2000 6000 1 1 3 Depth of cut ap is in range 0.2 0.8 1 1 3 Feed rate fz is in range 0.02 0.10 1 1 3 Radius r is in range 0.2 0.8 1 1 3 Grey grade GG maximize 0.346367 0.879263 1 1 3
Tung-Thanh NGUYEN et al.: Parameters Optimization of Milling Process of Mould Material for Decreasing Machining Power and Surface Roughness Criteria
1302 Technical Gazette 26, 5(2019), 1297-1304
Table 7 Optimization results Optimization parameters Responses
Method S (RPM) a (mm) f (mm/z) r (mm) GG Pm (kW) Ra (µm) Rz (µm) DA 5226 0.20 0.02 0.4 0.88053 0.1809 0.48 1.53 MA 5991 0.20 0.02 0.4 0.93647 0.1531 0.36 1.23
Initial values 4000 0.50 0.06 0.4 0.56604 0.6672 0.72 2.93 Improvement (%) 39.56 77.05 50.00 58.02
Table 8 Comparison results
Optimization parameters Responses Method S (RPM) a (mm) f (mm/z) r (mm) Pm (kW) Ra (µm) Rz (µm)
Prediction 5991 0.20 0.02 0.4 0.1531 0.36 1.23 Experiment 5991 0.20 0.02 0.4 0.1568 0.35 1.21 Error (%) -2.36 2.86 1.65
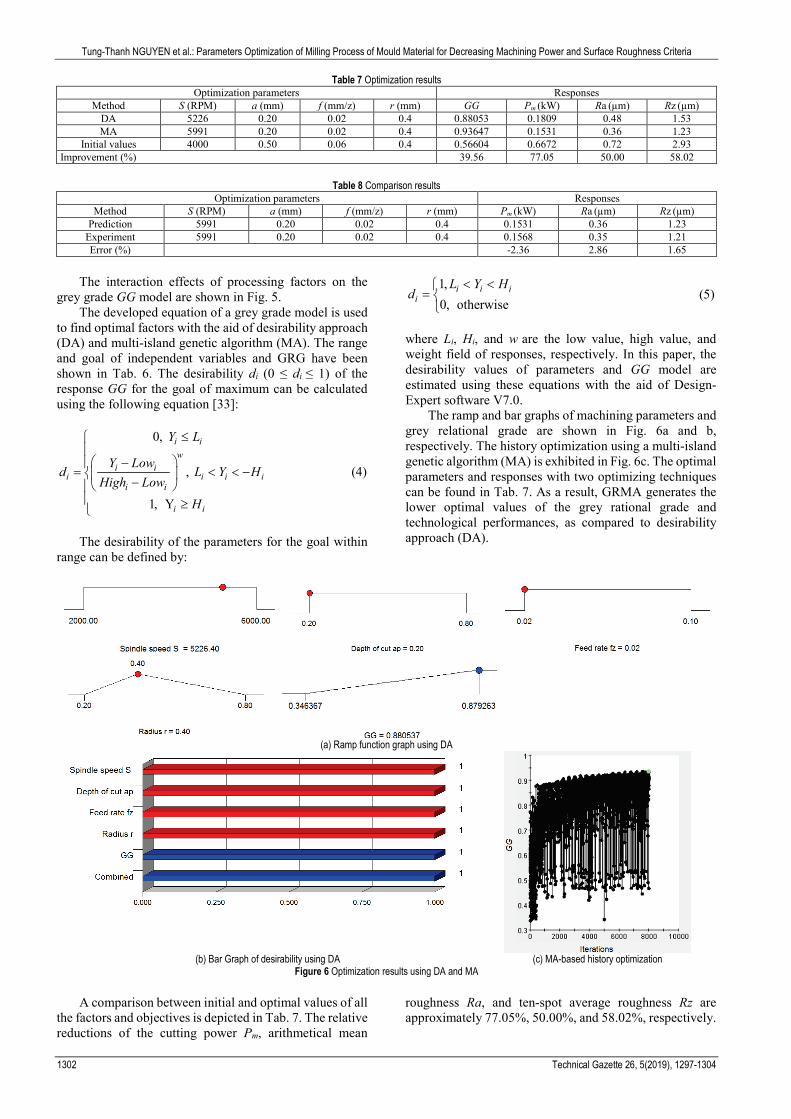
The interaction effects of processing factors on the
grey grade GG model are shown in Fig. 5. The developed equation of a grey grade model is used
to find optimal factors with the aid of desirability approach (DA) and multi-island genetic algorithm (MA). The range and goal of independent variables and GRG have been shown in Tab. 6. The desirability di (0 ≤ di ≤ 1) of the response GG for the goal of maximum can be calculated using the following equation [33]:
0,
,
1, Y
i iw
i ii i i i
i i
i i
Y L
Y Lowd L Y H
High LowH
≤ −
= < < − −
≥
(4)
The desirability of the parameters for the goal within
range can be defined by:
1,0, otherwise
i i ii
L Y Hd
< <=
(5)
where Li, Hi, and w are the low value, high value, and weight field of responses, respectively. In this paper, the desirability values of parameters and GG model are estimated using these equations with the aid of Design-Expert software V7.0.
The ramp and bar graphs of machining parameters and grey relational grade are shown in Fig. 6a and b, respectively. The history optimization using a multi-island genetic algorithm (MA) is exhibited in Fig. 6c. The optimal parameters and responses with two optimizing techniques can be found in Tab. 7. As a result, GRMA generates the lower optimal values of the grey rational grade and technological performances, as compared to desirability approach (DA).
(a) Ramp function graph using DA
(b) Bar Graph of desirability using DA (c) MA-based history optimization
Figure 6 Optimization results using DA and MA
A comparison between initial and optimal values of all the factors and objectives is depicted in Tab. 7. The relative reductions of the cutting power Pm, arithmetical mean
roughness Ra, and ten-spot average roughness Rz are approximately 77.05%, 50.00%, and 58.02%, respectively.
Tung-Thanh NGUYEN et al.: Parameters Optimization of Milling Process of Mould Material for Decreasing Machining Power and Surface Roughness Criteria
Tehnički vjesnik 26, 5(2019), 1297-1304 1303
The experiment is conducted at the optimal operating conditions to confirm the validation of these parameters. The relative errors between the prediction and the experiment of Pm, Ra, and Rz are -2.36%, 2.86%, and 1.65%, respectively, as shown in Tab. 8. The results indicate that the GRMA method using grey relation analysis, response surface method, and multi-island genetic algorithm is reliable and significant.
As a result, the GRC values could effectively support the milling operators and engineers to visualize the influences as well as contributions of the processing factors on the performances measured. The optimum inputs as well as output values are precisely predicted using the GG model proposed. Therefore, the proposed approach could be effectively used in the milling operations, avoiding expensive trials and huge costs required. Furthermore, the GRMA technique used is able to restrict the natural confliction among the objectives and the deficiencies of GRA and RSM. 4 CONCLUSIONS
This paper considered a machining parameters-based optimization in the milling process to decrease the machining power consumed and the roughness criteria. A hybrid optimizing method using grey relational analysis, response surface method, desirability approach, and the multi-island genetic algorithm was adopted to express the correlations between machining parameters and grey relational grade model as well as predict the optimal values. The resulting conclusions of this work can be listed as follows:
1. The GRMA approach was effectively applied to decrease numbers of machining experiments and predict the optimal processing conditions. Based on the proposed method, the optimal processing conditions for minimizing three responses, including Pm, Ra, and Rz were listed as follows: S = 5991 RPM, ap = 0.20 mm, fz = 0.02 mm/z, and r = 0.4 mm.
2. The results of the experimental test proved that the technological responses were significantly improved using optimal conditions observed from GRMA optimization method. The cutting power Pm, arithmetical mean roughness Ra, and ten-spot average roughness Rz were saved approximately 77.05 %, 50.00%, and 58.02%, respectively.
3. The machining power is mainly influenced by processing variables, including feed rate, depth of cut, and spindle speed, followed by tool radius. The radius significantly influences the surface roughness criteria.
4. The grey relational grade GG model was adequate and effectively exhibited the nonlinear mathematical modeling in terms of processing parameters. The predictive model developed could be used to forecast the optimal parameters with sufficient accuracy.
5. Solving the machining optimization issue using MA ensured the globally optimal results and better optimizing values, as compared to DA. The proposed approach GRMA combining GRA, RSM, and MA could be used to solve the natural conflicts among milling performances and observe the reliable parameter setting.
Acknowledgment
This research is funded by Vietnam National Foundation for Science and Technology Development (NAFOSTED) under grant number 107.04-2017.06. REFERENCES [1] Diaz, N., Choi, S., Helu, M., Chen, Y. Y., Jayanathan, S.,
Yasui, Y., Kong, D., Pavanaskar, S., & Dornfeld, D. (2010). Machine Tool Design and Operation Strategies for Green Manufacturing. Proceedings of 4th CIRP International Conference on High Performance Cutting, 271-276
[2] Zhongde, S., Shaoyan, Q., Qian, L., & Feng, L. (2012). Key manufacturing technology & equipment for energy saving and emissions reduction in mechanical equipment industry. International Journal of Precision Engineering and Manufacturing, 13(7), 1095-1100. https://doi.org/10.1007/s12541-012-0143-y
[3] Kouravand, S. & Imani B. M. (2014). Developing A Surface Roughness Model for End-Milling of Micro-Channel. Machining Science and Technology, 18(2), 299-321. https://doi.org/10.1080/10910344.2014.897846
[4] Bhardwaj, B., Kumar, R., & Singh, P. K. (2014). Effect of machining parameters on surface roughness in end milling of AISI 1019 steel. Proceedings of the Institution of Mechanical Engineers, Part B - Journal of Engineering Manufacture, 228(5), 704-714. https://doi.org/10.1177/0954405413506417
[5] Bhardwaj, B., Kumar, R., & Singh, P. K. (2014). An improved surface roughness prediction model using Box-Cox transformation with RSM in end milling of EN 353. Journal of Mechanical Science and Technology, 28(12): 5149-5157. https://doi.org/10.1007/s12206-014-0837-4
[6] Fuh, K. H. & Wu, C. F. (1995). A proposed statistical model for surface quality prediction in end-milling of Al alloy. International Journal of Machine Tools and Manufacture, 35(8), 1187-1200. https://doi.org/10.1016/0890-6955(95)90408-E
[7] Borojevic, S., Lukic, D., Milosevic, M., Vukman, J., & Kramar, D. (2018). Optimization of process parameters for machining of Al 7075 thin-walled structures. Advances in Production Engineering & Management, 13(2), 125-135. https://doi.org/10.14743/apem2018.2.278
[8] Simunovic, G., Svalina, I., Simunovic, K., Saric, T., Havrlisan, S., & Vukelic, D. (2016). Surface roughness assessing based on digital image features. Advances in Production Engineering & Management, 11(2), 93-104. https://doi.org/10.14743/apem2016.2.212
[9] Nguyen, H. T. & Hsu, Q. C. (2016). Surface Roughness Analysis in the Hard Milling of JIS SKD61 Alloy Steel. Applied sciences, 6(6), 172. https://doi.org/10.3390/app6060172
[10] Zhang, J. Z., Chen, J. C., & DanielKirby, E. (2007). Surface roughness optimization in an end-milling operation using the Taguchi design method. Journal of Materials Processing Technology, 184(1-3), 233-239. https://doi.org/10.1016/j.jmatprotec.2006.11.029
[11] Edem, I. F. & Balogun, V. A. (2018). Sustainability analyses of cutting edge radius on specific cutting energy and surface finish in side milling processes. The International Journal of Advanced Manufacturing Technology, 95(9-12), 3381-3391. https://doi.org/10.1007/s00170-017-1452-1
[12] Huang, S., Tao, L., Wang, M., & Xu, X. (2018). Enhanced machining performance and lubrication mechanism of electrostatic minimum quantity lubrication-EMQL milling process. The International Journal of Advanced Manufacturing Technology, 94(1-4), 655-666.
Tung-Thanh NGUYEN et al.: Parameters Optimization of Milling Process of Mould Material for Decreasing Machining Power and Surface Roughness Criteria
1304 Technical Gazette 26, 5(2019), 1297-1304
https://doi.org/10.1007/s00170-017-0935-4. [13] Savićević, S., Vukćević, M., Klimenko, S. A., & Tanović, L.
(2017). Impact of cutting elements on forces and roughness of surface during turning hard steel X160 CrMo V12 with CBN tool. Tehnički vjesnik, 24(4), 1001-1006, https://doi.org/10.17559/TV-20161013100743
[14] Masmiati, N., Sarhan, A. A. D., & Hassan, M. A. N. (2016). Optimization of cutting conditions for minimum residual stress, cutting force and surface roughness in end milling of S50C medium carbon steel. Measurement, 86, 253-265. https://doi.org/10.1016/j.measurement.2016.02.049.
[15] Yang, L. & Zheng, M. L. (2017). Simulation and Analysis of Ball-End Milling of Panel Moulds Based on Deform 3D. International Journal of Simulation Modelling, 16(2), 343-356. http://dx.doi.org/10.2507/IJSIMM16(2)CO9
[16] Bagci, E. & Yuncuoglu, E. U. (2017). The Effects of Milling Strategies on Forces, Material Removal Rate, Tool Deflection, and Surface Errors for the Rough Machining of Complex Surfaces. Strojniski vestnik-Journal of Mechanical Engineering, 63(11), 643-656. https://doi.org/10.5545/sv-jme.2017.4450
[17] Krajewska-Śpiewak, J., Gawlik, J., Piekoszewski, W., & Stachura, K. (2018). Identification of Residual Stresses in a Surface Layer of Ti6AL4V and Inconel 718 after Process of Peripheral Milling. Tehnički vjesnik, 25(1), 88-91. https://doi.org/10.17559/TV-20160531085315
[18] Yan, J. & Li, L. (2013). Multi-objective optimization of milling parameters-the trade-offs between energy, production rate and cutting quality. Journal of Cleaner Production, 52(1), 462-471. https://doi.org/10.1016/j.jclepro.2013.02.030
[19] Corso, L. L., Zeilmann, R. P., Nicola, G. L., Missell, F. P., & Gomes, H. M. (2013). Using optimization procedures to minimize machining time while maintaining surface quality. The International Journal of Advanced Manufacturing Technology, 65(9-12), 1659-1667. https://doi.org/10.1007/s00170-012-4288-8
[20] Zhang L., Zheng G., Shi Y., & Yang R., (2017). Improved tooth trajectory model for prediction of milled surface geometry. Machining Science and Technology, 21(2), 175-201. https://doi.org/10.1080/10910344.2017.1283959
[21] García-Barbosa J. A., Arroyo-Osorio J. M., & Córdoba-Nieto, E. (2017). Influence of tool inclination on chip formation process and roughness response in ball-end milling of freeform surfaces on Ti-6Al-4V alloy. Machining Science and Technology, 21(1), 121-135. https://doi.org/10.1080/10910344.2016.1260434
[22] Kuram, E. (2017). Nose radius and cutting speed effects during milling of AISI 304 material. Materials and Manufacturing Processes, 32(2), 185-192. https://doi.org/10.1080/10426914.2016.1198019
[23] Wang, F., Zhao, J., Li, A., & Zhang, H. (2014). Effects of cutting conditions on micro-hardness and microstructure in high-speed milling of H13 tool steel. The International Journal of Advanced Manufacturing Technology, 73(1-4), 137-146. https://doi.org/10.1007/s00170-014-5812-9
[24] Wang, Y. C., Kim, D. W., Katayama, H., & Hsueh, W. C. (2017). Optimization of machining economics and energy consumption in face milling operations. The International Journal of Advanced Manufacturing Technology, 1-8. https://doi.org/10.1007/s00170-018-1848-6
[25] Angappan, A., Thangiah, S., & Subbarayan, S., (2017). Taguchi-based grey relational analysis for modeling and optimizing machining parameters through dry turning of Incoloy 800H. Journal of Mechanical Science and Technology, 31(9), 4159-4165. https://doi.org/10.1007/s12206-017-0812-y
[26] Nguyen, T. T. & Le, X. B. (2018). Optimization of interior roller burnishing process for improving surface quality. Materials and Manufacturing Processes, 33(11).
https://doi.org/10.1080/10426914.2018.1453159 [27] Janes, G., Perinic, M., & Jurkovic, Z. (2017). An efficient
genetic algorithm for job shop scheduling problems. Tehnički vjesnik, 24(4) 1243-1247. https://doi.org/10.17559/TV-20150527133957
[28] Chaudhry, I. A. & Usman, M. (2017). Integrated process planning and scheduling using genetic algorithms. Tehnički vjesnik, 24(5), 1401-1409. https://doi.org/10.17559/TV-20151121212910
[29] Park, H. S & Nguyen, T. T (2017). Development of a new staking process for an automotive part. International Journal of Advanced Manufacturing Technology, 89(1-4), 1053-1068. https://doi.org/10.1007/s00170-016-9132-0
[30] Pathak, B. N., Sahoo, K. L., & Mishra, M. (2013). Effect of machining parameters on cutting forces and surface roughness in Al-(1–2) Fe-1V-1Si alloys. Materials and Manufacturing Processes, 28(4), 463-469. https://doi.org/10.1080/10426914.2013.763952
[31] Khani, S., Farahnakian, M., & Razfar, M. R. (2015). Experimental study on hybrid cryogenic and plasma-enhanced turning of 17-4PH stainless steel. Materials and Manufacturing Processes, 30(7), 868-874. https://doi.org/10.1080/10426914.2014.984200
[32] Singh, P. N., Raghukandan, K., & Pai, B. C. (2004). Optimization by grey relational analysis of EDM parameters on machining Al−10%SiCP composites. Journal of Materials Processing Technology, 155-156, 1658-1661. https://doi.org/10.1016/j.jmatprotec.2004.04.322
[33] Rajakumar, S. & Balasubramanian, V. (2016). Diffusion bonding of titanium and AA 7075 aluminum alloy dissimilar joints-process modeling and optimization using desirability approach. The International Journal of Advanced Manufacturing Technology, 86(1-4), 1095-1112. https://doi.org/10.1007/s00170-015-8223-7
Contact information: Trung-Thanh NGUYEN, PhD (Corresponding author) (1) Institute of Research and Development, Duy Tan University, 03 Quang Trung, Da Nang 550000, Viet Nam E-mail: [email protected] (2) Faculty of Mechanical Engineering, Le Quy Don Technical University, Hanoi 100000, Viet Nam E-mail: [email protected] Quoc-Hoang PHAM, Assoc. Prof., PhD Advanced Technology Center, Le Quy Don Technical University, Hanoi 100000, Viet Nam E-mail: [email protected] Xuan-Phuong DANG, Assoc. Prof., PhD Faculty of Mechanical Engineering, Nha Trang University, Nguyen Đinh Chieu, Nha Trang 57000, Viet Nam E-mail: [email protected] Tat-Khoa DOAN, PhD
Faculty of Mechanical Engineering, Le Quy Don Technical University, Hanoi 100000, Viet Nam E-mail: [email protected] Xuan-Hung LE, M.S. Faculty of Mechanical Engineering, Le Quy Don Technical University, Hanoi 100000, Viet Nam E-mail: [email protected]


![Comparative analysis of wobble milling, helical milling and … · 2020. 2. 6. · mould vacuum bagging [4, 5]. Nevertheless, after the curing processes, there are still many micro-](https://img.pdfslide.net/doc/110x75/5fcd21b0521c62418653e053/comparative-analysis-of-wobble-milling-helical-milling-and-2020-2-6-mould.jpg)

![Optimization of Milling Process Parameters using Taguchi ...[1] Optimization of gadget parameters of CNC Milling device for moderate metal using Taguchi layout and Single to Noise](https://img.pdfslide.net/doc/110x75/5ebc5074cce4ae63170ccc7a/optimization-of-milling-process-parameters-using-taguchi-1-optimization-of.jpg)