Embed Size (px)
Citation preview
The effects of wildfire on benthic macroinvertebrates in southern California streams
Andrew C. Rehn, Peter R. Ode and James M. Harrington
California Dept. of Fish & Game Aquatic Bioassessment Laboratory
2005 Nimbus Road Rancho Cordova, CA
Prepared for the San Diego Regional Water Quality Control Board
under agreement # 05-310-190-0
December 2011
Executive Summary Severe wildfires burned large portions of San Diego and southwestern San
Bernardino counties in October 2003 and 2007. Many of these fires burned watersheds where various state and federal agencies had previously established stream sampling locations to collect bioassessment data as part of ambient monitoring programs. After the 2003 fires, the San Diego Regional Water Quality Control Board (RWQCB) was interested in evaluating potential post-fire effects on benthic macroinvertebrates (BMIs) because these organisms are widely used in southern California as indicators of biological condition in streams. Two different indices are available for interpreting regional BMI data: the Southern California Index of Biotic Integrity (“SoCal IBI”, Ode et al. 2005) and an unpublished Observed-to-Expected (“O/E”) index developed by Dr. Chuck Hawkins at Utah State University. Both indices score biological condition at sampling sites with respect to conditions at reference sites. Reference sites are those where human disturbance in the watershed is absent or minimal and thereby set benchmarks for biological expectations. “Test” sites have some degree of human influence in the watershed that exceeds reference thresholds, but they are not always biologically degraded.
The San Diego RWQCB was interested in knowing: 1) to what extent do wildfires influence (i.e., reduce) IBI and O/E scores at sampling sites; 2) how long does it take IBI and O/E scores to recover at potentially affected sites; 3) does recovery time differ between reference and test sites; and 4) what are the primary mechanisms through which wildfires affect IBI and O/E? To address the Board’s questions, forty-nine sites where pre-fire data had been collected in 2000-2002 were resampled annually after the wildfires from spring of 2004-2009, except that no sampling occurred in 2006. One new burned site that lacked pre-fire data was added on the Sweetwater River in San Diego Co. Sites were selected to represent 4 different condition classes: burned reference, non-burned reference, burned test and non-burned test.
Report Highlights:
Post-fire IBI and O/E scores at burned reference sites were significantly lower than pre-fire reference site scores, but only for the first two years following the 2003 fires and only for one year following the 2007 fires.
Post-fire IBI scores at burned test sites were never significantly lower than pre-
fire test site scores. By contrast, after the 2003 fires, O/E scores at burned test sites were significantly lower in 2005 than pre-fire scores (but not in 2004!) and had recovered by spring 2007. After the 2007 fires, O/E scores were significantly lower in 2008 and 2009 than pre-fire scores, but recovery could not be assessed since 2009 was the last year of the study.
Indicator species analysis of raw taxonomic data showed that burned reference
and test sites had greatly reduced taxonomic diversity and were characterized by generalist, tolerant taxa such as black flies and minnow mayflies in post-fire years when IBI and O/E were significantly lower than pre-fire scores.
IBI and O/E were weakly correlated with physical habitat variables across burned reference and test sites over time. At reference sites, both indices were more strongly correlated with mean mid-channel canopy density and mean riparian canopy cover than any other physical habitat variable. At test sites, O/E was most strongly correlated with mean riparian canopy cover, but IBI was most strongly correlated with percent fast-water (e.g., riffle) habitat.
Four of the 15 burned reference sites experienced dramatic post-fire sediment
pulses after the first rains following the 2003 fires. The stream channels at these sites were completely inundated by sand, or even by cobble and large boulders in some cases. However, even in these extreme cases, IBI and O/E scores had recovered (i.e., were not significantly lower than pre-fire scores) by spring 2007. In one case (Roblar Canyon), meter-deep sand that choked the stream channel in spring 2004 was observed to have been completely washed out of the channel by spring 2007.
The rapid post-fire recovery of BMI assemblages observed in this study (within 3
years) is congruent with BMI responses to wildfire reported in other recent studies and reviews.
Recommendations:
Statistical approaches for comparing pre- and post- fire data were fairly limited in this study given data gaps from inconsistent sampling of sites over time. Future studies should strive for consistent data collection from all sites over a consistent post-fire time frame.
Existing or candidate reference sites that have recently burned should be given 3
years to recover from post-fire effects before being used to monitor BMIs for trends in reference condition over time or to set BMI-based expectations for biological condition in indicator development.
Pre- and post-fire anthropogenic disturbances in riparian corridors should be
restricted or avoided because stream recovery is especially sensitive to, and dependent on, the extent to which riparian processes remain intact. This management guideline extends to road construction and even fire fighting activities, such as extensive thinning and fire break construction outside of residential areas.
Evaluating the response of BMIs to post-fire contaminant flux across burned and
unburned sampling sites would provide additional insight into the mechanisms by which wildfires affect stream biota.
Introduction
Wildfire is a prevalent ecological disturbance in chaparral-dominated shrublands of southern California. The region is characterized by a Mediterranean climate with hot, dry summers, and much of the native flora is adapted to high-intensity, stand-replacing fires. However, explosive human population growth over the last few decades has increased ignitions such that fire frequency now exceeds its natural range of variability (Syphard et al. 2008). The effect of increasing wildfire frequency on regional streams is of great interest, especially as aquatic bioassessment has recently become more formalized in regional water resource management (e.g., see Ode et al. 2005). Published studies of the effects of wildfire on stream biota in western United States are not numerous, but most agree that direct effects of fire on benthic macroinvertebrates (BMIs) are minor or indiscernible (Minshall 2003). Instead, indirect effects resulting primarily from severe, sediment- or ash-laden floods that often follow wildfires in burned watersheds have the greatest impacts on BMI assemblages (Rinne 1996; Minshall 2003; Vieira et al. 2004).
Several studies that have evaluated post-fire response of individual BMI metrics and/or taxa have found greatly reduced density and taxonomic richness following the first post-fire floods (Roby and Azuma 1995; Rinne 1996; Vieira et al. 2004). However, these studies also found that density recovers quickly and can even exceed densities at control sites in the first few years after fire as generalist (collector) taxa such as midges (Chironomidae) and blackflies (Simuliidae) come to dominate (Roby and Azuma 1995; Mellon et al. 2008). By contrast, taxonomic richness can take 3-5 years to recover (Roby and Azuma 1995; Vieira et al. 2004), with wide variations continuing for 5-10 years (Minshall 2003). Moreover, streams with intact watersheds recover relatively rapidly, whereas streams in poorly managed watersheds show more protracted recovery (Minshall 2003).
To my knowledge, no studies have evaluated post-fire response of BMIs using either a multimetric or multivariate index of the type frequently used by monitoring programs to interpret complex BMI datasets. Multimetric indices such as the Southern California Index of Biotic Integrity (“SoCal IBI”, Ode et al. 2005) are composed of several independent metrics that represent different aspects of BMI assemblage structure and function. Multivariate indices such as Observed-to-Expected (O/E) taxonomic ratios express as a simple proportion the number of taxa observed in a sample compared to the number of taxa predicted to occur in the sample. Both types of index are integrative tools that reflect the condition of the entire BMI assemblage rather than select taxonomic groups. In addition, IBI and O/E score biological condition at sampling sites (often referred to as “test” sites) with respect to conditions at reference sites. Reference sites are those where human disturbance in the watershed is absent or minimal and thereby set benchmarks for biological expectations. Test sites have some degree of human influence in the watershed that exceeds reference thresholds, but they are not always biologically degraded.
In October 2003 and 2007, wildfires burned large portions of San Diego and southwestern San Bernardino counties in southern California (Figure 1). Several of these fires burned watersheds where various state and federal agencies, including the San Diego Regional Water Quality Control Board (RWQCB), the U.S. EPA and the U.S.
Forest Service, had previously established stream sampling locations to collect bioassessment data as part of ambient monitoring programs. After the 2003 fires, the San Diego RWQCB was interested in evaluating potential post-fire effects on BMI assemblages using the SoCal IBI (Ode et al. 2005) and an unpublished O/E index developed by Dr. Chuck Hawkins at Utah State University. Both indices are widely used by managers to interpret data from regional water quality monitoring and assessment programs. The San Diego RWQCB was interested in knowing: 1) to what extent do wildfires influence (i.e., reduce) IBI and O/E scores at sampling sites; 2) how long does it take IBI and O/E scores to recover at potentially affected sites; 3) does recovery time differ between reference and test sites; and 4) what are the primary mechanisms through which wildfires affect IBI and O/E? This study was undertaken to address those questions.
Methods Sampling sites: Forty-nine sites where pre-fire data had been collected in 2000-20021 were revisited in spring of 2004-2009 (usually in late April; Table 1). One new burned site that lacked pre-fire data was added on the Sweetwater River in San Diego Co. Sites were selected to represent 4 different condition classes: burned reference, non-burned reference, burned test and non-burned test2. No post-fire sites were sampled in 2006, and not every site was sampled every year. For example, several non-burned reference sites were dry in 2004, but were flowing and were sampled in subsequent years. Seven sites in San Diego Co. that did not burn until 2007 were added in spring 2008, whereas 6 sites from San Bernardino Co. that had burned in 2003 and had been sampled 2004-2007 were dropped in 2008. Finally, 3 sites that belonged to non-burned groups after the 2003 fires suffered burn-status changes as a result of the 2007 fires. Benthic macroinvertebrates: BMI collection protocols varied somewhat over the course of the post-fire study. In all years, a 150m sampling reach was established at each site. In 2004-2007, a targeted-riffle sample was collected at each site by sampling 0.09 m2 (1ft2) of substrate with a kick net from each of 8 randomly chosen riffle or fastest-water habitat units (Hawkins et al. 20013). All 8 kick samples were composited into a single sample. In 2008-2009, the U.S. EPA’s reachwide protocol (Peck et al. 2006) was utilized wherein eleven equidistant transects were established at each site and a benthic sample was collected by sampling 0.09 m2 of substrate with a kick net at each transect. Sampling points systematically alternated among 25%, 50% and 75% of stream width, thus reachwide samples often contained at least some riffle components. All 11 kick samples
1 Pre-fire data sources, including evaluation of comparability between different BMI sampling protocols, were documented as part of SoCal IBI development (Ode et al. 2005). 2 Screening criteria used to define least-disturbed regional reference sites for setting biological expectations were defined in Ode et al. (2005). Test sites are those that did not pass reference screening thresholds, but are not necessarily biologically degraded or otherwise severely altered by human disturbance (although most test sites included in this study have high levels of human influence). 3 The Hawkins et al. (2001) targeted-riffle protocol was developed by the National Aquatic Monitoring Center, a joint venture between Utah State University and the U.S. Bureau of Land Management. It was utilized in California by the U.S. Forest Service in 2000-2001 and was one of two BMI sampling protocols employed by the U.S. EPA’s western EMAP pilot in 2000-2003.
were composited into a single sample. The shift to reachwide protocol during the last 2 years of the post-fire study was concurrent with its adoption in California as the standard BMI sampling method for bioassessments and was supported by a methods comparison that demonstrated targeted-riffle and reachwide protocols are closely comparable (Rehn et al. 2007).
In the laboratory, each BMI sample was rinsed carefully in a 0.5-mm mesh sieve before being transferred to a 20 × 25 cm tray subdivided into a grid of 20 squares. Organisms were subsampled from randomly chosen squares until 500 individuals were picked from each sample. Most BMI taxa were identified to genus (Chironomidae were left at family) with standards of taxonomic effort defined by the Southwestern Association of Freshwater Invertebrate Taxonomists (www.swrcb.ca.gov/swamp/docs/safit/ste_list.pdf). Physical habitat (PHAB4): PHAB measurements and variable calculations followed Peck et al. (2006) and Kaufmann et al. (1999), respectively. Wetted width, canopy density and semi-quantitative measures of human influence (e.g., extent of roads, row crops, pipes and inlets, etc., and their proximity to the stream), riparian vegetation structure and in-stream habitat complexity were recorded at each cross-sectional transect. Canopy density was recorded using a spherical densiometer from 4 points in the center of the stream channel (up, down, left, right). Depth was measured at five equidistant points across the wetted channel at each transect. At each transect point, a single pebble also was measured, its size class recorded (see Kaufmann et al. 1999 for size class definitions) and its embeddedness estimated. One additional wetted width and 5 additional cross-sectional pebble measurements were taken midway between transects for a total of 105 pebbles counted per site. Additional PHAB measures included channel slope and bearing and visual estimates of the proportion of different flow habitat types (e.g., riffle, pool, glide, cascade, etc.) that composed the total wetted area between transects. Pebble counts and other PHAB measures were converted to whole-reach averages such as mean particle size, percent cobble, mean canopy density, mean in-stream habitat complexity, etc. Data analysis: SoCal IBI scores were calculated for all BMI samples per Ode et al. (2005) for use in pre-to-post fire comparisons. O/E scores were calculated per C. Hawkins’ unpublished model (see Ode et al. 2008 and Ode et al. 2010 for partial documentation). Possible statistical approaches to comparing pre- and post- fire data were somewhat limited given data gaps from inconsistent sampling of sites over time (see above and Table 1). Nonparametric Mann-Whitney U tests of differences between raw IBI or O/E distributions were conducted, e.g., between the pre-fire reference IBI distribution and the post-fire IBI distribution from burned reference sites in 2004, 2005, 2007, etc. The pre-fire distribution of index scores from all reference sites sampled during the study was used to compare to post-fire reference distributions, even though the post-fire distributions represented just a subset of the total reference pool (because not all reference sites were sampled in every post-fire year). Likewise, the pre-fire distribution of index scores from all test sites sampled during the study was used to compare to post-fire test distributions, even though the post-fire distributions represented just a subset of
4 Although the targeted-riffle BMI protocol was used in 2004-2007, the transect-based PHAB protocol of Peck et al. (2006) was used in all years.
the total test pool (because not all test sites were sampled in every post-fire year). The total pool of pre-fire data from reference and test sites provided a better regional representation of pre-fire conditions than would have been possible using data from only the subset of sites that were sampled in any given post-fire year. No comparisons were made between groups of reference and test sites.
In addition, tests of pre-to-post fire differences in IBI and O/E scores (i.e., pre-fire IBI minus post-fire IBI) between burned vs. non-burned sites were conducted on a year-to-year basis. For example, the pre-to-post fire difference in IBI score (“delta-IBI”) was calculated for burned and non-burned reference sites sampled in 2004. Parametric (two sample t-) and non-parametric (Mann-Whitney U) tests were then used to test for statistical difference in delta-IBI between burned and non-burned reference groups for that year. Tests for statistical difference in delta-IBI or delta-O/E between burned and non-burned reference or test groups for a given year were based on pre- and post-fire data only from the subset of sites that were sampled in that year. Again, no comparisons were made between groups of reference and test sites.
Pearson correlation and least-squares linear regression were used to assess the relationship between IBI and O/E scores and PHAB measurements over time. The strength of these statistical relationships, though not an indication of causality, was used to infer potential mechanisms through which wildfires affect BMI assemblages. For example, if in-stream habitat complexity and IBI scores were concurrently lower at burned sites than at non-burned sites, we might infer that wildfires reduce in-stream habitat complexity in ways that are harmful to BMIs. Indicator species analysis (Dufrêne and Legendre 1997) was used independently of IBI and O/E analyses to contrast individual taxa that were present at pre- and post-fire sites. Unlike IBI and O/E, which are integrative, composite measures of the overall composition of BMI assemblages, indicator species analysis seeks to describe the affinity of individual taxa to environmental groups, such as pre-fire vs. post-fire reference sites. A perfect indicator of a particular environmental group should be faithful to that group (always present), and should also be exclusive to that group, never occurring in other groups. Each taxon’s indicator value for a particular environmental group can be tested for significance by comparing results from real data with results from randomized data.
Pre- vs. post-fire indicator species analyses were conducted separately for reference and test sites using the program PC-ORD (McCune and Mefford 1999). Pre-fire groups comprised samples only from sites that eventually burned and that were sampled for long enough post-fire to allow assessment of recovery (in contrast to IBI and O/E analyses described above where data from all reference and test sites was used to characterize pre-fire conditions). Restricting pre-fire group size insured that any pre- to post-fire differences in indicator species were not due to imbalanced group sizes, as groups with more sites naturally tend to have higher species richness than groups with fewer sites. Post-fire groups comprised samples from years when IBI and O/E were significantly lower than pre-fire scores. “Recovered” groups comprised samples from post-fire years when IBI and O/E were no longer significantly lower than pre-fire scores. Only taxa with indicator values significant at the p < 0.05 level are reported.
Results Reference sites: Post-fire IBI and O/E scores at reference sites that burned in 2003 were significantly lower (p < 0.05) in 2004 and 2005 than pre-fire reference scores, but not in subsequent years (Figs 2b, 3b; Tables 2 & 3). However, post-fire IBI and O/E scores at non-burned reference sites decreased nearly as much as at burned reference sites in 2004 and 2005 (Figure 2a, 3a). This decrease was not significant at the p < 0.05 level in 2004, but was significant in 2005 (Tables 2 & 3). Post-fire IBI and O/E scores at reference sites that burned in 2007 were significantly lower in 2008 than pre-fire reference scores, but not in 2009 (Figure 2b 3b, Tables 2 & 3).
Differences in delta-IBI between burned vs. non-burned reference sites were significant (p < 0.05) in 2005 according to t-test and in 2007 according to Mann-Whitney U test (Table 4). In these cases, delta-IBI (i.e., the pre-to-post fire decrease in IBI score) was greater at burned than at non-burned reference sites. The difference in delta-IBI between burned and non-burned reference sites in 2004 could probably also be interpreted as significant (p = 0.052 for Mann Whitney U; Table 4) given the small sample size (n = 3) of non-burned reference sites that year. Oddly, differences in delta-O/E between burned vs. non-burned reference and test sites were never significant (Table 5).
Analysis of covariance (ANCOVA) was used post-hoc to determine if total annual or mean monthly precipitation for the 12 months prior to sampling in 2004 and 2005 covaried significantly with delta-IBI or delta-O/E. If post-fire sampling in 2004-2005 occurred during drought years, it might explain why IBI at non-burned reference sites decreased nearly as much as at burned reference sites in those 2 years. However, neither total annual nor mean monthly precipitation covaried significantly with delta-IBI or delta-O/E. In fact, the 12 months prior to sampling in 2005 was by far the wettest period during the 6-year study5, thus the cause of decreased IBI at non-burned reference sites in 2004-2005, and decreased O/E in 2005, is unknown. It is possible that indirect effects of ash fallout on water chemistry at non-burned reference sites contributed to decreased IBI (see Stein and Brown 2009), but water chemistry data that would support such an analysis were not collected.
IBI and O/E scores were poorly correlated with PHAB variables across burned reference sites over time (Table 6). When evaluating relationships between index scores and PHAB across sites, statistical significance (p < 0.05) of least-squares regressions was mostly ignored because the fairly large number of data points (n = 73 for all reference sites across all years) resulted in significant relationships that appeared weak or even absent upon visual inspection of scatterplots. IBI and O/E were more strongly correlated with mean mid-channel canopy density and mean riparian canopy cover than any other PHAB variable (Table 6). In addition, canopy measures showed patterns of response at burned reference sites over time that were similar to IBI and O/E recovery patterns
5 Monthy precipitation data from weather stations nearest to sampling sites were taken from the California Climate Data Archive (www.calclim.dri.edu/scaall.html). ANCOVA results are not reported here because none were statistically significant (or even close!).
(Figure 4a)6. Least-squares regressions of IBI on mean riparian canopy cover were highly significant (p < 0.0001), the relationship being particularly “tight” when only pre-fire and first year post-fire samples were plotted (Figure 4b,c). Regressions of O/E on mean riparian canopy cover were nearly identical to IBI thus are not shown. Test sites: IBI scores at burned test sites were not significantly lower (at p < 0.05) than pre-fire test site scores during any year of the post-fire study (Figure 2d, Table 7). Very few pairwise tests for differences in raw IBI distributions between any burned and non-burned test groups were significant, even at p < 0.1; those that were significant lacked relevance (Table 7). Likewise, no significant differences in delta-IBI between burned vs. non-burned test groups were found (Table 4). By contrast, after the 2003 fires, O/E scores at burned test sites were significantly lower in 2005 than pre-fire scores (but not in 2004!) but had recovered by spring 2007 (Figure 3d, Table 8). After the 2007 fires, O/E scores were significantly lower in 2008 and 2009 than pre-fire scores (Figure 3d, Table 8), but recovery could not be assessed since 2009 was the last year of the study. O/E was more strongly correlated with mean riparian canopy cover than any other PHAB variable at burned test sites over time (Table 9). As at reference sites, canopy measures at test sites showed patterns of response over time that were similar to O/E recovery patterns (Figure 5a), but regression of O/E on mean riparian canopy cover was less significant than at reference sites (Figure 5b, c). Indicator species analysis: In post-fire years when IBI and O/E scores were significantly lower than pre-fire scores, burned reference and test groups had far fewer taxa with significant (p < 0.05) indicator values compared to pre-fire conditions (Tables 10 & 11). Post-fire indicator taxa in the first years following fire tended to be generalist colonizers with relatively high tolerance for disturbance (e.g., blackflies and baetid mayflies). In later post-fire years when IBI and O/E had recovered (i.e., were no longer significantly lower than pre-fire scores), indicator taxa lists for reference and test groups also showed recovery, but not to pre-fire conditions. For example, the pre-fire reference group contained 29 significant indicator taxa, but the recovered reference group contained only 20 (12 returns and 8 new, Table 10). Similarly, the pre-fire test group contained 9 significant indicator taxa, but the recovered test group contained only 5 (1 return and 4 new, Table 11). However, recovery of indicator taxa must be interpreted with perspective: most taxa that were indicators of pre-fire reference or test groups but not recovered groups (Tables 10 & 11) were present in at least some recovered group samples, just not at frequencies that made them significant indicators of recovered groups. Likewise, most taxa that were indicators of recovered groups but not pre-fire groups were present in at least some samples from pre-fire groups, just not at frequencies that made them significant indicators of pre-fire groups. Differences in indicator taxa between pre-fire and recovered groups may reflect a shift in frequencies of occurrence associated with a more prolonged and subtle recovery than can be detected with IBI or O/E, but may also be due to natural temporal variation and sampling error.
6 Only mean riparian canopy cover is used to illustrate post-fire response over time and regression with IBI because riparian measures all showed similar patterns and were the most strongly correlated of PHAB variables (Table 6).
Discussion
Wildfires significantly reduced IBI and O/E scores at burned reference sites, but only for 1-3 years post-fire. In addition, burned reference and test sites had greatly reduced taxonomic diversity mostly characterized by generalist colonizers in post-fire years when index scores were significantly lower than pre-fire scores. The taxonomic response and relatively rapid post-fire recovery of index scores observed in this study is congruent with BMI responses to fire reported in other recent studies and reviews (e.g., Roby and Azuma 1995; Rinne 1996; Minshall 2003; Vieira et al. 2004). The lack of statistical difference between pre-and post-fire IBI scores at burned test sites may reflect a diminished capacity for BMI response to fire at sites that are already biologically degraded from urbanization and other human impacts at local and watershed scales. However, the fact that post-fire O/E scores at burned test sites were sometimes significantly lower than pre-fire scores may suggest that multivariate O/E is a more sensitive index for evaluating post-fire effects at test sites than IBI. This latter conclusion is provisional given that significant pre-post fire differences at test sites in this study are based on very small sample sizes. The conclusions of this study were complicated by low O/E and IBI scores at several non-burned reference sites (Figs 2, 3). Upon further examination of these sites, this unexpected result may be the result of a combination of factors including non-perenniality of several sites in 2004, a winter with record rainfall in 2005, and non-representative stream types. Only three flowing reference sites were sampled in 2004. Of those, 2 have had chronically low IBI scores over time: Black Mtn. Creek is non-perennial in many years; French Creek is a nice site with poor habitat; Troy Canyon scores fair to good over time. In 2005, we added four reference sites that were dry the previous year (Devil Canyon, San Mateo Creek, Fry Creek, Arroyo Trabuco). In addition, 2005 sampling followed a wet winter with record flows that may have affected spring sampling conditions. No benthic samples from non-burned reference sites in 2004 or 2005 achieved the target count of 500 organisms, and several had fewer than 300 organisms. Extreme flashiness of stream conditions and associated difficulty in collecting representative samples in 2004-2005 may have impaired our ability to show fire effects against the backdrop of wide variation in natural flows. Observed lack of covariance between annual rainfall and IBI may have been due to small sample sizes.
The weak correlation between IBI or O/E scores and PHAB variables across sites and years is probably best explained by site-specific differences in factors that influence PHAB variables, such as burn intensity and extent, stream size and gradient, precipitation and amount of runoff, vegetative cover, geology and topography. For example, despite the weak correlation between IBI scores and percent sand and fine sediment in this study, several burned sites were observed during field sampling to have been completely inundated by sediment in the first 2 years post-fire (e.g., Roblar Creek, Conejos Creek, Boulder Creek, West Fork City Creek). There is no question that BMI assemblages at those sites were adversely affected, but when data from those sites was combined with data from burned sites that did not suffer sediment pulses after post-fire runoff events, the relationship between BMI index scores and sediment became obscured. Moreover, the sediment that completely choked those streams in the first 2 years post-fire was observed to have been flushed out of most channels by 2007 (Figure 6) and BMI index scores had
effectively recovered, meaning that the deleterious effects of these seemingly catastrophic sediment pulses are of limited duration. From a management perspective, post-fire index scores from sediment-choked sites should be interpreted with caution until the stream channel has recovered.
Minshall (2003) noted that relatively rapid recovery of stream BMIs after wildfire is associated with more rapid recovery of riparian vegetation compared to that of the uplands. The results of the present study support that observation, as IBI and O/E scores at reference sites were more strongly (and positively) correlated with mid-channel canopy density and riparian canopy cover than any other PHAB variable. Dwire and Kauffman (2003) also noted that riparian plant species exhibit a range of adaptations to disturbance that contribute to rapid recovery of streamside habitats following fires. However, the cumulative impact of human disturbance in riparian zones can strongly influence fire properties and occurrence regimes, and recovery of stream ecosystems is likely to be slower and potentially incomplete in cases where natural processes are already impaired (Dwire and Kauffman 2003; Minshall 2003). Because stream recovery is especially sensitive to, and dependent on, the extent to which riparian processes remain intact, pre- and post-fire anthropogenic disturbances in riparian corridors should be restricted or avoided. This management guideline extends to road construction and even fire fighting activities such as extensive thinning and fire break construction outside of residential areas.
Relevance to the Proposed Southern California Regional Monitoring Program for the Effects of Post-Fire Runoff Stein and Brown (2009) outlined a plan for the development of a coordinated Southern California Regional Monitoring Program to study the effects of post-fire runoff on surface water quality. That document was organized around 3 priority management questions, the third being “What are the factors that influence how long post-fire runoff persists?” The present study is a completed example of the monitoring they proposed to address that management question. Unfortunately, neither the present study nor the monitoring they proposed allow for the assessment of how post-fire contaminant flux might affect BMI assemblages across burned watersheds. Contaminant loadings during post-fire storm events could potentially harm BMIs in addition to physical habitat changes such as reduced canopy cover and sedimentation. A more thorough understanding of the effects of wildfire on BMIs might be obtained if contaminant flux (for metals, nutrients polycyclic aromatic hydrocarbons) were measured at burned sites and comparable unburned sites during at least 3 storms during the first post-fire winter. Statistical relationships (if they occur) between BMI index scores and contaminant levels across burned vs. unburned sites would provide additional insight into factors that influence post-fire BMI responses across regional streams. Final Recommendations: 1) Statistical approaches for comparing pre- and post- fire data were fairly limited in this study given data gaps from inconsistent sampling of sites over time. Future studies
should strive for consistent data collection from all sites over a consistent post-fire time frame. 2) Existing or candidate reference sites that have recently burned should be given at least 3 years to recover from post-fire effects before being used to monitor BMIs for trends in reference condition over time or to set expectations for biological condition in indicator development. Similarly, test sites that have recently burned should be given 3 years to recover before being evaluated against a regional reference standard. This latter recommendation is based on the post-fire response of O/E at test sites, not IBI, and errors on the side of caution so that biological condition at burned test sites is not unfairly assessed within 3 years post-fire. 3) Pre- and post-fire anthropogenic disturbances in riparian corridors should be restricted or avoided because stream recovery is especially sensitive to, and dependent on, the extent to which riparian processes remain intact. This management guideline extends to road construction and even fire fighting activities, such as extensive thinning and fire break construction outside of residential areas. 4) Evaluating the response of BMIs to post-fire contaminant flux across burned and unburned sampling sites would provide additional insight into the mechanisms by which wildfires affect stream biota. Acknowledgements
The Aquatic Bioassessment Lab is greatly indebted to the San Diego Regional Water Quality Control Board for providing funding to support this study. The ABL especially wishes to thank Dave Gibson, Lilian Busse and Cynthia Gorham-Test for their involvement in site selection and reconnaissance, for contract management over a several year period, and for their continued support in regional and statewide efforts to enhance the use of benthic macroinvertebrates as indicators of ecological condition in streams. References Bêche, L.A., S.L. Stevens and V.H. Resh. 2005. Effects of prescribed fire on a Sierra
Nevada (California, USA) stream and its riparian zone. Forest Ecology and Management 218:37-59.
Dufrêne, M. and P. Legendre. 1997. Species assemblages and indicator species: the need
for a flexible asymmetrical approach. Ecological Monographs 67:345-366. Dwire, A.K. and J.B. Kauffman. 2003. Fire and riparian ecosystems in landscapes of the
western USA. Forest Ecology and Management 178:61-74.
Hawkins, C.P., J. Ostermiller and M. Vinson. 2001. Stream invertebrate, periphyton and environmental sampling associated with biological water quality assessments. Utah State University, Logan, Utah.
Kaufmann, P.R., P. Levine, E.G. Robison, C. Seeliger and D.V. Peck. 1999. Surface
Waters: Quantifying Physical Habitat in Wadeable Streams. EPA/620/R-99/003. U.S. Environmental Protection Agency, Office of Research and Development: Washington, D.C.
McCune, B. and M.J. Mefford. 1999. PC-ORD. Multivariate Analysis of Ecological
Data, Version 4. MjM Software Design, Gleneden Beach, Oregon, USA. Mellon, C.D., M.S. Wipfli and J.L. Li. 2008. Effects of forest fire on headwater stream
macroinvertebrate communities in eastern Washington, USA. Freshwater Biology 53:2331-2343.
Minshall, G.W. 2003. Responses of stream benthic macroinvertebrates to fire. Forest
Ecology and Management 178:155-161. Ode, P.R., A.C. Rehn and J.T. May. 2005. A quantitative tool for assessing the integrity
of southern coastal California streams. Environmental Management 35:493-504. Ode, P.R., C.P. Hawkins and R.D. Mazor. 2008. Comparability of biological assessments
derived from predictive models and multimetric indices of increasing geographic scope. Journal of the North American Benthological Society 27:967-985.
Peck, D.V., A.T. Herlihy, B.H. Hill, R.M. Hughes, P.R. Kaufmann, D.J. Klemm, J.M.
Lazorchak, F.H. McCormick, S.A. Peterson, P.L. Ringold, T. Magee and M. Cappaert. 2006. Environmental Monitoring and Assessment Program – Surface Waters Western Pilot Study: Field Operations Manual for Wadeable Streams. EPA 620/R-06/003. U.S. Environmental Protection Agency, Office of Research and Development: Washington, D.C.
Rehn, A.C., P.R. Ode and C.P. Hawkins. 2007. Comparisons of targeted-riffle and reach-
wide benthic macroinvertebrate samples: implications for data-sharing in stream condition assessments. Journal of the North American Benthological Society 26:332-348.
Rinne, J.N. 1996. Short term effects of wildfire on fishes and macroinvertebrates in the
southwestern United States. North American Journal of Fisheries Management 16:653-658.
Roby, K.B. and D.L. Azuma. 1995. Changes in a reach of a northern California stream
following wildfire. Environmental Management 19:591-600. Stein, E.D. and J. Brown. 2009. Effects of post-fire runoff on surface water quality:
development of a southern California regional monitoring program with management questions and implementation recommendations. Southern California Coastal Water Research Project Technical Report 598. Costa Mesa, CA.
Syphard, A.D., V.C. Radeloff, N.S. Keuler, R.S. Taylor, T.J. Hawbaker, S.I. Stewart and
M.K. Clayton. 2008. Predicting spatial patterns of fire on a southern California landscape. International Journal of Wildland Fire 17:602-613.
Vieira, N.K.M., W.H. Clements, L.S. Guevara and B.F. Jacobs. 2004. Resistance and
resilience of stream insect communities to repeated hydrologic disturbances after a wildfire. Freshwater Biology 49:1243-1259.
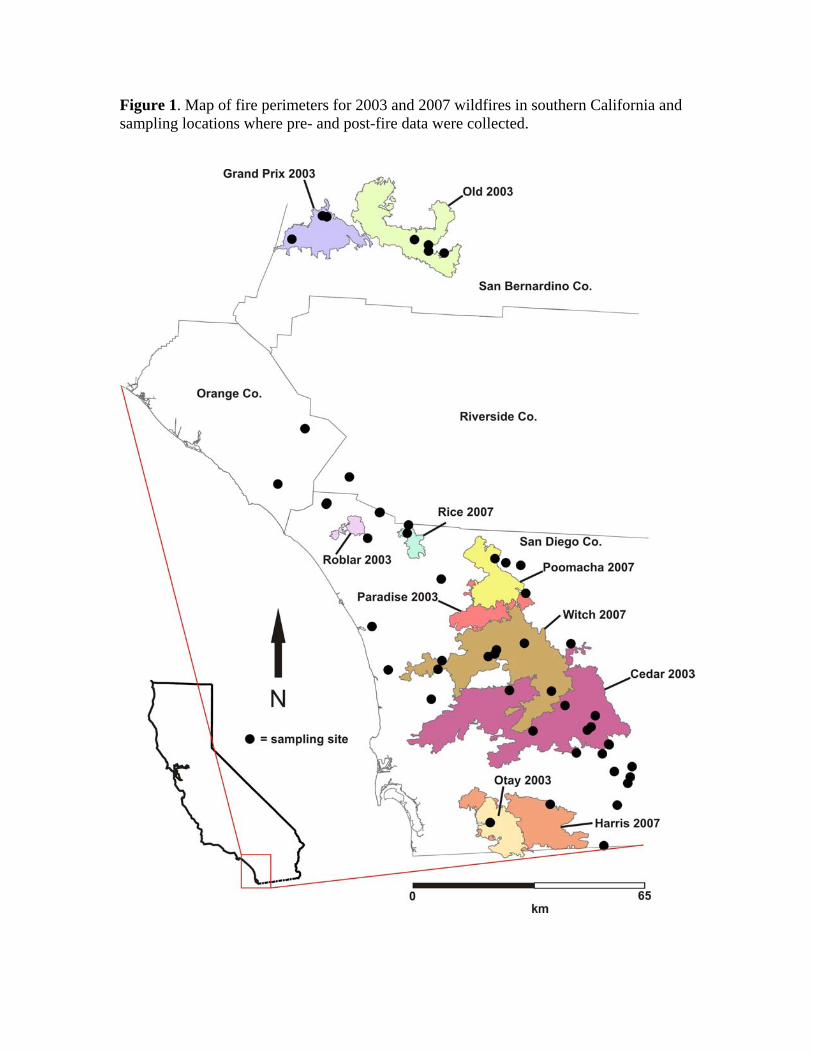
Figure 1. Map of fire perimeters for 2003 and 2007 wildfires in southern California and sampling locations where pre- and post-fire data were collected.
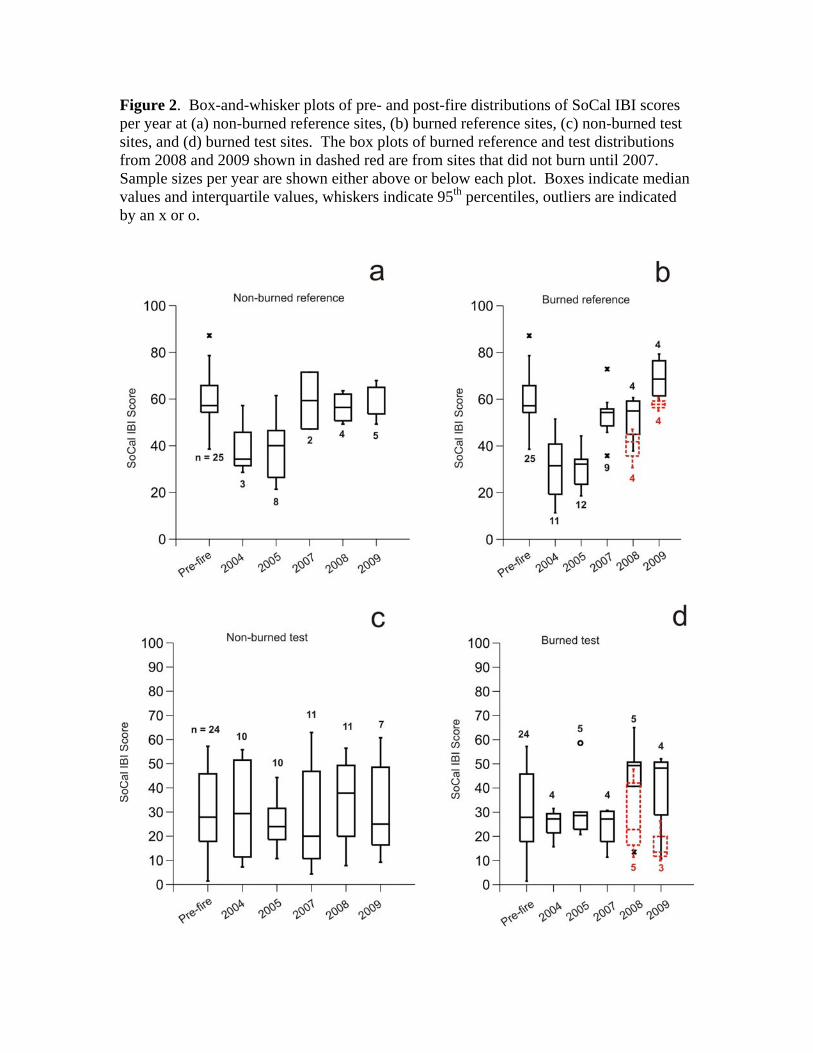
Figure 2. Box-and-whisker plots of pre- and post-fire distributions of SoCal IBI scores per year at (a) non-burned reference sites, (b) burned reference sites, (c) non-burned test sites, and (d) burned test sites. The box plots of burned reference and test distributions from 2008 and 2009 shown in dashed red are from sites that did not burn until 2007. Sample sizes per year are shown either above or below each plot. Boxes indicate median values and interquartile values, whiskers indicate 95th percentiles, outliers are indicated by an x or o.
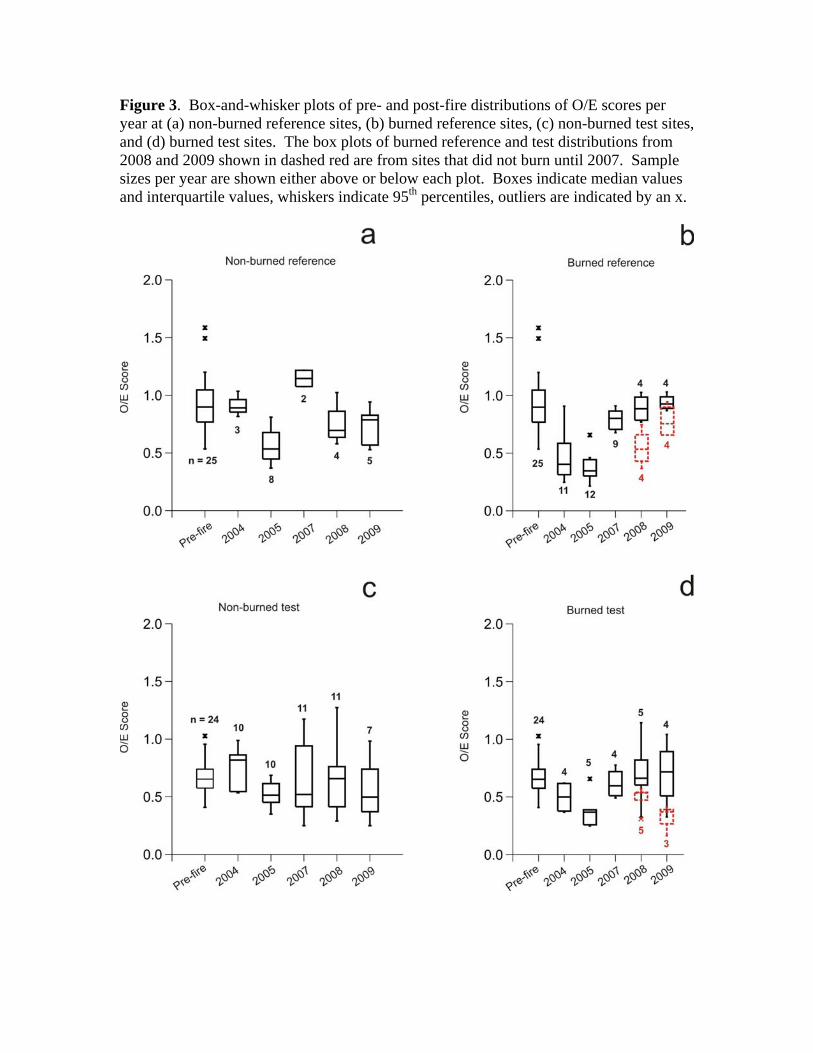
Figure 3. Box-and-whisker plots of pre- and post-fire distributions of O/E scores per year at (a) non-burned reference sites, (b) burned reference sites, (c) non-burned test sites, and (d) burned test sites. The box plots of burned reference and test distributions from 2008 and 2009 shown in dashed red are from sites that did not burn until 2007. Sample sizes per year are shown either above or below each plot. Boxes indicate median values and interquartile values, whiskers indicate 95th percentiles, outliers are indicated by an x.
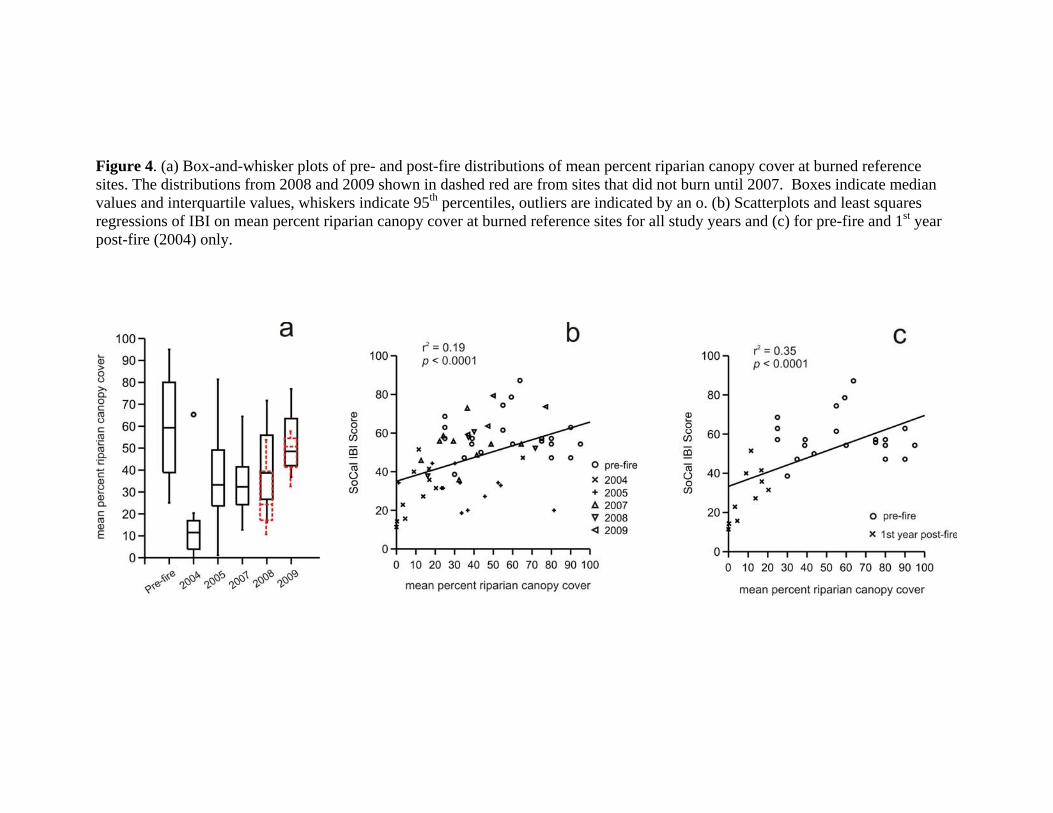
Figure 4. (a) Box-and-whisker plots of pre- and post-fire distributions of mean percent riparian canopy cover at burned reference sites. The distributions from 2008 and 2009 shown in dashed red are from sites that did not burn until 2007. Boxes indicate median values and interquartile values, whiskers indicate 95th percentiles, outliers are indicated by an o. (b) Scatterplots and least squares regressions of IBI on mean percent riparian canopy cover at burned reference sites for all study years and (c) for pre-fire and 1st year post-fire (2004) only.
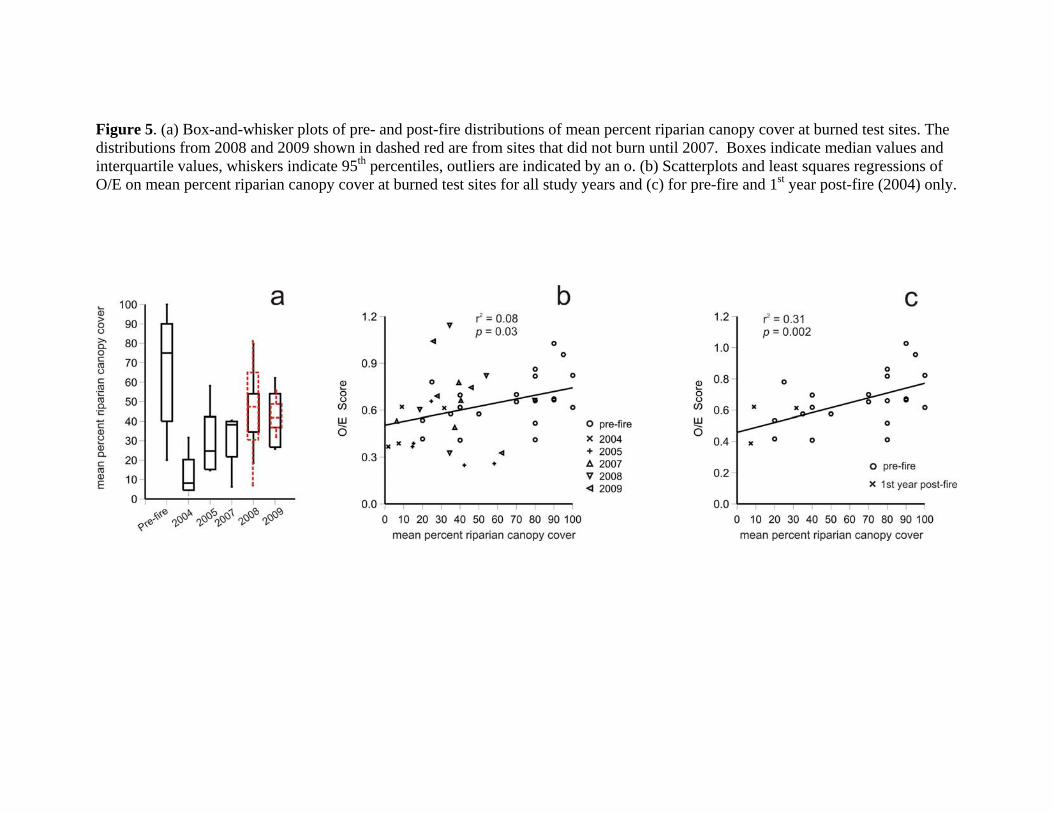
Figure 5. (a) Box-and-whisker plots of pre- and post-fire distributions of mean percent riparian canopy cover at burned test sites. The distributions from 2008 and 2009 shown in dashed red are from sites that did not burn until 2007. Boxes indicate median values and interquartile values, whiskers indicate 95th percentiles, outliers are indicated by an o. (b) Scatterplots and least squares regressions of O/E on mean percent riparian canopy cover at burned test sites for all study years and (c) for pre-fire and 1st year post-fire (2004) only.
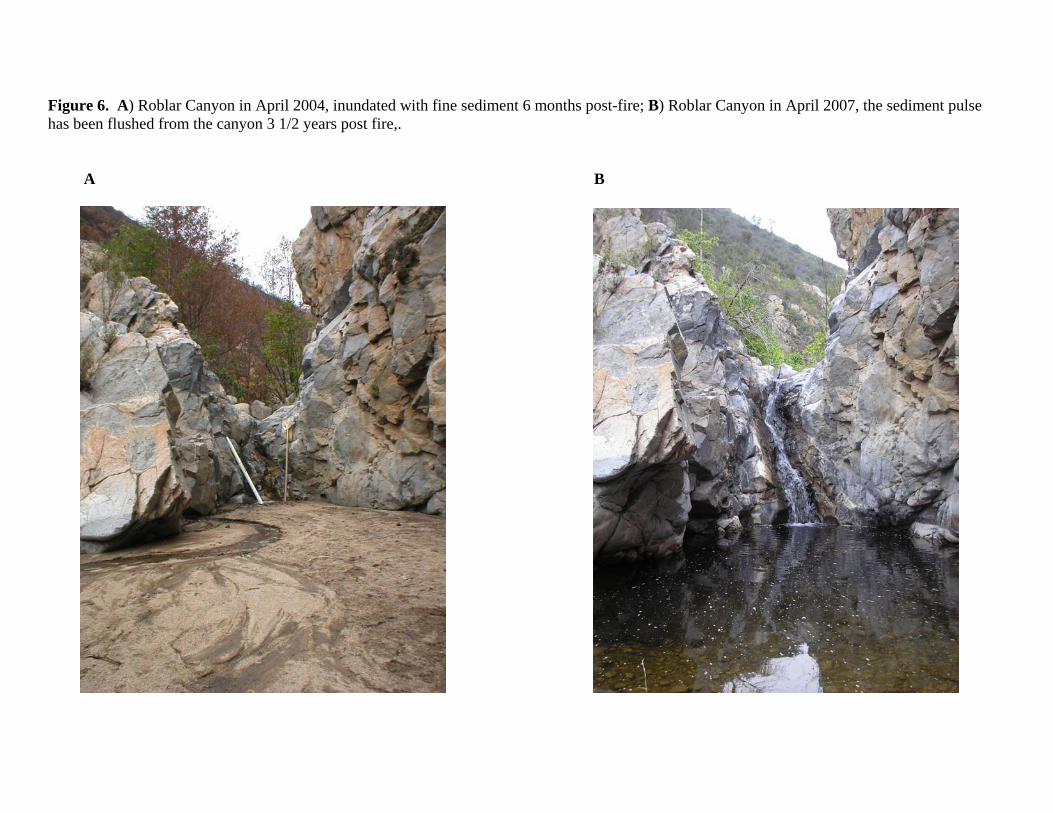
Figure 6. A) Roblar Canyon in April 2004, inundated with fine sediment 6 months post-fire; B) Roblar Canyon in April 2007, the sediment pulse has been flushed from the canyon 3 1/2 years post fire,. A B
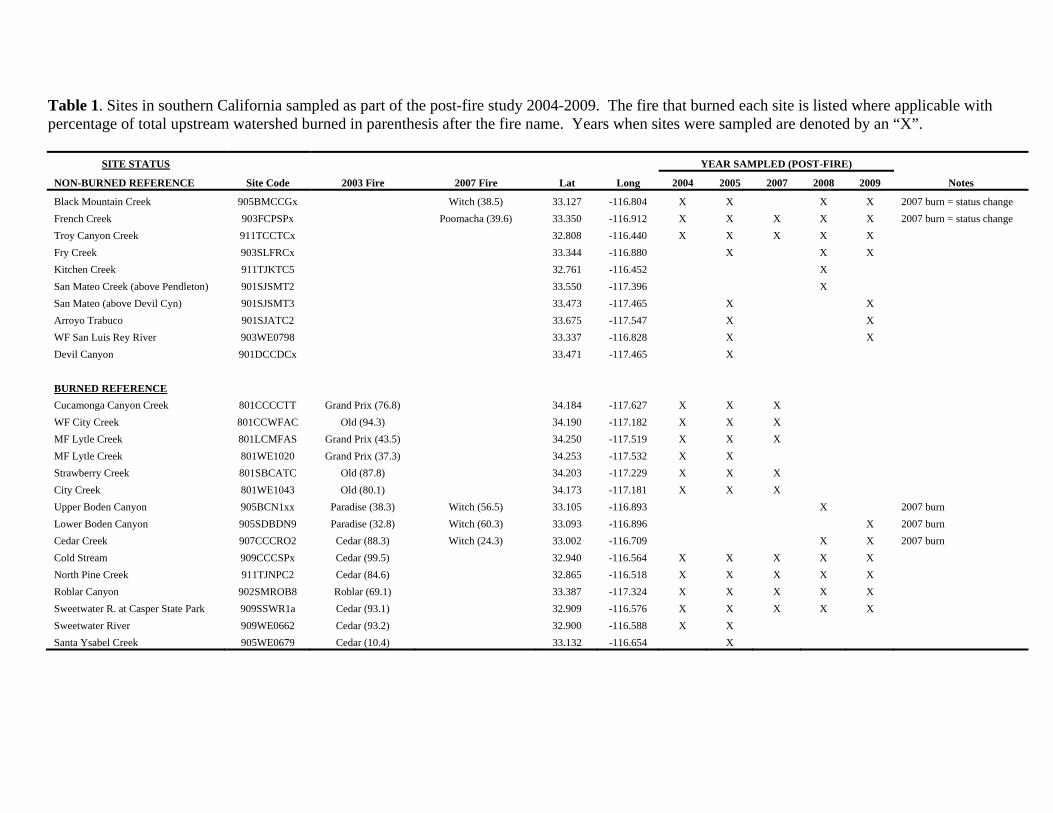
Table 1. Sites in southern California sampled as part of the post-fire study 2004-2009. The fire that burned each site is listed where applicable with percentage of total upstream watershed burned in parenthesis after the fire name. Years when sites were sampled are denoted by an “X”.
SITE STATUS YEAR SAMPLED (POST-FIRE)
NON-BURNED REFERENCE Site Code 2003 Fire 2007 Fire Lat Long 2004 2005 2007 2008 2009 Notes
Black Mountain Creek 905BMCCGx Witch (38.5) 33.127 -116.804 X X X X 2007 burn = status change
French Creek 903FCPSPx Poomacha (39.6) 33.350 -116.912 X X X X X 2007 burn = status change
Troy Canyon Creek 911TCCTCx 32.808 -116.440 X X X X X
Fry Creek 903SLFRCx 33.344 -116.880 X X X
Kitchen Creek 911TJKTC5 32.761 -116.452 X
San Mateo Creek (above Pendleton) 901SJSMT2 33.550 -117.396 X
San Mateo (above Devil Cyn) 901SJSMT3 33.473 -117.465 X X
Arroyo Trabuco 901SJATC2 33.675 -117.547 X X
WF San Luis Rey River 903WE0798 33.337 -116.828 X X
Devil Canyon 901DCCDCx 33.471 -117.465 X
BURNED REFERENCE
Cucamonga Canyon Creek 801CCCCTT Grand Prix (76.8) 34.184 -117.627 X X X
WF City Creek 801CCWFAC Old (94.3) 34.190 -117.182 X X X
MF Lytle Creek 801LCMFAS Grand Prix (43.5) 34.250 -117.519 X X X
MF Lytle Creek 801WE1020 Grand Prix (37.3) 34.253 -117.532 X X
Strawberry Creek 801SBCATC Old (87.8) 34.203 -117.229 X X X
City Creek 801WE1043 Old (80.1) 34.173 -117.181 X X X
Upper Boden Canyon 905BCN1xx Paradise (38.3) Witch (56.5) 33.105 -116.893 X 2007 burn
Lower Boden Canyon 905SDBDN9 Paradise (32.8) Witch (60.3) 33.093 -116.896 X 2007 burn
Cedar Creek 907CCCRO2 Cedar (88.3) Witch (24.3) 33.002 -116.709 X X 2007 burn
Cold Stream 909CCCSPx Cedar (99.5) 32.940 -116.564 X X X X X
North Pine Creek 911TJNPC2 Cedar (84.6) 32.865 -116.518 X X X X X
Roblar Canyon 902SMROB8 Roblar (69.1) 33.387 -117.324 X X X X X
Sweetwater R. at Casper State Park 909SSWR1a Cedar (93.1) 32.909 -116.576 X X X X X
Sweetwater River 909WE0662 Cedar (93.2) 32.900 -116.588 X X
Santa Ysabel Creek 905WE0679 Cedar (10.4) 33.132 -116.654 X
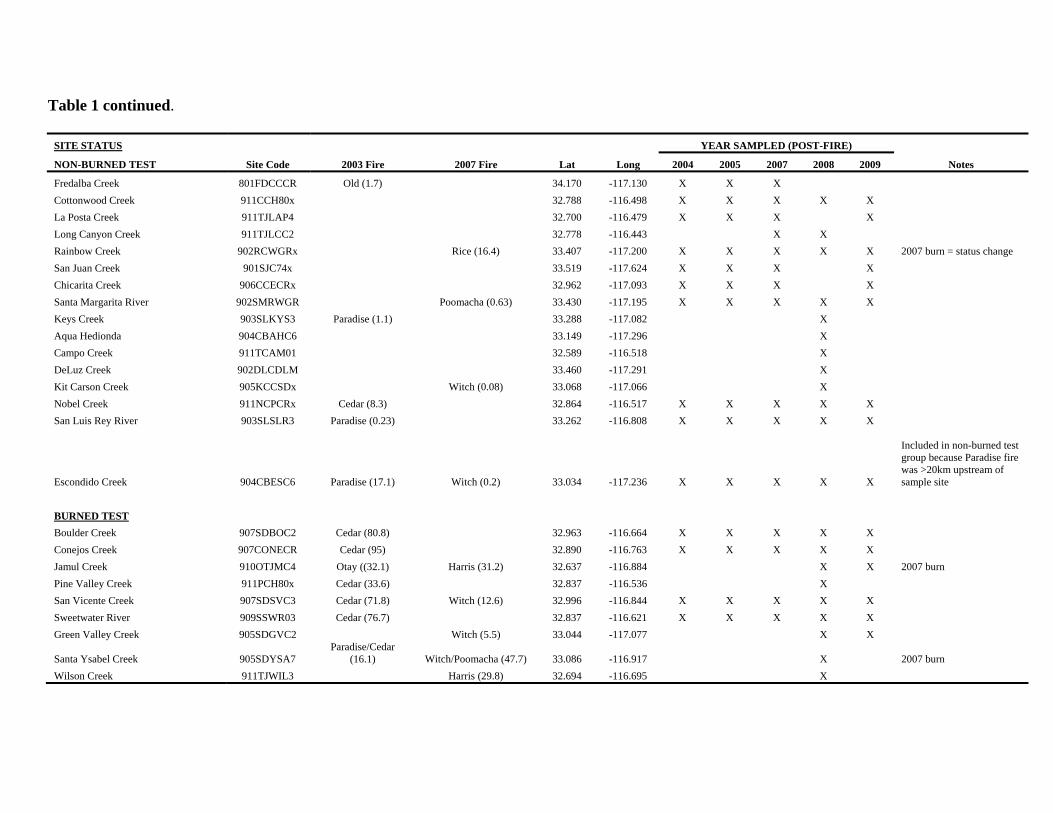
Table 1 continued.
SITE STATUS YEAR SAMPLED (POST-FIRE)
NON-BURNED TEST Site Code 2003 Fire 2007 Fire Lat Long 2004 2005 2007 2008 2009 Notes
Fredalba Creek 801FDCCCR Old (1.7) 34.170 -117.130 X X X
Cottonwood Creek 911CCH80x 32.788 -116.498 X X X X X
La Posta Creek 911TJLAP4 32.700 -116.479 X X X X
Long Canyon Creek 911TJLCC2 32.778 -116.443 X X
Rainbow Creek 902RCWGRx Rice (16.4) 33.407 -117.200 X X X X X 2007 burn = status change
San Juan Creek 901SJC74x 33.519 -117.624 X X X X
Chicarita Creek 906CCECRx 32.962 -117.093 X X X X
Santa Margarita River 902SMRWGR Poomacha (0.63) 33.430 -117.195 X X X X X
Keys Creek 903SLKYS3 Paradise (1.1) 33.288 -117.082 X
Aqua Hedionda 904CBAHC6 33.149 -117.296 X
Campo Creek 911TCAM01 32.589 -116.518 X
DeLuz Creek 902DLCDLM 33.460 -117.291 X
Kit Carson Creek 905KCCSDx Witch (0.08) 33.068 -117.066 X
Nobel Creek 911NCPCRx Cedar (8.3) 32.864 -116.517 X X X X X
San Luis Rey River 903SLSLR3 Paradise (0.23) 33.262 -116.808 X X X X X
Escondido Creek 904CBESC6 Paradise (17.1) Witch (0.2) 33.034 -117.236 X X X X X
Included in non-burned test group because Paradise fire was >20km upstream of sample site
BURNED TEST
Boulder Creek 907SDBOC2 Cedar (80.8) 32.963 -116.664 X X X X X
Conejos Creek 907CONECR Cedar (95) 32.890 -116.763 X X X X X
Jamul Creek 910OTJMC4 Otay ((32.1) Harris (31.2) 32.637 -116.884 X X 2007 burn
Pine Valley Creek 911PCH80x Cedar (33.6) 32.837 -116.536 X
San Vicente Creek 907SDSVC3 Cedar (71.8) Witch (12.6) 32.996 -116.844 X X X X X
Sweetwater River 909SSWR03 Cedar (76.7) 32.837 -116.621 X X X X X
Green Valley Creek 905SDGVC2 Witch (5.5) 33.044 -117.077 X X
Santa Ysabel Creek 905SDYSA7 Paradise/Cedar
(16.1) Witch/Poomacha (47.7) 33.086 -116.917 X 2007 burn
Wilson Creek 911TJWIL3 Harris (29.8) 32.694 -116.695 X
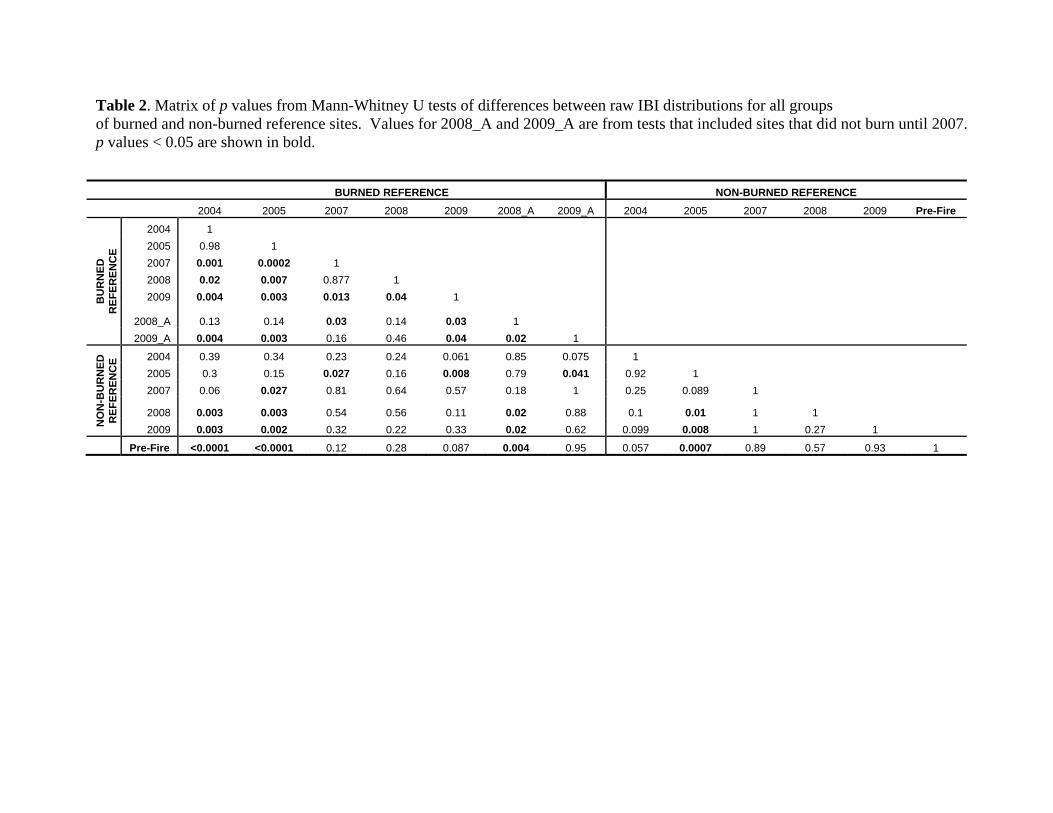
Table 2. Matrix of p values from Mann-Whitney U tests of differences between raw IBI distributions for all groups of burned and non-burned reference sites. Values for 2008_A and 2009_A are from tests that included sites that did not burn until 2007.
p values < 0.05 are shown in bold.
BURNED REFERENCE NON-BURNED REFERENCE 2004 2005 2007 2008 2009 2008_A 2009_A 2004 2005 2007 2008 2009 Pre-Fire
BU
RN
ED
REF
EREN
CE
2004 1
2005 0.98 1
2007 0.001 0.0002 1
2008 0.02 0.007 0.877 1
2009 0.004 0.003 0.013 0.04 1
2008_A 0.13 0.14 0.03 0.14 0.03 1
2009_A 0.004 0.003 0.16 0.46 0.04 0.02 1
NO
N-B
UR
NED
R
EFER
ENC
E 2004 0.39 0.34 0.23 0.24 0.061 0.85 0.075 1
2005 0.3 0.15 0.027 0.16 0.008 0.79 0.041 0.92 1
2007 0.06 0.027 0.81 0.64 0.57 0.18 1 0.25 0.089 1
2008 0.003 0.003 0.54 0.56 0.11 0.02 0.88 0.1 0.01 1 1
2009 0.003 0.002 0.32 0.22 0.33 0.02 0.62 0.099 0.008 1 0.27 1 Pre-Fire <0.0001 <0.0001 0.12 0.28 0.087 0.004 0.95 0.057 0.0007 0.89 0.57 0.93 1
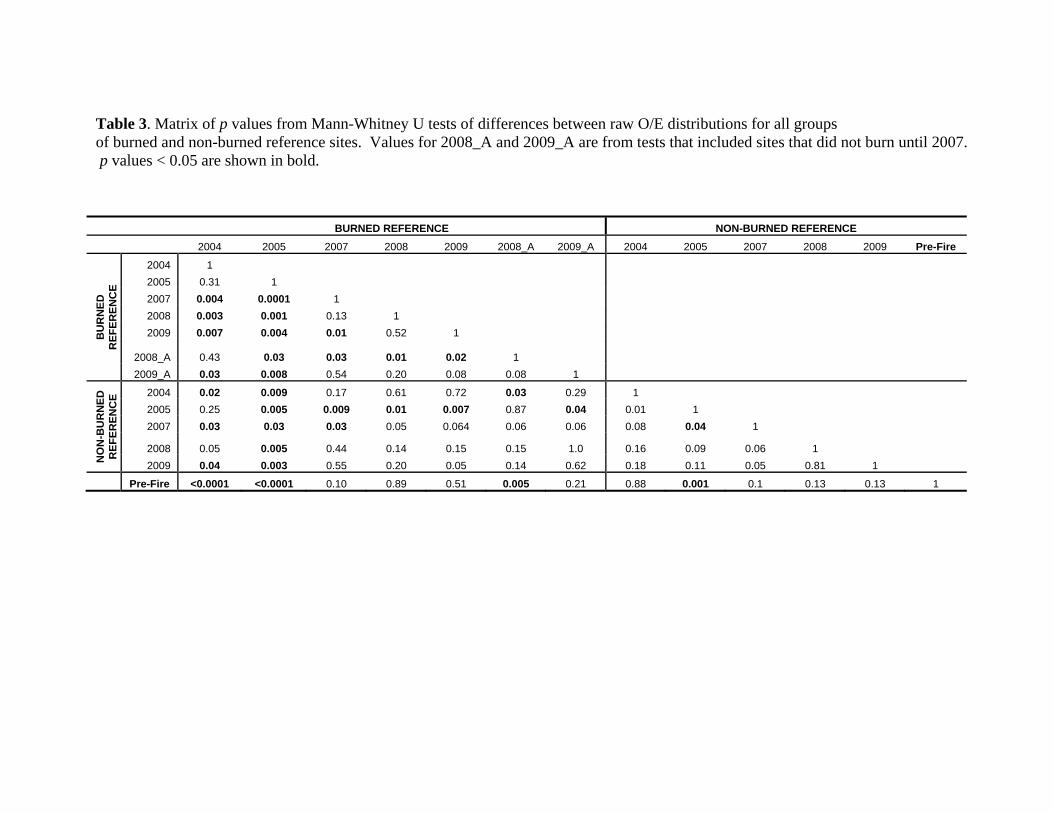
Table 3. Matrix of p values from Mann-Whitney U tests of differences between raw O/E distributions for all groups of burned and non-burned reference sites. Values for 2008_A and 2009_A are from tests that included sites that did not burn until 2007. p values < 0.05 are shown in bold.
BURNED REFERENCE NON-BURNED REFERENCE 2004 2005 2007 2008 2009 2008_A 2009_A 2004 2005 2007 2008 2009 Pre-Fire
BU
RN
ED
REF
EREN
CE
2004 1
2005 0.31 1
2007 0.004 0.0001 1
2008 0.003 0.001 0.13 1
2009 0.007 0.004 0.01 0.52 1
2008_A 0.43 0.03 0.03 0.01 0.02 1
2009_A 0.03 0.008 0.54 0.20 0.08 0.08 1
NO
N-B
UR
NED
R
EFER
ENC
E 2004 0.02 0.009 0.17 0.61 0.72 0.03 0.29 1
2005 0.25 0.005 0.009 0.01 0.007 0.87 0.04 0.01 1
2007 0.03 0.03 0.03 0.05 0.064 0.06 0.06 0.08 0.04 1
2008 0.05 0.005 0.44 0.14 0.15 0.15 1.0 0.16 0.09 0.06 1
2009 0.04 0.003 0.55 0.20 0.05 0.14 0.62 0.18 0.11 0.05 0.81 1 Pre-Fire <0.0001 <0.0001 0.10 0.89 0.51 0.005 0.21 0.88 0.001 0.1 0.13 0.13 1
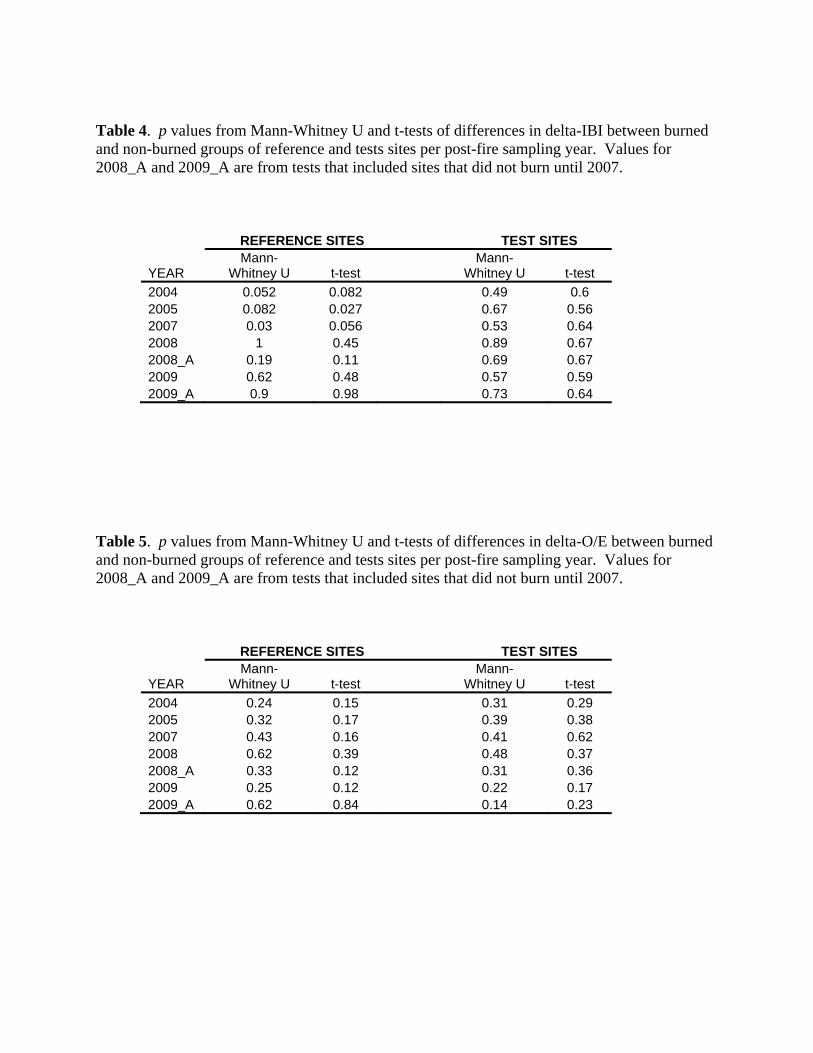
Table 4. p values from Mann-Whitney U and t-tests of differences in delta-IBI between burned and non-burned groups of reference and tests sites per post-fire sampling year. Values for 2008_A and 2009_A are from tests that included sites that did not burn until 2007.
REFERENCE SITES TEST SITES
YEAR Mann-
Whitney U t-test Mann-
Whitney U t-test
2004 0.052 0.082 0.49 0.6 2005 0.082 0.027 0.67 0.56 2007 0.03 0.056 0.53 0.64 2008 1 0.45 0.89 0.67 2008_A 0.19 0.11 0.69 0.67 2009 0.62 0.48 0.57 0.59 2009_A 0.9 0.98 0.73 0.64
Table 5. p values from Mann-Whitney U and t-tests of differences in delta-O/E between burned and non-burned groups of reference and tests sites per post-fire sampling year. Values for 2008_A and 2009_A are from tests that included sites that did not burn until 2007.
REFERENCE SITES TEST SITES
YEAR Mann-
Whitney U t-test Mann-
Whitney U t-test
2004 0.24 0.15 0.31 0.29 2005 0.32 0.17 0.39 0.38 2007 0.43 0.16 0.41 0.62 2008 0.62 0.39 0.48 0.37 2008_A 0.33 0.12 0.31 0.36 2009 0.25 0.12 0.22 0.17 2009_A 0.62 0.84 0.14 0.23
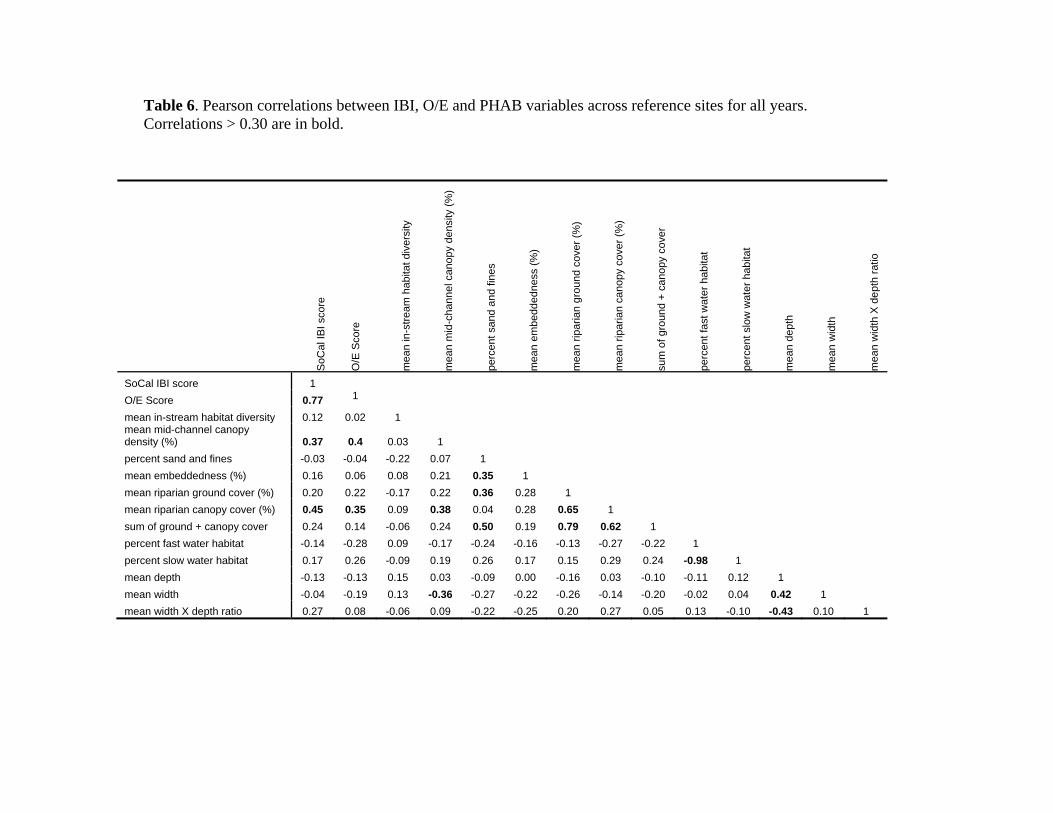
Table 6. Pearson correlations between IBI, O/E and PHAB variables across reference sites for all years. Correlations > 0.30 are in bold.
S
oCal
IBI s
core
O/E
Sco
re
mea
n in
-str
eam
hab
itat d
iver
sity
mea
n m
id-c
hann
el c
anop
y de
nsity
(%
)
perc
ent s
and
and
fines
mea
n em
bedd
edne
ss (
%)
mea
n rip
aria
n g
roun
d co
ver
(%)
mea
n rip
aria
n ca
nopy
cov
er (
%)
sum
of g
roun
d +
can
opy
cove
r
perc
ent f
ast w
ate
r ha
bita
t
perc
ent s
low
wat
er h
abita
t
mea
n de
pth
mea
n w
idth
mea
n w
idth
X d
ept
h ra
tio
SoCal IBI score 1
O/E Score 0.77 1
mean in-stream habitat diversity 0.12 0.02 1 mean mid-channel canopy density (%) 0.37 0.4 0.03 1
percent sand and fines -0.03 -0.04 -0.22 0.07 1
mean embeddedness (%) 0.16 0.06 0.08 0.21 0.35 1
mean riparian ground cover (%) 0.20 0.22 -0.17 0.22 0.36 0.28 1
mean riparian canopy cover (%) 0.45 0.35 0.09 0.38 0.04 0.28 0.65 1
sum of ground + canopy cover 0.24 0.14 -0.06 0.24 0.50 0.19 0.79 0.62 1
percent fast water habitat -0.14 -0.28 0.09 -0.17 -0.24 -0.16 -0.13 -0.27 -0.22 1
percent slow water habitat 0.17 0.26 -0.09 0.19 0.26 0.17 0.15 0.29 0.24 -0.98 1
mean depth -0.13 -0.13 0.15 0.03 -0.09 0.00 -0.16 0.03 -0.10 -0.11 0.12 1
mean width -0.04 -0.19 0.13 -0.36 -0.27 -0.22 -0.26 -0.14 -0.20 -0.02 0.04 0.42 1
mean width X depth ratio 0.27 0.08 -0.06 0.09 -0.22 -0.25 0.20 0.27 0.05 0.13 -0.10 -0.43 0.10 1
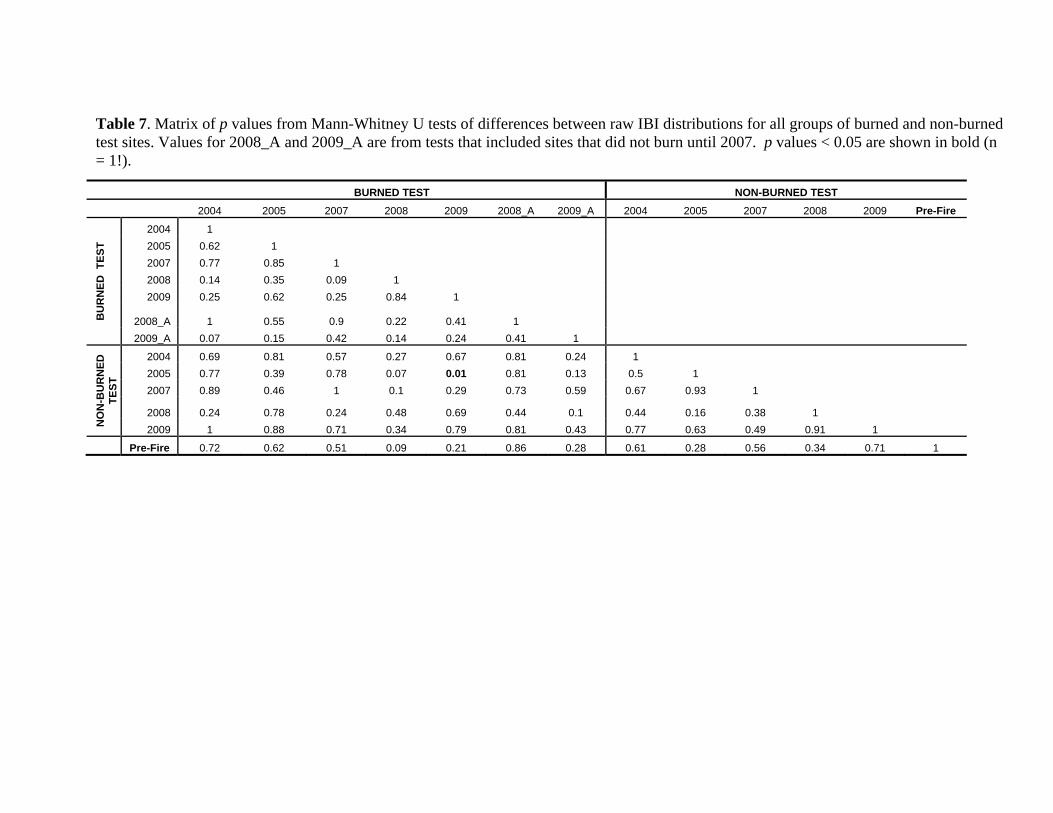
Table 7. Matrix of p values from Mann-Whitney U tests of differences between raw IBI distributions for all groups of burned and non-burned test sites. Values for 2008_A and 2009_A are from tests that included sites that did not burn until 2007. p values < 0.05 are shown in bold (n = 1!).
BURNED TEST NON-BURNED TEST 2004 2005 2007 2008 2009 2008_A 2009_A 2004 2005 2007 2008 2009 Pre-Fire
BU
RN
ED T
EST
2004 1
2005 0.62 1
2007 0.77 0.85 1
2008 0.14 0.35 0.09 1
2009 0.25 0.62 0.25 0.84 1
2008_A 1 0.55 0.9 0.22 0.41 1
2009_A 0.07 0.15 0.42 0.14 0.24 0.41 1
NO
N-B
UR
NED
TE
ST
2004 0.69 0.81 0.57 0.27 0.67 0.81 0.24 1
2005 0.77 0.39 0.78 0.07 0.01 0.81 0.13 0.5 1
2007 0.89 0.46 1 0.1 0.29 0.73 0.59 0.67 0.93 1
2008 0.24 0.78 0.24 0.48 0.69 0.44 0.1 0.44 0.16 0.38 1
2009 1 0.88 0.71 0.34 0.79 0.81 0.43 0.77 0.63 0.49 0.91 1 Pre-Fire 0.72 0.62 0.51 0.09 0.21 0.86 0.28 0.61 0.28 0.56 0.34 0.71 1
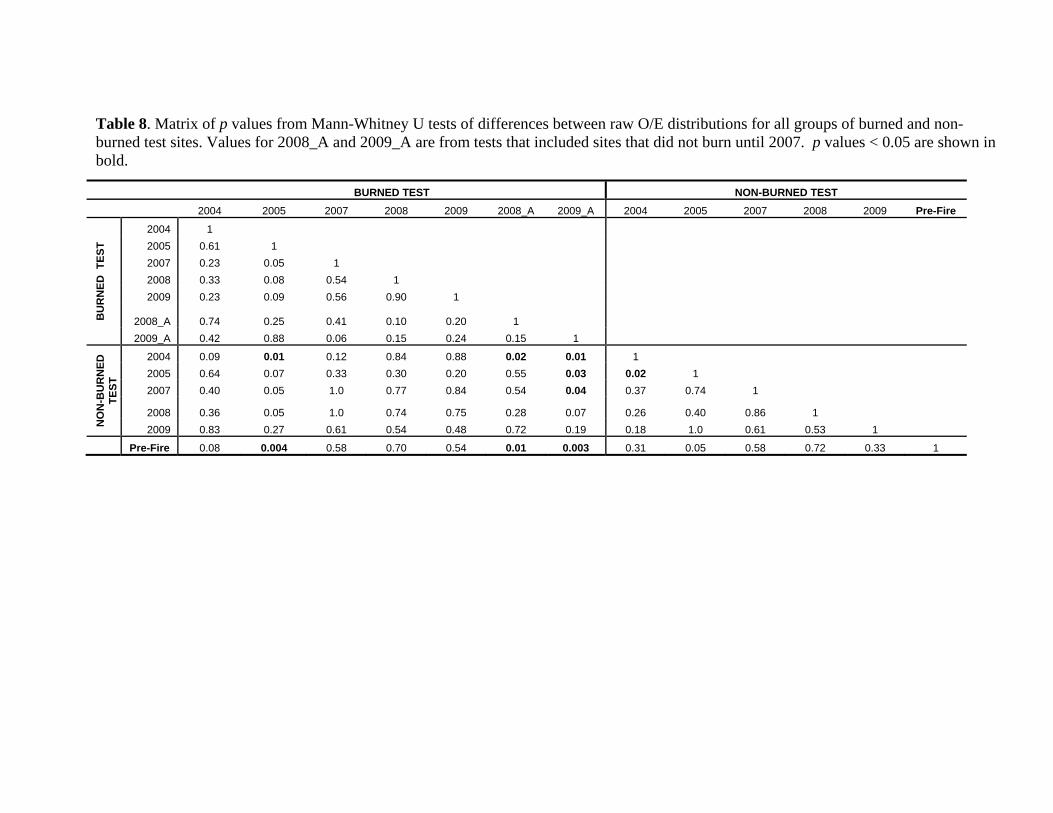
Table 8. Matrix of p values from Mann-Whitney U tests of differences between raw O/E distributions for all groups of burned and non-burned test sites. Values for 2008_A and 2009_A are from tests that included sites that did not burn until 2007. p values < 0.05 are shown in bold.
BURNED TEST NON-BURNED TEST 2004 2005 2007 2008 2009 2008_A 2009_A 2004 2005 2007 2008 2009 Pre-Fire
BU
RN
ED T
EST
2004 1
2005 0.61 1
2007 0.23 0.05 1
2008 0.33 0.08 0.54 1
2009 0.23 0.09 0.56 0.90 1
2008_A 0.74 0.25 0.41 0.10 0.20 1
2009_A 0.42 0.88 0.06 0.15 0.24 0.15 1
NO
N-B
UR
NED
TE
ST
2004 0.09 0.01 0.12 0.84 0.88 0.02 0.01 1
2005 0.64 0.07 0.33 0.30 0.20 0.55 0.03 0.02 1
2007 0.40 0.05 1.0 0.77 0.84 0.54 0.04 0.37 0.74 1
2008 0.36 0.05 1.0 0.74 0.75 0.28 0.07 0.26 0.40 0.86 1
2009 0.83 0.27 0.61 0.54 0.48 0.72 0.19 0.18 1.0 0.61 0.53 1 Pre-Fire 0.08 0.004 0.58 0.70 0.54 0.01 0.003 0.31 0.05 0.58 0.72 0.33 1
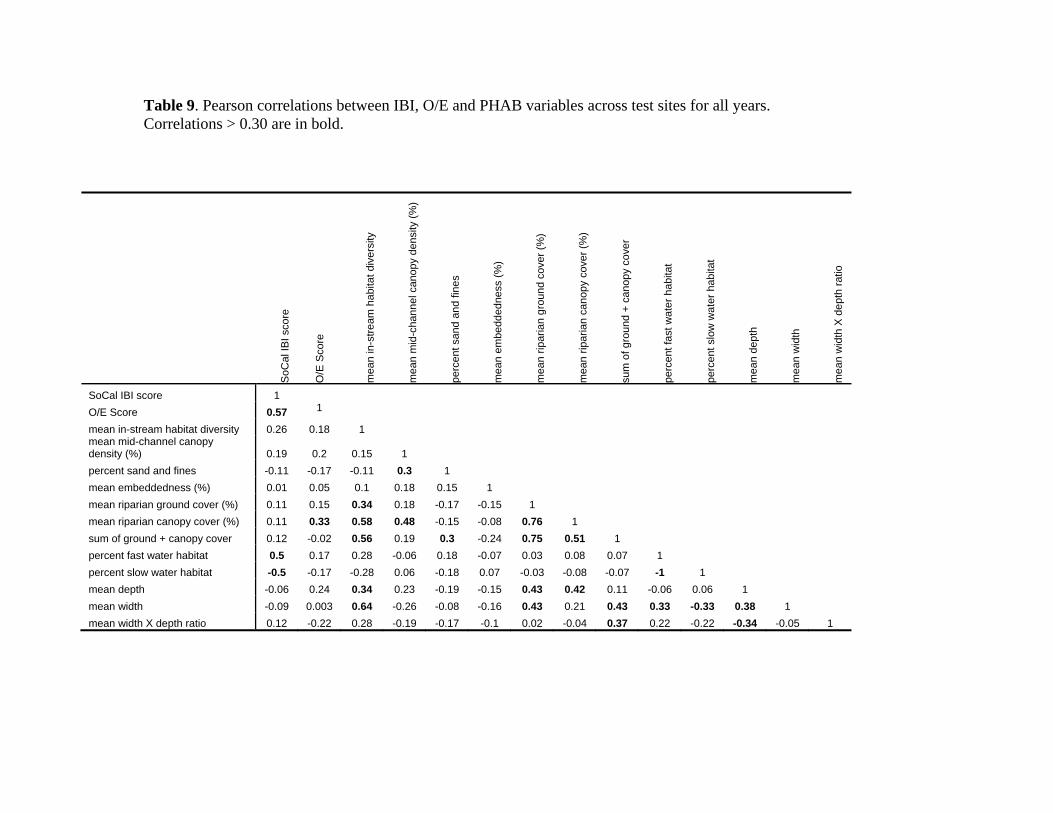
Table 9. Pearson correlations between IBI, O/E and PHAB variables across test sites for all years. Correlations > 0.30 are in bold.
S
oCal
IBI s
core
O/E
Sco
re
mea
n in
-str
eam
hab
itat d
iver
sity
mea
n m
id-c
hann
el c
anop
y de
nsity
(%
)
perc
ent s
and
and
fines
mea
n em
bedd
edne
ss (
%)
mea
n rip
aria
n g
roun
d co
ver
(%)
mea
n rip
aria
n ca
nopy
cov
er (
%)
sum
of g
roun
d +
can
opy
cove
r
perc
ent f
ast w
ate
r ha
bita
t
perc
ent s
low
wat
er h
abita
t
mea
n de
pth
mea
n w
idth
mea
n w
idth
X d
ept
h ra
tio
SoCal IBI score 1
O/E Score 0.57 1
mean in-stream habitat diversity 0.26 0.18 1 mean mid-channel canopy density (%) 0.19 0.2 0.15 1
percent sand and fines -0.11 -0.17 -0.11 0.3 1
mean embeddedness (%) 0.01 0.05 0.1 0.18 0.15 1
mean riparian ground cover (%) 0.11 0.15 0.34 0.18 -0.17 -0.15 1
mean riparian canopy cover (%) 0.11 0.33 0.58 0.48 -0.15 -0.08 0.76 1
sum of ground + canopy cover 0.12 -0.02 0.56 0.19 0.3 -0.24 0.75 0.51 1
percent fast water habitat 0.5 0.17 0.28 -0.06 0.18 -0.07 0.03 0.08 0.07 1
percent slow water habitat -0.5 -0.17 -0.28 0.06 -0.18 0.07 -0.03 -0.08 -0.07 -1 1
mean depth -0.06 0.24 0.34 0.23 -0.19 -0.15 0.43 0.42 0.11 -0.06 0.06 1
mean width -0.09 0.003 0.64 -0.26 -0.08 -0.16 0.43 0.21 0.43 0.33 -0.33 0.38 1
mean width X depth ratio 0.12 -0.22 0.28 -0.19 -0.17 -0.1 0.02 -0.04 0.37 0.22 -0.22 -0.34 -0.05 1
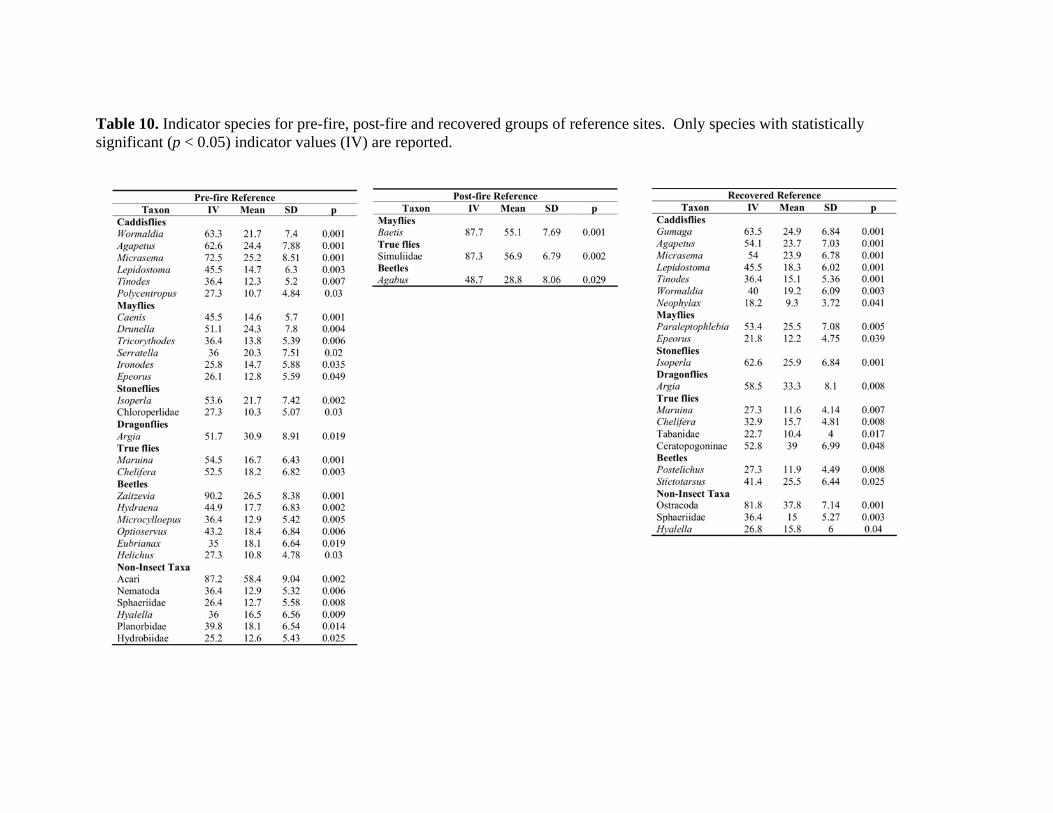
Table 10. Indicator species for pre-fire, post-fire and recovered groups of reference sites. Only species with statistically significant (p < 0.05) indicator values (IV) are reported.
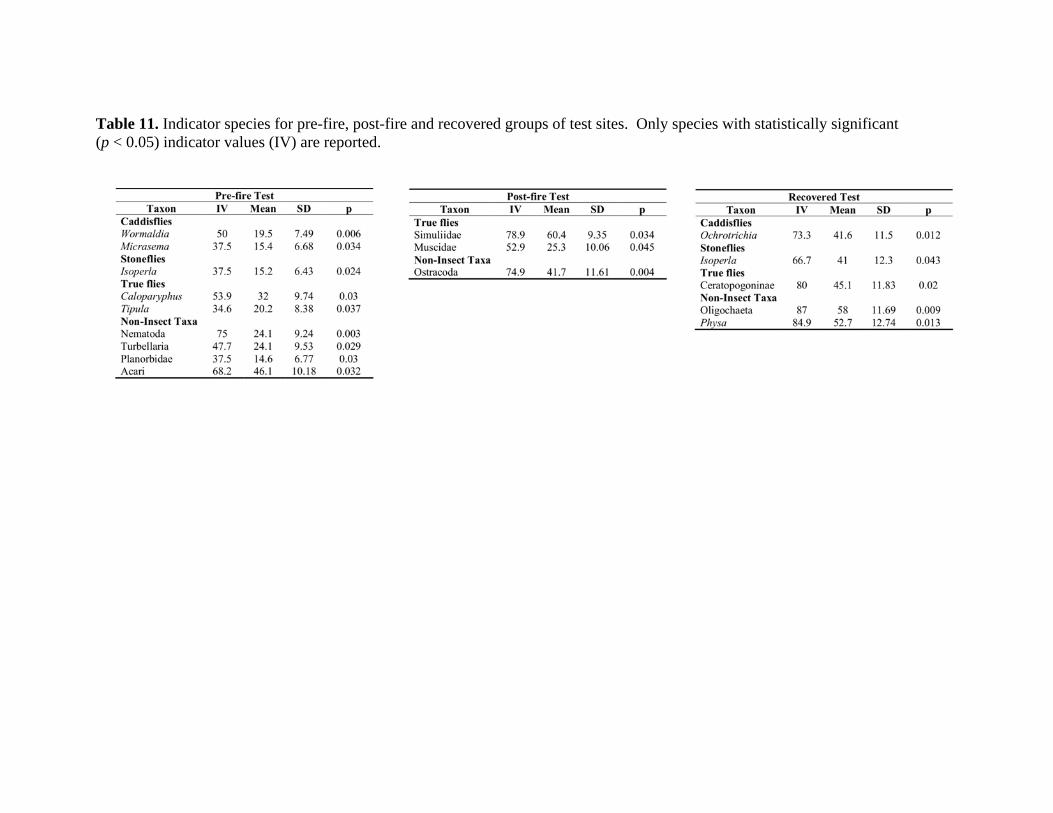
Table 11. Indicator species for pre-fire, post-fire and recovered groups of test sites. Only species with statistically significant (p < 0.05) indicator values (IV) are reported.