Embed Size (px)
Citation preview

This content has been downloaded from IOPscience. Please scroll down to see the full text.
Download details:
IP Address: 134.151.40.2
This content was downloaded on 11/01/2014 at 11:27
Please note that terms and conditions apply.
The electronic band structure of Pb1-xSnxTe alloys. I. Cubic and rhombohedral phase at 4.2K
View the table of contents for this issue, or go to the journal homepage for more
1985 J. Phys. F: Met. Phys. 15 317
(http://iopscience.iop.org/0305-4608/15/2/009)
Home Search Collections Journals About Contact us My IOPscience

J . Phys. F: Met. Phys. 15 (1985) 3 17-336. Printed in Great Britain
The electronic band structure of Pbl,, Sn, Te alloys. I: Cubic and rhombohedral phase at 4.2 K
He Yusheng and A D C Grassie Physics Laboratory, University of Sussex, Brighton BNl 9QH, UK
Received 24 April 1984
Abstract. The Fermi surfaces of Pb,-,Sn,Te in the cubic and rhombohedrally distorted phases for both normal and inverted band structures have been investigated using the Shubnikovde Haas effect. Comparison of the observed Fermi-surface cross-sectional areas with the band structures of Dimmock, for the cubic phase, and of Bangert, for the rhombohedral phase, yield parameters which are in agreement with values established previously for the cubic phase. The complex character of the Fermi surfaces at the points T and L in the rhombohedral Brillouin zone is found to agree with the predicted splitting of the ellipsoids of the cubic phase into the ‘skin’ and ‘core’ of an apple-like composite surface, originating in the lifting of the inversion symmetry of the structure at the structural phase transition. Clear evidence is obtained for the presence of structural domains in the rhombohedral phase. The carrier concentrations deduced from the Fermi-surface volumes are found to agree with those measured from the weak-field Hall coefficients, when account is taken of the anisotropy of the multiple carrier valleys in the band structure.
1. Introduction
Pb, -,Sn,Te alloys exhibit a wide variety of semiconducting and structural properties. A displacive structural phase transition from the cubic rock-salt structure to a rhombohedral structure occurs at positive absolute temperatures for x > 0.29 (Kobayashi et a1 1979) and a band inversion transition due to the different conduction and valence band symmetries in PbTe and SnTe (Dimmock et a1 1966) takes place at low temperatures for values of x in the neighbourhood of 0.35.
Extensive information is available (Kawamura 1980) about the structural phase transition in this alloy system and in the other related IV-VI compounds, such as Pb, -,Ge,Te and Pb, -,SnX Se, and values of the sublattice displacements, rhombohedral shear strains and electron-phonon interaction strengths are known. Furthermore, the band structure in the cubic phase is well established (Mitchell and Wallis 1966, Dimmock 1971) and recently a band-structure calculation for the rhombohedral phase has been developed (Bangert 1981).
We present here in a set of three linked papers (hereafter referred to as papers I, I1 and 111) an experimental study of the electronic band structure in Pb,-,Sn,Te using the Shubnikov4e Haas (SDH) effect in a temperature range covering the structural and band inversion transitions. In this first paper we will discuss the orientation dependence of the SDH effect at temperatures below 4.2 K and will compare our results with the published zero-temperature band-structure calculations of Bangert (1 98 1).
0305-4608/85/0203 17 + 20S02.25 0 1985 The Institute of Physics 317

318 He Yusheng and A D C Grassie
2. Experimental procedure
2.1. Sample preparation
The growth process consisted of preparing a polycrystalline alloy of Pb,-,Sn,Te of typically 6-10 g in mass which was then powdered and subjected to a seedless vapour- phase transport process to produce material with large crystalline grains. Parallelepiped needles were cut from these grains by spark erosion with typical dimensions 2.0 x 0.5 x 0.5 mm and were subsequently etched in HBr + 5% Br2 to remove surface damage. The carrier concentrations in the as-grown crystals with x in the range 0.3-0.4 were p type in the range 1019 ~ m - ~ . These concentrations could be reduced by annealing the needles, or more usually crystalline wafers, from the host material in the presence of metal-rich ingots with the same tin composition, i.e. (Pb,-,Sn,), +gTe,-g where 0 < 6 < 0.02. The annealing was carried out at 600 “C or below for a period of 20-40 d and the minimum carrier concentration achieved was 9.1 x 10’’ Standard six-probe contact was made to the needles by soldering thin gold wires, of diameter 0.0254 mm, to the sample by small indium dots using lactic acid as a flux. Alloy compositions were checked by wet chemical analysis after the growth of the host crystal.
The macroscopic homogeneity of the samples regarding carrier concentration ( p ) and resistivity ( p ) was then checked on the two pairs of voltage probes. The sample inhomogeneity was found to be less than 10% in bo thp and p. Some of the crystals used in this work (L32 samples) were supplied by Dr Kobayashi of the Hitachi Research Laboratories, Japan, and were grown by a solution growth technique (Kobayashi et a1 1978). The carrier concentrations of the samples were determined by conventional weak- field Hall-effect measurements and were corrected by a Hall correction factor r as p=r/R,e. Allgaier ( 1 9 8 1 ) showed that, in the degenerate limit, the Hall factor for an ellipsoidal multi-valley model is
r = 3K(K + 2)/(2K + 1)*
where K is the anisotropy factor (see 9 4 for definition). For our sample H32 [ 1101 we have K = 10.5 (see table 3 ) ; thus r=0.81. We have used this value of r for all our samples. Details of the alloy composition ( x ) and carrier concentration ( p ) of the samples studied are given in table 1 along with the orientation of the needle axes, the structural phase transition temperature T, and the band inversion temperature Tb . The values of T, and Tb were derived from anomalies in the temperature dependence of the resistivity and the weak- field Hall coefficient (Kobayashi et a1 1979). The question of whether T, can be less than T, in sample L37 is discussed in 8 4.3 of paper 11.
Table 1. Sample characteristics.
Orientation p at 4.2 K Tc T b Sample code of needle axis X (cm-’) (K) (K)
0.32 ( 1 . o r t 0 . 1 ) ~ i o i 9 - - H32 [ 1 I O ] (1101 L32 [OOI] [OOl l 0.32 (1.1 i 0 . 1 ) ~ 10” 38.5 rt0.5 - L32 [ 1101 [ 1101 0.32 (1.1 r t 0 . I ) ~ 10l8 38.5 f 0 . 5 -
M37 [OOl] 1 0.37 (6.2 & 0.5) x 10” 27.2 rt 0.5 35.5 rt 0.5 M37 [ 1 I O ] [1101 0.37 (6.2 rt 0.5) x 10l8 27.2 i 0.5 35.5 rt 0.5 L37 [ 1 IO] [I101 0.37 (9.1 i. 0.9) x l o ” 42.1 rt 0.5 35.5 i OS(?)

Band structure of Pb,-,Sn,Te. I 319
2.2. Measurement process
The SDH oscillations in magnetoresistance were detected using a field-modulation technique with the modulation field of typical amplitude 0.01 T parallel to the quasi-static main magnetic field of up to 6 T supplied by a superconducting solenoid.
For the orientation dependence of the SDH oscillations, the sample was immersed in pumped liquid helium giving a temperature range from 4.2 down to 1.6 K. It could be rotated through 200” about the needle axis and was mounted in such a way as to minimise thermal strain on the samples and electrical pick-up in the leads. The orientation of the rotation axis was determined by x-rays before each run to an accuracy of better than 1’ and was checked after each run for possible sample movement.
For measurement of the SDH effect at temperatures above 4.2 K, insufficient space for rotation was available inside the subsidiary cryostat which fitted into the bore of the superconducting solenoid. The samples were therefore mounted in a fixed orientation with the same precautions being taken for thermal strain, noise pick-up and sample movement. To ensure uniform temperature distribution over the sample, a small pressure of helium exchange gas was introduced into the subsidiary cryostat.
Temperatures below 4.2 K were measured from the 4He vapour pressure and above 4.2 K from an Allen Bradley carbon resistor, calibrated by a standard gas thermometer. The temperatures indicated by the carbon resistor and the gas thermometer were also compared with those deduced directly from the vapour pressure of 4 H e and N, and good agreement was obtained. Even at temperatures above 50 K, the error in temperature was found to be less than 0.2 K. The magnetic field sensitivity of the carbon resistor was carefully examined in fields up to 6 T but no observable change was found and the stability of temperature achieved using the carbon resistor as the temperature sensor was better than 0.5% of the recorded temperature.
In the studies carried out at elevated temperature, temperature-dependent phase shifts between the field of the modulating coil external to the hot cryostat and the field detected by the samples due to the temperature-dependent resistance of the cryostat walls were observed and were suitably corrected for. The detected SDH signal was recorded in digital form for subsequent Fourier analysis.
2.3. The two-window Fourier transform (TWFT) technique
A Fourier transform is required to obtain the SDH frequencies from the magnetoresistance oscillations. Unfortunately in this work the very low SDH frequencies ( F ) and appreciable Dingle temperatures (TD) (F- 7 T and TD - 7-15 K for low-concentration samples) meant that only a few oscillations were observable even at 4.2 K. Furthermore, in the rhombohedral phase, the distorted Fermi surface and complicated domain structure produced about a dozen frequencies, some of the components being less than 5% of the strongest component, and this made analysis very difficult. The conventional ‘discrete Fourier transform’ and ‘fast Fourier transform’ methods were found to give an inadequately accurate and complete spectrum of the SDH frequencies. For this study, we developed a ‘two-window Fourier transform’ technique which is more able to detect components with weaker strength and to resolve neighbouring components of similar strength, and also has a better accuracy of the frequency determination.
By necessity, each observed signal which we process must be of finite extent. During the process of Fourier transformation, the periodic extension of such a finite signal, usually not commensurate with its natural period, exhibits discontinuities at the boundaries of

320 He Yusheng and A D C Grassie
observation. These discontinuities are responsible for spectral leakage in the form of side lobes. Weighting function windows are applied to data to reduce the spectral leakage by reducing the order of the discontinuity at the boundary of the periodic extension. This periodic extension is accomplished by matching as many orders of derivative of the weighted data as possible at the boundary and in this way the detectability is greatly improved. On the other hand, the transformation of weighted data is equivalent to the convolution of two transforms, which can have the effect of reducing the resolvability of neighbouring components of similar strength. In order to increase the resolvability, a window in which the main lobe of the transform has a very narrow bandwidth is required. Unfortunately, this in its turn means a broadened window and hence high side-lobe level and therefore low detectability. These contradictory requirements of window functions led us to the idea of performing Fourier transforms twice for each set of data by using two different windows which fit the different requirements and hence achieve higher detectability and resolvability and better accuracy.
In choosing suitable forms for the two windows, a pSeUdO-SDH testing signal was generated in the computer using parameters for amplitude, frequency and phase which were typical of our samples along with an added non-linear background. The window function which gave the best quality reproduction of the input parameters was found to be the Kaiser-Bessel window function (Harris 1978) which is defined as
where
The transform is approximately that of
No sinh{[n2a2 -(N8/2)2]1’2} Io(na) [n’a2 -(NO/2)2]1’2 *
W(e) = -
The parameter na is half of the time-bandwidth product. Increased a will decrease the width of the window, reducing the severity of the discontinuity at the boundaries and hence the side-lobe levels at the expense of an increased width of the main lobe of the transform. We chose a=2.5 as the first window (the ‘good’ window) and a=0.1 as the second window (the ‘poor’ window).
The resulting input and output spectra are shown in figure 1 . It can clearly be seen that use of the ‘good’ window depresses the side-lobe level well below the main peak levels to a level an order of magnitude lower than that of the weakest SDH component. Thus we achieve high detectability with this window but have poor resolvability. For example, components with a frequency difference of 1-2 T and comparable strengths are missing at F = 2 1 T and 36 T. As a consequence, the error in frequency of nearby components is quite high, of the order of 4%. As a remedial measure, we turn to the ‘poor’ window. Although the side-lobe level is now 100 times higher and all the weakest components are submerged, the resolvability is improved and the merged peaks are well separated. Furthermore, the accuracy in frequency and amplitude is also improved (AF/F < 0.5% for those above side-lobe level). Combining the results from the two windows with careful

Band structure of Pb, -,Sn,Te. I 321
1 0 2 3 4 5
Magnetic field (T)
Frequency ( T I
0 20 FrequencylT)
0 20 40 60 80 Frequency ( T I
Figure I . (a) Pseudo-sDH testing signal; (6 ) the spectrum of the pSeudO-SDH testing signal; (c ) the Fourier transform of the testing signal using the ‘two-window’ technique with a ‘good’ window: ( d ) the Fourier transform of the testing signal using a ‘poor’ window.
analysis, the whole spectrum of the testing signal was re-obtained with an error in frequency less than 0.5%.
3. The band structure of Pbl --x Sn, Te in the cubic and rhombohedral phases
Pb, -, Sn,Te and other IV-VI compounds are well known narrow-gap semiconductors, characterised by having an energy gap less than 0.5 eV. It can be shown that in such a case the interactions between different levels involved in the band structure are small except those from the conduction and valence bands. Using the k . p method leads to a simple two-band Kane model (Kane 1957) in which the assumption of an ellipsoidal band structure gives an energy-momentum relationship
E(E + E , ) = Q:k: + Q,’kf (1) where Q, and Q, are the direct transverse and longitudinal valence-conduction-band interactions and the coordinate system has been taken with the z axis parallel to the ( 11 1) direction of the cubic crystal.

322 He Yusheng and A D C Grassie
Actually, in the vicinity of the Fermi level for these IV-VI compounds, there are six levels clustered in a spread of 3 eV, while the nearest other levels with non-zero k . p matrix elements lie about 8 eV from the Fermi level (Bauer 1980). The consequence is that a six- band model is necessary for an improved k - p calculation (Mitchell and Wallis 1966, Dimmock 1971). Dimmock showed that in the cubic phase the energy-momentum relationship for Pb,-,Sn,Te can be expressed as
(E - A k: - Bk:)(E + E, - Ck: - Dk:) = Q: kf + Q: k j (2)
where A , B, C and D are contributions from the four non-direct conduction and valence bands, while Q,, Q, and the coordinate system are the same as those in the Kane model of equation (1).
The energy gap Eg , defined as E(L,; ) - E(L& ) in the symbolism of Mitchell and Wallis (1966), was taken by Dimmock to vary linearly with x across the alloy system, but an improved fit using a quadratic term (Kawamura et a1 1978) has been used in our analysis. Band inversion is included in this model by allowing the energy gaps to take negative values. The result of these calculations is that there are four equivalent valleys at the point L of the cubic Brillouin zone which show strong non-parabolicity.
Bangert (1 98 1) considered the modifications to the Dimmock model which are necessary to take into account the rhombohedral distortion at the structural phase transition. The four equivalent valleys at the L points of the cubic Brillouin zone split into a single T valley and three equivalent L valleys. The symmetry of the conduction and the valence band states is reduced from D3, to C3, for the T points of the rhombohedral Brillouin zone and to C, for the L points. The structure of the bands in the rhombohedral phase was obtained by changing the lattice periodic potential
V(r) = Vo (r) + V’(r) (3) where V,(r) is the lattice potential in the cubic phase. V’(r), of C3” symmetry, accounted for the distortion related to the sublattice shift U. For the calculation of the E(k) relationship at the T points, V’(r) was added to the cubic one-electron Hamiltonian H , . The resulting energy-momentum relationship for the T point valley was found to be
(4) where n = k 1 for the two ‘spin’ states (Kramers conjugate pair), A , B , C, D and Q, were the same parameters as applied in the cubic phase while QL differed from the corresponding Q, of equation (2) for the cubic phase. This difference will be discussed in detail in paper 11. For the parameters E, and S, Bangert showed that
(E - A k f - B k f + nSk, )(E + E, - Ck: - Dkf - nSk, ) = Qf k: + Q: kt
E, =(Elc + 4A2)’I2 S- Q, sin 28 tan 28- 2A/E,,
where E,, is the energy gap in the cubic phase and A is the matrix element of the lattice potential V’(r) between the conduction and valence band states.
The term involving S characterised the C,, distortion symmetry and was linear in k, because it originated from a breaking of the inversion symmetry of the cubic phase. Since A is zero in the cubic phase, the Bangert model of equation (4) can be seen to be in agreement with the Dimmock model of equation (2) in this regime.
At the L point of the rhombohedral Brillouin zone, the group of the k vectors is C, with one reflection as the single non-trivial symmetry operation. A special case of the E(k) relation is identical to equation (4) but with the I coordinate no longer normal to the face of

Band structure of Pb, -,Sn,Te. I
5 k*
323
5 k.
- 5 1 v a l l e y
- 5 L v a l l e y
Figure 2. The Fermi surface of Pbo68Sn,,~2Te f o r p = 1.1 x 10l8 cm-3 in the rhombohedral phase. The full curves (the + or outer surfaces) and the broken curves (the - or inner surfaces) represent carriers in different ‘spin’ states. For the T valley k , parallels the rhombohedral c axis, but for the L valley k , is not normal to the face of the Brillouin zone. k: = k: + k;, i.e. all surfaces have axial symmetry about k, . The unit of k , and ki is io6 cm-‘ .
the Brillouin zone. In our band-structure calculations we will use this special case as a first- order approximation.
The actual shape of the Fermi surface predicted by Bangert’s model will be needed when we come to compare our SDH data with this calculation. At the T point, the term & Ski has the effect of modifying the single ellipsoid of the Dimmock model as in figure 2, yielding two surfaces-an outer ‘skin’ (T’) and an inner ‘core’ (T-) of an apple-like object. Furthermore, in the case of the L points, we will expect to see a similar pair of surfaces tilted from the normal to the Brillouin zone at L (L+ and L-).
4. Fermi surfaces of Pbl -, Sn, Te in the cubic phase
The frequencies obtained from the Fourier analysis of the SDH data for samples H32 [ 1 101 at all orientations measured with the magnetic field in the (1 10) plane are shown in figure 3. The full curves in this figure are calculated from the Dimmock model (equation (2)) while the broken curves are calculated from the Kane model (equation (I)). Band parameters from these fitting procedures are listed in table 2, where the band gap is taken to be (Kawamura et a1 1978)
E, = 187.0- 54.3 x + 2.0 x2.
Since the data are in reasonable agreement with frequencies calculated for the ellipsoid-of- revolution model (the Kane model) we can compute the length of the semimajor axis of the elliptical extrema1 cross section from
A nk, kL = ~ ‘ ” A / { f , l kL (6)
324 He Yusheng and A D C Grassie
L I , I 2 0 LO 60 80 - 100 120 1LO 160
1001 1 [ I101 l o o i l O r i e n t a t i o n [deg)
Figure 3. Frequencies obtained from Fourier analysis of the SDH data for sample H32 [ 1101 for each orientation of the magnetic field. The full curves were obtained from the six-band Dimmock model and the broken ones from the two-band Kane model.
where A is the area of any extremal cross section, A l l l l l is the extremal area for B parallel to [ 11 11, k , is the semimajor axis and k , is the semiminor axis. A polar plot of kL against the angle between the magnetic field and the [ 11 11 axis will map the shape of the Fermi surface and is shown in figure 4. The points in figure 4 are experimental data, recomputed by equation (6) , and the broken curves are from the Kane model. For comparison, the Fermi surface computed from the Dimmock model is shown in the same figure by full curves. It can be seen that although an ellipsoidal Kane model can be employed to describe the Fermi surface of Pbl -,Sn,Te (x=0.32) for p up to 10'' ~ m - ~ , the six-band Dimmock model gives a more accurate picture of the Fermi-surface shape.
Before turning to a detailed comparison of the experimental data and the theoretical curves, let us consider certain questions of the theory first to see what can be derived from those models.
The Kane two-band model, which takes account of interaction between only the conduction and valence bands, can be treated as a simplified Dimmock model with A = B = C = D = 0. This dispersion relation (equation (1)) can be rewritten as
Qt k,"
Table 2. Band parameters obtained from the fitting in figure 3. A , B , C and D are in units of I O - ' * meV cm2, Q, and Q, in meV cm and E , and E , in meV.
Model A B C D Q, Qz EF E ,
Kane (two-band) 0 0 0 0 47.6 15.3 131.6 13.44 Dimmock(six-band) 6.06 0.721 -4.11 -0.377 47.6 15.3 130 13.44

Band structure of Pb, -,Sn,Te. I 325
5 k l
4 -1 0 10
-5
Figure 4. Fermi surface of Pb0.68Sno,32Te for p = 1.0 x IO” c r C 3 . The points are experimental data, recomputed using equation (6). The full curves were obtained from the Dimmock model and the broken ones from the Kane model. The unit of k is lo6 cm-I.
This equation implies that the surface of constant energy in the Kane model is ellipsoidal. It is not difficult to derive the effective masses my, l l as
m;,1, =m01,,1(1 + 2E, /E, )
where
are the effective masses at the bottom of the band. There has been some confusion in defining the anisotropy ratio factor, which is often used to characterise a spheroidal constant energy surface. The original definition is K , = m,r/mr. Unfortunately, the longitudinal and transverse masses, mlf and m;, at the Fermi surface are not separately accessible. Thus another anisotropy factor K of the quantum oscillation mass is defined as the square of the ratio of maximum to minimum cross-sectional areas of the Fermi surface. In the ellipsoidal non-parabolic Kane model, we have
K , = m* mr = m0 / I / mo I - - ( Q i / Q z ) ’
K = 11 /
/Amin l2 = (QI /Q, Y and the two definitions are exactly the same.
volumes of the four equivalent ellipsoids, giving The carrier concentration p can be easily calculated in the Kane model from the
4 [ E F E g ( 1 + EF )13’2 3n2Q2 Q, P =
for p-type materials. In the Dimmock model the interactions of the nearest valence and conduction bands
are taken into account exactly and the interactions with more remote bands are included by second-order perturbation theory. The dispersion relation is given by equation ( 2 ) and from it we can obtain the transverse effective mass mr at the Fermi surface:
h2E,( 1 + 2E, /E, ) + L1 2Q: +L2
m; =

326 He Yusheng and A D C Grassie
with
L , =(A + C)kgh2
and
L , = 2(A + C)EF + 2AE, - 4ACk:.
The explicit analytical expressions for K and p are much more complicated and we have used numerical computation to obtain accurate values o f p and K.
In summary, there are three characteristic physical properties which can be used to examine our models-m*, p and K . We will discuss m* in paper I1 and will concentrate here on p and K , which determine the size and shape of the Fermi surface.
We list the experimental results of K , from the SDH effect, and of p , from the low-field Hall coefficient, together with the calculated values in table 3. It can be seen that both calculated values are within the experimental error. This implies that the descriptions of the shape and size of the Fermi surface by both models are reasonably good, which is evident from the similarity of fit in figure 4, although the Dimmock model seems to be more accurate. Hence six parameters (A, B, C, D, Q, and Q,) are obtained. The most important of these (Q, and Q,), common to the Kane and Dimmock models, are determined from the observed anisotropy factor and the carrier concentration. The others (A, B, C and D) are of lesser importance and vary from finite values for the Dimmock model to zero for the Kane model.
In table 4 we list the Dimmock model parameters from previous studies. Comparing the other sets of parameters and considering that the experimental errors in such experiments are relatively large, the parameters we have chosen are in reasonable agreement.
An exact mirror symmetry between conduction and valence bands holds in the Kane model, but in the Dimmock model asymmetric behaviour is obtained. This is the main difference between the two models, resulting in discrepancies in describing Fermi-surface properties, e.g. the dependence of the effective mass m* on the energy gap or temperature, to be discussed in paper 11.
5. Fermi surface of Pb, --x Sn, Te in the rhombohedral phase
The angular dependence of the SDH oscillations in the rhombohedral phase has been measured. The four samples studied were L32 [OOl], L32 [ 1 101, M37 [OOI] and M37 [ 1 IO] , the latter two samples exhibiting band inversion.
Table 3. Comparison of experimental results and theoretical models of the Fermi surface of sample H32 [ 1 IO].
p(10" ~ m - ~ ) K Km
Experiment Sample H32 [ 1 I O ] I O + 1 10.5 + 0.8 -
Theory Kane model 10.27 9.68 9.68 Dimmock model 10.26 10.61 10.94

Band structure of Pb, -,Sn,Te. I 321

328 He Yusheng and A D C Grassie
5.60.
5.58- 0.0161
( b ) 0 L37 I1101 o M37 [I101
0014- - 5 ,c 0012
z "r 0010-
, a
c L" a 0008-
0006
0 004 1 3 I
10 20 30 40 50 60 Temperature ( K l
0
@* -
m a o -
D o o n o M37 [I101 ~
5.56.
5.54.
I
m
E U 01)
= % l o 0.82 "
0.80
10 20 30 40 50 60 70 80 Temperature (K)
Figure 5 . Temperature dependence of (a) the resistivity p and ( b ) the weak-field Hall coefficient R, of samples M37 [ 1 I O ] and L37 [ 1 lo]. The arrows indicate T, and T,.
The structural phase transition temperatures were determined from anomalies in the resistivity and weak-field Hall coefficient, an example being shown in figure 5 , and the existence of the distorted phase was confirmed by the complex character of the SDH oscillations shown in figure 6(a). The band inversion present in the M37 samples was confirmed by measurement of the band inversion temperature from anomalies in the Hall coefficient (figure 5(6)). It is important to point out that, in figure 5 , the two samples used were cut side by side from the same single crystal. One sample (L37) was then annealed at 550 "C for about 30 days. It can be seen clearly from figure 5(a) that after 30 days' annealing, the structural transition temperature has increased from 27.2 K to 42.1 K, identified by the arrows, as a result of the reduction in carrier concentration. Two anomalies are apparent in the temperature dependence of the Hall coefficient R , . Comparing the two curves in figure 5(b) , we see that one anomaly had moved to higher temperatures after annealing whilst the other stayed at the same temperature. This observation indicates that the temperature corresponding to the anomaly which changed must be T, . which depends on carrier concentration, and that the band inversion temperature T, corresponded to the unchanged anomaly.
Attempts have been made to interpret the temperature dependence of the Hall coefficient by taking into account the changes in the band structure due to both the phase transition and the band inversion, assuming that the band edge structure changes with varying temperature (Kobayashi et a1 1979). It is well established that the valence band of PbTe, Pb,-,Sn,Te and SnTe is formed by two overlapping sub-bands with different densities of states. It has also been shown that the band edges, situated at L and Z respectively, are separated by an energy gap hE and that the light-hole sub-hand lies at higher energies. Experimental results for Pb, -, Sn,Te revealed that the energy separation between the edges of the conduction band and the second valence band, E, + AE, varies

Band structure of Pb, -.Sn,Te. I 329
0 2.0 2.5 3.0 3.5 4.0 4.5 5.0 5.5
Magnetic field (T I
Frequency ( T I
08-
I I
0 6-
0 4 -
0 2 -
,' , 0 20 40 60 80 100
Frequency ( T I
Figure 6. (a) Typical trace of SDH oscillations in the rhombohedral phase. Sample M37 [ 1001, T=4.2 K, 8= 114". (b) 'Two-window' Fourier transform of the oscillations in ( a ) using a 'good' window. (c ) 'Two-window' Fourier transform of the oscillations in ( a ) using a 'poor' window.
from 0.34 to 0.15 eV as x changes from 0 to 0.28 (Hoerstel and Herrmann 1980). For SnTe, AE(77 K)!x0.3 eV and dAE/dTz-2 .5 x eV K-' (Andreev 1967). Considering the existence of the second valence band, the carrier redistribution between the main L and the subsidiary C valleys with increasing temperature could change the Hall coefficient drastically.
The gradual increase of R H at temperatures above T, in figure 5(b) has already been observed in SnTe (Andreev 1967) and was interpreted in terms of a two-mobility model. The increase of R, below T, can also be understood within the same two-mobility model. Below T,, the cubic symmetry of the crystal is broken and the crystal lattice is distorted, giving rise to an energy shift of both L (or T) and C valleys.
The actual amount of the energy shifts depends on the deformation potential which will differ for the L (or T) and C valleys. This would alter the temperature dependence of the energy differences between the valleys, which would lead to an increase of the Hall coefficient at low temperatures.

330 He Yusheng and A D C Grassie
0
I I , I 20 40 60 80 100 120 140 160
I l O O l [ O I O I 1700 1 Orientation Ideg)
Figure 7. SDH frequencies for rotation of E in the (001) plane of samples L32 [OOI]. The full curves are calculated from the Bangert model and the short broken ones arise from the domain structure, showing clear reflection symmetry. The long broken curves are harmonics of the SDH frequencies.
The complex configurations of the oscillations in figure 6(a) is not surprising. From symmetry consideration and band-structure calculations, in the distorted (C3v ) phase the four equivalent valleys at the L points split into a single T valley and three equivalent L valleys, with two pieces of Fermi surface (T’ and T- or L’ and L-) associated with each valley on account of the lifting of spin degeneracy due to the absence of inversion symmetry. Thus contributions from all these pieces of the Fermi surface result in such complex oscillations. To disentangle all these contributions, we carefully distinguish true signals from side lobes in the Fourier transform and pick up as many components of the oscillations as possible using our ‘two-window Fourier transform’ technique. Figures 6(b) and (c) show the Fourier spectra of the oscillations in figure 6(a). It can be seen clearly that the true signals exist mainly in the region 15 T < F < 80 T (figure 6(b)) and that more components are obtained by using a flatter window (figure 6(c)).
Figure 7 shows the frequencies obtained in sample L32 [OOl] for rotation of the magnetic field B in the (001) plane of the cubic phase, where the orientation angle 19 is measured from the [ 1001 direction. Four parallel curves can clearly be seen and some of their harmonics are also apparent.
Before attempting to fit these data to Bangert’s predictions, the role of domains in the distorted phase must be considered. These have been observed by scanning electron microscopy in Pb,-,Ge,Te (Jantsch et a1 1981). In the case of field rotation in the (001) plane of the cubic phase, given that the sublattice displacement can be along any of the ( 1 1 1 ) directions, one expects to see reflection symmetry between the SDH patterns observed from the domain structure and this is indeed found.
The full curves in figure 7 represent the angular variation of the cross-sectional areas calculated from the Bangert model for the parameters in table 5 . It is important to note that the values of A , B, C, D and Qz are taken to be the same as those derived from the data on the cubic phase of sample H32. The short broken curves represent the contributions of

Band structure of Pb,-,Sn,Te. I 33 1
Table 5. Fitted parameters of the Bangert model. A=6.06, 8=0.721, C=-4.11, D=-0.377 (all in units of IO- '* meV cm'), Q, = 15.3 x meV cm.
dE P S Q: Sample (mev) (mev) (mev) (deg) meV cm) meV cm)
E,
L32 [OOI] 28 49.1 6.5 15 20 L32 [ 1 IO] 28 50.0 6.5 15 20 M37 [OOl] - 10 100.6 5 15 18 M37[110] -10 100.7 5 15 18
43.2 43.2 43 43
other domain configurations and the long broken curves are harmonics. Confirmation of this identification of frequencies was obtained at an even more complex level by fitting the data obtained for rotation of B in the (1 10) plane of the cubic phase, when three different domain configurations contribute to the data. The Fermi-surface shape shown in figure 2 was in fact calculated using the parameters derived from the L32 sample at the relevant carrier concentration.
A rotation diagram is shown in figure 8 for sample M37 [OOl] in which band inversion has taken place. The fitted curves are deduced from Bangert's model, calculated for a negative energy gap as discussed in 0 3. It is worth noting, in comparing figures 7 and 8, that there appears to be one branch missing in the experimental data of samples M37 [OOl ] near the minima of the SDH frequencies at 8=45" and 135". This can be interpreted as indicating that the minimum areas of the L and T surfaces are so close that their corresponding SDH frequencies cannot be distinguished by our Fourier transform technique. Thus only one frequency appears in the spectrum. It can be seen that the gaps between L; and L; and between T' and T- in figure 8 are much smaller than those in
L 1 , I 11001 iOl01 [1001
20 40 60 80 100 120 140 160
Orientat ion ldegi
Figure 8. SDH frequencies for rotation o f B in the (001) plane of samples M37 [ O O l ] . The full curves are calculated from the Bangert model and the broken ones arise from the domain structure, showing clear reflection symmetry.

332 He Yusheng and A D C Grassie
Table 6. Carrier redistribution in the distorted phase (in units of cm-’). ___
Sample p(T’) p(T-) p(L’) p(L-) Totalp pf rom Halleffect
L32 0.223 0.110 0.164 0.080 1.07 1.1 *O. l M37 0.990 0.647 0.848 0.569 5.89 6.2 + 0.5
figure 7, which implied that the carrier redistributions (the size of the inner and outer surfaces) are quite different between the cases with normal (L32) and inverted (M37) band ordering. We will discuss this later.
The carrier redistribution in the distorted phase can now be deduced and the calculated values are listed in table 6. The experimental values as measured by the weak-field Hall effect are also listed. It can be seen that the agreement between calculation and experiment is quite good.
Two additional parameters, d E = EF(T) - E,(L) and p, the tilt angle of the L ‘apples’ towards T, have been derived in addition to the parameters A , B , C, D and Q, . Hence we are working with five parameters fixed from the cubic phase and a further six (EF , dE, p, S, E, and Q:) determined from the fit to the SDH frequencies observed in the distorted phase.
With regard to EF and dE, it can be seen from the experimental results of figures 7 and 8 that the extrema1 areas of the T ‘apples’ are greater than those of the L ‘apples’, suggesting that the Fermi energy of the L valley measured from the band edge is smaller than that of the T valley for the p-type materials. Thus we have EF(T)= EF(L) + dE. The relative shift d E has been fitted to be 6.5 and 5 meV for samples L32 and M37 respectively, and can be explained by the rhombohedral strain E which lowers the valence band edge at the L point relative to that at the T point after the structural phase transitions. The scheme of energy levels is illustrated in figure 9 and is consistent with the model proposed by Murase (1 980), who had a smaller Fermi surface at the T (singlet) valley for n-type Pb, -xGe,Te, which implied a smaller Fermi energy at the T valley measured from the band edge for the conduction band. Obviously, the parameter E, determines the size of the Fermi surface (the total carrier concentration) and also affects the shape of the Fermi surface. The parameter d E determines the carrier redistribution between the T and the L ‘apple’ surfaces.
Figure 9. Illustration of the energy levels near the L and T points in p-type Pbl-,Sn,Te in the rhombohedral phase. The four valleys have split into three equivalent L valleys and a single T valley. The relative shifts of the Fermi levels as measured from the band edge between T and L are shown as dE=EF(T)-EF(L).

Band structure of Pb, -,Sn,Te. I 333
With regard to the tilt of the L ‘apples’, /3, equation (4) is deduced from C,, symmetry, i.e. for the T valley only. For the lower symmetry points (e.g. the L valley with C, symmetry) the most general k . p matrix is given by Bangert (1983):
where
We do not wish to develop such a complicated equation here, but it is worth mentioning that the parameters A , and B, will have the effect of tilting the ‘apple’ axis away from the cubic ( 11 1) axis, which is exactly what we have seen in the experimental results. A , , A , , B , and B , will shift the centre of the Fermi surface somewhat away from the L point. Furthermore, if A , # A , , B , # B , and Q , # Q 2 there will no longer be cylindrical symmetry of the Fermi surface. As a simplification, we have ignored all these complications and have assumed that the Fermi surface in the L valley has the same shape as that in the T valley but tilts with a certain angle (p ) towards T. It can be seen that the model with this assumption is consistent with the experimental results and we obtain a tilt angleP= 15’ for both samples M37 and L32.
In 0 3 we saw that S is a key parameter in the Bangert model, being related directly to the lattice distortion and reflecting the lifting of the spin degeneracy of the bands. In order to appreciate more clearly this important role played by S in the distorted band structure, several dispersion curves of the valence band have been plotted in figure 10. For convenience, we have inverted the band in this figure, setting E(k)= -Ev(k), and have shifted the zero to the bottom of the band, i.e. E(O)=O. It can be seen from figure 10(a) that two remarkable changes of the dispersion curves occur as S increases with Eg fixed. The first is the non-parabolic behaviour. For the case of small S , say S = 2 x l o p 6 meV cm, the dispersion curves show approximately parabolic behaviour but as S increases the minimum position of the full curves (the ‘skin’ of the ‘apple’) shifts away from k=O and warping of the full curves occurs. A change of curvature in the broken curves (the ‘core’) is also apparent. It can be seen that the bigger S is, the more non- parabolicity the curves show, and hence the more distortion appears in the shape of the Fermi surface. The second change is the difference between the full curves ( E + ( k ) , corresponding to n = + 1 in equation (4)) and the broken curves (E- (k), corresponding to n=-1). Defining 6 E ( k ) = E - ( k ) - E ’ ( k ) , for S=O, 6E(k)=O and the two curves are degenerate, corresponding to the cubic phase. As S increases, 6E(k) increases and hence at certain energy levels, such as the Fermi energy, 6 k F ( E ) = kF+ ( E ) - k; ( E ) increases. Such a change means that the relative size of the outer ‘skin’ Fermi surface gets bigger and bigger as the inner ‘core’ gets smaller and smaller with increasing S , and this is directly related to the carrier redistribution. Two such remarkable changes can also be seen in figure 10(b) for

334 He Yusheng and A D C Grassie
(a1 E , = 20 meV
0 1 2 kL 0 1 2 k, 0 1 2 kl
s=2 0 5 = 20 5 :LO
(bl E g : - 1 0 meV
0 1 2 kl 0 1
s s i . a 5-= 1 8 5: 36
75
50 5 0
,
E 5
25 25 I
0 1 2 ki 0 1 2 ki 0 1 2 kl E - - 2 O m e V E g = - 3 0 meV E 9 = - L 0 meV Q -
Figure IO. Dispersion curves for the valence band of Pbl-,Sn,Te. The whole band is inverted for convenience. Parameters, where not mentioned, are taken from table 5 . The broken curves are for n = - I and the full ones for n = 1 in equation (4). S is in units of
meV cm, k A in lo6 meV cm-l and E in meV.
the case of E=-10 meV. In summary, it is clear that, for fixed E, , S dominates the distortion and the relative size of the Fermi surfaces in the rhombohedral phase.
It is worth mentioning here that since S is directly related to the lattice distortion, there must be some relationship between S and the order parameters of the structural phase

Bund structure of Pb,-.Sn,Te. I 335
transition, If S were temperature dependent, figures 10(u) and (b) might give US a hint of the answer to the query: 'How does the Fermi surface change through the phase transition?' This point will be returned to in paper 11.
Comparing figures 10(u) and (b), it can be seen that the main difference is that the two branches cross over at a non-zero k = ko for the case of E, = -10 meV. This difference can be expressed as
for Eg > 0 k > O k = o I E' ( k ) = E - ( k )
E + (k) < E - ( k )
E+ ( k ) = E- ( k ) k=O 1 E + (k) > E - (k) E + (k ) = E - ( k )
It can also be seen that is independent of S (figure lO(b)) but dependent on Eg (figure lO(c)). For the case of E, = - 10 meV and S = 18.0 x meV cm, corresponding to the case of sample M37, we find ko =0.99 x lo6 cm-' , Leapo ~ 0 . 4 4 x lo'* ~ m - ~ . This unique property of the inverted band structure, predicted by the Bangert model, is confirmed by our experimental results on samples M37 [OOl] and M37 [ 1101. Since the carrier concentration of M37 (p=(6.2 * 0.5) x l O ' * ~ m - ~ ) is rather close topo , the outer and inner Fermi surfaces are so close together that the minimum extrema1 area of T- nearly equals the area of L', so that only three branches of SDH frequencies, instead of the expected four, appear in the Fourier spectrum, as shown in figure 8.
Since k , depends on E,, the relative sizes of the Fermi surface are also dependent on E,. It will be shown in paper I11 that the dispersion curves will become flatter and flatter as E, decreases, and the shape of the Fermi surface will be changed drastically. All of this indicates that E, will also affect the shape and the relative sizes of the Fermi surfaces.
In analysing the SDH data, it was found that the choice of a smaller value of Q; for the rhombohedral phase, say 43.2 instead of the 47.6 quoted in table 2 for the cubic phase, had the effect of markedly improving the fit to the experimental results. The different values for S and the slight difference in Qi between samples L32 and M37 will be discussed in 6 3 of paper 111.
In the cubic phase Q, is the dominant parameter in deciding the shape of the Fermi surface, while in the rhombohedral phase, Q; plays a similarly dominant role, together with S and E,, in fixing the shape of the Fermi surface. As the Fermi surface is badly distorted in the rhombohedral phase, an anisotropy factor K is no longer a useful quantity for measuring the shape of the apple-like surface.
6. Conclusions
Our study of Pb,-,Sn,Te in the cubic phase has yielded band-structure parameters in the Dimmock mod4 which are in agreement with values established previously. These parameters also fit the distorted rhombohedral phase when taken in association with the additional parameters of Bangert's model. The role of the band inversion as a function of alloy concentration (x) can be included in this model by invoking a negative energy gap. Energy shifts between the Fermi surfaces centred at the T and L points are evaluated and the tilt of the L ellipsoids is found to derive from the reduced symmetry of the L point as
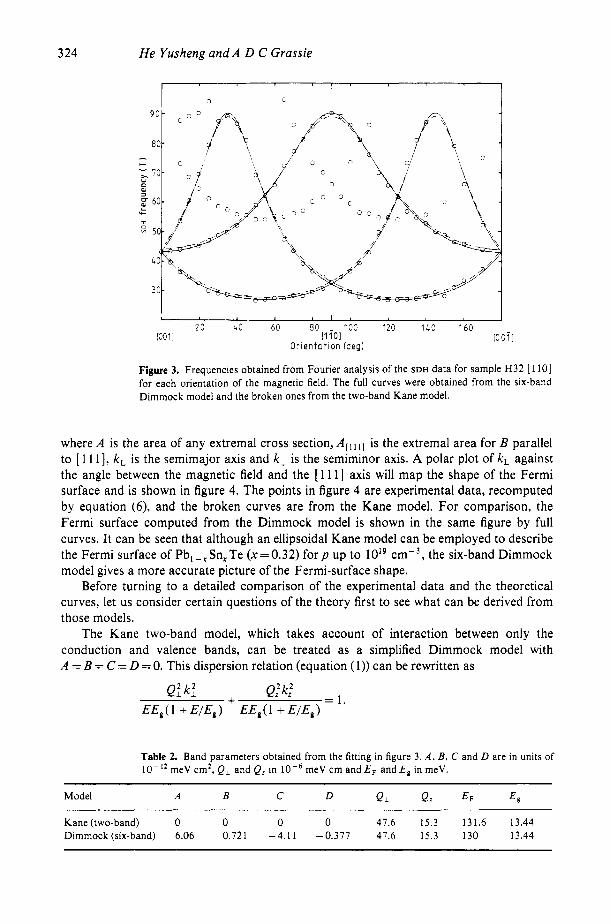
336 He Yusheng and A D C Grassie
compared with that at T. The complex character of the T and L surfaces in the rhombohedral phase is shown to be in agreement with the predicted splitting of the ellipsoids of the cubic phase into the ‘skin’ and ‘core’ of an apple-like composite surface. Evidence is clearly obtained for the existence of domain structure in the rhombohedral phase. Carrier concentrations in the various samples evaluated from the Fermi-surface volumes are found to be in excellent agreement with those measured from the weak-field Hall coefficients, taking into account the anisotropy of the multiple carrier valleys.
Acknowledgments
We wish to thank E Bangert for his helpful advice and generous hospitality, K L I Kobayashi for supplying some samples at an early stage of the investigations, Philips Research Laboratories (Redhill) for carrying out chemical analyses of the samples, and M Springford for informative discussions.
References
Allgaier R S 198 1 The Hall Effect and Its Applications ed. C L Chien and C R Westgate (New York: Plenum)
Andreev A A 1967 Sou. Phys.-Solid State 9 1232 Appold G e t a1 1979 Physics ofSemiconductors 1978 (Inst. Phys. Conf. Ser. 43) p 1101 Bangert E 1981 Physics ofNarrow Gap Semiconductors, Lecture Notes in Physics vol. 152 ed. E Gornik et a1
- 1983 Private communication Bauer G 1980 Narrow Gap Semiconductors, Physics and Applications, Lecture “Votes in Physics vol. 133 ed.
Dimmock J 0 197 1 The Physics of Semimetals and Narrow Gap Semiconductors ed. C L Carter and R T Bate
Dimmock J 0, Melngailis I and Strauss A J 1966 Phys. Rev. Lett. 16 1193 Dmitriev A I et a1 1977 Soc. J . Low Temp. Phys. 3 213 Harris F J 1978 Proc. IEEE 66 5 I Hoerstel W and Herrmann K H 1980 Phys. Status Solidi a 61 425 Ichiguchi T and Murase K 1981 Physics in High Magnetic Fields, Springer Series in Solid State Sciences
Jantsch W et a1 198 1 Ferroelectrics 38 905 Kane E 0 1957 J . Phys. Chem. Solids 1 249 Kawamura H 1980 Narrow Gap Semiconductors. Physics and Applications, Lecture Notes in Ph.wics vol. 133
Kawamura H et a1 1978 The Application of High Magnetic Fields in Semiconductor Physics ed. J F Ryan
Kobayashi K L I et a1 1978 Progress in Crystal Growth and Characterisation 1 117 - 1979 Physics of Semiconductors I978 (Inst. Phys. Conf. Ser. 43) p 441 Mitchell D L and Wallis R F 1966 Phvs. Rev. IS1 581 Murase K 1980 Proc. 15th Int. ConJ on Physics of Semiconductors, Kyoto (J. Phys. Soc. Japan 49 suppl.
p 389
(Berlin: Springer) p 2 16
W Zawadzki (Berlin: Springer) p 427
(New York: Pergamon) p 3 19
vol. 24 (Berlin: Springer) p 249
ed. W Zawadzki (Berlin: Springer) p 470
(Oxford: Clarendon) p 170
A725)