Embed Size (px)
Citation preview

Transmission of material in this release is embargoed until USDL-17-0392 8:30 a.m. (EDT) Friday, April 7, 2017 Technical information:
Household data: (202) 691-6378 • [email protected] • www.bls.gov/cps Establishment data: (202) 691-6555 • [email protected] • www.bls.gov/ces
Media contact: (202) 691-5902 • [email protected]
THE EMPLOYMENT SITUATION — MARCH 2017 The unemployment rate declined to 4.5 percent in March, and total nonfarm payroll employment edged up by 98,000, the U.S. Bureau of Labor Statistics reported today. Employment increased in professional and business services and in mining, while retail trade lost jobs.
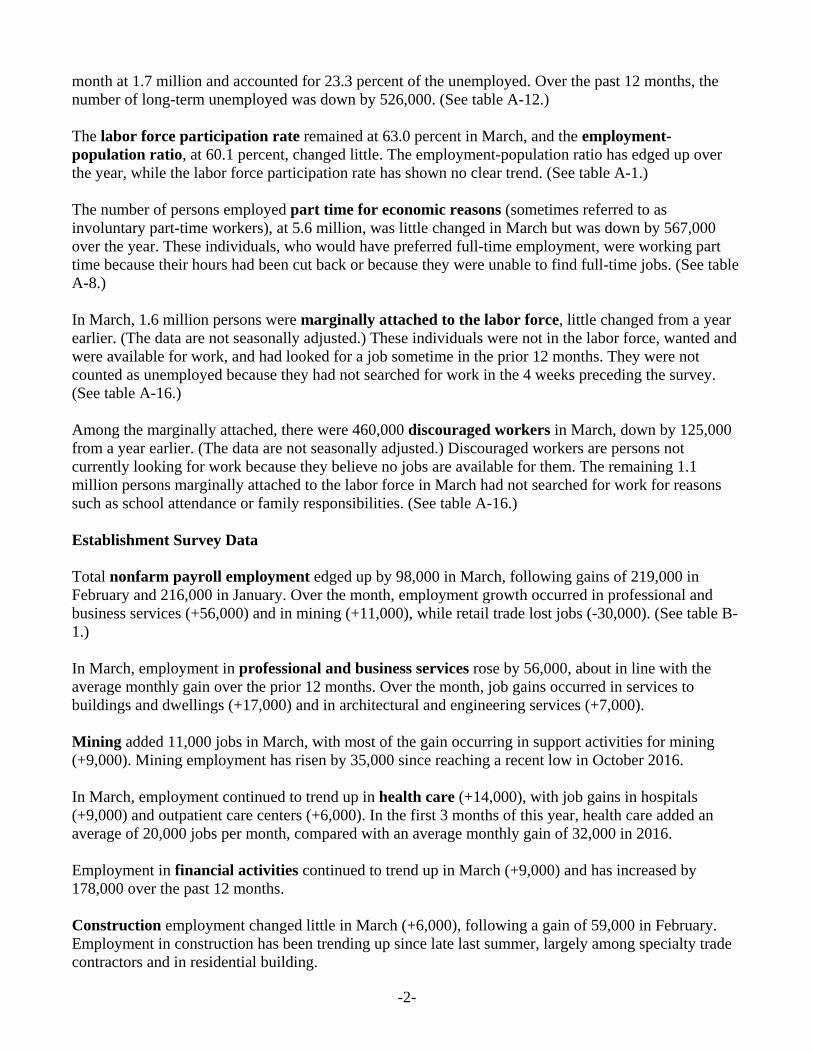
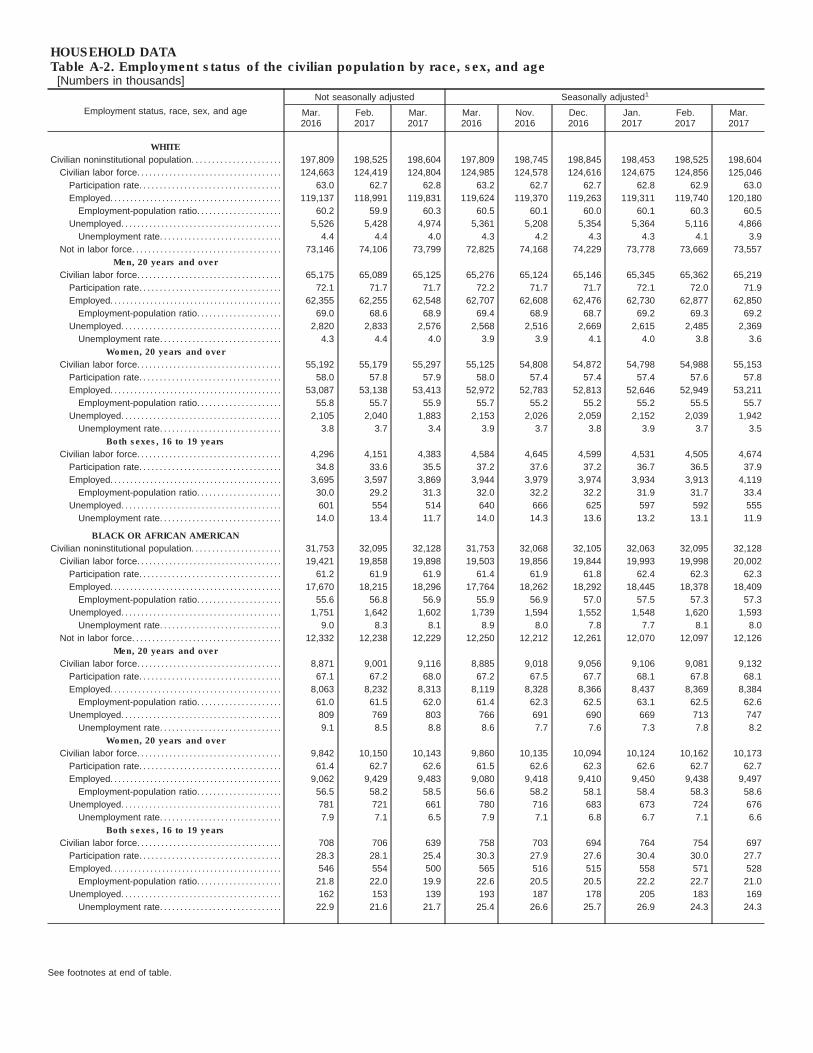
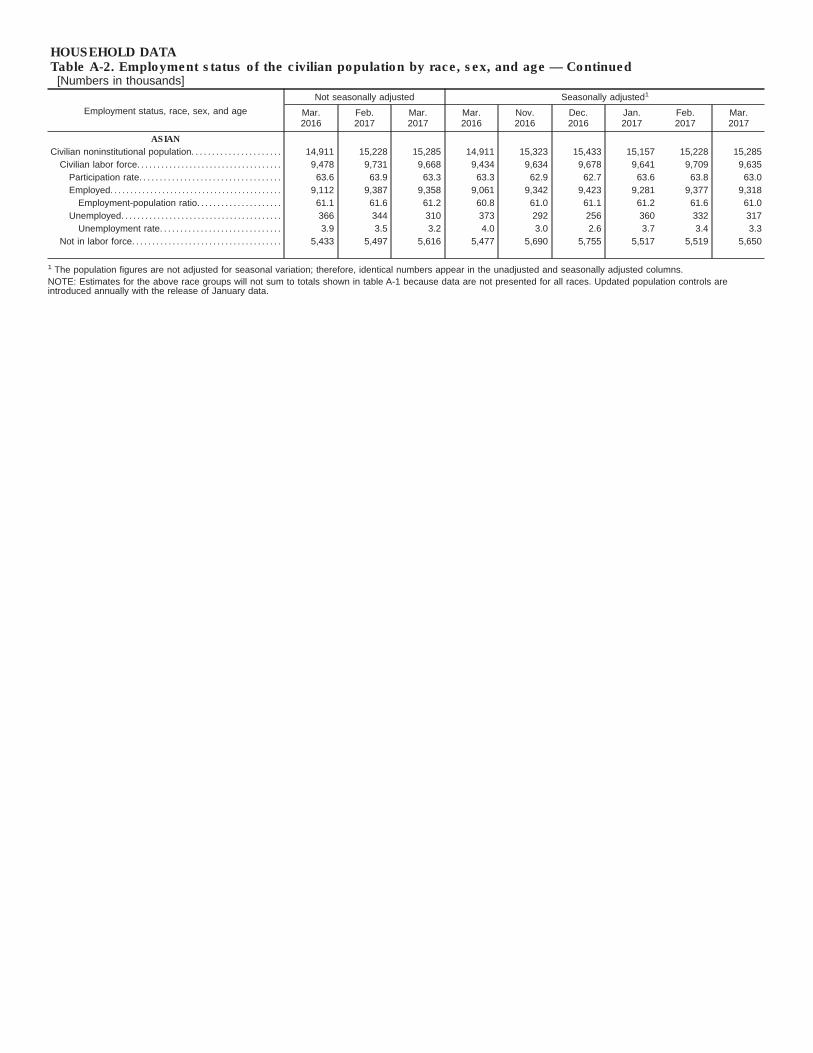
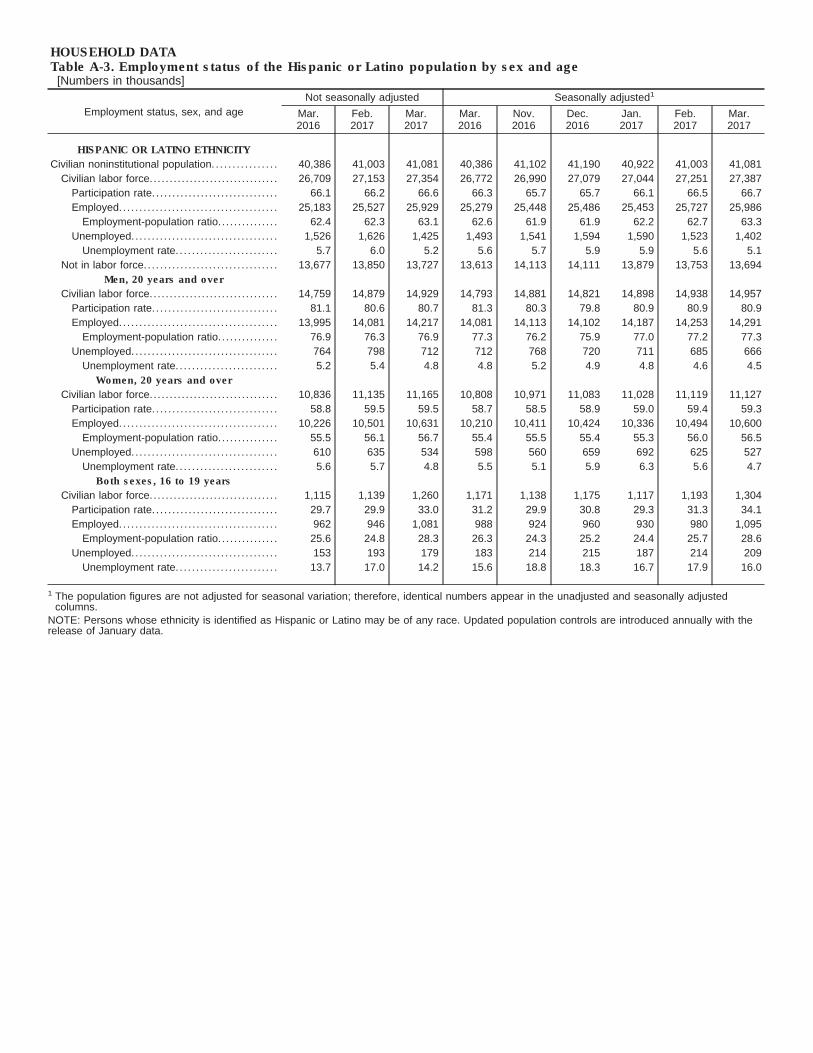
Household Survey Data The unemployment rate decreased by 0.2 percentage point to 4.5 percent in March, and the number of unemployed persons declined by 326,000 to 7.2 million. Both measures were down over the year. (See table A-1.) Among the major worker groups, the unemployment rates for adult women (4.0 percent), Whites (3.9 percent), and Hispanics (5.1 percent) declined in March. The jobless rates for adult men (4.3 percent), teenagers (13.7 percent), Blacks (8.0 percent), and Asians (3.3 percent) showed little or no change. (See tables A-1, A-2, and A-3.) In March, the number of persons unemployed less than 5 weeks declined by 232,000 to 2.3 million. The number of long-term unemployed (those jobless for 27 weeks or more) was little changed over the
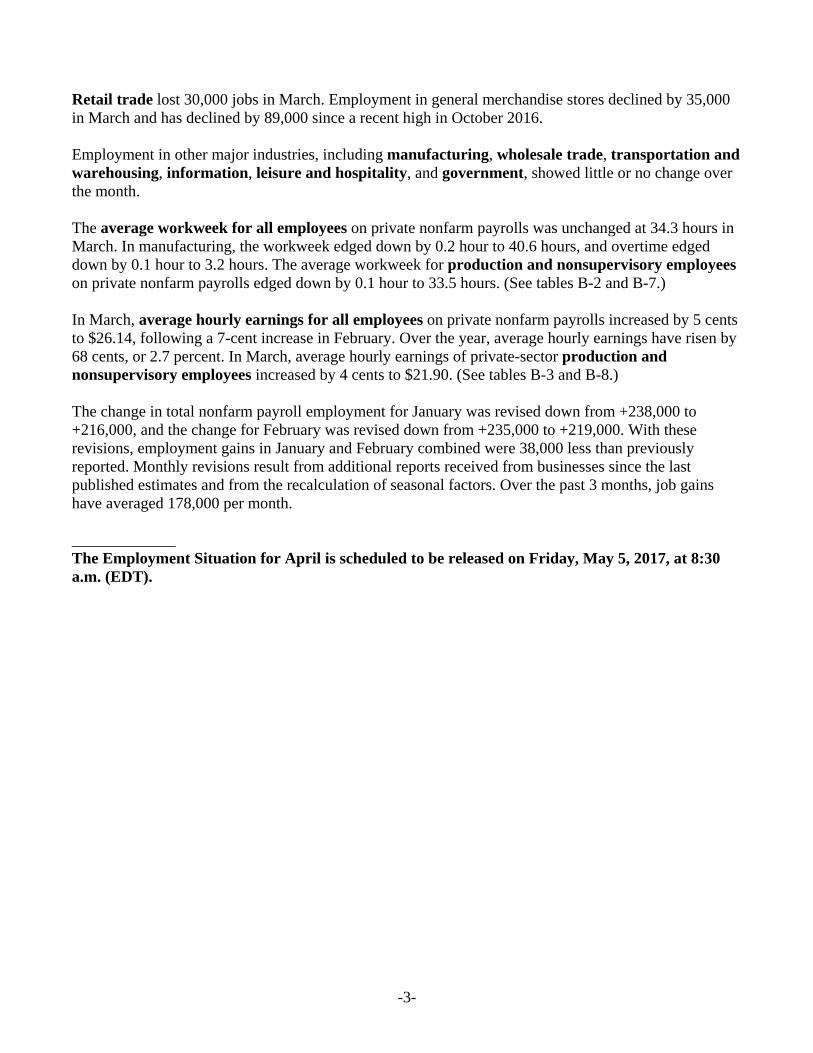
Chart 2. Nonfarm payroll employment over-the-month change, seasonally adjusted,March 2015 – March 2017
ThousandsPercent
3.0
4.0
5.0
6.0
7.0
Mar-15 Jun-15 Sep-15 Dec-15 Mar-16 Jun-16 Sep-16 Dec-16 Mar-17
Chart 1. Unemployment rate, seasonally adjusted, March 2015 – March 2017
-500
50100150200250300350400450
Mar-15 Jun-15 Sep-15 Dec-15 Mar-16 Jun-16 Sep-16 Dec-16 Mar-17
-2-
month at 1.7 million and accounted for 23.3 percent of the unemployed. Over the past 12 months, the number of long-term unemployed was down by 526,000. (See table A-12.) The labor force participation rate remained at 63.0 percent in March, and the employment-population ratio, at 60.1 percent, changed little. The employment-population ratio has edged up over the year, while the labor force participation rate has shown no clear trend. (See table A-1.) The number of persons employed part time for economic reasons (sometimes referred to as involuntary part-time workers), at 5.6 million, was little changed in March but was down by 567,000 over the year. These individuals, who would have preferred full-time employment, were working part time because their hours had been cut back or because they were unable to find full-time jobs. (See table A-8.) In March, 1.6 million persons were marginally attached to the labor force, little changed from a year earlier. (The data are not seasonally adjusted.) These individuals were not in the labor force, wanted and were available for work, and had looked for a job sometime in the prior 12 months. They were not counted as unemployed because they had not searched for work in the 4 weeks preceding the survey. (See table A-16.) Among the marginally attached, there were 460,000 discouraged workers in March, down by 125,000 from a year earlier. (The data are not seasonally adjusted.) Discouraged workers are persons not currently looking for work because they believe no jobs are available for them. The remaining 1.1 million persons marginally attached to the labor force in March had not searched for work for reasons such as school attendance or family responsibilities. (See table A-16.) Establishment Survey Data Total nonfarm payroll employment edged up by 98,000 in March, following gains of 219,000 in February and 216,000 in January. Over the month, employment growth occurred in professional and business services (+56,000) and in mining (+11,000), while retail trade lost jobs (-30,000). (See table B-1.) In March, employment in professional and business services rose by 56,000, about in line with the average monthly gain over the prior 12 months. Over the month, job gains occurred in services to buildings and dwellings (+17,000) and in architectural and engineering services (+7,000). Mining added 11,000 jobs in March, with most of the gain occurring in support activities for mining (+9,000). Mining employment has risen by 35,000 since reaching a recent low in October 2016. In March, employment continued to trend up in health care (+14,000), with job gains in hospitals (+9,000) and outpatient care centers (+6,000). In the first 3 months of this year, health care added an average of 20,000 jobs per month, compared with an average monthly gain of 32,000 in 2016. Employment in financial activities continued to trend up in March (+9,000) and has increased by 178,000 over the past 12 months. Construction employment changed little in March (+6,000), following a gain of 59,000 in February. Employment in construction has been trending up since late last summer, largely among specialty trade contractors and in residential building.
-3-
Retail trade lost 30,000 jobs in March. Employment in general merchandise stores declined by 35,000 in March and has declined by 89,000 since a recent high in October 2016. Employment in other major industries, including manufacturing, wholesale trade, transportation and warehousing, information, leisure and hospitality, and government, showed little or no change over the month. The average workweek for all employees on private nonfarm payrolls was unchanged at 34.3 hours in March. In manufacturing, the workweek edged down by 0.2 hour to 40.6 hours, and overtime edged down by 0.1 hour to 3.2 hours. The average workweek for production and nonsupervisory employees on private nonfarm payrolls edged down by 0.1 hour to 33.5 hours. (See tables B-2 and B-7.) In March, average hourly earnings for all employees on private nonfarm payrolls increased by 5 cents to $26.14, following a 7-cent increase in February. Over the year, average hourly earnings have risen by 68 cents, or 2.7 percent. In March, average hourly earnings of private-sector production and nonsupervisory employees increased by 4 cents to $21.90. (See tables B-3 and B-8.) The change in total nonfarm payroll employment for January was revised down from +238,000 to +216,000, and the change for February was revised down from +235,000 to +219,000. With these revisions, employment gains in January and February combined were 38,000 less than previously reported. Monthly revisions result from additional reports received from businesses since the last published estimates and from the recalculation of seasonal factors. Over the past 3 months, job gains have averaged 178,000 per month. _____________ The Employment Situation for April is scheduled to be released on Friday, May 5, 2017, at 8:30 a.m. (EDT).

HOUSEHOLD DATASummary table A. Household data, seasonally adjusted[Numbers in thousands]
CategoryMar.2016
Jan.2017
Feb.2017
Mar.2017
Change from:Feb. 2017-Mar. 2017
Employment status
Civilian noninstitutional population. . . . . . . . . . . . . . . . . . . . . . . . . . . . . . . . . . . . . . . . . . . 252,768 254,082 254,246 254,414 168
Civilian labor force.. . . . . . . . . . . . . . . . . . . . . . . . . . . . . . . . . . . . . . . . . . . . . . . . . . . . . . . . . . 159,278 159,716 160,056 160,201 145
Participation rate. . . . . . . . . . . . . . . . . . . . . . . . . . . . . . . . . . . . . . . . . . . . . . . . . . . . . . . . . . 63.0 62.9 63.0 63.0 0.0
Employed.. . . . . . . . . . . . . . . . . . . . . . . . . . . . . . . . . . . . . . . . . . . . . . . . . . . . . . . . . . . . . . . . . . 151,301 152,081 152,528 153,000 472
Employment-population ratio. . . . . . . . . . . . . . . . . . . . . . . . . . . . . . . . . . . . . . . . . . 59.9 59.9 60.0 60.1 0.1
Unemployed.. . . . . . . . . . . . . . . . . . . . . . . . . . . . . . . . . . . . . . . . . . . . . . . . . . . . . . . . . . . . . . 7,977 7,635 7,528 7,202 -326
Unemployment rate. . . . . . . . . . . . . . . . . . . . . . . . . . . . . . . . . . . . . . . . . . . . . . . . . . . . 5.0 4.8 4.7 4.5 -0.2
Not in labor force. . . . . . . . . . . . . . . . . . . . . . . . . . . . . . . . . . . . . . . . . . . . . . . . . . . . . . . . . . . . 93,490 94,366 94,190 94,213 23
Unemployment rates
Total, 16 years and over. . . . . . . . . . . . . . . . . . . . . . . . . . . . . . . . . . . . . . . . . . . . . . . . . . . . . . 5.0 4.8 4.7 4.5 -0.2
Adult men (20 years and over). . . . . . . . . . . . . . . . . . . . . . . . . . . . . . . . . . . . . . . . . . . . 4.6 4.4 4.3 4.3 0.0
Adult women (20 years and over). . . . . . . . . . . . . . . . . . . . . . . . . . . . . . . . . . . . . . . . . 4.6 4.4 4.3 4.0 -0.3
Teenagers (16 to 19 years). . . . . . . . . . . . . . . . . . . . . . . . . . . . . . . . . . . . . . . . . . . . . . . . 15.9 15.0 15.0 13.7 -1.3
White. . . . . . . . . . . . . . . . . . . . . . . . . . . . . . . . . . . . . . . . . . . . . . . . . . . . . . . . . . . . . . . . . . . . . . . . . . 4.3 4.3 4.1 3.9 -0.2
Black or African American.. . . . . . . . . . . . . . . . . . . . . . . . . . . . . . . . . . . . . . . . . . . . . . . . . 8.9 7.7 8.1 8.0 -0.1
Asian. . . . . . . . . . . . . . . . . . . . . . . . . . . . . . . . . . . . . . . . . . . . . . . . . . . . . . . . . . . . . . . . . . . . . . . . . . 4.0 3.7 3.4 3.3 -0.1
Hispanic or Latino ethnicity. . . . . . . . . . . . . . . . . . . . . . . . . . . . . . . . . . . . . . . . . . . . . . . . . 5.6 5.9 5.6 5.1 -0.5
Total, 25 years and over. . . . . . . . . . . . . . . . . . . . . . . . . . . . . . . . . . . . . . . . . . . . . . . . . . . . . . 4.2 3.9 3.9 3.8 -0.1
Less than a high school diploma.. . . . . . . . . . . . . . . . . . . . . . . . . . . . . . . . . . . . . . . . . 7.4 7.7 7.9 6.8 -1.1
High school graduates, no college. . . . . . . . . . . . . . . . . . . . . . . . . . . . . . . . . . . . . . . . 5.4 5.3 5.0 4.9 -0.1
Some college or associate degree. . . . . . . . . . . . . . . . . . . . . . . . . . . . . . . . . . . . . . . . 4.1 3.8 4.0 3.7 -0.3
Bachelor’s degree and higher. . . . . . . . . . . . . . . . . . . . . . . . . . . . . . . . . . . . . . . . . . . . . . 2.6 2.5 2.4 2.5 0.1
Reason for unemployment
Job losers and persons who completed temporary jobs. . . . . . . . . . . . . . . . . . 3,851 3,713 3,709 3,519 -190
Job leavers. . . . . . . . . . . . . . . . . . . . . . . . . . . . . . . . . . . . . . . . . . . . . . . . . . . . . . . . . . . . . . . . . . . . . . 839 862 802 798 -4
Reentrants. . . . . . . . . . . . . . . . . . . . . . . . . . . . . . . . . . . . . . . . . . . . . . . . . . . . . . . . . . . . . . . . . . . . . . . 2,483 2,170 2,197 2,066 -131
New entrants. . . . . . . . . . . . . . . . . . . . . . . . . . . . . . . . . . . . . . . . . . . . . . . . . . . . . . . . . . . . . . . . . . . . 783 813 773 790 17
Duration of unemployment
Less than 5 weeks.. . . . . . . . . . . . . . . . . . . . . . . . . . . . . . . . . . . . . . . . . . . . . . . . . . . . . . . . . . . . 2,420 2,468 2,566 2,334 -232
5 to 14 weeks.. . . . . . . . . . . . . . . . . . . . . . . . . . . . . . . . . . . . . . . . . . . . . . . . . . . . . . . . . . . . . . . . . . 2,210 2,089 2,138 2,109 -29
15 to 26 weeks. . . . . . . . . . . . . . . . . . . . . . . . . . . . . . . . . . . . . . . . . . . . . . . . . . . . . . . . . . . . . . . . . 1,167 1,192 1,057 1,115 58
27 weeks and over. . . . . . . . . . . . . . . . . . . . . . . . . . . . . . . . . . . . . . . . . . . . . . . . . . . . . . . . . . . . . 2,213 1,850 1,801 1,687 -114
Employed persons at work part time
Part time for economic reasons. . . . . . . . . . . . . . . . . . . . . . . . . . . . . . . . . . . . . . . . . . . . . . 6,120 5,840 5,704 5,553 -151
Slack work or business conditions. . . . . . . . . . . . . . . . . . . . . . . . . . . . . . . . . . . . . . . . 3,650 3,583 3,574 3,402 -172
Could only find part-time work. . . . . . . . . . . . . . . . . . . . . . . . . . . . . . . . . . . . . . . . . . . . . 2,118 1,944 1,864 1,852 -12
Part time for noneconomic reasons.. . . . . . . . . . . . . . . . . . . . . . . . . . . . . . . . . . . . . . . . . 20,430 20,487 20,773 20,723 -50
Persons not in the labor force (not seasonally adjusted)
Marginally attached to the labor force. . . . . . . . . . . . . . . . . . . . . . . . . . . . . . . . . . . . . . . 1,720 1,752 1,723 1,595 –
Discouraged workers. . . . . . . . . . . . . . . . . . . . . . . . . . . . . . . . . . . . . . . . . . . . . . . . . . . . . . . . 585 532 522 460 –
- Over-the-month changes are not displayed for not seasonally adjusted data.
NOTE: Persons whose ethnicity is identified as Hispanic or Latino may be of any race. Detail for the seasonally adjusted data shown in this table willnot necessarily add to totals because of the independent seasonal adjustment of the various series. Updated population controls are introducedannually with the release of January data.
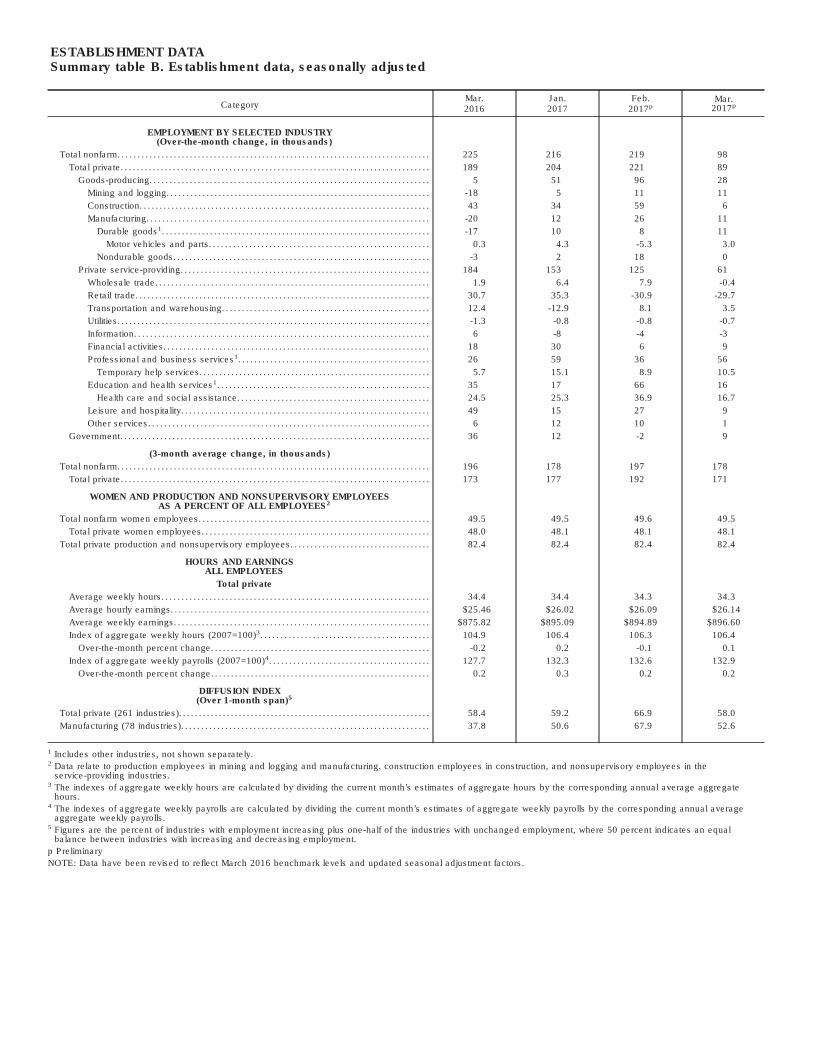
ESTABLISHMENT DATASummary table B. Establishment data, seasonally adjusted
CategoryMar.2016
Jan.2017
Feb.2017p
Mar.2017p
EMPLOYMENT BY SELECTED INDUSTRY(Over-the-month change, in thousands)
Total nonfarm. . . . . . . . . . . . . . . . . . . . . . . . . . . . . . . . . . . . . . . . . . . . . . . . . . . . . . . . . . . . . . . . . . . . . . . . . . . . . . 225 216 219 98
Total private. . . . . . . . . . . . . . . . . . . . . . . . . . . . . . . . . . . . . . . . . . . . . . . . . . . . . . . . . . . . . . . . . . . . . . . . . . . . . 189 204 221 89
Goods-producing. . . . . . . . . . . . . . . . . . . . . . . . . . . . . . . . . . . . . . . . . . . . . . . . . . . . . . . . . . . . . . . . . . . . . . 5 51 96 28
Mining and logging. . . . . . . . . . . . . . . . . . . . . . . . . . . . . . . . . . . . . . . . . . . . . . . . . . . . . . . . . . . . . . . . . . -18 5 11 11
Construction. . . . . . . . . . . . . . . . . . . . . . . . . . . . . . . . . . . . . . . . . . . . . . . . . . . . . . . . . . . . . . . . . . . . . . . . . 43 34 59 6
Manufacturing. . . . . . . . . . . . . . . . . . . . . . . . . . . . . . . . . . . . . . . . . . . . . . . . . . . . . . . . . . . . . . . . . . . . . . . -20 12 26 11
Durable goods1. . . . . . . . . . . . . . . . . . . . . . . . . . . . . . . . . . . . . . . . . . . . . . . . . . . . . . . . . . . . . . . . . . . -17 10 8 11
Motor vehicles and parts. . . . . . . . . . . . . . . . . . . . . . . . . . . . . . . . . . . . . . . . . . . . . . . . . . . . . . . 0.3 4.3 -5.3 3.0
Nondurable goods. . . . . . . . . . . . . . . . . . . . . . . . . . . . . . . . . . . . . . . . . . . . . . . . . . . . . . . . . . . . . . . . -3 2 18 0
Private service-providing. . . . . . . . . . . . . . . . . . . . . . . . . . . . . . . . . . . . . . . . . . . . . . . . . . . . . . . . . . . . . . 184 153 125 61
Wholesale trade. . . . . . . . . . . . . . . . . . . . . . . . . . . . . . . . . . . . . . . . . . . . . . . . . . . . . . . . . . . . . . . . . . . . . 1.9 6.4 7.9 -0.4
Retail trade. . . . . . . . . . . . . . . . . . . . . . . . . . . . . . . . . . . . . . . . . . . . . . . . . . . . . . . . . . . . . . . . . . . . . . . . . . 30.7 35.3 -30.9 -29.7
Transportation and warehousing. . . . . . . . . . . . . . . . . . . . . . . . . . . . . . . . . . . . . . . . . . . . . . . . . . . . 12.4 -12.9 8.1 3.5
Utilities. . . . . . . . . . . . . . . . . . . . . . . . . . . . . . . . . . . . . . . . . . . . . . . . . . . . . . . . . . . . . . . . . . . . . . . . . . . . . . -1.3 -0.8 -0.8 -0.7
Information. . . . . . . . . . . . . . . . . . . . . . . . . . . . . . . . . . . . . . . . . . . . . . . . . . . . . . . . . . . . . . . . . . . . . . . . . . 6 -8 -4 -3
Financial activities. . . . . . . . . . . . . . . . . . . . . . . . . . . . . . . . . . . . . . . . . . . . . . . . . . . . . . . . . . . . . . . . . . . 18 30 6 9
Professional and business services1. . . . . . . . . . . . . . . . . . . . . . . . . . . . . . . . . . . . . . . . . . . . . . . . 26 59 36 56
Temporary help services. . . . . . . . . . . . . . . . . . . . . . . . . . . . . . . . . . . . . . . . . . . . . . . . . . . . . . . . . . 5.7 15.1 8.9 10.5
Education and health services1. . . . . . . . . . . . . . . . . . . . . . . . . . . . . . . . . . . . . . . . . . . . . . . . . . . . . 35 17 66 16
Health care and social assistance. . . . . . . . . . . . . . . . . . . . . . . . . . . . . . . . . . . . . . . . . . . . . . . . 24.5 25.3 36.9 16.7
Leisure and hospitality. . . . . . . . . . . . . . . . . . . . . . . . . . . . . . . . . . . . . . . . . . . . . . . . . . . . . . . . . . . . . . 49 15 27 9
Other services. . . . . . . . . . . . . . . . . . . . . . . . . . . . . . . . . . . . . . . . . . . . . . . . . . . . . . . . . . . . . . . . . . . . . . 6 12 10 1
Government. . . . . . . . . . . . . . . . . . . . . . . . . . . . . . . . . . . . . . . . . . . . . . . . . . . . . . . . . . . . . . . . . . . . . . . . . . . . . 36 12 -2 9
(3-month average change, in thousands)
Total nonfarm. . . . . . . . . . . . . . . . . . . . . . . . . . . . . . . . . . . . . . . . . . . . . . . . . . . . . . . . . . . . . . . . . . . . . . . . . . . . . . 196 178 197 178
Total private. . . . . . . . . . . . . . . . . . . . . . . . . . . . . . . . . . . . . . . . . . . . . . . . . . . . . . . . . . . . . . . . . . . . . . . . . . . . . 173 177 192 171
WOMEN AND PRODUCTION AND NONSUPERVISORY EMPLOYEESAS A PERCENT OF ALL EMPLOYEES2
Total nonfarm women employees. . . . . . . . . . . . . . . . . . . . . . . . . . . . . . . . . . . . . . . . . . . . . . . . . . . . . . . . . . 49.5 49.5 49.6 49.5
Total private women employees. . . . . . . . . . . . . . . . . . . . . . . . . . . . . . . . . . . . . . . . . . . . . . . . . . . . . . . . . 48.0 48.1 48.1 48.1
Total private production and nonsupervisory employees. . . . . . . . . . . . . . . . . . . . . . . . . . . . . . . . . . . 82.4 82.4 82.4 82.4
HOURS AND EARNINGSALL EMPLOYEES
Total private
Average weekly hours. . . . . . . . . . . . . . . . . . . . . . . . . . . . . . . . . . . . . . . . . . . . . . . . . . . . . . . . . . . . . . . . . . . 34.4 34.4 34.3 34.3
Average hourly earnings. . . . . . . . . . . . . . . . . . . . . . . . . . . . . . . . . . . . . . . . . . . . . . . . . . . . . . . . . . . . . . . . . $25.46 $26.02 $26.09 $26.14
Average weekly earnings. . . . . . . . . . . . . . . . . . . . . . . . . . . . . . . . . . . . . . . . . . . . . . . . . . . . . . . . . . . . . . . . $875.82 $895.09 $894.89 $896.60
Index of aggregate weekly hours (2007=100)3. . . . . . . . . . . . . . . . . . . . . . . . . . . . . . . . . . . . . . . . . . 104.9 106.4 106.3 106.4
Over-the-month percent change. . . . . . . . . . . . . . . . . . . . . . . . . . . . . . . . . . . . . . . . . . . . . . . . . . . . . . . -0.2 0.2 -0.1 0.1
Index of aggregate weekly payrolls (2007=100)4. . . . . . . . . . . . . . . . . . . . . . . . . . . . . . . . . . . . . . . . 127.7 132.3 132.6 132.9
Over-the-month percent change. . . . . . . . . . . . . . . . . . . . . . . . . . . . . . . . . . . . . . . . . . . . . . . . . . . . . . . 0.2 0.3 0.2 0.2
DIFFUSION INDEX(Over 1-month span)5
Total private (261 industries). . . . . . . . . . . . . . . . . . . . . . . . . . . . . . . . . . . . . . . . . . . . . . . . . . . . . . . . . . . . . . . 58.4 59.2 66.9 58.0
Manufacturing (78 industries). . . . . . . . . . . . . . . . . . . . . . . . . . . . . . . . . . . . . . . . . . . . . . . . . . . . . . . . . . . . . . 37.8 50.6 67.9 52.6
1 Includes other industries, not shown separately.2 Data relate to production employees in mining and logging and manufacturing, construction employees in construction, and nonsupervisory employees in the
service-providing industries.3 The indexes of aggregate weekly hours are calculated by dividing the current month’s estimates of aggregate hours by the corresponding annual average aggregate
hours.4 The indexes of aggregate weekly payrolls are calculated by dividing the current month’s estimates of aggregate weekly payrolls by the corresponding annual average
aggregate weekly payrolls.5 Figures are the percent of industries with employment increasing plus one-half of the industries with unchanged employment, where 50 percent indicates an equal
balance between industries with increasing and decreasing employment.
p Preliminary
NOTE: Data have been revised to reflect March 2016 benchmark levels and updated seasonal adjustment factors.
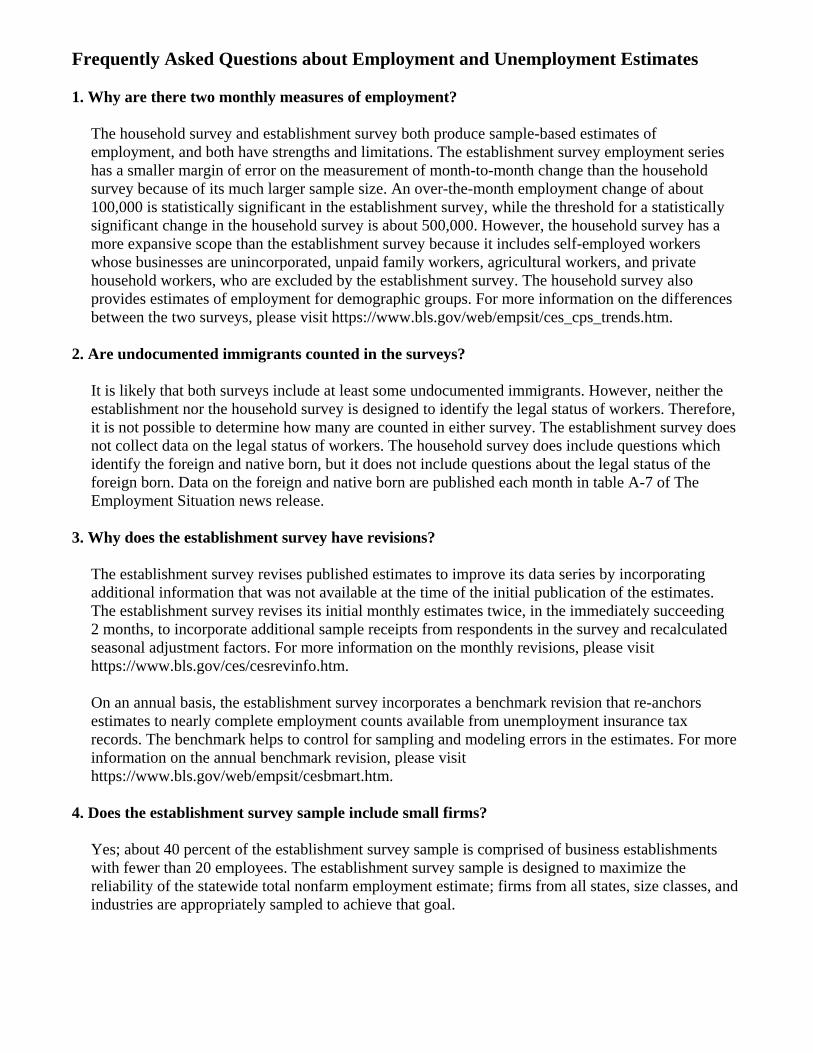
Frequently Asked Questions about Employment and Unemployment Estimates 1. Why are there two monthly measures of employment?
The household survey and establishment survey both produce sample-based estimates of employment, and both have strengths and limitations. The establishment survey employment series has a smaller margin of error on the measurement of month-to-month change than the household survey because of its much larger sample size. An over-the-month employment change of about 100,000 is statistically significant in the establishment survey, while the threshold for a statistically significant change in the household survey is about 500,000. However, the household survey has a more expansive scope than the establishment survey because it includes self-employed workers whose businesses are unincorporated, unpaid family workers, agricultural workers, and private household workers, who are excluded by the establishment survey. The household survey also provides estimates of employment for demographic groups. For more information on the differences between the two surveys, please visit https://www.bls.gov/web/empsit/ces_cps_trends.htm.
2. Are undocumented immigrants counted in the surveys?
It is likely that both surveys include at least some undocumented immigrants. However, neither the establishment nor the household survey is designed to identify the legal status of workers. Therefore, it is not possible to determine how many are counted in either survey. The establishment survey does not collect data on the legal status of workers. The household survey does include questions which identify the foreign and native born, but it does not include questions about the legal status of the foreign born. Data on the foreign and native born are published each month in table A-7 of The Employment Situation news release.
3. Why does the establishment survey have revisions?
The establishment survey revises published estimates to improve its data series by incorporating additional information that was not available at the time of the initial publication of the estimates. The establishment survey revises its initial monthly estimates twice, in the immediately succeeding 2 months, to incorporate additional sample receipts from respondents in the survey and recalculated seasonal adjustment factors. For more information on the monthly revisions, please visit https://www.bls.gov/ces/cesrevinfo.htm.
On an annual basis, the establishment survey incorporates a benchmark revision that re-anchors estimates to nearly complete employment counts available from unemployment insurance tax records. The benchmark helps to control for sampling and modeling errors in the estimates. For more information on the annual benchmark revision, please visit https://www.bls.gov/web/empsit/cesbmart.htm.
4. Does the establishment survey sample include small firms?
Yes; about 40 percent of the establishment survey sample is comprised of business establishments with fewer than 20 employees. The establishment survey sample is designed to maximize the reliability of the statewide total nonfarm employment estimate; firms from all states, size classes, and industries are appropriately sampled to achieve that goal.
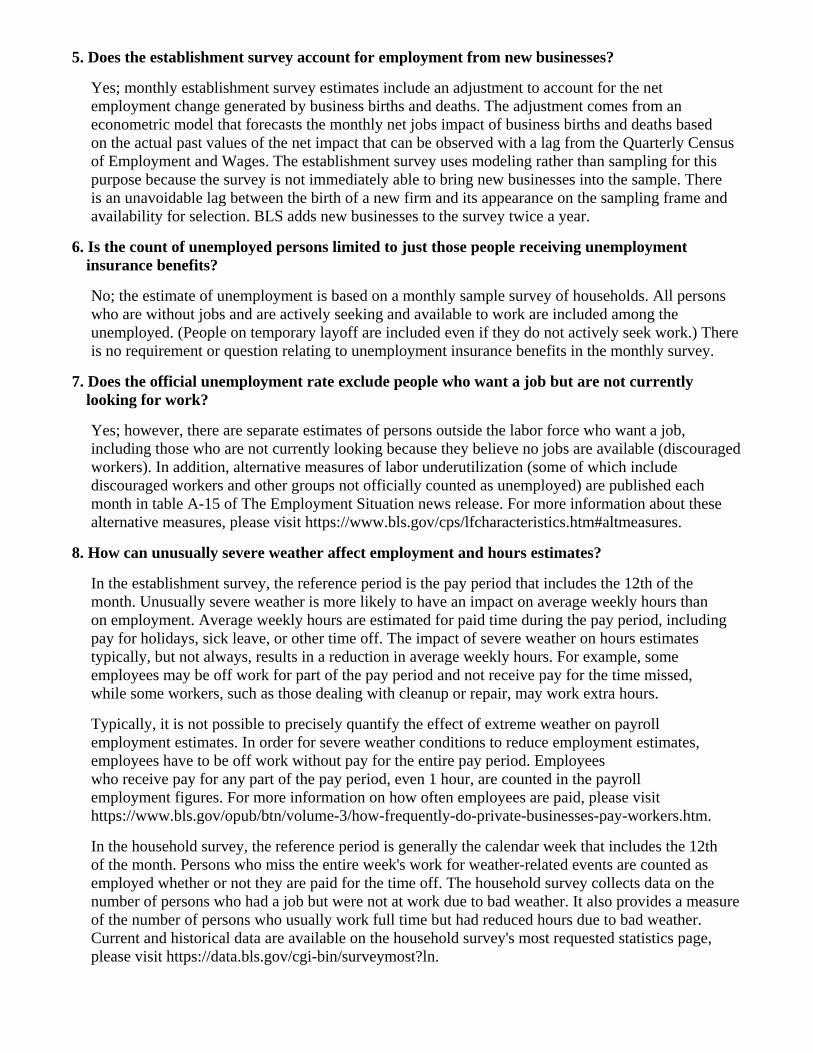
5. Does the establishment survey account for employment from new businesses?
Yes; monthly establishment survey estimates include an adjustment to account for the net employment change generated by business births and deaths. The adjustment comes from an econometric model that forecasts the monthly net jobs impact of business births and deaths based on the actual past values of the net impact that can be observed with a lag from the Quarterly Census of Employment and Wages. The establishment survey uses modeling rather than sampling for this purpose because the survey is not immediately able to bring new businesses into the sample. There is an unavoidable lag between the birth of a new firm and its appearance on the sampling frame and availability for selection. BLS adds new businesses to the survey twice a year.
6. Is the count of unemployed persons limited to just those people receiving unemployment
insurance benefits?
No; the estimate of unemployment is based on a monthly sample survey of households. All persons who are without jobs and are actively seeking and available to work are included among the unemployed. (People on temporary layoff are included even if they do not actively seek work.) There is no requirement or question relating to unemployment insurance benefits in the monthly survey.
7. Does the official unemployment rate exclude people who want a job but are not currently
looking for work?
Yes; however, there are separate estimates of persons outside the labor force who want a job, including those who are not currently looking because they believe no jobs are available (discouraged workers). In addition, alternative measures of labor underutilization (some of which include discouraged workers and other groups not officially counted as unemployed) are published each month in table A-15 of The Employment Situation news release. For more information about these alternative measures, please visit https://www.bls.gov/cps/lfcharacteristics.htm#altmeasures.
8. How can unusually severe weather affect employment and hours estimates?
In the establishment survey, the reference period is the pay period that includes the 12th of the month. Unusually severe weather is more likely to have an impact on average weekly hours than on employment. Average weekly hours are estimated for paid time during the pay period, including pay for holidays, sick leave, or other time off. The impact of severe weather on hours estimates typically, but not always, results in a reduction in average weekly hours. For example, some employees may be off work for part of the pay period and not receive pay for the time missed, while some workers, such as those dealing with cleanup or repair, may work extra hours.
Typically, it is not possible to precisely quantify the effect of extreme weather on payroll employment estimates. In order for severe weather conditions to reduce employment estimates, employees have to be off work without pay for the entire pay period. Employees who receive pay for any part of the pay period, even 1 hour, are counted in the payroll employment figures. For more information on how often employees are paid, please visit https://www.bls.gov/opub/btn/volume-3/how-frequently-do-private-businesses-pay-workers.htm.
In the household survey, the reference period is generally the calendar week that includes the 12th of the month. Persons who miss the entire week's work for weather-related events are counted as employed whether or not they are paid for the time off. The household survey collects data on the number of persons who had a job but were not at work due to bad weather. It also provides a measure of the number of persons who usually work full time but had reduced hours due to bad weather. Current and historical data are available on the household survey's most requested statistics page, please visit https://data.bls.gov/cgi-bin/surveymost?ln.

Technical Note
This news release presents statistics from two major surveys, the Current Population Survey (CPS; household survey) and the Current Employment Statistics survey (CES; establishment survey). The household survey provides information on the labor force, employment, and unemployment that appears in the "A" tables, marked HOUSEHOLD DATA. It is a sample survey of about 60,000 eligible households conducted by the U.S. Census Bureau for the U.S. Bureau of Labor Statistics (BLS).
The establishment survey provides information on employment, hours, and earnings of employees on nonfarm payrolls; the data appear in the "B" tables, marked ESTABLISHMENT DATA. BLS collects these data each month from the payroll records of a sample of nonagricultural business establishments. Each month the CES program surveys about 147,000 businesses and government agencies, representing approximately 634,000 individual worksites, in order to provide detailed industry data on employment, hours, and earnings of workers on nonfarm payrolls. The active sample includes approximately one-third of all nonfarm payroll employees.
For both surveys, the data for a given month relate to a particular week or pay period. In the household survey, the reference period is generally the calendar week that contains the 12th day of the month. In the establishment survey, the reference period is the pay period including the 12th, which may or may not correspond directly to the calendar week. Coverage, definitions, and differences between surveys
Household survey. The sample is selected to reflect the entire civilian noninstitutional population. Based on responses to a series of questions on work and job search activities, each person 16 years and over in a sample household is classified as employed, unemployed, or not in the labor force.
People are classified as employed if they did any work at all as paid employees during the reference week; worked in their own business, profession, or on their own farm; or worked without pay at least 15 hours in a family business or farm. People are also counted as employed if they were temporarily absent from their jobs because of illness, bad weather, vacation, labor-management disputes, or personal reasons.
People are classified as unemployed if they meet all of the following criteria: they had no employment during the reference week; they were available for work at that time; and they made specific efforts to find employment sometime during the 4-week period ending with the reference week. Persons laid off from a job and expecting recall need not be looking for work to be counted as unemployed. The unemployment data derived from the household survey in no way depend upon the eligibility for or receipt of unemployment insurance benefits.
The civilian labor force is the sum of employed and unemployed persons. Those persons not classified as employed or unemployed are not in the labor force. The
unemployment rate is the number unemployed as a percent of the labor force. The labor force participation rate is the labor force as a percent of the population, and the employment-population ratio is the employed as a percent of the population. Additional information about the household survey can be found at https://www.bls.gov/cps/documentation.htm.
Establishment survey. The sample establishments are drawn from private nonfarm businesses such as factories, offices, and stores, as well as from federal, state, and local government entities. Employees on nonfarm payrolls are those who received pay for any part of the reference pay period, including persons on paid leave. Persons are counted in each job they hold. Hours and earnings data are produced for the private sector for all employees and for production and nonsupervisory employees. Production and nonsupervisory employees are defined as production and related employees in manufacturing and mining and logging, construction workers in construction, and non-supervisory employees in private service-providing industries.
Industries are classified on the basis of an establishment’s principal activity in accordance with the 2012 version of the North American Industry Classification System. Additional information about the establishment survey can be found at https://www.bls.gov/ces/.
Differences in employment estimates. The numerous conceptual and methodological differences between the household and establishment surveys result in important distinctions in the employment estimates derived from the surveys. Among these are:
• The household survey includes agricultural workers, self-employed workers whose businesses are unincorporated, unpaid family workers, and private household workers among the employed. These groups are excluded from the establishment survey.
• The household survey includes people on unpaid
leave among the employed. The establishment survey does not.
• The household survey is limited to workers 16 years of age and older. The establishment survey is not limited by age.
• The household survey has no duplication of individuals, because individuals are counted only once, even if they hold more than one job. In the establishment survey, employees working at more than one job and thus appearing on more than one payroll are counted separately for each appearance.

Seasonal adjustment
Over the course of a year, the size of the nation's labor force and the levels of employment and unemployment undergo regularly occurring fluctuations. These events may result from seasonal changes in weather, major holidays, and the opening and closing of schools. The effect of such seasonal variation can be very large.
Because these seasonal events follow a more or less regular pattern each year, their influence on the level of a series can be tempered by adjusting for regular seasonal variation. These adjustments make nonseasonal developments, such as declines in employment or increases in the participation of women in the labor force, easier to spot. For example, in the household survey, the large number of youth entering the labor force each June is likely to obscure any other changes that have taken place relative to May, making it difficult to determine if the level of economic activity has risen or declined. Similarly, in the establishment survey, payroll employment in education declines by about 20 percent at the end of the spring term and later rises with the start of the fall term, obscuring the underlying employment trends in the industry. Because seasonal employment changes at the end and beginning of the school year can be estimated, the statistics can be adjusted to make underlying employment patterns more discernable. The seasonally adjusted figures provide a more useful tool with which to analyze changes in month-to-month economic activity.
Many seasonally adjusted series are independently adjusted in both the household and establishment surveys. However, the adjusted series for many major estimates, such as total payroll employment, employment in most major sectors, total employment, and unemployment are computed by aggregating independently adjusted component series. For example, total unemployment is derived by summing the adjusted series for four major age-sex components; this differs from the unemployment estimate that would be obtained by directly adjusting the total or by combining the duration, reasons, or more detailed age categories.
For both the household and establishment surveys, a concurrent seasonal adjustment methodology is used in which new seasonal factors are calculated each month using all relevant data, up to and including the data for the current month. In the household survey, new seasonal factors are used to adjust only the current month's data. In the establishment survey, however, new seasonal factors are used each month to adjust the three most recent monthly estimates. The prior 2 months are routinely revised to incorporate additional sample reports and recalculated seasonal adjustment factors. In both surveys, 5-year revisions to historical data are made once a year. Reliability of the estimates
Statistics based on the household and establishment surveys are subject to both sampling and nonsampling error. When a sample, rather than the entire population, is
surveyed, there is a chance that the sample estimates may differ from the true population values they represent. The component of this difference that occurs because samples differ by chance is known as sampling error, and its variability is measured by the standard error of the estimate. There is about a 90-percent chance, or level of confidence, that an estimate based on a sample will differ by no more than 1.6 standard errors from the true population value because of sampling error. BLS analyses are generally conducted at the 90-percent level of confidence.
For example, the confidence interval for the monthly change in total nonfarm employment from the establishment survey is on the order of plus or minus 120,000. Suppose the estimate of nonfarm employment increases by 50,000 from one month to the next. The 90-percent confidence interval on the monthly change would range from -70,000 to +170,000 (50,000 +/- 120,000). These figures do not mean that the sample results are off by these magnitudes, but rather that there is about a 90-percent chance that the true over-the-month change lies within this interval. Since this range includes values of less than zero, we could not say with confidence that nonfarm employment had, in fact, increased that month. If, however, the reported nonfarm employment rise was 250,000, then all of the values within the 90-percent confidence interval would be greater than zero. In this case, it is likely (at least a 90-percent chance) that nonfarm employment had, in fact, risen that month. At an unemployment rate of around 6.0 percent, the 90-percent confidence interval for the monthly change in unemployment as measured by the household survey is about +/- 300,000, and for the monthly change in the unemployment rate it is about +/- 0.2 percentage point.
In general, estimates involving many individuals or establishments have lower standard errors (relative to the size of the estimate) than estimates which are based on a small number of observations. The precision of estimates also is improved when the data are cumulated over time, such as for quarterly and annual averages.
The household and establishment surveys are also affected by nonsampling error, which can occur for many reasons, including the failure to sample a segment of the population, inability to obtain information for all respondents in the sample, inability or unwillingness of respondents to provide correct information on a timely basis, mistakes made by respondents, and errors made in the collection or processing of the data.
For example, in the establishment survey, estimates for the most recent 2 months are based on incomplete returns; for this reason, these estimates are labeled preliminary in the tables. It is only after two successive revisions to a monthly estimate, when nearly all sample reports have been received, that the estimate is considered final.
Another major source of nonsampling error in the establishment survey is the inability to capture, on a timely basis, employment generated by new firms. To correct for this systematic underestimation of employment growth, an estimation procedure with two components is used to account for business births. The first component excludes employment losses from business deaths from sample-based

estimation in order to offset the missing employment gains from business births. This is incorporated into the sample-based estimation procedure by simply not reflecting sample units going out of business, but imputing to them the same employment trend as the other firms in the sample. This procedure accounts for most of the net birth/death employment.
The second component is an ARIMA time series model designed to estimate the residual net birth/death employment not accounted for by the imputation. The historical time series used to create and test the ARIMA model was derived from the unemployment insurance universe micro-level database, and reflects the actual residual net of births and deaths over the past 5 years.
The sample-based estimates from the establishment survey are adjusted once a year (on a lagged basis) to
universe counts of payroll employment obtained from administrative records of the unemployment insurance program. The difference between the March sample-based employment estimates and the March universe counts is known as a benchmark revision, and serves as a rough proxy for total survey error. The new benchmarks also incorporate changes in the classification of industries. Over the past decade, absolute benchmark revisions for total nonfarm employment have averaged 0.3 percent, with a range from -0.7 percent to 0.6 percent. Other information
Information in this release will be made available to sensory impaired individuals upon request. Voice phone: (202) 691-5200; Federal Relay Service: (800) 877-8339.
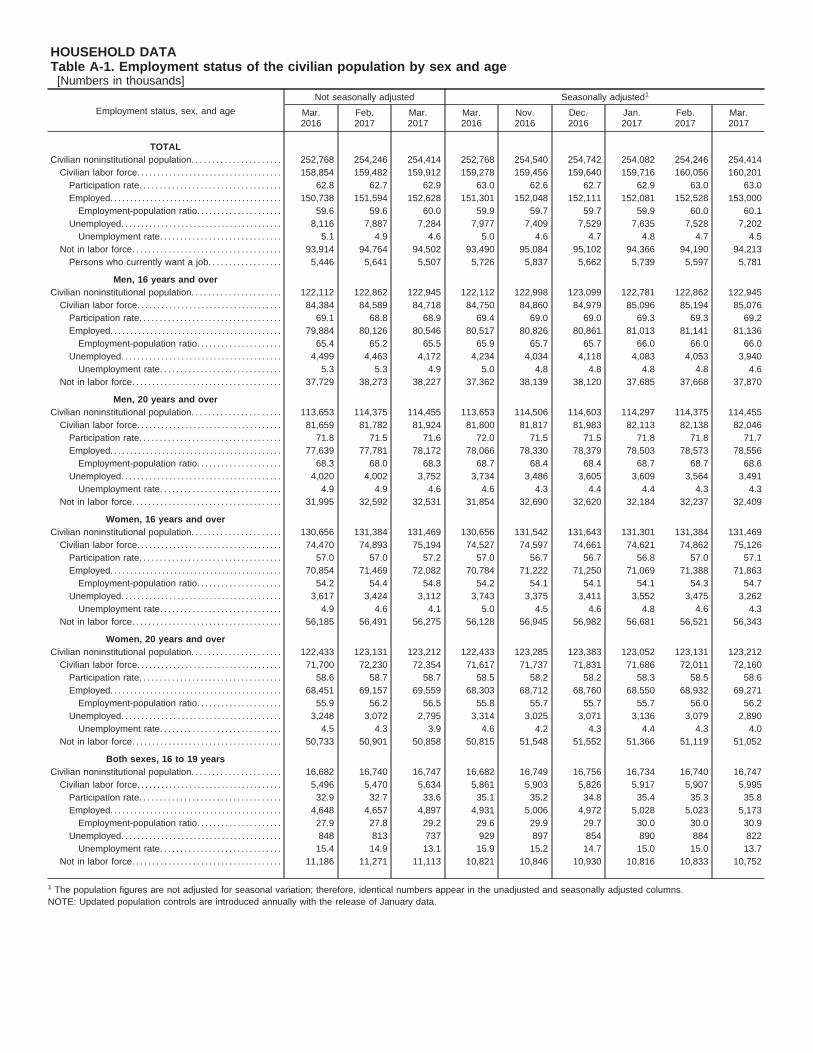
HOUSEHOLD DATATable A-1. Employment status of the civilian population by sex and age[Numbers in thousands]
Employment status, sex, and age
Not seasonally adjusted Seasonally adjusted1
Mar.2016
Feb.2017
Mar.2017
Mar.2016
Nov.2016
Dec.2016
Jan.2017
Feb.2017
Mar.2017
TOTAL
Civilian noninstitutional population. . . . . . . . . . . . . . . . . . . . . . 252,768 254,246 254,414 252,768 254,540 254,742 254,082 254,246 254,414
Civilian labor force. . . . . . . . . . . . . . . . . . . . . . . . . . . . . . . . . . . . 158,854 159,482 159,912 159,278 159,456 159,640 159,716 160,056 160,201
Participation rate. . . . . . . . . . . . . . . . . . . . . . . . . . . . . . . . . . . 62.8 62.7 62.9 63.0 62.6 62.7 62.9 63.0 63.0
Employed. . . . . . . . . . . . . . . . . . . . . . . . . . . . . . . . . . . . . . . . . . . 150,738 151,594 152,628 151,301 152,048 152,111 152,081 152,528 153,000
Employment-population ratio. . . . . . . . . . . . . . . . . . . . . 59.6 59.6 60.0 59.9 59.7 59.7 59.9 60.0 60.1
Unemployed. . . . . . . . . . . . . . . . . . . . . . . . . . . . . . . . . . . . . . . . 8,116 7,887 7,284 7,977 7,409 7,529 7,635 7,528 7,202
Unemployment rate. . . . . . . . . . . . . . . . . . . . . . . . . . . . . . 5.1 4.9 4.6 5.0 4.6 4.7 4.8 4.7 4.5
Not in labor force. . . . . . . . . . . . . . . . . . . . . . . . . . . . . . . . . . . . . 93,914 94,764 94,502 93,490 95,084 95,102 94,366 94,190 94,213
Persons who currently want a job. . . . . . . . . . . . . . . . . . 5,446 5,641 5,507 5,726 5,837 5,662 5,739 5,597 5,781
Men, 16 years and over
Civilian noninstitutional population. . . . . . . . . . . . . . . . . . . . . . 122,112 122,862 122,945 122,112 122,998 123,099 122,781 122,862 122,945
Civilian labor force. . . . . . . . . . . . . . . . . . . . . . . . . . . . . . . . . . . . 84,384 84,589 84,718 84,750 84,860 84,979 85,096 85,194 85,076
Participation rate. . . . . . . . . . . . . . . . . . . . . . . . . . . . . . . . . . . 69.1 68.8 68.9 69.4 69.0 69.0 69.3 69.3 69.2
Employed. . . . . . . . . . . . . . . . . . . . . . . . . . . . . . . . . . . . . . . . . . . 79,884 80,126 80,546 80,517 80,826 80,861 81,013 81,141 81,136
Employment-population ratio. . . . . . . . . . . . . . . . . . . . . 65.4 65.2 65.5 65.9 65.7 65.7 66.0 66.0 66.0
Unemployed. . . . . . . . . . . . . . . . . . . . . . . . . . . . . . . . . . . . . . . . 4,499 4,463 4,172 4,234 4,034 4,118 4,083 4,053 3,940
Unemployment rate. . . . . . . . . . . . . . . . . . . . . . . . . . . . . . 5.3 5.3 4.9 5.0 4.8 4.8 4.8 4.8 4.6
Not in labor force. . . . . . . . . . . . . . . . . . . . . . . . . . . . . . . . . . . . . 37,729 38,273 38,227 37,362 38,139 38,120 37,685 37,668 37,870
Men, 20 years and over
Civilian noninstitutional population. . . . . . . . . . . . . . . . . . . . . . 113,653 114,375 114,455 113,653 114,506 114,603 114,297 114,375 114,455
Civilian labor force. . . . . . . . . . . . . . . . . . . . . . . . . . . . . . . . . . . . 81,659 81,782 81,924 81,800 81,817 81,983 82,113 82,138 82,046
Participation rate. . . . . . . . . . . . . . . . . . . . . . . . . . . . . . . . . . . 71.8 71.5 71.6 72.0 71.5 71.5 71.8 71.8 71.7
Employed. . . . . . . . . . . . . . . . . . . . . . . . . . . . . . . . . . . . . . . . . . . 77,639 77,781 78,172 78,066 78,330 78,379 78,503 78,573 78,556
Employment-population ratio. . . . . . . . . . . . . . . . . . . . . 68.3 68.0 68.3 68.7 68.4 68.4 68.7 68.7 68.6
Unemployed. . . . . . . . . . . . . . . . . . . . . . . . . . . . . . . . . . . . . . . . 4,020 4,002 3,752 3,734 3,486 3,605 3,609 3,564 3,491
Unemployment rate. . . . . . . . . . . . . . . . . . . . . . . . . . . . . . 4.9 4.9 4.6 4.6 4.3 4.4 4.4 4.3 4.3
Not in labor force. . . . . . . . . . . . . . . . . . . . . . . . . . . . . . . . . . . . . 31,995 32,592 32,531 31,854 32,690 32,620 32,184 32,237 32,409
Women, 16 years and over
Civilian noninstitutional population. . . . . . . . . . . . . . . . . . . . . . 130,656 131,384 131,469 130,656 131,542 131,643 131,301 131,384 131,469
Civilian labor force. . . . . . . . . . . . . . . . . . . . . . . . . . . . . . . . . . . . 74,470 74,893 75,194 74,527 74,597 74,661 74,621 74,862 75,126
Participation rate. . . . . . . . . . . . . . . . . . . . . . . . . . . . . . . . . . . 57.0 57.0 57.2 57.0 56.7 56.7 56.8 57.0 57.1
Employed. . . . . . . . . . . . . . . . . . . . . . . . . . . . . . . . . . . . . . . . . . . 70,854 71,469 72,082 70,784 71,222 71,250 71,069 71,388 71,863
Employment-population ratio. . . . . . . . . . . . . . . . . . . . . 54.2 54.4 54.8 54.2 54.1 54.1 54.1 54.3 54.7
Unemployed. . . . . . . . . . . . . . . . . . . . . . . . . . . . . . . . . . . . . . . . 3,617 3,424 3,112 3,743 3,375 3,411 3,552 3,475 3,262
Unemployment rate. . . . . . . . . . . . . . . . . . . . . . . . . . . . . . 4.9 4.6 4.1 5.0 4.5 4.6 4.8 4.6 4.3
Not in labor force. . . . . . . . . . . . . . . . . . . . . . . . . . . . . . . . . . . . . 56,185 56,491 56,275 56,128 56,945 56,982 56,681 56,521 56,343
Women, 20 years and over
Civilian noninstitutional population. . . . . . . . . . . . . . . . . . . . . . 122,433 123,131 123,212 122,433 123,285 123,383 123,052 123,131 123,212
Civilian labor force. . . . . . . . . . . . . . . . . . . . . . . . . . . . . . . . . . . . 71,700 72,230 72,354 71,617 71,737 71,831 71,686 72,011 72,160
Participation rate. . . . . . . . . . . . . . . . . . . . . . . . . . . . . . . . . . . 58.6 58.7 58.7 58.5 58.2 58.2 58.3 58.5 58.6
Employed. . . . . . . . . . . . . . . . . . . . . . . . . . . . . . . . . . . . . . . . . . . 68,451 69,157 69,559 68,303 68,712 68,760 68,550 68,932 69,271
Employment-population ratio. . . . . . . . . . . . . . . . . . . . . 55.9 56.2 56.5 55.8 55.7 55.7 55.7 56.0 56.2
Unemployed. . . . . . . . . . . . . . . . . . . . . . . . . . . . . . . . . . . . . . . . 3,248 3,072 2,795 3,314 3,025 3,071 3,136 3,079 2,890
Unemployment rate. . . . . . . . . . . . . . . . . . . . . . . . . . . . . . 4.5 4.3 3.9 4.6 4.2 4.3 4.4 4.3 4.0
Not in labor force. . . . . . . . . . . . . . . . . . . . . . . . . . . . . . . . . . . . . 50,733 50,901 50,858 50,815 51,548 51,552 51,366 51,119 51,052
Both sexes, 16 to 19 years
Civilian noninstitutional population. . . . . . . . . . . . . . . . . . . . . . 16,682 16,740 16,747 16,682 16,749 16,756 16,734 16,740 16,747
Civilian labor force. . . . . . . . . . . . . . . . . . . . . . . . . . . . . . . . . . . . 5,496 5,470 5,634 5,861 5,903 5,826 5,917 5,907 5,995
Participation rate. . . . . . . . . . . . . . . . . . . . . . . . . . . . . . . . . . . 32.9 32.7 33.6 35.1 35.2 34.8 35.4 35.3 35.8
Employed. . . . . . . . . . . . . . . . . . . . . . . . . . . . . . . . . . . . . . . . . . . 4,648 4,657 4,897 4,931 5,006 4,972 5,028 5,023 5,173
Employment-population ratio. . . . . . . . . . . . . . . . . . . . . 27.9 27.8 29.2 29.6 29.9 29.7 30.0 30.0 30.9
Unemployed. . . . . . . . . . . . . . . . . . . . . . . . . . . . . . . . . . . . . . . . 848 813 737 929 897 854 890 884 822
Unemployment rate. . . . . . . . . . . . . . . . . . . . . . . . . . . . . . 15.4 14.9 13.1 15.9 15.2 14.7 15.0 15.0 13.7
Not in labor force. . . . . . . . . . . . . . . . . . . . . . . . . . . . . . . . . . . . . 11,186 11,271 11,113 10,821 10,846 10,930 10,816 10,833 10,752
1 The population figures are not adjusted for seasonal variation; therefore, identical numbers appear in the unadjusted and seasonally adjusted columns.
NOTE: Updated population controls are introduced annually with the release of January data.
HOUSEHOLD DATATable A-2. Employment status of the civilian population by race, sex, and age[Numbers in thousands]
Employment status, race, sex, and age
Not seasonally adjusted Seasonally adjusted1
Mar.2016
Feb.2017
Mar.2017
Mar.2016
Nov.2016
Dec.2016
Jan.2017
Feb.2017
Mar.2017
WHITE
Civilian noninstitutional population. . . . . . . . . . . . . . . . . . . . . . 197,809 198,525 198,604 197,809 198,745 198,845 198,453 198,525 198,604
Civilian labor force. . . . . . . . . . . . . . . . . . . . . . . . . . . . . . . . . . . . 124,663 124,419 124,804 124,985 124,578 124,616 124,675 124,856 125,046
Participation rate. . . . . . . . . . . . . . . . . . . . . . . . . . . . . . . . . . . 63.0 62.7 62.8 63.2 62.7 62.7 62.8 62.9 63.0
Employed. . . . . . . . . . . . . . . . . . . . . . . . . . . . . . . . . . . . . . . . . . . 119,137 118,991 119,831 119,624 119,370 119,263 119,311 119,740 120,180
Employment-population ratio. . . . . . . . . . . . . . . . . . . . . 60.2 59.9 60.3 60.5 60.1 60.0 60.1 60.3 60.5
Unemployed. . . . . . . . . . . . . . . . . . . . . . . . . . . . . . . . . . . . . . . . 5,526 5,428 4,974 5,361 5,208 5,354 5,364 5,116 4,866
Unemployment rate. . . . . . . . . . . . . . . . . . . . . . . . . . . . . . 4.4 4.4 4.0 4.3 4.2 4.3 4.3 4.1 3.9
Not in labor force. . . . . . . . . . . . . . . . . . . . . . . . . . . . . . . . . . . . . 73,146 74,106 73,799 72,825 74,168 74,229 73,778 73,669 73,557
Men, 20 years and over
Civilian labor force. . . . . . . . . . . . . . . . . . . . . . . . . . . . . . . . . . . . 65,175 65,089 65,125 65,276 65,124 65,146 65,345 65,362 65,219
Participation rate. . . . . . . . . . . . . . . . . . . . . . . . . . . . . . . . . . . 72.1 71.7 71.7 72.2 71.7 71.7 72.1 72.0 71.9
Employed. . . . . . . . . . . . . . . . . . . . . . . . . . . . . . . . . . . . . . . . . . . 62,355 62,255 62,548 62,707 62,608 62,476 62,730 62,877 62,850
Employment-population ratio. . . . . . . . . . . . . . . . . . . . . 69.0 68.6 68.9 69.4 68.9 68.7 69.2 69.3 69.2
Unemployed. . . . . . . . . . . . . . . . . . . . . . . . . . . . . . . . . . . . . . . . 2,820 2,833 2,576 2,568 2,516 2,669 2,615 2,485 2,369
Unemployment rate. . . . . . . . . . . . . . . . . . . . . . . . . . . . . . 4.3 4.4 4.0 3.9 3.9 4.1 4.0 3.8 3.6
Women, 20 years and over
Civilian labor force. . . . . . . . . . . . . . . . . . . . . . . . . . . . . . . . . . . . 55,192 55,179 55,297 55,125 54,808 54,872 54,798 54,988 55,153
Participation rate. . . . . . . . . . . . . . . . . . . . . . . . . . . . . . . . . . . 58.0 57.8 57.9 58.0 57.4 57.4 57.4 57.6 57.8
Employed. . . . . . . . . . . . . . . . . . . . . . . . . . . . . . . . . . . . . . . . . . . 53,087 53,138 53,413 52,972 52,783 52,813 52,646 52,949 53,211
Employment-population ratio. . . . . . . . . . . . . . . . . . . . . 55.8 55.7 55.9 55.7 55.2 55.2 55.2 55.5 55.7
Unemployed. . . . . . . . . . . . . . . . . . . . . . . . . . . . . . . . . . . . . . . . 2,105 2,040 1,883 2,153 2,026 2,059 2,152 2,039 1,942
Unemployment rate. . . . . . . . . . . . . . . . . . . . . . . . . . . . . . 3.8 3.7 3.4 3.9 3.7 3.8 3.9 3.7 3.5
Both sexes, 16 to 19 years
Civilian labor force. . . . . . . . . . . . . . . . . . . . . . . . . . . . . . . . . . . . 4,296 4,151 4,383 4,584 4,645 4,599 4,531 4,505 4,674
Participation rate. . . . . . . . . . . . . . . . . . . . . . . . . . . . . . . . . . . 34.8 33.6 35.5 37.2 37.6 37.2 36.7 36.5 37.9
Employed. . . . . . . . . . . . . . . . . . . . . . . . . . . . . . . . . . . . . . . . . . . 3,695 3,597 3,869 3,944 3,979 3,974 3,934 3,913 4,119
Employment-population ratio. . . . . . . . . . . . . . . . . . . . . 30.0 29.2 31.3 32.0 32.2 32.2 31.9 31.7 33.4
Unemployed. . . . . . . . . . . . . . . . . . . . . . . . . . . . . . . . . . . . . . . . 601 554 514 640 666 625 597 592 555
Unemployment rate. . . . . . . . . . . . . . . . . . . . . . . . . . . . . . 14.0 13.4 11.7 14.0 14.3 13.6 13.2 13.1 11.9
BLACK OR AFRICAN AMERICAN
Civilian noninstitutional population. . . . . . . . . . . . . . . . . . . . . . 31,753 32,095 32,128 31,753 32,068 32,105 32,063 32,095 32,128
Civilian labor force. . . . . . . . . . . . . . . . . . . . . . . . . . . . . . . . . . . . 19,421 19,858 19,898 19,503 19,856 19,844 19,993 19,998 20,002
Participation rate. . . . . . . . . . . . . . . . . . . . . . . . . . . . . . . . . . . 61.2 61.9 61.9 61.4 61.9 61.8 62.4 62.3 62.3
Employed. . . . . . . . . . . . . . . . . . . . . . . . . . . . . . . . . . . . . . . . . . . 17,670 18,215 18,296 17,764 18,262 18,292 18,445 18,378 18,409
Employment-population ratio. . . . . . . . . . . . . . . . . . . . . 55.6 56.8 56.9 55.9 56.9 57.0 57.5 57.3 57.3
Unemployed. . . . . . . . . . . . . . . . . . . . . . . . . . . . . . . . . . . . . . . . 1,751 1,642 1,602 1,739 1,594 1,552 1,548 1,620 1,593
Unemployment rate. . . . . . . . . . . . . . . . . . . . . . . . . . . . . . 9.0 8.3 8.1 8.9 8.0 7.8 7.7 8.1 8.0
Not in labor force. . . . . . . . . . . . . . . . . . . . . . . . . . . . . . . . . . . . . 12,332 12,238 12,229 12,250 12,212 12,261 12,070 12,097 12,126
Men, 20 years and over
Civilian labor force. . . . . . . . . . . . . . . . . . . . . . . . . . . . . . . . . . . . 8,871 9,001 9,116 8,885 9,018 9,056 9,106 9,081 9,132
Participation rate. . . . . . . . . . . . . . . . . . . . . . . . . . . . . . . . . . . 67.1 67.2 68.0 67.2 67.5 67.7 68.1 67.8 68.1
Employed. . . . . . . . . . . . . . . . . . . . . . . . . . . . . . . . . . . . . . . . . . . 8,063 8,232 8,313 8,119 8,328 8,366 8,437 8,369 8,384
Employment-population ratio. . . . . . . . . . . . . . . . . . . . . 61.0 61.5 62.0 61.4 62.3 62.5 63.1 62.5 62.6
Unemployed. . . . . . . . . . . . . . . . . . . . . . . . . . . . . . . . . . . . . . . . 809 769 803 766 691 690 669 713 747
Unemployment rate. . . . . . . . . . . . . . . . . . . . . . . . . . . . . . 9.1 8.5 8.8 8.6 7.7 7.6 7.3 7.8 8.2
Women, 20 years and over
Civilian labor force. . . . . . . . . . . . . . . . . . . . . . . . . . . . . . . . . . . . 9,842 10,150 10,143 9,860 10,135 10,094 10,124 10,162 10,173
Participation rate. . . . . . . . . . . . . . . . . . . . . . . . . . . . . . . . . . . 61.4 62.7 62.6 61.5 62.6 62.3 62.6 62.7 62.7
Employed. . . . . . . . . . . . . . . . . . . . . . . . . . . . . . . . . . . . . . . . . . . 9,062 9,429 9,483 9,080 9,418 9,410 9,450 9,438 9,497
Employment-population ratio. . . . . . . . . . . . . . . . . . . . . 56.5 58.2 58.5 56.6 58.2 58.1 58.4 58.3 58.6
Unemployed. . . . . . . . . . . . . . . . . . . . . . . . . . . . . . . . . . . . . . . . 781 721 661 780 716 683 673 724 676
Unemployment rate. . . . . . . . . . . . . . . . . . . . . . . . . . . . . . 7.9 7.1 6.5 7.9 7.1 6.8 6.7 7.1 6.6
Both sexes, 16 to 19 years
Civilian labor force. . . . . . . . . . . . . . . . . . . . . . . . . . . . . . . . . . . . 708 706 639 758 703 694 764 754 697
Participation rate. . . . . . . . . . . . . . . . . . . . . . . . . . . . . . . . . . . 28.3 28.1 25.4 30.3 27.9 27.6 30.4 30.0 27.7
Employed. . . . . . . . . . . . . . . . . . . . . . . . . . . . . . . . . . . . . . . . . . . 546 554 500 565 516 515 558 571 528
Employment-population ratio. . . . . . . . . . . . . . . . . . . . . 21.8 22.0 19.9 22.6 20.5 20.5 22.2 22.7 21.0
Unemployed. . . . . . . . . . . . . . . . . . . . . . . . . . . . . . . . . . . . . . . . 162 153 139 193 187 178 205 183 169
Unemployment rate. . . . . . . . . . . . . . . . . . . . . . . . . . . . . . 22.9 21.6 21.7 25.4 26.6 25.7 26.9 24.3 24.3
See footnotes at end of table.
HOUSEHOLD DATATable A-2. Employment status of the civilian population by race, sex, and age — Continued[Numbers in thousands]
Employment status, race, sex, and age
Not seasonally adjusted Seasonally adjusted1
Mar.2016
Feb.2017
Mar.2017
Mar.2016
Nov.2016
Dec.2016
Jan.2017
Feb.2017
Mar.2017
ASIAN
Civilian noninstitutional population. . . . . . . . . . . . . . . . . . . . . . 14,911 15,228 15,285 14,911 15,323 15,433 15,157 15,228 15,285
Civilian labor force. . . . . . . . . . . . . . . . . . . . . . . . . . . . . . . . . . . . 9,478 9,731 9,668 9,434 9,634 9,678 9,641 9,709 9,635
Participation rate. . . . . . . . . . . . . . . . . . . . . . . . . . . . . . . . . . . 63.6 63.9 63.3 63.3 62.9 62.7 63.6 63.8 63.0
Employed. . . . . . . . . . . . . . . . . . . . . . . . . . . . . . . . . . . . . . . . . . . 9,112 9,387 9,358 9,061 9,342 9,423 9,281 9,377 9,318
Employment-population ratio. . . . . . . . . . . . . . . . . . . . . 61.1 61.6 61.2 60.8 61.0 61.1 61.2 61.6 61.0
Unemployed. . . . . . . . . . . . . . . . . . . . . . . . . . . . . . . . . . . . . . . . 366 344 310 373 292 256 360 332 317
Unemployment rate. . . . . . . . . . . . . . . . . . . . . . . . . . . . . . 3.9 3.5 3.2 4.0 3.0 2.6 3.7 3.4 3.3
Not in labor force. . . . . . . . . . . . . . . . . . . . . . . . . . . . . . . . . . . . . 5,433 5,497 5,616 5,477 5,690 5,755 5,517 5,519 5,650
1 The population figures are not adjusted for seasonal variation; therefore, identical numbers appear in the unadjusted and seasonally adjusted columns.
NOTE: Estimates for the above race groups will not sum to totals shown in table A-1 because data are not presented for all races. Updated population controls areintroduced annually with the release of January data.
HOUSEHOLD DATATable A-3. Employment status of the Hispanic or Latino population by sex and age[Numbers in thousands]
Employment status, sex, and age
Not seasonally adjusted Seasonally adjusted1
Mar.2016
Feb.2017
Mar.2017
Mar.2016
Nov.2016
Dec.2016
Jan.2017
Feb.2017
Mar.2017
HISPANIC OR LATINO ETHNICITY
Civilian noninstitutional population. . . . . . . . . . . . . . . . 40,386 41,003 41,081 40,386 41,102 41,190 40,922 41,003 41,081
Civilian labor force. . . . . . . . . . . . . . . . . . . . . . . . . . . . . . . . 26,709 27,153 27,354 26,772 26,990 27,079 27,044 27,251 27,387
Participation rate. . . . . . . . . . . . . . . . . . . . . . . . . . . . . . . 66.1 66.2 66.6 66.3 65.7 65.7 66.1 66.5 66.7
Employed. . . . . . . . . . . . . . . . . . . . . . . . . . . . . . . . . . . . . . . 25,183 25,527 25,929 25,279 25,448 25,486 25,453 25,727 25,986
Employment-population ratio. . . . . . . . . . . . . . . 62.4 62.3 63.1 62.6 61.9 61.9 62.2 62.7 63.3
Unemployed. . . . . . . . . . . . . . . . . . . . . . . . . . . . . . . . . . . . 1,526 1,626 1,425 1,493 1,541 1,594 1,590 1,523 1,402
Unemployment rate. . . . . . . . . . . . . . . . . . . . . . . . . 5.7 6.0 5.2 5.6 5.7 5.9 5.9 5.6 5.1
Not in labor force. . . . . . . . . . . . . . . . . . . . . . . . . . . . . . . . . 13,677 13,850 13,727 13,613 14,113 14,111 13,879 13,753 13,694
Men, 20 years and over
Civilian labor force. . . . . . . . . . . . . . . . . . . . . . . . . . . . . . . . 14,759 14,879 14,929 14,793 14,881 14,821 14,898 14,938 14,957
Participation rate. . . . . . . . . . . . . . . . . . . . . . . . . . . . . . . 81.1 80.6 80.7 81.3 80.3 79.8 80.9 80.9 80.9
Employed. . . . . . . . . . . . . . . . . . . . . . . . . . . . . . . . . . . . . . . 13,995 14,081 14,217 14,081 14,113 14,102 14,187 14,253 14,291
Employment-population ratio. . . . . . . . . . . . . . . 76.9 76.3 76.9 77.3 76.2 75.9 77.0 77.2 77.3
Unemployed. . . . . . . . . . . . . . . . . . . . . . . . . . . . . . . . . . . . 764 798 712 712 768 720 711 685 666
Unemployment rate. . . . . . . . . . . . . . . . . . . . . . . . . 5.2 5.4 4.8 4.8 5.2 4.9 4.8 4.6 4.5
Women, 20 years and over
Civilian labor force. . . . . . . . . . . . . . . . . . . . . . . . . . . . . . . . 10,836 11,135 11,165 10,808 10,971 11,083 11,028 11,119 11,127
Participation rate. . . . . . . . . . . . . . . . . . . . . . . . . . . . . . . 58.8 59.5 59.5 58.7 58.5 58.9 59.0 59.4 59.3
Employed. . . . . . . . . . . . . . . . . . . . . . . . . . . . . . . . . . . . . . . 10,226 10,501 10,631 10,210 10,411 10,424 10,336 10,494 10,600
Employment-population ratio. . . . . . . . . . . . . . . 55.5 56.1 56.7 55.4 55.5 55.4 55.3 56.0 56.5
Unemployed. . . . . . . . . . . . . . . . . . . . . . . . . . . . . . . . . . . . 610 635 534 598 560 659 692 625 527
Unemployment rate. . . . . . . . . . . . . . . . . . . . . . . . . 5.6 5.7 4.8 5.5 5.1 5.9 6.3 5.6 4.7
Both sexes, 16 to 19 years
Civilian labor force. . . . . . . . . . . . . . . . . . . . . . . . . . . . . . . . 1,115 1,139 1,260 1,171 1,138 1,175 1,117 1,193 1,304
Participation rate. . . . . . . . . . . . . . . . . . . . . . . . . . . . . . . 29.7 29.9 33.0 31.2 29.9 30.8 29.3 31.3 34.1
Employed. . . . . . . . . . . . . . . . . . . . . . . . . . . . . . . . . . . . . . . 962 946 1,081 988 924 960 930 980 1,095
Employment-population ratio. . . . . . . . . . . . . . . 25.6 24.8 28.3 26.3 24.3 25.2 24.4 25.7 28.6
Unemployed. . . . . . . . . . . . . . . . . . . . . . . . . . . . . . . . . . . . 153 193 179 183 214 215 187 214 209
Unemployment rate. . . . . . . . . . . . . . . . . . . . . . . . . 13.7 17.0 14.2 15.6 18.8 18.3 16.7 17.9 16.0
1 The population figures are not adjusted for seasonal variation; therefore, identical numbers appear in the unadjusted and seasonally adjustedcolumns.
NOTE: Persons whose ethnicity is identified as Hispanic or Latino may be of any race. Updated population controls are introduced annually with therelease of January data.

HOUSEHOLD DATATable A-4. Employment status of the civilian population 25 years and over by educational attainment[Numbers in thousands]
Educational attainment
Not seasonally adjusted Seasonally adjusted
Mar.2016
Feb.2017
Mar.2017
Mar.2016
Nov.2016
Dec.2016
Jan.2017
Feb.2017
Mar.2017
Less than a high school diploma
Civilian labor force. . . . . . . . . . . . . . . . . . . . . . . . . . . . . . . . . . 10,817 9,926 10,143 10,773 10,587 10,483 10,533 10,229 10,139
Participation rate. . . . . . . . . . . . . . . . . . . . . . . . . . . . . . . . . . 46.4 44.7 45.1 46.2 45.1 45.0 45.3 46.1 45.1
Employed.. . . . . . . . . . . . . . . . . . . . . . . . . . . . . . . . . . . . . . . . . 9,926 9,030 9,375 9,977 9,753 9,660 9,725 9,424 9,450
Employment-population ratio. . . . . . . . . . . . . . . . . 42.6 40.7 41.7 42.8 41.5 41.4 41.8 42.5 42.1
Unemployed.. . . . . . . . . . . . . . . . . . . . . . . . . . . . . . . . . . . . . . 891 896 768 797 834 823 808 806 689
Unemployment rate. . . . . . . . . . . . . . . . . . . . . . . . . . . . 8.2 9.0 7.6 7.4 7.9 7.9 7.7 7.9 6.8
High school graduates, no college1
Civilian labor force. . . . . . . . . . . . . . . . . . . . . . . . . . . . . . . . . . 35,654 35,768 36,227 35,655 35,833 35,661 35,443 35,853 36,092
Participation rate. . . . . . . . . . . . . . . . . . . . . . . . . . . . . . . . . . 57.5 57.8 58.0 57.5 57.7 57.7 57.9 57.9 57.8
Employed.. . . . . . . . . . . . . . . . . . . . . . . . . . . . . . . . . . . . . . . . . 33,599 33,825 34,324 33,738 34,068 33,860 33,580 34,078 34,315
Employment-population ratio. . . . . . . . . . . . . . . . . 54.2 54.6 54.9 54.4 54.9 54.8 54.9 55.0 54.9
Unemployed.. . . . . . . . . . . . . . . . . . . . . . . . . . . . . . . . . . . . . . 2,055 1,943 1,903 1,918 1,765 1,801 1,863 1,776 1,778
Unemployment rate. . . . . . . . . . . . . . . . . . . . . . . . . . . . 5.8 5.4 5.3 5.4 4.9 5.1 5.3 5.0 4.9
Some college or associate degree
Civilian labor force. . . . . . . . . . . . . . . . . . . . . . . . . . . . . . . . . . 37,929 37,837 37,881 37,891 38,189 38,244 38,007 37,754 37,851
Participation rate. . . . . . . . . . . . . . . . . . . . . . . . . . . . . . . . . . 66.3 66.0 66.2 66.2 66.4 66.1 65.7 65.8 66.1
Employed.. . . . . . . . . . . . . . . . . . . . . . . . . . . . . . . . . . . . . . . . . 36,309 36,193 36,442 36,323 36,702 36,773 36,563 36,245 36,454
Employment-population ratio. . . . . . . . . . . . . . . . . 63.4 63.1 63.6 63.5 63.8 63.6 63.2 63.2 63.7
Unemployed.. . . . . . . . . . . . . . . . . . . . . . . . . . . . . . . . . . . . . . 1,620 1,644 1,439 1,568 1,486 1,472 1,444 1,509 1,397
Unemployment rate. . . . . . . . . . . . . . . . . . . . . . . . . . . . 4.3 4.3 3.8 4.1 3.9 3.8 3.8 4.0 3.7
Bachelor’s degree and higher2
Civilian labor force. . . . . . . . . . . . . . . . . . . . . . . . . . . . . . . . . . 53,715 55,254 54,905 53,489 53,899 54,032 54,271 54,804 54,653
Participation rate. . . . . . . . . . . . . . . . . . . . . . . . . . . . . . . . . . 74.9 74.1 74.2 74.6 73.7 73.6 73.8 73.5 73.9
Employed.. . . . . . . . . . . . . . . . . . . . . . . . . . . . . . . . . . . . . . . . . 52,323 53,943 53,573 52,078 52,656 52,699 52,925 53,498 53,308
Employment-population ratio. . . . . . . . . . . . . . . . . 73.0 72.3 72.4 72.6 72.0 71.7 72.0 71.8 72.0
Unemployed.. . . . . . . . . . . . . . . . . . . . . . . . . . . . . . . . . . . . . . 1,391 1,311 1,332 1,411 1,243 1,333 1,346 1,306 1,345
Unemployment rate. . . . . . . . . . . . . . . . . . . . . . . . . . . . 2.6 2.4 2.4 2.6 2.3 2.5 2.5 2.4 2.5
1 Includes persons with a high school diploma or equivalent.2 Includes persons with bachelor’s, master’s, professional, and doctoral degrees.
NOTE: Updated population controls are introduced annually with the release of January data.

HOUSEHOLD DATATable A-5. Employment status of the civilian population 18 years and over by veteran status, period of service,and sex, not seasonally adjusted[Numbers in thousands]
Employment status, veteran status, and period of service
Total Men Women
Mar.2016
Mar.2017
Mar.2016
Mar.2017
Mar.2016
Mar.2017
VETERANS, 18 years and over
Civilian noninstitutional population. . . . . . . . . . . . . . . . . . . . . . . . . . . . . . . . . . . . . . . . . 20,982 20,635 18,973 18,609 2,009 2,026
Civilian labor force. . . . . . . . . . . . . . . . . . . . . . . . . . . . . . . . . . . . . . . . . . . . . . . . . . . . . . 10,570 10,270 9,305 9,067 1,265 1,203
Participation rate. . . . . . . . . . . . . . . . . . . . . . . . . . . . . . . . . . . . . . . . . . . . . . . . . . . . . . 50.4 49.8 49.0 48.7 62.9 59.4
Employed. . . . . . . . . . . . . . . . . . . . . . . . . . . . . . . . . . . . . . . . . . . . . . . . . . . . . . . . . . . . . 10,095 9,865 8,887 8,728 1,208 1,137
Employment-population ratio. . . . . . . . . . . . . . . . . . . . . . . . . . . . . . . . . . . . . . . 48.1 47.8 46.8 46.9 60.1 56.1
Unemployed. . . . . . . . . . . . . . . . . . . . . . . . . . . . . . . . . . . . . . . . . . . . . . . . . . . . . . . . . . 475 405 419 339 57 66
Unemployment rate. . . . . . . . . . . . . . . . . . . . . . . . . . . . . . . . . . . . . . . . . . . . . . . . . 4.5 3.9 4.5 3.7 4.5 5.5
Not in labor force. . . . . . . . . . . . . . . . . . . . . . . . . . . . . . . . . . . . . . . . . . . . . . . . . . . . . . . . 10,412 10,365 9,668 9,542 744 823
Gulf War-era II veterans
Civilian noninstitutional population. . . . . . . . . . . . . . . . . . . . . . . . . . . . . . . . . . . . . . . . . 3,783 4,008 3,141 3,357 642 651
Civilian labor force. . . . . . . . . . . . . . . . . . . . . . . . . . . . . . . . . . . . . . . . . . . . . . . . . . . . . . 3,039 3,183 2,556 2,746 483 437
Participation rate. . . . . . . . . . . . . . . . . . . . . . . . . . . . . . . . . . . . . . . . . . . . . . . . . . . . . . 80.3 79.4 81.4 81.8 75.2 67.1
Employed. . . . . . . . . . . . . . . . . . . . . . . . . . . . . . . . . . . . . . . . . . . . . . . . . . . . . . . . . . . . . 2,848 3,022 2,392 2,620 456 402
Employment-population ratio. . . . . . . . . . . . . . . . . . . . . . . . . . . . . . . . . . . . . . . 75.3 75.4 76.2 78.1 71.1 61.8
Unemployed. . . . . . . . . . . . . . . . . . . . . . . . . . . . . . . . . . . . . . . . . . . . . . . . . . . . . . . . . . 191 160 165 126 26 35
Unemployment rate. . . . . . . . . . . . . . . . . . . . . . . . . . . . . . . . . . . . . . . . . . . . . . . . . 6.3 5.0 6.4 4.6 5.4 7.9
Not in labor force. . . . . . . . . . . . . . . . . . . . . . . . . . . . . . . . . . . . . . . . . . . . . . . . . . . . . . . . 744 825 584 611 160 214
Gulf War-era I veterans
Civilian noninstitutional population. . . . . . . . . . . . . . . . . . . . . . . . . . . . . . . . . . . . . . . . . 3,404 3,393 2,858 2,822 546 571
Civilian labor force. . . . . . . . . . . . . . . . . . . . . . . . . . . . . . . . . . . . . . . . . . . . . . . . . . . . . . 2,778 2,723 2,363 2,285 415 438
Participation rate. . . . . . . . . . . . . . . . . . . . . . . . . . . . . . . . . . . . . . . . . . . . . . . . . . . . . . 81.6 80.3 82.7 81.0 76.0 76.7
Employed. . . . . . . . . . . . . . . . . . . . . . . . . . . . . . . . . . . . . . . . . . . . . . . . . . . . . . . . . . . . . 2,688 2,623 2,288 2,202 400 421
Employment-population ratio. . . . . . . . . . . . . . . . . . . . . . . . . . . . . . . . . . . . . . . 79.0 77.3 80.0 78.0 73.3 73.7
Unemployed. . . . . . . . . . . . . . . . . . . . . . . . . . . . . . . . . . . . . . . . . . . . . . . . . . . . . . . . . . 90 101 75 83 15 17
Unemployment rate. . . . . . . . . . . . . . . . . . . . . . . . . . . . . . . . . . . . . . . . . . . . . . . . . 3.2 3.7 3.2 3.6 3.5 4.0
Not in labor force. . . . . . . . . . . . . . . . . . . . . . . . . . . . . . . . . . . . . . . . . . . . . . . . . . . . . . . . 626 670 495 537 131 133
World War II, Korean War, and Vietnam-era veterans
Civilian noninstitutional population. . . . . . . . . . . . . . . . . . . . . . . . . . . . . . . . . . . . . . . . . 8,606 8,162 8,298 7,867 308 295
Civilian labor force. . . . . . . . . . . . . . . . . . . . . . . . . . . . . . . . . . . . . . . . . . . . . . . . . . . . . . 2,161 1,887 2,100 1,841 61 46
Participation rate. . . . . . . . . . . . . . . . . . . . . . . . . . . . . . . . . . . . . . . . . . . . . . . . . . . . . . 25.1 23.1 25.3 23.4 19.7 15.8
Employed. . . . . . . . . . . . . . . . . . . . . . . . . . . . . . . . . . . . . . . . . . . . . . . . . . . . . . . . . . . . . 2,076 1,812 2,015 1,766 61 45
Employment-population ratio. . . . . . . . . . . . . . . . . . . . . . . . . . . . . . . . . . . . . . . 24.1 22.2 24.3 22.5 19.7 15.4
Unemployed. . . . . . . . . . . . . . . . . . . . . . . . . . . . . . . . . . . . . . . . . . . . . . . . . . . . . . . . . . 85 75 85 74 0 1
Unemployment rate. . . . . . . . . . . . . . . . . . . . . . . . . . . . . . . . . . . . . . . . . . . . . . . . . 3.9 4.0 4.0 4.0 – –
Not in labor force. . . . . . . . . . . . . . . . . . . . . . . . . . . . . . . . . . . . . . . . . . . . . . . . . . . . . . . . 6,445 6,275 6,198 6,026 247 249
Veterans of other service periods
Civilian noninstitutional population. . . . . . . . . . . . . . . . . . . . . . . . . . . . . . . . . . . . . . . . . 5,189 5,072 4,676 4,563 513 509
Civilian labor force. . . . . . . . . . . . . . . . . . . . . . . . . . . . . . . . . . . . . . . . . . . . . . . . . . . . . . 2,592 2,477 2,286 2,195 306 282
Participation rate. . . . . . . . . . . . . . . . . . . . . . . . . . . . . . . . . . . . . . . . . . . . . . . . . . . . . . 50.0 48.8 48.9 48.1 59.7 55.3
Employed. . . . . . . . . . . . . . . . . . . . . . . . . . . . . . . . . . . . . . . . . . . . . . . . . . . . . . . . . . . . . 2,483 2,408 2,192 2,140 290 268
Employment-population ratio. . . . . . . . . . . . . . . . . . . . . . . . . . . . . . . . . . . . . . . 47.8 47.5 46.9 46.9 56.6 52.7
Unemployed. . . . . . . . . . . . . . . . . . . . . . . . . . . . . . . . . . . . . . . . . . . . . . . . . . . . . . . . . . 110 69 94 56 16 13
Unemployment rate. . . . . . . . . . . . . . . . . . . . . . . . . . . . . . . . . . . . . . . . . . . . . . . . . 4.2 2.8 4.1 2.5 5.2 4.7
Not in labor force. . . . . . . . . . . . . . . . . . . . . . . . . . . . . . . . . . . . . . . . . . . . . . . . . . . . . . . . 2,597 2,595 2,390 2,368 207 227
NONVETERANS, 18 years and over
Civilian noninstitutional population. . . . . . . . . . . . . . . . . . . . . . . . . . . . . . . . . . . . . . . . . 222,857 224,847 98,685 99,825 124,172 125,021
Civilian labor force. . . . . . . . . . . . . . . . . . . . . . . . . . . . . . . . . . . . . . . . . . . . . . . . . . . . . . 146,417 147,565 74,219 74,648 72,198 72,918
Participation rate. . . . . . . . . . . . . . . . . . . . . . . . . . . . . . . . . . . . . . . . . . . . . . . . . . . . . . 65.7 65.6 75.2 74.8 58.1 58.3
Employed. . . . . . . . . . . . . . . . . . . . . . . . . . . . . . . . . . . . . . . . . . . . . . . . . . . . . . . . . . . . . 139,128 141,040 70,344 71,003 68,785 70,037
Employment-population ratio. . . . . . . . . . . . . . . . . . . . . . . . . . . . . . . . . . . . . . . 62.4 62.7 71.3 71.1 55.4 56.0
Unemployed. . . . . . . . . . . . . . . . . . . . . . . . . . . . . . . . . . . . . . . . . . . . . . . . . . . . . . . . . . 7,289 6,525 3,875 3,644 3,414 2,881
Unemployment rate. . . . . . . . . . . . . . . . . . . . . . . . . . . . . . . . . . . . . . . . . . . . . . . . . 5.0 4.4 5.2 4.9 4.7 4.0
Not in labor force. . . . . . . . . . . . . . . . . . . . . . . . . . . . . . . . . . . . . . . . . . . . . . . . . . . . . . . . 76,440 77,282 24,466 25,178 51,974 52,104
NOTE: Veterans served on active duty in the U.S. Armed Forces and were not on active duty at the time of the survey. Nonveterans never served on active duty in theU.S. Armed Forces. Veterans could have served anywhere in the world during these periods of service: Gulf War era II (September 2001-present), Gulf War era I (August1990-August 2001), Vietnam era (August 1964-April 1975), Korean War (July 1950-January 1955), World War II (December 1941-December 1946), and other serviceperiods (all other time periods). Veterans who served in more than one wartime period are classified only in the most recent one. Veterans who served during one of theselected wartime periods and another period are classified only in the wartime period. Dash indicates no data or data that do not meet publication criteria (values notshown where base is less than 75,000).
HOUSEHOLD DATATable A-6. Employment status of the civilian population by sex, age, and disability status, not seasonallyadjusted[Numbers in thousands]
Employment status, sex, and age
Persons with a disability Persons with no disability
Mar.2016
Mar.2017
Mar.2016
Mar.2017
TOTAL, 16 years and over
Civilian noninstitutional population.. . . . . . . . . . . . . . . . . . . . . . . . . . . . . . . . . . . . . . . . . . . . . . . . . . . . . 29,661 30,611 223,107 223,803
Civilian labor force. . . . . . . . . . . . . . . . . . . . . . . . . . . . . . . . . . . . . . . . . . . . . . . . . . . . . . . . . . . . . . . . . . . . . 5,907 6,252 152,948 153,661
Participation rate. . . . . . . . . . . . . . . . . . . . . . . . . . . . . . . . . . . . . . . . . . . . . . . . . . . . . . . . . . . . . . . . . . . . . 19.9 20.4 68.6 68.7
Employed.. . . . . . . . . . . . . . . . . . . . . . . . . . . . . . . . . . . . . . . . . . . . . . . . . . . . . . . . . . . . . . . . . . . . . . . . . . . . 5,269 5,589 145,469 147,039
Employment-population ratio. . . . . . . . . . . . . . . . . . . . . . . . . . . . . . . . . . . . . . . . . . . . . . . . . . . . 17.8 18.3 65.2 65.7
Unemployed.. . . . . . . . . . . . . . . . . . . . . . . . . . . . . . . . . . . . . . . . . . . . . . . . . . . . . . . . . . . . . . . . . . . . . . . . . 638 663 7,479 6,621
Unemployment rate. . . . . . . . . . . . . . . . . . . . . . . . . . . . . . . . . . . . . . . . . . . . . . . . . . . . . . . . . . . . . . . 10.8 10.6 4.9 4.3
Not in labor force.. . . . . . . . . . . . . . . . . . . . . . . . . . . . . . . . . . . . . . . . . . . . . . . . . . . . . . . . . . . . . . . . . . . . . . 23,754 24,359 70,160 70,143
Men, 16 to 64 years
Civilian labor force. . . . . . . . . . . . . . . . . . . . . . . . . . . . . . . . . . . . . . . . . . . . . . . . . . . . . . . . . . . . . . . . . . . . . 2,561 2,730 76,673 76,681
Participation rate. . . . . . . . . . . . . . . . . . . . . . . . . . . . . . . . . . . . . . . . . . . . . . . . . . . . . . . . . . . . . . . . . . . . . 33.7 34.8 82.2 82.3
Employed.. . . . . . . . . . . . . . . . . . . . . . . . . . . . . . . . . . . . . . . . . . . . . . . . . . . . . . . . . . . . . . . . . . . . . . . . . . . . 2,233 2,430 72,689 73,011
Employment-population ratio. . . . . . . . . . . . . . . . . . . . . . . . . . . . . . . . . . . . . . . . . . . . . . . . . . . . 29.4 30.9 77.9 78.4
Unemployed.. . . . . . . . . . . . . . . . . . . . . . . . . . . . . . . . . . . . . . . . . . . . . . . . . . . . . . . . . . . . . . . . . . . . . . . . . 328 300 3,984 3,670
Unemployment rate. . . . . . . . . . . . . . . . . . . . . . . . . . . . . . . . . . . . . . . . . . . . . . . . . . . . . . . . . . . . . . . 12.8 11.0 5.2 4.8
Not in labor force.. . . . . . . . . . . . . . . . . . . . . . . . . . . . . . . . . . . . . . . . . . . . . . . . . . . . . . . . . . . . . . . . . . . . . . 5,039 5,124 16,593 16,474
Women, 16 to 64 years
Civilian labor force. . . . . . . . . . . . . . . . . . . . . . . . . . . . . . . . . . . . . . . . . . . . . . . . . . . . . . . . . . . . . . . . . . . . . 2,295 2,388 68,062 68,549
Participation rate. . . . . . . . . . . . . . . . . . . . . . . . . . . . . . . . . . . . . . . . . . . . . . . . . . . . . . . . . . . . . . . . . . . . . 28.4 29.8 70.7 71.2
Employed.. . . . . . . . . . . . . . . . . . . . . . . . . . . . . . . . . . . . . . . . . . . . . . . . . . . . . . . . . . . . . . . . . . . . . . . . . . . . 2,049 2,102 64,842 65,919
Employment-population ratio. . . . . . . . . . . . . . . . . . . . . . . . . . . . . . . . . . . . . . . . . . . . . . . . . . . . 25.4 26.3 67.3 68.4
Unemployed.. . . . . . . . . . . . . . . . . . . . . . . . . . . . . . . . . . . . . . . . . . . . . . . . . . . . . . . . . . . . . . . . . . . . . . . . . 245 286 3,220 2,630
Unemployment rate. . . . . . . . . . . . . . . . . . . . . . . . . . . . . . . . . . . . . . . . . . . . . . . . . . . . . . . . . . . . . . . 10.7 12.0 4.7 3.8
Not in labor force.. . . . . . . . . . . . . . . . . . . . . . . . . . . . . . . . . . . . . . . . . . . . . . . . . . . . . . . . . . . . . . . . . . . . . . 5,773 5,617 28,248 27,789
Both sexes, 65 years and over
Civilian labor force. . . . . . . . . . . . . . . . . . . . . . . . . . . . . . . . . . . . . . . . . . . . . . . . . . . . . . . . . . . . . . . . . . . . . 1,051 1,134 8,212 8,431
Participation rate. . . . . . . . . . . . . . . . . . . . . . . . . . . . . . . . . . . . . . . . . . . . . . . . . . . . . . . . . . . . . . . . . . . . . 7.5 7.7 24.5 24.6
Employed.. . . . . . . . . . . . . . . . . . . . . . . . . . . . . . . . . . . . . . . . . . . . . . . . . . . . . . . . . . . . . . . . . . . . . . . . . . . . 987 1,057 7,938 8,109
Employment-population ratio. . . . . . . . . . . . . . . . . . . . . . . . . . . . . . . . . . . . . . . . . . . . . . . . . . . . 7.0 7.2 23.7 23.6
Unemployed.. . . . . . . . . . . . . . . . . . . . . . . . . . . . . . . . . . . . . . . . . . . . . . . . . . . . . . . . . . . . . . . . . . . . . . . . . 65 77 275 321
Unemployment rate. . . . . . . . . . . . . . . . . . . . . . . . . . . . . . . . . . . . . . . . . . . . . . . . . . . . . . . . . . . . . . . 6.2 6.8 3.3 3.8
Not in labor force.. . . . . . . . . . . . . . . . . . . . . . . . . . . . . . . . . . . . . . . . . . . . . . . . . . . . . . . . . . . . . . . . . . . . . . 12,943 13,618 25,318 25,880
NOTE: A person with a disability has at least one of the following conditions: is deaf or has serious difficulty hearing; is blind or has serious difficultyseeing even when wearing glasses; has serious difficulty concentrating, remembering, or making decisions because of a physical, mental, oremotional condition; has serious difficulty walking or climbing stairs; has difficulty dressing or bathing; or has difficulty doing errands alone such asvisiting a doctor’s office or shopping because of a physical, mental, or emotional condition. Updated population controls are introduced annually withthe release of January data.
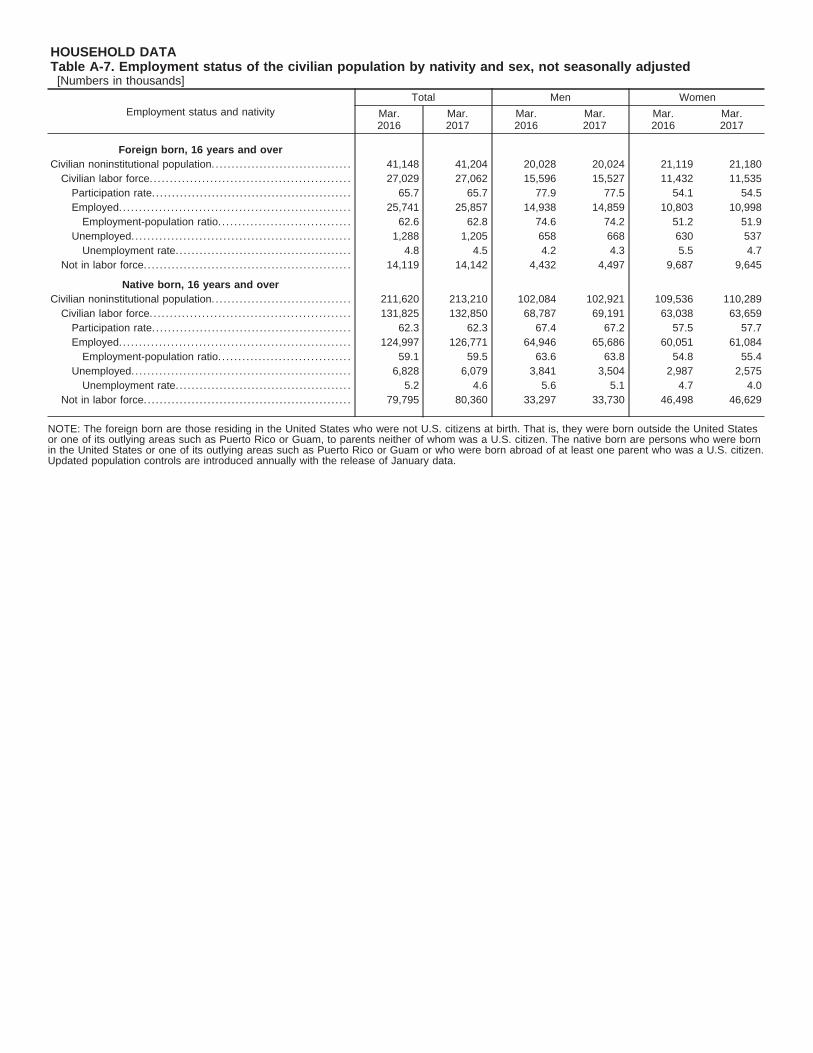
HOUSEHOLD DATATable A-7. Employment status of the civilian population by nativity and sex, not seasonally adjusted[Numbers in thousands]
Employment status and nativity
Total Men Women
Mar.2016
Mar.2017
Mar.2016
Mar.2017
Mar.2016
Mar.2017
Foreign born, 16 years and over
Civilian noninstitutional population.. . . . . . . . . . . . . . . . . . . . . . . . . . . . . . . . . . 41,148 41,204 20,028 20,024 21,119 21,180
Civilian labor force. . . . . . . . . . . . . . . . . . . . . . . . . . . . . . . . . . . . . . . . . . . . . . . . . . 27,029 27,062 15,596 15,527 11,432 11,535
Participation rate. . . . . . . . . . . . . . . . . . . . . . . . . . . . . . . . . . . . . . . . . . . . . . . . . . 65.7 65.7 77.9 77.5 54.1 54.5
Employed.. . . . . . . . . . . . . . . . . . . . . . . . . . . . . . . . . . . . . . . . . . . . . . . . . . . . . . . . . 25,741 25,857 14,938 14,859 10,803 10,998
Employment-population ratio. . . . . . . . . . . . . . . . . . . . . . . . . . . . . . . . . 62.6 62.8 74.6 74.2 51.2 51.9
Unemployed.. . . . . . . . . . . . . . . . . . . . . . . . . . . . . . . . . . . . . . . . . . . . . . . . . . . . . . 1,288 1,205 658 668 630 537
Unemployment rate. . . . . . . . . . . . . . . . . . . . . . . . . . . . . . . . . . . . . . . . . . . . 4.8 4.5 4.2 4.3 5.5 4.7
Not in labor force.. . . . . . . . . . . . . . . . . . . . . . . . . . . . . . . . . . . . . . . . . . . . . . . . . . . 14,119 14,142 4,432 4,497 9,687 9,645
Native born, 16 years and over
Civilian noninstitutional population.. . . . . . . . . . . . . . . . . . . . . . . . . . . . . . . . . . 211,620 213,210 102,084 102,921 109,536 110,289
Civilian labor force. . . . . . . . . . . . . . . . . . . . . . . . . . . . . . . . . . . . . . . . . . . . . . . . . . 131,825 132,850 68,787 69,191 63,038 63,659
Participation rate. . . . . . . . . . . . . . . . . . . . . . . . . . . . . . . . . . . . . . . . . . . . . . . . . . 62.3 62.3 67.4 67.2 57.5 57.7
Employed.. . . . . . . . . . . . . . . . . . . . . . . . . . . . . . . . . . . . . . . . . . . . . . . . . . . . . . . . . 124,997 126,771 64,946 65,686 60,051 61,084
Employment-population ratio. . . . . . . . . . . . . . . . . . . . . . . . . . . . . . . . . 59.1 59.5 63.6 63.8 54.8 55.4
Unemployed.. . . . . . . . . . . . . . . . . . . . . . . . . . . . . . . . . . . . . . . . . . . . . . . . . . . . . . 6,828 6,079 3,841 3,504 2,987 2,575
Unemployment rate. . . . . . . . . . . . . . . . . . . . . . . . . . . . . . . . . . . . . . . . . . . . 5.2 4.6 5.6 5.1 4.7 4.0
Not in labor force.. . . . . . . . . . . . . . . . . . . . . . . . . . . . . . . . . . . . . . . . . . . . . . . . . . . 79,795 80,360 33,297 33,730 46,498 46,629
NOTE: The foreign born are those residing in the United States who were not U.S. citizens at birth. That is, they were born outside the United Statesor one of its outlying areas such as Puerto Rico or Guam, to parents neither of whom was a U.S. citizen. The native born are persons who were bornin the United States or one of its outlying areas such as Puerto Rico or Guam or who were born abroad of at least one parent who was a U.S. citizen.Updated population controls are introduced annually with the release of January data.
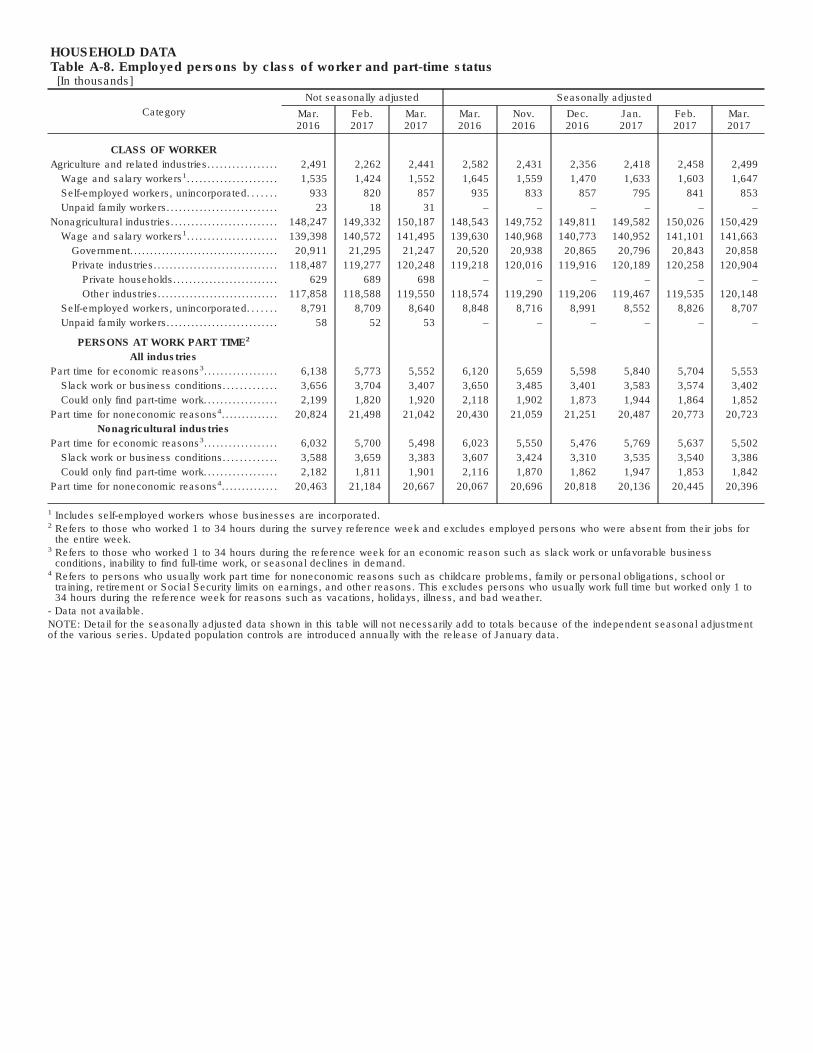
HOUSEHOLD DATATable A-8. Employed persons by class of worker and part-time status[In thousands]
Category
Not seasonally adjusted Seasonally adjusted
Mar.2016
Feb.2017
Mar.2017
Mar.2016
Nov.2016
Dec.2016
Jan.2017
Feb.2017
Mar.2017
CLASS OF WORKER
Agriculture and related industries. . . . . . . . . . . . . . . . . 2,491 2,262 2,441 2,582 2,431 2,356 2,418 2,458 2,499
Wage and salary workers1. . . . . . . . . . . . . . . . . . . . . . 1,535 1,424 1,552 1,645 1,559 1,470 1,633 1,603 1,647
Self-employed workers, unincorporated. . . . . . . 933 820 857 935 833 857 795 841 853
Unpaid family workers. . . . . . . . . . . . . . . . . . . . . . . . . . . 23 18 31 – – – – – –
Nonagricultural industries. . . . . . . . . . . . . . . . . . . . . . . . . . 148,247 149,332 150,187 148,543 149,752 149,811 149,582 150,026 150,429
Wage and salary workers1. . . . . . . . . . . . . . . . . . . . . . 139,398 140,572 141,495 139,630 140,968 140,773 140,952 141,101 141,663
Government. . . . . . . . . . . . . . . . . . . . . . . . . . . . . . . . . . . . . 20,911 21,295 21,247 20,520 20,938 20,865 20,796 20,843 20,858
Private industries. . . . . . . . . . . . . . . . . . . . . . . . . . . . . . . 118,487 119,277 120,248 119,218 120,016 119,916 120,189 120,258 120,904
Private households. . . . . . . . . . . . . . . . . . . . . . . . . . 629 689 698 – – – – – –
Other industries. . . . . . . . . . . . . . . . . . . . . . . . . . . . . . 117,858 118,588 119,550 118,574 119,290 119,206 119,467 119,535 120,148
Self-employed workers, unincorporated. . . . . . . 8,791 8,709 8,640 8,848 8,716 8,991 8,552 8,826 8,707
Unpaid family workers. . . . . . . . . . . . . . . . . . . . . . . . . . . 58 52 53 – – – – – –
PERSONS AT WORK PART TIME2
All industries
Part time for economic reasons3. . . . . . . . . . . . . . . . . . 6,138 5,773 5,552 6,120 5,659 5,598 5,840 5,704 5,553
Slack work or business conditions. . . . . . . . . . . . . 3,656 3,704 3,407 3,650 3,485 3,401 3,583 3,574 3,402
Could only find part-time work. . . . . . . . . . . . . . . . . . 2,199 1,820 1,920 2,118 1,902 1,873 1,944 1,864 1,852
Part time for noneconomic reasons4. . . . . . . . . . . . . . 20,824 21,498 21,042 20,430 21,059 21,251 20,487 20,773 20,723
Nonagricultural industries
Part time for economic reasons3. . . . . . . . . . . . . . . . . . 6,032 5,700 5,498 6,023 5,550 5,476 5,769 5,637 5,502
Slack work or business conditions. . . . . . . . . . . . . 3,588 3,659 3,383 3,607 3,424 3,310 3,535 3,540 3,386
Could only find part-time work. . . . . . . . . . . . . . . . . . 2,182 1,811 1,901 2,116 1,870 1,862 1,947 1,853 1,842
Part time for noneconomic reasons4. . . . . . . . . . . . . . 20,463 21,184 20,667 20,067 20,696 20,818 20,136 20,445 20,396
1 Includes self-employed workers whose businesses are incorporated.2 Refers to those who worked 1 to 34 hours during the survey reference week and excludes employed persons who were absent from their jobs for
the entire week.3 Refers to those who worked 1 to 34 hours during the reference week for an economic reason such as slack work or unfavorable business
conditions, inability to find full-time work, or seasonal declines in demand.4 Refers to persons who usually work part time for noneconomic reasons such as childcare problems, family or personal obligations, school or
training, retirement or Social Security limits on earnings, and other reasons. This excludes persons who usually work full time but worked only 1 to34 hours during the reference week for reasons such as vacations, holidays, illness, and bad weather.
- Data not available.
NOTE: Detail for the seasonally adjusted data shown in this table will not necessarily add to totals because of the independent seasonal adjustmentof the various series. Updated population controls are introduced annually with the release of January data.
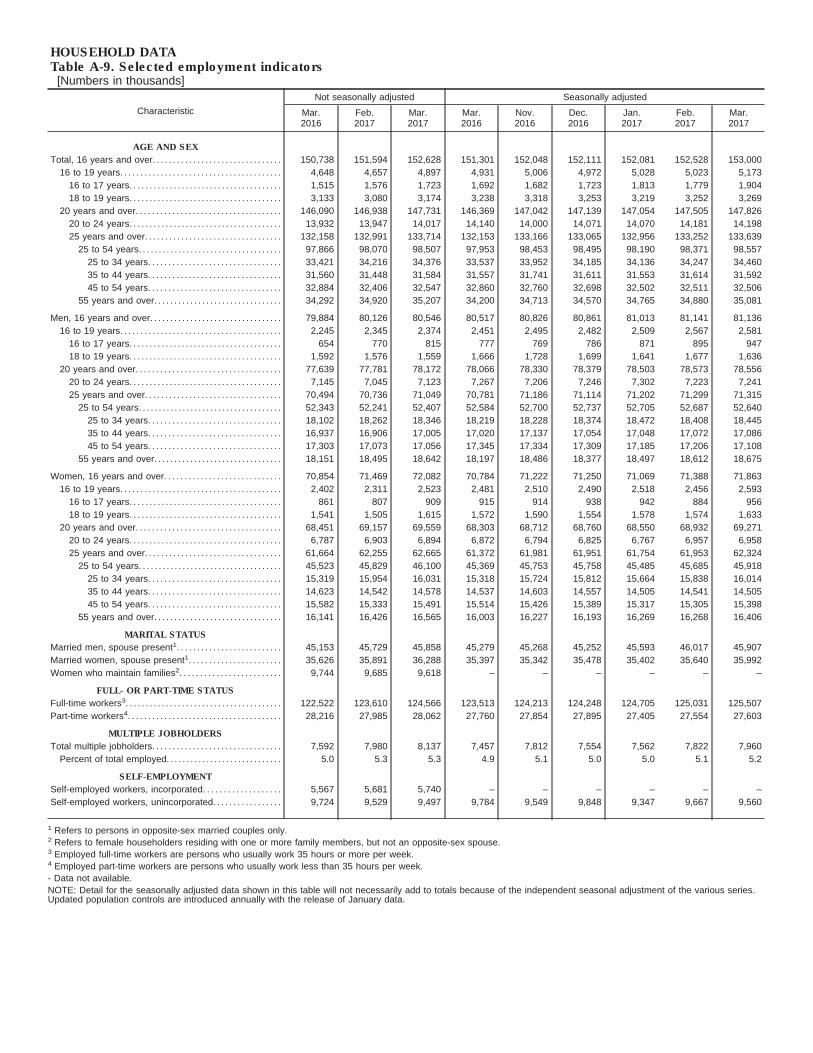
HOUSEHOLD DATATable A-9. Selected employment indicators[Numbers in thousands]
Characteristic
Not seasonally adjusted Seasonally adjusted
Mar.2016
Feb.2017
Mar.2017
Mar.2016
Nov.2016
Dec.2016
Jan.2017
Feb.2017
Mar.2017
AGE AND SEX
Total, 16 years and over. . . . . . . . . . . . . . . . . . . . . . . . . . . . . . . . 150,738 151,594 152,628 151,301 152,048 152,111 152,081 152,528 153,000
16 to 19 years. . . . . . . . . . . . . . . . . . . . . . . . . . . . . . . . . . . . . . . . 4,648 4,657 4,897 4,931 5,006 4,972 5,028 5,023 5,173
16 to 17 years. . . . . . . . . . . . . . . . . . . . . . . . . . . . . . . . . . . . . . 1,515 1,576 1,723 1,692 1,682 1,723 1,813 1,779 1,904
18 to 19 years. . . . . . . . . . . . . . . . . . . . . . . . . . . . . . . . . . . . . . 3,133 3,080 3,174 3,238 3,318 3,253 3,219 3,252 3,269
20 years and over. . . . . . . . . . . . . . . . . . . . . . . . . . . . . . . . . . . . 146,090 146,938 147,731 146,369 147,042 147,139 147,054 147,505 147,826
20 to 24 years. . . . . . . . . . . . . . . . . . . . . . . . . . . . . . . . . . . . . . 13,932 13,947 14,017 14,140 14,000 14,071 14,070 14,181 14,198
25 years and over. . . . . . . . . . . . . . . . . . . . . . . . . . . . . . . . . . 132,158 132,991 133,714 132,153 133,166 133,065 132,956 133,252 133,639
25 to 54 years. . . . . . . . . . . . . . . . . . . . . . . . . . . . . . . . . . . . 97,866 98,070 98,507 97,953 98,453 98,495 98,190 98,371 98,557
25 to 34 years. . . . . . . . . . . . . . . . . . . . . . . . . . . . . . . . . 33,421 34,216 34,376 33,537 33,952 34,185 34,136 34,247 34,460
35 to 44 years. . . . . . . . . . . . . . . . . . . . . . . . . . . . . . . . . 31,560 31,448 31,584 31,557 31,741 31,611 31,553 31,614 31,592
45 to 54 years. . . . . . . . . . . . . . . . . . . . . . . . . . . . . . . . . 32,884 32,406 32,547 32,860 32,760 32,698 32,502 32,511 32,506
55 years and over. . . . . . . . . . . . . . . . . . . . . . . . . . . . . . . . 34,292 34,920 35,207 34,200 34,713 34,570 34,765 34,880 35,081
Men, 16 years and over. . . . . . . . . . . . . . . . . . . . . . . . . . . . . . . . . 79,884 80,126 80,546 80,517 80,826 80,861 81,013 81,141 81,136
16 to 19 years. . . . . . . . . . . . . . . . . . . . . . . . . . . . . . . . . . . . . . . . 2,245 2,345 2,374 2,451 2,495 2,482 2,509 2,567 2,581
16 to 17 years. . . . . . . . . . . . . . . . . . . . . . . . . . . . . . . . . . . . . . 654 770 815 777 769 786 871 895 947
18 to 19 years. . . . . . . . . . . . . . . . . . . . . . . . . . . . . . . . . . . . . . 1,592 1,576 1,559 1,666 1,728 1,699 1,641 1,677 1,636
20 years and over. . . . . . . . . . . . . . . . . . . . . . . . . . . . . . . . . . . . 77,639 77,781 78,172 78,066 78,330 78,379 78,503 78,573 78,556
20 to 24 years. . . . . . . . . . . . . . . . . . . . . . . . . . . . . . . . . . . . . . 7,145 7,045 7,123 7,267 7,206 7,246 7,302 7,223 7,241
25 years and over. . . . . . . . . . . . . . . . . . . . . . . . . . . . . . . . . . 70,494 70,736 71,049 70,781 71,186 71,114 71,202 71,299 71,315
25 to 54 years. . . . . . . . . . . . . . . . . . . . . . . . . . . . . . . . . . . . 52,343 52,241 52,407 52,584 52,700 52,737 52,705 52,687 52,640
25 to 34 years. . . . . . . . . . . . . . . . . . . . . . . . . . . . . . . . . 18,102 18,262 18,346 18,219 18,228 18,374 18,472 18,408 18,445
35 to 44 years. . . . . . . . . . . . . . . . . . . . . . . . . . . . . . . . . 16,937 16,906 17,005 17,020 17,137 17,054 17,048 17,072 17,086
45 to 54 years. . . . . . . . . . . . . . . . . . . . . . . . . . . . . . . . . 17,303 17,073 17,056 17,345 17,334 17,309 17,185 17,206 17,108
55 years and over. . . . . . . . . . . . . . . . . . . . . . . . . . . . . . . . 18,151 18,495 18,642 18,197 18,486 18,377 18,497 18,612 18,675
Women, 16 years and over. . . . . . . . . . . . . . . . . . . . . . . . . . . . . 70,854 71,469 72,082 70,784 71,222 71,250 71,069 71,388 71,863
16 to 19 years. . . . . . . . . . . . . . . . . . . . . . . . . . . . . . . . . . . . . . . . 2,402 2,311 2,523 2,481 2,510 2,490 2,518 2,456 2,593
16 to 17 years. . . . . . . . . . . . . . . . . . . . . . . . . . . . . . . . . . . . . . 861 807 909 915 914 938 942 884 956
18 to 19 years. . . . . . . . . . . . . . . . . . . . . . . . . . . . . . . . . . . . . . 1,541 1,505 1,615 1,572 1,590 1,554 1,578 1,574 1,633
20 years and over. . . . . . . . . . . . . . . . . . . . . . . . . . . . . . . . . . . . 68,451 69,157 69,559 68,303 68,712 68,760 68,550 68,932 69,271
20 to 24 years. . . . . . . . . . . . . . . . . . . . . . . . . . . . . . . . . . . . . . 6,787 6,903 6,894 6,872 6,794 6,825 6,767 6,957 6,958
25 years and over. . . . . . . . . . . . . . . . . . . . . . . . . . . . . . . . . . 61,664 62,255 62,665 61,372 61,981 61,951 61,754 61,953 62,324
25 to 54 years. . . . . . . . . . . . . . . . . . . . . . . . . . . . . . . . . . . . 45,523 45,829 46,100 45,369 45,753 45,758 45,485 45,685 45,918
25 to 34 years. . . . . . . . . . . . . . . . . . . . . . . . . . . . . . . . . 15,319 15,954 16,031 15,318 15,724 15,812 15,664 15,838 16,014
35 to 44 years. . . . . . . . . . . . . . . . . . . . . . . . . . . . . . . . . 14,623 14,542 14,578 14,537 14,603 14,557 14,505 14,541 14,505
45 to 54 years. . . . . . . . . . . . . . . . . . . . . . . . . . . . . . . . . 15,582 15,333 15,491 15,514 15,426 15,389 15,317 15,305 15,398
55 years and over. . . . . . . . . . . . . . . . . . . . . . . . . . . . . . . . 16,141 16,426 16,565 16,003 16,227 16,193 16,269 16,268 16,406
MARITAL STATUS
Married men, spouse present1. . . . . . . . . . . . . . . . . . . . . . . . . . 45,153 45,729 45,858 45,279 45,268 45,252 45,593 46,017 45,907
Married women, spouse present1. . . . . . . . . . . . . . . . . . . . . . . 35,626 35,891 36,288 35,397 35,342 35,478 35,402 35,640 35,992
Women who maintain families2. . . . . . . . . . . . . . . . . . . . . . . . . 9,744 9,685 9,618 – – – – – –
FULL- OR PART-TIME STATUS
Full-time workers3. . . . . . . . . . . . . . . . . . . . . . . . . . . . . . . . . . . . . . . 122,522 123,610 124,566 123,513 124,213 124,248 124,705 125,031 125,507
Part-time workers4. . . . . . . . . . . . . . . . . . . . . . . . . . . . . . . . . . . . . . 28,216 27,985 28,062 27,760 27,854 27,895 27,405 27,554 27,603
MULTIPLE JOBHOLDERS
Total multiple jobholders. . . . . . . . . . . . . . . . . . . . . . . . . . . . . . . . 7,592 7,980 8,137 7,457 7,812 7,554 7,562 7,822 7,960
Percent of total employed. . . . . . . . . . . . . . . . . . . . . . . . . . . . . 5.0 5.3 5.3 4.9 5.1 5.0 5.0 5.1 5.2
SELF-EMPLOYMENT
Self-employed workers, incorporated. . . . . . . . . . . . . . . . . . . 5,567 5,681 5,740 – – – – – –
Self-employed workers, unincorporated. . . . . . . . . . . . . . . . . 9,724 9,529 9,497 9,784 9,549 9,848 9,347 9,667 9,560
1 Refers to persons in opposite-sex married couples only.2 Refers to female householders residing with one or more family members, but not an opposite-sex spouse.3 Employed full-time workers are persons who usually work 35 hours or more per week.4 Employed part-time workers are persons who usually work less than 35 hours per week.
- Data not available.
NOTE: Detail for the seasonally adjusted data shown in this table will not necessarily add to totals because of the independent seasonal adjustment of the various series.Updated population controls are introduced annually with the release of January data.

HOUSEHOLD DATATable A-10. Selected unemployment indicators, seasonally adjusted
Characteristic
Number ofunemployed persons
(in thousands)Unemployment rates
Mar.2016
Feb.2017
Mar.2017
Mar.2016
Nov.2016
Dec.2016
Jan.2017
Feb.2017
Mar.2017
AGE AND SEX
Total, 16 years and over. . . . . . . . . . . . . . . . . . . . . . . . . . . 7,977 7,528 7,202 5.0 4.6 4.7 4.8 4.7 4.5
16 to 19 years. . . . . . . . . . . . . . . . . . . . . . . . . . . . . . . . . . . . . 929 884 822 15.9 15.2 14.7 15.0 15.0 13.7
16 to 17 years. . . . . . . . . . . . . . . . . . . . . . . . . . . . . . . . . . 409 390 400 19.5 18.1 17.6 16.0 18.0 17.4
18 to 19 years. . . . . . . . . . . . . . . . . . . . . . . . . . . . . . . . . . 530 509 412 14.1 14.2 13.1 14.5 13.5 11.2
20 years and over. . . . . . . . . . . . . . . . . . . . . . . . . . . . . . . . 7,047 6,643 6,380 4.6 4.2 4.3 4.4 4.3 4.1
20 to 24 years. . . . . . . . . . . . . . . . . . . . . . . . . . . . . . . . . . 1,300 1,232 1,122 8.4 8.1 8.2 8.3 8.0 7.3
25 years and over. . . . . . . . . . . . . . . . . . . . . . . . . . . . . . 5,730 5,398 5,256 4.2 3.9 3.9 3.9 3.9 3.8
25 to 54 years. . . . . . . . . . . . . . . . . . . . . . . . . . . . . . . 4,328 4,159 4,020 4.2 4.0 4.0 4.1 4.1 3.9
25 to 34 years. . . . . . . . . . . . . . . . . . . . . . . . . . . . . 1,828 1,726 1,642 5.2 4.8 4.7 4.9 4.8 4.5
35 to 44 years. . . . . . . . . . . . . . . . . . . . . . . . . . . . . 1,264 1,353 1,289 3.9 3.5 4.0 3.9 4.1 3.9
45 to 54 years. . . . . . . . . . . . . . . . . . . . . . . . . . . . . 1,236 1,080 1,089 3.6 3.5 3.3 3.3 3.2 3.2
55 years and over. . . . . . . . . . . . . . . . . . . . . . . . . . . 1,392 1,235 1,224 3.9 3.5 3.6 3.5 3.4 3.4
Men, 16 years and over. . . . . . . . . . . . . . . . . . . . . . . . . . . . 4,234 4,053 3,940 5.0 4.8 4.8 4.8 4.8 4.6
16 to 19 years. . . . . . . . . . . . . . . . . . . . . . . . . . . . . . . . . . . . . 500 489 449 17.0 18.0 17.1 15.9 16.0 14.8
16 to 17 years. . . . . . . . . . . . . . . . . . . . . . . . . . . . . . . . . . 230 192 203 22.8 23.3 21.1 17.2 17.7 17.7
18 to 19 years. . . . . . . . . . . . . . . . . . . . . . . . . . . . . . . . . . 282 303 240 14.5 16.1 14.8 15.1 15.3 12.8
20 years and over. . . . . . . . . . . . . . . . . . . . . . . . . . . . . . . . 3,734 3,564 3,491 4.6 4.3 4.4 4.4 4.3 4.3
20 to 24 years. . . . . . . . . . . . . . . . . . . . . . . . . . . . . . . . . . 732 751 676 9.1 9.1 9.2 9.3 9.4 8.5
25 years and over. . . . . . . . . . . . . . . . . . . . . . . . . . . . . . 2,988 2,802 2,805 4.1 3.8 3.9 3.8 3.8 3.8
25 to 54 years. . . . . . . . . . . . . . . . . . . . . . . . . . . . . . . 2,243 2,157 2,151 4.1 3.9 3.9 4.0 3.9 3.9
25 to 34 years. . . . . . . . . . . . . . . . . . . . . . . . . . . . . 961 960 931 5.0 4.8 4.7 4.9 5.0 4.8
35 to 44 years. . . . . . . . . . . . . . . . . . . . . . . . . . . . . 631 669 666 3.6 3.5 3.8 3.9 3.8 3.8
45 to 54 years. . . . . . . . . . . . . . . . . . . . . . . . . . . . . 651 528 554 3.6 3.3 3.2 3.1 3.0 3.1
55 years and over. . . . . . . . . . . . . . . . . . . . . . . . . . . 745 645 654 3.9 3.6 3.7 3.3 3.4 3.4
Women, 16 years and over. . . . . . . . . . . . . . . . . . . . . . . . 3,743 3,475 3,262 5.0 4.5 4.6 4.8 4.6 4.3
16 to 19 years. . . . . . . . . . . . . . . . . . . . . . . . . . . . . . . . . . . . . 429 396 372 14.7 12.2 12.0 14.2 13.9 12.6
16 to 17 years. . . . . . . . . . . . . . . . . . . . . . . . . . . . . . . . . . 179 198 196 16.3 13.1 14.4 14.8 18.3 17.0
18 to 19 years. . . . . . . . . . . . . . . . . . . . . . . . . . . . . . . . . . 248 206 172 13.6 12.1 11.1 13.8 11.6 9.6
20 years and over. . . . . . . . . . . . . . . . . . . . . . . . . . . . . . . . 3,314 3,079 2,890 4.6 4.2 4.3 4.4 4.3 4.0
20 to 24 years. . . . . . . . . . . . . . . . . . . . . . . . . . . . . . . . . . 569 481 446 7.6 7.0 7.0 7.1 6.5 6.0
25 years and over. . . . . . . . . . . . . . . . . . . . . . . . . . . . . . 2,742 2,595 2,451 4.3 3.9 3.9 4.0 4.0 3.8
25 to 54 years. . . . . . . . . . . . . . . . . . . . . . . . . . . . . . . 2,085 2,002 1,869 4.4 4.0 4.1 4.2 4.2 3.9
25 to 34 years. . . . . . . . . . . . . . . . . . . . . . . . . . . . . 867 766 711 5.4 4.8 4.7 5.0 4.6 4.2
35 to 44 years. . . . . . . . . . . . . . . . . . . . . . . . . . . . . 632 684 623 4.2 3.6 4.1 4.1 4.5 4.1
45 to 54 years. . . . . . . . . . . . . . . . . . . . . . . . . . . . . 585 552 536 3.6 3.7 3.5 3.5 3.5 3.4
55 years and over. . . . . . . . . . . . . . . . . . . . . . . . . . . 635 588 567 3.8 3.4 3.6 3.6 3.5 3.3
MARITAL STATUS
Married men, spouse present1. . . . . . . . . . . . . . . . . . . . 1,347 1,234 1,228 2.9 2.7 2.7 2.7 2.6 2.6
Married women, spouse present1. . . . . . . . . . . . . . . . . 1,136 1,122 1,043 3.1 2.7 2.9 3.1 3.1 2.8
Women who maintain families2. . . . . . . . . . . . . . . . . . . . 713 671 557 6.8 6.2 5.8 6.3 6.5 5.5
FULL- OR PART-TIME STATUS
Full-time workers3. . . . . . . . . . . . . . . . . . . . . . . . . . . . . . . . . . . 6,597 6,035 5,760 5.1 4.7 4.7 4.8 4.6 4.4
Part-time workers4. . . . . . . . . . . . . . . . . . . . . . . . . . . . . . . . . . 1,388 1,471 1,414 4.8 4.5 4.9 4.8 5.1 4.9
1 Refers to persons in opposite-sex couples only.2 Data are not seasonally adjusted. Refers to female householders residing with one or more family members, but not an opposite-sex spouse.3 Full-time workers are unemployed persons who have expressed a desire to work full time (35 hours or more per week) or are on layoff from full-time
jobs.4 Part-time workers are unemployed persons who have expressed a desire to work part time (less than 35 hours per week) or are on layoff from
part-time jobs.
NOTE: Detail for the seasonally adjusted data shown in this table will not necessarily add to totals because of the independent seasonal adjustmentof the various series. Updated population controls are introduced annually with the release of January data.
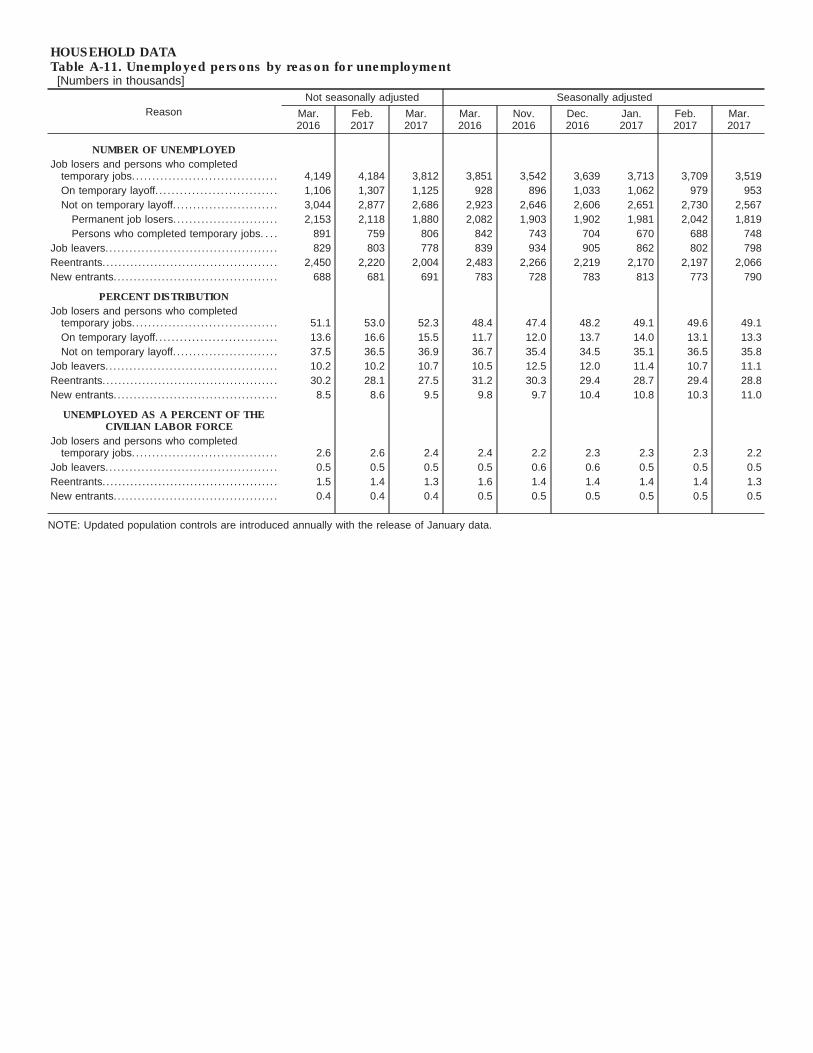
HOUSEHOLD DATATable A-11. Unemployed persons by reason for unemployment[Numbers in thousands]
Reason
Not seasonally adjusted Seasonally adjusted
Mar.2016
Feb.2017
Mar.2017
Mar.2016
Nov.2016
Dec.2016
Jan.2017
Feb.2017
Mar.2017
NUMBER OF UNEMPLOYED
Job losers and persons who completedtemporary jobs. . . . . . . . . . . . . . . . . . . . . . . . . . . . . . . . . . . . 4,149 4,184 3,812 3,851 3,542 3,639 3,713 3,709 3,519
On temporary layoff. . . . . . . . . . . . . . . . . . . . . . . . . . . . . . 1,106 1,307 1,125 928 896 1,033 1,062 979 953
Not on temporary layoff. . . . . . . . . . . . . . . . . . . . . . . . . . 3,044 2,877 2,686 2,923 2,646 2,606 2,651 2,730 2,567
Permanent job losers. . . . . . . . . . . . . . . . . . . . . . . . . . 2,153 2,118 1,880 2,082 1,903 1,902 1,981 2,042 1,819
Persons who completed temporary jobs. . . . 891 759 806 842 743 704 670 688 748
Job leavers. . . . . . . . . . . . . . . . . . . . . . . . . . . . . . . . . . . . . . . . . . . 829 803 778 839 934 905 862 802 798
Reentrants. . . . . . . . . . . . . . . . . . . . . . . . . . . . . . . . . . . . . . . . . . . . 2,450 2,220 2,004 2,483 2,266 2,219 2,170 2,197 2,066
New entrants. . . . . . . . . . . . . . . . . . . . . . . . . . . . . . . . . . . . . . . . . 688 681 691 783 728 783 813 773 790
PERCENT DISTRIBUTION
Job losers and persons who completedtemporary jobs. . . . . . . . . . . . . . . . . . . . . . . . . . . . . . . . . . . . 51.1 53.0 52.3 48.4 47.4 48.2 49.1 49.6 49.1
On temporary layoff. . . . . . . . . . . . . . . . . . . . . . . . . . . . . . 13.6 16.6 15.5 11.7 12.0 13.7 14.0 13.1 13.3
Not on temporary layoff. . . . . . . . . . . . . . . . . . . . . . . . . . 37.5 36.5 36.9 36.7 35.4 34.5 35.1 36.5 35.8
Job leavers. . . . . . . . . . . . . . . . . . . . . . . . . . . . . . . . . . . . . . . . . . . 10.2 10.2 10.7 10.5 12.5 12.0 11.4 10.7 11.1
Reentrants. . . . . . . . . . . . . . . . . . . . . . . . . . . . . . . . . . . . . . . . . . . . 30.2 28.1 27.5 31.2 30.3 29.4 28.7 29.4 28.8
New entrants. . . . . . . . . . . . . . . . . . . . . . . . . . . . . . . . . . . . . . . . . 8.5 8.6 9.5 9.8 9.7 10.4 10.8 10.3 11.0
UNEMPLOYED AS A PERCENT OF THECIVILIAN LABOR FORCE
Job losers and persons who completedtemporary jobs. . . . . . . . . . . . . . . . . . . . . . . . . . . . . . . . . . . . 2.6 2.6 2.4 2.4 2.2 2.3 2.3 2.3 2.2
Job leavers. . . . . . . . . . . . . . . . . . . . . . . . . . . . . . . . . . . . . . . . . . . 0.5 0.5 0.5 0.5 0.6 0.6 0.5 0.5 0.5
Reentrants. . . . . . . . . . . . . . . . . . . . . . . . . . . . . . . . . . . . . . . . . . . . 1.5 1.4 1.3 1.6 1.4 1.4 1.4 1.4 1.3
New entrants. . . . . . . . . . . . . . . . . . . . . . . . . . . . . . . . . . . . . . . . . 0.4 0.4 0.4 0.5 0.5 0.5 0.5 0.5 0.5
NOTE: Updated population controls are introduced annually with the release of January data.

HOUSEHOLD DATATable A-12. Unemployed persons by duration of unemployment[Numbers in thousands]
Duration
Not seasonally adjusted Seasonally adjusted
Mar.2016
Feb.2017
Mar.2017
Mar.2016
Nov.2016
Dec.2016
Jan.2017
Feb.2017
Mar.2017
NUMBER OF UNEMPLOYED
Less than 5 weeks. . . . . . . . . . . . . . . . . . . . . . . . . . . . . . . . . . 2,083 2,327 2,000 2,420 2,415 2,379 2,468 2,566 2,334
5 to 14 weeks.. . . . . . . . . . . . . . . . . . . . . . . . . . . . . . . . . . . . . . . 2,382 2,522 2,269 2,210 2,133 2,156 2,089 2,138 2,109
15 weeks and over. . . . . . . . . . . . . . . . . . . . . . . . . . . . . . . . . . 3,651 3,038 3,016 3,380 2,929 3,030 3,043 2,858 2,802
15 to 26 weeks.. . . . . . . . . . . . . . . . . . . . . . . . . . . . . . . . . . . 1,346 1,160 1,255 1,167 1,073 1,199 1,192 1,057 1,115
27 weeks and over. . . . . . . . . . . . . . . . . . . . . . . . . . . . . . . 2,305 1,878 1,761 2,213 1,856 1,831 1,850 1,801 1,687
Average (mean) duration, in weeks. . . . . . . . . . . . . . . 29.1 25.1 26.1 28.3 26.2 26.0 25.1 25.1 25.3
Median duration, in weeks. . . . . . . . . . . . . . . . . . . . . . . . . 12.7 10.3 11.6 11.4 10.2 10.3 10.2 10.0 10.3
PERCENT DISTRIBUTION
Less than 5 weeks. . . . . . . . . . . . . . . . . . . . . . . . . . . . . . . . . . 25.7 29.5 27.5 30.2 32.3 31.4 32.5 33.9 32.2
5 to 14 weeks.. . . . . . . . . . . . . . . . . . . . . . . . . . . . . . . . . . . . . . . 29.3 32.0 31.1 27.6 28.5 28.5 27.5 28.3 29.1
15 weeks and over. . . . . . . . . . . . . . . . . . . . . . . . . . . . . . . . . . 45.0 38.5 41.4 42.2 39.2 40.0 40.0 37.8 38.7
15 to 26 weeks.. . . . . . . . . . . . . . . . . . . . . . . . . . . . . . . . . . . 16.6 14.7 17.2 14.6 14.4 15.8 15.7 14.0 15.4
27 weeks and over. . . . . . . . . . . . . . . . . . . . . . . . . . . . . . . 28.4 23.8 24.2 27.6 24.8 24.2 24.4 23.8 23.3
NOTE: Updated population controls are introduced annually with the release of January data.
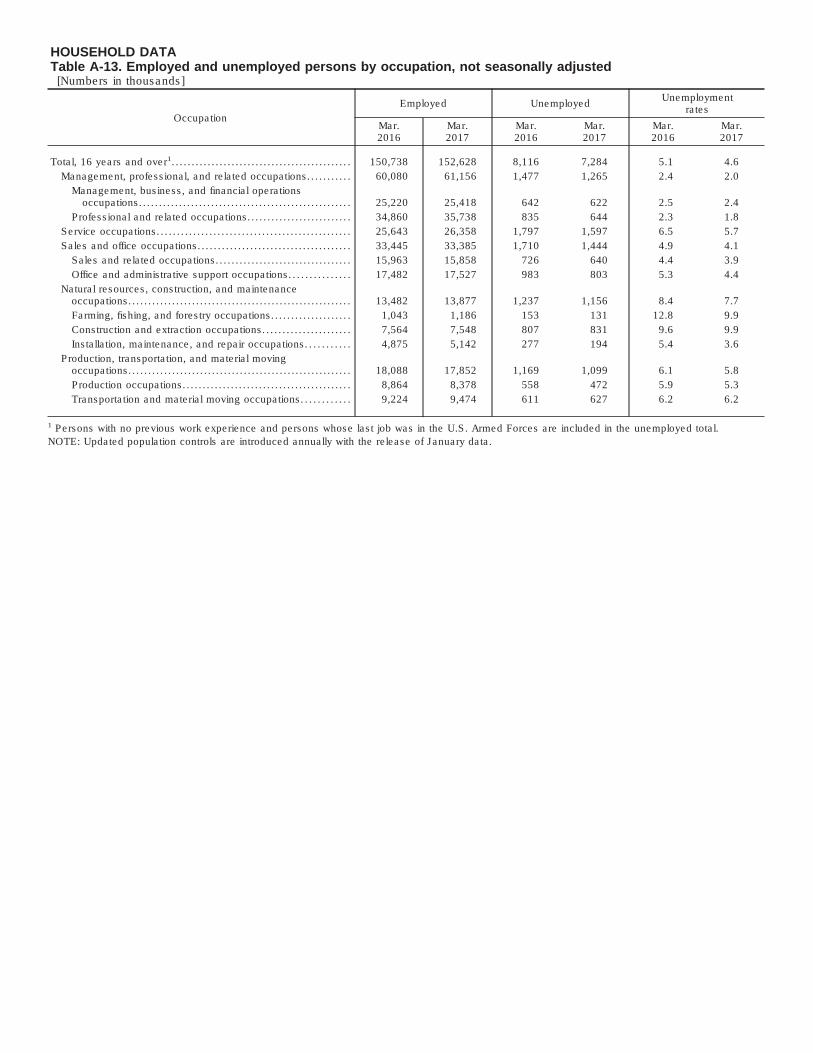
HOUSEHOLD DATATable A-13. Employed and unemployed persons by occupation, not seasonally adjusted[Numbers in thousands]
Occupation
Employed UnemployedUnemployment
rates
Mar.2016
Mar.2017
Mar.2016
Mar.2017
Mar.2016
Mar.2017
Total, 16 years and over1. . . . . . . . . . . . . . . . . . . . . . . . . . . . . . . . . . . . . . . . . . . . . 150,738 152,628 8,116 7,284 5.1 4.6
Management, professional, and related occupations. . . . . . . . . . . 60,080 61,156 1,477 1,265 2.4 2.0
Management, business, and financial operationsoccupations.. . . . . . . . . . . . . . . . . . . . . . . . . . . . . . . . . . . . . . . . . . . . . . . . . . . . 25,220 25,418 642 622 2.5 2.4
Professional and related occupations.. . . . . . . . . . . . . . . . . . . . . . . . . 34,860 35,738 835 644 2.3 1.8
Service occupations. . . . . . . . . . . . . . . . . . . . . . . . . . . . . . . . . . . . . . . . . . . . . . . . 25,643 26,358 1,797 1,597 6.5 5.7
Sales and office occupations. . . . . . . . . . . . . . . . . . . . . . . . . . . . . . . . . . . . . . 33,445 33,385 1,710 1,444 4.9 4.1
Sales and related occupations.. . . . . . . . . . . . . . . . . . . . . . . . . . . . . . . . . 15,963 15,858 726 640 4.4 3.9
Office and administrative support occupations. . . . . . . . . . . . . . . 17,482 17,527 983 803 5.3 4.4
Natural resources, construction, and maintenanceoccupations.. . . . . . . . . . . . . . . . . . . . . . . . . . . . . . . . . . . . . . . . . . . . . . . . . . . . . . . 13,482 13,877 1,237 1,156 8.4 7.7
Farming, fishing, and forestry occupations. . . . . . . . . . . . . . . . . . . . 1,043 1,186 153 131 12.8 9.9
Construction and extraction occupations. . . . . . . . . . . . . . . . . . . . . . 7,564 7,548 807 831 9.6 9.9
Installation, maintenance, and repair occupations. . . . . . . . . . . 4,875 5,142 277 194 5.4 3.6
Production, transportation, and material movingoccupations.. . . . . . . . . . . . . . . . . . . . . . . . . . . . . . . . . . . . . . . . . . . . . . . . . . . . . . . 18,088 17,852 1,169 1,099 6.1 5.8
Production occupations. . . . . . . . . . . . . . . . . . . . . . . . . . . . . . . . . . . . . . . . . . 8,864 8,378 558 472 5.9 5.3
Transportation and material moving occupations. . . . . . . . . . . . 9,224 9,474 611 627 6.2 6.2
1 Persons with no previous work experience and persons whose last job was in the U.S. Armed Forces are included in the unemployed total.
NOTE: Updated population controls are introduced annually with the release of January data.
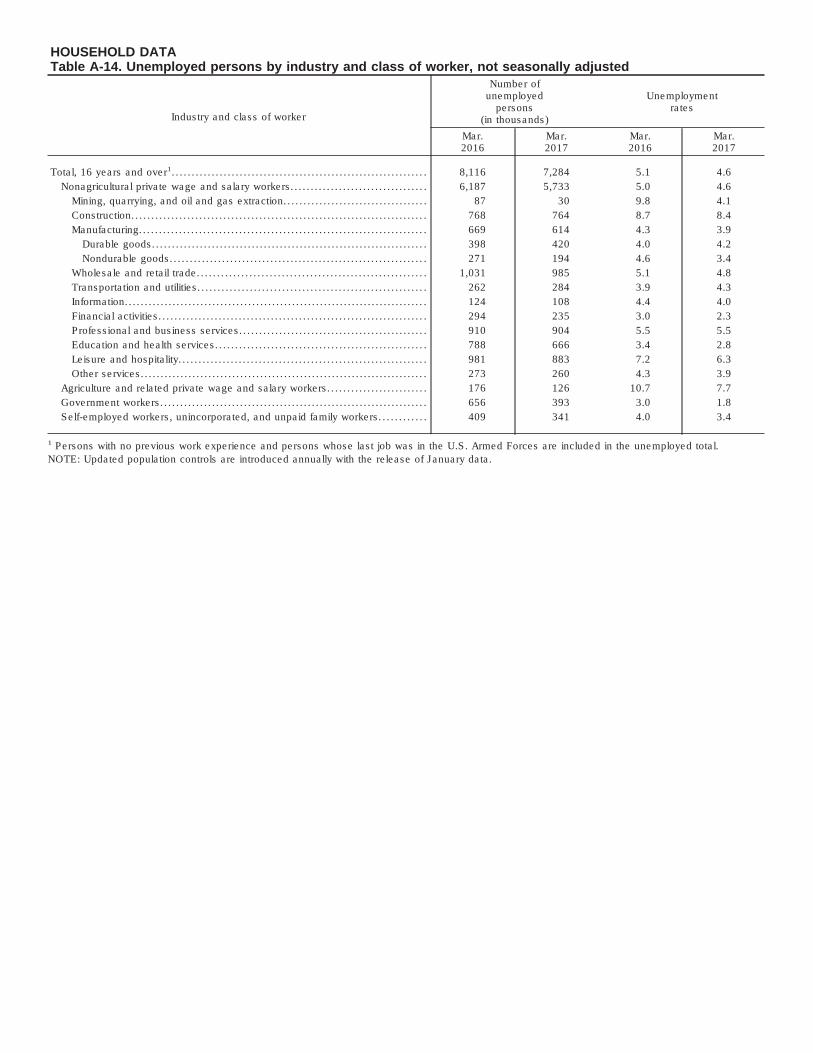
HOUSEHOLD DATATable A-14. Unemployed persons by industry and class of worker, not seasonally adjusted
Industry and class of worker
Number ofunemployed
persons(in thousands)
Unemploymentrates
Mar.2016
Mar.2017
Mar.2016
Mar.2017
Total, 16 years and over1. . . . . . . . . . . . . . . . . . . . . . . . . . . . . . . . . . . . . . . . . . . . . . . . . . . . . . . . . . . . . . . . 8,116 7,284 5.1 4.6
Nonagricultural private wage and salary workers. . . . . . . . . . . . . . . . . . . . . . . . . . . . . . . . . . 6,187 5,733 5.0 4.6
Mining, quarrying, and oil and gas extraction.. . . . . . . . . . . . . . . . . . . . . . . . . . . . . . . . . . . 87 30 9.8 4.1
Construction.. . . . . . . . . . . . . . . . . . . . . . . . . . . . . . . . . . . . . . . . . . . . . . . . . . . . . . . . . . . . . . . . . . . . . . . . . 768 764 8.7 8.4
Manufacturing. . . . . . . . . . . . . . . . . . . . . . . . . . . . . . . . . . . . . . . . . . . . . . . . . . . . . . . . . . . . . . . . . . . . . . . . 669 614 4.3 3.9
Durable goods.. . . . . . . . . . . . . . . . . . . . . . . . . . . . . . . . . . . . . . . . . . . . . . . . . . . . . . . . . . . . . . . . . . . . 398 420 4.0 4.2
Nondurable goods.. . . . . . . . . . . . . . . . . . . . . . . . . . . . . . . . . . . . . . . . . . . . . . . . . . . . . . . . . . . . . . . 271 194 4.6 3.4
Wholesale and retail trade. . . . . . . . . . . . . . . . . . . . . . . . . . . . . . . . . . . . . . . . . . . . . . . . . . . . . . . . . 1,031 985 5.1 4.8
Transportation and utilities. . . . . . . . . . . . . . . . . . . . . . . . . . . . . . . . . . . . . . . . . . . . . . . . . . . . . . . . . 262 284 3.9 4.3
Information.. . . . . . . . . . . . . . . . . . . . . . . . . . . . . . . . . . . . . . . . . . . . . . . . . . . . . . . . . . . . . . . . . . . . . . . . . . . 124 108 4.4 4.0
Financial activities. . . . . . . . . . . . . . . . . . . . . . . . . . . . . . . . . . . . . . . . . . . . . . . . . . . . . . . . . . . . . . . . . . . 294 235 3.0 2.3
Professional and business services. . . . . . . . . . . . . . . . . . . . . . . . . . . . . . . . . . . . . . . . . . . . . . . 910 904 5.5 5.5
Education and health services. . . . . . . . . . . . . . . . . . . . . . . . . . . . . . . . . . . . . . . . . . . . . . . . . . . . . 788 666 3.4 2.8
Leisure and hospitality. . . . . . . . . . . . . . . . . . . . . . . . . . . . . . . . . . . . . . . . . . . . . . . . . . . . . . . . . . . . . . 981 883 7.2 6.3
Other services.. . . . . . . . . . . . . . . . . . . . . . . . . . . . . . . . . . . . . . . . . . . . . . . . . . . . . . . . . . . . . . . . . . . . . . . 273 260 4.3 3.9
Agriculture and related private wage and salary workers. . . . . . . . . . . . . . . . . . . . . . . . . 176 126 10.7 7.7
Government workers. . . . . . . . . . . . . . . . . . . . . . . . . . . . . . . . . . . . . . . . . . . . . . . . . . . . . . . . . . . . . . . . . . . 656 393 3.0 1.8
Self-employed workers, unincorporated, and unpaid family workers. . . . . . . . . . . . 409 341 4.0 3.4
1 Persons with no previous work experience and persons whose last job was in the U.S. Armed Forces are included in the unemployed total.
NOTE: Updated population controls are introduced annually with the release of January data.

HOUSEHOLD DATA
Table A-15. Alternative measures of labor underutilization
[Percent]
Measure
Not seasonally adjusted Seasonally adjusted
Mar.2016
Feb.2017
Mar.2017
Mar.2016
Nov.2016
Dec.2016
Jan.2017
Feb.2017
Mar.2017
U-1 Persons unemployed 15 weeks or longer,as a percent of the civilian labor force. . . . . . . . . 2.3 1.9 1.9 2.1 1.8 1.9 1.9 1.8 1.7
U-2 Job losers and persons who completedtemporary jobs, as a percent of the civilianlabor force. . . . . . . . . . . . . . . . . . . . . . . . . . . . . . . . . . . . . . . . . 2.6 2.6 2.4 2.4 2.2 2.3 2.3 2.3 2.2
U-3 Total unemployed, as a percent of thecivilian labor force (official unemploymentrate). . . . . . . . . . . . . . . . . . . . . . . . . . . . . . . . . . . . . . . . . . . . . . . . 5.1 4.9 4.6 5.0 4.6 4.7 4.8 4.7 4.5
U-4 Total unemployed plus discouragedworkers, as a percent of the civilian laborforce plus discouraged workers. . . . . . . . . . . . . . . . . 5.5 5.3 4.8 5.4 5.0 5.0 5.1 5.0 4.8
U-5 Total unemployed, plus discouragedworkers, plus all other persons marginallyattached to the labor force, as a percent ofthe civilian labor force plus all personsmarginally attached to the labor force. . . . . . . . . 6.1 6.0 5.5 6.0 5.8 5.7 5.8 5.7 5.4
U-6 Total unemployed, plus all personsmarginally attached to the labor force, plustotal employed part time for economicreasons, as a percent of the civilian laborforce plus all persons marginally attached tothe labor force.. . . . . . . . . . . . . . . . . . . . . . . . . . . . . . . . . . . . 9.9 9.5 8.9 9.8 9.3 9.2 9.4 9.2 8.9
NOTE: Persons marginally attached to the labor force are those who currently are neither working nor looking for work but indicate that they want andare available for a job and have looked for work sometime in the past 12 months. Discouraged workers, a subset of the marginally attached, havegiven a job-market related reason for not currently looking for work. Persons employed part time for economic reasons are those who want and areavailable for full-time work but have had to settle for a part-time schedule. Updated population controls are introduced annually with the release ofJanuary data.
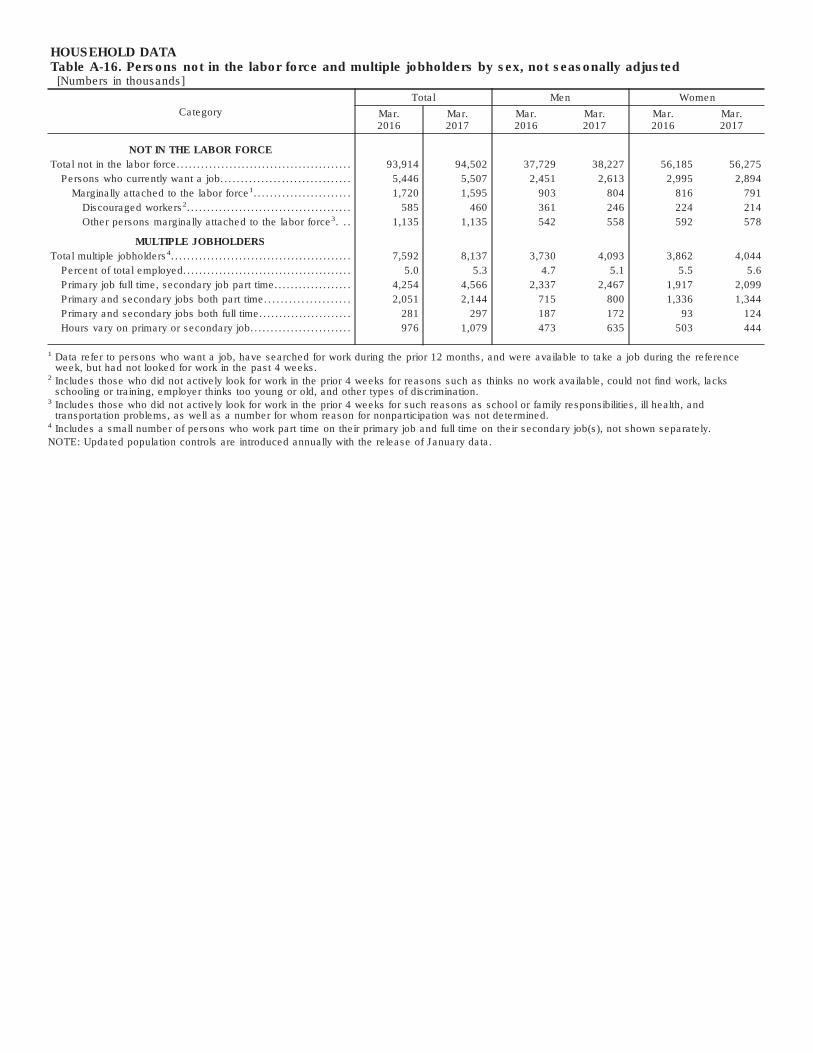
HOUSEHOLD DATATable A-16. Persons not in the labor force and multiple jobholders by sex, not seasonally adjusted[Numbers in thousands]
Category
Total Men Women
Mar.2016
Mar.2017
Mar.2016
Mar.2017
Mar.2016
Mar.2017
NOT IN THE LABOR FORCE
Total not in the labor force. . . . . . . . . . . . . . . . . . . . . . . . . . . . . . . . . . . . . . . . . . . 93,914 94,502 37,729 38,227 56,185 56,275
Persons who currently want a job. . . . . . . . . . . . . . . . . . . . . . . . . . . . . . . . 5,446 5,507 2,451 2,613 2,995 2,894
Marginally attached to the labor force1. . . . . . . . . . . . . . . . . . . . . . . . 1,720 1,595 903 804 816 791
Discouraged workers2. . . . . . . . . . . . . . . . . . . . . . . . . . . . . . . . . . . . . . . . . 585 460 361 246 224 214
Other persons marginally attached to the labor force3. . . 1,135 1,135 542 558 592 578
MULTIPLE JOBHOLDERS
Total multiple jobholders4. . . . . . . . . . . . . . . . . . . . . . . . . . . . . . . . . . . . . . . . . . . . . 7,592 8,137 3,730 4,093 3,862 4,044
Percent of total employed.. . . . . . . . . . . . . . . . . . . . . . . . . . . . . . . . . . . . . . . . . 5.0 5.3 4.7 5.1 5.5 5.6
Primary job full time, secondary job part time.. . . . . . . . . . . . . . . . . . 4,254 4,566 2,337 2,467 1,917 2,099
Primary and secondary jobs both part time. . . . . . . . . . . . . . . . . . . . . 2,051 2,144 715 800 1,336 1,344
Primary and secondary jobs both full time.. . . . . . . . . . . . . . . . . . . . . . 281 297 187 172 93 124
Hours vary on primary or secondary job. . . . . . . . . . . . . . . . . . . . . . . . . 976 1,079 473 635 503 444
1 Data refer to persons who want a job, have searched for work during the prior 12 months, and were available to take a job during the referenceweek, but had not looked for work in the past 4 weeks.
2 Includes those who did not actively look for work in the prior 4 weeks for reasons such as thinks no work available, could not find work, lacksschooling or training, employer thinks too young or old, and other types of discrimination.
3 Includes those who did not actively look for work in the prior 4 weeks for such reasons as school or family responsibilities, ill health, andtransportation problems, as well as a number for whom reason for nonparticipation was not determined.
4 Includes a small number of persons who work part time on their primary job and full time on their secondary job(s), not shown separately.
NOTE: Updated population controls are introduced annually with the release of January data.

ESTABLISHMENT DATATable B-1. Employees on nonfarm payrolls by industry sector and selected industry detail[In thousands]
Industry
Not seasonally adjusted Seasonally adjusted
Mar.2016
Jan.2017
Feb.2017p
Mar.2017p
Mar.2016
Jan.2017
Feb.2017p
Mar.2017p
Changefrom:
Feb.2017 -Mar.2017p
Total nonfarm. . . . . . . . . . . . . . . . . . . . . . . . . . . . . . . . . . . . . . . . . . . 142,814 143,273 144,279 144,949 143,673 145,541 145,760 145,858 98
Total private. . . . . . . . . . . . . . . . . . . . . . . . . . . . . . . . . . . . . . . . . . 120,262 121,104 121,665 122,258 121,507 123,230 123,451 123,540 89
Goods-producing. . . . . . . . . . . . . . . . . . . . . . . . . . . . . . . . . . . 19,371 19,340 19,453 19,599 19,752 19,845 19,941 19,969 28
Mining and logging. . . . . . . . . . . . . . . . . . . . . . . . . . . . . . . 681 662 672 684 692 673 684 695 11
Logging. . . . . . . . . . . . . . . . . . . . . . . . . . . . . . . . . . . . . . . . 50.4 48.7 50.3 49.0 52.3 50.4 51.6 50.8 -0.8
Mining. . . . . . . . . . . . . . . . . . . . . . . . . . . . . . . . . . . . . . . . . 630.1 613.2 622.0 634.5 639.8 622.7 632.7 644.0 11.3
Oil and gas extraction. . . . . . . . . . . . . . . . . . . . . . . 181.8 176.0 176.9 179.8 183.1 177.1 178.9 180.7 1.8
Mining, except oil and gas. . . . . . . . . . . . . . . . . . . 178.5 177.2 177.2 179.4 183.5 183.5 183.5 184.2 0.7
Coal mining. . . . . . . . . . . . . . . . . . . . . . . . . . . . . . . 52.1 50.2 50.0 50.2 52.1 50.0 50.2 50.3 0.1
Metal ore mining. . . . . . . . . . . . . . . . . . . . . . . . . . 38.8 38.9 39.0 39.1 39.1 39.0 39.1 39.3 0.2
Nonmetallic mineral mining andquarrying. . . . . . . . . . . . . . . . . . . . . . . . . . . . . . . . 87.6 88.1 88.2 90.1 92.4 94.5 94.1 94.5 0.4
Support activities for mining. . . . . . . . . . . . . . . . . 269.8 260.0 267.9 275.3 273.2 262.1 270.3 279.1 8.8
Construction. . . . . . . . . . . . . . . . . . . . . . . . . . . . . . . . . . . . . . 6,402 6,415 6,479 6,586 6,705 6,817 6,876 6,882 6
Construction of buildings. . . . . . . . . . . . . . . . . . . . . . . 1,440.4 1,460.2 1,467.2 1,478.9 1,488.1 1,514.9 1,524.0 1,524.9 0.9
Residential building. . . . . . . . . . . . . . . . . . . . . . . . . . 696.3 730.6 736.1 738.9 724.3 762.0 768.5 767.5 -1.0
Nonresidential building. . . . . . . . . . . . . . . . . . . . . . 744.1 729.6 731.1 740.0 763.8 752.9 755.5 757.4 1.9
Heavy and civil engineering construction. . . . . . 879.5 825.9 855.2 886.6 958.8 941.2 958.3 962.4 4.1
Specialty trade contractors. . . . . . . . . . . . . . . . . . . . 4,081.6 4,128.9 4,156.5 4,220.6 4,258.5 4,360.9 4,393.5 4,394.2 0.7
Residential specialty trade contractors. . . . . . 1,771.1 1,814.4 1,824.0 1,847.9 1,855.7 1,920.1 1,931.7 1,925.1 -6.6
Nonresidential specialty trade contractors. . . 2,310.5 2,314.5 2,332.5 2,372.7 2,402.8 2,440.8 2,461.8 2,469.1 7.3
Manufacturing. . . . . . . . . . . . . . . . . . . . . . . . . . . . . . . . . . . . 12,288 12,263 12,302 12,329 12,355 12,355 12,381 12,392 11
Durable goods. . . . . . . . . . . . . . . . . . . . . . . . . . . . . . . . . 7,710 7,677 7,688 7,714 7,736 7,718 7,726 7,737 11
Wood products. . . . . . . . . . . . . . . . . . . . . . . . . . . . . . 385.6 393.2 391.8 393.9 391.1 397.1 398.2 399.1 0.9
Nonmetallic mineral products. . . . . . . . . . . . . . . . 397.1 398.9 401.5 408.0 407.2 414.4 417.0 418.3 1.3
Primary metals. . . . . . . . . . . . . . . . . . . . . . . . . . . . . . 379.8 377.7 378.3 379.3 379.8 376.8 378.1 379.0 0.9
Fabricated metal products. . . . . . . . . . . . . . . . . . . 1,425.4 1,417.8 1,422.1 1,427.1 1,429.5 1,423.1 1,425.8 1,431.3 5.5
Machinery. . . . . . . . . . . . . . . . . . . . . . . . . . . . . . . . . . . 1,086.8 1,075.1 1,082.0 1,080.8 1,088.1 1,076.3 1,082.6 1,080.0 -2.6
Computer and electronic products. . . . . . . . . . . 1,050.3 1,032.7 1,032.3 1,034.5 1,052.8 1,036.1 1,035.9 1,036.6 0.7
Computer and peripheral equipment. . . . . . 164.3 160.5 160.2 160.5 165.0 161.9 161.5 161.2 -0.3
Communications equipment. . . . . . . . . . . . . . . 86.1 84.1 84.0 84.5 86.3 84.4 84.5 84.6 0.1
Semiconductors and electroniccomponents. . . . . . . . . . . . . . . . . . . . . . . . . . . . . 368.6 358.2 358.2 359.7 369.7 358.8 359.3 360.6 1.3
Electronic instruments. . . . . . . . . . . . . . . . . . . . . 395.9 395.7 396.1 396.2 396.3 396.6 396.7 396.4 -0.3
Miscellaneous computer and electronicproducts. . . . . . . . . . . . . . . . . . . . . . . . . . . . . . . . 35.4 34.2 33.8 33.6 35.5 34.3 33.9 33.8 -0.1
Electrical equipment and appliances. . . . . . . . 383.3 383.2 383.9 385.4 384.5 384.6 385.6 386.5 0.9
Transportation equipment1. . . . . . . . . . . . . . . . . . 1,625.9 1,618.8 1,614.2 1,622.5 1,623.2 1,624.6 1,617.0 1,620.0 3.0
Motor vehicles and parts2. . . . . . . . . . . . . . . . . 938.6 943.5 940.2 948.2 935.1 946.7 941.4 944.4 3.0
Furniture and related products. . . . . . . . . . . . . . 388.7 392.6 391.9 390.4 389.8 393.7 392.8 391.3 -1.5
Miscellaneous durable goodsmanufacturing. . . . . . . . . . . . . . . . . . . . . . . . . . . . . 586.8 587.1 589.8 592.2 590.3 591.7 593.3 595.3 2.0
Nondurable goods. . . . . . . . . . . . . . . . . . . . . . . . . . . . . 4,578 4,586 4,614 4,615 4,619 4,637 4,655 4,655 0
Food manufacturing. . . . . . . . . . . . . . . . . . . . . . . . . 1,517.6 1,549.6 1,564.7 1,559.3 1,541.9 1,572.1 1,583.1 1,581.8 -1.3
Textile mills. . . . . . . . . . . . . . . . . . . . . . . . . . . . . . . . . . 115.0 111.7 111.5 111.5 114.9 111.9 111.7 111.4 -0.3
Textile product mills. . . . . . . . . . . . . . . . . . . . . . . . . 115.4 111.7 111.2 110.8 116.4 112.9 112.5 111.7 -0.8
Apparel. . . . . . . . . . . . . . . . . . . . . . . . . . . . . . . . . . . . . . 132.6 125.5 126.7 125.0 132.5 127.1 126.5 125.5 -1.0
Paper and paper products. . . . . . . . . . . . . . . . . . . 370.6 367.9 368.7 368.4 372.7 368.6 369.8 370.1 0.3
Printing and related support activities. . . . . . . 448.5 438.9 437.7 439.0 449.5 441.2 440.8 439.9 -0.9
Petroleum and coal products. . . . . . . . . . . . . . . . 109.0 107.0 106.2 107.3 111.8 110.3 109.9 110.4 0.5
Chemicals. . . . . . . . . . . . . . . . . . . . . . . . . . . . . . . . . . . 809.9 808.0 811.8 815.1 810.7 811.5 814.2 815.4 1.2
Plastics and rubber products. . . . . . . . . . . . . . . . 698.4 693.2 698.9 701.1 699.5 699.1 701.1 702.1 1.0
Miscellaneous nondurable goodsmanufacturing. . . . . . . . . . . . . . . . . . . . . . . . . . . . . 260.9 272.9 276.1 277.7 269.5 282.0 285.2 287.0 1.8
Private service-providing. . . . . . . . . . . . . . . . . . . . . . . . . . . 100,891 101,764 102,212 102,659 101,755 103,385 103,510 103,571 61
Trade, transportation, and utilities. . . . . . . . . . . . . . . . 26,855 27,241 26,998 27,025 27,167 27,402 27,386 27,359 -27
Wholesale trade. . . . . . . . . . . . . . . . . . . . . . . . . . . . . . . 5,828.4 5,847.8 5,862.4 5,874.3 5,855.9 5,894.8 5,902.7 5,902.3 -0.4
Durable goods. . . . . . . . . . . . . . . . . . . . . . . . . . . . . . . 2,918.4 2,916.0 2,922.5 2,930.9 2,928.4 2,934.6 2,938.5 2,940.4 1.9
Nondurable goods. . . . . . . . . . . . . . . . . . . . . . . . . . . 2,017.3 2,033.1 2,037.2 2,045.4 2,031.8 2,056.4 2,057.8 2,061.0 3.2
See footnotes at end of table.
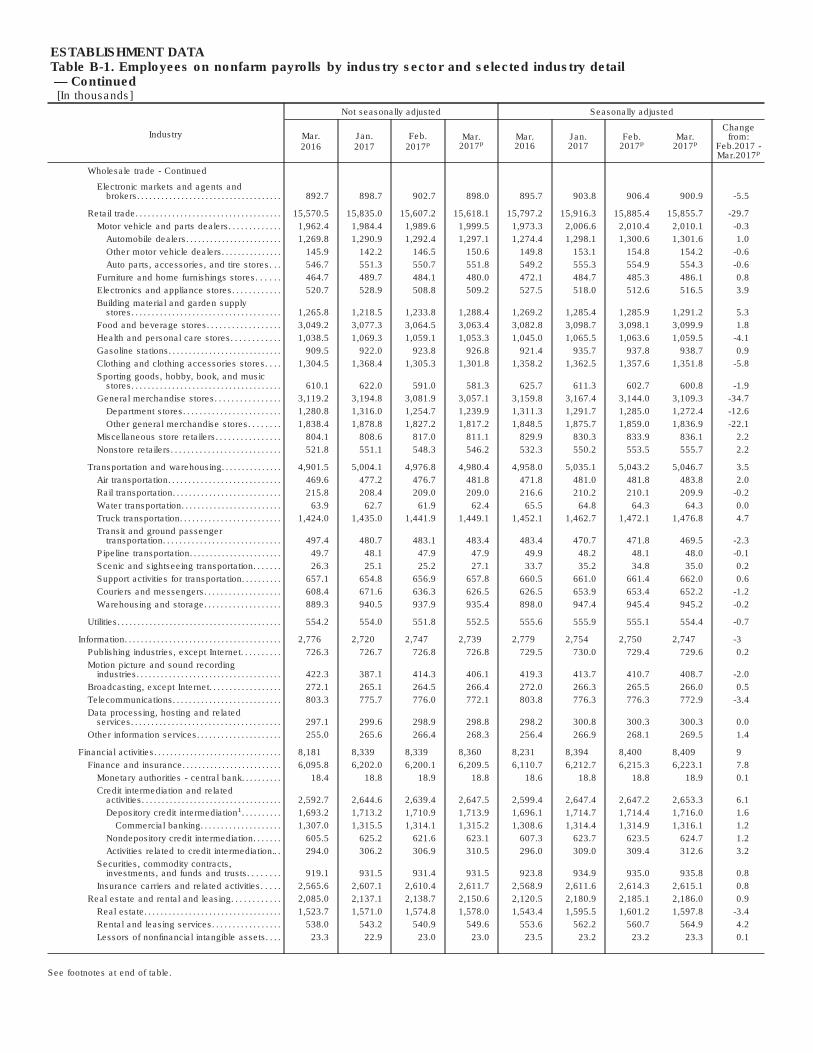
ESTABLISHMENT DATATable B-1. Employees on nonfarm payrolls by industry sector and selected industry detail— Continued[In thousands]
Industry
Not seasonally adjusted Seasonally adjusted
Mar.2016
Jan.2017
Feb.2017p
Mar.2017p
Mar.2016
Jan.2017
Feb.2017p
Mar.2017p
Changefrom:
Feb.2017 -Mar.2017p
Wholesale trade - Continued
Electronic markets and agents andbrokers. . . . . . . . . . . . . . . . . . . . . . . . . . . . . . . . . . . . 892.7 898.7 902.7 898.0 895.7 903.8 906.4 900.9 -5.5
Retail trade. . . . . . . . . . . . . . . . . . . . . . . . . . . . . . . . . . . . 15,570.5 15,835.0 15,607.2 15,618.1 15,797.2 15,916.3 15,885.4 15,855.7 -29.7
Motor vehicle and parts dealers. . . . . . . . . . . . . 1,962.4 1,984.4 1,989.6 1,999.5 1,973.3 2,006.6 2,010.4 2,010.1 -0.3
Automobile dealers. . . . . . . . . . . . . . . . . . . . . . . . 1,269.8 1,290.9 1,292.4 1,297.1 1,274.4 1,298.1 1,300.6 1,301.6 1.0
Other motor vehicle dealers. . . . . . . . . . . . . . . 145.9 142.2 146.5 150.6 149.8 153.1 154.8 154.2 -0.6
Auto parts, accessories, and tire stores. . . 546.7 551.3 550.7 551.8 549.2 555.3 554.9 554.3 -0.6
Furniture and home furnishings stores. . . . . . 464.7 489.7 484.1 480.0 472.1 484.7 485.3 486.1 0.8
Electronics and appliance stores. . . . . . . . . . . . 520.7 528.9 508.8 509.2 527.5 518.0 512.6 516.5 3.9
Building material and garden supplystores. . . . . . . . . . . . . . . . . . . . . . . . . . . . . . . . . . . . . 1,265.8 1,218.5 1,233.8 1,288.4 1,269.2 1,285.4 1,285.9 1,291.2 5.3
Food and beverage stores. . . . . . . . . . . . . . . . . . 3,049.2 3,077.3 3,064.5 3,063.4 3,082.8 3,098.7 3,098.1 3,099.9 1.8
Health and personal care stores. . . . . . . . . . . . 1,038.5 1,069.3 1,059.1 1,053.3 1,045.0 1,065.5 1,063.6 1,059.5 -4.1
Gasoline stations. . . . . . . . . . . . . . . . . . . . . . . . . . . . 909.5 922.0 923.8 926.8 921.4 935.7 937.8 938.7 0.9
Clothing and clothing accessories stores. . . . 1,304.5 1,368.4 1,305.3 1,301.8 1,358.2 1,362.5 1,357.6 1,351.8 -5.8
Sporting goods, hobby, book, and musicstores. . . . . . . . . . . . . . . . . . . . . . . . . . . . . . . . . . . . . 610.1 622.0 591.0 581.3 625.7 611.3 602.7 600.8 -1.9
General merchandise stores. . . . . . . . . . . . . . . . 3,119.2 3,194.8 3,081.9 3,057.1 3,159.8 3,167.4 3,144.0 3,109.3 -34.7
Department stores. . . . . . . . . . . . . . . . . . . . . . . . 1,280.8 1,316.0 1,254.7 1,239.9 1,311.3 1,291.7 1,285.0 1,272.4 -12.6
Other general merchandise stores. . . . . . . . 1,838.4 1,878.8 1,827.2 1,817.2 1,848.5 1,875.7 1,859.0 1,836.9 -22.1
Miscellaneous store retailers. . . . . . . . . . . . . . . . 804.1 808.6 817.0 811.1 829.9 830.3 833.9 836.1 2.2
Nonstore retailers. . . . . . . . . . . . . . . . . . . . . . . . . . . 521.8 551.1 548.3 546.2 532.3 550.2 553.5 555.7 2.2
Transportation and warehousing. . . . . . . . . . . . . . . 4,901.5 5,004.1 4,976.8 4,980.4 4,958.0 5,035.1 5,043.2 5,046.7 3.5
Air transportation. . . . . . . . . . . . . . . . . . . . . . . . . . . . 469.6 477.2 476.7 481.8 471.8 481.0 481.8 483.8 2.0
Rail transportation. . . . . . . . . . . . . . . . . . . . . . . . . . . 215.8 208.4 209.0 209.0 216.6 210.2 210.1 209.9 -0.2
Water transportation. . . . . . . . . . . . . . . . . . . . . . . . . 63.9 62.7 61.9 62.4 65.5 64.8 64.3 64.3 0.0
Truck transportation. . . . . . . . . . . . . . . . . . . . . . . . . 1,424.0 1,435.0 1,441.9 1,449.1 1,452.1 1,462.7 1,472.1 1,476.8 4.7
Transit and ground passengertransportation. . . . . . . . . . . . . . . . . . . . . . . . . . . . . 497.4 480.7 483.1 483.4 483.4 470.7 471.8 469.5 -2.3
Pipeline transportation. . . . . . . . . . . . . . . . . . . . . . . 49.7 48.1 47.9 47.9 49.9 48.2 48.1 48.0 -0.1
Scenic and sightseeing transportation. . . . . . . 26.3 25.1 25.2 27.1 33.7 35.2 34.8 35.0 0.2
Support activities for transportation. . . . . . . . . . 657.1 654.8 656.9 657.8 660.5 661.0 661.4 662.0 0.6
Couriers and messengers. . . . . . . . . . . . . . . . . . . 608.4 671.6 636.3 626.5 626.5 653.9 653.4 652.2 -1.2
Warehousing and storage. . . . . . . . . . . . . . . . . . . 889.3 940.5 937.9 935.4 898.0 947.4 945.4 945.2 -0.2
Utilities. . . . . . . . . . . . . . . . . . . . . . . . . . . . . . . . . . . . . . . . . 554.2 554.0 551.8 552.5 555.6 555.9 555.1 554.4 -0.7
Information. . . . . . . . . . . . . . . . . . . . . . . . . . . . . . . . . . . . . . . 2,776 2,720 2,747 2,739 2,779 2,754 2,750 2,747 -3
Publishing industries, except Internet. . . . . . . . . . 726.3 726.7 726.8 726.8 729.5 730.0 729.4 729.6 0.2
Motion picture and sound recordingindustries. . . . . . . . . . . . . . . . . . . . . . . . . . . . . . . . . . . . 422.3 387.1 414.3 406.1 419.3 413.7 410.7 408.7 -2.0
Broadcasting, except Internet. . . . . . . . . . . . . . . . . . 272.1 265.1 264.5 266.4 272.0 266.3 265.5 266.0 0.5
Telecommunications. . . . . . . . . . . . . . . . . . . . . . . . . . . 803.3 775.7 776.0 772.1 803.8 776.3 776.3 772.9 -3.4
Data processing, hosting and relatedservices. . . . . . . . . . . . . . . . . . . . . . . . . . . . . . . . . . . . . 297.1 299.6 298.9 298.8 298.2 300.8 300.3 300.3 0.0
Other information services. . . . . . . . . . . . . . . . . . . . . 255.0 265.6 266.4 268.3 256.4 266.9 268.1 269.5 1.4
Financial activities. . . . . . . . . . . . . . . . . . . . . . . . . . . . . . . . 8,181 8,339 8,339 8,360 8,231 8,394 8,400 8,409 9
Finance and insurance. . . . . . . . . . . . . . . . . . . . . . . . . 6,095.8 6,202.0 6,200.1 6,209.5 6,110.7 6,212.7 6,215.3 6,223.1 7.8
Monetary authorities - central bank. . . . . . . . . . 18.4 18.8 18.9 18.8 18.6 18.8 18.8 18.9 0.1
Credit intermediation and relatedactivities. . . . . . . . . . . . . . . . . . . . . . . . . . . . . . . . . . . 2,592.7 2,644.6 2,639.4 2,647.5 2,599.4 2,647.4 2,647.2 2,653.3 6.1
Depository credit intermediation1. . . . . . . . . . 1,693.2 1,713.2 1,710.9 1,713.9 1,696.1 1,714.7 1,714.4 1,716.0 1.6
Commercial banking. . . . . . . . . . . . . . . . . . . . 1,307.0 1,315.5 1,314.1 1,315.2 1,308.6 1,314.4 1,314.9 1,316.1 1.2
Nondepository credit intermediation. . . . . . . 605.5 625.2 621.6 623.1 607.3 623.7 623.5 624.7 1.2
Activities related to credit intermediation.. . 294.0 306.2 306.9 310.5 296.0 309.0 309.4 312.6 3.2
Securities, commodity contracts,investments, and funds and trusts. . . . . . . . 919.1 931.5 931.4 931.5 923.8 934.9 935.0 935.8 0.8
Insurance carriers and related activities. . . . . 2,565.6 2,607.1 2,610.4 2,611.7 2,568.9 2,611.6 2,614.3 2,615.1 0.8
Real estate and rental and leasing. . . . . . . . . . . . 2,085.0 2,137.1 2,138.7 2,150.6 2,120.5 2,180.9 2,185.1 2,186.0 0.9
Real estate. . . . . . . . . . . . . . . . . . . . . . . . . . . . . . . . . . 1,523.7 1,571.0 1,574.8 1,578.0 1,543.4 1,595.5 1,601.2 1,597.8 -3.4
Rental and leasing services. . . . . . . . . . . . . . . . . 538.0 543.2 540.9 549.6 553.6 562.2 560.7 564.9 4.2
Lessors of nonfinancial intangible assets. . . . 23.3 22.9 23.0 23.0 23.5 23.2 23.2 23.3 0.1
See footnotes at end of table.

ESTABLISHMENT DATATable B-1. Employees on nonfarm payrolls by industry sector and selected industry detail— Continued[In thousands]
Industry
Not seasonally adjusted Seasonally adjusted
Mar.2016
Jan.2017
Feb.2017p
Mar.2017p
Mar.2016
Jan.2017
Feb.2017p
Mar.2017p
Changefrom:
Feb.2017 -Mar.2017p
Private service-providing - Continued
Professional and business services. . . . . . . . . . . . . . 19,704 20,098 20,216 20,336 19,928 20,475 20,511 20,567 56
Professional and technical services. . . . . . . . . . . . 8,815.2 9,037.9 9,118.8 9,122.7 8,766.4 9,039.8 9,060.1 9,082.3 22.2
Legal services. . . . . . . . . . . . . . . . . . . . . . . . . . . . . . . 1,115.6 1,118.8 1,117.9 1,117.2 1,119.6 1,125.8 1,123.3 1,121.8 -1.5
Accounting and bookkeeping services. . . . . . 1,083.2 1,071.1 1,118.9 1,105.4 968.5 994.9 993.6 994.8 1.2
Architectural and engineering services. . . . . . 1,383.3 1,414.8 1,417.7 1,428.8 1,402.0 1,435.2 1,440.4 1,447.7 7.3
Specialized design services. . . . . . . . . . . . . . . . . 134.5 141.0 141.0 141.1 136.3 142.9 142.8 143.2 0.4
Computer systems design and relatedservices. . . . . . . . . . . . . . . . . . . . . . . . . . . . . . . . . . . 1,943.3 2,034.7 2,043.0 2,031.0 1,960.3 2,040.8 2,046.3 2,050.8 4.5
Management and technical consultingservices. . . . . . . . . . . . . . . . . . . . . . . . . . . . . . . . . . . 1,329.5 1,387.5 1,402.6 1,413.1 1,341.2 1,408.8 1,417.9 1,426.2 8.3
Scientific research and developmentservices. . . . . . . . . . . . . . . . . . . . . . . . . . . . . . . . . . . 670.3 693.7 695.0 698.2 673.2 699.2 699.5 701.5 2.0
Advertising and related services. . . . . . . . . . . . . 483.0 483.7 487.0 486.4 486.0 488.7 489.3 489.8 0.5
Other professional and technical services. . . 672.5 692.6 695.7 701.5 679.2 703.5 706.9 706.5 -0.4
Management of companies and enterprises. . . 2,221.4 2,256.7 2,258.2 2,261.4 2,229.5 2,264.1 2,268.3 2,268.9 0.6
Administrative and waste services. . . . . . . . . . . . . 8,666.9 8,803.7 8,838.9 8,951.6 8,931.7 9,171.3 9,182.8 9,216.2 33.4
Administrative and support services. . . . . . . . . 8,273.5 8,397.3 8,431.9 8,543.6 8,530.4 8,757.7 8,767.9 8,800.6 32.7
Office administrative services. . . . . . . . . . . . . 485.7 506.6 511.6 514.4 487.8 509.5 512.6 515.7 3.1
Facilities support services. . . . . . . . . . . . . . . . . 144.0 139.1 138.8 140.3 143.3 140.2 139.7 139.8 0.1
Employment services1. . . . . . . . . . . . . . . . . . . . 3,419.3 3,481.1 3,497.4 3,537.4 3,533.0 3,635.5 3,643.8 3,651.1 7.3
Temporary help services. . . . . . . . . . . . . . . . 2,787.5 2,843.0 2,856.5 2,896.6 2,885.9 2,976.7 2,985.6 2,996.1 10.5
Business support services. . . . . . . . . . . . . . . . 899.0 918.8 917.3 913.3 901.5 919.3 916.5 917.4 0.9
Travel arrangement and reservationservices. . . . . . . . . . . . . . . . . . . . . . . . . . . . . . . . . 214.6 211.7 214.2 215.2 216.0 216.7 217.2 216.5 -0.7
Investigation and security services. . . . . . . . 883.7 898.8 899.2 908.1 890.8 909.6 910.7 915.0 4.3
Services to buildings and dwellings. . . . . . . 1,919.4 1,926.6 1,935.8 1,993.6 2,049.3 2,107.8 2,106.3 2,123.1 16.8
Other support services. . . . . . . . . . . . . . . . . . . . 307.8 314.6 317.6 321.3 308.6 319.0 321.0 321.8 0.8
Waste management and remediationservices. . . . . . . . . . . . . . . . . . . . . . . . . . . . . . . . . . . 393.4 406.4 407.0 408.0 401.3 413.6 414.9 415.6 0.7
Education and health services. . . . . . . . . . . . . . . . . . . 22,590 22,707 23,072 23,111 22,443 22,888 22,954 22,970 16
Educational services. . . . . . . . . . . . . . . . . . . . . . . . . . . 3,697.1 3,468.3 3,771.0 3,787.8 3,534.1 3,595.7 3,625.2 3,623.8 -1.4
Health care and social assistance. . . . . . . . . . . . . 18,892.8 19,238.6 19,300.5 19,323.3 18,908.8 19,292.2 19,329.1 19,345.8 16.7
Health care3. . . . . . . . . . . . . . . . . . . . . . . . . . . . . . . . . 15,263.5 15,559.1 15,602.9 15,612.7 15,299.7 15,610.0 15,641.4 15,654.9 13.5
Ambulatory health care services. . . . . . . . . . 6,988.7 7,176.9 7,207.4 7,211.9 7,008.4 7,205.1 7,226.6 7,233.4 6.8
Offices of physicians. . . . . . . . . . . . . . . . . . . . 2,502.5 2,554.6 2,563.4 2,559.9 2,507.1 2,560.4 2,566.6 2,565.1 -1.5
Offices of dentists. . . . . . . . . . . . . . . . . . . . . . . 912.2 935.2 939.0 937.3 917.2 938.3 940.5 942.3 1.8
Offices of other health practitioners. . . . . 837.2 880.4 884.5 887.1 840.6 886.3 888.5 890.7 2.2
Outpatient care centers. . . . . . . . . . . . . . . . . 840.6 883.4 889.3 897.1 842.2 886.2 891.8 897.7 5.9
Medical and diagnostic laboratories. . . . 263.3 259.9 259.2 258.0 263.0 260.5 259.9 258.3 -1.6
Home health care services. . . . . . . . . . . . . 1,345.2 1,376.5 1,380.0 1,382.5 1,350.1 1,383.1 1,386.6 1,388.1 1.5
Other ambulatory health careservices. . . . . . . . . . . . . . . . . . . . . . . . . . . . . . 287.7 286.9 292.0 290.0 288.2 290.5 292.6 291.1 -1.5
Hospitals. . . . . . . . . . . . . . . . . . . . . . . . . . . . . . . . . . 4,979.9 5,069.0 5,078.4 5,090.3 4,983.7 5,079.9 5,087.1 5,095.8 8.7
Nursing and residential care facilities. . . . . 3,294.9 3,313.2 3,317.1 3,310.5 3,307.6 3,325.0 3,327.7 3,325.7 -2.0
Nursing care facilities. . . . . . . . . . . . . . . . . . . 1,632.4 1,639.5 1,638.3 1,632.3 1,640.9 1,643.3 1,644.1 1,642.3 -1.8
Residential mental health facilities. . . . . . 613.2 614.7 616.6 618.0 614.3 617.3 618.4 618.8 0.4
Community care facilities for theelderly. . . . . . . . . . . . . . . . . . . . . . . . . . . . . . . . 886.9 896.0 898.0 897.1 888.7 899.8 900.4 900.1 -0.3
Other residential care facilities. . . . . . . . . . 162.4 163.0 164.2 163.1 163.6 164.5 164.8 164.4 -0.4
Social assistance. . . . . . . . . . . . . . . . . . . . . . . . . . . . 3,629.3 3,679.5 3,697.6 3,710.6 3,609.1 3,682.2 3,687.7 3,690.9 3.2
Individual and family services. . . . . . . . . . . . . 2,208.0 2,267.1 2,275.6 2,279.9 2,204.6 2,272.0 2,276.6 2,276.8 0.2
Emergency and other relief services. . . . . . 162.4 168.2 168.2 168.7 162.7 168.2 167.8 168.5 0.7
Vocational rehabilitation services. . . . . . . . . 336.5 330.1 329.5 331.8 339.4 334.2 333.4 334.8 1.4
Child day care services. . . . . . . . . . . . . . . . . . . 922.4 914.1 924.3 930.2 902.4 907.7 909.9 910.9 1.0
Leisure and hospitality. . . . . . . . . . . . . . . . . . . . . . . . . . . 15,143 15,018 15,167 15,390 15,537 15,759 15,786 15,795 9
Arts, entertainment, and recreation. . . . . . . . . . . . 2,067.8 1,984.4 2,020.3 2,069.6 2,228.2 2,245.4 2,250.4 2,238.0 -12.4
Performing arts and spectator sports. . . . . . . . 438.9 396.9 412.3 425.3 456.9 450.5 449.7 444.9 -4.8
Museums, historical sites, and similarinstitutions. . . . . . . . . . . . . . . . . . . . . . . . . . . . . . . . . 148.6 147.3 148.9 152.8 157.2 161.7 162.7 162.0 -0.7
Amusements, gambling, and recreation. . . . . 1,480.3 1,440.2 1,459.1 1,491.5 1,614.1 1,633.2 1,638.0 1,631.1 -6.9
Accommodation and food services. . . . . . . . . . . . 13,075.4 13,033.8 13,146.9 13,320.8 13,308.3 13,513.5 13,535.2 13,557.3 22.1
See footnotes at end of table.

ESTABLISHMENT DATATable B-1. Employees on nonfarm payrolls by industry sector and selected industry detail— Continued[In thousands]
Industry
Not seasonally adjusted Seasonally adjusted
Mar.2016
Jan.2017
Feb.2017p
Mar.2017p
Mar.2016
Jan.2017
Feb.2017p
Mar.2017p
Changefrom:
Feb.2017 -Mar.2017p
Accommodation and food services -Continued
Accommodation. . . . . . . . . . . . . . . . . . . . . . . . . . . . . 1,878.6 1,846.7 1,862.4 1,884.0 1,944.9 1,946.6 1,949.6 1,950.0 0.4
Food services and drinking places. . . . . . . . . . 11,196.8 11,187.1 11,284.5 11,436.8 11,363.4 11,566.9 11,585.6 11,607.3 21.7
Other services. . . . . . . . . . . . . . . . . . . . . . . . . . . . . . . . . . . . 5,642 5,641 5,673 5,698 5,670 5,713 5,723 5,724 1
Repair and maintenance. . . . . . . . . . . . . . . . . . . . . . . 1,291.8 1,273.9 1,286.3 1,294.0 1,292.9 1,290.2 1,293.0 1,294.3 1.3
Personal and laundry services. . . . . . . . . . . . . . . . . 1,424.2 1,443.9 1,451.6 1,463.0 1,434.1 1,464.6 1,471.5 1,472.4 0.9
Membership associations and organizations. . . 2,925.8 2,922.7 2,935.3 2,940.8 2,942.5 2,958.2 2,958.7 2,957.6 -1.1
Government. . . . . . . . . . . . . . . . . . . . . . . . . . . . . . . . . . . . . . . . . . . 22,552 22,169 22,614 22,691 22,166 22,311 22,309 22,318 9
Federal. . . . . . . . . . . . . . . . . . . . . . . . . . . . . . . . . . . . . . . . . . . . . 2,767.0 2,802.0 2,801.0 2,798.0 2,781.0 2,817.0 2,817.0 2,816.0 -1.0
Federal, except U.S. Postal Service. . . . . . . . . . . . . 2,162.7 2,190.3 2,186.0 2,181.9 2,175.1 2,199.6 2,200.1 2,197.5 -2.6
U.S. Postal Service. . . . . . . . . . . . . . . . . . . . . . . . . . . . . . 604.6 611.3 614.6 615.6 605.6 617.5 617.2 618.2 1.0
State government. . . . . . . . . . . . . . . . . . . . . . . . . . . . . . . . . . 5,247.0 5,002.0 5,221.0 5,240.0 5,091.0 5,095.0 5,085.0 5,086.0 1.0
State government education. . . . . . . . . . . . . . . . . . . . . 2,573.0 2,338.4 2,554.1 2,568.0 2,410.8 2,419.9 2,408.4 2,408.4 0.0
State government, excluding education. . . . . . . . . . 2,673.6 2,664.0 2,667.0 2,671.6 2,679.7 2,674.9 2,676.7 2,677.2 0.5
Local government. . . . . . . . . . . . . . . . . . . . . . . . . . . . . . . . . . 14,538.0 14,365.0 14,592.0 14,653.0 14,294.0 14,399.0 14,407.0 14,416.0 9.0
Local government education. . . . . . . . . . . . . . . . . . . . . 8,243.6 8,053.2 8,264.7 8,308.6 7,900.6 7,953.2 7,958.0 7,967.7 9.7
Local government, excluding education. . . . . . . . . . 6,294.6 6,311.7 6,327.6 6,344.8 6,393.3 6,446.0 6,449.2 6,448.0 -1.2
1 Includes other industries, not shown separately.2 Includes motor vehicles, motor vehicle bodies and trailers, and motor vehicle parts.3 Includes ambulatory health care services, hospitals, and nursing and residential care facilities.
p Preliminary
NOTE: Data have been revised to reflect March 2016 benchmark levels and updated seasonal adjustment factors.
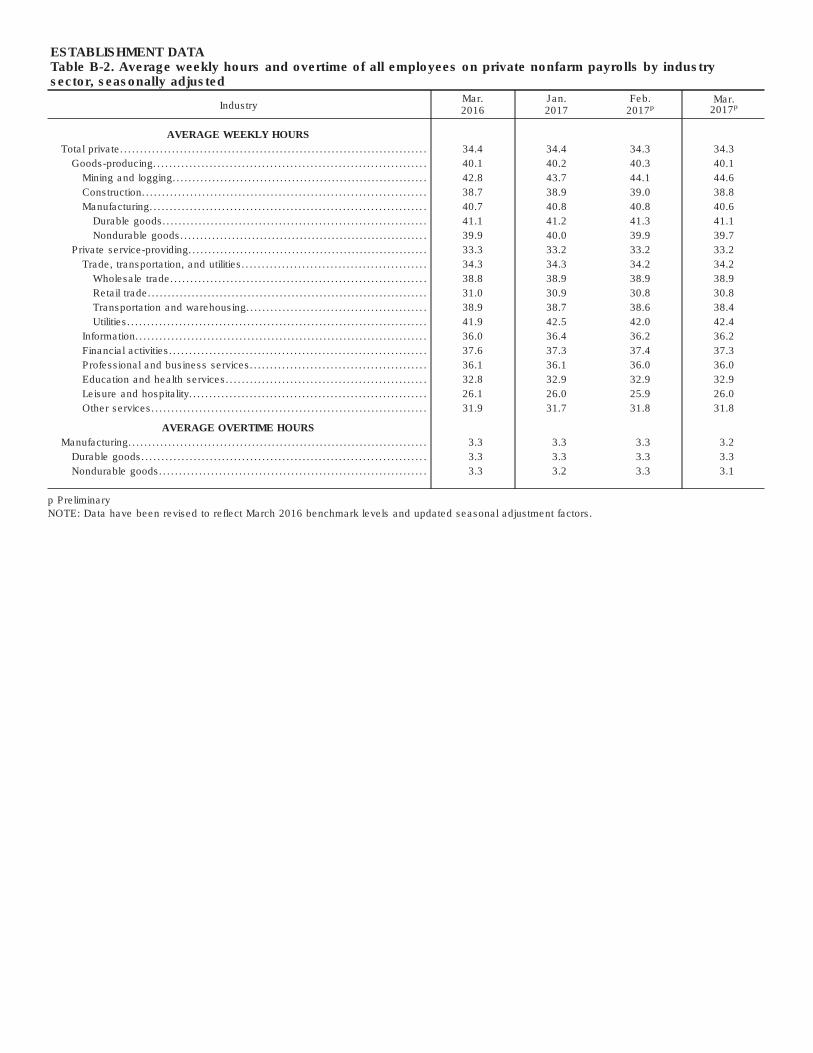
ESTABLISHMENT DATATable B-2. Average weekly hours and overtime of all employees on private nonfarm payrolls by industrysector, seasonally adjusted
IndustryMar.2016
Jan.2017
Feb.2017p
Mar.2017p
AVERAGE WEEKLY HOURS
Total private. . . . . . . . . . . . . . . . . . . . . . . . . . . . . . . . . . . . . . . . . . . . . . . . . . . . . . . . . . . . . . . . . . . . . . . . . . . . . 34.4 34.4 34.3 34.3
Goods-producing. . . . . . . . . . . . . . . . . . . . . . . . . . . . . . . . . . . . . . . . . . . . . . . . . . . . . . . . . . . . . . . . . . . . 40.1 40.2 40.3 40.1
Mining and logging.. . . . . . . . . . . . . . . . . . . . . . . . . . . . . . . . . . . . . . . . . . . . . . . . . . . . . . . . . . . . . . . 42.8 43.7 44.1 44.6
Construction. . . . . . . . . . . . . . . . . . . . . . . . . . . . . . . . . . . . . . . . . . . . . . . . . . . . . . . . . . . . . . . . . . . . . . . 38.7 38.9 39.0 38.8
Manufacturing. . . . . . . . . . . . . . . . . . . . . . . . . . . . . . . . . . . . . . . . . . . . . . . . . . . . . . . . . . . . . . . . . . . . . 40.7 40.8 40.8 40.6
Durable goods.. . . . . . . . . . . . . . . . . . . . . . . . . . . . . . . . . . . . . . . . . . . . . . . . . . . . . . . . . . . . . . . . . 41.1 41.2 41.3 41.1
Nondurable goods.. . . . . . . . . . . . . . . . . . . . . . . . . . . . . . . . . . . . . . . . . . . . . . . . . . . . . . . . . . . . . 39.9 40.0 39.9 39.7
Private service-providing.. . . . . . . . . . . . . . . . . . . . . . . . . . . . . . . . . . . . . . . . . . . . . . . . . . . . . . . . . . . 33.3 33.2 33.2 33.2
Trade, transportation, and utilities. . . . . . . . . . . . . . . . . . . . . . . . . . . . . . . . . . . . . . . . . . . . . . 34.3 34.3 34.2 34.2
Wholesale trade.. . . . . . . . . . . . . . . . . . . . . . . . . . . . . . . . . . . . . . . . . . . . . . . . . . . . . . . . . . . . . . . 38.8 38.9 38.9 38.9
Retail trade.. . . . . . . . . . . . . . . . . . . . . . . . . . . . . . . . . . . . . . . . . . . . . . . . . . . . . . . . . . . . . . . . . . . . . 31.0 30.9 30.8 30.8
Transportation and warehousing. . . . . . . . . . . . . . . . . . . . . . . . . . . . . . . . . . . . . . . . . . . . . 38.9 38.7 38.6 38.4
Utilities. . . . . . . . . . . . . . . . . . . . . . . . . . . . . . . . . . . . . . . . . . . . . . . . . . . . . . . . . . . . . . . . . . . . . . . . . . . 41.9 42.5 42.0 42.4
Information.. . . . . . . . . . . . . . . . . . . . . . . . . . . . . . . . . . . . . . . . . . . . . . . . . . . . . . . . . . . . . . . . . . . . . . . . 36.0 36.4 36.2 36.2
Financial activities. . . . . . . . . . . . . . . . . . . . . . . . . . . . . . . . . . . . . . . . . . . . . . . . . . . . . . . . . . . . . . . . 37.6 37.3 37.4 37.3
Professional and business services. . . . . . . . . . . . . . . . . . . . . . . . . . . . . . . . . . . . . . . . . . . . 36.1 36.1 36.0 36.0
Education and health services. . . . . . . . . . . . . . . . . . . . . . . . . . . . . . . . . . . . . . . . . . . . . . . . . . 32.8 32.9 32.9 32.9
Leisure and hospitality. . . . . . . . . . . . . . . . . . . . . . . . . . . . . . . . . . . . . . . . . . . . . . . . . . . . . . . . . . . 26.1 26.0 25.9 26.0
Other services.. . . . . . . . . . . . . . . . . . . . . . . . . . . . . . . . . . . . . . . . . . . . . . . . . . . . . . . . . . . . . . . . . . . . 31.9 31.7 31.8 31.8
AVERAGE OVERTIME HOURS
Manufacturing.. . . . . . . . . . . . . . . . . . . . . . . . . . . . . . . . . . . . . . . . . . . . . . . . . . . . . . . . . . . . . . . . . . . . . . . . . . 3.3 3.3 3.3 3.2
Durable goods.. . . . . . . . . . . . . . . . . . . . . . . . . . . . . . . . . . . . . . . . . . . . . . . . . . . . . . . . . . . . . . . . . . . . . . 3.3 3.3 3.3 3.3
Nondurable goods.. . . . . . . . . . . . . . . . . . . . . . . . . . . . . . . . . . . . . . . . . . . . . . . . . . . . . . . . . . . . . . . . . . 3.3 3.2 3.3 3.1
p Preliminary
NOTE: Data have been revised to reflect March 2016 benchmark levels and updated seasonal adjustment factors.

ESTABLISHMENT DATATable B-3. Average hourly and weekly earnings of all employees on private nonfarm payrolls by industrysector, seasonally adjusted
Industry
Average hourly earnings Average weekly earnings
Mar.2016
Jan.2017
Feb.2017p
Mar.2017p
Mar.2016
Jan.2017
Feb.2017p
Mar.2017p
Total private. . . . . . . . . . . . . . . . . . . . . . . . . . . . . . . . . . . . . . . . . . . . . . . $25.46 $26.02 $26.09 $26.14 $875.82 $895.09 $894.89 $896.60
Goods-producing.. . . . . . . . . . . . . . . . . . . . . . . . . . . . . . . . . . . . . . 26.66 27.30 27.31 27.34 1,069.07 1,097.46 1,100.59 1,096.33
Mining and logging. . . . . . . . . . . . . . . . . . . . . . . . . . . . . . . . . . 31.92 32.87 32.54 32.54 1,366.18 1,436.42 1,435.01 1,451.28
Construction.. . . . . . . . . . . . . . . . . . . . . . . . . . . . . . . . . . . . . . . . . 27.87 28.49 28.49 28.55 1,078.57 1,108.26 1,111.11 1,107.74
Manufacturing.. . . . . . . . . . . . . . . . . . . . . . . . . . . . . . . . . . . . . . . 25.72 26.35 26.36 26.37 1,046.80 1,075.08 1,075.49 1,070.62
Durable goods. . . . . . . . . . . . . . . . . . . . . . . . . . . . . . . . . . . . 27.05 27.58 27.60 27.60 1,111.76 1,136.30 1,139.88 1,134.36
Nondurable goods. . . . . . . . . . . . . . . . . . . . . . . . . . . . . . . . 23.42 24.24 24.24 24.26 934.46 969.60 967.18 963.12
Private service-providing. . . . . . . . . . . . . . . . . . . . . . . . . . . . . . 25.18 25.72 25.80 25.86 838.49 853.90 856.56 858.55
Trade, transportation, and utilities. . . . . . . . . . . . . . . . . 22.20 22.59 22.62 22.63 761.46 774.84 773.60 773.95
Wholesale trade. . . . . . . . . . . . . . . . . . . . . . . . . . . . . . . . . . 29.31 29.91 30.01 29.93 1,137.23 1,163.50 1,167.39 1,164.28
Retail trade. . . . . . . . . . . . . . . . . . . . . . . . . . . . . . . . . . . . . . . . 17.82 18.01 18.01 18.01 552.42 556.51 554.71 554.71
Transportation and warehousing. . . . . . . . . . . . . . . 23.04 23.55 23.58 23.67 896.26 911.39 910.19 908.93
Utilities. . . . . . . . . . . . . . . . . . . . . . . . . . . . . . . . . . . . . . . . . . . . . 37.99 38.98 38.64 38.83 1,591.78 1,656.65 1,622.88 1,646.39
Information. . . . . . . . . . . . . . . . . . . . . . . . . . . . . . . . . . . . . . . . . . . 36.05 37.42 37.48 37.50 1,297.80 1,362.09 1,356.78 1,357.50
Financial activities. . . . . . . . . . . . . . . . . . . . . . . . . . . . . . . . . . . 32.13 32.62 32.79 32.82 1,208.09 1,216.73 1,226.35 1,224.19
Professional and business services. . . . . . . . . . . . . . 30.59 31.27 31.36 31.65 1,104.30 1,128.85 1,128.96 1,139.40
Education and health services.. . . . . . . . . . . . . . . . . . . . 25.60 26.01 26.11 26.06 839.68 855.73 859.02 857.37
Leisure and hospitality. . . . . . . . . . . . . . . . . . . . . . . . . . . . . . 14.68 15.21 15.25 15.33 383.15 395.46 394.98 398.58
Other services. . . . . . . . . . . . . . . . . . . . . . . . . . . . . . . . . . . . . . . 22.90 23.54 23.62 23.50 730.51 746.22 751.12 747.30
p Preliminary
NOTE: Data have been revised to reflect March 2016 benchmark levels and updated seasonal adjustment factors.

ESTABLISHMENT DATATable B-4. Indexes of aggregate weekly hours and payrolls for all employees on private nonfarm payrolls byindustry sector, seasonally adjusted[2007=100]
Industry
Index of aggregate weekly hours1 Index of aggregate weekly payrolls2
Mar.2016
Jan.2017
Feb.2017p
Mar.2017p
Percentchangefrom:Feb.
2017 -Mar.
2017p
Mar.2016
Jan.2017
Feb.2017p
Mar.2017p
Percentchangefrom:Feb.
2017 -Mar.
2017p
Total private. . . . . . . . . . . . . . . . . . . . . . . . . . . . . . . . . . . . . 104.9 106.4 106.3 106.4 0.1 127.7 132.3 132.6 132.9 0.2
Goods-producing. . . . . . . . . . . . . . . . . . . . . . . . . . . . . 90.2 90.9 91.6 91.2 -0.4 108.7 112.1 113.0 112.7 -0.3
Mining and logging. . . . . . . . . . . . . . . . . . . . . . . . 93.1 92.4 94.8 97.4 2.7 119.3 122.0 123.8 127.3 2.8
Construction. . . . . . . . . . . . . . . . . . . . . . . . . . . . . . . . 89.4 91.4 92.4 92.0 -0.4 108.3 113.2 114.4 114.2 -0.2
Manufacturing. . . . . . . . . . . . . . . . . . . . . . . . . . . . . . 90.5 90.7 90.9 90.5 -0.4 108.2 111.1 111.4 111.0 -0.4
Durable goods.. . . . . . . . . . . . . . . . . . . . . . . . . . 89.5 89.5 89.8 89.5 -0.3 107.5 109.7 110.1 109.7 -0.4
Nondurable goods. . . . . . . . . . . . . . . . . . . . . . 92.0 92.6 92.7 92.2 -0.5 109.3 113.8 114.0 113.5 -0.4
Private service-providing. . . . . . . . . . . . . . . . . . . . 109.0 110.4 110.6 110.6 0.0 133.4 138.0 138.6 139.0 0.3
Trade, transportation, and utilities. . . . . . . 101.3 102.2 101.9 101.8 -0.1 121.1 124.3 124.0 123.9 -0.1
Wholesale trade.. . . . . . . . . . . . . . . . . . . . . . . . 99.1 100.1 100.2 100.2 0.0 121.3 124.9 125.5 125.1 -0.3
Retail trade. . . . . . . . . . . . . . . . . . . . . . . . . . . . . . 99.5 99.9 99.4 99.2 -0.2 117.2 118.9 118.3 118.1 -0.2
Transportation and warehousing. . . . . . 110.4 111.5 111.4 110.9 -0.4 129.1 133.3 133.3 133.2 -0.1
Utilities. . . . . . . . . . . . . . . . . . . . . . . . . . . . . . . . . . . . 100.7 102.2 100.9 101.7 0.8 126.4 131.6 128.8 130.5 1.3
Information. . . . . . . . . . . . . . . . . . . . . . . . . . . . . . . . . 91.4 91.6 90.9 90.8 -0.1 117.3 122.0 121.3 121.3 0.0
Financial activities. . . . . . . . . . . . . . . . . . . . . . . . . 101.4 102.5 102.9 102.7 -0.2 127.0 130.5 131.6 131.5 -0.1
Professional and business services. . . . . 113.1 116.3 116.1 116.5 0.3 140.2 147.3 147.5 149.3 1.2
Education and health services. . . . . . . . . . . 120.2 123.0 123.3 123.4 0.1 148.0 153.9 154.9 154.7 -0.1
Leisure and hospitality. . . . . . . . . . . . . . . . . . . . 115.7 116.9 116.7 117.2 0.4 137.0 143.5 143.5 144.9 1.0
Other services. . . . . . . . . . . . . . . . . . . . . . . . . . . . . 104.3 104.4 104.9 104.9 0.0 130.9 134.7 135.8 135.2 -0.4
1 The indexes of aggregate weekly hours are calculated by dividing the current month’s estimates of aggregate hours by the corresponding 2007annual average aggregate hours. Aggregate hours estimates are the product of estimates of average weekly hours and employment.
2 The indexes of aggregate weekly payrolls are calculated by dividing the current month’s estimates of aggregate weekly payrolls by thecorresponding 2007 annual average aggregate weekly payrolls. Aggregate payrolls estimates are the product of estimates of average hourlyearnings, average weekly hours, and employment.
p Preliminary
NOTE: Data have been revised to reflect March 2016 benchmark levels and updated seasonal adjustment factors.

ESTABLISHMENT DATATable B-5. Employment of women on nonfarm payrolls by industry sector, seasonally adjusted
Industry
Women employees (in thousands) Percent of all employees
Mar.2016
Jan.2017
Feb.2017p
Mar.2017p
Mar.2016
Jan.2017
Feb.2017p
Mar.2017p
Total nonfarm.. . . . . . . . . . . . . . . . . . . . . . . . . . . . . . . . . . . . . . . . . . . . 71,070 72,107 72,232 72,241 49.5 49.5 49.6 49.5
Total private. . . . . . . . . . . . . . . . . . . . . . . . . . . . . . . . . . . . . . . . . . . . 58,372 59,307 59,431 59,432 48.0 48.1 48.1 48.1
Goods-producing. . . . . . . . . . . . . . . . . . . . . . . . . . . . . . . . . . . . 4,314 4,351 4,362 4,365 21.8 21.9 21.9 21.9
Mining and logging. . . . . . . . . . . . . . . . . . . . . . . . . . . . . . . 102 99 100 101 14.7 14.7 14.6 14.5
Construction. . . . . . . . . . . . . . . . . . . . . . . . . . . . . . . . . . . . . . . 836 857 863 861 12.5 12.6 12.6 12.5
Manufacturing. . . . . . . . . . . . . . . . . . . . . . . . . . . . . . . . . . . . . 3,376 3,395 3,399 3,403 27.3 27.5 27.5 27.5
Durable goods.. . . . . . . . . . . . . . . . . . . . . . . . . . . . . . . . . 1,804 1,807 1,804 1,807 23.3 23.4 23.3 23.4
Nondurable goods. . . . . . . . . . . . . . . . . . . . . . . . . . . . . 1,572 1,588 1,595 1,596 34.0 34.2 34.3 34.3
Private service-providing. . . . . . . . . . . . . . . . . . . . . . . . . . . 54,058 54,956 55,069 55,067 53.1 53.2 53.2 53.2
Trade, transportation, and utilities. . . . . . . . . . . . . . 11,029 11,062 11,064 11,021 40.6 40.4 40.4 40.3
Wholesale trade.. . . . . . . . . . . . . . . . . . . . . . . . . . . . . . . 1,730.3 1,743.0 1,747.0 1,742.1 29.5 29.6 29.6 29.5
Retail trade. . . . . . . . . . . . . . . . . . . . . . . . . . . . . . . . . . . . . 7,972.1 7,962.5 7,959.8 7,926.2 50.5 50.0 50.1 50.0
Transportation and warehousing. . . . . . . . . . . . . 1,195.1 1,227.8 1,229.2 1,224.9 24.1 24.4 24.4 24.3
Utilities. . . . . . . . . . . . . . . . . . . . . . . . . . . . . . . . . . . . . . . . . . . 131.8 128.7 127.9 127.4 23.7 23.2 23.0 23.0
Information.. . . . . . . . . . . . . . . . . . . . . . . . . . . . . . . . . . . . . . . . 1,109 1,101 1,098 1,094 39.9 40.0 39.9 39.8
Financial activities. . . . . . . . . . . . . . . . . . . . . . . . . . . . . . . . 4,693 4,756 4,760 4,757 57.0 56.7 56.7 56.6
Professional and business services. . . . . . . . . . . . 8,917 9,191 9,228 9,257 44.7 44.9 45.0 45.0
Education and health services. . . . . . . . . . . . . . . . . . 17,290 17,639 17,691 17,706 77.0 77.1 77.1 77.1
Leisure and hospitality. . . . . . . . . . . . . . . . . . . . . . . . . . . 8,054 8,202 8,214 8,213 51.8 52.0 52.0 52.0
Other services.. . . . . . . . . . . . . . . . . . . . . . . . . . . . . . . . . . . . 2,966 3,005 3,014 3,019 52.3 52.6 52.7 52.7
Government. . . . . . . . . . . . . . . . . . . . . . . . . . . . . . . . . . . . . . . . . . . . . 12,698 12,800 12,801 12,809 57.3 57.4 57.4 57.4
p Preliminary
NOTE: Data have been revised to reflect March 2016 benchmark levels and updated seasonal adjustment factors.
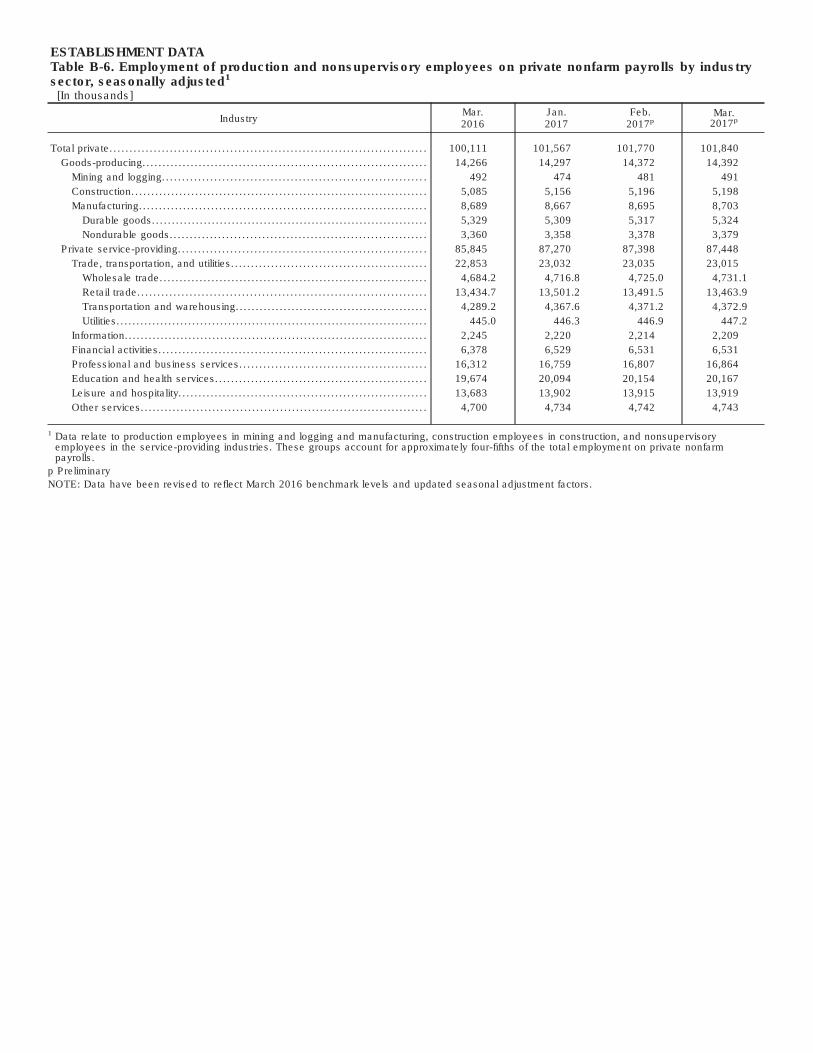
ESTABLISHMENT DATATable B-6. Employment of production and nonsupervisory employees on private nonfarm payrolls by industrysector, seasonally adjusted1
[In thousands]
IndustryMar.2016
Jan.2017
Feb.2017p
Mar.2017p
Total private. . . . . . . . . . . . . . . . . . . . . . . . . . . . . . . . . . . . . . . . . . . . . . . . . . . . . . . . . . . . . . . . . . . . . . . . . . . . . . . 100,111 101,567 101,770 101,840
Goods-producing.. . . . . . . . . . . . . . . . . . . . . . . . . . . . . . . . . . . . . . . . . . . . . . . . . . . . . . . . . . . . . . . . . . . . . . 14,266 14,297 14,372 14,392
Mining and logging. . . . . . . . . . . . . . . . . . . . . . . . . . . . . . . . . . . . . . . . . . . . . . . . . . . . . . . . . . . . . . . . . . 492 474 481 491
Construction.. . . . . . . . . . . . . . . . . . . . . . . . . . . . . . . . . . . . . . . . . . . . . . . . . . . . . . . . . . . . . . . . . . . . . . . . . 5,085 5,156 5,196 5,198
Manufacturing. . . . . . . . . . . . . . . . . . . . . . . . . . . . . . . . . . . . . . . . . . . . . . . . . . . . . . . . . . . . . . . . . . . . . . . . 8,689 8,667 8,695 8,703
Durable goods.. . . . . . . . . . . . . . . . . . . . . . . . . . . . . . . . . . . . . . . . . . . . . . . . . . . . . . . . . . . . . . . . . . . . 5,329 5,309 5,317 5,324
Nondurable goods.. . . . . . . . . . . . . . . . . . . . . . . . . . . . . . . . . . . . . . . . . . . . . . . . . . . . . . . . . . . . . . . 3,360 3,358 3,378 3,379
Private service-providing. . . . . . . . . . . . . . . . . . . . . . . . . . . . . . . . . . . . . . . . . . . . . . . . . . . . . . . . . . . . . . 85,845 87,270 87,398 87,448
Trade, transportation, and utilities. . . . . . . . . . . . . . . . . . . . . . . . . . . . . . . . . . . . . . . . . . . . . . . . . 22,853 23,032 23,035 23,015
Wholesale trade.. . . . . . . . . . . . . . . . . . . . . . . . . . . . . . . . . . . . . . . . . . . . . . . . . . . . . . . . . . . . . . . . . . 4,684.2 4,716.8 4,725.0 4,731.1
Retail trade. . . . . . . . . . . . . . . . . . . . . . . . . . . . . . . . . . . . . . . . . . . . . . . . . . . . . . . . . . . . . . . . . . . . . . . . 13,434.7 13,501.2 13,491.5 13,463.9
Transportation and warehousing.. . . . . . . . . . . . . . . . . . . . . . . . . . . . . . . . . . . . . . . . . . . . . . . 4,289.2 4,367.6 4,371.2 4,372.9
Utilities. . . . . . . . . . . . . . . . . . . . . . . . . . . . . . . . . . . . . . . . . . . . . . . . . . . . . . . . . . . . . . . . . . . . . . . . . . . . . . 445.0 446.3 446.9 447.2
Information.. . . . . . . . . . . . . . . . . . . . . . . . . . . . . . . . . . . . . . . . . . . . . . . . . . . . . . . . . . . . . . . . . . . . . . . . . . . 2,245 2,220 2,214 2,209
Financial activities. . . . . . . . . . . . . . . . . . . . . . . . . . . . . . . . . . . . . . . . . . . . . . . . . . . . . . . . . . . . . . . . . . . 6,378 6,529 6,531 6,531
Professional and business services. . . . . . . . . . . . . . . . . . . . . . . . . . . . . . . . . . . . . . . . . . . . . . . 16,312 16,759 16,807 16,864
Education and health services. . . . . . . . . . . . . . . . . . . . . . . . . . . . . . . . . . . . . . . . . . . . . . . . . . . . . 19,674 20,094 20,154 20,167
Leisure and hospitality. . . . . . . . . . . . . . . . . . . . . . . . . . . . . . . . . . . . . . . . . . . . . . . . . . . . . . . . . . . . . . 13,683 13,902 13,915 13,919
Other services.. . . . . . . . . . . . . . . . . . . . . . . . . . . . . . . . . . . . . . . . . . . . . . . . . . . . . . . . . . . . . . . . . . . . . . . 4,700 4,734 4,742 4,743
1 Data relate to production employees in mining and logging and manufacturing, construction employees in construction, and nonsupervisoryemployees in the service-providing industries. These groups account for approximately four-fifths of the total employment on private nonfarmpayrolls.
p Preliminary
NOTE: Data have been revised to reflect March 2016 benchmark levels and updated seasonal adjustment factors.

ESTABLISHMENT DATATable B-7. Average weekly hours and overtime of production and nonsupervisory employees on privatenonfarm payrolls by industry sector, seasonally adjusted1
IndustryMar.2016
Jan.2017
Feb.2017p
Mar.2017p
AVERAGE WEEKLY HOURS
Total private. . . . . . . . . . . . . . . . . . . . . . . . . . . . . . . . . . . . . . . . . . . . . . . . . . . . . . . . . . . . . . . . . . . . . . . . . . . . . 33.6 33.6 33.6 33.5
Goods-producing. . . . . . . . . . . . . . . . . . . . . . . . . . . . . . . . . . . . . . . . . . . . . . . . . . . . . . . . . . . . . . . . . . . . 41.0 41.1 41.3 41.1
Mining and logging.. . . . . . . . . . . . . . . . . . . . . . . . . . . . . . . . . . . . . . . . . . . . . . . . . . . . . . . . . . . . . . . 44.5 45.5 45.9 45.7
Construction. . . . . . . . . . . . . . . . . . . . . . . . . . . . . . . . . . . . . . . . . . . . . . . . . . . . . . . . . . . . . . . . . . . . . . . 39.4 39.3 39.8 39.4
Manufacturing. . . . . . . . . . . . . . . . . . . . . . . . . . . . . . . . . . . . . . . . . . . . . . . . . . . . . . . . . . . . . . . . . . . . . 41.7 41.9 42.0 41.8
Durable goods.. . . . . . . . . . . . . . . . . . . . . . . . . . . . . . . . . . . . . . . . . . . . . . . . . . . . . . . . . . . . . . . . . 42.1 42.3 42.4 42.3
Nondurable goods.. . . . . . . . . . . . . . . . . . . . . . . . . . . . . . . . . . . . . . . . . . . . . . . . . . . . . . . . . . . . . 41.1 41.3 41.3 41.0
Private service-providing.. . . . . . . . . . . . . . . . . . . . . . . . . . . . . . . . . . . . . . . . . . . . . . . . . . . . . . . . . . . 32.4 32.3 32.3 32.3
Trade, transportation, and utilities. . . . . . . . . . . . . . . . . . . . . . . . . . . . . . . . . . . . . . . . . . . . . . 33.5 33.6 33.5 33.5
Wholesale trade.. . . . . . . . . . . . . . . . . . . . . . . . . . . . . . . . . . . . . . . . . . . . . . . . . . . . . . . . . . . . . . . 38.5 38.8 38.8 38.7
Retail trade.. . . . . . . . . . . . . . . . . . . . . . . . . . . . . . . . . . . . . . . . . . . . . . . . . . . . . . . . . . . . . . . . . . . . . 29.7 29.8 29.9 29.9
Transportation and warehousing. . . . . . . . . . . . . . . . . . . . . . . . . . . . . . . . . . . . . . . . . . . . . 38.9 38.6 38.2 38.0
Utilities. . . . . . . . . . . . . . . . . . . . . . . . . . . . . . . . . . . . . . . . . . . . . . . . . . . . . . . . . . . . . . . . . . . . . . . . . . . 42.1 43.3 42.2 42.7
Information.. . . . . . . . . . . . . . . . . . . . . . . . . . . . . . . . . . . . . . . . . . . . . . . . . . . . . . . . . . . . . . . . . . . . . . . . 35.4 35.9 35.7 35.7
Financial activities. . . . . . . . . . . . . . . . . . . . . . . . . . . . . . . . . . . . . . . . . . . . . . . . . . . . . . . . . . . . . . . . 37.0 36.9 36.9 36.9
Professional and business services. . . . . . . . . . . . . . . . . . . . . . . . . . . . . . . . . . . . . . . . . . . . 35.5 35.3 35.3 35.2
Education and health services. . . . . . . . . . . . . . . . . . . . . . . . . . . . . . . . . . . . . . . . . . . . . . . . . . 32.2 32.2 32.3 32.2
Leisure and hospitality. . . . . . . . . . . . . . . . . . . . . . . . . . . . . . . . . . . . . . . . . . . . . . . . . . . . . . . . . . . 24.9 24.8 24.7 24.8
Other services.. . . . . . . . . . . . . . . . . . . . . . . . . . . . . . . . . . . . . . . . . . . . . . . . . . . . . . . . . . . . . . . . . . . . 30.7 30.8 30.8 30.7
AVERAGE OVERTIME HOURS
Manufacturing.. . . . . . . . . . . . . . . . . . . . . . . . . . . . . . . . . . . . . . . . . . . . . . . . . . . . . . . . . . . . . . . . . . . . . . . . . . 4.3 4.2 4.2 4.2
Durable goods.. . . . . . . . . . . . . . . . . . . . . . . . . . . . . . . . . . . . . . . . . . . . . . . . . . . . . . . . . . . . . . . . . . . . . . 4.4 4.3 4.4 4.3
Nondurable goods.. . . . . . . . . . . . . . . . . . . . . . . . . . . . . . . . . . . . . . . . . . . . . . . . . . . . . . . . . . . . . . . . . . 4.1 4.0 4.0 4.0
1 Data relate to production employees in mining and logging and manufacturing, construction employees in construction, and nonsupervisoryemployees in the service-providing industries. These groups account for approximately four-fifths of the total employment on private nonfarmpayrolls.
p Preliminary
NOTE: Data have been revised to reflect March 2016 benchmark levels and updated seasonal adjustment factors.

ESTABLISHMENT DATATable B-8. Average hourly and weekly earnings of production and nonsupervisory employees on privatenonfarm payrolls by industry sector, seasonally adjusted1
Industry
Average hourly earnings Average weekly earnings
Mar.2016
Jan.2017
Feb.2017p
Mar.2017p
Mar.2016
Jan.2017
Feb.2017p
Mar.2017p
Total private. . . . . . . . . . . . . . . . . . . . . . . . . . . . . . . . . . . . . . . . . . . . . . . $21.40 $21.83 $21.86 $21.90 $719.04 $733.49 $734.50 $733.65
Goods-producing.. . . . . . . . . . . . . . . . . . . . . . . . . . . . . . . . . . . . . . 22.38 22.85 22.87 22.93 917.58 939.14 944.53 942.42
Mining and logging. . . . . . . . . . . . . . . . . . . . . . . . . . . . . . . . . . 26.90 27.55 27.49 27.63 1,197.05 1,253.53 1,261.79 1,262.69
Construction.. . . . . . . . . . . . . . . . . . . . . . . . . . . . . . . . . . . . . . . . . 25.69 26.33 26.30 26.39 1,012.19 1,034.77 1,046.74 1,039.77
Manufacturing.. . . . . . . . . . . . . . . . . . . . . . . . . . . . . . . . . . . . . . . 20.27 20.63 20.64 20.69 845.26 864.40 866.88 864.84
Durable goods. . . . . . . . . . . . . . . . . . . . . . . . . . . . . . . . . . . . 21.35 21.64 21.62 21.65 898.84 915.37 916.69 915.80
Nondurable goods. . . . . . . . . . . . . . . . . . . . . . . . . . . . . . . . 18.52 18.99 19.06 19.14 761.17 784.29 787.18 784.74
Private service-providing. . . . . . . . . . . . . . . . . . . . . . . . . . . . . . 21.19 21.61 21.65 21.69 686.56 698.00 699.30 700.59
Trade, transportation, and utilities. . . . . . . . . . . . . . . . . 18.92 19.19 19.20 19.24 633.82 644.78 643.20 644.54
Wholesale trade. . . . . . . . . . . . . . . . . . . . . . . . . . . . . . . . . . 24.06 24.48 24.55 24.51 926.31 949.82 952.54 948.54
Retail trade. . . . . . . . . . . . . . . . . . . . . . . . . . . . . . . . . . . . . . . . 15.03 15.22 15.22 15.24 446.39 453.56 455.08 455.68
Transportation and warehousing. . . . . . . . . . . . . . . 20.90 20.99 21.03 21.14 813.01 810.21 803.35 803.32
Utilities. . . . . . . . . . . . . . . . . . . . . . . . . . . . . . . . . . . . . . . . . . . . . 34.77 36.06 36.03 36.32 1,463.82 1,561.40 1,520.47 1,550.86
Information. . . . . . . . . . . . . . . . . . . . . . . . . . . . . . . . . . . . . . . . . . . 29.69 30.32 30.34 30.46 1,051.03 1,088.49 1,083.14 1,087.42
Financial activities. . . . . . . . . . . . . . . . . . . . . . . . . . . . . . . . . . . 25.97 26.27 26.28 26.37 960.89 969.36 969.73 973.05
Professional and business services. . . . . . . . . . . . . . 25.20 25.78 25.83 25.93 894.60 910.03 911.80 912.74
Education and health services.. . . . . . . . . . . . . . . . . . . . 22.41 22.82 22.88 22.85 721.60 734.80 739.02 735.77
Leisure and hospitality. . . . . . . . . . . . . . . . . . . . . . . . . . . . . . 12.73 13.16 13.18 13.25 316.98 326.37 325.55 328.60
Other services. . . . . . . . . . . . . . . . . . . . . . . . . . . . . . . . . . . . . . . 19.27 19.72 19.82 19.70 591.59 607.38 610.46 604.79
1 Data relate to production employees in mining and logging and manufacturing, construction employees in construction, and nonsupervisoryemployees in the service-providing industries. These groups account for approximately four-fifths of the total employment on private nonfarmpayrolls.
p Preliminary
NOTE: Data have been revised to reflect March 2016 benchmark levels and updated seasonal adjustment factors.

ESTABLISHMENT DATATable B-9. Indexes of aggregate weekly hours and payrolls for production and nonsupervisory employees onprivate nonfarm payrolls by industry sector, seasonally adjusted1
[2002=100]
Industry
Index of aggregate weekly hours2 Index of aggregate weekly payrolls3
Mar.2016
Jan.2017
Feb.2017p
Mar.2017p
Percentchangefrom:Feb.
2017 -Mar.
2017p
Mar.2016
Jan.2017
Feb.2017p
Mar.2017p
Percentchangefrom:Feb.
2017 -Mar.
2017p
Total private. . . . . . . . . . . . . . . . . . . . . . . . . . . . . . . . . . . . . 112.1 113.7 113.9 113.7 -0.2 160.3 165.9 166.4 166.4 0.0
Goods-producing. . . . . . . . . . . . . . . . . . . . . . . . . . . . . 89.4 89.8 90.7 90.4 -0.3 122.5 125.6 127.0 126.9 -0.1
Mining and logging. . . . . . . . . . . . . . . . . . . . . . . . 116.3 114.6 117.3 119.2 1.6 182.0 183.6 187.6 191.6 2.1
Construction. . . . . . . . . . . . . . . . . . . . . . . . . . . . . . . . 100.3 101.5 103.5 102.5 -1.0 139.2 144.2 147.0 146.1 -0.6
Manufacturing. . . . . . . . . . . . . . . . . . . . . . . . . . . . . . 83.2 83.4 83.8 83.5 -0.4 110.3 112.5 113.2 113.0 -0.2
Durable goods.. . . . . . . . . . . . . . . . . . . . . . . . . . 84.3 84.4 84.7 84.6 -0.1 112.4 114.0 114.4 114.4 0.0
Nondurable goods. . . . . . . . . . . . . . . . . . . . . . 81.4 81.7 82.2 81.6 -0.7 106.5 109.7 110.7 110.4 -0.3
Private service-providing. . . . . . . . . . . . . . . . . . . . 118.5 120.0 120.2 120.3 0.1 172.1 177.9 178.5 178.9 0.2
Trade, transportation, and utilities. . . . . . . 106.7 107.9 107.6 107.5 -0.1 144.0 147.7 147.3 147.5 0.1
Wholesale trade.. . . . . . . . . . . . . . . . . . . . . . . . 106.2 107.8 108.0 107.8 -0.2 150.5 155.4 156.1 155.7 -0.3
Retail trade. . . . . . . . . . . . . . . . . . . . . . . . . . . . . . 101.0 101.8 102.1 101.9 -0.2 130.1 132.8 133.2 133.1 -0.1
Transportation and warehousing. . . . . . 125.6 126.9 125.7 125.1 -0.5 166.5 169.0 167.7 167.7 0.0
Utilities. . . . . . . . . . . . . . . . . . . . . . . . . . . . . . . . . . . . 95.8 98.8 96.4 97.7 1.3 139.1 148.8 145.0 148.0 2.1
Information. . . . . . . . . . . . . . . . . . . . . . . . . . . . . . . . . 90.7 91.0 90.2 90.0 -0.2 133.3 136.5 135.5 135.7 0.1
Financial activities. . . . . . . . . . . . . . . . . . . . . . . . . 111.1 113.4 113.5 113.5 0.0 177.5 183.3 183.4 184.1 0.4
Professional and business services. . . . . 129.8 132.6 133.0 133.0 0.0 194.6 203.4 204.4 205.3 0.4
Education and health services. . . . . . . . . . . 135.1 138.0 138.8 138.5 -0.2 199.8 207.8 209.6 208.8 -0.4
Leisure and hospitality. . . . . . . . . . . . . . . . . . . . 124.8 126.3 125.9 126.4 0.4 180.4 188.7 188.4 190.3 1.0
Other services. . . . . . . . . . . . . . . . . . . . . . . . . . . . . 101.2 102.3 102.4 102.1 -0.3 142.1 146.9 147.9 146.6 -0.9
1 Data relate to production employees in mining and logging and manufacturing, construction employees in construction, and nonsupervisoryemployees in the service-providing industries. These groups account for approximately four-fifths of the total employment on private nonfarmpayrolls.
2 The indexes of aggregate weekly hours are calculated by dividing the current month’s estimates of aggregate hours by the corresponding 2002annual average aggregate hours. Aggregate hours estimates are the product of estimates of average weekly hours and employment.
3 The indexes of aggregate weekly payrolls are calculated by dividing the current month’s estimates of aggregate weekly payrolls by thecorresponding 2002 annual average aggregate weekly payrolls. Aggregate payrolls estimates are the product of estimates of average hourlyearnings, average weekly hours, and employment.
p Preliminary
NOTE: Data have been revised to reflect March 2016 benchmark levels and updated seasonal adjustment factors.