Embed Size (px)
Citation preview
REVIEW
The evolutionary consequences of oxygenic photosynthesis: a bodysize perspective
Jonathan L. Payne • Craig R. McClain • Alison G. Boyer • James H. Brown •
Seth Finnegan • Michał Kowalewski • Richard A. Krause Jr. • S. Kathleen Lyons •
Daniel W. McShea • Philip M. Novack-Gottshall • Felisa A. Smith •
Paula Spaeth • Jennifer A. Stempien • Steve C. Wang
Received: 2 October 2009 / Accepted: 18 August 2010 / Published online: 7 September 2010
� Springer Science+Business Media B.V. 2010
Abstract The high concentration of molecular oxygen in
Earth’s atmosphere is arguably the most conspicuous and
geologically important signature of life. Earth’s early
atmosphere lacked oxygen; accumulation began after the
evolution of oxygenic photosynthesis in cyanobacteria
around 3.0–2.5 billion years ago (Gya). Concentrations of
oxygen have since varied, first reaching near-modern
values *600 million years ago (Mya). These fluctuations
have been hypothesized to constrain many biological
patterns, among them the evolution of body size. Here, we
review the state of knowledge relating oxygen availability
to body size. Laboratory studies increasingly illuminate the
mechanisms by which organisms can adapt physiologically
to the variation in oxygen availability, but the extent to
which these findings can be extrapolated to evolutionary
timescales remains poorly understood. Experiments con-
firm that animal size is limited by experimental hypoxia,
but show that plant vegetative growth is enhanced due to
J. L. Payne (&) � S. Finnegan
Department of Geological and Environmental Sciences,
Stanford University, 450 Serra Mall, Bldg. 320,
Stanford, CA 94305, USA
e-mail: [email protected]
C. R. McClain
National Evolutionary Synthesis Center (NESCent),
2024 W. Main St., Suite A200, Durham, NC 27705, USA
A. G. Boyer
Department of Ecology and Evolutionary Biology, Yale
University, 165 Prospect St., New Haven, CT 06520, USA
J. H. Brown � F. A. Smith
Department of Biology, University of New Mexico,
Albuquerque, NM 87131, USA
M. Kowalewski
Department of Geosciences, Virginia Polytechnic Institute
and State University, Blacksburg, VA 24061, USA
R. A. Krause Jr.
Department of Geology and Geophysics, Yale University,
PO Box 208109, New Haven, CT 06520, USA
S. K. Lyons
Department of Paleobiology, National Museum of Natural
History, Smithsonian Institution, Washington, DC 20560, USA
D. W. McShea
Department of Biology, Duke University, Box 90338,
Durham, NC 27708, USA
P. M. Novack-Gottshall
Department of Biological Sciences, Benedictine University,
5700 College Ave., Lisle, IL 60532, USA
P. Spaeth
Natural Resources Department, Northland College,
1411 Ellis Ave., Ashland, WI 54806, USA
J. A. Stempien
Department of Geology, Washington and Lee University,
Lexington, VA 24450, USA
S. C. Wang
Department of Mathematics and Statistics, Swarthmore College,
500 College Ave., Swarthmore, PA 19081, USA
Present Address:S. Finnegan
Division of Geological and Planetary Sciences, California
Institute of Technology, Pasadena, CA 91125, USA
123
Photosynth Res (2011) 107:37–57
DOI 10.1007/s11120-010-9593-1
reduced photorespiration at lower O2:CO2. Field studies of
size distributions across extant higher taxa and individual
species in the modern provide qualitative support for a
correlation between animal and protist size and oxygen
availability, but few allow prediction of maximum or mean
size from oxygen concentrations in unstudied regions.
There is qualitative support for a link between oxygen
availability and body size from the fossil record of protists
and animals, but there have been few quantitative analyses
confirming or refuting this impression. As oxygen transport
limits the thickness or volume-to-surface area ratio—rather
than mass or volume—predictions of maximum possible
size cannot be constructed simply from metabolic rate and
oxygen availability. Thus, it remains difficult to confirm
that the largest representatives of fossil or living taxa are
limited by oxygen transport rather than other factors.
Despite the challenges of integrating findings from exper-
iments on model organisms, comparative observations
across living species, and fossil specimens spanning mil-
lions to billions of years, numerous tractable avenues of
research could greatly improve quantitative constraints on
the role of oxygen in the macroevolutionary history of
organismal size.
Keywords Body size � Oxygen � Evolution �Precambrian � Maximum size � Optimum size
Abbreviations
PAL Present atmospheric level (of oxygen)
Mya Millions of years ago
Gya Billions of years ago
Introduction
The interval of geological time from the Cambrian Period to
the Recent (543–0 Mya) is termed the Phanerozoic (Phan-
ero—visible; zoic—animals) because the most obvious
contrast between Phanerozoic and Precambrian rocks is the
presence of macrofossils. It was not until the 1950s and
1960s that definitive fossils were described from the Gun-
flint Chert (Barghoorn and Tyler 1963, 1965; Tyler and
Barghoorn 1954), a 1.88-billion-year-old shallow-water
deposit exposed in Minnesota and Ontario on the northern
shore of Lake Superior (Fralick et al. 2002). Additional
fossil finds and geochemical data have since extended the
record of life back another 2 billion years (Allwood et al.
2006; Mojzsis et al. 1996; Rosing 1999; Schidlowski et al.
1979; Schopf 1993; Schopf and Packer 1987; Tice and Lowe
2004). Precambrian fossils can be spectacularly well pre-
served (cf. Schopf and Klein 1992) but nearly all are
microscopic. Larger macroscopic organisms such as clams,
snails, insects, trees, dinosaurs, elephants, and whales are all
relative newcomers to our planet.
Why did it take 2 billion years for macroscopic organ-
isms to evolve from their microscopic ancestors and
another billion years for them to exceed a meter in maxi-
mum dimension? Lack of sufficient oxygen appears to have
been an important constraint. Earth’s atmosphere lacked
oxygen prior to 2.5 Gya, and near-modern levels were not
achieved until about 600 million years ago (Mya) (Canfield
2005; Holland 2006; Sessions et al. 2009), coincident with
the first appearance of large life forms. For geometrically
and physiologically simple aerobic organisms, diffusion of
oxygen into the organism limits the maximum possible size
(Alexander 1971; Raff and Raff 1970), consistent with the
observed link between oxygenation of the atmosphere and
the evolution of larger organisms.
The evolutionary importance of atmospheric oxygen
extends far beyond its potential to limit body size; oxygen is
required for biosynthetic reactions in all eukaryotes; without
it, complex life on Earth would likely be impossible
(Berkner and Marshall 1965; Catling et al. 2005; Cloud
1965, 1968, 1972; Knoll 2003; Nursall 1959). Considerable
discussion has arisen about the evolutionary importance of
oxygen in the origin and diversification of early eukaryotes,
plants, and animals (e.g., Berkner and Marshall 1965;
Berner et al. 2007; Brown et al. 2004; Calder 1984; Cloud
1968, 1972; Falkowski et al. 2005; Gilbert 1996; Gillooly
et al. 2001a, b; Graham et al. 1995; Huey and Ward 2005;
Knoll 1992, 2003; Knoll and Holland 1995; Lane 2002;
Lenton 2003; McAlester 1970; Nursall 1959; Peters 1983;
Raven 1991; Raven et al. 1994; Tappan 1974).
In this review, we discuss the role of varying oxygen
levels on the evolution of organism size. Size is of great
physiological and ecological significance (e.g., Peters
1983); moreover, it is easily quantified and readily compared
across distantly related taxa. Oxygen is by no means the only
factor to influence the evolution of body size and, therefore,
our review addresses two related questions in sequence. Can
oxygen constrain the evolution of body size? If so, was it, in
fact, a primary control on the evolution of body size over
earth history? We take a synthetic approach by linking
theory with data from laboratory, field, and fossil studies
across a wide range spatial, temporal, and taxonomic scales.
We believe a systematic attempt to integrate these recent
findings will do as much to spur additional research as it will
to inform readers of the current state of knowledge.
History of atmospheric oxygen
Oxygenic photosynthesis evolved only once in the history
of life; consequently, all oxygenic photosynthesis today
38 Photosynth Res (2011) 107:37–57
123

occurs in cyanobacteria and their descendant chloroplasts
within eukaryotic cells (Blankenship et al. 2007; Fehling
et al. 2007). Accumulation of oxygen in the atmosphere
requires production by photosynthesis in excess of con-
sumption through aerobic respiration and the oxidation of
other reduced chemical species such as sulfide or ferrous
iron. Sequestration of reduced (organic) carbon through
burial in rocks is the primary mechanism by which organic
carbon is protected from re-oxidation. Oxygen will accu-
mulates in the atmosphere as long as its production exceeds
consumption by reaction with reduced gases from volca-
noes or existing pools of reduced chemical species in the
crust and atmosphere (Holland 2009; Kump and Barley
2007).
Atmospheric oxygen levels have increased in two major
steps through Earth history, but have also varied consider-
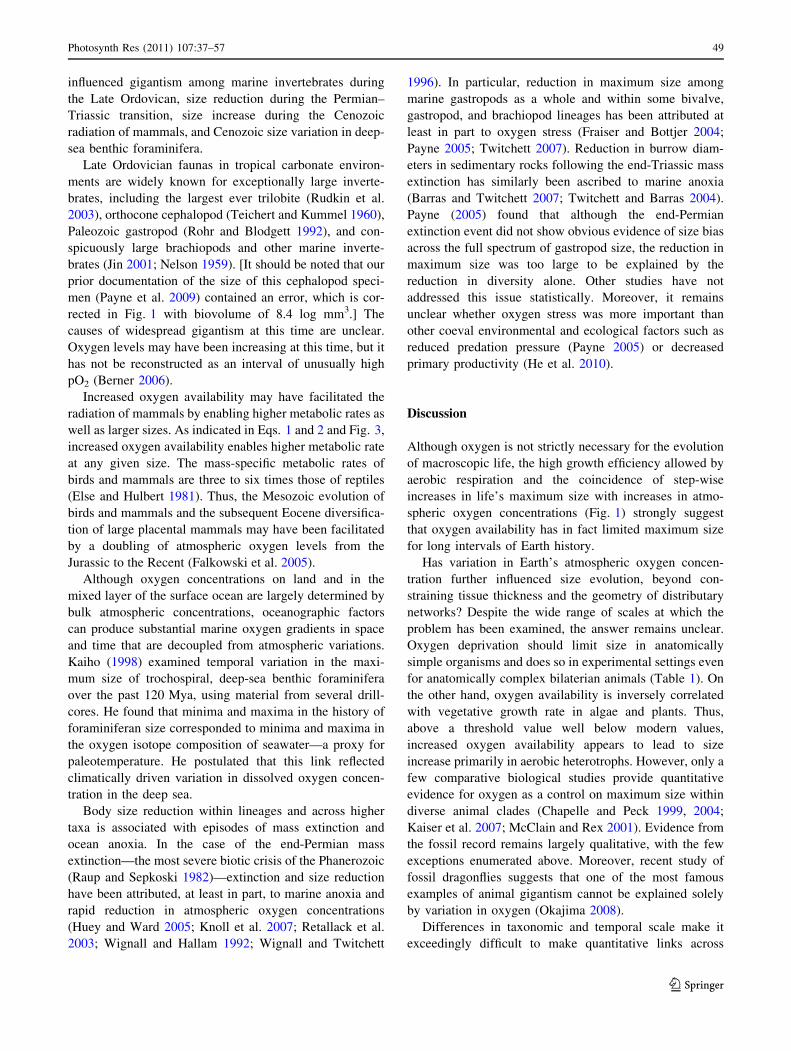
ably between these major steps. Atmospheric oxygen was
less than 0.001% of present atmospheric level (PAL) prior to
2.4 billion years ago (Gya; reviewed by Sessions et al. 2009;
Fig. 1a). Between 2.4 Gya and 800 Mya, oxygen concen-
trations increased to levels between 1 and 18% of PAL
(reviewed by Canfield 2005), with a possible excursion back
to even lower values *2.0 Gya (Frei et al. 2009). Near-
modern pO2 first achieved *600 Mya, late in the Neopro-
terozoic Era (Berner et al. 2003; Canfield et al. 2007; Fike
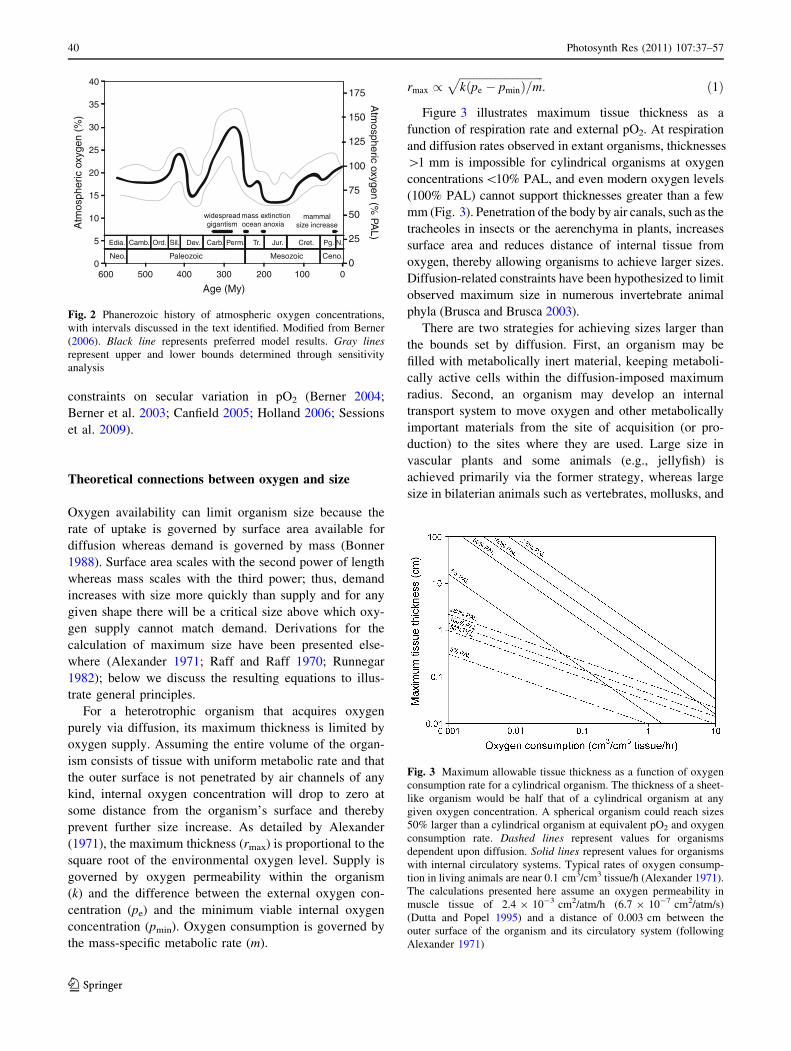
et al. 2006). Figure 2 illustrates the considerable variation in
atmospheric oxygen levels through Phanerozoic time, which
peaked near 150% PAL (31% of the atmosphere) late in
Carboniferous time and dropped as low as 60% PAL (12% of
the atmosphere) early in the Jurassic (Fig. 2; Belcher and
McElwain 2008; Bergman et al. 2004; Berner 2004, 2006;
Falkowski et al. 2005).
Oxygen concentrations in the oceans can be partially
decoupled from atmospheric values by oceanographic
processes, such as the high rates of aerobic respiration at
depths of a few hundred meters or shifts in global climate
and associated large-scale patterns of ocean circulation.
These processes have occasionally produced widespread
marine anoxia during Phanerozoic time (Schlanger and
Jenkyns 1976), which may have contributed to episodes of
mass extinctions of marine animals (Hallam and Wignall
1997; McAlester 1970).
Several recent reviews provide detailed discussion of the
geochemical controls on oxygen accumulation and proxy
Age (Ma)
1000200030004000
Bio
volu
me
(log
mm
3 )
-8
-4
0
4
8
12
-6
-2
2
6
10
14
Archaean Proterozoic Phan.
giant sequioa
largest prokaryote
blue whale
Paleoar. Mesoar. Neoar.Eoarchaean Paleoproterozoic Mesoprot. Neoprot. Pz. Mz. C
largest single-celledeukaryote
Grypania
Dickinsonia
cephalopod
arthropod
Primaevifilum
Atm
osph
eric
oxy
gen
(per
cent
PA
L)
0.0001
0.001
0.01
0.1
1
10
100
1000
A
B
unnamedacritarch
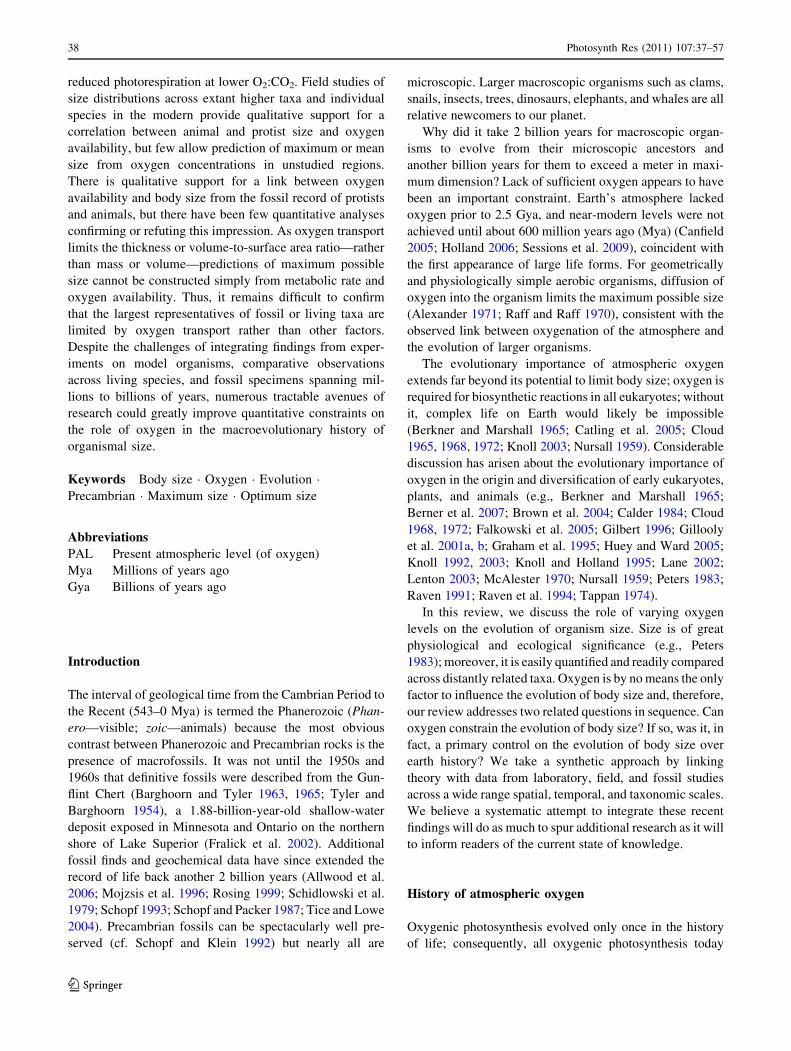
Fig. 1 Atmospheric oxygen
levels and maximum organismal
sizes through geological time.
a Likely history of atmospheric
oxygen levels, modified from
Kump (2008) and Lyons and
Reinhard (2009). Dashed lineswith arrows indicate upper and
lower bounds based on proxy
constraints. Smooth gray lineindicates a best estimate of the
history of pO2. b Sizes of the
largest known fossils through
geological time, modified from
Payne et al. (2009). Redtriangles represent prokaryotes.
Yellow circles represent protists.
Blue squares represent animals.
Green diamonds represent
vascular plants. The gray squarerepresents Dickinsonia, a
taxonomically problematic
Ediacaran organism. The graytriangle represents an unnamed
Archaean acritarch for which
prokaryotic versus eukaryotic
affinities remain uncertain (see
Javaux et al. 2010)
Photosynth Res (2011) 107:37–57 39
123
constraints on secular variation in pO2 (Berner 2004;
Berner et al. 2003; Canfield 2005; Holland 2006; Sessions
et al. 2009).
Theoretical connections between oxygen and size
Oxygen availability can limit organism size because the
rate of uptake is governed by surface area available for
diffusion whereas demand is governed by mass (Bonner
1988). Surface area scales with the second power of length
whereas mass scales with the third power; thus, demand
increases with size more quickly than supply and for any
given shape there will be a critical size above which oxy-
gen supply cannot match demand. Derivations for the
calculation of maximum size have been presented else-
where (Alexander 1971; Raff and Raff 1970; Runnegar
1982); below we discuss the resulting equations to illus-
trate general principles.
For a heterotrophic organism that acquires oxygen
purely via diffusion, its maximum thickness is limited by
oxygen supply. Assuming the entire volume of the organ-
ism consists of tissue with uniform metabolic rate and that
the outer surface is not penetrated by air channels of any
kind, internal oxygen concentration will drop to zero at
some distance from the organism’s surface and thereby
prevent further size increase. As detailed by Alexander
(1971), the maximum thickness (rmax) is proportional to the
square root of the environmental oxygen level. Supply is
governed by oxygen permeability within the organism
(k) and the difference between the external oxygen con-
centration (pe) and the minimum viable internal oxygen
concentration (pmin). Oxygen consumption is governed by
the mass-specific metabolic rate (m).
rmax /ffiffiffiffiffiffiffiffiffiffiffiffiffiffiffiffiffiffiffiffiffiffiffiffiffiffiffiffiffiffi
kðpe � pminÞ=mp
: ð1Þ
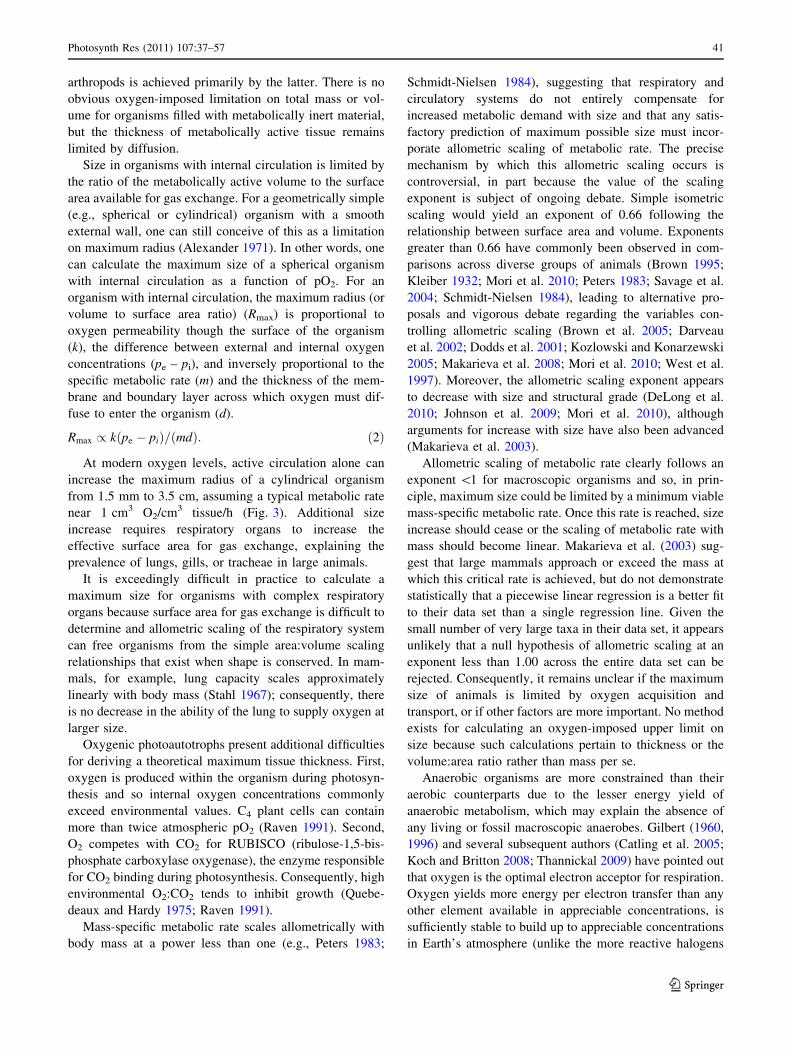
Figure 3 illustrates maximum tissue thickness as a
function of respiration rate and external pO2. At respiration
and diffusion rates observed in extant organisms, thicknesses
[1 mm is impossible for cylindrical organisms at oxygen
concentrations\10% PAL, and even modern oxygen levels
(100% PAL) cannot support thicknesses greater than a few
mm (Fig. 3). Penetration of the body by air canals, such as the
tracheoles in insects or the aerenchyma in plants, increases
surface area and reduces distance of internal tissue from
oxygen, thereby allowing organisms to achieve larger sizes.
Diffusion-related constraints have been hypothesized to limit
observed maximum size in numerous invertebrate animal
phyla (Brusca and Brusca 2003).
There are two strategies for achieving sizes larger than
the bounds set by diffusion. First, an organism may be
filled with metabolically inert material, keeping metaboli-
cally active cells within the diffusion-imposed maximum
radius. Second, an organism may develop an internal
transport system to move oxygen and other metabolically
important materials from the site of acquisition (or pro-
duction) to the sites where they are used. Large size in
vascular plants and some animals (e.g., jellyfish) is
achieved primarily via the former strategy, whereas large
size in bilaterian animals such as vertebrates, mollusks, and
600 500 400 300 200 100 0
40
30
20
10
0
5
15
25
35
Age (My)
Atm
osph
eric
oxy
gen
(%)
Paleozoic Mesozoic Ceno.
Edia. Camb. Ord. Sil. Dev. Carb. Perm. Tr. Jur. Cret. Pg. N.
Neo.
widespread gigantism
mammalsize increase
mass extinctionocean anoxia
Atm
ospheric oxygen (% PA
L)
100
50
0
25
75
175
125
150
Fig. 2 Phanerozoic history of atmospheric oxygen concentrations,
with intervals discussed in the text identified. Modified from Berner
(2006). Black line represents preferred model results. Gray linesrepresent upper and lower bounds determined through sensitivity
analysis
Fig. 3 Maximum allowable tissue thickness as a function of oxygen
consumption rate for a cylindrical organism. The thickness of a sheet-
like organism would be half that of a cylindrical organism at any
given oxygen concentration. A spherical organism could reach sizes
50% larger than a cylindrical organism at equivalent pO2 and oxygen
consumption rate. Dashed lines represent values for organisms
dependent upon diffusion. Solid lines represent values for organisms
with internal circulatory systems. Typical rates of oxygen consump-
tion in living animals are near 0.1 cm3/cm3 tissue/h (Alexander 1971).
The calculations presented here assume an oxygen permeability in
muscle tissue of 2.4 9 10-3 cm2/atm/h (6.7 9 10-7 cm2/atm/s)
(Dutta and Popel 1995) and a distance of 0.003 cm between the
outer surface of the organism and its circulatory system (following
Alexander 1971)
40 Photosynth Res (2011) 107:37–57
123
arthropods is achieved primarily by the latter. There is no
obvious oxygen-imposed limitation on total mass or vol-
ume for organisms filled with metabolically inert material,
but the thickness of metabolically active tissue remains
limited by diffusion.
Size in organisms with internal circulation is limited by
the ratio of the metabolically active volume to the surface
area available for gas exchange. For a geometrically simple
(e.g., spherical or cylindrical) organism with a smooth
external wall, one can still conceive of this as a limitation
on maximum radius (Alexander 1971). In other words, one
can calculate the maximum size of a spherical organism
with internal circulation as a function of pO2. For an
organism with internal circulation, the maximum radius (or
volume to surface area ratio) (Rmax) is proportional to
oxygen permeability though the surface of the organism
(k), the difference between external and internal oxygen
concentrations (pe – pi), and inversely proportional to the
specific metabolic rate (m) and the thickness of the mem-
brane and boundary layer across which oxygen must dif-
fuse to enter the organism (d).
Rmax / kðpe � piÞ=ðmdÞ: ð2Þ
At modern oxygen levels, active circulation alone can
increase the maximum radius of a cylindrical organism
from 1.5 mm to 3.5 cm, assuming a typical metabolic rate
near 1 cm3 O2/cm3 tissue/h (Fig. 3). Additional size
increase requires respiratory organs to increase the
effective surface area for gas exchange, explaining the
prevalence of lungs, gills, or tracheae in large animals.
It is exceedingly difficult in practice to calculate a
maximum size for organisms with complex respiratory
organs because surface area for gas exchange is difficult to
determine and allometric scaling of the respiratory system
can free organisms from the simple area:volume scaling
relationships that exist when shape is conserved. In mam-
mals, for example, lung capacity scales approximately
linearly with body mass (Stahl 1967); consequently, there
is no decrease in the ability of the lung to supply oxygen at
larger size.
Oxygenic photoautotrophs present additional difficulties
for deriving a theoretical maximum tissue thickness. First,
oxygen is produced within the organism during photosyn-
thesis and so internal oxygen concentrations commonly
exceed environmental values. C4 plant cells can contain
more than twice atmospheric pO2 (Raven 1991). Second,
O2 competes with CO2 for RUBISCO (ribulose-1,5-bis-
phosphate carboxylase oxygenase), the enzyme responsible
for CO2 binding during photosynthesis. Consequently, high
environmental O2:CO2 tends to inhibit growth (Quebe-
deaux and Hardy 1975; Raven 1991).
Mass-specific metabolic rate scales allometrically with
body mass at a power less than one (e.g., Peters 1983;
Schmidt-Nielsen 1984), suggesting that respiratory and
circulatory systems do not entirely compensate for
increased metabolic demand with size and that any satis-
factory prediction of maximum possible size must incor-
porate allometric scaling of metabolic rate. The precise
mechanism by which this allometric scaling occurs is
controversial, in part because the value of the scaling
exponent is subject of ongoing debate. Simple isometric
scaling would yield an exponent of 0.66 following the
relationship between surface area and volume. Exponents
greater than 0.66 have commonly been observed in com-
parisons across diverse groups of animals (Brown 1995;
Kleiber 1932; Mori et al. 2010; Peters 1983; Savage et al.
2004; Schmidt-Nielsen 1984), leading to alternative pro-
posals and vigorous debate regarding the variables con-
trolling allometric scaling (Brown et al. 2005; Darveau
et al. 2002; Dodds et al. 2001; Kozlowski and Konarzewski
2005; Makarieva et al. 2008; Mori et al. 2010; West et al.
1997). Moreover, the allometric scaling exponent appears
to decrease with size and structural grade (DeLong et al.
2010; Johnson et al. 2009; Mori et al. 2010), although
arguments for increase with size have also been advanced
(Makarieva et al. 2003).
Allometric scaling of metabolic rate clearly follows an
exponent \1 for macroscopic organisms and so, in prin-
ciple, maximum size could be limited by a minimum viable
mass-specific metabolic rate. Once this rate is reached, size
increase should cease or the scaling of metabolic rate with
mass should become linear. Makarieva et al. (2003) sug-
gest that large mammals approach or exceed the mass at
which this critical rate is achieved, but do not demonstrate
statistically that a piecewise linear regression is a better fit
to their data set than a single regression line. Given the
small number of very large taxa in their data set, it appears
unlikely that a null hypothesis of allometric scaling at an
exponent less than 1.00 across the entire data set can be
rejected. Consequently, it remains unclear if the maximum
size of animals is limited by oxygen acquisition and
transport, or if other factors are more important. No method
exists for calculating an oxygen-imposed upper limit on
size because such calculations pertain to thickness or the
volume:area ratio rather than mass per se.
Anaerobic organisms are more constrained than their
aerobic counterparts due to the lesser energy yield of
anaerobic metabolism, which may explain the absence of
any living or fossil macroscopic anaerobes. Gilbert (1960,
1996) and several subsequent authors (Catling et al. 2005;
Koch and Britton 2008; Thannickal 2009) have pointed out
that oxygen is the optimal electron acceptor for respiration.
Oxygen yields more energy per electron transfer than any
other element available in appreciable concentrations, is
sufficiently stable to build up to appreciable concentrations
in Earth’s atmosphere (unlike the more reactive halogens
Photosynth Res (2011) 107:37–57 41
123
such as fluorine, chlorine, and bromine), and is abundant in
a biologically available form—liquid water. Catling et al.
(2005) argue that alternative metabolic pathways are likely
too inefficient to permit the growth of large organisms.
They focus on differences in growth efficiency; for ani-
mals, values are near 50%, whereas anaerobic organisms
never achieve more than 20% (Catling et al. 2005). The
inefficiency of energy transfer up the food chain would
limit the abundance of larger organisms, which tend to be
at higher trophic levels. Considering Eq. 1, however, we
suggest that the transport of electron acceptors into the
body can also present a severe limitation. As with aerobic
organisms, the maximum possible thickness for anaerobic
organisms is limited by availability of the electron accep-
tor, metabolic rate, and geometry. The lower energy yield
of anaerobic reactions means that when compared with a
similar-sized aerobic organism, an anaerobic organism
would require a higher concentration of the electron
acceptor, exhibit a much lower metabolic rate, or have a
lower volume:area ratio. If the Precambrian oceans lacked
any suitably abundant electron acceptor, and if all life is
limited by some minimum viable metabolic rate, then the
failure of large organisms to evolve prior to the rise in
oxygen may reflect this fundamental energetic limitation.
The theoretical results presented above demonstrate that
oxygen can limit body size; they do not demonstrate that it
does (or did) limit body size. The structural complexity of
large organisms and the fact that oxygen availability limits
thickness rather than mass make it difficult to predict an
oxygen-limited maximum size for fungi, plants, or animals.
Moreover, selection on body size in any given species
reflects numerous trade-offs between advantages and dis-
advantages of size increase or decrease (Brown 1995; Brown
et al. 1993, 2004; Calder 1984; Peters 1983; Schmidt-
Nielsen 1984; Sebens 2002). Below we address the empirical
question of whether oxygen does in fact impose a limit on
size within or among living species and whether historical
variation in atmospheric oxygen concentrations has signifi-
cantly influenced macroevolutionary trends in body size.
Experiments on oxygen and size
Hypoxia and hyperoxia each affect growth and develop-
ment of algae, plants, and animals in laboratory settings.
The vast majority of studies have focused on animals. The
few whole-organism experiments on plants have used
agriculturally important taxa such as wheat, corn, soy-
beans, and lettuce.
In animals, size decrease is nearly universal under
hypoxia, occurring in fruit flies, snakes, fish, rats, and even
human populations (Table 1) whereas hyperoxia is asso-
ciated with increased final size and growth rate in a
minority of studies (Table 1). The most pronounced
acceleration of growth under experimental hyperoxia
occurred in the domestic chicken (Metcalfe et al. 1981;
Stock et al. 1983), a species which has been bred specifi-
cally for rapid growth. In studies finding size effects
associated with both hypoxia and hyperoxia, the magnitude
of change in body size under hyperoxia has been much less
than that observed under hypoxia (Frazier et al. 2001;
Owerkowicz et al. 2009). Several other studies have found
size decrease under hypoxia but no increase under hyper-
oxia (Andrews 2002; Greenberg and Ar 1996; Herman and
Ingermann 1996; Klok et al. 2009).
Multi-generation studies point toward differences in the
mechanisms of size change in response to hypoxia versus
hyperoxia. Klok et al. (2009) reared individual flies under a
variety of oxygen levels, finding size reduction under
hypoxia but no change in size under hyperoxia. However,
exposing multiple generations of a population to hyperoxia
produced size increase that was maintained even after return
to normal oxygen, suggesting an evolutionary response
favoring larger size under hyperoxia. In contrast, lineages
exposed to hypoxia returned to pre-exposure sizes after one
or two generations reared under normal atmospheric levels.
These findings suggest size reduction under hypoxia resulted
entirely from developmental plasticity whereas size increase
under hyperoxia was evolutionary (Klok et al. 2009).
Experimental selection for large size yielded similar results.
Lineages raised under normoxia and hyperoxia exhibited
heritable size increase, whereas lineages raised under
hypoxia did not exhibit larger size until subsequent gener-
ations were reared under normoxia (Klok and Harrison
2009). Thus, not only are the effects of hypoxia versus
hyperoxia asymmetric, but also the mechanisms underlying
size responses differ as well.
Performance studies have also been used to assess the
extent to which oxygen supply limits size evolution. One
potential consequence of size limitation by oxygen is a
higher critical oxygen level (the value below which the
organism cannot function indefinitely) at large body size or
a smaller safety margin between resting and maximum
metabolic rate. There is little experimental evidence for
such an effect. Critical oxygen level does not scale with
size across species of grasshoppers (Greenlee et al. 2007)
or during development in grasshoppers and caterpillars
(Greenlee and Harrison 2004, 2005). In fact, the metabolic
safety margin increases with size in the grasshopper
Schistocerca americana (Greenlee and Harrison 2004).
Decrease in endurance during aerobic exercise with size in
grasshoppers appears to reflect an increase in mass-specific
metabolic rate with size rather than a decrease in the
absolute capacity of the organism to supply its muscles
with oxygen (Kirkton et al. 2005). Performance reduction
in pycnogonids (sea spiders) under hypoxia is not
42 Photosynth Res (2011) 107:37–57
123

Table 1 Results from studies of growth under hypoxic or hyperoxic conditions
Taxon Hypoxia Response Hyperoxia Response Reference
Alligator mississippiensis(American alligator)
10% Decrease Crossley and Altimiras (2005)
12% Decrease Owerkowicz et al. (2009)
15% None Crossley and Altimiras (2005)
17% Decrease Stephen et al. (1995)
30% No embryonic effect;
faster growth after
hatching
Owerkowicz et al. (2009)
Ambystoma maculatum(spotted salamander)
3–14% None Mills and Barnhart (1999)
Anarhichas minor(spotted wolffish)
14.5 mg/l
(9.6 mg/
l = norm)
None Foss et al. (2003)
Cavia porcellus(guinea pig)
13% Increase Hsia et al. (2005)
Colinus virginianus(Northern bobwhite quail)
60% None Williams and Swift (1988)
Drosophila melanogaster
(fruit fly)
7.5% Decrease Peck and Maddrell (2005)
10% Decrease Frazier et al. (2001),
Klok et al. (2009),
Peck and Maddrell (2005)
15% Decrease Peck and Maddrell (2005)
40% Increase (minor) Frazier et al. (2001)
40% None Klok et al. (2009)
Gallus gallus(domestic chicken)
3100 m Decrease Wangensteen et al. (1974)
3800 m Decrease Wangensteen et al. (1974)
15% Decrease Dzialowski et al. (2002)
15% Decrease Chan and Burggren (2005)
15% Decrease Tintu et al. (2007)
13% Decrease Giussani et al. (2007)
40% Increase Stock et al. (1983)
60% Increase Metcalfe et al. (1981)
70% Increase Stock et al. (1983)
Homo sapiens (humans) Sea level to 4500 m Decrease Mortola et al. (2000)
400–3600 m Decrease Zamudio et al. (2007)
2500–4500 m Decrease Julian et al. (2007)
4000–5500 m Decrease Frisancho and Baker (1970)
Mesocricetus auratus (hamster) 10% Decrease Frappell and Mortola (1994)
Mus musculus (mouse) 11% Decrease Fan et al. (2005)
Oncorhynchus kisutch(Coho Salmon)
2.37 mg/L Decrease Sundt-Hansen et al. (2007)
Oncorhynchus mykiss (trout) 10% Decrease Dabrowski et al. (2004)
38% Increase Dabrowski et al. (2004)
Pseudemys nelsoni(Florida red-bellied turtle)
10% Decrease Kam (1993)
Rattus rattus (Rat) 10% Decrease Mortola et al. (1990)
10% Decrease Frappell and Mortola (1994)
12.5% Decrease Cunningham et al. (1974)
15% Decrease Mortola et al. (1990)
Photosynth Res (2011) 107:37–57 43
123
correlated with size (Woods et al. 2009). Critical oxygen
levels were unaffected by multi-generational rearing of
Drosophila melanogaster under hypoxia and hyperoxia
(Klok et al. 2010). These findings have been interpreted by
some (e.g., Woods et al. 2009) to indicate that maximum
size in the studied clades is not oxygen-limited. However,
it is also possible that the findings simply reflect the fact
that the need for metabolic scope is unrelated to size in
these organisms. Species cannot evolve to sizes where
resting metabolism is oxygen-limited because of the
behavioral constraints such a size would impose, and small
species may have no need for greater scope than larger
species. Therefore, these findings should be interpreted
cautiously with respect to constraints on size evolution.
The limited response of organism size to experimental
hyperoxia could indicate that little evolutionary response
would occur during intervals of elevated pO2, but these
observations are perhaps better interpreted to reflect asym-
metry in nature. Many animals encounter hypoxia during
growth and development, in an egg, in utero, or within
microenvironments such as decaying organic matter and
burrows. In contrast, there are few natural settings under
which animals encounter hyperoxia, as noted by Harrison
(2010) with respect to D. melanogaster. Consequently,
there is likely little selective advantage associated with
developmental plasticity that can take advantage of elevated
pO2. The rarity of natural hyperoxic environments can
explain why hemoglobin in the American alligator becomes
saturated with oxygen under present-day oxygen levels
(Busk et al. 2000), limiting the benefits of hyperoxia, and the
observation that flight performance in several insects
appears to be generally unaffected by experimental hyper-
oxia (Harrison 2010).
Growth response to experimental hypoxia is more com-
plex in plants and algae than in animals. Vegetative growth
generally increases under hypoxia as severe as 25% PAL in
plants without carbon-concentrating mechanisms (i.e., C3
plants) such as soybeans (Glycine max), liverworts
(Marchantia polymorpha), and the scarlet monkeyflower
(Mimulus cardinalis) (Bjorkman et al. 1969, 1968; Quebe-
deaux and Hardy 1973, 1975), although lettuce (Lactuca
sativa) exhibited reduced growth at 25% PAL (He et al.
2007). In contrast to the increase in vegetative growth, seed
growth decreased under hypoxia in soybeans, reaching zero
in soybeans at 24% PAL (Quebedeaux and Hardy 1973,
1975). Plants with carbon concentrating mechanisms (i.e.,
C4 and CAM plants), such as sorghum wheat (Sorghum
bicolor) and corn (Zea mays), did not exhibit increased
vegetative growth under experimental hypoxia covering the
above-ground portion of the plant (Bjorkman et al. 1969;
Quebedeaux and Hardy 1973, 1975). Musgrave and Strain
(1988) were the first to conduct whole-plant growth exper-
iments under hypoxia, using two strains of Triticum aestivum
(wheat). They observed increased vegetative growth under
hypoxia and under high CO2 (1000 ppm). Quebedeaux and
Hardy observed a decline in wheat seed production under
hypoxia (1973), whereas Guo et al. (2008) observed slightly
increased yield at 50 and 25% PAL, with yield declining to
near zero at 12% PAL. Thus, although experimental results
are somewhat mixed, hypoxia generally tends to increase
vegetative growth for C3 plants but not for C4 plants, con-
sistent with differences in mechanisms for CO2 acquisition
and O2 release (Raven 1991). As hypoxia negatively impacts
seed production, it is difficult to extrapolate these findings to
expected differences in fitness and resulting trends in size
over multiple-generation timescales.
Table 1 continued
Taxon Hypoxia Response Hyperoxia Response Reference
Sceloporus undulates(Eastern fence lizard)
8% Decrease Andrews (2002)
32% None Andrews (2002)
Schistocerca americana(grasshopper)
5% None Harrison et al. (2006)
10% None Harrison et al. (2006)
40% None Harrison et al. (2006)
Tenebrio molitor(mealworm beetle)
10% Decrease Greenberg and Ar (1996)
10.5% None Loudon (1988)
15% None Loudon (1988)
40% None Greenberg and Ar (1996)
Thamnophis elegans(garter snake)
5% Decrease Herman and Ingermann (1996)
100% None (small, not
significant increase)
Herman and Ingermann (1996)
44 Photosynth Res (2011) 107:37–57
123
Hyperoxia inhibited growth in all studies of plants, algae,
and cyanobacteria. Torzillo et al. (1998) observed decreased
biomass production under hyperoxia in the cyanobacterium
Spirulina plantensis. Pruder and Bolton (1980) observed a
reduction in total carbon content (though not cell number) at
high pO2 in the estuarine diatom Thalassiosira pseudonana
clone 3H. McMinn et al. (2005) observed decreased growth
in the diatoms Fragilariopsis cylindrus, F. curta, Pseudo-
nitzschia sp., Porosira glacialis, Endomoneis kjellmannii,
and Nitzschia frigida under hyperoxia. Quebedeuax and
Hardy (1975) observed decreases in both vegetative and
reproductive growth in soybeans and wheat under hyperoxia
(190% PAL). No experiments have reported cell size
directly, although Pruder and Bolton’s (1980) results appear
to require a decrease in mean cell size.
The effects of oxygen on size in oxygenic photoauto-
trophs suggest photorespiration exerts a greater negative
effect on growth than any beneficial effects from greater
oxygen availability. Vegetative growth appears not to be
inhibited by hypoxia at oxygen levels above 25% PAL,
although reproduction may be optimized by higher pO2 or
higher pCO2. The extent to which decreased seed produc-
tion under hypoxia could be modified by selection during
long-term hypoxia is currently unknown. Experimental
coverage is limited primarily to clades that radiated during
the Mesozoic (e.g., angiosperms and diatoms), but these
findings suggest that Phanerozoic oxygen levels have been
consistently above the minimum level required for vege-
tative growth. In contrast to findings for animals, experi-
mental results suggest high pO2 and low (i.e., near-modern)
pCO2 during the Carboniferous and Permian periods may
have negatively impacted growth rates in plants.
Comparative biological perspectives on oxygen
and body size
Additional insights into the effect of oxygen on maximum
size in higher taxa arise from comparative studies across
living species. Biological variation across environmental
gradients in the modern world can serve as a useful analog
for the temporal variation in the same parameters. As is the
case for experimental studies, most comparative studies
have focused on animals and a minority on marine protists.
The influence of oxygen availability on the structure of
marine communities has been investigated most thoroughly
in studies of the oceans’ oxygen minimum zones (OMZs)
(Levin 2003; Rhoads and Morse 1971), regions at depths of
a few hundred meters where respiration of sinking organic
matter exceeds oxygen supply through physical mixing.
These zones contain oxygen concentrations below atmo-
spheric equilibrium and are locally completely anoxic.
These studies have often been conducted with an eye
toward reconstructing oxygen gradients using fossil data
(e.g., Rhoads and Morse 1971). Levin (2003) argued that
change in size structure is the most pervasive response of
marine benthic invertebrate communities to the reduced
oxygen availability in the OMZ. Megafauna such as echi-
noids, large gastropods, asteroids, holothurians, and deca-
pods are reported from OMZs down to concentrations less
than 0.25 ml/l (McClain and Barry 2010), but are typically
absent from the most oxygen-starved settings (\0.1 ml/l),
which tend to be dominated by protists and invertebrate
animals of ca. 0.1–1.0 mm.
Extremely low oxygen levels exclude macrofauna in the
oceans, but patterns of size variation with oxygen within
species and higher taxa is more complex. For example,
Gooday et al. (2000) observed smaller mean (but not
maximum) size when comparing foraminiferan communi-
ties from the OMZ and to those from deep water in the
Arabian Sea off of Oman. Perez-Cruz and Machain-
Castillo (1990) observed reduction in average size from the
shelf to the OMZ in the common species Hanzawaia niti-
dula and Bolivina seminuda in the Gulf of Tehuantepec,
Mexico. However, Phleger and Soutar (1973) speculated
that small size may reflect an adaptive strategy to high food
availability rather than low oxygen, a prediction consistent
with life-history modeling by Hallock (1985).
Interestingly, there are also cases of increased size with
lower oxygen (Levin et al. 1994), perhaps due to the
greater food availability in OMZs (Levin 2003). A similar
inverse correlation between the availability of food and
oxygen occurs in many deep sea environments (McClain
et al. 2005, 2006; Rex et al. 2006). There have been few
studies explicitly assessing the relationship between oxy-
gen availability and size that have controlled for the effects
of food availability, the presence of competitor species and
other potential confounders. McClain and Rex (2001) did
find a significant relationship between oxygen concentra-
tions and intra- and inter-specific size even after controlling
for depth (as a proxy for food) in non-OMZ deep sea
systems. Differentiating the effects of food and oxygen on
size is challenging because oxygen and food availability
are rarely decoupled in the modern ocean, as oxygen
minima exist when and where the supply of food exceeds
the supply of oxygen required to respire the organic carbon
aerobically (Levin 2003).
There are few hard data concerning the relationship
between size and oxygen availability for large, photosyn-
thetic marine protists, such as brown algae. A recent study
of kelp suggests that they depend primarily upon high
nutrient levels within the photic zone. Consequently, they
occur where nutrient-enriched (and oxygen-depleted)
waters from below the mixed layer impinge upon hard
substrates within the photic zone (Graham et al. 2007).
Based upon experimental findings for plants and algae,
Photosynth Res (2011) 107:37–57 45
123
giant kelp may if anything benefit from lower oxygen levels
in nutrient-rich deeper waters. These findings are consistent
with evidence that size evolution of diatoms, planktonic
foraminifers, and dinoflagellates through Cenozoic time has
been controlled primarily by nutrient availability in surface
waters (Finkel et al. 2005, 2007; Schmidt et al. 2004).
Size clines also occur over other oxygen gradients.
Chapelle and Peck (1999, 2004; Peck and Chapelle 2003)
have compiled size distributions for amphipod crustaceans
across water bodies varying in salinity, temperature, and
dissolved oxygen concentration. The upper 95th percentile
of size among species is highly correlated with water
oxygen content across a wide range of marine basins and
large lakes (Chapelle and Peck 1999; Peck and Chapelle
2003). As the rate of oxygen uptake depends on partial
pressure (which is constant at sea level) and solubility
(which varies with temperature and salinity), the larger
maximum size of freshwater amphipods relative to marine
environments of similar temperature results from the
greater solubility of oxygen at lower salinity (Peck and
Chapelle 2003). The consistency of the relationship
between maximum size and oxygen concentrations across
both marine and fresh water environments and across ele-
vation strongly supports the hypothesis that oxygen limits
maximum size in amphipods. Chapelle and Peck (2004)
further found that oxygen availability is not only associated
with maximum size; in fact, it is positively associated with
every size quantile, with the slope of the relationship
becoming steeper for the higher size quantiles. The linear
relationship between oxygen concentration and body
length suggests that respiration in these amphipods is aided
by circulation and/or allometric scaling of gill size, rather
than occurring simply via diffusion. Jacobsen et al. (2003)
examined the effects of oxygen availability on the macr-
oinvertebrate fauna of freshwater streams along an eleva-
tion gradient in Ecuador, spanning more than 3 km in
elevation. They found a slightly higher proportion of large-
bodied families in the low-elevation streams, but the dif-
ference in mean size between high- and low-elevation was
not statistically significant. As discussed with respect to the
OMZ, however, there remains the potential that size vari-
ation with elevation is controlled, at least in part, by other
correlates of elevation.
Cross-species comparisons also hold promise for
understanding structural and physiological constraints on
the evolution of body size. The best example of this
approach is a recent study by Kaiser et al. (2007), in which
they characterized the relationship between tracheal vol-
ume and body size in beetles and used this scaling to
estimate the maximum size physiologically possible. They
used synchrotron radiation to image tracheae in situ, find-
ing an allometric scaling exponent of 1.29. Their results
suggest a maximum length for beetles of 32 cm, twice the
observed maximum. However, they note that oxygen enters
the beetle body at the thorax and must pass through local
constrictions to reach the head and limbs of the organism.
Their scaling relationship suggests tracheae would occupy
90% of the leg joint orifice at a length of 16 cm, preventing
any further growth by limiting the space available for
connective tissue and hemolymph. This predicted value is
similar to the size of the largest living beetle (Titanus
giganteus), suggesting it is not the overall scaling of tra-
cheal volume to body volume that limits beetle size, but
rather the scaling of particular anatomical features (Kaiser
et al. 2007). As insects exhibit developmental plasticity
such that tracheal volume is reduced when individuals are
reared under high oxygen conditions (cf. Henry and Har-
rison 2004), increased atmospheric oxygen levels could
permit larger beetles than currently exist. The study by
Kaiser et al. (2007) provides good evidence for a particular
morphological bottleneck that currently serves to limit
maximum size in a diverse group of animals (Lighton
2007). Such bottlenecks may be widespread, but they have
yet to be identified in other clades.
Historical correlation between oxygen and size
The simple fact that both atmospheric oxygen and life’s
maximum size have increased through geological time does
not prove a causal relationship. For example, secular
increase in life’s maximum size could simply reflect
expansion away from a small initial size (Gould 1988, 1996;
McShea 1994; Stanley 1973); indeed, one would expect this
to be the case in the absence of any ecological or environ-
mental selective pressures. Improved documentation of size
trends and of Earth’s atmospheric oxygen history has
recently enabled more detailed examination of the covaria-
tion between body size evolution and changing atmospheric
composition. Many observations in the fossil record appear
to reflect a strong influence of oxygen availability on size
evolution, but considerable complexity remains.
Bonner (1965) was the first to report the sizes of the
largest organisms through the entire geological record,
updating this record in subsequent publications (Bonner
1988, 2006). He illustrated a smooth trend in maximum
size from the Archean to the Recent. Interpretation of the
rate of change implied by his graph is complicated by his
use of a logarithmic time axis, but the smooth trend line
implies that if maximum size was tightly controlled by
oxygen availability, then oxygenation of the atmosphere
must have been gradual. Over time, the pattern of size
evolution implied by Bonner’s illustration came to stand in
contrast to geochemical evidence for stepwise oxygenation
of Earth’s surface environments derived from a wide range
of proxies (Fig. 1).
46 Photosynth Res (2011) 107:37–57
123

Payne et al. (2009) recently revisited the evolution of
size over time, finding a stepwise pattern of increase in
life’s maximum size coinciding approximately with the
inferred steps in atmospheric pO2. The first size step
occurred early in the Proterozoic and the second in the late
Neoproterozoic and early Paleozoic (Fig. 1b). The magni-
tude of the initial size jump may have been smaller than
reported by Payne et al. (2009). Javaux et al. (2010) dis-
covered Paleoarchaean (*3.2 Gya) acritarchs (organic-
walled microfossils of uncertain taxonomic affinity) with
diameters up to 300 lm (Fig. 1b). It remains uncertain
even whether these microfossils derive from prokaryotic or
eukaryotic organisms. Similarly large microfossils are
currently unknown from younger Archaean rocks, but this
finding highlights the extent of current uncertainty in the
size distribution and evolution of early life. Interestingly,
the first major size jump appears to post-date the initial rise
in oxygen (*2.35 Gya) by 350–700 Mya. However, per-
manent oxygenation of the atmosphere may not have
occurred until less than 2.0 Gya (Frei et al. 2009).
The duration of the lag between oxygenation and size
increase is uncertain not only because the timing of per-
manent oxygenation remains uncertain, but also because
taxonomic interpretation of the early fossil record of
eukaryotes remains challenging. Sterane molecules in
2.7 Gya rocks from Western Australia have been inter-
preted as the earliest fossil signature of eukaryotic cells
(Brocks et al. 1999), but more recent work suggests these
molecular fossils may not be indigenous to the sediments
that contain them. Instead, they appear to result from post-
burial contamination by much younger overlying strata
(Rasmussen et al. 2008). The oldest putative eukaryotic
macrofossils occur in the Negaunee Iron Formation of
Michigan (1.9 Gya; Schneider et al. 2002), but these and
other specimens of similar age have been alternatively
interpreted as composite microbial filaments (Samuelsson
and Butterfield 2001). Recently, macrofossils possibly
derived from multicellular eukaryotes were reported
from the 2.1 Gya Francevillian B Formation of Gabon
(Albani et al. 2010). The oldest uncontroversial eukaryotic
macrofossils occur in the 1.6 Gya Vindhyan Supergroup
of India (Kumar 1995), post-dating the earliest evidence
for an increase in atmospheric oxygen by more than
700 Mya—an interval longer than the entire animal fossil
record. In sum, these observations suggest oxygen avail-
ability played a role in triggering the initial evolution of
macroscopic organisms. This scenario must be viewed
cautiously, however, given the large uncertainties in the
timing of size increase and the taxonomic affinities of these
ancient fossils.
The second step in maximum size, during the Ediacaran,
Cambrian, and Ordovician periods (635–445 Mya), began
essentially coincident with the second major oxygenation
event (Fig. 1). Size increase began with the appearance of
the taxonomically problematic Ediacaran organisms and
continued during the Cambrian and Ordovician radiation of
animals. The largest fossils from this interval all appear to
be stem- or crown-group animals, but macroscopic algae
also exhibit a trend toward larger size through Neoprote-
rozoic time (Xiao and Dong 2006). During Cambrian and
Ordovician time, numerous animal phyla independently
achieved size orders of magnitude larger than any pre-
Ediacaran fossils (Payne et al. 2009). Several recent studies
have reported geochemical evidence for increased oxy-
genation of seawater during the latest Neoproterozoic
(Canfield et al. 2007; Fike et al. 2006; Scott et al. 2008),
providing stronger support for an increase in oxygen
availability at this time. Runnegar (1982) used the
approaches of Raff and Raff (1970) and Alexander (1971)
to calculate the minimum ambient oxygen concentrations
required by Dickinsonia, a flat, ovoid, segmented fossil of
Ediacaran age (635–543 Mya). Due to its simple mor-
phology and lack of any obvious gills, Dickinsonia pro-
vides one of the more attractive opportunities to use
organismal size as a constraint on oxygen availability.
Assuming the organism was filled with muscle tissue,
Runnegar calculated that larger individuals (*5 mm thick)
would have had difficulty meeting their metabolic needs if
acquiring oxygen by simple diffusion, even at modern
oxygen levels. If, alternatively, Dickinsonia contained a
circulatory system, then it would have required only about
10% PAL (Runnegar 1982). This value may provide a
minimum estimate of Ediacaran oxygen levels because
Dickinsonia does not appear to have had any respiratory
organ that would have increased its effective surface area.
However, it is possible that Dickinsonia and other Ediac-
aran organisms contained metabolically inert material
surrounded by a thin layer of metabolically active cells,
similar to living cnidarians (Norris 1989). If so, its effec-
tive thickness may have been much less than 1 mm and its
overall thickness may provide little constraint on ambient
oxygen concentrations. Larger Cambrian animals used
respiratory and circulatory systems, making quantification
of the relationship between pO2 and maximum size more
challenging.
The temporal relationship between episodes of oxy-
genation and size increases (Fig. 1) points toward oxygen
as a contributing factor, but the taxonomic distribution of
the pattern indicates that rising oxygen alone was not
sufficient. The first increase in maximum size coincides
with the appearance of fossils that were likely eukaryotes.
Moreover, no prokaryote before or since has reached the
size of early putative eukaryotes such as Grypania and
Chuaria (Fig. 1b). The second increase in maximum size
occurred only among multicellular eukaryotes; no single-
celled eukaryote has achieved the sizes of the largest
Photosynth Res (2011) 107:37–57 47
123
Ediacaran and Cambrian organisms (Fig. 1b). Thus, even if
oxygen concentrations limited organismal sizes for long
stretches of geological time, increases in structural com-
plexity were also required for each stepwise increase in
maximum size. Of course, these structural changes may
also have required increased oxygen availability for other
reasons (e.g., Acquisti et al. 2007)—potentially making
oxygen both a proximate and ultimate control on the evo-
lution of body size. Multicellular forms have evolved
numerous times independently within the eukaryotes. The
earliest multicellular form in the fossil record—a 1.2 Gya
bangiophyte red alga (Butterfield 2000)—predates the
increase in maximum size by 600 Mya. Consequently, the
evolution of decimeter- to meter-scale organisms in mul-
tiple animal clades during Ediacaran and Cambrian time
suggests the removal of an environmental barrier, although
ecological pressures favoring large size (and hard parts) in
predators and prey and the evolution of more genetic reg-
ulatory systems controlling tissue-grade organisms may
also have been important factors (Knoll and Carroll 1999;
Marshall 2006). Similarly, the later appearance of large
vascular plants, during Devonian time (Fig. 1), suggests
that the proximal barrier to large size was not oxygen
availability but, rather, the biochemical and anatomical
modifications associated with the production of wood.
The post-Cambrian fossil record points toward a link
between variation in atmospheric pO2 and the evolution of
body size in taxa as disparate as insects, mammals, and
protists. For example, Carboniferous gigantism in several
animal clades has been attributed to high oxygen concen-
trations. In fact, prior to the geochemical modeling of
Phanerozoic oxygen levels by Berner and colleagues
(Berner 2004, 2006; Berner and Canfield 1989), Rutten
(1966) argued that insect gigantism was the best evidence
for high pO2 during Carboniferous time. Later authors
inverted the argument, using the geochemical model pre-
dictions of high Carboniferous oxygen levels to argue for
oxygen as a contributing cause of gigantism (Berner et al.
2007; Dudley 1998; Graham et al. 1995). Flying insects are
the most widely cited Late Paleozoic giants, particularly
dragonflies (Protodonata) with wingspans reaching 70 cm
(Carpenter 1960; Shear and Kukalova-Peck 1990) and
mayflies reaching 45 cm (Kukalova-Peck 1985), but other
lineages appear to have exhibited gigantism as well, such
as meter-long arthropleurid arthropods (Rolfe and Ingham
1967; Shear and Kukalova-Peck 1990) and marginal mar-
ine eurypterids, which have left tracks up to a meter in
width (Whyte 2005). Gigantism in marine animals may
have been unusually widespread at this time as well;
marine eurypterids also exhibit very large sizes (Braddy
et al. 2008). In addition, Newell’s (1949) examples of
phyletic size increase in his classic paper on Cope’s Rule
draw largely on Late Paleozoic examples: foraminifera,
bryozoans, echinoids, brachiopods, and rugose corals.
Moreover, the sizes of the largest arthropods, mollusks, and
chordates decline from the Carboniferous to the Permian,
dramatically so in the arthropods, the group likely to have
been most sensitive to oxygen concentrations for anatom-
ical reasons (Payne et al. 2009).
Despite widespread awareness of Late Paleozoic
gigantism, there have been few attempts to determine
whether organisms the size of Carboniferous giants would
be prohibited at present-day oxygen levels or whether the
magnitude of temporal variation in maximum size within
the relevant taxa has been of the magnitude predicted by
modeled changes in pO2. Okajima (2008) was the first to
examine the link between insect size and oxygen concen-
tration quantitatively through the Phanerozoic, using newly
compiled data on the sizes of fossil dragonflies. She found
that the variation in maximum size of dragonflies through
time has been much greater than predicted by variation in
atmospheric oxygen concentrations, assuming respiration
via diffusion through tracheae, and assuming that the sizes
of Carboniferous dragonflies represent an oxygen-limited
maximum size. If oxygen limited maximum body size in
the Carboniferous, it has not consistently done so during
other periods. Alternatively, if oxygen is limiting in the
modern, then anatomical or physiological differences must
exist between the Protodonata and Odonata to explain the
inability of the Odonata to achieve similarly large sizes.
The latter interpretation is suggested by the fact that all of
the largest Paleozoic specimens belong to the Protodonata;
Paleozoic members of the Odonata exhibit sizes compa-
rable to the largest in the Mesozoic and Cenozoic. Alter-
natively, the simplifying assumption of oxygen diffusion
through tracheae may be inaccurate; there is emerging
evidence for active tracheal breathing in insects (Socha
et al. 2008; Westneat et al. 2003). Okajima (2008) pro-
posed still another alternative: although variation in oxygen
may have contributed to size evolution, maximum size of
Mesozoic and Cenozoic dragonflies was limited by eco-
logical competition with flying vertebrates. A further pos-
sibility, not examined by Okajima (2008), is that the trend
in maximum size of fossils is poorly correlated with the
true evolutionary pattern. Temporal variation in the quality
of the insect fossil record (Labandiera 2005; Smith and
Cook 2001) makes it difficult to determine the extent to
which variation in maximum size in the fossil record
reflects biological reality versus variation in the quality of
available material. For example, the Carboniferous con-
tains an unusually extensive record of the coastal marsh
environments that may be most likely to house large
insects.
Carboniferous gigantism is the most widely cited link
between oxygen and the evolution of animal size, but
variation in oxygen levels may also have significantly
48 Photosynth Res (2011) 107:37–57
123
influenced gigantism among marine invertebrates during
the Late Ordovican, size reduction during the Permian–
Triassic transition, size increase during the Cenozoic
radiation of mammals, and Cenozoic size variation in deep-
sea benthic foraminifera.
Late Ordovician faunas in tropical carbonate environ-
ments are widely known for exceptionally large inverte-
brates, including the largest ever trilobite (Rudkin et al.
2003), orthocone cephalopod (Teichert and Kummel 1960),
Paleozoic gastropod (Rohr and Blodgett 1992), and con-
spicuously large brachiopods and other marine inverte-
brates (Jin 2001; Nelson 1959). [It should be noted that our
prior documentation of the size of this cephalopod speci-
men (Payne et al. 2009) contained an error, which is cor-
rected in Fig. 1 with biovolume of 8.4 log mm3.] The
causes of widespread gigantism at this time are unclear.
Oxygen levels may have been increasing at this time, but it
has not be reconstructed as an interval of unusually high
pO2 (Berner 2006).
Increased oxygen availability may have facilitated the
radiation of mammals by enabling higher metabolic rates as
well as larger sizes. As indicated in Eqs. 1 and 2 and Fig. 3,
increased oxygen availability enables higher metabolic rate
at any given size. The mass-specific metabolic rates of
birds and mammals are three to six times those of reptiles
(Else and Hulbert 1981). Thus, the Mesozoic evolution of
birds and mammals and the subsequent Eocene diversifica-
tion of large placental mammals may have been facilitated
by a doubling of atmospheric oxygen levels from the
Jurassic to the Recent (Falkowski et al. 2005).
Although oxygen concentrations on land and in the
mixed layer of the surface ocean are largely determined by
bulk atmospheric concentrations, oceanographic factors
can produce substantial marine oxygen gradients in space
and time that are decoupled from atmospheric variations.
Kaiho (1998) examined temporal variation in the maxi-
mum size of trochospiral, deep-sea benthic foraminifera
over the past 120 Mya, using material from several drill-
cores. He found that minima and maxima in the history of
foraminiferan size corresponded to minima and maxima in
the oxygen isotope composition of seawater—a proxy for
paleotemperature. He postulated that this link reflected
climatically driven variation in dissolved oxygen concen-
tration in the deep sea.
Body size reduction within lineages and across higher
taxa is associated with episodes of mass extinction and
ocean anoxia. In the case of the end-Permian mass
extinction—the most severe biotic crisis of the Phanerozoic
(Raup and Sepkoski 1982)—extinction and size reduction
have been attributed, at least in part, to marine anoxia and
rapid reduction in atmospheric oxygen concentrations
(Huey and Ward 2005; Knoll et al. 2007; Retallack et al.
2003; Wignall and Hallam 1992; Wignall and Twitchett
1996). In particular, reduction in maximum size among
marine gastropods as a whole and within some bivalve,
gastropod, and brachiopod lineages has been attributed at
least in part to oxygen stress (Fraiser and Bottjer 2004;
Payne 2005; Twitchett 2007). Reduction in burrow diam-
eters in sedimentary rocks following the end-Triassic mass
extinction has similarly been ascribed to marine anoxia
(Barras and Twitchett 2007; Twitchett and Barras 2004).
Payne (2005) found that although the end-Permian
extinction event did not show obvious evidence of size bias
across the full spectrum of gastropod size, the reduction in
maximum size was too large to be explained by the
reduction in diversity alone. Other studies have not
addressed this issue statistically. Moreover, it remains
unclear whether oxygen stress was more important than
other coeval environmental and ecological factors such as
reduced predation pressure (Payne 2005) or decreased
primary productivity (He et al. 2010).
Discussion
Although oxygen is not strictly necessary for the evolution
of macroscopic life, the high growth efficiency allowed by
aerobic respiration and the coincidence of step-wise
increases in life’s maximum size with increases in atmo-
spheric oxygen concentrations (Fig. 1) strongly suggest
that oxygen availability has in fact limited maximum size
for long intervals of Earth history.
Has variation in Earth’s atmospheric oxygen concen-
tration further influenced size evolution, beyond con-
straining tissue thickness and the geometry of distributary
networks? Despite the wide range of scales at which the
problem has been examined, the answer remains unclear.
Oxygen deprivation should limit size in anatomically
simple organisms and does so in experimental settings even
for anatomically complex bilaterian animals (Table 1). On
the other hand, oxygen availability is inversely correlated
with vegetative growth rate in algae and plants. Thus,
above a threshold value well below modern values,
increased oxygen availability appears to lead to size
increase primarily in aerobic heterotrophs. However, only a
few comparative biological studies provide quantitative
evidence for oxygen as a control on maximum size within
diverse animal clades (Chapelle and Peck 1999, 2004;
Kaiser et al. 2007; McClain and Rex 2001). Evidence from
the fossil record remains largely qualitative, with the few
exceptions enumerated above. Moreover, recent study of
fossil dragonflies suggests that one of the most famous
examples of animal gigantism cannot be explained solely
by variation in oxygen (Okajima 2008).
Differences in taxonomic and temporal scale make it
exceedingly difficult to make quantitative links across
Photosynth Res (2011) 107:37–57 49
123

theory, experimental biology, comparative biology, and
paleobiology. Theoretical predictions are difficult to apply
to living animals because of the wide range of morpho-
logical and physiological mechanisms that animals use to
compensate for variation in oxygen concentration. Conse-
quently, we lack a predictive model for the maximum size
of morphologically complex animals as a function of
oxygen concentration. Laboratory findings that hypoxia has
a much greater influence on size than hyperoxia could be
read to suggest a non-linear relationship between oxygen
and body size with an optimum value for large size near
modern oxygen levels, but are perhaps more likely to
reflect an asymmetric need for developmental plasticity
due to the prevalence of hypoxia but not hyperoxia in
nature. Correlation between oxygen levels and size in field
studies is often complicated by covariation of oxygen with
variables such as temperature or food availability, not to
mention co-occurring species. Modern oxygen gradients
cannot fully mimic the variation in selective pressures
associated with temporal variation in atmospheric pO2 and
provide no analog for historical hyperoxia. Moreover, there
may be hysteresis in the evolutionary response to variation
in oxygen concentration. For example, if size increase is
made possible by an evolutionary novelty that is difficult or
impossible to reverse (e.g., metazoan multicellularity), then
the response to subsequent decrease in oxygen availability
is unlikely to be symmetrical with the initial response to
oxygen increase. Threshold transitions in the allometric
scaling of metabolic rate with size (DeLong et al. 2010;
Mori et al. 2010) may be indicative of such hysteresis or
ratcheting.
In contrast to animals and benthic protists, there is little
evidence that the details of size evolution in vascular plants
and algae can be explained by variation in atmospheric
oxygen levels beyond the constraints lifted when oxygen
first accumulated in the atmosphere and when it first
exceeded a threshold value near 10% PAL. First, vascular
plants achieve large size primarily through the production
of wood, which is not metabolically active. Secondly,
metabolically active cells are maintained near the outer
surface of the plant (e.g., leaves), where they can be sup-
plied with oxygen and carbon dioxide via diffusion through
stomata. Third, the competition between CO2 and O2 for
RUBISCO results in an inhibition of growth by high
O2:CO2, suggesting that higher oxygen levels would, if
anything, increase the cost of growth to large size (Raven
1991). Fourth, maximum height in vascular plants appears
to be limited by hydraulic and possibly mechanical factors,
rather than by metabolic and nutrient demands (Niklas
2007; Ryan and Yoder 1997). These anatomical and
physiological constraints are consistent with biogeographic
data showing that kelp are environmentally constrained by
nutrient availability rather than oxygen concentration
(Graham et al. 2007) and fossil data indicating that the size
evolution of dinoflagellates and diatoms has responded
most strongly to rates of nutrient upwelling into surface
waters rather than to oxygen availability (Finkel et al.
2005, 2007; Schmidt et al. 2004).
The challenges enumerated above are in many ways
inherent to any interdisciplinary problem in the Earth and
life sciences because experimental and field observations
must be extrapolated across vast spatial and temporal
scales, whereas the fossil record often contains little or no
information constraining potentially important variables.
That said, the findings emerging at all scales of investi-
gation into the role of oxygen in size evolution suggest that
more integrated efforts could yield important new insights
using techniques and data already available. Below we
outline what we believe may be the most fruitful lines of
inquiry. This is intended to be a representative list, not an
exhaustive one.
1. Despite decades of speculation, there remains little
systematic analysis of size evolution in the fossil
record with respect to oxygen history. The examples of
Carboniferous gigantism are undoubtedly real—coun-
terexamples would certainly have come forth by now.
However, Okajima’s (2008) recent study represents the
only systematic examination of size data with respect
to oxygen for a clade with a late Paleozoic maximum
in size. Similar analyses for other taxa are critical. It
remains unknown not only whether size variation in
other clades is over- or under-predicted by variation in
atmospheric oxygen but also whether other clades
exhibit gigantism during intervals not characterized by
high pO2. Until such studies are conducted, it will
remain unclear whether the widely cited examples of
Carboniferous and Permian gigantism represent selec-
tion bias or whether gigantism was truly more common
during the time of Earth’s highest oxygen levels. The
fossil record is replete with diverse and well-fossilized
clades; such analyses are well within the scope of the
size data included implicitly or explicitly in the
taxonomic literature.
2. Although prediction of maximum (or optimum) size
from first principles alone is likely impossible in light
of the anatomical and physiological complexity of
animals, several lines of empirical research could
improve our understanding of the role of oxygen in the
evolution of body size. Work on amphipods by
Chapelle and Peck (1999, 2004) highlights several
potential avenues for future research. First, it remains
unknown whether other clades exhibit a similarly
strong relationship between size quantiles and oxygen
availability. Are such relationships common in other
arthropod clades? Among animals more generally?
50 Photosynth Res (2011) 107:37–57
123

Constraints on the prevalence of such relationships, or
lack thereof, would greatly aid our understanding of
the extent to which oxygen availability governs size
distributions in animals. If such relationships are
common in some higher taxa but not others, compar-
ative analyses may shed light on the anatomical,
physiological, or ecological factors that determine the
importance of oxygen in the evolution of size. Such
data could even be applied to analysis of fossil data.
Given an empirically determined relationship between
oxygen availability and maximum size, one could then
assess the extent to which temporal variation in size
matches predictions based on spatial variation among
living species. Over- or under-prediction of size
change relative to past oxygen concentrations could
even shed light on additional factors governing size
evolution. Unfortunately, amphipods likely have too
poor a fossil record for such an exercise, but other
diverse higher taxa with good fossil records may
present opportunities. Bivalves, gastropods, and
ostracods are likely among the best candidates.
3. The observed scaling of the entire size distribution
with oxygen availability in amphipods further high-
lights a shortcoming of previous theoretical work on
the size-oxygen relationship: all theoretical work has
focused on oxygen as a factor limiting maximum size.
Size distributions among species within higher taxa are
widely thought to be determined by energetic consid-
erations and mortality schedules (Brown et al. 1993;
Hallock 1985; Sebens 2002). As oxygen availability
can affect both efficiency and rate of growth (Ower-
kowicz et al. 2009), variation in oxygen availability
should affect selection across the size spectrum, not
simply at the maximum. For example, time-dependent
risk of death due to predation or disease tends to select
against large size because of the time required to grow
larger prior to reproduction. An increase in growth
efficiency due to increased oxygen availability could
allow an organism to achieve larger size without the
trade-off of waiting longer prior to reproduction.
Figure 4 illustrates a schematic example of how an
effect of oxygen on the efficiency of energy intake as a
function of body mass could affect fitness across the
size spectrum. Higher oxygen concentrations also
come with a cost of increased oxidative damage.
Any complete assessment of the precise effects of
variation in oxygen levels on the evolution of body
size would take these into account as well. However,
the ability of many animals to grow normally under
experimental conditions of extremely high pO2 (e.g.,
Herman and Ingermann 1996; Metcalfe et al. 1981;
Stock et al. 1983) suggests that the stress of oxidative
damage is comparatively minor, at least over
experimental timescales. Of course, any change in
oxygen availability will occur for all organisms within
an ecosystem. Consequently, factors allowing for size
increase at higher oxygen levels may be offset by
ecological interactions with other similarly affected
organisms, either through increased competition for
resources or through increased predation pressure on
prey species. On the other hand, the strong circum-
stantial evidence for oxygen as an important control on
size evolution in the fossil record suggests its effects
are expressed despite the many additional ecological
factors influencing size evolution.
4. Systematic experimentation across taxa differing in
anatomy and physiology can help to clarify which
anatomical and physiological characteristics are most
likely to lead to a relationship between oxygen and
body size. Extrapolation of experimental findings to
evolutionary timescales is difficult because experi-
mental systems cannot capture the effects of ecological
selection pressures on body size or phenotypic vari-
ability introduced by new mutations. However, they
can provide additional insight through comparative
A
B
Intake -high oxygen Intake - lowoxygen
Cost
high oxygen
low oxygen
Body Masslow high
Ene
rgy
Sur
plus
Ene
rgy
optim
um
optim
um
max
imum
max
imum
min
imum0
+
-
0
+
Fig. 4 Schematic illustration of how variation in atmospheric oxygen
concentrations could affect energetically determined minimum, opti-
mum, and maximum sizes. In this case, cost is assumed to be a linear
function of mass, whereas intake is assumed to scale allometrically
with mass with a scaling exponent less than one. Optimum size is
assumed to occur where energy surplus is maximized. The range of
viable sizes is assumed to span those sizes where an energy surplus
occurs. Assuming a proportional increase in intake under high oxygen
causes an increase in both optimum and maximum size. Such a pattern
is consistent with the observations of Chapelle and Peck (2004) for
amphipods. Varying cost as a function of oxygen concentration rather
than intake yields qualitatively similar results. a Energy intake and
energy cost as a function of body mass. b Energy surplus as a function
of mass
Photosynth Res (2011) 107:37–57 51
123

analysis among taxa. Experiments on taxa for which
relevant field observations also exist, such as the
amphipods, could even be used to test the extent to
which size responses in the laboratory can be extrap-
olated. Such comparisons could potentially help to
calibrate an empirical relationship between ecopheno-
typic and evolutionary response to variation in oxygen
availability.
5. Experimental work suggests that the relationship
between oxygen availability and size evolution is
much more complex for oxygenic photoautotrophs
than for aerobic heterotrophs and that high O2:CO2
negatively impacts growth at modern pO2. However,
there are few fossil data sets and no experimental data
for the clades of vascular plants that were most diverse
and abundant through the majority of Phanerozoic
time. Basic observations are still required to better
understand the interactions between O2, CO2, and plant
anatomy in governing the evolution of maximum size.
6. Experiments suggest that size reduction may be more
easily achieved during oxygen decrease than size
increase during oxygen increase. As there is likely
stronger selective pressure on taxa for ecophenotypic
responses to oxygen deprivation than to oxygen
surplus, simply because oxygen deprivation occurs
more commonly in nature, it is possible that most taxa
can respond more quickly to reduction in oxygen
availability over evolutionary time. Of course, the
response times for size increase and decrease may be
shorter than the temporal resolution of the fossil record
or the rate of change in pO2, but such a potential
asymmetry in evolutionary pattern may warrant a
careful search for appropriate study organisms. More-
over, hysteresis in the evolutionary response may
extend beyond asymmetry in phenotypic plasticity to
size thresholds requiring the gain or loss of a key
innovation such as a respiratory organ or circulatory
system. Parasites may provide interesting test cases
because many lineages are much larger than their free-
living relatives (A. Curis, pers. comm. 2010) and
parasites occur in unique microenvironments where O2
availability may differ substantially from the surround-
ing environment.
Conclusions
Eons and eras are demarcated on the basis of evolutionary
events. Among these, the Archean-Proterozoic (2.5 Gya),
Proterozoic-Phanerozoic (543 Mya), and Paleozoic–
Mesozoic (252 Mya) transitions have long been recognized
as among the most significant, in part on account of the
major changes in maximum body size occurring during or
after these events. The evidence we have now points to
change in atmospheric oxygen as a major cause of these
size changes. This possibility has been appreciated for at
least half a century, but quantitative support has grown
rapidly in recent years and now derives from a wide
spectrum of disciplines, including physical chemistry,
geochemistry, cell and developmental biology, physiology,
ecology, and paleontology. The case is still somewhat
uncertain, of course; and other factors were doubtless
involved.
Future work in experimental and comparative biology
holds the potential to provide better quantitative models of
the potential influence of oxygen on size evolution. When
applied to the fossil record, these models may shed light on
the extent to which size evolution in different clades and at
different times can be ascribed to the influence of variation
in atmospheric oxygen levels versus other environmental
and ecological factors.
Acknowledgments This review is a product of the working group on
body size evolution (principal investigators JLP, JAS, and MK) funded
by the National Evolutionary Synthesis Center (NESCent), National
Science Foundation Grant EF-0423641. P. Falkowski, P. Harnik,
J. Skotheim, and N. Sleep provided comments that greatly improved
the manuscript. We thank G.X. Rothdrake for correcting the body size
estimate of the Ordovician cephalopod.
References
Acquisti C, Kleffe J, Collins S (2007) Oxygen content of transmem-
brane proteins over macroevolutionary time scales. Nature
445:47–52
Albani AE, Bengtson S, Canfield DE, Bekker A, Macchiarelli R,
Mazurier A, Hammarlund EU, Boulvais P, Dupuy J-J, Fontaine C,
Fursich FT, Gauthier-Lafaye F, Janvier P, Javaux E, Ossa FO,
Pierson-Wickmann A-C, Riboulleau A, Sardini P, Vachard D,
Whitehouse M, Meunier A (2010) Large colonial organisms with
coordinated growth in oxygenated environments 2.1 Gyr ago.
Nature 466:100–104
Alexander RM (1971) Size and shape. Edward Arnold, London
Allwood AC, Walter MR, Kamber BS, Marshall CP, Burch IW
(2006) Stromatolite reef from the Early Archaean era of
Australia. Nature 441:714–718
Andrews RM (2002) Low oxygen: a constraint on the evolution of
viviparity in reptiles. Physiol Biochem Zool 75:145–154
Barghoorn ES, Tyler SA (1963) Fossil organisms from Precambrian
sediments. Ann N Y Acad Sci 108:451–452
Barghoorn ES, Tyler SA (1965) Microorganisms from Gunflint
Chert—these structurally preserved Precambrian fossils from
Ontario are most ancient organisms known. Science 147:563–
575
Barras CG, Twitchett RJ (2007) Response of the marine infauna to
Triassic-Jurassic environmental change: ichnological data from
southern England. Palaeogeogr Palaeoclimatol Palaeoecol
244:223–241
Belcher CM, McElwain JC (2008) Limits for combustion in low O2
redefine paleoatmospheric predictions for the Mesozoic. Science
321:1197–1200
52 Photosynth Res (2011) 107:37–57
123

Bergman NM, Lenton TM, Watson AJ (2004) COPSE: a new model
of biogeochemical cycling over Phanerozoic time. Am J Sci
304:397–437
Berkner LV, Marshall LC (1965) History of major atmospheric
components. Proc Natl Acad Sci USA 53:1215–1226
Berner RA (2004) The Phanerozoic carbon cycle: CO2 and O2.
Oxford University Press, New York
Berner RA (2006) GEOCARBSULF: a combined model for Phan-
erozoic atmospheric O2 and CO2. Geochim Cosmochim Acta
70:5653–5664
Berner RA, Canfield DE (1989) A new model for atmospheric oxygen
over Phanerozoic time. Am J Sci 289:333–361
Berner RA, Beerling DJ, Dudley R, Robinson JM, Wildman RA
(2003) Phanerozoic atmospheric oxygen. Annu Rev Earth Planet
Sci 31:105–134
Berner RA, VandenBrooks JM, Ward PD (2007) Oxygen and
evolution. Science 316:557–558
Bjorkman O, Hiesey WM, Nobs MA, Nicholson F, Hart RW (1968)
Effect of oxygen concentration in higher plants. Carnegie Inst
Wash Year B 66:228–232
Bjorkman O, Gauhl E, Hiesey WM, Nicholson F, Nobs MA (1969)
Growth of Mimulus, Marchantia, and Zea under different
oxygen and carbon dioxide levels. Carnegie Inst Wash Year B
67:477–478
Blankenship RE, Sadekar S, Raymond J (2007) The evolutionary
transition from anoxygenic to oxygenic photosynthesis. In:
Falkowski PG, Knoll AH (eds) Evolution of primary producers
in the sea. Academic Press, Amsterdam, pp 21–35
Bonner JT (1965) Size and cycle. Princeton University Press,
Princeton, NJ
Bonner JT (1988) The evolution of complexity by means of natural
selection. Princeton University Press, Princeton, NJ
Bonner JT (2006) Why size matters: from bacteria to blue whales.
Princeton University Press, Princeton, NJ
Braddy SJ, Poschmann M, Tetlie OE (2008) Giant claw reveals the
largest ever arthropod. Biol Lett 4:106–109
Brocks JJ, Logan GA, Buick R, Summons RE (1999) Archean
molecular fossils and the early rise of eukaryotes. Science
285:1033–1036
Brown JH (1995) Macroecology. University of Chicago Press,
Chicago
Brown JH, Marquet PA, Taper ML (1993) Evolution of body-size—
consequences of an energetic definition of fitness. Am Nat
142:573–584
Brown JH, Gillooly JF, Allen AP, Savage VM, West GB (2004)
Toward a metabolic theory of ecology. Ecology 85:1771–1789
Brown JH, West GB, Enquist BJ (2005) Yes, West, Brown and
Enquist’s model of allometric scaling is both mathematically
correct and biologically relevant. Funct Ecol 19:735–738
Brusca RC, Brusca GJ (2003) Invertebrates. Sinauer Associates,
Sunderland, MA
Busk M, Overgaard J, Hicks JW, Bennett AF, Wang T (2000) Effects
of feeding on arterial blood gases in the American alligator
Alligator mississippiensis. J Exp Biol 203:3117–3124
Butterfield NJ (2000) Bangiomorpha pubescens n. gen., n.sp.:
implications for the evolution of sex, multicellularity, and the
Mesoproterozoic/Neoproterozoic radiation of eukaryotes. Paleo-
biology 26:386–404
Calder WA (1984) Size, function, and life history. Harvard University
Press, Cambridge, MA
Canfield DE (2005) The early history of atmospheric oxygen: homage
to Robert M. Garrels. Annu Rev Earth Planet Sci 33:1–36
Canfield DE, Poulton SW, Narbonne GM (2007) Late-Neoproterozoic
deep-ocean oxygenation and the rise of animal life. Science
315:92–95
Carpenter FM (1960) Studies on Carboniferous insects. 1. The
Protodonata. Psyche 67:98–110
Catling DC, Glein CR, Zahnle KJ, McKay CP (2005) Why O2 is
required by complex life on habitable planets and the concept of
planetary ‘‘oxygenation time’’. Astrobiology 5:415–438
Chan T, Burggren W (2005) Hypoxic incubation creates differential
morphological effects during specific developmental critical
windows in the embryo of the chicken (Gallus gallus). Respir
Physiol Neurobiol 145:251–263
Chapelle G, Peck LS (1999) Polar gigantism dictated by oxygen
availability. Nature 399:114–115
Chapelle G, Peck LS (2004) Amphipod crustacean size spectra: new
insights in the relationship between size and oxygen. Oikos
106:167–175
Cloud PE (1965) Significance of the Gunflint (Precambrian) micro-
flora. Science 148:27–35
Cloud PE (1968) Pre-metazoan evolution and the origins of the
Metazoa. In: Drake ET (ed) Evolution and environment. Yale
University Press, New Haven, pp 1–72
Cloud PE (1972) A working model of the primitive Earth. Am J Sci
272:537–548
Crossley DA II, Altimiras J (2005) Cardiovascular development in
embryos of the American alligator Alligator mississippiensis:
effects of chronic and acute hypoxia. J Exp Biol 208:31–39
Cunningham EL, Brody JS, Jain BP (1974) Lung growth induced by
hypoxia. J Appl Physiol 37:362–366
Dabrowski K, Lee K-J, Guz L, Verlhac V, Gabaudan J (2004) Effects
of dietary ascorbic acid on oxygen stress (hypoxia or hyperoxia),
growth and tissue vitamin concentrations in juvenile rainbow
trout (Oncorhynchus mykiss). Aquaculture 233:383–392
Darveau CA, Suarez RK, Andrews RD, Hochachka PW (2002)
Allometric cascade as a unifying principle of body mass effects
on metabolism. Nature 417:166–170
DeLong JP, Okie JG, Moses ME, Sibly RM, Brown JH (2010) Shifts
in metabolic scaling, production, and efficiency across major
evolutionary transitions of life. Proc Natl Acad Sci USA 107.
doi: 10.1073/iti2510107
Dodds PS, Rothman DH, Weitz JS (2001) Re-examination of the ‘‘3/
4-law’’ of metabolism. J Theor Biol 209:9–27
Dudley R (1998) Atmospheric oxygen, giant Paleozoic insects and the
evolution of aerial locomotor performance. J Exp Biol 201:
1043–1050
Dutta A, Popel AS (1995) A theoretical analysis of intracellular
oxygen diffusion. J Theor Biol 176:433–445
Dzialowski EM, von Plettenberg D, Elmonoufy NA, Burggren WW
(2002) Chronic hypoxia alters the physiological and morpho-
logical trajectories of developing chicken embryos. Comp
Biochem Physiol A 131:713–724
Else PL, Hulbert AJ (1981) Comparison of the ‘‘mammal machine’’
and the ‘‘reptile machine’’: energy production. Am J Physiol
240:3–9
Falkowski PG, Katz ME, Milligan AJ, Fennel K, Cramer BS, Aubry
MP, Berner RA, Novacek MJ, Zapol WM (2005) The rise of
oxygen over the past 205 million years and the evolution of large
placental mammals. Science 309:2202–2204
Fan C, Iacobas DA, Zhou D, Chen Q, Lai JK, Gavrialov O, Haddad
GG (2005) Gene expression and phenotypic characterization of
mouse heart after chronic constant or intermittent hypoxia.
Physiol Genomics 22:292–307
Fehling J, Stoecker D, Baldauf SL (2007) Photosynthesis and the
eukaryote tree of life. In: Falkowski PG, Knoll AH (eds)
Evolution of primary producers in the sea. Academic Press,
Amsterdam, pp 75–107
Fike DA, Grotzinger JP, Pratt LM, Summons RE (2006) Oxidation of
the Ediacaran ocean. Nature 444:744–747
Photosynth Res (2011) 107:37–57 53
123

Finkel ZV, Katz ME, Wright JD, Schofield OME, Falkowski PG
(2005) Climatically driven macroevolutionary patterns in the
size of marine diatoms of the Cenozoic. Proc Natl Acad Sci USA
102:8927–8932
Finkel ZV, Sebbo J, Feist-Burkhardt S, Irwin AJ, Katz ME, Schofield
OEM, Young JR, Falkowski PG (2007) A universal driver of
macroevolutionary change in the size of marine phytoplankton
over the Cenozoic. Proc Natl Acad Sci USA 104:20416–20420
Foss A, Vollen T, Øiestad V (2003) Growth and oxygen consumption
in normal and O2 supersaturated water, and interactive effects of
O2 saturation and ammonia on growth in spotted wolffish
(Anarhichas minor Olafsen). Aquaculture 224:105–116
Fraiser ML, Bottjer DJ (2004) The non-actualistic Early Triassic
gastropod fauna: a case study of the Lower Triassic Sinbad
Limestone member. Palaios 19:259–275
Fralick P, Davis DW, Kissin SA (2002) The age of the Gunflint
Formation, Ontario, Canada: single zircon U–Pb age determina-
tions from reworked volcanic ash. Can J Earth Sci 39:1085–1091
Frappell PB, Mortola JP (1994) Hamsters vs. rats: metabolic and
ventilatory response to development in chronic hypoxia. J Appl
Physiol 77:2748–2752
Frazier MR, Woods HA, Harrison JF (2001) Interactive effects of
rearing temperature and oxygen on the development of Dro-sophila melanogaster. Physiol Biochem Zool 74:641–650
Frei R, Gaucher C, Poulton SW, Canfield DE (2009) Fluctuations in
Precambrian atmospheric oxygenation recorded by chromium
isotopes. Nature 461:250–253
Frisancho AR, Baker PT (1970) Altitude and growth: a study of the
patterns of physical growth of a high altitude Peruvian Quechua
population. Am J Phys Anthropol 32:279–292
Gilbert DL (1960) Speculation on the relationship between organic
and atmospheric evolution. Perspect Biol Med 4:58–71
Gilbert DL (1996) Evolutionary aspects of atmospheric oxygen and
organisms. In: Fregly MJ, Blatteis CM (eds) Environmental
physiology. Oxford University Press, New York, pp 1059–1094
Gillooly JF, Brown JH, West GB, Savage VM, Charnov EL (2001a)
Effects of size and temperature on metabolic rate. Science
293:2248–2251
Gillooly JF, Charnov EL, West GB, Savage VM, Brown JH (2001b)
Effects of size and temperature on developmental time. Nature
417:70–73
Giussani DA, Salinas CE, Villena M, Blanco CE (2007) The role of
oxygen in prenatal growth: studies in the chicken embryo.
J Physiol 585:911–917
Gooday AJ, Bernhard JM, Levin LA, Suhr SB (2000) Foraminifera in
the Arabian Sea oxygen minimum zone and other oxygen-
deficient settings: taxonomic composition, diversity, and relation
to metazoan faunas. Deep-Sea Res II 47:25–54
Gould SJ (1988) Trends as changes in variance—a new slant on
progress and directionality in evolution. J Paleontol 62:319–329
Gould SJ (1996) Full house: the spread of excellence from Plato to
Darwin. Harmony Books, New York
Graham JB, Aguilar NM, Dudley R, Gans C (1995) Implications of
the late Paleozoic oxygen pulse for physiology and evolution.
Nature 375:117–120
Graham MH, Kinlan BP, Druehl LD, Garske LE, Banks S (2007)
Deep-water kelp refugia as potential hotspots of tropical marine
diversity and productivity. Proc Natl Acad Sci USA 104:
16576–16580
Greenberg S, Ar A (1996) Effects of chronic hypoxia, normoxia and
hyperoxia on larval development in the beetle Tenebrio molitor.
J Insect Physiol 42:991–996
Greenlee KJ, Harrison JF (2004) Development of respiratory function
in the American locust Schistocerca americana I. Across-instar
effects. J Exp Biol 207:497–508
Greenlee KJ, Harrison JF (2005) Respiratory changes throughout
ontogeny in the tobacco hornworm caterpillar, Manduca sexta.
J Exp Biol 208:1385–1392
Greenlee KJ, Nebeker C, Harrison JF (2007) Body size-independent
safety margins for gas exchange across grasshopper species.
J Exp Biol 210:1288–1296
Guo SS, Tang YK, Gao F, Ai WD, Qin LF (2008) Effects of low
pressure and hypoxia on growth and development of wheat. Acta
Astronaut 63:1081–1085
Hallam A, Wignall PB (1997) Mass extinctions and their aftermaths.
Oxford University Press, New York
Hallock P (1985) Why are larger Foraminifera large? Paleobiology
11:195–208
Harrison JF (2010) Atmospheric oxygen level and the evolution of
insect body size. Proc R Soc Lond B 277:1937–1946
Harrison J, Frazier MR, Henry JR, Kaiser A, Klok CJ, Rascon B
(2006) Responses of terrestrial insects to hypoxia or hyperoxia.
Respir Physiol Neurobiol 154:4–17
He C, Davies FT, Lacey RE (2007) Separating the effects of
hypobaria and hypoxia on lettuce: growth and gas exchange.
Physiol Plant 131:226–240
He W-H, Twitchett RJ, Zhang Y, Shi GR, Feng Q-L, Yu J-X, Wu S-B,
Peng X-F (2010) Controls on body size during the Late Permian
mass extinction event. Geobiology. doi: 10.1111/j.1472-4669.
2010.00248.x
Henry JR, Harrison JF (2004) Plastic and evolved responses of larval
tracheae and mass to varying atmospheric oxygen content in
Drosophila melanogaster. J Exp Biol 207:3559–3567
Herman J, Ingermann R (1996) Effects of hypoxia and hyperoxia on
oxygen-transfer properties of the blood of a viviparous snake.
J Exp Biol 199:2061–2070
Holland HD (2006) The oxygenation of the atmosphere and oceans.
Philos Trans R Soc Lond B 361:903–915
Holland HD (2009) Why the atmosphere became oxygenated: a
proposal. Geochim Cosmochim Acta 73:5241–5255
Hsia CCW, Carbayo JJP, Yan X, Bellotto DJ (2005) Enhanced
alveolar growth and remodeling in Guinea pigs raised at high
altitude. Respir Physiol Neurobiol 147:105–115
Huey RB, Ward PD (2005) Hypoxia, global warming, and terrestrial
Late Permian extinctions. Science 308:398–401
Jacobsen D, Rostgaard S, Vasconez JJ (2003) Are macroinvertebrates
in high altitude streams affected by oxygen deficiency? Freshw
Biol 48:2025–2032
Javaux EJ, Marshall CP, Bekker A (2010) Organic-walled microfos-
sils in 3.2-billion-year-old shallow-marine siliciclastic deposits.
Nature 463:934–938
Jin J (2001) Evolution and extinction of the North American
Hiscobeccus brachiopod Fauna during the Late Ordovician.
Can J Earth Sci 38:143–151
Johnson MD, Volker J, Moeller HV, Laws E, Breslauer KJ,
Falkowski PG (2009) Universal constant for heat production in
protists. Proc Natl Acad Sci USA 106:6696–6699
Julian CG, Vargas E, Armaza JF, Wilson MJ, Niermeyer S, Moore
LG (2007) High-altitude ancestry protects against hypoxia-
associated reductions in fetal growth. Arch Dis Child 92:F372–
F377
Kaiho K (1998) Global climatic forcing of deep-sea benthic
foraminiferal test size during the past 120 m.y. Geology
26:491–494
Kaiser A, Klok CJ, Socha JJ, Lee W-K, Quinlan MC, Harrison JF
(2007) Increase in tracheal investment with beetle size supports
hypothesis of oxygen limitation on insect gigantism. Proc Natl
Acad Sci USA 104:13198–13203
Kam Y-C (1993) Physiological effects of hypoxia on metabolism and
growth of turtle embryos. Respir Physiol 92:127–138
54 Photosynth Res (2011) 107:37–57
123
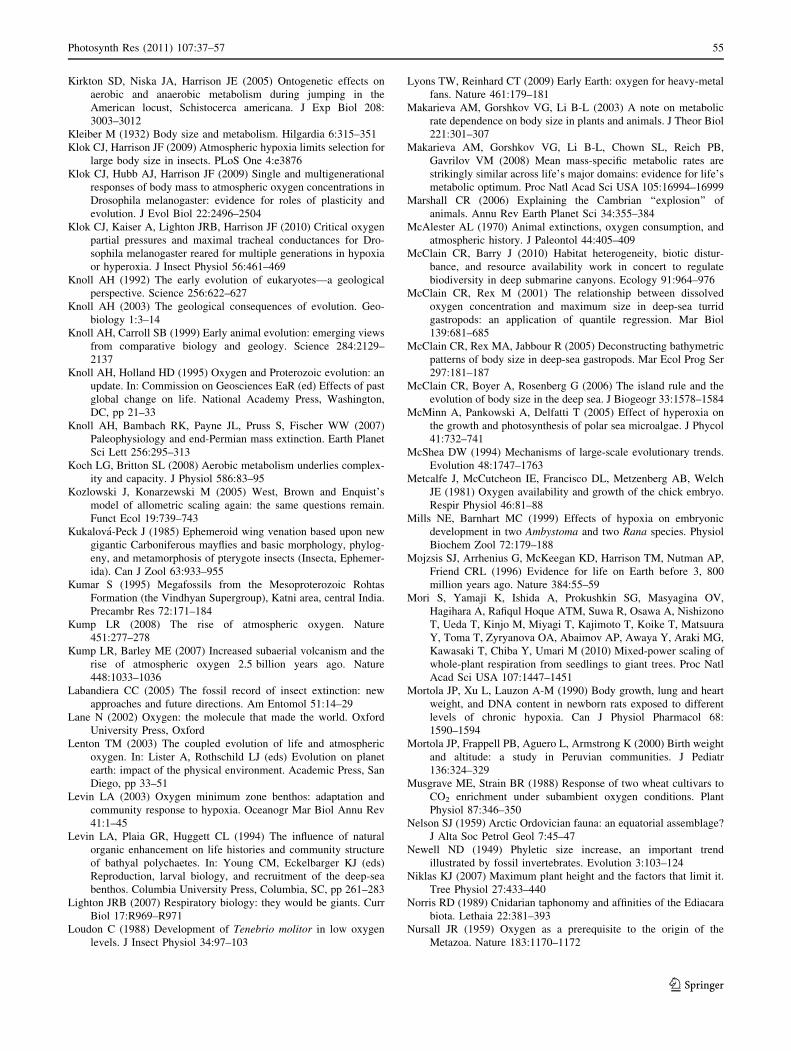
Kirkton SD, Niska JA, Harrison JE (2005) Ontogenetic effects on
aerobic and anaerobic metabolism during jumping in the
American locust, Schistocerca americana. J Exp Biol 208:
3003–3012
Kleiber M (1932) Body size and metabolism. Hilgardia 6:315–351
Klok CJ, Harrison JF (2009) Atmospheric hypoxia limits selection for
large body size in insects. PLoS One 4:e3876
Klok CJ, Hubb AJ, Harrison JF (2009) Single and multigenerational
responses of body mass to atmospheric oxygen concentrations in
Drosophila melanogaster: evidence for roles of plasticity and
evolution. J Evol Biol 22:2496–2504
Klok CJ, Kaiser A, Lighton JRB, Harrison JF (2010) Critical oxygen
partial pressures and maximal tracheal conductances for Dro-
sophila melanogaster reared for multiple generations in hypoxia
or hyperoxia. J Insect Physiol 56:461–469
Knoll AH (1992) The early evolution of eukaryotes—a geological
perspective. Science 256:622–627
Knoll AH (2003) The geological consequences of evolution. Geo-
biology 1:3–14
Knoll AH, Carroll SB (1999) Early animal evolution: emerging views
from comparative biology and geology. Science 284:2129–
2137
Knoll AH, Holland HD (1995) Oxygen and Proterozoic evolution: an
update. In: Commission on Geosciences EaR (ed) Effects of past
global change on life. National Academy Press, Washington,
DC, pp 21–33
Knoll AH, Bambach RK, Payne JL, Pruss S, Fischer WW (2007)
Paleophysiology and end-Permian mass extinction. Earth Planet
Sci Lett 256:295–313
Koch LG, Britton SL (2008) Aerobic metabolism underlies complex-
ity and capacity. J Physiol 586:83–95
Kozlowski J, Konarzewski M (2005) West, Brown and Enquist’s
model of allometric scaling again: the same questions remain.
Funct Ecol 19:739–743
Kukalova-Peck J (1985) Ephemeroid wing venation based upon new
gigantic Carboniferous mayflies and basic morphology, phylog-
eny, and metamorphosis of pterygote insects (Insecta, Ephemer-
ida). Can J Zool 63:933–955
Kumar S (1995) Megafossils from the Mesoproterozoic Rohtas
Formation (the Vindhyan Supergroup), Katni area, central India.
Precambr Res 72:171–184
Kump LR (2008) The rise of atmospheric oxygen. Nature
451:277–278
Kump LR, Barley ME (2007) Increased subaerial volcanism and the
rise of atmospheric oxygen 2.5 billion years ago. Nature
448:1033–1036
Labandiera CC (2005) The fossil record of insect extinction: new
approaches and future directions. Am Entomol 51:14–29
Lane N (2002) Oxygen: the molecule that made the world. Oxford
University Press, Oxford
Lenton TM (2003) The coupled evolution of life and atmospheric
oxygen. In: Lister A, Rothschild LJ (eds) Evolution on planet
earth: impact of the physical environment. Academic Press, San
Diego, pp 33–51
Levin LA (2003) Oxygen minimum zone benthos: adaptation and
community response to hypoxia. Oceanogr Mar Biol Annu Rev
41:1–45
Levin LA, Plaia GR, Huggett CL (1994) The influence of natural
organic enhancement on life histories and community structure
of bathyal polychaetes. In: Young CM, Eckelbarger KJ (eds)
Reproduction, larval biology, and recruitment of the deep-sea
benthos. Columbia University Press, Columbia, SC, pp 261–283
Lighton JRB (2007) Respiratory biology: they would be giants. Curr
Biol 17:R969–R971
Loudon C (1988) Development of Tenebrio molitor in low oxygen
levels. J Insect Physiol 34:97–103
Lyons TW, Reinhard CT (2009) Early Earth: oxygen for heavy-metal
fans. Nature 461:179–181
Makarieva AM, Gorshkov VG, Li B-L (2003) A note on metabolic
rate dependence on body size in plants and animals. J Theor Biol
221:301–307
Makarieva AM, Gorshkov VG, Li B-L, Chown SL, Reich PB,
Gavrilov VM (2008) Mean mass-specific metabolic rates are
strikingly similar across life’s major domains: evidence for life’s
metabolic optimum. Proc Natl Acad Sci USA 105:16994–16999
Marshall CR (2006) Explaining the Cambrian ‘‘explosion’’ of
animals. Annu Rev Earth Planet Sci 34:355–384
McAlester AL (1970) Animal extinctions, oxygen consumption, and
atmospheric history. J Paleontol 44:405–409
McClain CR, Barry J (2010) Habitat heterogeneity, biotic distur-
bance, and resource availability work in concert to regulate
biodiversity in deep submarine canyons. Ecology 91:964–976
McClain CR, Rex M (2001) The relationship between dissolved
oxygen concentration and maximum size in deep-sea turrid
gastropods: an application of quantile regression. Mar Biol
139:681–685
McClain CR, Rex MA, Jabbour R (2005) Deconstructing bathymetric
patterns of body size in deep-sea gastropods. Mar Ecol Prog Ser
297:181–187
McClain CR, Boyer A, Rosenberg G (2006) The island rule and the
evolution of body size in the deep sea. J Biogeogr 33:1578–1584
McMinn A, Pankowski A, Delfatti T (2005) Effect of hyperoxia on
the growth and photosynthesis of polar sea microalgae. J Phycol
41:732–741
McShea DW (1994) Mechanisms of large-scale evolutionary trends.
Evolution 48:1747–1763
Metcalfe J, McCutcheon IE, Francisco DL, Metzenberg AB, Welch
JE (1981) Oxygen availability and growth of the chick embryo.
Respir Physiol 46:81–88
Mills NE, Barnhart MC (1999) Effects of hypoxia on embryonic
development in two Ambystoma and two Rana species. Physiol
Biochem Zool 72:179–188
Mojzsis SJ, Arrhenius G, McKeegan KD, Harrison TM, Nutman AP,
Friend CRL (1996) Evidence for life on Earth before 3, 800
million years ago. Nature 384:55–59
Mori S, Yamaji K, Ishida A, Prokushkin SG, Masyagina OV,
Hagihara A, Rafiqul Hoque ATM, Suwa R, Osawa A, Nishizono
T, Ueda T, Kinjo M, Miyagi T, Kajimoto T, Koike T, Matsuura
Y, Toma T, Zyryanova OA, Abaimov AP, Awaya Y, Araki MG,
Kawasaki T, Chiba Y, Umari M (2010) Mixed-power scaling of
whole-plant respiration from seedlings to giant trees. Proc Natl
Acad Sci USA 107:1447–1451
Mortola JP, Xu L, Lauzon A-M (1990) Body growth, lung and heart
weight, and DNA content in newborn rats exposed to different
levels of chronic hypoxia. Can J Physiol Pharmacol 68:
1590–1594
Mortola JP, Frappell PB, Aguero L, Armstrong K (2000) Birth weight
and altitude: a study in Peruvian communities. J Pediatr
136:324–329
Musgrave ME, Strain BR (1988) Response of two wheat cultivars to
CO2 enrichment under subambient oxygen conditions. Plant
Physiol 87:346–350
Nelson SJ (1959) Arctic Ordovician fauna: an equatorial assemblage?
J Alta Soc Petrol Geol 7:45–47
Newell ND (1949) Phyletic size increase, an important trend
illustrated by fossil invertebrates. Evolution 3:103–124
Niklas KJ (2007) Maximum plant height and the factors that limit it.
Tree Physiol 27:433–440
Norris RD (1989) Cnidarian taphonomy and affinities of the Ediacara
biota. Lethaia 22:381–393
Nursall JR (1959) Oxygen as a prerequisite to the origin of the
Metazoa. Nature 183:1170–1172
Photosynth Res (2011) 107:37–57 55
123
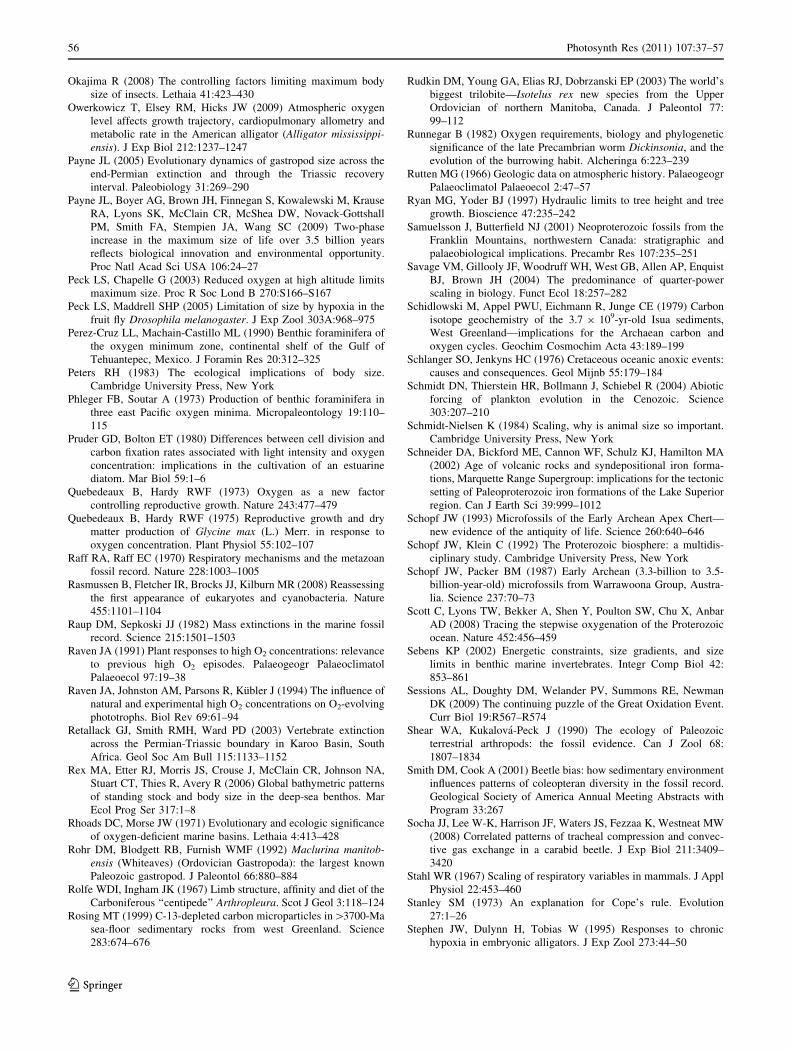
Okajima R (2008) The controlling factors limiting maximum body
size of insects. Lethaia 41:423–430
Owerkowicz T, Elsey RM, Hicks JW (2009) Atmospheric oxygen
level affects growth trajectory, cardiopulmonary allometry and
metabolic rate in the American alligator (Alligator mississippi-ensis). J Exp Biol 212:1237–1247
Payne JL (2005) Evolutionary dynamics of gastropod size across the
end-Permian extinction and through the Triassic recovery
interval. Paleobiology 31:269–290
Payne JL, Boyer AG, Brown JH, Finnegan S, Kowalewski M, Krause
RA, Lyons SK, McClain CR, McShea DW, Novack-Gottshall
PM, Smith FA, Stempien JA, Wang SC (2009) Two-phase
increase in the maximum size of life over 3.5 billion years
reflects biological innovation and environmental opportunity.
Proc Natl Acad Sci USA 106:24–27
Peck LS, Chapelle G (2003) Reduced oxygen at high altitude limits
maximum size. Proc R Soc Lond B 270:S166–S167
Peck LS, Maddrell SHP (2005) Limitation of size by hypoxia in the
fruit fly Drosophila melanogaster. J Exp Zool 303A:968–975
Perez-Cruz LL, Machain-Castillo ML (1990) Benthic foraminifera of
the oxygen minimum zone, continental shelf of the Gulf of
Tehuantepec, Mexico. J Foramin Res 20:312–325
Peters RH (1983) The ecological implications of body size.
Cambridge University Press, New York
Phleger FB, Soutar A (1973) Production of benthic foraminifera in
three east Pacific oxygen minima. Micropaleontology 19:110–
115
Pruder GD, Bolton ET (1980) Differences between cell division and
carbon fixation rates associated with light intensity and oxygen
concentration: implications in the cultivation of an estuarine
diatom. Mar Biol 59:1–6
Quebedeaux B, Hardy RWF (1973) Oxygen as a new factor
controlling reproductive growth. Nature 243:477–479
Quebedeaux B, Hardy RWF (1975) Reproductive growth and dry
matter production of Glycine max (L.) Merr. in response to
oxygen concentration. Plant Physiol 55:102–107
Raff RA, Raff EC (1970) Respiratory mechanisms and the metazoan
fossil record. Nature 228:1003–1005
Rasmussen B, Fletcher IR, Brocks JJ, Kilburn MR (2008) Reassessing
the first appearance of eukaryotes and cyanobacteria. Nature
455:1101–1104
Raup DM, Sepkoski JJ (1982) Mass extinctions in the marine fossil
record. Science 215:1501–1503
Raven JA (1991) Plant responses to high O2 concentrations: relevance
to previous high O2 episodes. Palaeogeogr Palaeoclimatol
Palaeoecol 97:19–38
Raven JA, Johnston AM, Parsons R, Kubler J (1994) The influence of
natural and experimental high O2 concentrations on O2-evolving
phototrophs. Biol Rev 69:61–94
Retallack GJ, Smith RMH, Ward PD (2003) Vertebrate extinction
across the Permian-Triassic boundary in Karoo Basin, South
Africa. Geol Soc Am Bull 115:1133–1152
Rex MA, Etter RJ, Morris JS, Crouse J, McClain CR, Johnson NA,
Stuart CT, Thies R, Avery R (2006) Global bathymetric patterns
of standing stock and body size in the deep-sea benthos. Mar
Ecol Prog Ser 317:1–8
Rhoads DC, Morse JW (1971) Evolutionary and ecologic significance
of oxygen-deficient marine basins. Lethaia 4:413–428
Rohr DM, Blodgett RB, Furnish WMF (1992) Maclurina manitob-ensis (Whiteaves) (Ordovician Gastropoda): the largest known
Paleozoic gastropod. J Paleontol 66:880–884
Rolfe WDI, Ingham JK (1967) Limb structure, affinity and diet of the
Carboniferous ‘‘centipede’’ Arthropleura. Scot J Geol 3:118–124
Rosing MT (1999) C-13-depleted carbon microparticles in[3700-Ma
sea-floor sedimentary rocks from west Greenland. Science
283:674–676
Rudkin DM, Young GA, Elias RJ, Dobrzanski EP (2003) The world’s
biggest trilobite—Isotelus rex new species from the Upper
Ordovician of northern Manitoba, Canada. J Paleontol 77:
99–112
Runnegar B (1982) Oxygen requirements, biology and phylogenetic
significance of the late Precambrian worm Dickinsonia, and the
evolution of the burrowing habit. Alcheringa 6:223–239
Rutten MG (1966) Geologic data on atmospheric history. Palaeogeogr
Palaeoclimatol Palaeoecol 2:47–57
Ryan MG, Yoder BJ (1997) Hydraulic limits to tree height and tree
growth. Bioscience 47:235–242
Samuelsson J, Butterfield NJ (2001) Neoproterozoic fossils from the
Franklin Mountains, northwestern Canada: stratigraphic and
palaeobiological implications. Precambr Res 107:235–251
Savage VM, Gillooly JF, Woodruff WH, West GB, Allen AP, Enquist
BJ, Brown JH (2004) The predominance of quarter-power
scaling in biology. Funct Ecol 18:257–282
Schidlowski M, Appel PWU, Eichmann R, Junge CE (1979) Carbon
isotope geochemistry of the 3.7 9 109-yr-old Isua sediments,
West Greenland—implications for the Archaean carbon and
oxygen cycles. Geochim Cosmochim Acta 43:189–199
Schlanger SO, Jenkyns HC (1976) Cretaceous oceanic anoxic events:
causes and consequences. Geol Mijnb 55:179–184
Schmidt DN, Thierstein HR, Bollmann J, Schiebel R (2004) Abiotic
forcing of plankton evolution in the Cenozoic. Science
303:207–210
Schmidt-Nielsen K (1984) Scaling, why is animal size so important.
Cambridge University Press, New York
Schneider DA, Bickford ME, Cannon WF, Schulz KJ, Hamilton MA
(2002) Age of volcanic rocks and syndepositional iron forma-
tions, Marquette Range Supergroup: implications for the tectonic
setting of Paleoproterozoic iron formations of the Lake Superior
region. Can J Earth Sci 39:999–1012
Schopf JW (1993) Microfossils of the Early Archean Apex Chert—
new evidence of the antiquity of life. Science 260:640–646
Schopf JW, Klein C (1992) The Proterozoic biosphere: a multidis-
ciplinary study. Cambridge University Press, New York
Schopf JW, Packer BM (1987) Early Archean (3.3-billion to 3.5-
billion-year-old) microfossils from Warrawoona Group, Austra-
lia. Science 237:70–73
Scott C, Lyons TW, Bekker A, Shen Y, Poulton SW, Chu X, Anbar
AD (2008) Tracing the stepwise oxygenation of the Proterozoic
ocean. Nature 452:456–459
Sebens KP (2002) Energetic constraints, size gradients, and size
limits in benthic marine invertebrates. Integr Comp Biol 42:
853–861
Sessions AL, Doughty DM, Welander PV, Summons RE, Newman
DK (2009) The continuing puzzle of the Great Oxidation Event.
Curr Biol 19:R567–R574
Shear WA, Kukalova-Peck J (1990) The ecology of Paleozoic
terrestrial arthropods: the fossil evidence. Can J Zool 68:
1807–1834
Smith DM, Cook A (2001) Beetle bias: how sedimentary environment
influences patterns of coleopteran diversity in the fossil record.
Geological Society of America Annual Meeting Abstracts with
Program 33:267
Socha JJ, Lee W-K, Harrison JF, Waters JS, Fezzaa K, Westneat MW
(2008) Correlated patterns of tracheal compression and convec-
tive gas exchange in a carabid beetle. J Exp Biol 211:3409–
3420
Stahl WR (1967) Scaling of respiratory variables in mammals. J Appl
Physiol 22:453–460
Stanley SM (1973) An explanation for Cope’s rule. Evolution
27:1–26
Stephen JW, Dulynn H, Tobias W (1995) Responses to chronic
hypoxia in embryonic alligators. J Exp Zool 273:44–50
56 Photosynth Res (2011) 107:37–57
123

Stock MK, Francisco DL, Metcalfe J (1983) Organ growth in chick
embryos incubated in 40% or 70% oxygen. Respir Physiol
52:1–11
Sundt-Hansen L, Sundstrom LF, Einum S, Hindar K, Fleming IA,
Devlin RH (2007) Genetically enhanced growth causes increased
mortality in hypoxic environments. Biol Lett 3:165–168
Tappan H (1974) Molecular oxygen and evolution. In: Hayaishi O
(ed) Molecular oxygen in biology. Elsevier, Amsterdam,
pp 81–135
Teichert C, Kummel B (1960) Size of endoceroid cephalolopods.
Breviora 128:1–7
Thannickal VJ (2009) Oxygen in the evolution of complex life and
the price we pay. Am J Respir Cell Mol Biol 40:507–510
Tice MM, Lowe DR (2004) Photosynthetic microbial mats in the 3,
416-Myr-old ocean. Nature 431:549–552
Tintu AN, le Noble FAC, Rouwet EV (2007) Hypoxia disturbs fetal
hemodynamics and growth. Endothelium 14:353–360
Torzillo G, Bernardini P, Masojıdek J (1998) On-line monitoring of
chlorophyll fluorescence to assess the extent of photoinhibition
of photosynthesis induced by high oxygen concentration and low
temperature and its effect on the productivity of outdoor cultures
of Spirulina plantensis (Cyanobacteria). J Phycol 34:504–510
Twitchett RJ (2007) The Lilliput effect in the aftermath of the end-
Permian extinction event. Palaeogeogr Palaeoclimatol Palaeo-
ecol 252:132–144
Twitchett RJ, Barras CG (2004) Trace fossils in the aftermath of mass
extinction events. Geol Soc Lond 228:397–418
Tyler SA, Barghoorn ES (1954) Occurrence of structurally preserved
plants in pre-cambrian rocks of the Canadian Shield. Science
119:606–608
Wangensteen OD, Rahn H, Burton RR, Smith AH (1974) Respiratory
gas exchange of high altitude adapted chick embryos. Respir
Physiol 21:61–70
West GB, Brown JH, Enquist BJ (1997) A general model for the
origin of allometric scaling laws in biology. Science 276:
122–126
Westneat MW, Betz O, Blob RW, Fezzaa K, Cooper WJ, Lee W-K
(2003) Tracheal respiration in insects visualized with synchro-
tron X-ray imaging. Science 299:558–560
Whyte MA (2005) Palaeoecology: a gigantic fossil arthropod
trackway. Nature 438:576–577
Wignall PB, Hallam A (1992) Anoxia as a cause of the Permian
Triassic mass extinction: facies evidence from northern Italy and
the western United-States. Palaeogeogr Palaeoclimatol Palaeo-
ecol 93:21–46
Wignall PB, Twitchett RJ (1996) Oceanic anoxia and the end Permian
mass extinction. Science 272:1155–1158
Williams JB, Swift K (1988) Oxygen consumption and growth of
Northern Bobwhite embryos under normoxic and hyperoxic
conditions. The Condor 90:187–192
Woods HA, Moran AL, Arango CP, Mullen L, Shields C (2009)
Oxygen hypothesis of polar gigantism not supported by perfor-
mance of Antarctic pycnogonids in hypoxia. Proc R Soc Lond B
276:1069–1075
Xiao S, Dong L (2006) On the morphological and ecological history of
Proterozoic macroalgae. In: Xiao S, Kaufman AJ (eds) Neopro-
terozoic geobiology and paleobiology. Springer, Dordrecht,
pp 57–90
Zamudio S, Postigo L, Illsley NP, Rodriguez C, Heredia G,
Brimacombe M, Echalar L, Torricos T, Tellez W, Moldonado
I, Balanza E, Alvarez T, Ameller J, Vargas E (2007) Maternal
oxygen delivery is not related to altitude- and ancestry-associ-
ated differences in human fetal growth. J Physiol 582:883–895
Photosynth Res (2011) 107:37–57 57
123