Embed Size (px)
Citation preview
C E N T E R O N J A P A N E S E E C O N O M Y A N D B U S I N E S S
Working Paper Series May 2009, No. 282
The Fed’s Response to the Financial Crisis:Pages from the BOJ Playbook, or a WholeNew Ball Game?
Kenneth N. Kuttner
This paper is available online at www.gsb.columbia.edu/cjeb/research/ac
C O L U M B I A U N I V E R S I T Y I N T H E C I T Y O F N E W Y O R K

The Fed’s response to the financial crisis:
Pages from the BOJ playbook,
or a whole new ball game?
Kenneth N. Kuttner∗
June 4, 2009
Abstract
Like the Bank of Japan (BOJ) a decade ago, the U.S. Federal Reserve (Fed) hasrecently taken a number of unprecedented steps to stabilize its foundering financialsystem. This paper describes the Fed’s and the BOJ’s responses to their countries’crises, highlighting the similarities and differences between the two banks’ policies.Both banks acted as lenders of last resort, providing the short-term funding necessaryto prevent full-blown liquidity crises. Circumstances compelled the Fed to act muchmore quickly than the BOJ, however. And, in its direct involvement in the provisionof credit to the private sector and its assumption of banks’ credit risk, the Fed hasintervened in the financial markets more extensively than the BOJ. Disparities in thespeed and scope of the two countries’ crises help explain the Fed’s relatively more ag-gressive response. The more heavily securitized financial structure in the U.S. and theFed’s relaxed stance on credit risk also may account for the Fed’s more interventionistpolicies.
JEL codes: E42, E58, E65.
∗Williams College Economics Department, Schapiro Hall 312, 24 Hopkins Hall Drive, Williamstown,MA, 01267, USA. [email protected]. Prepared for the March 24 2009 InternationalConference on the U.S. Economy, organized by the Policy Research Institute, Ministry of Finance, Japan. Iam grateful to Shigenori Shiratsuka for his help in obtaining historical BOJ balance sheet data, and to ToshikiJinushi, Takatoshi Ito, and the conference participants for their helpful comments.

1 Introduction
As the U.S. economy struggled to emerge from recession in the first years of the decade,
slow economic growth, falling inflation, and near-zero interest rates came together to cre-
ate a worrying macroeconomic scenario. It seemed at the time as if the U.S. might suffer
the same fate as Japan, and sink into a protracted slump in which the zero lower bound
on the interest rate would limit the scope for monetary policy. Deflation was a real pos-
sibility, and unconventional policy measures were on the table. Policymakers at the U.S.
Federal Reserve (the Fed) contemplated such actions as the targeting long-term interest
rates, purchases of privately-issued assets, and explicit commitments to a path for the fed-
eral funds rate. Concerns dissipated as the U.S. economy recovered in 2004, however, and
the unconventional policy measures under consideration turned out to be unnecessary.
Scarcely five and a half years after the 2003 deflation scare, U.S. policymakers now
face a much deeper economic crisis. The deeper financial dimension of the current crisis
makes comparisons with the Japanese experience of the 1990s more relevant than in 2003.
Not only has the Fed reached the limit of conventional monetary policy, it has been com-
pelled to prop up the foundering financial system through massive injections of liquidity
and extensive new lending programs. Its balance sheet has more than doubled in size since
mid-2008, and its composition has changed almost beyond recognition. At the same time,
the Fed has extended funds in highly unconventional ways, to institutions not normally
falling under the Fed’s aegis.
Extraordinary as these measures are, they are not entirely without precedent. During
Japan’s lengthy banking crisis of the 1990s and early 2000s, the Bank of Japan (BOJ)
also injected an unheard-of volume of liquidity into the financial system, and expanded its
lending facilities. While these appear in retrospect to be quite modest relative to the Fed’s
actions—and to what some had urged the BOJ to do—they were at the time quite novel for
modern central banks.
Like the BOJ in the 1990s, circumstances have compelled the Fed to function as the
lender of last resort (LOLR) for the financial system. This is a core function of any cen-
1

tral bank, and there is a long history of liquidity provision during banking panics. The
reasoning is that lending to sound institutions facing a temporary shortage of funds would
ameliorate bank “runs” precipitated by a deterioration in confidence. This view of the
LOLR was articulated by Bagehot (1873), who advised central banks to lend freely, but at
a penalty rate, against good collateral. In the 19th century, the Bank of England on several
occasions deviated from Bagehot’s advice, lending against a diverse range of assets that
included mortgages, railway debentures, and even unimproved land. During the postwar
era, however, the central banks of industrial countries, including the Fed, have been quite
conservative in their exercise of the LOLR option.
There are two reasons why central banks have historically been loath to lend directly to
private entities. The first stems from a reluctance to interfere with the markets’ allocation
of credit and risk. If not priced correctly, central banks’ asset purchases, loans, and loan
guarantees represent subsidies to specific institutions. In the present crisis, and to a lesser
extent in Japan’s, these interventions have made a difference in terms of which institutions
survive (e.g., A.I.G.) and which fail (Lehman). The second reason is the fear of loan losses,
and their consequences for inflation and independence.
Much has already been written on the BOJ’s monetary policy response to the economic
contraction that began in the early 1990s. These include Jinushi et al. (2000), Taylor (2001),
Ahearne et al. (2002), Okina & Shiratsuka (2002), McCallum (2003), Kuttner & Posen
(2004), Harrigan & Kuttner (2005), to cite a few. All of these focus exclusively or primarily
on interest rate policy, however. Less has been written specifically about the BOJ’s actions
as LOLR, although Kuttner & Posen (2004), in critiquing the application of the Taylor
rule to the Japanese experience, observed that the BOJ’s various LOLR functions were not
readily incorporated within Taylor’s framework.
With the U.S. now dealing with financial stress comparable to Japan’s, there is much
to be learned from a comparison of the two countries’ experiences. This paper’s goal is to
examine the episodes’ similarities and differences, while recognizing that the crisis in the
U.S. is far from over. Its specific focus is on the steps taken by the Fed and the BOJ in their
respective efforts to restore financial system stability. The paper’s comparative approach is
2

similar to that of Harrigan & Kuttner (2005), who contrasted Japan’s situation in the 1990s
with that of the U.S. in the early 2000s after the bursting of the tech bubble. That paper’s
conclusion was that the U.S. was in very little danger of becoming mired in an extended
recession, a conclusion that seemed justified by the relative soundness of the U.S. financial
system. With many of the nation’s largest financial institutions facing a distinct possibility
of insolvency, such a such a sanguine conclusion would reflect wishful thinking. But on
the positive side, the Fed’s reaction has been faster, and broader in its thrust, than the BOJ’s
policies of a decade ago.
It is still too early to tell to gauge the efficacy of the Fed’s efforts. Arguably the most
important question learned from the Japanese experience is that the liquidity and credit
extended by the central bank in a crisis situation are at best stop-gap measures: the disposal
and workout of non-performing loans is essential to recovery. In Japan, seven years passed
between the initial wave of bank failures in 1995 and the resolution of the bad loan problem
under the Takenaka Plan of 2002. It remains to be seen whether the U.S. will act with any
greater alacrity.
2 A short history of the crises
I will begin with a brief review of the financial crises’ inception and progression in Japan
and the U.S. While there are some differences, the parallels between the two countries’
experiences are striking.
2.1 Japan, 1995 to 2002
The basic outlines of the Japanese experience are familiar. Its distinguishing feature was a
dizzying asset price escalation, followed by the collapse depicted in figure 1. Stock prices
hit their peak and began a steep descent in 1989. Property prices remained strong for
another two years, only beginning their slide in 1991 with the start of the recession. The
BOJ responded with a series of interest rate cuts which, while rapid, failed to prevent a
3

sharp economic slowdown. Whether the BOJ acted with sufficient alacrity has been a topic
of considerable debate, but as this paper’s focus is on financial policy, there is no need to
revisit that debate here.
Interestingly, the Japanese financial system did not experience significant financial
stress until several years after the beginning of the macroeconomic downturn. Burdened
with trillions of yen in worthless real estate loans, the dire conditions of the jusen became
increasingly apparent in 1995, and plans to bail out those institutions began to be formu-
lated later that year. Two prominent events during this initial phase of the crisis were the
closure of Kizu Credit Association, and the rescue of Cosmo Credit and Hyogo Bank in
August 1995. It was only at this point, five years into the downturn, that the BOJ was forced
to intervene in the financial markets, and exercise its authority as lender of last resort. The
BOJ responded to banks’ deteriorating conditions with a series of ad hoc credit extensions,
under Article 25 under the old BOJ law, and the provision of temporary funding to the De-
posit Insurance Corporation (DIC). A selected chronology of the events in Japan is given
in table 1.
An acute condition turned critical with the November 1997 closure of Yamaichi Secu-
rities, and the collapse of Hokkaido Takushoku Bank. While not a core part of the Japanese
financial system, Hokkaido Takushoku’s failure in particular was regarded as a major shift
in Japanese policymakers’ response to financial distress.1 The decision to allow the bank
to fail marked an end to the government’s goso-sendan-hoshiki (“convoy”) policy in which
troubled banks were kept alive through mergers with relatively stronger institutions. The
market response was dramatic, with the so-called “Japan premium” spiking to nearly 70
basis points. At the same time, the share of borrowers in the Tankan survey reporting
tighter credit conditions swung 30 percentage points, from −15 to 15 percent. These two
developments are depicted in figure 2.
The next significant milestone was the passage of bank rescue legislation in October
1998. Half of the bill’s $500 billion appropriation provided funds for recapitalizing dis-
1The second-tier brokerage firm Sanyo Securities also filed for bankruptcy in early November, resultingin the first default in the unsecured call loan market.
4

tressed banks. The remaining $250 billion financed a blanket guarantee of bank deposits,
and provided for the possible nationalization of failing institutions. The bill was the largest
bailout effort up to that point, although there some skepticism that it would be enough to
solve the long-term problems facing Japan’s largest banks. The bill did, however, make
possible the government takeover of failing banks: just days after the bill’s passage, Long-
Term Credit Bank was nationalized, followed by Nippon Credit in December of the same
year. In spite of these failures, the Japan premium fell sharply following the introduction
of blanket deposit insurance.
The BOJ took a number of incremental steps to regularize its provision of liquidity in
the months following the bank rescue bill. In November 1998, the BOJ announced an ex-
pansion of its short-term lending against commercial paper collateral, and its intention to
establish a lending facility specifically designed to “support firms’ financing activities.” It
also announced plans to study change in operating procedure, in which funds would be lent
against pooled collateral, ultimately backed by corporate bonds and loans on deeds. It an-
nounced in September 1999 an expansion in the range of collateral to includes such things
as bank debentures and corporate bonds. Those guidelines were subsequently modified,
and generally relaxed, in a series of steps over the next several years. The BOJ continued
to cut interest rate target during this period, with the call rate reaching zero in March 1999.
Based on the perception that economic conditions were improving, the Policy Board
raised the target all rate to 25 basis points in August 2000.2 The nascent recovery stalled,
however, and in February, the Policy Board cut the call rate target to 0.15 percent. In March
2001, the Policy Board initiated its quantitative easing policy by making banks’ current ac-
count balances (CABs) the BOJ’s operating objective, effectively driving the call rate to
zero and further increasing banks’ access to liquidity. The Bank at the same time estab-
lished a Lombard-type lending facility in an effort to stabilize interest rates. In addition,
the Bank pledged to leave the quantitative easing policy in place so long as CPI inflation
remained negative. The Bank’s target level of CABs was lifted in a number of steps be-
2See, “Monthly Report of Recent Economic and Financial Developments, August 2000, The Bank’sView,” and “Change of the Guideline for Money Market Operations, August 11.”
5
ginning in February 2002, eventually reaching 30 to 35 trillion yen by early 2004. The
additional liquidity was provided through a combination of increased short-term collater-
alized loans, along with outright purchases of Japanese government bonds (JGBs), which
more than tripled to 1.2 trillion yen per month by October 2002.
The BOJ followed its introduction of quantitative easing with two new programs that
represent its two most conspicuous departures from conventional LOLR operations. The
first was its October 2002 announcement of a policy of outright equity purchases. Eight
months later, the BOJ announced plans for outright purchases of asset-backed securities
(ABS). The Bank began its equity purchases in December 2002, and its ABS purchases in
August 2003.
The unwinding of these various credit and monetary measures began in 2005, as defla-
tion receded and the economy began to show signs of a more sustained recovery. In that
year, the Deposit Insurance Corporation lifted the blanket guarantee of bank deposits, and
the BOJ suspended it ABS purchases. The quantitative easing policy came to an end the
spring of 2006, and CABs fell rapidly from its January 2006 peak of 33.6 trillion to 7.5
trillion as of November 2007.
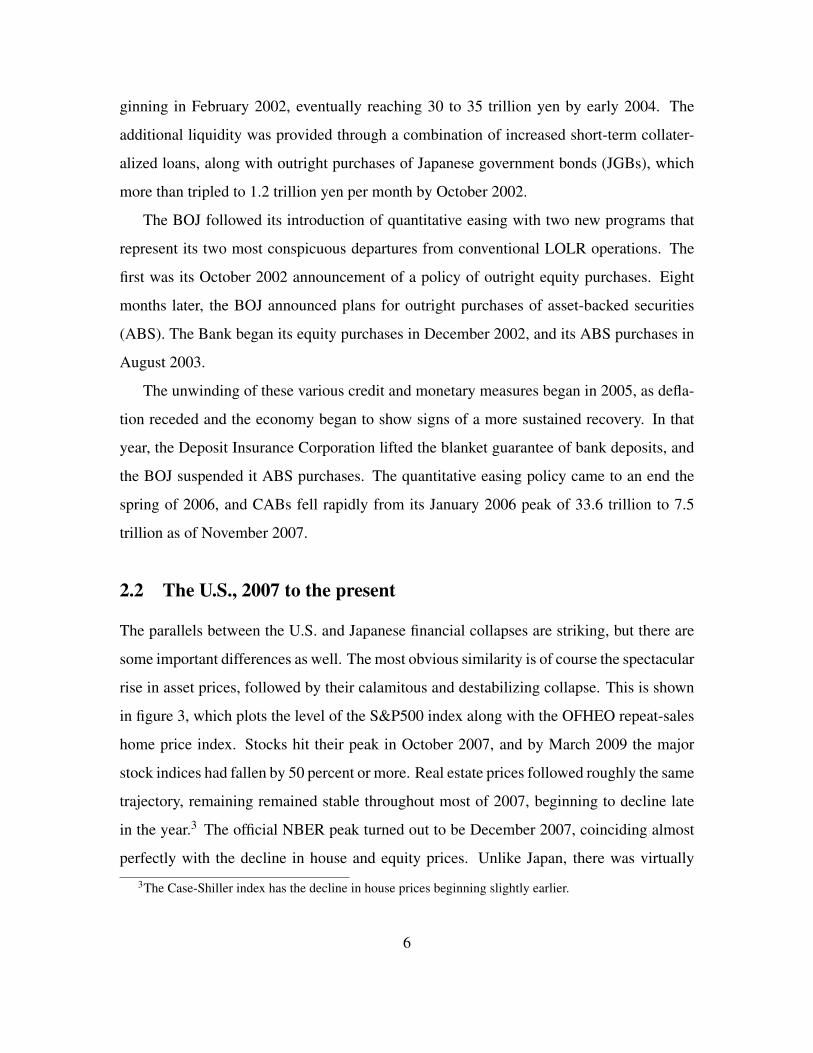
2.2 The U.S., 2007 to the present
The parallels between the U.S. and Japanese financial collapses are striking, but there are
some important differences as well. The most obvious similarity is of course the spectacular
rise in asset prices, followed by their calamitous and destabilizing collapse. This is shown
in figure 3, which plots the level of the S&P500 index along with the OFHEO repeat-sales
home price index. Stocks hit their peak in October 2007, and by March 2009 the major
stock indices had fallen by 50 percent or more. Real estate prices followed roughly the same
trajectory, remaining remained stable throughout most of 2007, beginning to decline late
in the year.3 The official NBER peak turned out to be December 2007, coinciding almost
perfectly with the decline in house and equity prices. Unlike Japan, there was virtually
3The Case-Shiller index has the decline in house prices beginning slightly earlier.
6

no lag between the financial markets’ collapse and the deterioration in macroeconomic
conditions.
Troubles in the mortgage-backed securities market began to surface during the summer
of 2007, and in June Bear Stearns was compelled to rescue two of its troubled hedge funds.
As stress mounted in the money market, the Fed made took its first modest steps towards en-
hancing its LOLR capabilities, introducing in August 2007 a term discount window lending
facility to supplement it existing short-term facility. In December, it established the Term
Auction Facility (TAF). A chronology of selected events and key Fed policies appears in
table 2.4
The first major blow to the financial system was the collapse of Bear Stearns, occuring
in March 2008, only three months after the official start of the recession. This also marked
the Fed’s first major credit market interventions, and one of its more controversial: the
purchase of $30 billion of the distressed assets of the failed investment bank Bear Stearns,
prior to that company’s sale to JP Morgan. Technically, the assets were purchased by a
Fed-financed special-purpose vehicle (SPV), named Maiden Lane after the street running
behind the New York Fed’s building in lower Manhattan. In response to the Bear failure, the
Fed established two new facilities for providing liquidity to money markets. The first, the
Term Securities Lending Facility (TSLF), expanded an existing securities lending program
to accept privately-issued securities as collateral, and extended the duration of the loans. Its
second, more far-reaching step was to establish a lending facility, the PDCF, for primary
dealers in Treasury securities, which would not otherwise have had direct access to Fed
liquidity. Its significance is its unprecedented extension of credit to non-banks.
The summer of 2008 was relatively uneventful, but the FDIC’s July seizure of the failed
thrift IndyMac foreshadowed the deep problems lurking in the mortgage and mortage-
backed securities markets.
The critical turning point was the September 2008 failure of Lehman Brothers, which
neither the Fed nor the Treasury took decisive steps to avert. That Lehman was allowed
4A more extensive chronology of the U.S. crisis is maintained by the St. Louis Fed, http://timeline.stlouisfed.org/.
7
to fail was widely interpreted as a signal that the rules of the game had changed, and that
there were limits to what the Fed and the Treasury were willing to do to support troubled
institutions. In this regard, Lehman’s failure is analogous to the 1997 demise of Hokkaido
Takushoku.
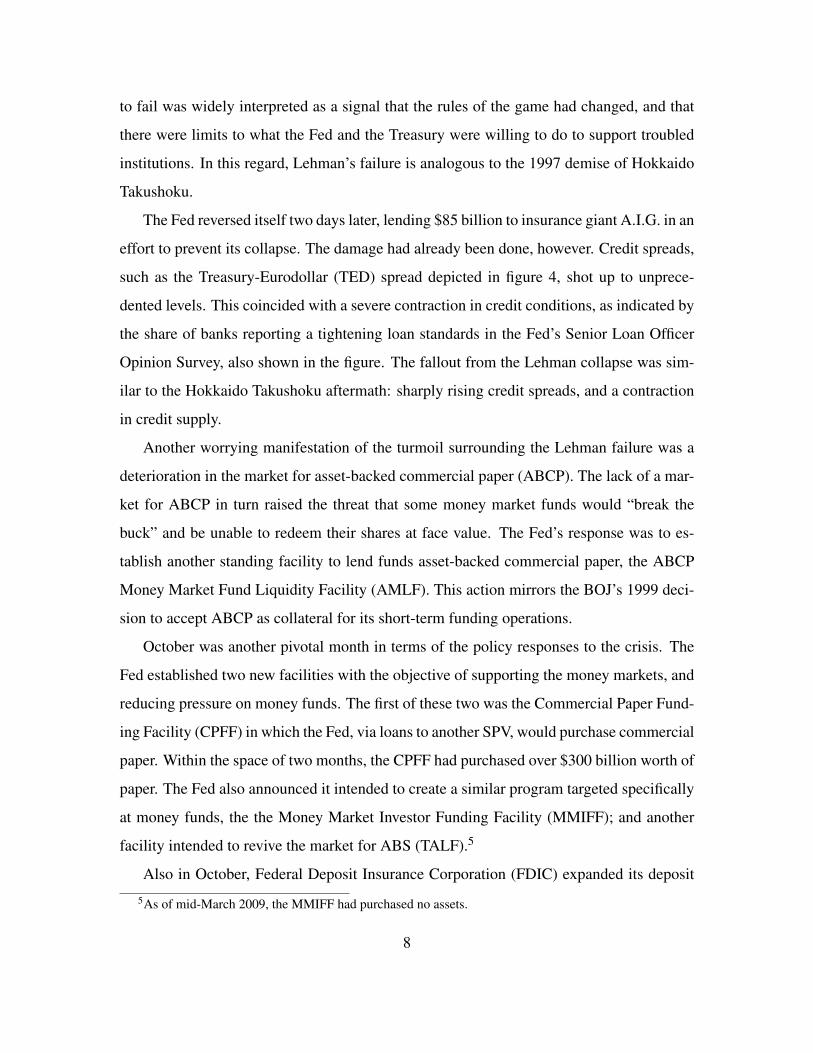
The Fed reversed itself two days later, lending $85 billion to insurance giant A.I.G. in an
effort to prevent its collapse. The damage had already been done, however. Credit spreads,
such as the Treasury-Eurodollar (TED) spread depicted in figure 4, shot up to unprece-
dented levels. This coincided with a severe contraction in credit conditions, as indicated by
the share of banks reporting a tightening loan standards in the Fed’s Senior Loan Officer
Opinion Survey, also shown in the figure. The fallout from the Lehman collapse was sim-
ilar to the Hokkaido Takushoku aftermath: sharply rising credit spreads, and a contraction
in credit supply.
Another worrying manifestation of the turmoil surrounding the Lehman failure was a
deterioration in the market for asset-backed commercial paper (ABCP). The lack of a mar-
ket for ABCP in turn raised the threat that some money market funds would “break the
buck” and be unable to redeem their shares at face value. The Fed’s response was to es-
tablish another standing facility to lend funds asset-backed commercial paper, the ABCP
Money Market Fund Liquidity Facility (AMLF). This action mirrors the BOJ’s 1999 deci-
sion to accept ABCP as collateral for its short-term funding operations.
October was another pivotal month in terms of the policy responses to the crisis. The
Fed established two new facilities with the objective of supporting the money markets, and
reducing pressure on money funds. The first of these two was the Commercial Paper Fund-
ing Facility (CPFF) in which the Fed, via loans to another SPV, would purchase commercial
paper. Within the space of two months, the CPFF had purchased over $300 billion worth of
paper. The Fed also announced it intended to create a similar program targeted specifically
at money funds, the the Money Market Investor Funding Facility (MMIFF); and another
facility intended to revive the market for ABS (TALF).5
Also in October, Federal Deposit Insurance Corporation (FDIC) expanded its deposit
5As of mid-March 2009, the MMIFF had purchased no assets.
8

guarantee to a maximum of $250,000 per account, up from $100,000. One month later, the
FDIC announced its Temporary Liquidity Guarantee Program, which extended an unlim-
ited guarantee of all senior debt and non interest-bearing transactions accounts. The U.S.
authorities, like those in Japan a decade earlier, clearly saw the value of deposit guarantees
a means to stem bank runs, and acted accordingly.
Yet another asset purchase plan was announced in November: this one for up to $100
billion in mortgage-backed securities and the direct obligations of government sponsored
enterprises (GSEs) including Fannie Mae and Freddie Mac. As of mid-March, the Fed had
accumulated $69 billion of these assets.
The steps taken during the fall of 2008 together seem to have had the desired calming
effect on money markets. Rates on negotiable CDs and financial CP fell from four and three
percent, respectively, to less than one percent—much closer to the prevailing Treasury rate.
In this regard, the CPFF, perhaps in combination with the FDIC’s guarantee, seems to have
been more effective than the TAF which, as shown by Taylor & Williams (2009), failed
to appreciably reduce key interest rates, such as the closely-watched Libor-OIS. The yield
on 30-year conventional mortgages fell by roughly one percent during this period, and the
spread over Treasuries narrowed substantially during the first few weeks of 2009.
Also during this period the Fed took the unprecedented step of committing to serve as
a credit backstop for a $306 billion pool of mortgage-related assets. A similar arrangement
for Bank of America was announced on January 29. The implications of these guarantees
are discussed below in section 4.
Finally, the Fed on March 18 announced three additional major credit market interven-
tions. The first was a significant expansion of its existing program for purchasing MBS
and agency obligations: $750 billion of the former, and $100 billion of the latter. It also
committed to the purchase of up to $300 billion in long-term Treasury bonds.
9

3 A comparison of BOJ and Fed policies
The narrative history in section 2 has already highlighted some of the parallels between the
Japanese and U.S. experiences. This section presents a more structured comparison of the
Fed and BOJ responses along three dimensions: timing, scale and scope. The two insti-
tutions have, to a surprising degree, taken their cues same playbook. Both central banks’
responses progressed through three stages: first, emergency ad hoc lending to specific dis-
tressed institutions; second, the regularization and expansion of standing facilities; and
third, the direct provision of credit to the private sector. The timing and magnitude of the
two central banks’ actions differ appreciably, however. Compared with the BOJ, which im-
plemented a series of measured responses over a course of several years, the Fed’s reaction
has been drastic in both speed and magnitude. And, unlike the BOJ, the Fed has ventured
into uncharted territory in its explicit assumption of default risk.
3.1 Timing
Comparisons between two central banks’ response speed are complicated by differences in
the time lines on which the respective crises progressed. Reflecting this paper’s focus on
the central banks’ response to financial instability, it makes sense to establish chronologies
with respect to key points marking the intensification of the crises. As noted above, Japan’s
financial breakdown began several years after the downturn in macroeconomic conditions
and and asset prices. If one were to identify the onset of the crisis, a plausible starting
date would be the surfacing of the jusen problems in mid-1995, or the collapse of Cosmo
Credit, Hyogo Bank and Kizu Credit Association in August 1995. In the U.S., on the
other hand, the financial dominoes began to fall just a few months after the stock market
and macroeconomic peaks. The March 2008 Bear Stearns collapse is arguably the closest
equivalent to this first wave of Japanese failures.
Both central banks’ responses in this initial phase were relatively modest. The BOJ
focused its efforts on emergency lending, but took no formal steps to increase liquidity
provision, other than further reduce the target call rate. Like the BOJ, the Fed was also
10

called upon to assist in bailouts, in the U.S. case by effectively purchasing some of Bear’s
assets. But at the same time it took steps to enhance liquidity provision through the the
PDCF and TAF, along with another cut in the funds rate target.
The Hokkaido Takushoku and Lehman failures were the next significant events. Both
were seen as watershed events, failures that revealed the depth of the nations’ financial
woes, and the limits of government intervention. The progression from acute to critical
took 27 months in Japan, but only six months in the U.S. The response in both cases was
the enhancement of liquidity provision. The BOJ’s reaction was relatively gradual. The
first cut in the call rate target occurred nearly a year later, and the first new lending facility
was established in November 1998. The expansion in the BOJ’s terms of lending occurred
nearly two years later, in August 1999. By contrast, the Fed’s response was almost instan-
taneous, with the AMLF established immediately after the Lehman failure, and the CPFF
and MMIFF one month later. The Fed’s rapid response is clearly evident in the plots of
CABs and reserves, figures 5 and 6.
While not under the purview of the central banks, another important milestone is the
replacement of ad hoc bailouts with a coordinated bank rescue plan. Japan’s first systematic
attempt at such a package came in October 1998, 11 months after the Hokkaido Takushoku
failure. The analogous date for the U.S. is not entirely clear, as efforts thus far have been
piecemeal. The initial response, the establishment of the Troubled Asset Relief Program
(TARP), was almost immediate, becoming law in October 1998. While the program’s
objectives seem to change from day to day, the program has provided funds for ad hoc
bank recapitalizations. Alternatively, the Treasury’s February 2009 proposal, which was
short on details at the time of announcement, might be analogous to Japan’s 1998 package,
it remains a work in progress. Consequently, it is not yet clear whether progress towards a
definitive resolution is occurring more rapidly in the U.S. than it did in Japan.
11

3.2 Scope
A useful distinction to make in comparing the scope of the BOJ’s and the Fed’s response to
the crisis is between three distinct forms of central bank intervention in the financial mar-
kets: first, the provision of liquidity; second, the supply of credit; and third, the extension
of loan guarantees or credit backstops. Table 3 show how the two central banks’ various
actions as LOLR might be classified along these lines.
3.2.1 Liquidity provision
Liquidity provision is what is traditionally associated with the LOLR function. It is worth
noting that there are two senses in which central banks can provide liquidity. One defini-
tion focuses on the liability side of intermediaries’ balance sheets, and has to do with the
availability of credit: institutions are “liquid” if short-term collateralized funding is read-
ily available for financing asset holdings. It was the sudden evaporation of these sources
of short-term funding that threatened financial stability in the immediate aftermath of the
Bear and Lehman failures. The second usage of the term focuses on the asset side of in-
stitutions’ balance sheets, and in particular bank reserves.6 Liquidity in this sense of the
word is in normal times provided through open market operations, or in conditions of more
severe financial market dislocation, the extension of secured loans.
These two definitions of liquidity overlap, but they are not interchangeable. Central
banks can take certain measures to enhance provide liquidity, in the sense of facilitating
short-term funding, without necessarily increasing reserve supply—an example would be
the Fed’s TSLF. Conversely, the bank reserves supplied by conventional measures, such
as open market operations, may fail to restore liquidity to certain financial markets. An
increase in bank reserves would, for example, fail to improve the liquidity for non-bank
institutions.
The BOJ and the Fed both responded to the crisis with a number of efforts to improve
liquidity. The BOJ’s measures included the introduction of repo operations, repos on CPs,
6Henry Kaufman (2007) emphasizes this distinction.
12

the relaxation of collateral standards, quantitative easing, and the introduction of repos on
JGBs. All were intended either to facilitate institutions’ access to short-term funding or,
especially in the case of quantitative easing, to increase bank reserves. The Fed also took
steps to increase institutions’ access to short-term funding, primarily through the establish-
ment of new standing facilities: the Term Discount Window, TAF, TSLF, PDCF, and the
AMLF. The additional liquidity, as measured on the asset side of banks’ balance sheets, is
evident in figures 5 and 6: CABs and reserve balances took off, as overnight lending rates
headed towards zero.
3.2.2 Credit supply
As the BOJ, and now the Fed, have discovered, liquidity is not the same thing as credit.
The BOJ provided ample liquidity to Japanese banks, especially after quantitative easing
went into effect. But with the bad asset problem unresolved, banks remained reluctant to
extend new credit, and loan supply shrank. The same is true now in the U.S.: bank lending
is falling and markets for asset-backed securities have dried up, despite the Fed’s massive
injections of liquidity. This problem prompted several efforts at both central banks to restart
the flow of credit.
The line between credit supply and liquidity provision is indistinct, but it is useful to
distinguish the two in terms of maturity and assumption of risk. Liquidity provision is
characterized by short-term secured lending, along the lines laid out by Bagehot. Credit
supply, by contrast, can be described as longer-term, non-recourse lending, or even the
outright purchases of assets. Such transactions minimize borrowing institutions’ exposure
to rollover risk, while transferring to the central bank some or all of the credit risk.
In Japan, the first effort along these lines was the awkwardly-titled “Temporary Lending
Facility to Support Firms’ Financing Activities,” announced in November 1998. Four years
later, the BOJ made a foray into the stock market, with its equity purchase plan of October
2002. While other motives have been attributed to the BOJ, the stated purpose of the pro-
gram was to free banks’ balance sheets of the burden of equities, which would presumably
13
make them more willing to extend new credit. The BOJ’s third effort to increase credit
supply was its June 2003 plan to resuscitate the ABS market through outright purchases of
those securities. The Bank’s stated rationale for the policy is consistent with its interpreta-
tion as an effort to boost credit supply. According to the press release, its purpose was to
encourage “. . . the development of the ABS market by directly taking credit risks through
purchases of ABSs as a temporary measure. By encouraging the development of the ABS
market through this unprecedented scheme for a central bank, the Bank could strengthen
the transmission mechanism of monetary easing against the background of banks’ weak
financial intermediary function.”
The Fed’s largest credit-supplying effort to date is the $300 billion CPFF program,
established in October 2008, which conducts outright purchases (via a Fed-financed SPV)
of commercial paper (CP) issued by nonfinancial corporations. The purpose was clearly
credit supply. As Fed chair Bernanke described it, “our commercial paper facility has
helped American businesses finance their payrolls and other operational obligations by
significantly lowering rates on the paper and opening access to financing at terms longer
than a few days.”7 The Fed began to purchase significant quantities Agency issues in
September 2008, MBS in January 2009, in a similar effort to restore the flow of credit to
the housing sector. A significant expansion of these purchases was announced on March
18 of this year.
But it is the long-awaited TALF program, intended to finance the purchase of securities
backed by consumer and Small Business Administration (SBA) loans, that could have the
most far-reaching impact on the credit markets. Like the BOJ’s 2003 program, TALF is
intended to fill the void left after investors fled the market for these securities. A radical
feature of TALF is that it would provide non-recourse funding to private-sector investors,
such as hedge funds, would would then purchase newly-issued asset-backed securities.
This unique arrangement has two implications. The first its use of low-cost Fed-supplied
leverage to enhance the returns enjoyed private investors. Second, the non-recourse nature
of the funding private investors’ risk exposure, with any losses in excess of the investors’
7Speech to the Independent Community Bankers of America, March 19.
14
initial investment absorbed by the Treasury and the Federal Reserve.
These measures have collectively taken the Fed far beyond its traditional LOLR role of
short-term collateralized lending to Banks, and take the Fed farther along the road to credit
provision. In effect, the provision of credit is becoming nationalized—even as the banks
themselves remain in private hands.
3.2.3 Risk backstopping
The Fed’s most radical departure from its traditional LOLR role stems from its involvement
with the Citigroup and Bank of America rescues in November 2008 and January 2009. The
Fed is not doing any actual lending to either institution as part of the deal, and the troubled
assets will remain on the banks’ books. But the Fed, the Treasury and the FDIC have jointly
agreed to limit the institutions’ risk exposure. In the case of Citi, the larger of the two deals,
the Treasury and FDIC will backstop $15 billion in losses exceeding $29 billion, leaving
the Fed with an open-ended commitment to absorb losses in excess of that amount.8 The
BOJ did nothing comparable.
3.3 Scale
Liquidity provision and credit supply swelled the balance sheets of both the BOJ and the
Fed, expanding the banks’ asset holds to an unprecedented degree. Relative to its initial
size, the BOJ’s expansion is considerably larger than the Fed’s thus far. In contrast to
the BOJ’s relatively gradual growth, the Fed’s expansion has been phenomenally rapid.
Moreover, compared with the BOJ, a larger share of the Fed’s balance sheet growth is
attributable to efforts to supply credit, as opposed to liquidity provision.
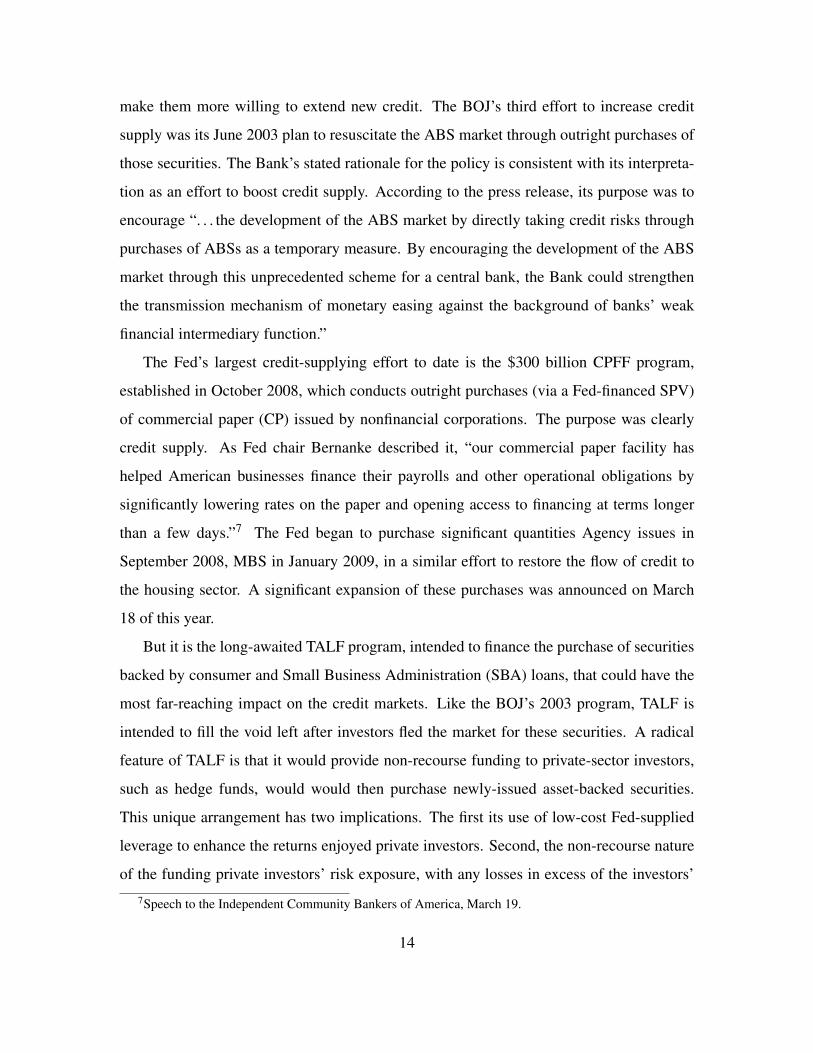
Figure 7 plots the overall size of the BOJ’s balance sheet, along with a breakdown by
major asset classes. In the early 1990s, the Bank owned roughly 40 trillion yen of financial
assets. Those holdings rose gradually as the BOJ progressively cut interest rates. The
8In theory, the Fed would be extending a collateralized loan to Citigroup to finance the asset pool, butwithout recourse to Citi’s assets, the Fed would experience losses if the value of the collateral were to declinesignificantly.
15
volume of assets rose more sharply after the Hokkaido Takushoku crisis, owing partly to
the 8 trillion yen in credit extended to the DIC. The bank’s assets shrank by a comparable
amount as the DIC loan was extinguished, interrupted only by a brief Y2K spike towards
the end of 1999.
The Bank’s balance sheet again began to expand steadily as the call rate was cut to
zero, and especially once the quantitative easing policy was put into place. The volume of
assets on the Bank’s books over the 2000-2005 period nearly doubled, from roughly 80 to
more than 150 trillion. Relative to its 40 billion level at the start of the decade, the Bank’s
balance sheet expanded nearly four-fold. As a share of GDP, the Bank’s size tripled, rising
from one to three percent.
Examining the breakdown by asset class, the expansion in the Bank’s balance sheet is
largely due to some combination of JGB purchases, and the category labeled in the chart as
Short-Term operations. The largest component in this grouping, and the one that accounts
for most of the growth in the Bank’s balance sheet, is “Assets/Bills purchased,” a category
the Bank ceased to report after the introduction in April 2006 of funds supplying operations
using pooled collateral.9
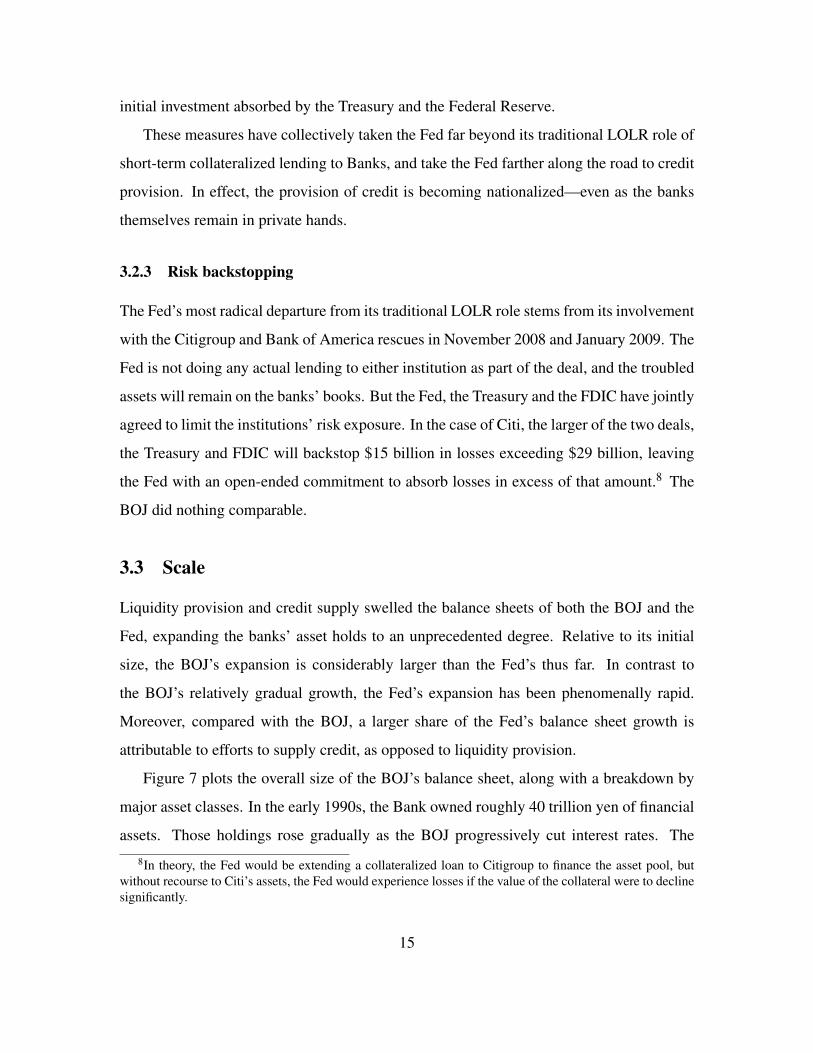
Except for the 1998-99 spike in DIC lending, very little of the increase in BOJ credit
can be attributed to unconventional policy actions, such as direct lending to troubled in-
stitutions or the purchase of assets other than government securities. The Bank’s lending
under Articles 33 and 38 peaked at 1.4 and 3.0 trillion yen, representing respectively 1.8
and 3.7 percent of the Bank’s balance sheet. The much-publicized stock purchase plan
never amounted to more than 2 trillion yen, or 1.4 percent of the Bank’s assets. The ABS
purchase program had only a trivial impact on the Bank’s assets, with a maximum of 291
billion yen, or 0.2 percent of the balance sheet. As shown in figure 8, except for the peak
of the crisis in late 1998 and early 1999, these assets collectively comprised approximately
2 trillion yen.
9In the BOJ’s accounts, “Assets/Bills purchased” is classified as a purchase, while the supply of fundsagainst pooled collateral is a loan. Both presumably involve the extension of credit against privately-issuedsecurities.
16

This figure may understate the degree to which the BOJ departed from its normal prac-
tice, however, as it does not account for the Bank’s progressive relaxation of collateral
standards for its purchases of bills and other short-term assets. Unfortunately, this is hard
to gauge quantitatively, as these purchases took place through existing facilities, rather than
the creation of new ones.
The Fed’s balance sheet has also grown spectacularly—more rapidly than the BOJ’s,
and from a relatively larger base. As shown in figure 9, the size of the Fed’s portfolio
a stable $850 billion (6 percent of GDP) in the months preceding the September 2008
Lehman crisis. At that point, its asset holdings began to grow, reaching 2.2 trillion by
yearend 2008—a 150 percent expansion, representing 16 percent of GDP. Relative to its
pre-crisis size, the expansion of the Fed’s balance sheet is modest, compared with that of
the BOJ.
The Fed’s new credit provision facilities promise to vastly expand the scale of its in-
volvement in the financial system, and the size of its balance sheet. The $300 billion CPFF
has been the biggest step so far in this direction. The just-announced purchases of Treasury
bonds, Agency issues and MBS would add up to $1.15 trillion to the $1.8 trillion of as-
sets currently on the balance sheet. And, if the impending TALF program were to grow to
its full $2 trillion, the Fed’s asset holdings could soar to nearly $4 trillion—a greater-than
four-fold increase that would take the size of its portfolio up to an astonishing 32 percent
of GDP. Note also that these figures do not include the off balance sheet loan guarantees to
Citigroup and Bank of America.
Because the Fed’s modus operandi has been to introduce a distinct facility for each new
mode of lending, it is relatively easy to keep track of exactly where the balance sheet expan-
sion is coming from. Lending through the term discount window, PDCF and TAF facilities
began to grow after the the Bear collapse, as shown in figure 9, but the Fed restrained total
asset growth by running down its holdings of Treasury bills. Lending ballooned after the
Lehman collapse, however, and the Fed abandoned its efforts to rein in its balance sheet
expansion. The main sources of asset growth have been the loans category (encompassing
the discount window, TAF, PDCF, and AMLF), swap lines with other foreign central banks,
17
and the purchase of commercial paper through the CPFF. Purchases of mortgage-backed
and agency securities have also begun to grow in recent months.
Figure 10 shows a more detailed breakdown of several of the Fed’s less conventional
credit extensions: direct lending to troubled institutions, credit lines for non-bank institu-
tions, and de facto asset purchases via SPVs. At their peak in late 2008, these asset classes
totaled nearly $500 billion, approximately 20 percent of the Fed’s balance sheet. If all goes
according to plan, this figure, and figure 9 will show even more spectacular growth than
they do already.
Overall, the pictures is one in which an increasing share of the Fed’s balance sheet is
being allocated to credit supply, relative to liquidity creation. This is is a major difference
from the BOJ, whose strategy focused primarily on liquidity creation, allocating only a
small share of its balance sheet to efforts to supplement the private sector’s creation of
credit.
4 Accounting for the differences
A partial explanation of the speed of the Fed’s intervention must be the very rapid progres-
sion of the crisis: there seems to have been a much greater degree of contagion in the U.S.
than in Japan, where bank failures dragged on for a period of years. This may be because
of the U.S. financial system’s much greater reliance on short-term highly liquid sources of
funding, particularly repos. At their peak in the second quarter of 2007, 40 percent of the
liabilities of U.S. broker-dealers, their balance sheets bloated with questionable mortgage-
backed securities and CDOs, consisted of repos. In Japan, the comparable figure in 1995
was only 17 percent.10 Consequently, U.S. financial institutions such as Bear Stearns and
Lehman Brothers were far more susceptible to runs than the typical Japanese intermediary.
Disparities between the two countries’ financial structures may account for the diver-
gent approaches to the restoration of credit supply. Japanese firms are far more dependent
10Sources: Federal Reserve release Z.1 table L.129, and Bank of Japan Flow of Funds series 190L280 and190L900.
18

on bank loans than those in the U.S., and conversely U.S. firms rely much more heavily on
publicly traded debt securities. In 2006, for example, loans accounted for 82 percent of the
debt of Japanese nonfinancial corporations, with debt securities accounting for the remain-
ing 18 percent. The analogous figures for the U.S. are 27 percent for loans (from various
bank and non-bank intermediaries) and 73 percent for securities.11 This heavier reliance on
publicly-traded debt allows the Fed to supply credit via direct purchases of securities on the
open market, as it has done through its purchases of commercial paper, mortgage-backed
securities, and GSE debt; as well as by funding private investors’ purchases through the
TALF facility. Fewer such opportunities exist in Japan’s more bank-dependent financial
system.
Differing levels of concern about potential loan losses may also have influenced the
two banks’ intervention in the credit markets. The primary worry is that these losses would
ultimately lead to higher inflation. Seigniorage is one channel through which this could
occur: in the absence of a government commitment to reimburse or recapitalize the central
bank, Ize (2005) and Buiter (2008) demonstrated that solvency would require the mon-
etization of losses. Alternatively, Sims (2004) showed theoretically that the issuance of
Treasury securities without an accompanying commitment to increased tax revenues could,
by making monetary policy “passive” in the sense of Leeper (1991), cause the price level to
explode “exponentially upward,” even if the money supply were held constant. The second
channel leading to higher inflation is through the loss of central bank independence, which
would presumably exacerbate the inflation bias resulting from the Barro-Gordon (1983)
time inconsistency problem.
While it is impossible to determine the extent to which risk concerns affected the BOJ’s
decisions, speeches given by Policy Board members suggest balance sheet risk was a major
consideration despite the Bank’s relatively small positions in unconventional assets such as
equities and ABS. Speeches delivered by Ueda (2003) and Yamaguchi (2001) raise both of
the concerns mentioned above, and give particular emphasis to the possibility of an erosion
11Sources: Federal Reserve release Z.1 tables L.102 and L.216, and Bank of Japan Flow of Funds series410L240 and 410L300.
19

in independence. This is perhaps understandable given that the BOJ had only been granted
an enhanced degree of independence with the passage of the New Bank of Japan Law in
1997. BOJ officials also voiced concerns about the ability to quickly remove reserves from
the system by unwinding their positions. This may also explain the Bank’s preference for
using short-term liquidity provision over longer-term credit supplying operations.
Unlike BOJ policymakers, Fed officials have thus far downplayed the risks associated
with nontraditional forms of lending. Chairman Bernanke, in his February 10 congressional
testimony and in a February 18 speech, characterized these risks as “exceptionally low.”12
And, while acknowledging some element of risk, Bernanke argued that the costs of not
engaging in such lending outweighed the risk associated with the loans.
This relatively relaxed attitude towards balance sheet risk represents a major shift in
the Fed’s thinking. The Federal Reserve, like most central banks, was established on the
principle that it would assume little or no balance sheet risk. This principle is embodied in
the Federal Reserve Act (FRA) which, narrowly interpreted, restricts the Fed’s purchases
to risk-free assets—and only from depository institutions.13 The Fed has in practice min-
imized balance sheet risk (and its intervention in private credit markets) by investing of
virtually its entire System Open Market Account (SOMA) portfolio in Treasury securities.
However section 13(3) of the FRA permits the Federal Reserve, in “unusual and ex-
igent circumstances. . . to discount for any individual, partnership, or corporation, notes,
drafts, and bills of exchange when such notes, drafts, and bills of exchange are indorsed or
otherwise secured to the satisfaction of the Federal Reserve bank,” when that institution is
unable to secure credit from other banking institutions. The Fed has invoked this provision
repeatedly in establishing its new credit lines. Most of the Fed’s new arrangements—the
TAF, TSLF, PDCF and the AMLF—lie within the scope of section 13(3). In these cases,
losses would be realized only if the value of the collateral declines sufficiently and the
borrowing institution is unable to unable to make up the difference.
12See http://www.federalreserve.gov/newsevents/speech/bernanke20090218a.htm andhttp://www.federalreserve.gov/newsevents/testimony/bernanke20090210a.htm.
13This conservative view of the Fed’s powers is reflected Clouse & Small (2004), a study prepared duringthe deflation scare of 2003.
20

Its other lending programs could expose the Fed to considerably more risk. Maiden
Lane LLC is one potential source of losses. Financed by a $28.8 billion non-recourse loan
from the Fed and $1.2 billion in subordinated debt from by JP Morgan, the SPV was set up
to purchase $30 billion in troubled assets from Bear Stearns prior to its sale to JP Morgan.
Without recourse to JP Morgans assets, the Fed would stand to lose if the value of the
securities owned by Maiden Lane declined by more than $1.2 billion. There is risk in the
Fed’s other asset purchases as well: the roughly $300 billion in commercial paper through
the CPFF, plus $48 billion in mortgage-backed securities and CDOs purchased from AIG
by Maiden Lane II and III. The same is true of the Fed’s $85 billion credit line to AIG,
despite being secured by A.I.G.’s assets and warrants for a 79.9% equity stake.
It is impossible to gauge with any precision the amount of risk the Fed has assumed, but
with $1 trillion of private-sector assets currently on its balance sheet—and the possibility
of a much larger volume in the near future—significant losses are not out of the question.
Highlighting this risk is the European Central Bank’s March 5 acknowledgment that five
counterparties defaulted on 10.3 billion euros worth of secured borrowing, leaving the ECB
stuck with its “eligible collateral” consisting of questionable asset-backed securities.14 And
indeed, the fair value of Maiden Lane’s assets has already been marked down by $2.7
billion, leaving the Fed with a paper loss of roughly $1.5 billion. Working to reduce the
Fed’s credit risk exposure is the commitment of the Treasury and the FDIC to share some
of the risk associated with certain lending programs and credit guarantees. In addition,
the Treasury in its March 24 joint statement with the Fed announced its intention to assume
ownership of the troubled Maiden Lane vehicles, and the pledge of closer cooperation hints
at an implicit commitment by the Treasury to finance at least a portion of any Fed losses.
14See the March 5 2009 press release on Eurosystem Monetary Policy Operations in 2008, http://www.ecb.int/press/pr/date/2009/html/pr090305_2.en.html.
21

5 Summary and conclusions
The parallels between the U.S. in 2009 and Japan a decade ago are striking. Both
economies experienced spectacular asset price rises, followed by calamitous declines that
jeopardized the stability of the financial systems. The two crises have created an opportu-
nity to draw lessons from a comparison of the Bank of Japan’s and U.S. Federal Reserve’s
responses to the financial turmoil. Circumstances compelled both banks to take drastic
actions as lenders of last resort. This involved providing funds in the form of short-term
collateralized lending through mechanisms which would have been recognizable to Bage-
hot (1873)—but also in ways going well beyond what Bagehot envisioned.
The BOJ and Fed responses followed followed broadly similar progressions. The initial
reaction was a series of ad hoc emergency loans to institutions in imminent danger of
collapse. This was followed in both cases by the establishment of new standing facilities
for the provision of liquidity, or the expansion of existing facilities. The large scale increase
in liquidity led to a massive expansion in both banks’ balance sheets: the Bank of Japan’s
expanded by a factor of four, and the Fed’s by a factor of 2.5.
By most any measure, the Fed responded to the crisis much more quickly than the
Bank of Japan. The BOJ’s balance sheet growth took place over a period measured in
years, whereas virtually all of the expansion in the Fed’s balance sheet (so far) occurred
within just three months. The primary reason for the Fed’s alacrity is without a doubt a
result of the exceptionally rapid progression of the financial deterioration in the U.S.
The two banks’ responses also differ significantly in terms of scope, with the Fed in-
creasingly emphasizing credit creation over liquidity provision. Through its outright pur-
chases of commercial paper, mortgage-backed securities and agency issues, the Fed has
already become a major player in several key financial markets, and its involvement could
increase significantly with the expansion of the TALF program. The BOJ’s unconventional
credit provision measures were more circumscribed: a modest short-term lending program
and small-scale purchases of equities and ABS. Japan’s more more bank-dependent and
less heavily securitized financial system naturally limited the scope for the BOJ’s credit
22

market interventions. But another factor behind the BOJ’s liquidity-focused approach may
have been a more cautious stance towards balance sheet risk.
The overarching conclusion to be drawn from all this is that conventional LOLR tools,
such as the purchase of government securities and discount window lending, have become
inadequate for dealing with modern financial crises like those of the U.S. and Japan. The
ever increasing complexity of the financial system compels central banks to offer assistance
to a wide range of institutions outside the banking system: mortgage lenders, brokers and
dealers, and even insurance companies. The globalization of financial markets requires
a greater degree of international cooperation than in the past, as in the Fed’s provision
of dollar-denominated liquidity via swap lines to other central banks. And the greater
degree of opacity of financial instruments makes it much more difficult to distinguish good
collateral from bad than it was in Bagehot’s day. It is a whole new ball game: the rules
have changed and the playbook must be revised accordingly.
23

Table 1: A Chronology of BOJ Actions, 1996–2009
Announcement (Implementation)Cosmo Credit, Hyogo Bank and Kizu Credit August 1995Emergency loan to Tokyo Kyodo Bank April 1996Lending to DIC September 1996Emergency loan to Hanwa Bank November 1996Introduction of repo operations October 1997Emergency loan to Kyoto Kyoei Bank October 1997Failures of Yamaichi & Hokkaido
Takushoku, emergency loans November 1997Emergency loan to Tokuyo City Bank November 1997Emergency loan to Fuji/Yamaichi November 1997Lending to DIC February 1998CP operations for repos November 1998Temporary Lending Facility to Support
Firms’ Financing Activities November 1998Zero interest rate target August 1999Expansion of eligible collateral September 1999Lombard facility March 2001Quantitative easing March 2001Stock purchases October 2002 (December 2002)ABS purchases June 2003 (August 2003)Reaffirmation of LOLR function March 2005End of quantitative easing policy March 2006Introduction of pooled collateral April 2006Suspension of stock purchase program October 2008Resumption of stock purchase program February 2009
24
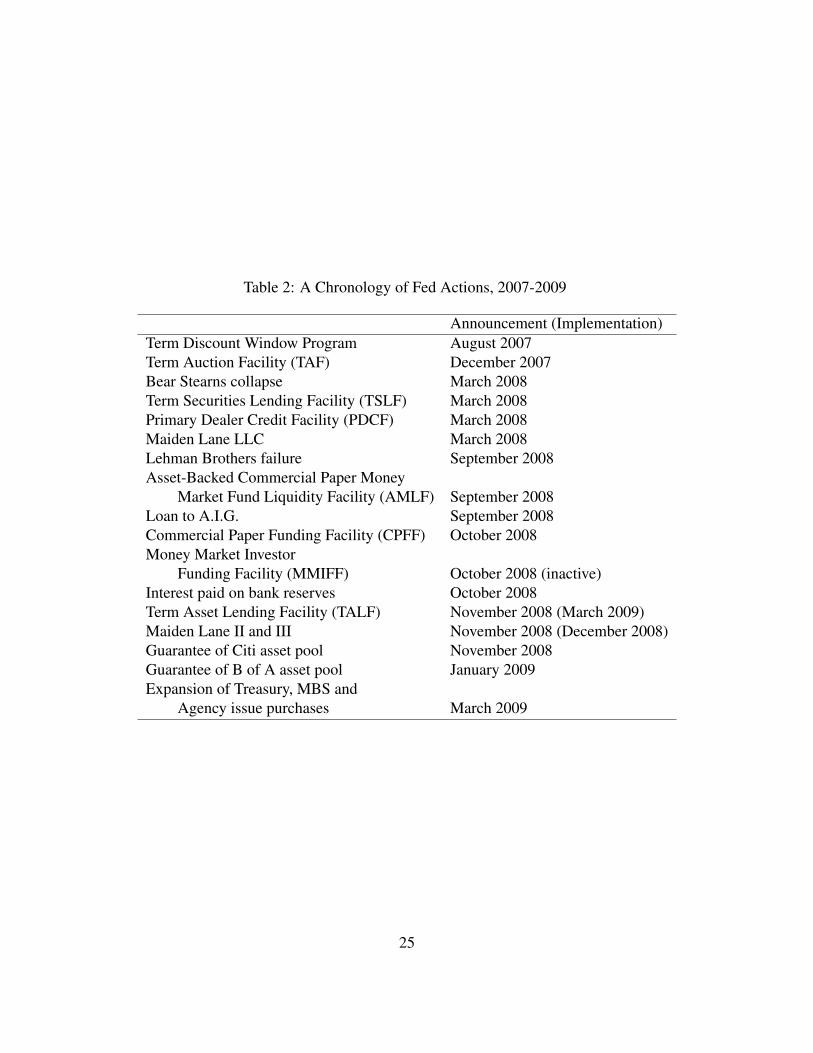
Table 2: A Chronology of Fed Actions, 2007-2009
Announcement (Implementation)Term Discount Window Program August 2007Term Auction Facility (TAF) December 2007Bear Stearns collapse March 2008Term Securities Lending Facility (TSLF) March 2008Primary Dealer Credit Facility (PDCF) March 2008Maiden Lane LLC March 2008Lehman Brothers failure September 2008Asset-Backed Commercial Paper Money
Market Fund Liquidity Facility (AMLF) September 2008Loan to A.I.G. September 2008Commercial Paper Funding Facility (CPFF) October 2008Money Market Investor
Funding Facility (MMIFF) October 2008 (inactive)Interest paid on bank reserves October 2008Term Asset Lending Facility (TALF) November 2008 (March 2009)Maiden Lane II and III November 2008 (December 2008)Guarantee of Citi asset pool November 2008Guarantee of B of A asset pool January 2009Expansion of Treasury, MBS and
Agency issue purchases March 2009
25

Table 3: A Taxonomy of Fed and BOJ Actions
Type BOJ FedLiquidity Repos, Repos on CP, Term Discount Window,
Collateral expansion, TAF, TSLF,Quantitative easing, PDCF, AMLFRepos on JGBs, Treasury purchasesPooled collateral scheme
Credit “Temporary Lending Facility to CPFF, MMIFF, TALFSupport Firms Financing MBS, Agency purchasesActivities,”
ABS purchases,Stock purchasesCollateral expansion
Risk Citi backstopBofA backstop
26

Figure 1: Equity and Real Estate Prices in JapanT
hou
san
d Index
1985 1987 1989 1991 1993 1995 1997 1999 20015
10
15
20
25
30
35
40
60
70
80
90
100
110
120Nikkei
Bank stock price
Real estate
HokkaidoTakushoku
Cosmo, etc.
Figure 2: Tankan Lending Attitude and the Japan Premium
Ta
nk
an
, %
tig
hte
nin
gJ
ap
an
prem
ium
, percen
t
1995 1997 1999 2001 2003 2005-20
-10
0
10
20-0.1
0.1
0.3
0.5
0.7
Cosmo, etc.
HokkaidoTakushoku
Rescuepackage
Quantitativeeasing
27

Figure 3: Equity and Real Estate Prices in the U.S.S
&P
in
dex
OF
HE
O in
dex
1998 2000 2002 2004 2006 2008
500
1000
1500
2000
2500
3000
120
140
160
180
200
220
240S&P 500
FIRE stocks
OFHEO index
Bear
Lehman
Figure 4: Senior Loan Officer Opinion Survey and the CP Spread
SL
OO
S,
% t
igh
ten
ing C
P sp
read
, percen
t
1997 1999 2001 2003 2005 2007-25
0
25
50
75
100
0
50
100
150
200
250
300
350
Bear
Lehman
28

Figure 5: Current Account Balances and the Call RateC
all
rate
, %
CA
B, trillio
n yen
1995 1997 1999 2001 2003 2005 20070.00
0.25
0.50
0.75
1.00
1.25
1.50
1.75
2.00
2.25
0
5
10
15
20
25
30
35
Cosmo, etc.
HokkaidoTakushoku
Rescuepackage
Quantitativeeasing
Figure 6: Total Reserves and the Federal Funds Rate
Perc
en
t billio
n $
J F M A M J J A S O N D J F2008
0
1
2
3
40
200
400
600
800Funds rate
Total reserves
BearStearns
LehmanBrothers
29

Figure 7: The Bank of Japan’s Balance SheetT
rill
ion
Yen
1992 1994 1996 1998 2000 2002 2004 2006 20080
20
40
60
80
100
120
140
160Loans
ST operations
JGBs
Bills
FX
Other
Cosmo, etc.
HokkaidoTakushoku
Rescuepackage
Quantitativeeasing
Figure 8: Unconventional Lending by the Bank of Japan
Tri
llio
n Y
en
1998 1999 2000 2001 2002 2003 2004 20050
2
4
6
8
10Article 38
Article 33
ABS
Stocks
DIC
Rescuepackage
Quantitativeeasing
30

Figure 9: The Federal Reserve’s Balance SheetB
illi
on
do
lla
rs
J F M A M J J A S O N D J F2008
0
250
500
750
1000
1250
1500
1750
2000
2250Swaps
Asset purchases
All loans
Repos
Bills
Notes + bonds
Other
BearStearns
LehmanBrothers
Figure 10: Unconventional Lending by the Federal Reserve
Bil
lion
doll
ars
J F M A M J J A S O N D J F
2008
0
100
200
300
400
500
600MBS
CPFF
Maiden Lane
AIG
PDCF
Bear
Stearns
Lehman
Brothers
31

ReferencesAhearne, Alan, Gagnon, Joseph, Haltimaier, Jane, & Kamin, Steve. 2002. Preventing De-
flation: Lessons from Japan’s Experience in the 1990s. International Finance DiscussionPaper 729. Board of Governors of the Federal Reserve System.
Bagehot, Walter. 1873. Lombard Street. H.S. King & Company.
Barro, Robert J., & Gordon, David B. 1983. A Positive Theory of Monetary Policy in aNatural-Rate Model. Journal of Political Economy, 91, 589–610.
Buiter, Willem. 2008. Can Central Banks Go Broke? CEPR Policy Insight, May.
Clouse, James A., & Small, David H. 2004. The Scope of Monetary Policy Actions Autho-rized under the Federal Reserve Act. FEDS Working Paper 2004-40. Board of Governorsof the Federal Reserve System.
Harrigan, James, & Kuttner, Kenneth N. 2005. Lost Decade in Translation: Did the UnitedStates Learn from Japan’s Post-bubble Mistakes? Pages 79–106 of: Ito, Takatoshi,Patrick, Hugh, & Weinstein, David E. (eds), Reviving Japan’s Economy: Problems andPrescriptions. Cambridge, MA: MIT Press.
Ize, Alain. 2005. Capitalizing Central Banks: A Net Worth Approach. IMF Staff Papers,52(2), 289–310.
Jinushi, Toshiki, Kuroki, Yoshihiro, & Miyao, Ryuzo. 2000. Monetary Policy in JapanSince the Late 1980s: Delayed Policy Actions and Some Explanations. Pages 115–148 of: Mikitani, Ryoichi, & Posen, Adam S. (eds), Japan’s Financial Crisis and ItsParallels to U.S. Experience. Washington D.C.: Institute for International Economics.
Kaufman, Henry. 2007. Our Risky New Financial Markets. Wall Street Journal, August15, A13.
Kuttner, Kenneth N., & Posen, Adam S. 2004. The difficulty of discerning what’s too tight:Taylor rules and Japanese monetary policy. North American Journal of Economics andFinance, 15, 53–74.
Leeper, Eric M. 1991. Equilibria under ‘active’ and ‘passive’ monetary and fiscal policies.Journal of Monetary Economics, 27, 129–47.
McCallum, Bennett T. 2003. Japanese monetary policy, 1991-2001. Federal Reserve Bankof Richmond Economic Quarterly, 89, 1–31.
Okina, Kunio, & Shiratsuka, Shigenori. 2002. Asset Price Bubbles, Price Stability, andMonetary Policy: Japan’s Experience. Monetary and Economic Studies, 35–76.
32

Sims, Christopher A. 2004. Fiscal Aspects of Central Bank Independence. Pages 103–116of: Sinn, Widgren, & Kothenburger (eds), European Monetary Integration. MIT Press.
Taylor, John B. 2001. Low Inflation, Deflation, and Policies for Future Price Stability.Monetary and Economic Studies, 19, 35–51.
Taylor, John B., & Williams, John C. 2009. A Black Swan in the Money Market. AmericanEconomic Association Journal of Macroeconomics, 1(1), 58–83.
Ueda, Kazuo. 2003 (October 25). The Role of Capital for Central Banks. Speech deliveredat the Fall meeting of the Japan Society of Monetary Economics.
Yamaguchi, Yutaka. 2001 (October 17). Remarks. Speech delivered at the JCIF Interna-tional Finance Seminar.
33