Embed Size (px)
Citation preview
The Fox News Effect: Media Bias and Voting∗
Stefano DellaVigna
UC Berkeley and NBER
Ethan Kaplan
UC Berkeley
This version: May 10, 2005.
Abstract
Does the media affect voting? We address this question by looking at the entry of Fox
News in cable markets and its impact on voting. Between October 1996 and November
2000, the conservative Fox News Channel was introduced in the cable programming of 20
percent of US towns. Fox News availability in 2000 appears to be largely idiosyncratic.
Using a data set of voting data for 8,634 towns, we investigate if Republicans gained vote
share in towns where Fox News entered the cable market by the year 2000. We find no
significant effect of the introduction of Fox News on the vote share in Presidential elections
between 1996 and 2000. We can rule out an effect of Fox News larger than 0.5 percentage
points. The results are robust to town-level controls, state and county fixed effects, and
alternative specifications. We also find no significant effect of Fox News on voter turnout.
Our results imply that Fox News convinced between 0 and 2.1 percent of its viewers to
vote Republican. The evidence is consistent with the view that voters are sophisticated
and filter out media bias. Alternatively, voters may display a form of confirmatory bias.
∗George Akerlof, Stephen Ansolabehere, Larry M. Bartels, Jay Hamilton, Alan Krueger, Marco Mana-
corda, Enrico Moretti, Torsten Persson, Sam Popkin, Riccardo Puglisi, Matthew Rabin, Jesse Shapiro, David
Stromberg, and audiences at Fuqua, at the IIES (Stockholm), at Princeton University, UC Berkeley, and at
the NBER 2005 Meeting on Political Economy provided comments. Shawn Bananzadeh, Jessica Chan, Mar-
guerite Converse, Neil Dandavati, Tatyana Deryugina, Monica Deza, Dylan Fox, Melissa Galicia, Calvin Ho,
Sudhamas Khanchanawong, Richard Kim, Martin Kohan, Vipul Kumar, Jonathan Leung, Clarice Li, Tze Yang
Lim, Ming Mai, Sameer Parekh, Sharmini Radakrishnan, Rohan Relan, Chanda Singh, Matthew Stone, Nan
Zhang, Sibo Zhao, and Liya Zhu helped collect the voting and the cable data. Dan Acland, Saurabh Bhargava,
Avi Ebenstein, and Devin Pope provided excellent research assistance.
1 Introduction
Media coverage of news can be partisan. Over 70 percent of Americans believe that there is
a great deal or a fair amount of media bias in news coverage (Pew, 2004). Evidence of bias
ranges from the topic choice of the New York Times (Puglisi, 2004) to the choice of think-tanks
that the media refer to (Groseclose and Milyo, 2004).
This evidence, however, leaves open the question of whether media bias matters. Does
media bias affect beliefs of the audience? Does it change voting behavior? Ultimately, these
are the questions of interest for economics and political science.
The answer to these questions has implications also for policy, such as for the regulation of
media concentration. If media bias alters voting behavior, deregulation of media markets may
have a large impact on political outcomes.
In this paper, we present empirical evidence on the impact of media bias on voting. We
consider one of the most significant changes in the US media in recent years, the entry and
expansion of the Fox News cable channel. We exploit the natural experiment induced by the
timing of the entry of this conservative news channel in local cable markets and consider its
impact on voting behavior.
We employ a differences-in-differences methodology and compare changes in the Republican
vote share for towns where Fox News was introduced before the 2000 elections to towns where
it was not present by 2000. We exploit three key elements of the Fox News case, the fast
expansion, the geographical differentiation, and the widely-perceived conservative slant in its
coverage.
The 24-hour Fox News channel was introduced by Rupert Murdoch in October 1996 in
order to compete with CNN. Like CNN, it is only offered via cable and, to a smaller extent,
via satellite. Thanks to an aggressive marketing campaign, a number of cable companies added
Fox News to their programming over the next four years. The geographical expansion of Fox
News was accompanied by a corresponding increase in its share of the audience. By June 2000,
17.7 percent of the US population reported listening regularly to the Fox News channel (Pew,
2004).
The nature of the cable industry induces substantial geographical variation in access to
Fox News. Cable markets are natural monopolies with capacity constraints on the number
of channels. The availability of Fox News in a town depends on whether the local cable
company decides to add it to the programming, possibly at the expense of another channel.
Cable companies in two neighboring towns may make different decisions, creating idiosyncratic
variation in access.
Even given the sudden expansion and popularity of Fox News and the variation in Fox News
diffusion, it is unclear whether the addition of any single media source could have a significant
impact on the information received by voters. Fox News coverage, however, is unique among
1
the television media. Groseclose and Milyo (2004) use data on citations of think-tanks to
rank the political orientation of the media. They conclude that Fox News is significantly to
the right of all the other mainstream television networks (ABC, CBS, CNN, and NBC). The
introduction of Fox News into a cable market, therefore, is likely to have a systematic and
significant effect on the available political information in that cable market.
In order to analyze the impact of Fox News on voting, we assemble a new panel data set of
town-level election data and match it with town-level data on cable programming. The data
set covers the federal elections in 1996 and 2000 for 24 US States. We compare the change in
the Republican vote share between 1996 and 2000 for the towns that had adopted Fox News
by 2000 with those that had not. The availability of Fox News in 2000 appears to be largely
idiosyncratic. Conditional on a set of controls, the two groups of towns have indistinguishable
political outcomes in 1996.
Our main result is that the entry of Fox News did not affect voting behavior. The estimates
of this non-effect are very precise. We can rule out an effect of Fox News entry on vote share
in Presidential elections larger than .5 percentage points. Since Fox News in 2000 is available
in about 60 percent of the households, the overall effect of Fox News on the 2000 elections is
estimated to be at best .3 percentage points, 300,000 votes, and possibly zero. The results hold
after the introduction of town-level demographic controls, state, district, and county dummies,
as well as controls for features of the cable system. The results do not differ for Republican or
for Democratic States and are robust to a variety of alternative specifications.
The estimates could be biased downward in the (unlikely) event that Fox News selected
into towns that were turning more Democratic. We control for town-level trends by comparing
Presidential and US House races in the same town. Shifts in town-level political preferences
should similarly affect the two races. However, since Fox News does not cover House races,
Fox News exposure should impact mainly Presidential elections. We find no evidence that Fox
News differentially affected the Republican vote share for Presidential and House elections.
Along similar lines, we also analyze Senatorial races. While most races for the US Senate go
unmentioned in the Fox News programming, the Senatorial race in New York State between
Hillary Clinton and Rick Lazio attracted considerable attention. In particular, Fox News
maintained a very critical position toward Hillary Clinton. If Fox News affected viewers,
therefore, its effect should have been highest in this race. Instead, we are unable to reject the
hypothesis that the effect on the New York race was the same as on the other Senate races,
that is, no effect.
Fox News entry in media markets does not appear to have had any significant effect on
the Republican vote share. This, however, does not imply that Fox News did not affect voting
behavior. It is possible that Fox News energized both Republicans and Democrats, inducing
both to turn out more to the polls. According to this scenario, the offsetting increases in
turnout lead to no overall effect on Republican vote share. We test for this possibility by
2
examining the effect of Fox News on two measures of voter turnout. For both measures, we
fail to reject the hypothesis of no effect of Fox News on turnout.
Overall, we find no effect of Fox News on either the vote share for Republicans or turnout
to the polls. These empirical results, however, do not directly address the effectiveness of
media bias in altering voting behavior. The findings have to incorporate information on the
size and the share of Republicans in the Fox News audience. We calibrate the media bias
effect using our estimates and data on the Fox News audience from a 2000 Pew survey. The
point estimates imply that Fox News convinced only 0.6 percent of its non-Republican listeners
to vote Republican. An upper bound estimate for the effect is that Fox News convinced 2.1
percent of its audience. Exposure to the conservative coverage of Fox News, therefore, had at
best a small effect on voting behavior of its audience.
These results contrast with findings of large effects of media exposure on political beliefs.1
Following Lazarsfeld, Berelson and Gaudet (1944), political scientists have widely used sur-
veys to assess the impact of the media. A survey in this tradition (Kull et al., 2003) finds
that Fox News watchers are 50 percent more likely to believe (erroneously) that weapons of
mass destruction were found in Iraq by October 2003, compared to viewers of other networks.
In a separate strand of the literature, laboratory experiments involving exposure to political
advertisements (Ansolabehre and Iyengar, 1995) find large impact on beliefs and voting inten-
tions elicited at the end of the experiment. Our non-effect can be reconciled with these large
media effects. The survey findings are likely to overstate the role of the media due to selection
of viewers. The large swings in opinion induced by the experimental manipulations may be
short-lived and may not translate into voting behavior.
Our results are consistent with political science studies finding no effect of media exposure,
summarized in Zaller (1996). Unlike in most of this evidence, however, the non-effect is not
due to lack of variation in media exposure, which leads to imprecise estimates. Our non-
effect is consistent with the finding that media coverage of the incumbent in gubernatorial
and senate elections does not affect the incumbent vote share (Ansolabehere, Snowberg and
Snyder, 2004). Finally, the results are also consistent with studies documenting small effects
of campaign spending (Levitt, 1994), although the evidence on champaign spending is mixed
(Gerber, 2004).
In Section 5 we consider several interpretations of our results. Two explanations of the
non-effect are contamination of the experiment and the presence of other conservative media,
which would weaken the impact of Fox News entry. The non-effect could also be explained
by selection of only Republican voters into watching Fox News, as we discussed above. The
evidence, however, does not support these three interpretations. The results are consistent
1Dyck and Zingales (2003) and Huberman and Regev (1999), among others, find that media coverage has a
large impact on stock returns, even when arguably it conveys no new information.
3
with rational filtering: voters interpret media coverage and are not swayed on average by
media bias (Baron, 2004; Gentzkow and Shapiro, 2004). The results are also consistent with a
form of confirmatory bias (Lord, Ross, and Lepper, 1979): Republican and Democratic voters
reinforce their prior beliefs, while non-voters reinforce their belief that voting is not worth the
effort.
The findings do not support the theory that consumers underestimate the extent of media
bias (Mullainathan and Shleifer, 2004) or are subject to persuasion bias (De Marzo, Vayanos,
and Zwiebel, 2003). According to these theories, exposure to media slant should systematically
alter beliefs and voting behavior.
Our paper also relates to the evidence on shifts in voter turnout following media market
expansion. George and Waldfogel (2004) show that, in areas where New York Times circulation
expanded in the ’90s, voter turnout in local election decreased among likely readers. Gentzkow
(2004) finds a similar effect on voter turnout from the expansion of television. Prat and
Stromberg (2004) find that the introduction of a private TV channel in Sweden increased
voter turnout. We differ from these studies in that (i) we examine the introduction of a
politically-slanted media, and (ii) we consider the media effects at a finer geographical level,
the town. Unlike these authors, we find no effect on voter turnout of the arrival of a new
information source.
Finally, our paper relates to the field experiments on campaign methods to mobilize voters
(Gerber and Green, 2000; Imai, forthcoming). These studies examine the impact of door-to-
door campaigning, phone calling and mass mailings on voter turnout. They estimate that
canvassing and phone calling convince about 5 percent of the subjects, while mailings have a
much smaller effect. The most effective methods depend on personal contact, a feature that
media exposure does not have.
The remainder of the paper is structured as follows. In Section 2 we provide an overview
of the cable industry and of the history of the expansion of Fox News. In Section 3 we discuss
the voting and the cable data. In Section 4 we present the empirical results of the paper, first
on the Republican vote share and then on turnout. In Section 5 we present interpretations
and calibrations of the results and in Section 6 we conclude.
2 Cable Industry and Fox News
Cable industry. The cable industry is a local natural monopoly. Once one company has
paid the fixed cost to lay the cables in a town, it is uncommon for a second company to pay
the fixed cost as well and enter the local market. In our sample, only ten percent of the towns
have two competing cable companies, and only one percent have three or more companies.
A second important feature of the cable industry is the technological constraint on the
number of channels. Channels are rationed, and consumers have to take as given the program-
4
ming choices of the cable company. This generates substantial variation across towns in the
programming provided. Established channels like CNN are offered in almost all towns. New
channels like Fox News, instead, have to convince local cable companies in order to be added,
often at the expense of other channels being dropped.
Cable companies pay a monthly fee, typically between 10 cents and 40 cents per user, to
the networks that they carry. Cable companies also pay fees to towns that grant them the
right to broadcast. These fees are typically set as part of a 10- to 15-year contract between the
cable company and the town. Finally, cable companies get their revenue from their monthly
subscriber fees. The amount of the subscriber fee is partly regulated and varies between $10
and $60, depending on the cable company and on the tier of service.
Fox News history. Until 1996, the Fox Broadcasting Corporation, a subsidiary of News
Corp., mainly produced national news for local affiliates. In March of 1996, Rupert Murdoch,
CEO of News Corp., announced the introduction of a 24-hour-a-day cable news channel. The
new channel, Fox News Channel, was created to compete with CNN. Prior to the launch
of the Fox News Channel, news broadcasts took up a small share of programming of the
Fox Broadcasting Corporation, which included channels like Fox Sports, Fox Entertainment,
and Fox Family Channel. There was no broadcast news at a national level, and prime time
programming on Fox did not include news. The main television sources for news before 1996
were the three major broadcast networks–ABC, CBS, and NBC–, in addition to CNN,
distributed solely via cable.
The distribution of Fox News started on October 7, 1996 in a limited number of cable
markets. In order to facilitate the spread of the new channel, the Fox Network took the
unusual move to offer a one-time payment of $10 per subscriber to cable companies that
included Fox News in its programming. TCI was one of the first cable companies to sign
a contract with Fox News and carried the channel already in 1996. After TCI, other cable
companies signed agreements with Fox News. After the initial contract was signed by one
of these companies, the local affiliates of this company decided whether to include Fox News
among the channels transmitted. The timing of the agreement affected the diffusion of Fox
News among the affiliates. By November 2000, AT&T Broadband, which acquired TCI Cable
in February of 1999, offered Fox News in 33 percent of the 1,538 towns served by AT&T
Broadband affiliates (estimate from our sample). Adelphia Communications, instead, had a
late agreement with Fox News. By November 2000 only 6.3 percent of the 1,301 towns in our
sample served by Adelphia affiliates included Fox News in their broadcast.
In addition to the 24-hour cable programming, Fox News distributes short news segments to
local TV stations that are affiliates of Fox Broadcasting. However, the complete programming
of Fox News is only available via cable and, for about 12 million subscribers as of 2000, via
satellite.2
2As of June 2000, 14,458,000 US households subscribe the a satellite service, but 2 million of
5
In the expansion of Fox News, the most relevant year for this study is the year 2000. In our
sample of 24 States, Fox News is present in 20.3 percent of the towns with cable service. Since
the towns reached by Fox News in 2000 were almost twice as large as the remaining towns,
Fox News was potentially available to 31.8 percent of the population of these States.3 Overall,
in 2000 Fox News reached 51 million households (News Corp., 2001).
Fox News content and programming. A key feature of Fox News for the purpose of
this study is the significant differentiation in political coverage relative to CNN and the network
news stations. Groseclose and Milyo (2004) use data on citations of think-tanks between 1998
and 2003 to rank the political orientation of news from different media sources. In particular,
they impute an ADA score for the media source based on the ADA score of the members
of Congress that refer to the same think-tanks.4 Their estimation results assign an imputed
ADA score for Fox News Special Report of 39.7. This score is significantly lower than the score
for any of the other mainstream television media (ABC, CBS, CNN, and NBC), with scores
between 56.0 (CNN NewsNight) and 73.7 (CBS Evening News). The news coverage of Fox
News, therefore, is assigned a more conservative record compared to all the other TV news
channels. Moreover, Fox News coverage is estimated to be to the right of the average US
elected official. The mean score for US House members is 50.
The study by Groseclose and Milyo may, if anything, underestimate the degree of political
differentiation of Fox News. The two Fox News shows with the highest ratings, The O’Reilly
Factor and Hannity & Colmes, are likely more conservative than the Special Report, which
Groseclose and Milyo use to estimate the ADA citations. Fox’s top-rated show, The O’Reilly
Factor, is named after its confrontational anchor, Bill O’Reilly. The show, which has aired
since the beginning of Fox News, now occupies the popular 8pm spot. The show, which hosts
mainly journalists and politicians, deals mostly with political topics. It is not meant to be
unbiased; in fact, every segment of the show begins with a “Talking Points” memo, in which
Bill O’Reilly shares his opinion on a leading news story. The second most popular Fox News
programs is Hannity & Colmes, a talk show hosted by conservative Sean Hannity and liberal
Alan Colmes. The more aggressive Hannity typically prevails over the calmer Colmes. This
show has also been part of the programming of Fox News since 1996 and is aired at 9pm.
Fox News Audience. Mere availability of Fox News via cable is not enough to impact
voting behavior of the potential audience. A necessary condition is that a substantial share
of the audience were watching the Fox News channel by the year 2000. We use survey data
these subscribers do not receive Fox News (Satellite Broadcasting and Communications Association, from
http://www.sbca.com/index.asp).3This measure understates the share of population of the 24 US States with Fox News available via cable
because some of the largest cities (such as New York) are missing from the data set. These cities almost always
have cable systems that offer Fox News, but the offering varies by neghbourhood, making it impossible for us
to classify the whole city.4The ADA score is a measure of political orientation created by Americans for Democratic Action.
6
from the Pew Research Center to document the size and characteristics of the Fox News
viewership in the year 2000. The survey center ran its biennial media survey in June 2000 on a
representative sample of 3,142 respondents. To maximize comparability with the sample used
in this paper, we exclude 276 respondents that state that no cable channel is available in their
town. We also drop 345 observations with missing values for one or more of the variables. In
the survey, respondents are asked, among other questions, whether they “watch or listen to [a
given program] regularly, sometimes, hardly ever, or never”. In Column 1 of Table 1 we report
the answer for the “Fox News CABLE Channel” and for the “Cable News Network (CNN)”.
Overall, 17.7 percent of respondents reported that they listened to Fox News regularly, and
46.8 percent reported that they listened to it at least sometimes. In comparison, 22.8 percent
of respondents claimed to listen to CNN regularly, while 58.7 percent listened to CNN at least
sometimes. By the year 2000, therefore, Fox News had reached a substantial share of the
population, a share only 20 percent lower than that of CNN.
In Table 1, we also present summary statistics on respondent characteristics for the overall
sample (Column 1), for the regular Fox News audience (Column 2), and for the sample of
non-regular viewers (Column 3). The regular Fox News audience is significantly more likely to
watch CNN than its counterpart, probably reflecting a taste for TV news. The two samples
also differ substantially in the education level. The regular Fox News audience is 45 percent
less likely to have a college degree (21.7 vs. 35.5 percent). The regular Fox News audience is
also more likely to be Hispanic (8.5 vs. 6.7 percent) and almost twice as likely to be African
American (14.8 vs. 8.2 percent). There are no large differences in the share of the population
living in urban areas, in age or in gender between the two samples.
Turning to the political variables, the political composition of the two groups is surprisingly
similar. Among the regular Fox News watchers, 33.6 percent self-identify as Republicans, 32.7
percent as Democrats, the omitted group being the self-identified Independent. Among the
rest of the population, the Republican share is slightly lower (30.5), but the numbers are
otherwise comparable. In both groups, 67 percent of respondents report that they turnout
out to the polls. Perhaps surprisingly, therefore, the political composition of the regular Fox
News audience in 2000 does not differ substantially from the composition of the rest of the
population.5
The survey also asks respondents whether they have cable and satellite. Over the whole
sample (Column 1), 73.7 percent of the population reports having cable while only 13.7 percent
reports having access to satellite television. The share with cable is higher for the regular Fox
News audience, while the share with satellite does not vary.
In Column 4, we provide an alternative characterization of the demographic and political
5The share of Republicans in the Fox News audience has increased steadily over time. In the 1998 Pew
Survey, Democrats outnumbered Republicans in the audiance, while the opposite is clearly true in 2002 and
2004. (Hamilton, 2004).
7
determinants of Fox News watching. We run a probit regression of the indicator variable for
watching Fox News regularly on the controls listed in Table 1, and report the marginal effects.
The results confirm the differences in the summary statistics. The two significant determinants
of Fox News watching are low education and African American ethnicity. Republicans are 4.5
percentage points more likely to watch Fox News regularly. A cable subscription increases
the likelihood of watching Fox News by 7.8 percentage points, while a satellite has only a
3.1 percentage (insignificant) effect. Satellite appears to be used more for entertainment than
for access to news. Contamination of the treatment, induced by availability of Fox News via
satellite throughout the country, is likely to be limited.
For comparison purposes, we also present the results of parallel probit regressions to predict
whether the respondents watch CNN regularly (Column 5) and whether they watch nightly
network news (CBS, ABC, NBC) regularly (Column 6). More educated and older respondents
are more likely to watch CNN. Self-reported Democrats are 5.5 percentage points more likely
to be part of the regular CNN audience, as they are to watch the nightly network news.
Additional demographic determinants of the audience for the network news are Hispanic and
black ethnicity, and especially older age. Overall, the demographics predicting a regular CNN
and network audience differ substantially from the ones predicting Fox News audience. The
Fox News audience has a higher share of low-educated, African-American, conservative, and
younger respondents.
3 Data
Cable data. We obtained information on programming and contracts in local cable markets
from the Television and Cable Factbook (Warren, 2001). We use the 2001 edition, which
contains information updated as of November 2000, that is, right until the 2000 elections.
We did not collect information for the 1996 period, since Fox News became available only in
October 1996 and just for a limited number of markets. Each observation is identified by an
account number, a principal community6, a name, and an owner. A cable company serves up
to 100 additional communities in the neighboring region, all listed in the entry. The contract
structure includes the price for Basic Service and the price for Expanded Basic Service 1, 2,
and 3 (when available). Though basic service programming varies from company to company,
the basic service typically includes channels such as C-Span and the ABC Family Channel. In
addition, cable companies are required by law to broadcast local television stations as part of
their basic service. Expanded basic service, when available, typically offers additional channels
such as Comedy Central and Fox Sports for an additional fee over the basic service fee. In our
sample, two thirds of the subscribers purchased expanded basic service when available. Finally,
cable companies sometimes offer a la carte channels for a fee; HBO is a frequent example.
6A principal community is the town where a given local cable company’s business office is located.
8
Since no electronic version of the cable data exists for the year 2000, we collected the
most relevant information from a paper copy. We restricted the collection to the 24 states for
which we were able to collect town-level election data (Appendix Table 1). For all principal
communities in these States, we collected information on communities served, company name,
cable owner, number of subscribers, and price for each tier of contract. For each cable account,
we collected information on whether CNN and Fox News were included in the cable package
and, if so, as part of which contract (Basic or Expanded Basic). Finally, we estimated the total
number of channels (excluding the local TV channels) offered by the cable company7. Using
this information, we created a data set on cable offering for 15,640 local communities in 24 out
of the 50 States. Column 1 in Appendix Table 1 shows how programming varied across states in
the year 2000. The states with information on the largest number of communities are California
(1,086), Michigan (1,306), New York (1,430), Ohio (1,726), and especially Pennsylvania (2,624).
Election data. We collected voting data in the general elections for Presidential, US
House, and US Senate races in all the US States which made the data available. For the year
2000 we mostly used data from the Federal Election Project (Lublin and Voss, 2001). For the
year 1988, we used data from the Record of American Democracy (ROAD) project (King et
al., 1997). For most of the other years, and specifically for 1996, we obtained the information
directly from the Election Division of the Secretary of State of each state8. An additional
source of Presidential voting data for the years 1992 and 1996 is the Atlas Election data (Leip,
2004).
Since the information on cable is available at the town level, we have generated a data set
of voting information at the town level. The data collection differs depending on the type of
voting data provided by the states. A first group of states–California, Connecticut, Maine,
Massachusetts, New Hampshire, New York, Rhode Island, and Vermont–directly provides
voting information at the town level, which we employ. A second group of states–Minnesota,
Michigan, Montana, Pennsylvania–provides precinct-level voting information with an indica-
tion of the town to which each precinct belongs; in this case, we just aggregated the voting
information to the town level. Finally, a third group of states–Alaska, Alabama, Arkansas,
Iowa, Idaho, Missouri, Ohio, South Carolina, Tennessee, Utah, Virginia, and Wisconsin–only
has precinct-level voting information, with precinct names that usually include the name of the
town. Examples of precinct names are ”02 - Concord Elem School” and ”Hot Springs Retire-
ment Hm”. For these states, we recover the town name from the precinct name by elimination
7In order to save coding time, the total number of channels is estimated using the number of lines in the
cable book devoted to the channels in the Basic and Expanded Basic 1, 2, and 3 Services. We then obtain the
estimated number of channels by multiplying this number by 2.6, a conversion rate estimated on a subsample
of 40 cable companies. Over this subsample, a regression of actual number of channels on forecasted number of
channels yields an R2 of .95 and a coefficient of 1.8Mostly this data was available online but, in some cases, we obtained hard copies or electronic files from
the offices.
9
of numbers and commonly used words, such as ”School” and ”Church”9. Twenty-four US
states fall into one of these groups and have voting information available for both years 1996
and 2000. This group of states forms the sample used in this paper. The remaining twenty-six
states either do not have electronic precinct-level or town-level voting information available,
or have numeric precincts with no conversion table to town available from the State.10 This
procedure generates 25,322 distinct localities over the 24 States. Column 3 in Appendix Table
1 shows how voting data varies across the different States. States like Alabama, Arkansas, and
Tennessee have a very large number of localities because often precinct names are incorrectly
identified as a locality by our code. Conversely, the New England states have a small number
of exactly-identified towns because the election data is reported at the town level.
Census data. For the 24 US states for which election and cable data are available, we
collect information on town-level demographics from the 1990 Census and the 2000 Census.
More precisely, we obtain the demographic information at the level of “Place”, including “Re-
mainders of Place”. In order to match the place data with the election and cable data, we
transform the place name using the same code employed for the election and cable data. We
identify 25,663 places from the 2000 Census and 25,019 places from the 1990 Census.
Matched data. The final sample derives from the match of the cable, the election, and
the Census data. The observations are matched by State, County, and Place name. The match
between the cable data and the election data reduces the overall sample to 9,270 localities.
Of these towns, we drop 308 localities that fail to match to the demographics data from both
the 1990 and the 2000 Censuses. We also drop 35 towns for which the cable data does not
report the number of channels. Finally, we drop the 297 towns with cable systems that do
not offer CNN as part of the cable package. In these (few) towns, cable offerings are typically
limited to the re-programming of local cable channels. Their news programming, therefore, is
not comparable to the programming of the other towns.11
The final sample includes 8,630 towns, for which we have complete information on cable
programming, voting behavior, and town-level demographics. Column 2 of Appendix Table
1 shows the distribution of towns across States in the final sample. The states with the
largest number of observations are Pennsylvania (1,778), Michigan (958), and Ohio (941), not
surprisingly, given that they are three of the largest States. Overall, the two regions with the
greatest number of towns in the sample are the Northeast Census region (41.4 percent) and
the Midwest region (42.5 percent). The South (9.5 percent) and the West (6.4 percent) follow.
Figure 1 shows the distribution of observations over the US by county. In the majority of
the 1,275 counties in the sample, no town offers Fox News. This is not surprising given that
Fox News is available in only about 20 percent of towns. Very few counties have Fox News
9The Stata code that translates precinct names into town names is available upon request.10We did not collect voting information when only available through the individual counties.11The results do not vary if we include these towns.
10
available in all towns. The remaining 315 counties, in which a fraction of the towns offers Fox
News, are spread all over the United States.
Column 7 of Appendix Table 1 shows that the town-level data in the final sample covers
approximately 60.7 percent of the total population in the 24 States in our sample. The cor-
responding figure for the voting data is 65.1 percent (Column 8). The coverage rate is lower
than 100 percent for three main reasons: (1) we drop from the sample the largest cities like
New York which have several cable systems spanning different parts of the city, (2) in states
like Missouri, Utah, and Virginia, some of the counties have numeric precinct names that we
cannot match to town, and (3) in states like Arkansas and Alabama the complicated patterns
of precinct names induce a poor match between the election data and the cable and Census
data. The exclusion of large cities or certain counties and the presence of States with a large
non-matching rate should not affect the results, as long as the non-match rate is not correlated
with Fox News and voting data12.
Appendix Table 1 allows us also to compare the characteristics of towns in the final sample
and in the initial sample. The two groups of towns have comparable Fox News availability
(Columns 1 and 2). The initial sample of towns in the voting data has a somewhat higher
Republican vote share in 2000 and 1996 (Columns 3 through 6) because the unmatched towns
are more likely to be small and rural. Overall, the excluded towns in the 24 States are fairly
comparable to the towns in the final sample.
Variables. The main variable of interest from the cable data is the indicator variable
dFOXk,2000. The variable dFOXk,2000 indicates that at least one cable system in town k in year 2000
includes Fox News in either the Basic package or in one of the Expanded Basic packages.
Appendix Table 1 shows the average penetration of Fox News in the original sample of cable
localities (Column 1) and in the final sample (column 2). Overall, 19 percent (20.9 percent) of
the towns offers Fox News in the original (final) sample. In most States, the percentage varies
between 10 percent and 30 percent, indicating substantial within-State variation.
Appendix Table 1 also presents information on the voting data. For each town k in year t
we denote the total number of votes cast in race j (j = Pres., Sen., House) for the Republican
candidate as V R,jk,t . Similarly, we denote the total number of votes cast for the Democratic
candidate as V D,jk,t . We aggregate the total votes cast for other parties into V O,j
k,t . The main
voting variable in the paper is the two-party republican vote share vR,jk,t = V R,jk,t /(V R,j
k,t +V D,jk,t ).
As a robustness check, we also use the all-party republican vote share v0R,jk,t = V R,jk,t /(V R,j
k,t +
V D,jk,t +V O,j
k,t ) and the right-wing vote share v00R,jk,t = (V R,j
k,t +V Ref,jk,t )/(V R,jk,t +V D,j
k,t +V O,jk,t ), where
Ref. denotes the Reform party. All these measures are set to missing if the number of votes
for either the Republican or the Democratic candidate is zero, usually reflecting an incumbent
running unchallenged. Over the final sample, the average two-party Republican vote share is
12Below, we show that the results replicate if we exclude States with low match rate.
11
.561 in the year 2000 (Column 4) and .470 in the year 1996. Since these simple averages weight
equally small and large towns, the average Republican vote share in our sample is higher than
the population-weighted average.
The second main political outcome we consider is voter turnout. Total turnout tjk,t in
town k for year t and race j is the share of the total number of votes in year t and the
population of the town in the same year: tjk,t = V TOT,jk,t /Popk,t. For year 1996, we compute
the town-level population as a linear interpolation between the 1990 and the 2000 levels:
Popk,1996 = Popk,1990 + .6 ∗ (Popk,2000 − Popk,1990) . The average town-level turnout is .579 in
the year 2000 and .550 in the year 1996.13 As an alternative measure of turnout tj0k,t, we use the
log total votes in year t, ln(V TOT,jk,t ). The change in this measure over time can be interpreted
as the percent change in total votes cast.
4 Empirical results
4.1 Summary statistics
Column 1 of Table 2 presents summary statistics on the 8,634 towns in our sample. In the
year 2000, the average cable system included over 29 channels in the Basic and Expanded
Basic programming. The mean total population reached by a cable system is 88,882, with a
median of 27,471. The mean town population in our sample is 10,415 people, with a median
town population of 2,734. The demographic controls from the Census are the share of the
population with some college, the share of college graduates, the share of African Americans
and of Hispanics, the percentage unemployed, and the share of the town that is urban. These
controls are present both in their 2000 value, and in the change in their value between 1990
and 2000. Finally, the political variables are the two-party vote share for Republicans in
Presidential elections (1996 and 2000) and the total turnout in Presidential elections (1996
and 2000).
Columns 2 and 3 show the same statistics for the towns that offered Fox News in their
programming (Column 2) and towns that did not (Column 3). Towns that offer Fox News
have a substantially higher number of channels offered (45.7 versus 24.8). In addition, towns
that offer Fox News have almost twice as large a population, are served by cable channels that
reach three times as many people, and are more likely to be urban. Turning to the voting
data, towns served by Fox News were somewhat more likely to vote Republican in 1996 (48.1
percent versus 46.8 percent), but not in the year 2000 (54.1 percent vs. 53.8 percent). In both
years, turnout is comparable in the two samples.
The overall sample of towns spans 217 congressional districts, out of 435 total in the US.
For each district, we compute the share of towns in the district which offered Fox News in
13See Section 4.5 for a thorough description of the construction of this variable, including the missing values.
12
the cable programming. Out of the 217 districts, 151 districts include towns that offered Fox
News and towns that did not. In our differences-in-differences specification with district fixed
effects, the effect of Fox News is estimated on this subgroup of districts. The median district
in this subsample of 7,412 towns has 20 percent of towns offering Fox News. Columns 4 and
5 of Table 2 provide summary statistics for observations in this subsample for towns with and
without Fox News, respectively. Towns in this subsample are smaller in population but have
comparable political behavior and geographical distribution as in the overall sample14.
We also consider the distribution of Fox News at the finer geographical level of the county.
As above, we compute the share of towns that offer Fox News within each of the 1,275 counties.
Only 315 counties out of 1,275 incorporate both towns that have Fox News and towns that
do not. Figure 1 shows the distribution of these counties. In our empirical specification
with county fixed effects, the effect of Fox News is estimated on this subgroup of counties.
Within these counties, 44.4 percent of towns offer Fox News. Columns 6 and 7 of Table 2
provide summary statistics for observations in this subsample of 3,473 towns, respectively for
the subsample of towns with and without Fox News. Observations in this subsample have
similar population and political data as in the subsample with District variation, and are more
concentrated geographically in the Northeast and less in the South. The population and voting
data is somewhat more similar across towns with and without Fox News than in the original
sample. This reflects the fact that towns with and without Fox News in this subsample are
close geographical neighbors and therefore are more closely matched on observables.
4.2 Selection
The empirical results in this paper rely on comparing towns with Fox News in their program-
ming in year 2000 to towns without Fox News. Since the assignment of towns into these two
groups is not random, we investigate the nature of the selection. We focus in particular on
sorting with respect to electoral outcomes, since this is a concern for a causal interpretation
of our estimates. Fox News may well have expanded first in more Republican areas, since
demand for its services is likely to be higher in these areas. If Republican vote share in 1996
is correlated with changes in vote share between 1996 and 2000, the differences-in-difference
estimates are biased.
To investigate this and other forms of selection, we estimate which town-level variables
predict the availability of Fox News in 2000. In particular, we include the Republican vote
share in presidential elections in 1996 (that is, pre-Fox News), vR,Presk,1996 . We estimate a linear
probability model:
dFOXk,2000 = α+ βvR,Presk,1996 + Γ2000Xk,2000 + Γ00−90Xk,00−90 + ΓCCk,2000 + εk, (1)
14The average town size is smaller because districts having either no towns with Fox News or no towns without
Fox News tend to be either very rural or very urban districts.
13
where Xk,2000 is the set of demographic controls from the 2000 Census, and Xk,2000−1990 is
the set of changes in demographic controls between the 1990 Census and the 2000 Census (see
Table 2). In addition to the demographic variables, we control for features of the cable system
by including Ck,2000, deciles in the number of channels provided and in the number of potential
subscribers.
In Column 1 of Table 3 we present the results of the regression with the set of demographic
controls, but without cable controls (ΓC = 0). The estimated β = .223 implies that a 10
percentage point increase in Republican vote share is associated with a 2.2 percentage points
increase in Fox News penetration. Urban towns and larger towns are more likely to have Fox
News by year 2000. While these demographic variables are significant, they predict a small
share of the variance, with a R2 of .023. In Column 2, we add the non-parametric controls
for potential subscribers in the cable system and for number of channels. The additional
variables are highly significant and raise the R2 to .344. Larger cable systems are much more
likely to offer Fox News. The introduction of the cable controls lowers the coefficient β on the
Republican vote share by more than half. Moreover, conditional on the cable controls, towns
with a declining share of college graduates between 1990 and 2000 were more likely to offer
Fox News by year 2000. This is consistent with the Pew Survey evidence that the regular
Fox News audience is significantly less educated than the rest of the population (Table 1).
However, we also find that a decline in the share of African American is negatively associated
with the probability of offering Fox News, in contrast with the survey evidence.
In Column 3 we add state and congressional district fixed effects to control for some of the
geographic heterogeneity in Fox News penetration. With these additional geographic controls,
specification (1) captures the determinants of within-district Fox News availability. In this
specification, there is no evidence that towns with higher Republican vote share are more
likely to offer Fox News: the estimated β = .0098 is essentially zero. Given the precision
of the estimates, we can reject any substantial effect of pre-existing political composition on
availability of Fox News. Moreover, only 3 of 14 demographic controls are significant at the
5% level. This suggests that, once we control for geographic heterogeneity and size of the cable
system, availability of Fox News in 2000 is essential idiosyncratic. We obtain similar results
when we add county fixed effects in addition to the State and District fixed effects (Column
4).
In Column 5 we replicate the specification in Column 3 with the addition of another political
variable, voter turnout in the 1996 Presidential election.15 As with the case of the Republican
vote share, voter turnout in 1996 is uncorrelated with the availability of Fox News in 2000.
Finally, in Column 6 we add the growth in the Republican vote share in Presidential elections
between 1988 and 1992 to the specification of Column 3. Since town-level data for 1992 is
hard to find, this reduces the sample to 3,065 towns. We find that a 10 percentage point
15The sample is somewhat smaller to insure comparability of the town definition across years; see Section 4.5.
14
growth in the Republican vote share between 1988 and 2002 increases the likelihood of Fox
News availability by 2.5 percentage point, a significant effect.
Overall, we find that the strongest determinant of the availability of Fox News in 2000 is
the presence of a cable system with a large number of channels. Once we control for cable size
and for geographical heterogeneity, the presence of Fox News in 2000 appears to be largely
idiosyncratic. Fox News availability is not systematically related to demographics at the town
level. Further, it is orthogonal to both the Republican vote share and voter turnout in the
1996 Presidential elections. The exception to this pattern is the change in the Republican vote
share in prior elections, which is correlated with future availability of Fox News.
4.3 Presidential elections
The baseline empirical specification is a standard difference-in-difference estimation. We com-
pare towns where Fox News entered the cable market by the year 2000 with towns where Fox
News was not available by the year 2000. We consider the impact of the entry of Fox News
on the change in Republican vote share between 1996 and 2000. This strategy exploits the
timing of the entry of Fox News. By November 1996, Fox News had been launched in only a
few markets, and just one month before the elections. By November 2000, Fox News had an
audience that was smaller but nonetheless comparable to that of CNN. The baseline empirical
specification is
vR,Presk,2000 − vR,Presk,1996 = α+ βFdFOXk,2000 + Γ2000Xk,2000 + Γ00−90Xk,00−90 + ΓCCk,2000 + εk. (2)
This specification controls for the same demographics as in Table 3, that is, town-level de-
mographics from the 2000 Census (Xk,2000), changes in demographics between the 1990 and
the 2000 Census (Xk,00−90), and cable-level controls (Ck,2000). Column 1 in Table 4 presents
the result of specification (2) with only the demographic controls Xk,2000 and Xk,00−90. The
average value of the dependent variable is .0686, indicating an average 6.89 percentage point
increase of vote share for Republicans between the 1996 and the 2000 elections. The estimate
for βF , βF = −.0044, implies that towns with Fox News became (significantly) more Demo-cratic by four tenth of a percentage point relative to towns without Fox News. The change
in vote share for Republicans is more positive in towns with lower population, fewer college
graduates, fewer blacks and Hispanics, and higher unemployment in 2000. The change in vote
share is also positively correlated with increases in the number of Hispanics and decreases in
the number of unemployed workers between 1990 and 2000.
Column 2 presents the results after adding controls for cable size Ck,2000. A higher number
of potential subscribers for cable is strongly negatively correlated with Republican vote shares.
The introduction of these controls renders the coefficient βF on Fox News positive (.001) but
insignificantly different from zero. The point estimate suggests that the introduction of Fox
News increases the Republican vote share by 1 tenth of a percentage point, a very small
15
effect. We then introduce district (Column 3) and district and county fixed effects (Column
4). In these specifications the identification of βF depends on the comparison of neighboring
towns with and without Fox News. This specification controls for unobserved differences in
voting behavior that are common to a geographic area, and that may be correlated with Fox
News availability. In Column 3, the comparison of neighboring towns takes place within a US
House district, a geographical unit inhabited on average by 640,000 people. In Column 4, the
comparison takes place within a county inside a district16, a substantially finer geographical
unit. The estimate of the effect of Fox News remains small and insignificant, -.0006 and +.0015
respectively.
In Columns 5 and 6, we replicate the results of Columns 3 and 4 after adding the change in
Republican vote share between 1988 and 1992 as an additional control. In this specification,
the number of observations is reduced to 3,065, since town-level voting data in 1992 is available
only for a limited sample of states. The point estimates of βF are small and comparable to
the benchmark ones in Columns 3 and 4. Moreover, the coefficient on change in vote share
between 1988 and 1992 is not significant. These finding suggest that, even though Fox News
availability in 2000 is correlated with previous vote share changes (Table 3), this correlation
is unlikely to bias the estimate of the Fox News effect on voting. The null effect of Fox News,
therefore, is robust to the inclusion of past voting trends.
Robustness. In Table 5, we examine the robustness of the results of specification (2)
to a number of alternative assumptions. Throughout, we use the full set of controls as well
as fixed effects for congressional districts, as in Column 3 of Table 417. First, we regress
vote share in 2000, vR,Presk,2000 , on vote share in 1996, vR,Presk,1996 , instead of taking their difference
(Column 1). Then, we consider alternative specifications of the dependent variable to take
into account the role of third parties, that is, Ross Perot in 1996 and, to a lesser extent, Ralph
Nader in 2000. To the extent that towns with Fox News in 2000 are generally more informed
about third party candidates, neglecting third parties could lead to a bias in the estimates.
Therefore, we consider as alternative dependent variables the all-party Republican vote share
v0R,Presk,t = V R,Presk,t /
³V R,Presk,t + V D,Pres
k,t + V O,Presk,t
´(Column 2) and the right-wing-party vote
share v00R,jk,t =³V R,Presk,t + V Ref,Presk,t
´/³V R,Presk,t + V D,Pres
k,t + V O,Presk,t
´(Column 3). Finally, we
trim the top and bottom 1 percent of the dependent variable to examine the potential impact
of outliers (Column 4). In all four cases, the point estimates for βF remain essentially zero.
Next, we consider alternative specifications to measure exposure to Fox News. Exposure
to Fox News is likely to be higher for towns in which Fox News is provided as part of the
Basic cable package, rather than as part of the (more expensive) Expanded package. We add a
16House Districts sometimes cross county borders. In this case, district and county fixed effects compare
towns within the same county and district.17The results are similar if we add fixed effects for county, as in Column 4 of Table 4.
16
dummy for towns with Fox News in the Basic package (Column 5). The estimated coefficient
on this dummy, .0045, is marginally significant. However, given that the baseline coefficient on
Fox News is negative (-.002), the overall effect of exposure to Fox News in the Basic package is
not significantly positive relative to towns with no Fox News. While this specification accounts
for differences in exposure to different packages, it does not account for variation across towns
in subscription rates to cable. To account for this, we compute rk,t, the ratio of the number of
Fox News subscribers to the number of potential subscribers. This ratio is zero for towns that
do not offer Fox News.18 The coefficient on this ratio (Column 6), -.0017, replicates the null
result of the baseline specification.
We also estimate a specification in which observations are weighted by town population
(Column 7) to explore whether the effect differs for larger towns. Finally, we restrict the
sample to the States in which the final sample of towns covers at least 40 percent of the State
population (Column 8)19. This specification addresses the concern that attenuation bias due
to poor matching between electoral and cable data may contribute to the null effect for Fox
News. In both cases, the results of the baseline specification do not change.
Interaction effects. In Table 6, we examine whether the effect of Fox News exposure on
the Republican vote share depends on the geographical area, demographic characteristics of
the town, or the previous vote share. One explanation for our measured zero effect is that Fox
News had differential effects in different areas of the country which net to zero. In Column 1,
we allow the result of Fox News to differ between the four Census regions, New England (the
omitted category), the Midwest, the West, and the South. We do not find any evidence that
the effect of Fox News differs by US region, except for the coefficient on the Midwest that is
marginally significantly negative.
In Column 2 we allow the effect of Fox News to be larger for towns with demographic groups
that watch it more regularly according to the Pew Survey data (Table 1). In particular, the
effect should be larger for towns with more African American and smaller for towns with more
college graduates. We do not find any evidence of a significantly different effect for these
groups.
Finally, in Columns 3 and 4 we allow the effect of Fox News to differ based upon the
Republican vote share in 1996. In particular, in Column 3 we split US States into thirds,
depending on the 1996 Republican vote share in the State. We then examine if the Fox News
effect is larger for swing States and for Republican States, relative to the omitted category of
Democratic States. In Column 4 we do a similar split, except that we divide by congressional
district. The point estimates for the Fox News effect are more positive for close States and
more Republican states, but none of the interactions is close to being significant.
18Since subscription information is missing for some towns, 64 towns drop out from this regression.19The results are the same if we limit the sample to States with town-level electoral data, as opposed to
precinct-level data.
17
Magnitudes. Overall, across the different specifications, the entry of Fox News into a
cable market by the year 2000 does not appear to have increased the Republican vote share in
Presidential elections. The result is precisely estimated and robust to controls and alternative
specifications. We now evaluate the magnitude of these effects on the election outcome. The
benchmark estimates for the Fox News effect on the Republican vote share (Columns 3 and 4
of Table 4) have standard errors of .0015 and .0017. This implies tight confidence intervals for
the effect of Fox News: (-.0036, .0024) in Column 3 and (-.0019,.0049) in Column 4. In the
specification with district fixed effects, therefore, the 95 percent confidence interval allows us
to reject an effect of Fox News on the Republican vote share larger than .24 percentage points.
In the specification with county fixed effects, we can reject an effect larger than .49 percentage
points.
How large are these effects relative to shifts in vote share between 1996 and 2000? The
average change in vote share between 1996 and 2000 for the 8,634 towns in our sample is 6.56
percentage points, with a median change of 6.86 percentage points. The standard deviation of
this same measure is 5.44 percentage points. Therefore, our point estimates of the Fox News
effect represent about 1/50th of a standard deviation. Even if we consider the upper bound
of the 95 percent confidence interval for the effect, the Fox News effect would still be less that
1/10th of a standard deviation, a fairly small effect.
A second way to measure the effect is to compute bounds on the number of votes that Fox
News may have shifted in the 2000 Presidential election. We assume that the treatment effect
estimated here holds for the 26 States for which we do not have data. The highest treatment
effect that is consistent with the data, as we said, is .49 percentage points. In 2000, Fox News
had 51 million household subscribers out of 85 million cable households (News Corp., 2001).
Therefore, about 60 percent of the US population was in a town with Fox News exposure, that
is, was part of the treatment group. The upper bound on the effect of Fox News entry on the
Republican vote share is .6*(.0049)=.003, that is, .3 percentage points, approximately 300,000
votes. We should stress that this is an upper bound of the Fox News effect, since the point
estimates suggest a zero effect.
4.4 House and Senate elections
The baseline specification shows that overall the introduction of Fox News into cable markets
did not significantly affect the propensity of voters to favor the Republican candidate. The
estimates, however, could be biased downward in the (unlikely) event that Fox News selects
into towns that were turning more Democratic. We control for trends with two specifications.
First, we compare Presidential and US House races in the same town. Shifts in town-level
political preferences should affect the two races similarly, so this specification controls for
these shifts. Moreover, since Fox News does not usually cover House races, Fox News should
18
impact mainly the Presidential elections.
Second, we compare Senatorial races that received substantial attention in Fox News to
Senatorial Races that did not. The trends in voting should be similar across the different
races, and the impact of Fox News on voting should be higher for races that are explicitly
discussed.
President vs. House. First, we consider how Fox News affects the Republican vote
share for Presidential election, relative to the Republican vote share for House elections. The
triple-difference specification is:³vR,Presk,2000 − vR,Presk,1996
´−³vR,Housek,2000 − vR,Housek,1996
´= α+ βFd
FOXk,2000 + Γ2000Xk,2000 +
+Γ00−90Xk,00−90 + ΓCCk,2000 + εk. (3)
This specification is equivalent to the baseline specification (2) except that the dependent
variable is the double difference of change in vote share for Presidential and House elections.
Table 7 reports the findings. In Columns 1 and 2, we present the results of estimation of (3)
with the full set of controls and district (Column 1) and county (Column 2) fixed effects. The
point estimates for βF are small and insignificantly different from zero, with standard errors
that are 60-80 percent higher than in the baseline specification. The higher standard errors
depend at least in part upon the smaller sample size, given the lack of availability of US House
election data for some states. In Columns 3 and 4, we obtain similar results after including
a 1988-1992 time trend. In Column 5, we weigh observations by population and obtain a
significant negative effect of Fox News. In Column 6, we do not find a significant effect over
the subsample of States for which our data covers at least 40 percent of the State population.
The effect of Fox News on the Republican vote share is significantly more positive for close
districts and for Republican districts (Column 7), although it is not significantly positive, even
for Republican districts. Finally, we replicate the specification of Column 1 using the all-party
vote share as an alternative dependent variable. We find no effect for Fox News as in the
baseline specification.
Overall, we find little support for a differential effect of Fox News exposure on Presidential
elections, relative to House elections.
Featured Senate Races. Senate races are a middle ground between the national Pres-
idential elections and the local House elections. While most Senate races fail to get national
coverage, some do get national attention. In 2000, the Senate race that by a wide margin got
the most coverage in Fox News was the Hillary Clinton-Rick Lazio race in New York State. The
names of these two candidates got 99 overall mentions in the O’Reilly Factor and the Hannity
& Colmes show in the two months prior to the 2000 elections. All the other Senate candidates
running in the 2000 campaign combined got a total of 73 mentions, with Joe Lieberman, who
19
was typically mentioned because of his Vice-Presidential race, getting a lion share of these
mentions. In addition, the mentions of the race are to a large extent critical of Hillary Clinton,
and supportive of Rick Lazio.20
We examine whether Fox News had a differential effect for the Clinton-Lazio race. We
denote by dNY the indicator variable for the New York Senate races. We then estimate the
specification
vR,Senk,2000 − vR,Presk,1996 = α+ βFdFOXk,2000 + φFd
FOXk,2000 ∗ dNY +
+Γ2000Xk,2000 + Γ00−90Xk,00−90 + ΓCCk,2000 + εk, (4)
where the coefficient φF indicates whether the entry of Fox News has a differential effect for
featured Senate races as compared to non-featured Senate races. Notice that the dependent
variable is the difference of the Senatorial vote share in 2000 and the Presidential vote share in
1996. This specification maximizes sample size: only half of the States with a senatorial race
in 2000 have a senatorial race in 1996, and in particular we do not have Senatorial election
data for New York for years other than 2000.
Table 8 reports the results. The effect of Fox News on non-featured races is essentially
zero, with standard errors of .0020 (Column 1) and .0022 (Column 2). The differential effect
of Fox News on the New York race is positive (.0013 and .0022) but not significant. The point
estimates are small, but given the larger standard errors (.0045 and .0046), we cannot reject a
sizeable effect in New York State of one percentage point. When we introduce as an additional
control the change in the presidential vote share between 1988 and 1992, we lose the New York
State observations, so we cannot identify the effect for the featured races. The effect on the
other races is still not significantly different from zero. In Column 5, we weigh observations by
population and find a significantly positive effect for the New York race. The effect is small
and insignificant for the subset of States with high data coverage (Column 6). We also find
that, in Districts with close races, Fox News exposure has a significantly more positive effect on
Senate races than for Democratic districts (Column 7). Finally, we do not find any significant
effect when we use the all-party vote share as dependent variable (Column 8).
Overall, we find no evidence of an effect of Fox News for featured races. These findings
confirm the null effect of Section 4.3.
4.5 Voter turnout
The main finding in the above Sections is that Fox News entry has no significant impact on the
Republican vote share. However, the absence of an effect of Fox News on the Republican vote
20Two excerpts from the ”O’Reilly Factor” of 10/31/2000: ”Now, I am saying to THE FACTOR viewers, and
everyone else who hears what we have to say on this program, that Mrs. Clinton has trouble with honesty”;
”Mr. Gore does have some honesty issues about campaign finance, but they pale beside the deceit factory the
Clintons have set up”.
20
share could occur for two reasons. First, Fox News entry did not have any effect on average
on political behavior. Second, Fox News entry had a polarizing effect on Republicans and
Democrats alike and it increased the turnout of both parties symmetrically. In this latter case,
Fox News would have affected political behavior, but not the vote share. We use measures of
turnout to test these hypotheses.
The baseline regression for voter turnout is:
tPresk,2000 − tPresk,1996 = α+ βFdFOXk,2000 + Γ2000Xk,2000 + Γ00−90Xk,00−90 + ΓCCk,2000 + εk, (5)
where tPresk,t is the ratio of the total number of votes cast in a town divided by population
in year t. For the analysis of the turnout data, we need to be careful about states in which
the town-level election data is generated from precinct-level data. Since the precinct names
change frequently over time, the precincts aggregated into a town in 2000 could differ from the
precincts that generate the town observation in 1996. While this is unlikely to substantially
affect the estimation of vote share21, it may generate substantial noise in the turnout data.
Therefore, we drop towns in which the number of precincts in 2000 differs by more than 20
percent from the number of precincts in 1996. We also drop towns with turnout lower than 10
percent or larger than 100 percent. The resulting sample includes 7,849 towns.
Table 9 shows the results. The average change in turnout between 1996 and 2000 is of
3.84 percentage points, reflecting a much tighter race in 2000. The estimates in Column 1 and
2 suggest that Fox News did not have any effect on voter turnout. The point estimates for
βF are small and negative (-.0021 and -.0024), with small standard errors (.0021 and .0025).
The addition of a control for changes in turnout over the period 1988-1992 does not affect
the estimates (Columns 3 and 4). We obtain the same null result in weighted regressions
(Column 5) and in regressions on the sample of States with high data coverage (Column 6).
We find that the impact of Fox News is essentially the same in Districts with a close race and
in Republican districts (Column 7). Finally, we also find no significant impact of Fox News
availability on turnout when we use the log of total votes cast in Presidential elections as an
alternative measure of turnout (Column 8).
Overall, Fox News entry into a market appears neither to have mobilized new voters, nor
to have turned voters away from casting ballots.
5 Interpretation
The results in this paper show that one of the most dramatic shifts in media orientation in
the past years has had little or no effect on political outcomes. The entry of Fox News into
local cable markets does not appear to have affected the vote share for Republicans. We fail
21All the results on the Republican vote share replicate in the smaller sample of towns in which the number
of precincts does not vary over time.
21
to detect an effect also for the races to which Fox News programming gave most visibility.
Further, exposure to Fox News has not affected turnout to the polls.
We now evaluate the magnitude of the Fox News effect and put forward possible interpreta-
tions of our empirical findings. The estimated effect of Fox News exposure on Republican vote
share, βF , is essentially zero. The upper bound of the confidence interval, that is, the highest
effect of Fox News that is not rejected by the data, is .0049, half of a percentage point. These
figures, however, do not directly address the effect of media bias. In particular, what share
of Fox News watchers were convinced by Fox News to vote Republican? Clearly, Republican
voters or people that were not watching Fox News could not have been convinced. From an
econometric standpoint, we do a calculation of treatment on the treated using the average
treatment effect.
5.1 Calibration
We consider a population with two types of towns, town F and town N. We denote by µF
the share of towns of type F. In town F Fox News is available in the year 2000 on cable,
while in town N it is not. We denote by r the share of Republican voters and by d the share
Democratic voters before the introduction of Fox News. Consequently, (1− r− d) denotes the
share of non-voters. Following the evidence that the two types of towns have similar political
outcomes in the pre-Fox News period (Section 4.2), we assume that r and d are the same in
towns F and N .
After the nation-wide introduction of Fox News, a fraction e of the town population is
exposed to the new channel. The exposure parameter e is higher in town F than in town
N, that is, eF > eN ≥ 0. We allow exposure eN in town N to be positive because of the
availability of satellite (which broadcasts Fox News) in both towns. We also assume that the
exposure to Fox News in town j is independent of political affiliation. Again, this builds on
the evidence from Section 4.2 that in 2000 the political composition of the Fox News audience
was representative of the overall population.
We assume that Fox News convinces a fraction f of its audience to vote Republican. The
parameter f therefore captures the causal effect of Fox News on voting. This persuasion rate
f applies both to Democratic voters and to non-voters, that is, to a fraction (1− r) of the Fox
News audience ej , where j = F,N . Overall, therefore, the Fox News introduction increases
the fraction of people voting Republican by (1− r) ejf. The two-party vote share vj in town
j, with j = F,N, therefore, equals
vj =r + (1− r) ejf
r + d+ (1− r − d) ejf. (6)
(Notice that turnout increases since Fox News induces a fraction f of the non-voters to vote
Republican.) Using expression (6) for towns F and N , we can now solve for the difference in
22
vote share between town F and town N, vF −vN . This difference corresponds to the estimatedβF in the data. We obtain
vF − vN = (eF − fN) fd
tN tF
where tj ≡ (r + d+ (1− r) ejf) is the turnout in town j. It follows that the fraction of people
convinced f is
f =vF − vNeF − eN
tN tFd
. (7)
Expression (7) is easily interpretable. The numerator of the first term, (vF − vN) , is the
change in Republican vote share due to the availability of Fox News via cable. The larger
is the shift in votes, the higher is the impact of Fox News, f. The denominator, (eF − eN) ,
normalizes the change in the vote share by the differential exposure to Fox News in town F and
N . The larger the difference in exposure, the smaller is the causal effect f for given vote shift
(vF − vN ). Finally, the higher the turnout variables tF and tN and the lower the Democratic
share d, the smaller the pool of people that was not already voting Republican, and therefore
the larger is the impact of Fox News for a given (vF − vN ) / (eF − eN ) .
We can compute the persuading power f of Fox News, provided that we estimate the terms
in expression (7). We evaluate first the political fractions tN, tF, and d. The data from the Pew
survey in Section 4.2 suggest that the regular Fox News audience does not differ in its turnout
rate from the rest of the population, and is only slightly more likely to be Republican. We
therefore assume tF = tN = .579, corresponding to the average turnout rate in the year 2000 in
our sample22. We estimate the percentage of Democratic voters d as the product of the turnout
rate t and the average two-party vote share in 2000 in our sample, that is, .579 ∗ .539 = .312.
This implies tN tF/d = 1.074 and therefore f = 1.074 ∗ (vF − vN) / (eF − eN) .
We estimate the difference in exposure (eF − eN) allowing for a share s of the population
that subscribes to satellite and a share c that subscribes to cable. We assume that no one
subscribes to both, although this hypothesis is immaterial. We also assume that the shares s
and c are the same in town F and in town N, that is, they do not depend on whether Fox News
is included in the cable programming. The exposure rate eN in town N is given by s ∗E [e|s] ,where E [e|s] is the share of people with satellite that watches Fox News. (Cable does notbroadcast Fox News in town N) In town F, the exposure rate is given by s∗E [e|s]+c∗E [e|c] .The difference in exposure rate (eF − eN) , therefore, equals c∗E [e|c] .While we do not observec and E [e|c] directly, we do observe the average exposure e = µF ∗ eF + (1− µF ) ∗ eN =
µF ∗ (s ∗E [e|s] + c ∗E [e|c]) + (1− µF ) ∗ (s ∗ E [e|s]) . It follows that
eF − eN = c ∗ E [e|c] = e− s ∗ E [e|s]µF
. (8)
22The average self-reported turnout in the Pew survey 67 percent, but self-reported turnout is known to
overstate the actual figures.
23
Expression (8) allows us to estimate the difference in exposure eF − eN combining Pew
survey data from June 2000 and audience data. The Pew Survey data provides us with an
estimate of the average Fox News audience e. Table 1 shows that 17.7 percent of the people
surveyed stated that they listened regularly to the Fox News cable channel, and an additional
29.1 percent said that they listened to it sometimes. In order to be conservative, we assume
that only the regular audience is likely to be affected by Fox News, and therefore e = .177.
Also using Table 1, we estimate the average share of population with satellite s to be .137.
We estimate E [e|s] as the average share that watches Fox News regularly among satellitesubscribers, .1834. Finally, audience data (News Corp., 2001) indicate that Fox News in 2000
reached 51m out of 85m cable households, that is, µF = 51/85 = .6. Expression (8) then
implies eF − eN = (.177− .137 ∗ .1834) / (.6) = .253.
Using these figures and the benchmark estimate for (vF − vN) of .0015 (Table 4, Column 4),
we obtain a point estimate for f of 1.074∗(.0015/.253) = .0063, that is, Fox News convinced 0.63
percent of its listeners that were not already voting Republican to do so. We can also compute
an upper bound of the estimates, using the 95 percent confidence interval for (vF − vN) of
.0049 (Table 4, Column 4). This leads to an estimate for f of 1.074 ∗ (.0049/.253) = .0208,
suggesting that Fox News convinced at most 2.08 percent of its listeners.
Robustness. We now assess the robustness of the benchmark calibrations to the set of
assumptions. The calibration is robust to different estimates of the political parameters tN ,
tF , and d. If, for example, we use the population-weighted town averages of t and d, we obtain
t2/d = .494/.436 = 1.133, a very similar ratio to the one in the benchmark calibration. The
ratio tN tF/d is unlikely to differ substantially from 1.
A key element in the calibrations is the measure of selective exposure eF − eN . The most
direct evidence is available regarding the share of Fox News towns µF using aggregate cable
availability data. The estimate µF = 51/85 = .6, if anything, is likely to be biased upward
since it refers to end of year 2000. Using our data for the 24 States, we obtain a lower figure.
Mismeasurement in µF , therefore, leads at most to overstate the effect of Fox News.
Finally, the measurement of e− s ∗E [e|s] is subject to two biases going in opposite direc-tions. This figure could be understated since we estimate e using only the regular Fox News
audience and do not include the ones that listen ”sometimes” to Fox News. For example, if
half of the ”sometimes” audience was counted, the differential exposure eF − eN would equal
(.322− .137 ∗ .330) / (.6) = .461, 80 percent larger than in the baseline calibrations. The figure
e−s∗E [e|s] could instead be overstated if some of the respondents misunderstand the questionto apply also to the local Fox affiliate (despite the wording “Fox News CABLE Channel”). Evi-
dence for this is the fact that 13.4 percent of the respondents without cable or satellite state that
they nevertheless listen to Fox News regularly. Given this, we can compute a lower bound on
differential exposure eF − eN as the difference between the regular Fox News audience for peo-ple with cable and for people without cable. This leads to eF − eN = (.200− .139) /.6 = .102,
24
an estimate that is sixty percent lower than our benchmark calibration. This estimate is a
lower bound for eF − eN since measurement error in the cable ownership variable attenuates
this difference downward. Consistent with the measurement error interpretation, 7.3 percent
of respondents without cable or satellite state that they regularly listen to CNN, a channel
clearly available only via cable.
5.2 Explanations
The above benchmark calibrations indicate that the non-effect of Fox News is not due to
imprecision of the estimates. The benchmark estimates show that Fox News convinced from
0 to 2.08 percent of its viewers, with the point estimate being 0.63 percent. We consider six
explanations for this finding of null effect of media bias upon voting. The first two explanations
suggest that there was no new information provided to Fox-News towns relative to non-Fox-
News towns. That is, there was no natural experiment in exposure to media bias. The next
two explanations maintain that, while there was a natural experiment, exposure to Fox News
had no impact on voter beliefs. Finally, the last two explanations suggest that, despite the
impact of Fox News entry on beliefs, changes in beliefs did not affect voting behavior.
1. Contamination of the Treatment. A first interpretation is that there was substantial
contamination of the Fox News natural experiment. Individuals in towns without the Fox
News cable channel may have had exposure to the same information through satellite, through
the local Fox affiliates, or through visits to houses of neighboring towns. The numerator of
equation (3) implies that the contamination of the treatment is large if a large fraction s is
contaminated and the exposure conditional on contamination E [e|s] is large. Contaminationvia satellite is fairly small, as discussed above, because both s and E [e|s] are relatively small.As for contamination through local TV channels, Fox affiliates offer very limited coverage of
Fox News programming23 and do not include any of the talk shows. Therefore, the conditional
exposure E [e|s] is very small. Finally, given that Americans spend on average about 3 hoursper day watching television, the occasional visits to neighbors in different towns are unlikely
offset the effect of direct exposure (that is, s is very small). Overall, the contamination of the
treatment, which would lead to attenuation of the results, is likely to be limited.
2. No Differential Change in Media Coverage. Another interpretation is that there
was no differential change in information between Fox-News and non-Fox-News towns. This
may have occurred for three reasons. First, Fox News’ programming may have become con-
servative only after the year 2000. There is no evidence pointing in this direction, though.
Since the beginning, Fox News aired its trademark conservative shows and identified itself as
‘Fair and Balanced’ to differentiate itself from the allegedly liberal mainstream media. Sec-
23Fox affiliates typically air no more than 5 minutes of news from the Fox News Cable programming in a
30-minute nightly news program.
25
ond, individuals may have had access to the same conservative information as provided by Fox
News through other media sources, such as radio and local newspapers. This could have made
Fox News entry redundant. However, while other conservative sources of information, such
as Rush Limbaugh’s radio program, were broadly available in 2000, their influence is unlikely
to be comparable to the influence of a television source such as Fox News. In a June 2000
survey (Pew, 2000), 44.2 percent of respondents reported watching at least 30 minutes of news
in television the previous day. This percentage is almost double the percent of respondents
that reported reading a newspaper (24.1) or listening to news on the radio (21.3) for at least
30 minutes the previous day. Third, in response to Fox News entry, the other television media
(CNN, CBS, ABC, and NBC) may have changed their coverage to the point of making it in-
distinguishable from the Fox News coverage. However, Groseclose and Milyo (2004) document
that over the period 1997-2003 Fox News was substantially to the right of the all the other
national television news programs24. Therefore, while Fox News was not the only source of
conservative information in the period 1996-2000, access to Fox News programming was still
the prime source of conservative information for Americans.
3. Selection of the Audience. To the extent that self-selected Fox News viewers were
already Republican voters, we would expect no impact of Fox News introduction on voting.
However, as we discussed above, Republicans are only slightly more likely than Democrats to
be regular Fox News viewers in the year 2000 (Table 1). Selection of the audience does not
explain the results.
4. Rational Filtering. An alternative explanation of the results is that viewers are by and
large rational and able to filter out Fox News’s ideological bias. Therefore, whether they watch
Fox News or read the Nation, they recognize the bias and extract only the true informational
content embedded in the news. A related explanation is that viewers were skeptical of the
information from Fox News because of it was a new source of information, whose credibility
had to be assessed over time. These viewers may have seen Fox News more as a source of
entertainment than as a trustworthy source of news. At first, this theory appears inconsistent
with the finding of large effects of watching Fox News on beliefs from survey data (Kull et al.,
2003). However, the survey results could be explained by selection, given that in 2003 Fox
News viewers were substantially more likely to be Republican (Hamilton, 2004).
5. Confirmatory Bias. Another explanation is that voters are subject to a form of
confirmatory bias (Lord, Ross,and Lepper, 1979). Both Republicans and Democrats confirmed
their prior beliefs. Non-voters reacted to the polarized reporting by confirming their prior that
the existing parties are not worth the effort of voting. This explanation makes the out-of-
sample prediction that Fox News entry should affect campaign contributions, since it bolsters
beliefs of the most committed voters.
24Groseclose and Milyo (2004) evaluate media bias using slightly different years for each media. (Table 3)
The modal period of evaluation is 1997-2003.
26
6. Voting by Identity. A different explanation, consistent with our empirical results and
the results of the Pew survey, is that Fox News impacted people’s beliefs but not their voting
decision. Voting decisions may largely depend upon social identity (Akerlof and Kranton,
2000), may be determined by family background or by early age exposure. This explanation
implies that Fox News exposure may ultimately affect how people vote but the effect would
be discernible empirically only after many years. This identity-based explanation of voting,
however, does not explain why vote shares vary substantially between elections.
Overall, the rational filtering story is the most parsimonious explanation for the results in
the paper. The audience of the new, conservative media channel appears to take the systematic
bias into consideration. An alternative explanation is a form of confirmatory bias, suggesting
that Fox News did not change people’s behavior because it just reinforced their prior beliefs.
In either case, media bias is likely to have a more limited impact on people’s voting behavior
than previously thought, although more evidence is needed on this conclusion.
6 Conclusion
This paper studies the impact of media bias upon voting. We consider one of the most dramatic
changes in the US media in recent years, the sudden expansion of the Fox News cable channel
from 1996 to 2000. We exploit the natural experiment induced by the timing of the entry of
the Fox News channel in cable markets. We estimate the impact of the availability of Fox News
in 2000 on the Republican vote share and on voter turnout.
We find no effect of exposure to Fox News on voting behavior. The effect is precisely
estimated, so the null result is not due to lack of power. A simple calculation using audience
data suggests that exposure to Fox News induced 0 to 2.1 percent of its viewers to start voting
for the Republican party, with our most plausible calculation suggesting an insignificant 0.6
percent effect.
The results are consistent with the view that viewers are sophisticated and take into ac-
count to a large extent the bias of the source of information. Viewers know that Fox news
is conservative and rationally use that knowledge when watching the Fox news programming.
An alternative interpretation is a form of confirmatory bias.
In ongoing research, we consider the impact of Fox News entry on other outcomes, such
as campaign contributions. Whereas Fox News does not appear to affect voting behavior on
average, it may affect the most committed Republican audience to increase campaign contri-
butions. Fox News may also affect the political platform of local elected officials (Stromberg,
2004). We also hope that more evidence on the introduction of other sources of media bias,
such as local papers and radio talk shows, will complement the evidence in this paper.
27
References
[1] Akerlof, George and Rachel Kranton, “Economics and Identity,” Quarterly Journal of
Economics, Vol. 115, pp. 715-753, 2000.
[2] Ansolabehere, Stephen, Erik Snowberg, and James Snyder, ”Television and the Incum-
bency Advantage in U.S. Elections”, mimeo, 2004.
[3] Ansolabehere, Stephen, and Shanto Iyengar, Going negative: How Attack ads shrink and
polarize the electorate. New York: Free Press, 1995.
[4] Baron, David, ”Persistent Media Bias”, mimeo, 2004.
[5] De Marzo, Peter, Dimitri Vayanos, and Jeffrey Zwiebel, ”Persuasion Bias, Social Influence,
and Uni-Dimensional Opinions”, Quarterly Journal of Economics, Vol. 118, pp. 909-968,
2001.
[6] Dyck, Alexander and Luigi Zingales. “The Media and Asset Prices” Working Paper, Har-
vard Business School, 2003.
[7] Gentzkow, Matthew. “Television and Voter Turnout”, mimeo, GSB Chicago, 2004.
[8] George, Lisa and Joel Waldfogel, “Does the New York Times Spread Ignorance and Ap-
athy?”, American Economic Review, forthcoming.
[9] Gerber, Alan S. “Does Campaign Spending Work?” American Behavioral Scientists, vol.
47, pp.541-74, 2004.
[10] Gerber, Alan and Donald Green, ”The Effects of Canvassing, Telephone Calls and Direct
Mail on Voter Turnout: A Field Experiment”, American Political Science Review, pp.
653-663, 2000.
[11] Groseclose, Timothy and Jeff Milyo, ”A Measure of Media Bias”, mimeo, 2004.
[12] Hamilton, James T. All the News That’s Fit to Sell, Princeton: Princeton University
Press, 2004.
[13] Huberman, Gur, and Tomer Regev. “Contagious Speculation and a Cure for Cancer: A
Nonevent that Made Stock Prices Soar”, Journal of Finance, Vol. 56, pp. 387-396, 2001.
[14] Imai, Kosuke. “Do Get-Out-The-Vote Calls Reduce Turnout? The Importance of Statis-
tical Methods for Field Experiments.” American Political Science Review, forthcoming.
[15] King, Gary, Bradley Palmquist, Greg Adams, Micah Altman, Kenneth Benoit, Claudine
Gay, Jeffrey B. Lewis, Russ Mayer, and Eric Reinhardt. “The Record of American Democ-
racy, 1984-1990,” Harvard University, Cambridge, MA, Ann Arbor, MI: ICPSR, 1997.
28
[16] Kull, Steven; Clay Ramsay; Stefan Subias; Evan Lewis; Phillip Warf. Misperceptions, The
Media, And The Iraq War. The PIPA/Knowledge Networks Poll, 2003.
[17] Lazarsfeld, Paul, Bernard Berelson, and Hazel Gaudet, The People’s Choice, Duell, Sloan
& Pearce, New York, 1944.
[18] Leip, David. Dave Leip’s Atlas of U.S. Presidential Elections.
http://www.uselectionatlas.org, 2004.
[19] Levitt, Steve. ”Using Repeat Challengers to Estimate the Effect of Campaign spending
on Election Outcomes in the U.S. House”, Journal of Political Economy, Vol. 102, pp.
777-798, 1994.
[20] Lord, C. G., L. Ross, and M. R. Lepper, “Biased Assimilation and Attitude Polariza-
tion: The Effects of Prior Theories on Subsequently Considered Evidence,” Journal of
Personality and Social Psychology, Vol. 37, 2098—2109, 1979.
[21] David Lublin and D. Stephen Voss. 2001. ”Federal Elections Project.” American Univer-
sity, Washington, DC and the University of Kentucky, Lexington, KY.
[22] Mullainathan, Sendhil, and Andrei Shleifer. ”The Market for News”, American Economic
Review, forthcoming.
[23] News Corp., Annual Report 2000, 2001.
[24] Pew Report, ”News Audiences Increasingly Politicized”, April 2004.
[25] Prat, Andrea and Stromberg, David. ”State Television and Voter Information”, mimeo,
2004.
[26] Puglisi, Riccardo. ”Being the New York Times: the Political Behavior of a Newspaper”,
mimeo, 2004.
[27] Stromberg, David, ”Mass Media Competition, Political Competition, and Public Policy”,
Review of Economic Studies, Vol. 71, pp. 265-284, 2004.
[28] Warren, Albert, Television and Cable Factbook 2001, Warren Communication News Edi-
tor, 2001.
[29] Zaller, John, ”The Myth of Massive Media Impact Revived.” in Political Persuasion and
Attitude Change, Diana C. Mutz, Richard A. Brody, and Paul M. Sniderman Editors,
1996, University of Michigan Press.
29
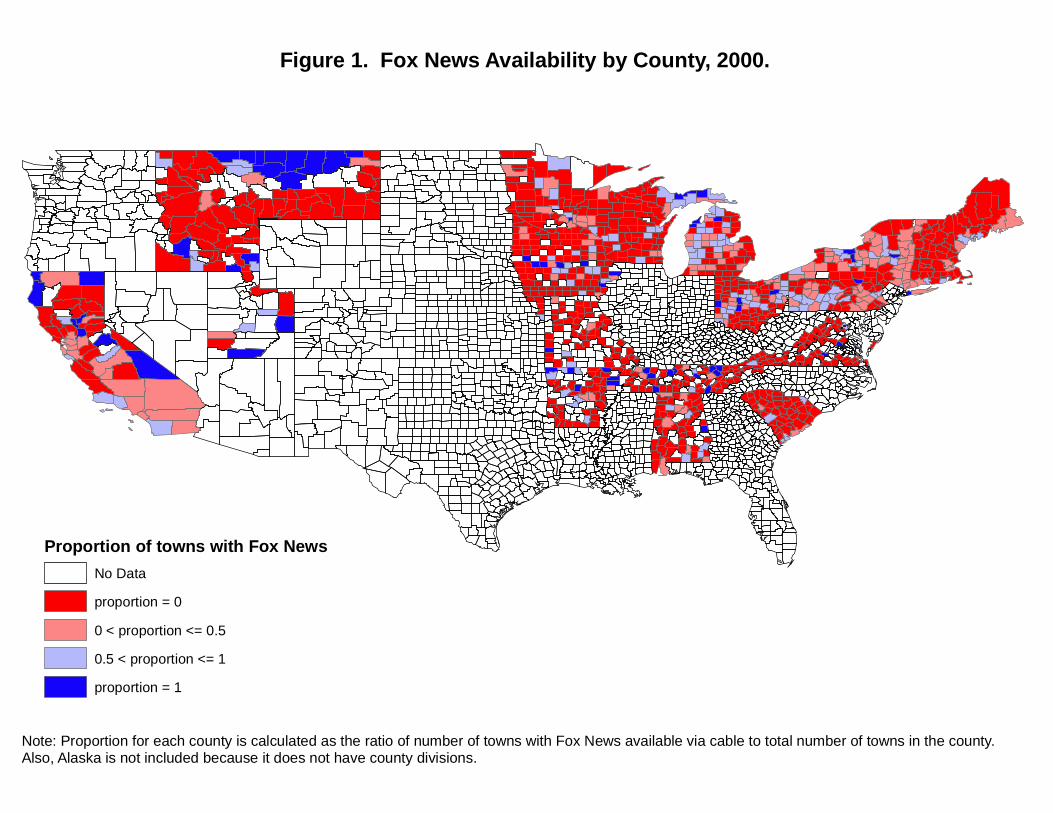
Proportion of towns with Fox NewsNo Dataproportion = 00 < proportion <= 0.50.5 < proportion <= 1proportion = 1
Figure 1. Fox News Availability by County, 2000.
Note: Proportion for each county is calculated as the ratio of number of towns with Fox News available via cable to total number of towns in the county. Also, Alaska is not included because it does not have county divisions.
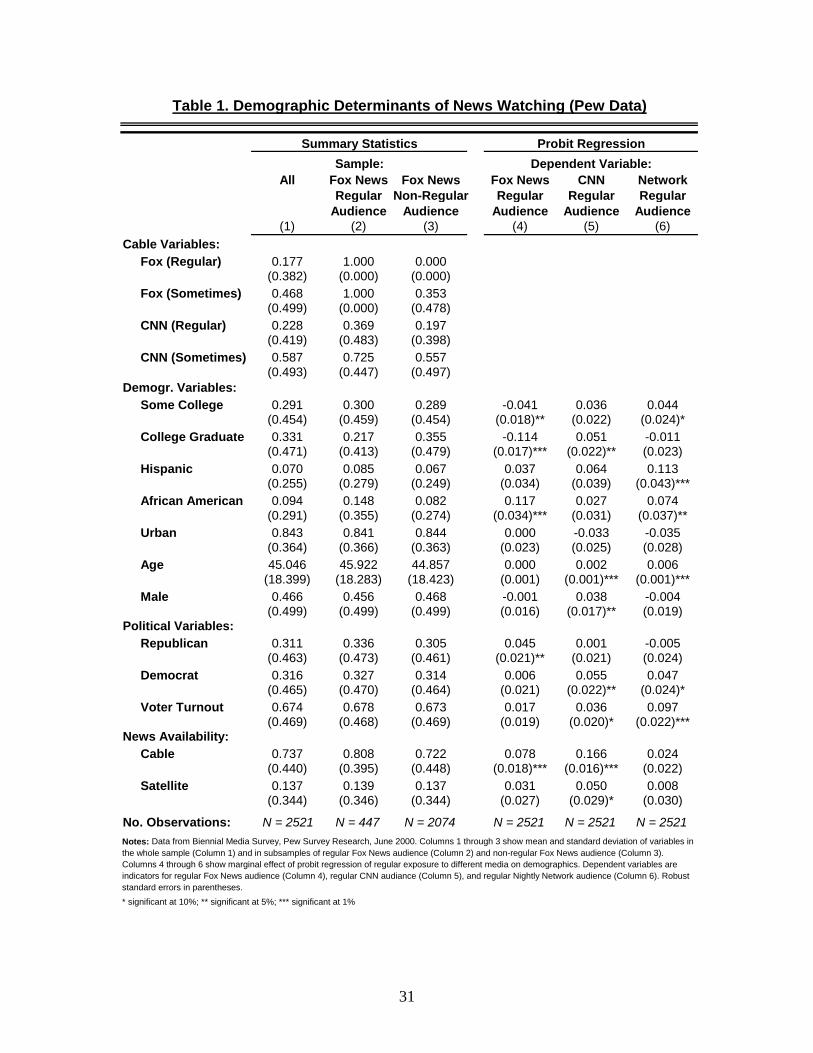
31
All Fox News Fox News Fox News CNN NetworkRegular Non-Regular Regular Regular Regular
Audience Audience Audience Audience Audience(1) (2) (3) (4) (5) (6)
Fox (Regular) 0.177 1.000 0.000(0.382) (0.000) (0.000)
Fox (Sometimes) 0.468 1.000 0.353(0.499) (0.000) (0.478)
CNN (Regular) 0.228 0.369 0.197(0.419) (0.483) (0.398)
CNN (Sometimes) 0.587 0.725 0.557(0.493) (0.447) (0.497)
Some College 0.291 0.300 0.289 -0.041 0.036 0.044(0.454) (0.459) (0.454) (0.018)** (0.022) (0.024)*
College Graduate 0.331 0.217 0.355 -0.114 0.051 -0.011(0.471) (0.413) (0.479) (0.017)*** (0.022)** (0.023)
Hispanic 0.070 0.085 0.067 0.037 0.064 0.113(0.255) (0.279) (0.249) (0.034) (0.039) (0.043)***
African American 0.094 0.148 0.082 0.117 0.027 0.074(0.291) (0.355) (0.274) (0.034)*** (0.031) (0.037)**
Urban 0.843 0.841 0.844 0.000 -0.033 -0.035(0.364) (0.366) (0.363) (0.023) (0.025) (0.028)
Age 45.046 45.922 44.857 0.000 0.002 0.006(18.399) (18.283) (18.423) (0.001) (0.001)*** (0.001)***
Male 0.466 0.456 0.468 -0.001 0.038 -0.004(0.499) (0.499) (0.499) (0.016) (0.017)** (0.019)
Republican 0.311 0.336 0.305 0.045 0.001 -0.005(0.463) (0.473) (0.461) (0.021)** (0.021) (0.024)
Democrat 0.316 0.327 0.314 0.006 0.055 0.047(0.465) (0.470) (0.464) (0.021) (0.022)** (0.024)*
Voter Turnout 0.674 0.678 0.673 0.017 0.036 0.097(0.469) (0.468) (0.469) (0.019) (0.020)* (0.022)***
Cable 0.737 0.808 0.722 0.078 0.166 0.024(0.440) (0.395) (0.448) (0.018)*** (0.016)*** (0.022)
Satellite 0.137 0.139 0.137 0.031 0.050 0.008(0.344) (0.346) (0.344) (0.027) (0.029)* (0.030)
No. Observations: N = 2521 N = 447 N = 2074 N = 2521 N = 2521 N = 2521
Summary Statistics
Table 1. Demographic Determinants of News Watching (Pew Data)
Probit Regression
Notes: Data from Biennial Media Survey, Pew Survey Research, June 2000. Columns 1 through 3 show mean and standard deviation of variables in the whole sample (Column 1) and in subsamples of regular Fox News audience (Column 2) and non-regular Fox News audience (Column 3). Columns 4 through 6 show marginal effect of probit regression of regular exposure to different media on demographics. Dependent variables are indicators for regular Fox News audience (Column 4), regular CNN audiance (Column 5), and regular Nightly Network audience (Column 6). Robust standard errors in parentheses.
Dependent Variable:
* significant at 10%; ** significant at 5%; *** significant at 1%
Cable Variables:
Demogr. Variables:
Sample:
Political Variables:
News Availability:
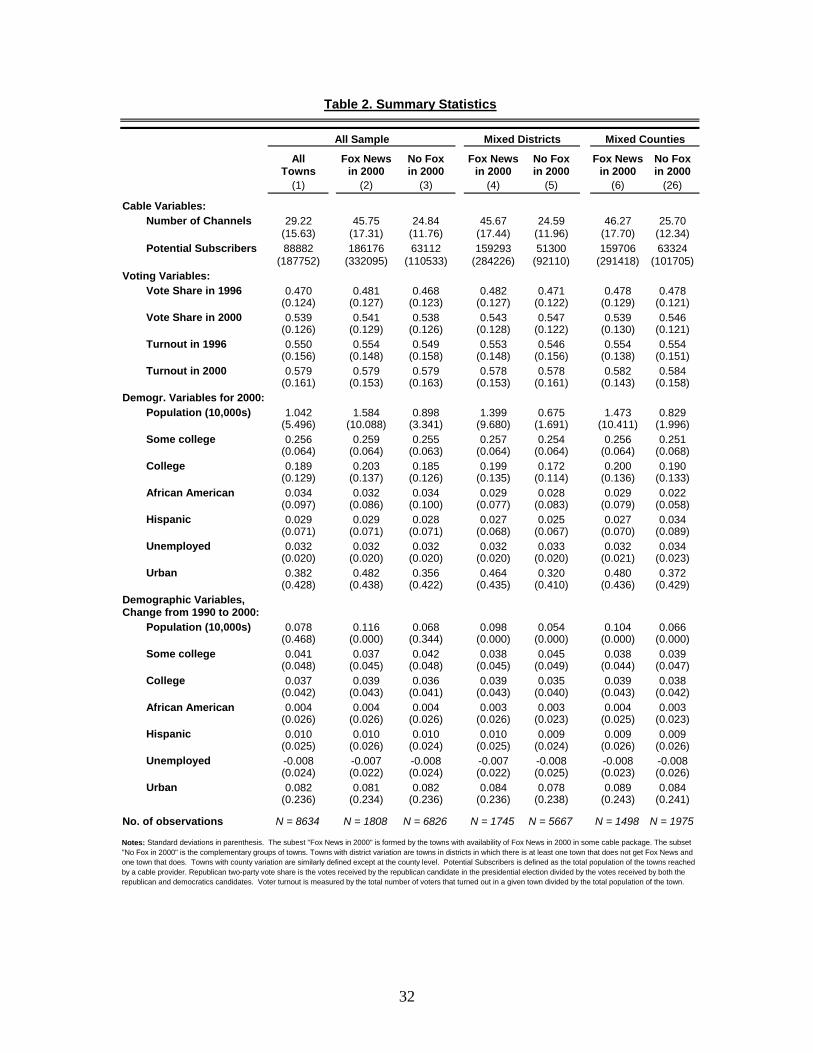
32
All Fox News No Fox Fox News No Fox Fox News No FoxTowns in 2000 in 2000 in 2000 in 2000 in 2000 in 2000
(1) (2) (3) (4) (5) (6) (26)
Number of Channels 29.22 45.75 24.84 45.67 24.59 46.27 25.70(15.63) (17.31) (11.76) (17.44) (11.96) (17.70) (12.34)
Potential Subscribers 88882 186176 63112 159293 51300 159706 63324(187752) (332095) (110533) (284226) (92110) (291418) (101705)
Vote Share in 1996 0.470 0.481 0.468 0.482 0.471 0.478 0.478(0.124) (0.127) (0.123) (0.127) (0.122) (0.129) (0.121)
Vote Share in 2000 0.539 0.541 0.538 0.543 0.547 0.539 0.546(0.126) (0.129) (0.126) (0.128) (0.122) (0.130) (0.121)
Turnout in 1996 0.550 0.554 0.549 0.553 0.546 0.554 0.554(0.156) (0.148) (0.158) (0.148) (0.156) (0.138) (0.151)
Turnout in 2000 0.579 0.579 0.579 0.578 0.578 0.582 0.584(0.161) (0.153) (0.163) (0.153) (0.161) (0.143) (0.158)
Population (10,000s) 1.042 1.584 0.898 1.399 0.675 1.473 0.829(5.496) (10.088) (3.341) (9.680) (1.691) (10.411) (1.996)
Some college 0.256 0.259 0.255 0.257 0.254 0.256 0.251(0.064) (0.064) (0.063) (0.064) (0.064) (0.064) (0.068)
College 0.189 0.203 0.185 0.199 0.172 0.200 0.190(0.129) (0.137) (0.126) (0.135) (0.114) (0.136) (0.133)
African American 0.034 0.032 0.034 0.029 0.028 0.029 0.022(0.097) (0.086) (0.100) (0.077) (0.083) (0.079) (0.058)
Hispanic 0.029 0.029 0.028 0.027 0.025 0.027 0.034(0.071) (0.071) (0.071) (0.068) (0.067) (0.070) (0.089)
Unemployed 0.032 0.032 0.032 0.032 0.033 0.032 0.034(0.020) (0.020) (0.020) (0.020) (0.020) (0.021) (0.023)
Urban 0.382 0.482 0.356 0.464 0.320 0.480 0.372(0.428) (0.438) (0.422) (0.435) (0.410) (0.436) (0.429)
Demographic Variables,
Population (10,000s) 0.078 0.116 0.068 0.098 0.054 0.104 0.066(0.468) (0.000) (0.344) (0.000) (0.000) (0.000) (0.000)
Some college 0.041 0.037 0.042 0.038 0.045 0.038 0.039(0.048) (0.045) (0.048) (0.045) (0.049) (0.044) (0.047)
College 0.037 0.039 0.036 0.039 0.035 0.039 0.038(0.042) (0.043) (0.041) (0.043) (0.040) (0.043) (0.042)
African American 0.004 0.004 0.004 0.003 0.003 0.004 0.003(0.026) (0.026) (0.026) (0.026) (0.023) (0.025) (0.023)
Hispanic 0.010 0.010 0.010 0.010 0.009 0.009 0.009(0.025) (0.026) (0.024) (0.025) (0.024) (0.026) (0.026)
Unemployed -0.008 -0.007 -0.008 -0.007 -0.008 -0.008 -0.008(0.024) (0.022) (0.024) (0.022) (0.025) (0.023) (0.026)
Urban 0.082 0.081 0.082 0.084 0.078 0.089 0.084(0.236) (0.234) (0.236) (0.236) (0.238) (0.243) (0.241)
No. of observations N = 8634 N = 1808 N = 6826 N = 1745 N = 5667 N = 1498 N = 1975
Table 2. Summary Statistics
All Sample Mixed Districts Mixed Counties
Notes: Standard deviations in parenthesis. The subest "Fox News in 2000" is formed by the towns with availability of Fox News in 2000 in some cable package. The subset "No Fox in 2000" is the complementary groups of towns. Towns with district variation are towns in districts in which there is at least one town that does not get Fox News and one town that does. Towns with county variation are similarly defined except at the county level. Potential Subscribers is defined as the total population of the towns reached by a cable provider. Republican two-party vote share is the votes received by the republican candidate in the presidential election divided by the votes received by both the republican and democratics candidates. Voter turnout is measured by the total number of voters that turned out in a given town divided by the total population of the town.
Cable Variables:
Voting Variables:
Demogr. Variables for 2000:
Change from 1990 to 2000:
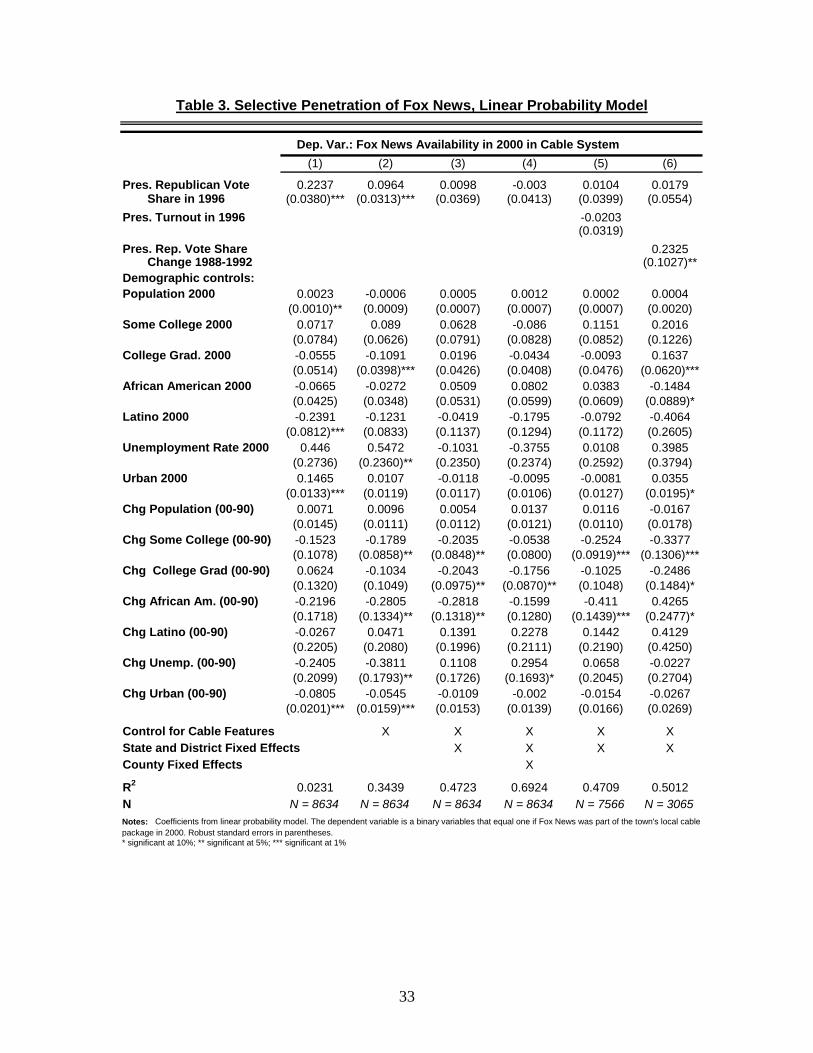
33
Dep. Var.: Fox News Availability in 2000 in Cable System(1) (2) (3) (4) (5) (6)
0.2237 0.0964 0.0098 -0.003 0.0104 0.0179Share in 1996 (0.0380)*** (0.0313)*** (0.0369) (0.0413) (0.0399) (0.0554)
-0.0203(0.0319)
0.2325Change 1988-1992 (0.1027)**
Demographic controls:0.0023 -0.0006 0.0005 0.0012 0.0002 0.0004
(0.0010)** (0.0009) (0.0007) (0.0007) (0.0007) (0.0020)0.0717 0.089 0.0628 -0.086 0.1151 0.2016
(0.0784) (0.0626) (0.0791) (0.0828) (0.0852) (0.1226)-0.0555 -0.1091 0.0196 -0.0434 -0.0093 0.1637(0.0514) (0.0398)*** (0.0426) (0.0408) (0.0476) (0.0620)***-0.0665 -0.0272 0.0509 0.0802 0.0383 -0.1484(0.0425) (0.0348) (0.0531) (0.0599) (0.0609) (0.0889)*-0.2391 -0.1231 -0.0419 -0.1795 -0.0792 -0.4064
(0.0812)*** (0.0833) (0.1137) (0.1294) (0.1172) (0.2605)0.446 0.5472 -0.1031 -0.3755 0.0108 0.3985
(0.2736) (0.2360)** (0.2350) (0.2374) (0.2592) (0.3794)0.1465 0.0107 -0.0118 -0.0095 -0.0081 0.0355
(0.0133)*** (0.0119) (0.0117) (0.0106) (0.0127) (0.0195)*0.0071 0.0096 0.0054 0.0137 0.0116 -0.0167
(0.0145) (0.0111) (0.0112) (0.0121) (0.0110) (0.0178)-0.1523 -0.1789 -0.2035 -0.0538 -0.2524 -0.3377(0.1078) (0.0858)** (0.0848)** (0.0800) (0.0919)*** (0.1306)***0.0624 -0.1034 -0.2043 -0.1756 -0.1025 -0.2486
(0.1320) (0.1049) (0.0975)** (0.0870)** (0.1048) (0.1484)*-0.2196 -0.2805 -0.2818 -0.1599 -0.411 0.4265(0.1718) (0.1334)** (0.1318)** (0.1280) (0.1439)*** (0.2477)*-0.0267 0.0471 0.1391 0.2278 0.1442 0.4129(0.2205) (0.2080) (0.1996) (0.2111) (0.2190) (0.4250)-0.2405 -0.3811 0.1108 0.2954 0.0658 -0.0227(0.2099) (0.1793)** (0.1726) (0.1693)* (0.2045) (0.2704)-0.0805 -0.0545 -0.0109 -0.002 -0.0154 -0.0267
(0.0201)*** (0.0159)*** (0.0153) (0.0139) (0.0166) (0.0269)Control for Cable Features X X X X XState and District Fixed Effects X X X XCounty Fixed Effects X
0.0231 0.3439 0.4723 0.6924 0.4709 0.5012N = 8634 N = 8634 N = 8634 N = 8634 N = 7566 N = 3065
Notes: Coefficients from linear probability model. The dependent variable is a binary variables that equal one if Fox News was part of the town's local cable package in 2000. Robust standard errors in parentheses.* significant at 10%; ** significant at 5%; *** significant at 1%
Pres. Turnout in 1996
Pres. Rep. Vote Share
Chg Unemp. (00-90)
Chg Urban (00-90)
R2
N
Chg Some College (00-90)
Chg College Grad (00-90)
College Grad. 2000
African American 2000
Chg African Am. (00-90)
Chg Latino (00-90)
Latino 2000
Unemployment Rate 2000
Urban 2000
Chg Population (00-90)
Table 3. Selective Penetration of Fox News, Linear Probability Model
Pres. Republican Vote
Population 2000
Some College 2000
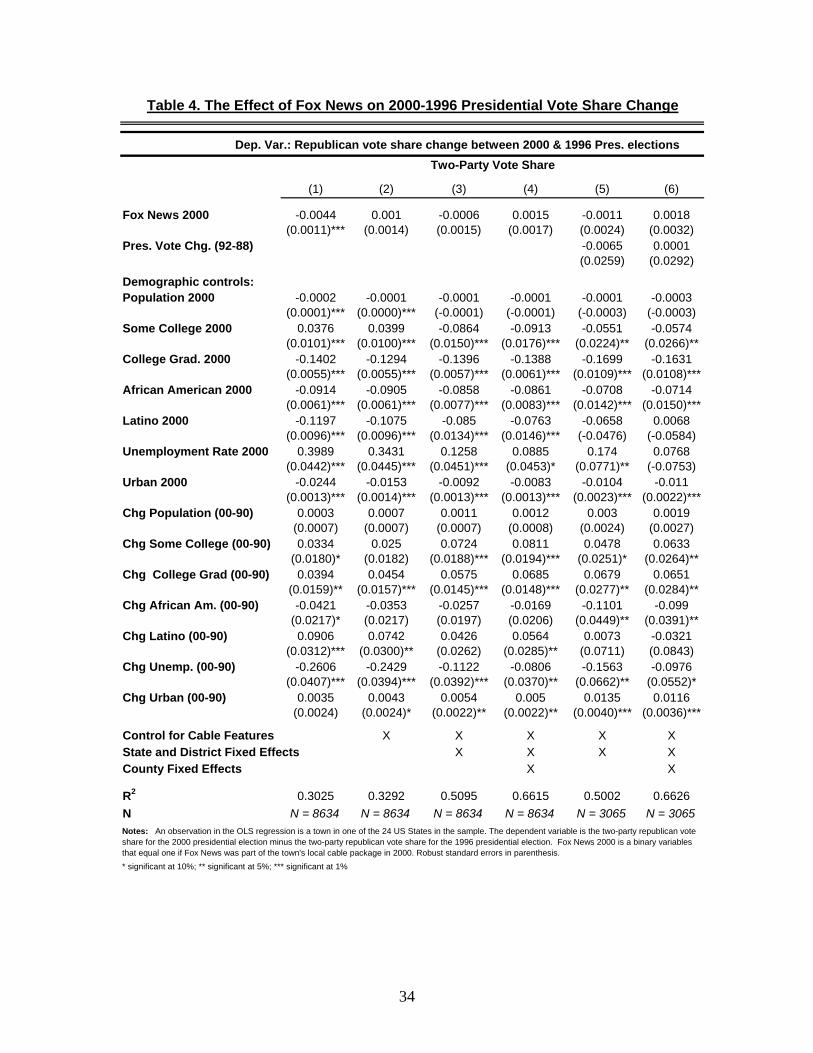
34
Dep. Var.: Republican vote share change between 2000 & 1996 Pres. elections
(1) (2) (3) (4) (5) (6)-0.0044 0.001 -0.0006 0.0015 -0.0011 0.0018
(0.0011)*** (0.0014) (0.0015) (0.0017) (0.0024) (0.0032)-0.0065 0.0001(0.0259) (0.0292)
Demographic controls:-0.0002 -0.0001 -0.0001 -0.0001 -0.0001 -0.0003
(0.0001)*** (0.0000)*** (-0.0001) (-0.0001) (-0.0003) (-0.0003)0.0376 0.0399 -0.0864 -0.0913 -0.0551 -0.0574
(0.0101)*** (0.0100)*** (0.0150)*** (0.0176)*** (0.0224)** (0.0266)**-0.1402 -0.1294 -0.1396 -0.1388 -0.1699 -0.1631
(0.0055)*** (0.0055)*** (0.0057)*** (0.0061)*** (0.0109)*** (0.0108)***-0.0914 -0.0905 -0.0858 -0.0861 -0.0708 -0.0714
(0.0061)*** (0.0061)*** (0.0077)*** (0.0083)*** (0.0142)*** (0.0150)***-0.1197 -0.1075 -0.085 -0.0763 -0.0658 0.0068
(0.0096)*** (0.0096)*** (0.0134)*** (0.0146)*** (-0.0476) (-0.0584)0.3989 0.3431 0.1258 0.0885 0.174 0.0768
(0.0442)*** (0.0445)*** (0.0451)*** (0.0453)* (0.0771)** (-0.0753)-0.0244 -0.0153 -0.0092 -0.0083 -0.0104 -0.011
(0.0013)*** (0.0014)*** (0.0013)*** (0.0013)*** (0.0023)*** (0.0022)***0.0003 0.0007 0.0011 0.0012 0.003 0.0019
(0.0007) (0.0007) (0.0007) (0.0008) (0.0024) (0.0027)0.0334 0.025 0.0724 0.0811 0.0478 0.0633
(0.0180)* (0.0182) (0.0188)*** (0.0194)*** (0.0251)* (0.0264)**0.0394 0.0454 0.0575 0.0685 0.0679 0.0651
(0.0159)** (0.0157)*** (0.0145)*** (0.0148)*** (0.0277)** (0.0284)**-0.0421 -0.0353 -0.0257 -0.0169 -0.1101 -0.099
(0.0217)* (0.0217) (0.0197) (0.0206) (0.0449)** (0.0391)**0.0906 0.0742 0.0426 0.0564 0.0073 -0.0321
(0.0312)*** (0.0300)** (0.0262) (0.0285)** (0.0711) (0.0843)-0.2606 -0.2429 -0.1122 -0.0806 -0.1563 -0.0976
(0.0407)*** (0.0394)*** (0.0392)*** (0.0370)** (0.0662)** (0.0552)*0.0035 0.0043 0.0054 0.005 0.0135 0.0116
(0.0024) (0.0024)* (0.0022)** (0.0022)** (0.0040)*** (0.0036)***Control for Cable Features X X X X XState and District Fixed Effects X X X XCounty Fixed Effects X X
0.3025 0.3292 0.5095 0.6615 0.5002 0.6626N = 8634 N = 8634 N = 8634 N = 8634 N = 3065 N = 3065
Population 2000
African American 2000
Unemployment Rate 2000
Chg Population (00-90)
Some College 2000
College Grad. 2000
Latino 2000
Urban 2000
Two-Party Vote Share
Table 4. The Effect of Fox News on 2000-1996 Presidential Vote Share Change
Fox News 2000
Pres. Vote Chg. (92-88)
Chg Some College (00-90)
Chg College Grad (00-90)
Chg African Am. (00-90)
Chg Latino (00-90)
Chg Unemp. (00-90)
Chg Urban (00-90)
Notes: An observation in the OLS regression is a town in one of the 24 US States in the sample. The dependent variable is the two-party republican vote share for the 2000 presidential election minus the two-party republican vote share for the 1996 presidential election. Fox News 2000 is a binary variables that equal one if Fox News was part of the town's local cable package in 2000. Robust standard errors in parenthesis.* significant at 10%; ** significant at 5%; *** significant at 1%
R2
N
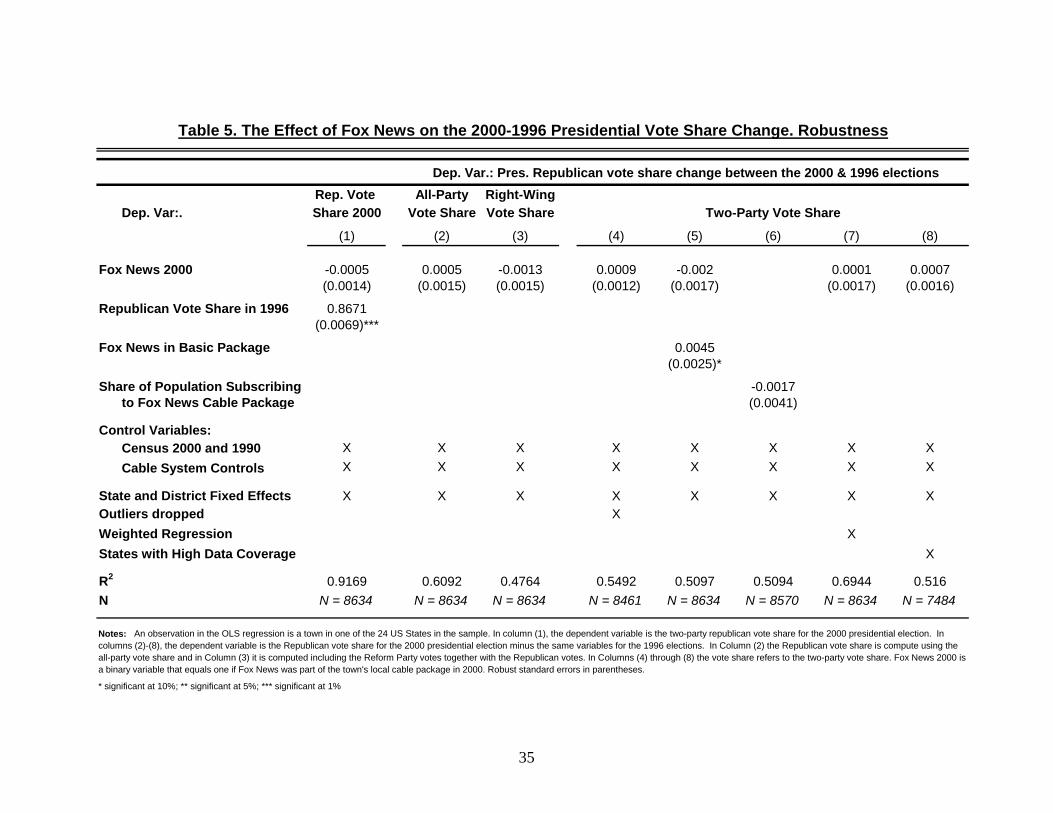
35
Rep. Vote All-Party Right-WingDep. Var:. Share 2000 Vote Share Vote Share
(1) (2) (3) (4) (5) (6) (7) (8)
-0.0005 0.0005 -0.0013 0.0009 -0.002 0.0001 0.0007(0.0014) (0.0015) (0.0015) (0.0012) (0.0017) (0.0017) (0.0016)0.8671
(0.0069)***0.0045
(0.0025)*-0.0017
to Fox News Cable Package (0.0041)
Census 2000 and 1990 X X X X X X X XCable System Controls X X X X X X X X
X X X X X X X XOutliers dropped X
XX
0.9169 0.6092 0.4764 0.5492 0.5097 0.5094 0.6944 0.516N = 8634 N = 8634 N = 8634 N = 8461 N = 8634 N = 8570 N = 8634 N = 7484N
Notes: An observation in the OLS regression is a town in one of the 24 US States in the sample. In column (1), the dependent variable is the two-party republican vote share for the 2000 presidential election. In columns (2)-(8), the dependent variable is the Republican vote share for the 2000 presidential election minus the same variables for the 1996 elections. In Column (2) the Republican vote share is compute using the all-party vote share and in Column (3) it is computed including the Reform Party votes together with the Republican votes. In Columns (4) through (8) the vote share refers to the two-party vote share. Fox News 2000 is a binary variable that equals one if Fox News was part of the town's local cable package in 2000. Robust standard errors in parentheses.* significant at 10%; ** significant at 5%; *** significant at 1%
State and District Fixed Effects
Weighted RegressionStates with High Data CoverageR2
Republican Vote Share in 1996
Fox News in Basic Package
Share of Population Subscribing
Control Variables:
Table 5. The Effect of Fox News on the 2000-1996 Presidential Vote Share Change. Robustness
Dep. Var.: Pres. Republican vote share change between the 2000 & 1996 elections
Two-Party Vote Share
Fox News 2000
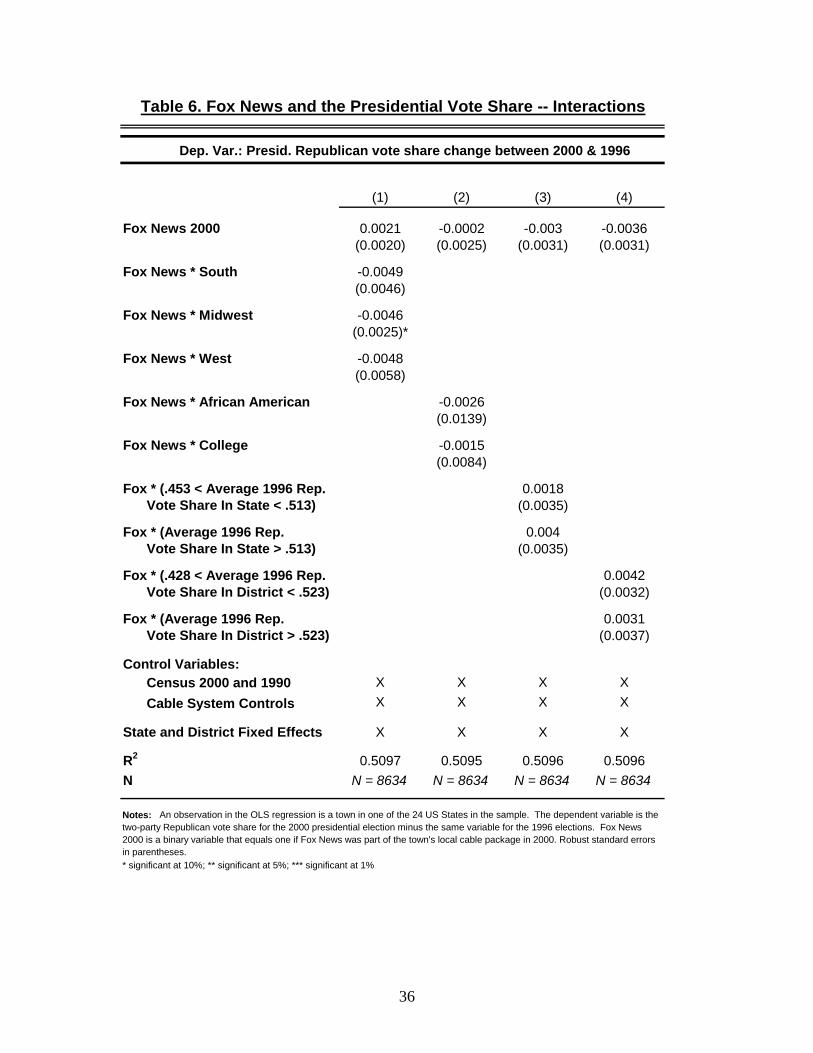
36
(1) (2) (3) (4)0.0021 -0.0002 -0.003 -0.0036
(0.0020) (0.0025) (0.0031) (0.0031)-0.0049(0.0046)-0.0046
(0.0025)*-0.0048(0.0058)
-0.0026(0.0139)-0.0015(0.0084)
0.0018Vote Share In State < .513) (0.0035)
0.004Vote Share In State > .513) (0.0035)
0.0042Vote Share In District < .523) (0.0032)
0.0031Vote Share In District > .523) (0.0037)
Census 2000 and 1990 X X X XCable System Controls X X X X
X X X X0.5097 0.5095 0.5096 0.5096
N = 8634 N = 8634 N = 8634 N = 8634
Fox * (.453 < Average 1996 Rep.
Fox * (.428 < Average 1996 Rep.
Fox * (Average 1996 Rep.
Control Variables:
State and District Fixed Effects
Notes: An observation in the OLS regression is a town in one of the 24 US States in the sample. The dependent variable is the two-party Republican vote share for the 2000 presidential election minus the same variable for the 1996 elections. Fox News 2000 is a binary variable that equals one if Fox News was part of the town's local cable package in 2000. Robust standard errors in parentheses.* significant at 10%; ** significant at 5%; *** significant at 1%
NR2
Fox * (Average 1996 Rep.
Table 6. Fox News and the Presidential Vote Share -- Interactions
Fox News * College
Dep. Var.: Presid. Republican vote share change between 2000 & 1996
Fox News 2000
Fox News * Midwest
Fox News * South
Fox News * West
Fox News * African American
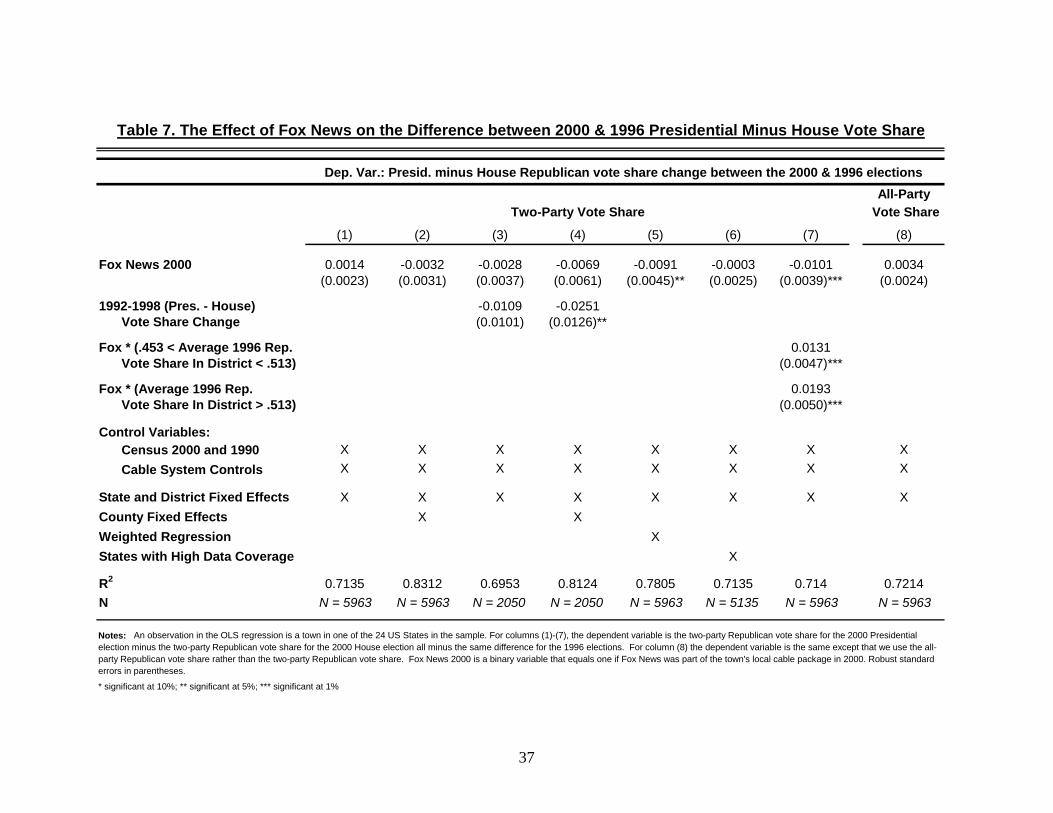
37
All-Party Vote Share
(1) (2) (3) (4) (5) (6) (7) (8)0.0014 -0.0032 -0.0028 -0.0069 -0.0091 -0.0003 -0.0101 0.0034
(0.0023) (0.0031) (0.0037) (0.0061) (0.0045)** (0.0025) (0.0039)*** (0.0024)-0.0109 -0.0251
Vote Share Change (0.0101) (0.0126)**0.0131
Vote Share In District < .513) (0.0047)***0.0193
Vote Share In District > .513) (0.0050)***
Census 2000 and 1990 X X X X X X X XCable System Controls X X X X X X X X
X X X X X X X XX X
XX
0.7135 0.8312 0.6953 0.8124 0.7805 0.7135 0.714 0.7214 N = 5963 N = 5963 N = 2050 N = 2050 N = 5963 N = 5135 N = 5963 N = 5963
Fox News 2000
Fox * (Average 1996 Rep.
Control Variables:
Table 7. The Effect of Fox News on the Difference between 2000 & 1996 Presidential Minus House Vote Share
Dep. Var.: Presid. minus House Republican vote share change between the 2000 & 1996 elections
Two-Party Vote Share
Notes: An observation in the OLS regression is a town in one of the 24 US States in the sample. For columns (1)-(7), the dependent variable is the two-party Republican vote share for the 2000 Presidential election minus the two-party Republican vote share for the 2000 House election all minus the same difference for the 1996 elections. For column (8) the dependent variable is the same except that we use the all-party Republican vote share rather than the two-party Republican vote share. Fox News 2000 is a binary variable that equals one if Fox News was part of the town's local cable package in 2000. Robust standard errors in parentheses.* significant at 10%; ** significant at 5%; *** significant at 1%
1992-1998 (Pres. - House)
Fox * (.453 < Average 1996 Rep.
State and District Fixed EffectsCounty Fixed EffectsWeighted RegressionStates with High Data CoverageR2
N
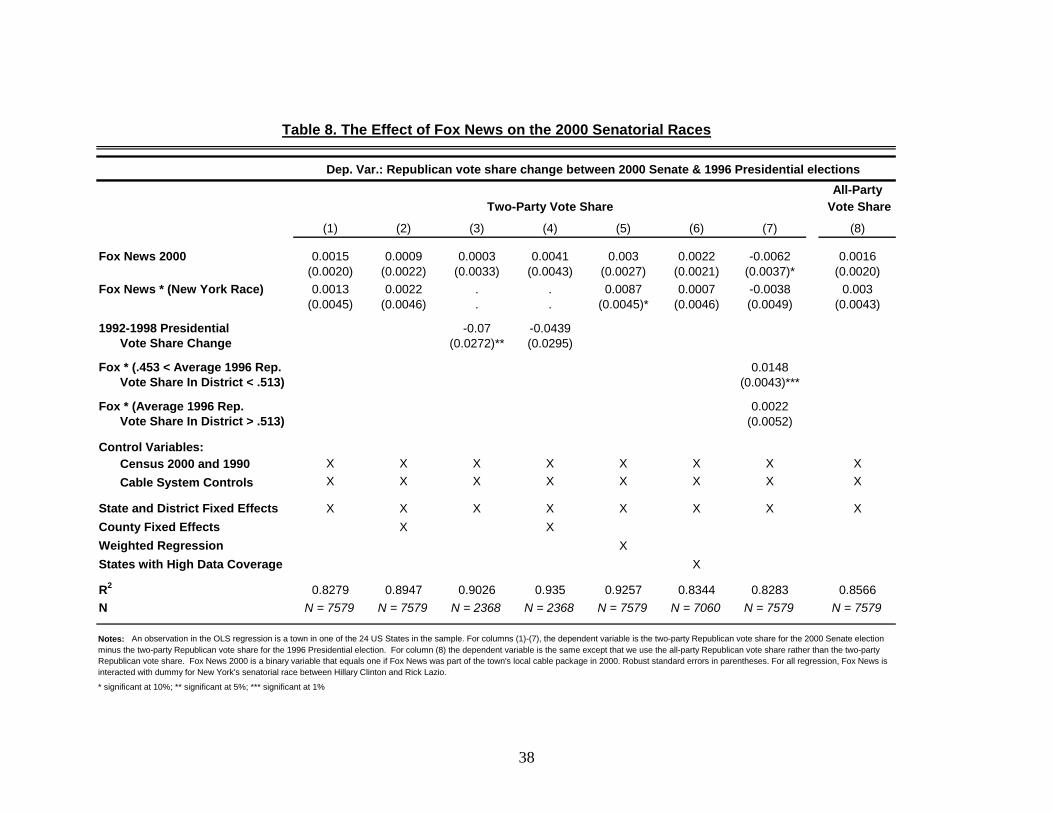
38
All-Party Vote Share
(1) (2) (3) (4) (5) (6) (7) (8)0.0015 0.0009 0.0003 0.0041 0.003 0.0022 -0.0062 0.0016
(0.0020) (0.0022) (0.0033) (0.0043) (0.0027) (0.0021) (0.0037)* (0.0020)0.0013 0.0022 . . 0.0087 0.0007 -0.0038 0.003
(0.0045) (0.0046) . . (0.0045)* (0.0046) (0.0049) (0.0043)-0.07 -0.0439
Vote Share Change (0.0272)** (0.0295)0.0148
Vote Share In District < .513) (0.0043)***0.0022
Vote Share In District > .513) (0.0052)
Census 2000 and 1990 X X X X X X X XCable System Controls X X X X X X X X
X X X X X X X XX X
XX
0.8279 0.8947 0.9026 0.935 0.9257 0.8344 0.8283 0.8566N = 7579 N = 7579 N = 2368 N = 2368 N = 7579 N = 7060 N = 7579 N = 7579
County Fixed Effects
States with High Data Coverage
NR2
Table 8. The Effect of Fox News on the 2000 Senatorial Races
Dep. Var.: Republican vote share change between 2000 Senate & 1996 Presidential elections
Fox * (Average 1996 Rep.
Notes: An observation in the OLS regression is a town in one of the 24 US States in the sample. For columns (1)-(7), the dependent variable is the two-party Republican vote share for the 2000 Senate election minus the two-party Republican vote share for the 1996 Presidential election. For column (8) the dependent variable is the same except that we use the all-party Republican vote share rather than the two-party Republican vote share. Fox News 2000 is a binary variable that equals one if Fox News was part of the town's local cable package in 2000. Robust standard errors in parentheses. For all regression, Fox News is interacted with dummy for New York's senatorial race between Hillary Clinton and Rick Lazio. * significant at 10%; ** significant at 5%; *** significant at 1%
Two-Party Vote Share
Fox News 2000
1992-1998 Presidential
Fox * (.453 < Average 1996 Rep.
Fox News * (New York Race)
Weighted Regression
Control Variables:
State and District Fixed Effects
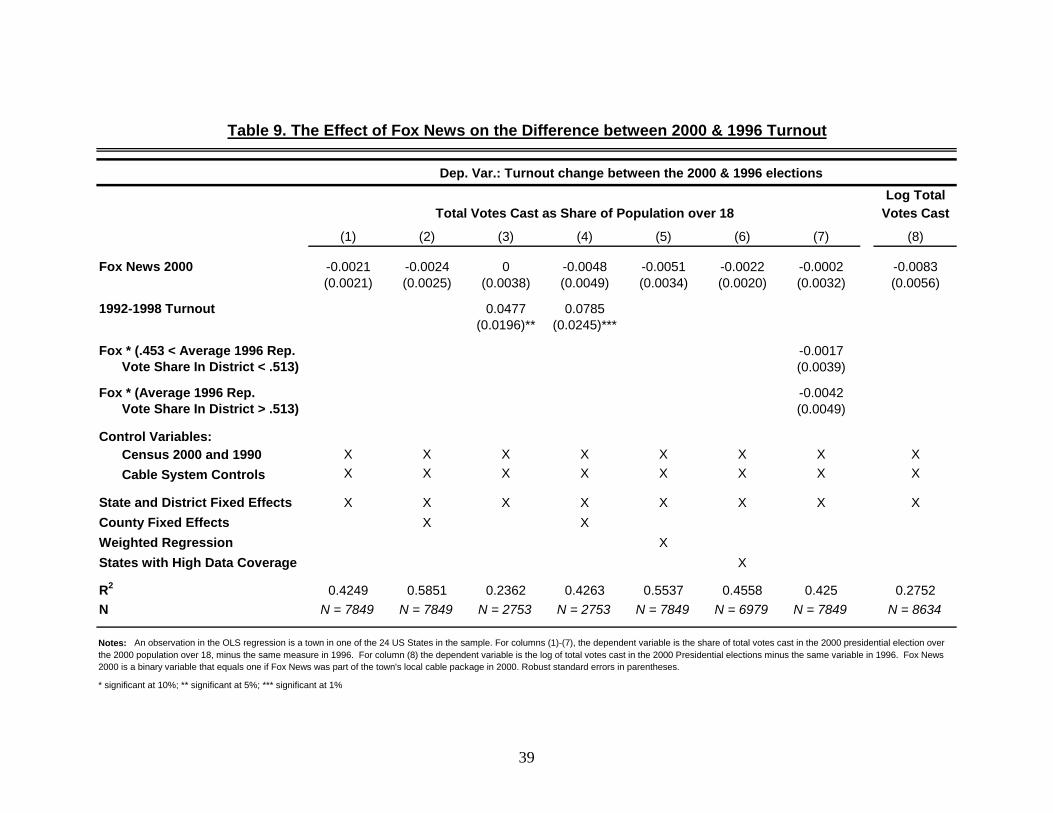
39
Log TotalVotes Cast
(1) (2) (3) (4) (5) (6) (7) (8)-0.0021 -0.0024 0 -0.0048 -0.0051 -0.0022 -0.0002 -0.0083(0.0021) (0.0025) (0.0038) (0.0049) (0.0034) (0.0020) (0.0032) (0.0056)
0.0477 0.0785(0.0196)** (0.0245)***
-0.0017Vote Share In District < .513) (0.0039)
-0.0042Vote Share In District > .513) (0.0049)
Census 2000 and 1990 X X X X X X X XCable System Controls X X X X X X X X
X X X X X X X XX X
XX
0.4249 0.5851 0.2362 0.4263 0.5537 0.4558 0.425 0.2752N = 7849 N = 7849 N = 2753 N = 2753 N = 7849 N = 6979 N = 7849 N = 8634
State and District Fixed Effects
Weighted Regression
N
Notes: An observation in the OLS regression is a town in one of the 24 US States in the sample. For columns (1)-(7), the dependent variable is the share of total votes cast in the 2000 presidential election over the 2000 population over 18, minus the same measure in 1996. For column (8) the dependent variable is the log of total votes cast in the 2000 Presidential elections minus the same variable in 1996. Fox News 2000 is a binary variable that equals one if Fox News was part of the town's local cable package in 2000. Robust standard errors in parentheses.
Fox News 2000
1992-1998 Turnout
Fox * (Average 1996 Rep.
Control Variables:
Fox * (.453 < Average 1996 Rep.
* significant at 10%; ** significant at 5%; *** significant at 1%
County Fixed Effects
States with High Data CoverageR2
Table 9. The Effect of Fox News on the Difference between 2000 & 1996 Turnout
Dep. Var.: Turnout change between the 2000 & 1996 elections
Total Votes Cast as Share of Population over 18
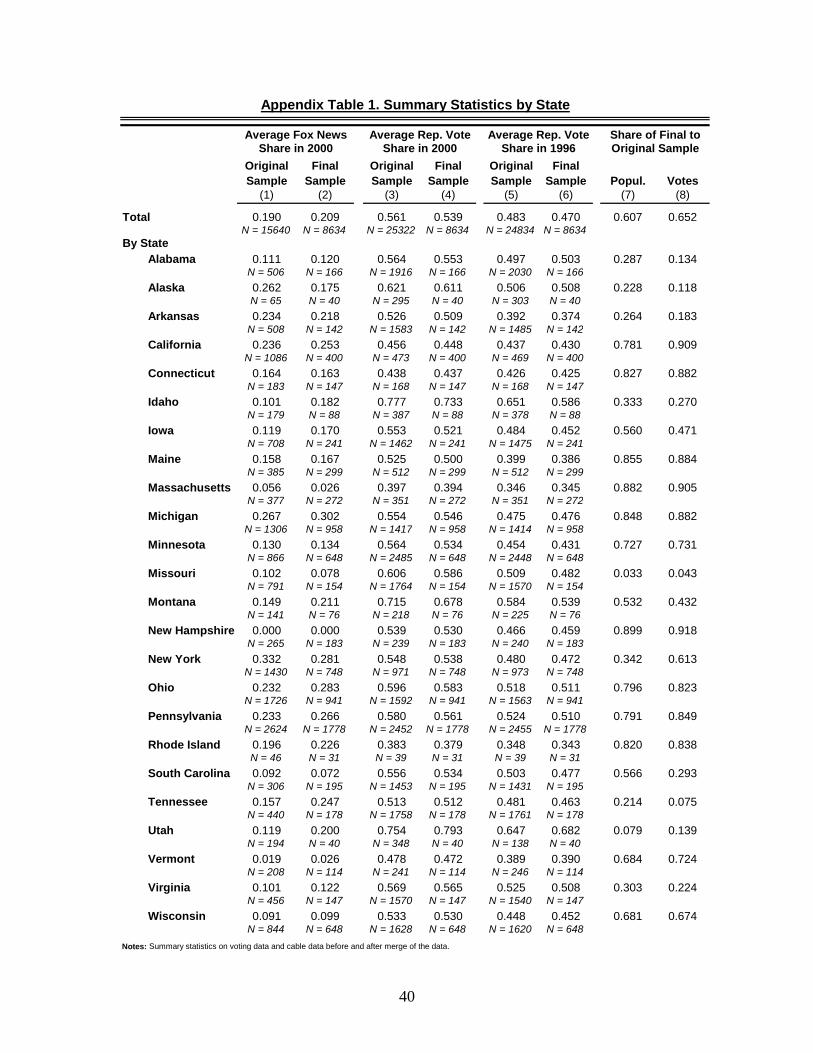
40
Original Final Original Final Original FinalSample Sample Sample Sample Sample Sample Popul. Votes
(1) (2) (3) (4) (5) (6) (7) (8)Total 0.190 0.209 0.561 0.539 0.483 0.470 0.607 0.652
N = 15640 N = 8634 N = 25322 N = 8634 N = 24834 N = 8634
Alabama 0.111 0.120 0.564 0.553 0.497 0.503 0.287 0.134N = 506 N = 166 N = 1916 N = 166 N = 2030 N = 166
Alaska 0.262 0.175 0.621 0.611 0.506 0.508 0.228 0.118N = 65 N = 40 N = 295 N = 40 N = 303 N = 40
Arkansas 0.234 0.218 0.526 0.509 0.392 0.374 0.264 0.183N = 508 N = 142 N = 1583 N = 142 N = 1485 N = 142
California 0.236 0.253 0.456 0.448 0.437 0.430 0.781 0.909N = 1086 N = 400 N = 473 N = 400 N = 469 N = 400
Connecticut 0.164 0.163 0.438 0.437 0.426 0.425 0.827 0.882N = 183 N = 147 N = 168 N = 147 N = 168 N = 147
Idaho 0.101 0.182 0.777 0.733 0.651 0.586 0.333 0.270N = 179 N = 88 N = 387 N = 88 N = 378 N = 88
Iowa 0.119 0.170 0.553 0.521 0.484 0.452 0.560 0.471N = 708 N = 241 N = 1462 N = 241 N = 1475 N = 241
Maine 0.158 0.167 0.525 0.500 0.399 0.386 0.855 0.884N = 385 N = 299 N = 512 N = 299 N = 512 N = 299
Massachusetts 0.056 0.026 0.397 0.394 0.346 0.345 0.882 0.905N = 377 N = 272 N = 351 N = 272 N = 351 N = 272
Michigan 0.267 0.302 0.554 0.546 0.475 0.476 0.848 0.882N = 1306 N = 958 N = 1417 N = 958 N = 1414 N = 958
Minnesota 0.130 0.134 0.564 0.534 0.454 0.431 0.727 0.731N = 866 N = 648 N = 2485 N = 648 N = 2448 N = 648
Missouri 0.102 0.078 0.606 0.586 0.509 0.482 0.033 0.043N = 791 N = 154 N = 1764 N = 154 N = 1570 N = 154
Montana 0.149 0.211 0.715 0.678 0.584 0.539 0.532 0.432N = 141 N = 76 N = 218 N = 76 N = 225 N = 76
New Hampshire 0.000 0.000 0.539 0.530 0.466 0.459 0.899 0.918N = 265 N = 183 N = 239 N = 183 N = 240 N = 183
New York 0.332 0.281 0.548 0.538 0.480 0.472 0.342 0.613N = 1430 N = 748 N = 971 N = 748 N = 973 N = 748
Ohio 0.232 0.283 0.596 0.583 0.518 0.511 0.796 0.823N = 1726 N = 941 N = 1592 N = 941 N = 1563 N = 941
Pennsylvania 0.233 0.266 0.580 0.561 0.524 0.510 0.791 0.849N = 2624 N = 1778 N = 2452 N = 1778 N = 2455 N = 1778
Rhode Island 0.196 0.226 0.383 0.379 0.348 0.343 0.820 0.838N = 46 N = 31 N = 39 N = 31 N = 39 N = 31
South Carolina 0.092 0.072 0.556 0.534 0.503 0.477 0.566 0.293N = 306 N = 195 N = 1453 N = 195 N = 1431 N = 195
Tennessee 0.157 0.247 0.513 0.512 0.481 0.463 0.214 0.075N = 440 N = 178 N = 1758 N = 178 N = 1761 N = 178
Utah 0.119 0.200 0.754 0.793 0.647 0.682 0.079 0.139N = 194 N = 40 N = 348 N = 40 N = 138 N = 40
Vermont 0.019 0.026 0.478 0.472 0.389 0.390 0.684 0.724N = 208 N = 114 N = 241 N = 114 N = 246 N = 114
Virginia 0.101 0.122 0.569 0.565 0.525 0.508 0.303 0.224N = 456 N = 147 N = 1570 N = 147 N = 1540 N = 147
Wisconsin 0.091 0.099 0.533 0.530 0.448 0.452 0.681 0.674N = 844 N = 648 N = 1628 N = 648 N = 1620 N = 648
Appendix Table 1. Summary Statistics by StateAverage Rep. Vote Share of Final to
Notes: Summary statistics on voting data and cable data before and after merge of the data.
Share in 1996 Original Sample
By State
Average Rep. VoteAverage Fox News Share in 2000 Share in 2000