Embed Size (px)
Citation preview

www.Conlumino-winesandspirits.com
The Future of Retailing in Indonesia to 2018 Comprehensive data overview of the market, with retail sales value
and forecasts to 2018
Report Code: RT0180MR
Published: October 2014
Report Price: US$4,950 (Single Copy)
©Conlumino 2014 | This product is licensed and is not to be photocopied or reproduced. 2
The Future of Retailing in Indonesia to 2018
Published: October 2014
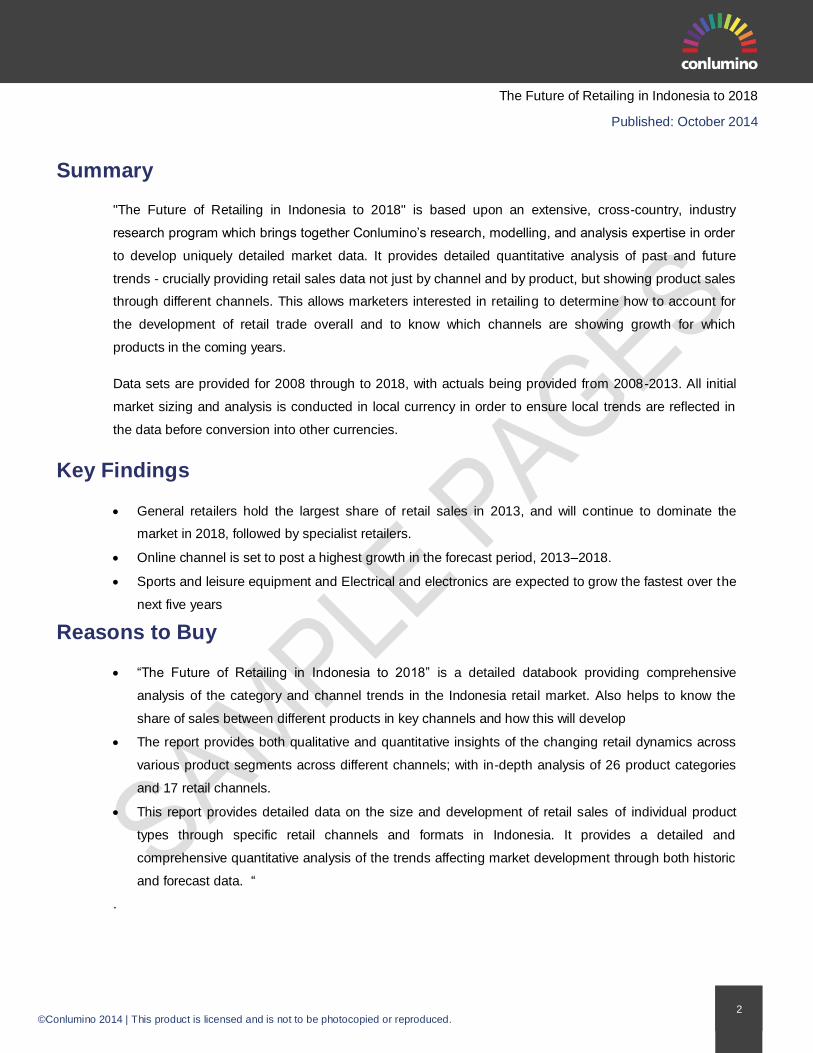
Summary
"The Future of Retailing in Indonesia to 2018" is based upon an extensive, cross-country, industry
research program which brings together Conlumino’s research, modelling, and analysis expertise in order
to develop uniquely detailed market data. It provides detailed quantitative analysis of past and future
trends - crucially providing retail sales data not just by channel and by product, but showing product sales
through different channels. This allows marketers interested in retailing to determine how to account for
the development of retail trade overall and to know which channels are showing growth for which
products in the coming years.
Data sets are provided for 2008 through to 2018, with actuals being provided from 2008-2013. All initial
market sizing and analysis is conducted in local currency in order to ensure local trends are reflected in
the data before conversion into other currencies.
Key Findings
General retailers hold the largest share of retail sales in 2013, and will continue to dominate the
market in 2018, followed by specialist retailers.
Online channel is set to post a highest growth in the forecast period, 2013–2018.
Sports and leisure equipment and Electrical and electronics are expected to grow the fastest over the
next five years
Reasons to Buy
―The Future of Retailing in Indonesia to 2018‖ is a detailed databook providing comprehensive
analysis of the category and channel trends in the Indonesia retail market. Also helps to know the
share of sales between different products in key channels and how this will develop
The report provides both qualitative and quantitative insights of the changing retail dynamics across
various product segments across different channels; with in-depth analysis of 26 product categories
and 17 retail channels.
This report provides detailed data on the size and development of retail sales of individual product
types through specific retail channels and formats in Indonesia. It provides a detailed and
comprehensive quantitative analysis of the trends affecting market development through both historic
and forecast data. ―
.

©Conlumino 2014 | This product is licensed and is not to be photocopied or reproduced. 3
The Future of Retailing in Indonesia to 2018
Published: October 2014
1. Indonesia Retail Sales Overview
This section of the report provides an insight into Indonesian retail sales at channel level. It
considers four key channel groups: online, specialist retailers, general retailers and value retailers.
Data is presented in three ways: at overview level, by breaking down each channel group by the
channels that it is made of, and by breaking down each channel by the category groups that are sold
through it.
1.1 Retail Categories Overview
In 2013, food and grocery was the largest category group accounting for x% of total Indonesian retail
sales, which represented a value of IDRx billion. Food and grocery was the fastest-growing category
group during the review period, registering a CAGR of x% and is expected to remain so during the
forecast period with a CAGR of x%.
Figure 1: Indonesia Overall Retail Sales and Forecast (IDR bn), by Category Group, 2008–2018
Source: Conlumino © Conlumino
x
x
x
x
x
x
x
x
x
x
2008 2009 2010 2011 2012 2013 2014 2015 2016 2017 2018
Belg
ium
Overa
ll R
eta
il S
ale
s a
nd
Fo
recast , B
y C
ate
go
ry G
rou
p, 2
008–
2018
Sports and leisure equipment
Music, video and entertainment software
Books, news and stationery
Furniture and floor coverings
Home and garden products
Electrical and electronics
Apparel, accessories, luggage and leather goods
Food and grocery
©Conlumino 2014 | This product is licensed and is not to be photocopied or reproduced. 4
The Future of Retailing in Indonesia to 2018
Published: October 2014
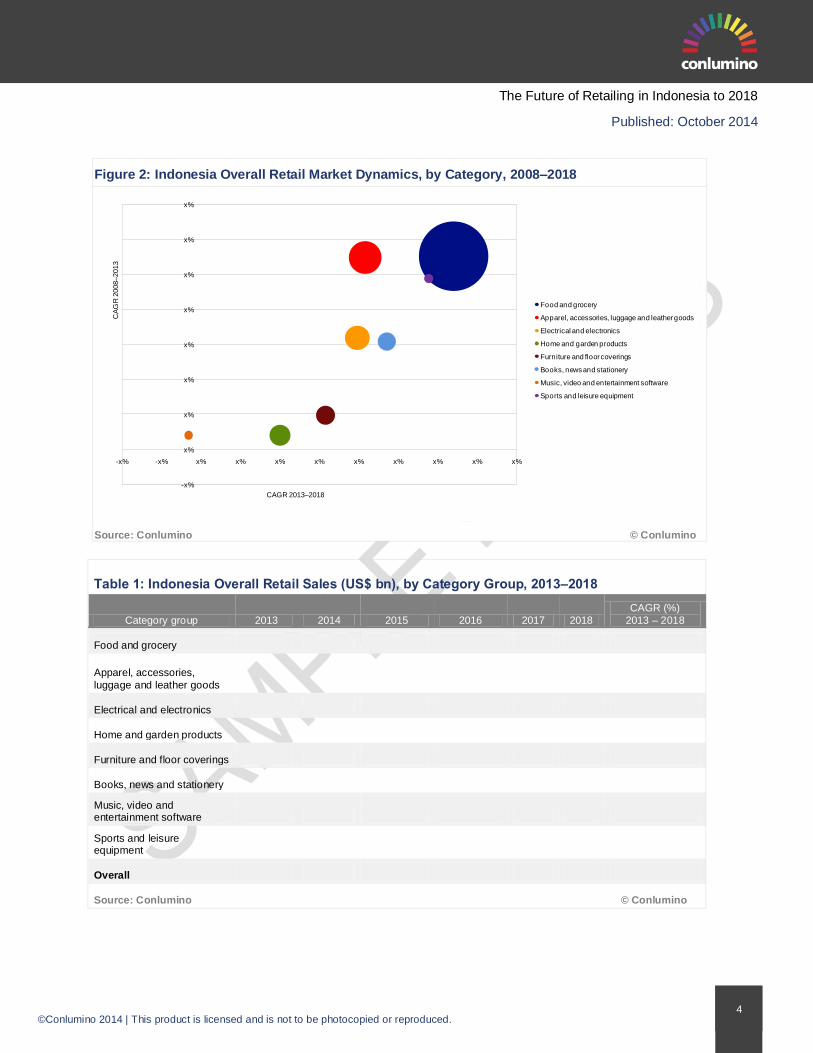
Figure 2: Indonesia Overall Retail Market Dynamics, by Category, 2008–2018
Source: Conlumino © Conlumino
Table 1: Indonesia Overall Retail Sales (US$ bn), by Category Group, 2013–2018
Category group 2013 2014 2015 2016 2017 2018
CAGR (%)
2013 – 2018
Food and grocery
Apparel, accessories,
luggage and leather goods
Electrical and electronics
Home and garden products
Furniture and floor coverings
Books, news and stationery
Music, video and entertainment software
Sports and leisure equipment
Overall
Source: Conlumino © Conlumino
-x%
x%
x%
x%
x%
x%
x%
x%
x%
-x% -x% x% x% x% x% x% x% x% x% x%
CA
GR
2008–2013
CAGR 2013–2018
Food and grocery
Apparel, accessories, luggage and leather goods
Electrical and electronics
Home and garden products
Furniture and floor coverings
Books, news and stationery
Music, video and entertainment software
Sports and leisure equipment

©Conlumino 2014 | This product is licensed and is not to be photocopied or reproduced. 5
The Future of Retailing in Indonesia to 2018
Published: October 2014
2. Category Group Analysis: Apparel, Accessories,
Luggage and Leather Goods
This chapter considers the Indonesian apparel, accessories, luggage and leather goods
category group. Data is presented by breaking down the group by the categories it is made of,
and the channels the category group is sold through.
2.1 Apparel, Accessories, Luggage and Leather Goods Category Overview
2.1.1 Apparel, Accessories, Luggage and Leather Goods by Channel
The apparel, accessories, luggage and leather goods product category, contributed x%
towards total retail sales, in 2013, registering retail sales of IDRx million. The category group is
expected to grow at a pace of x% during the forecast period, and register retail sales of IDRx
million in 2018.
Specialist retailers formed the dominant sales channel, with retail revenues of IDRx million
selling x% of the product category in 2013.
Figure 5: Indonesia Apparel, Accessories, Luggage and Leather Goods Retail Sales and
Forecast (IDR mn), by Channel Group, 2008–2018
Source: Conlumino © Conlumino
xx
xx
xx
xx
xx
xx
xx
xx
xx
xx
2008 2009 2010 2011 2012 2013 2014 2015 2016 2017 2018
Belg
ium
Ap
pare
l, a
ccesso
ries, l
ug
gag
e a
nd
leath
er g
oo
ds
Reta
il S
ale
s
an
d F
ore
cast , B
y C
han
nel G
rou
p, 2
008
–2018
Value retailers
Online retailers
General retailers
Specialist retailers
©Conlumino 2014 | This product is licensed and is not to be photocopied or reproduced. 6
The Future of Retailing in Indonesia to 2018
Published: October 2014
3. Channel Group Analysis: General Retailers
This chapter considers the Indonesian general retailers channel group. Data is presented by
breaking down the group by the channels it is made of, and the category groups that are sold
through the channel.
3.1 General Retailers Overview
3.1.1 General Retailers by Channel
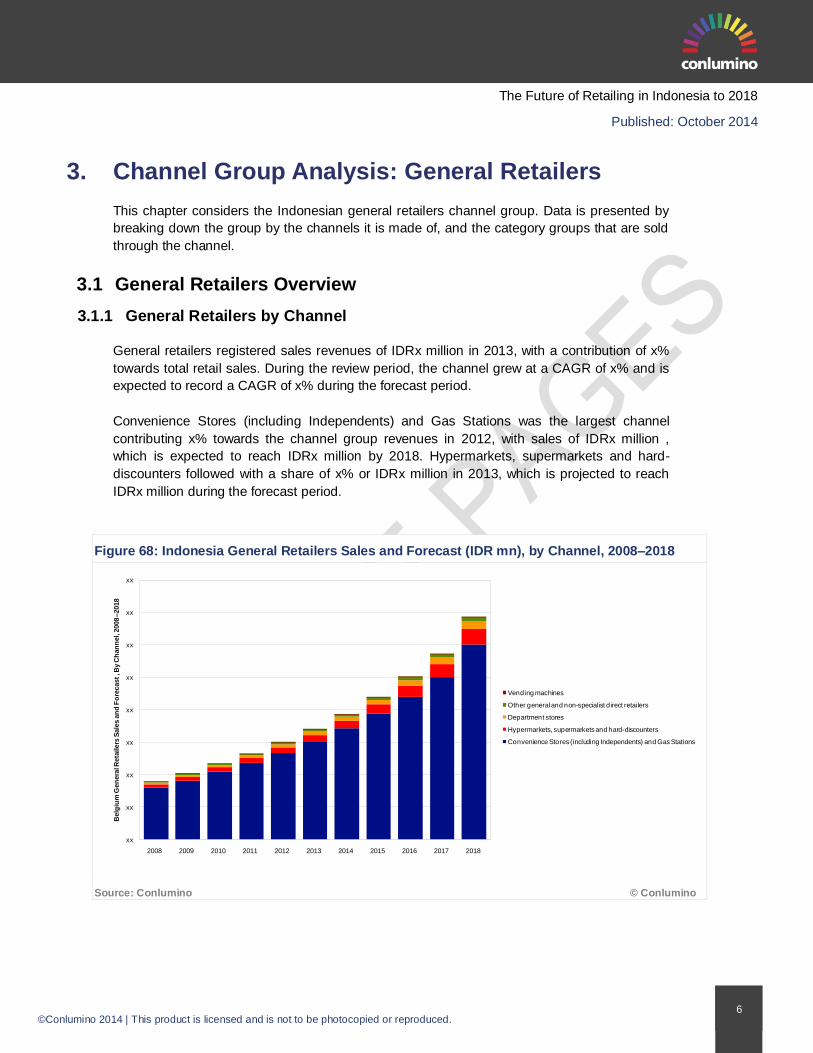
General retailers registered sales revenues of IDRx million in 2013, with a contribution of x%
towards total retail sales. During the review period, the channel grew at a CAGR of x% and is
expected to record a CAGR of x% during the forecast period.
Convenience Stores (including Independents) and Gas Stations was the largest channel
contributing x% towards the channel group revenues in 2012, with sales of IDRx million ,
which is expected to reach IDRx million by 2018. Hypermarkets, supermarkets and hard-
discounters followed with a share of x% or IDRx million in 2013, which is projected to reach
IDRx million during the forecast period.
Figure 68: Indonesia General Retailers Sales and Forecast (IDR mn), by Channel, 2008–2018
Source: Conlumino © Conlumino
xx
xx
xx
xx
xx
xx
xx
xx
xx
2008 2009 2010 2011 2012 2013 2014 2015 2016 2017 2018
Belg
ium
Gen
era
l Reta
ilers
Sale
s a
nd
Fo
recast , B
y C
han
nel, 2
008
–2018
Vending machines
Other general and non-specialist direct retailers
Department stores
Hypermarkets, supermarkets and hard-discounters
Convenience Stores (including Independents) and Gas Stations

©Conlumino 2014 | This product is licensed and is not to be photocopied or reproduced. 7
The Future of Retailing in Indonesia to 2018
Published: October 2014
Figure 69: Indonesia General Retailers Market Dynamics, by Channel, 2008–2018
Source: Conlumino © Conlumino
Table 236: Indonesia General Retailers Sales (IDR mn), by Channel, 2013–2018
Channel group 2013 2014 2015 2016 2017 2018
CAGR (%) 2013 –
2018
Convenience Stores (including
Independents) and Gas Stations
Hypermarkets, supermarkets and
hard-discounters
Department stores
Other general and non-specialist direct retailers
Vending machines
Overall
Source: Conlumino © Conlumino
x%
x%
x%
x%
x%
x%
x%
x%
x%
x%
x% x% x% x% x% x%
CA
GR
2008
–2013
CAGR 2013–2018
Convenience Stores (including Independents) and Gas Stations
Hypermarkets, supermarkets and hard-discounters
Department stores
Other general and non-specialist direct retailers
Vending machines

©Conlumino 2014 | This product is licensed and is not to be photocopied or reproduced. 8
The Future of Retailing in Indonesia to 2018
Published: October 2014
Summary Methodology
Overview
All data in this series of retail reports from Conlumino is rigorously sourced using a comprehensive,
standardized methodology. This methodology ensures that all data is thoroughly researched and cross–
checked against a number of sources and validation processes. At the core of this methodology is a
triangulated market sizing approach, which ensures that results from different sources and approaches,
including Conlumino’s own industry surveys, are compared and a final consensus number between these
inputs is derived. In addition, standardized processes and quality controls across the entire data
collection, analysis and publication process ensure compliance and cross–checking of the data occurs at
each stage of the methodology.
The triangulated market sizing method
The triangulation method ensures that the results from three distinct phases of the research are brought
together and cross–compared before finalized market numbers are derived:
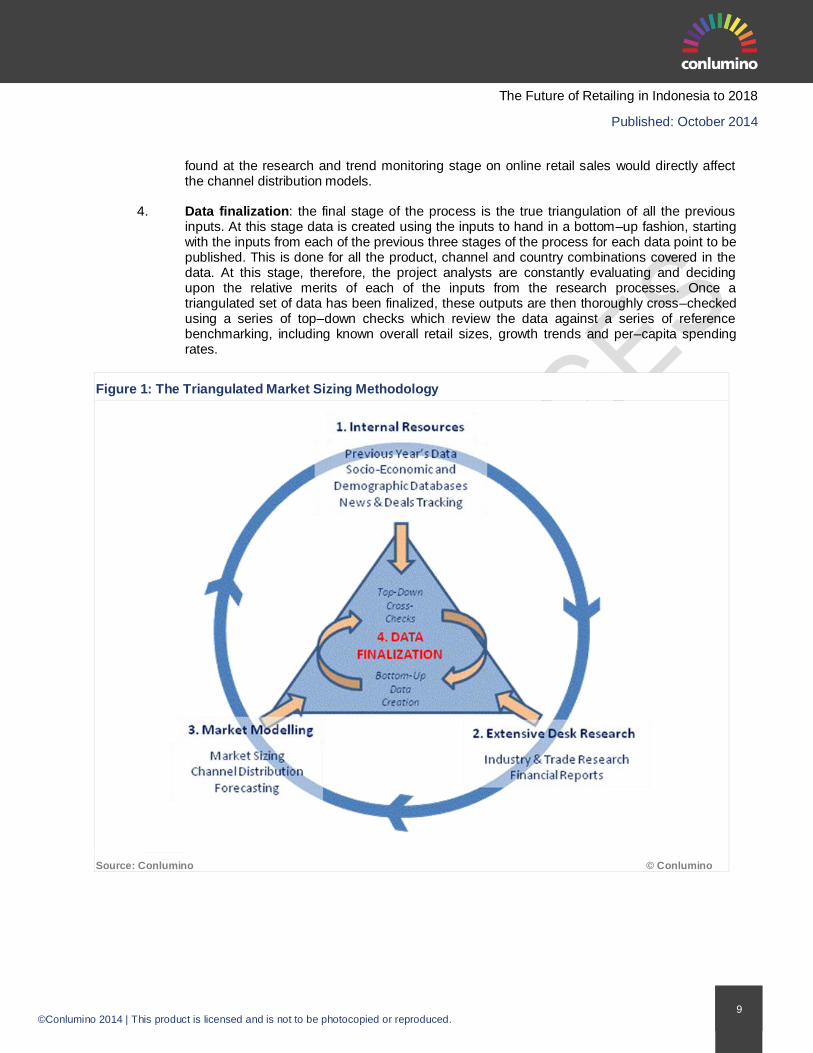
1. Existing internal resources: as retail data is compiled using a rolling annual program of
industry research, the first stage of producing the data is to review the existing internal information, both from the last major data release, as well as that which has been collected on an ongoing basis throughout the year. This includes inputs about market as well as individual retailer performance. These sources are then reviewed and incorporated into data collection processes and databases before the second intensive phase of desk research.
2. Extensive desk research: this phase of the methodology incorporates the main phase of
secondary research. This research is initially conducted across a wealth of information sources, as listed below. In addition, the results of any relevant surveys from other Conlumino projects are also fed into data collection sheets. Online industry surveys can include industry opinion surveys of retailers’ — and their suppliers’ — sentiment and consumer surveys of purchasing and retail behavior. Secondary sources include, but are not limited to, the following:
a. Industry surveys b. Industry and trade association research c. Trade portals d. Company filings and analyst presentations e. Broker and investment analyst reports f. International organizations g. Government statistics h. Retail media i. National Press, including both business and consumer titles
3. Market modeling: the next stage in the process is to feed the results of the above into
market models, which also include drive–based forecasting tools — which analyze drivers such as disposable income, product uptake, macro–economic drivers and market momentum — in order to fill in any gaps in the data and update forecast numbers. At this stage, the market models also look to update channel distribution data sets. For example, information
©Conlumino 2014 | This product is licensed and is not to be photocopied or reproduced. 9
The Future of Retailing in Indonesia to 2018
Published: October 2014
found at the research and trend monitoring stage on online retail sales would directly affect the channel distribution models.
4. Data finalization: the final stage of the process is the true triangulation of all the previous inputs. At this stage data is created using the inputs to hand in a bottom–up fashion, starting with the inputs from each of the previous three stages of the process for each data point to be published. This is done for all the product, channel and country combinations covered in the data. At this stage, therefore, the project analysts are constantly evaluating and deciding upon the relative merits of each of the inputs from the research processes. Once a triangulated set of data has been finalized, these outputs are then thoroughly cross–checked using a series of top–down checks which review the data against a series of reference benchmarking, including known overall retail sizes, growth trends and per–capita spending rates.
Figure 1: The Triangulated Market Sizing Methodology
Source: Conlumino / © Conlumino

©Conlumino 2014 | This product is licensed and is not to be photocopied or reproduced. 10
The Future of Retailing in Indonesia to 2018
Published: October 2014
Industry surveys in the creation of retail market data
Stage 2 of the above process includes using the outputs of Conlumino’s surveys of consumers’ packaged
goods consumption and industry opinion. Every year Conlumino completes a large scale survey, with
over 120,000 responses, covering CPG purchasing and consumption habits in 10 core retail markets
around the globe. This major study, cross-referenced against the primary telephone research of product
market sizes by country, provides outputs against which relevant retail market data, focusing on the
grocery channel and core products in this channel are assessed. It should be noted that overall, this feeds
research into 3 of the 25 product categories covered. In addition, any other suitable surveys conducted by
Conlumino which also provide information on retail markets are mined for information to be put into the
data finalization process.
Quality control and standardized processes
Crucial to the function of the above method is the adoption of strict definitions for all products and
channels, and adherence to a standardized process at each and every stage in the methodology. By
following this approach all data is made cross-comparable across countries to ensure that analysis adds
to the understanding of market dynamics and trends.
The key elements of this approach are:
Strict channel definitions: the definition of each channel is the same in every country;
Strict product definitions: the definition of each product is the same in every country;
Standardized processes:
o Data capture – all data received as part of the research is captured in standardized files and in a
standard format. Any workings that analysts carry out on inputs, for example to correct for
misalignment in category coverage, are also covered in these sheets
o Data creation – all modeling and forecasting approaches are standardized in order to ensure
consistency
o Finalization and verification – systematic methods and approaches are used to finalize data
points
Country by country research structure: all research is conducted country by country in order to
ensure that market data reflect local market trends and contexts
Data checks during “bottom-up” creation: during the data creation and finalization stage analysts
refer back to initial sources and inputs in order to ensure accuracy in the data
Top down data audits and cross-checks: a large series of cross-checks across all the different
dimensions of the final data sets are run in order to identify any outliers or trends that do not fit with
Conlumino’s market understanding, as well as to conduct specific analyses against set proofing
criteria, such as abnormal growth rate changes, verifying data at both the overall and detailed level
against research inputs and checking per capita spends against other analysis of consumers’
spending in a country
Hierarchical review processes: finally, all of the above processes are subject to a hierarchical
review process which ensures that not only the core analysts within a team look at the data, but that
at each stage data is passed through several management layers in order that queries and data
review and sign-off are completed before any final data can be published

©Conlumino 2014 | This product is licensed and is not to be photocopied or reproduced. 11
The Future of Retailing in Indonesia to 2018
Published: October 2014
Related Reports
The Future of Retailing in Slovakia to 2018
The Future of Retailing in the Czech Republic to 2018
The Future of Retailing in Poland to 2018
The Future of Retailing in Malaysia to 2018
The Future of Retailing in Hong Kong to 2018

©Conlumino 2014 | This product is licensed and is not to be photocopied or reproduced. 12
The Future of Retailing in Indonesia to 2018
Published: October 2014
Table of Contents
1. Introduction .................................................................................................. 15
1.1 What is this Report About? ............................................................................. 15
2. Indonesia Retail Sales Overview ............................................................... 16
2.1 Retail Categories Overview ............................................................................ 16
2.2 Retail Channels Overview .............................................................................. 22
3. Category Group Analysis: Apparel, Accessories, Luggage and Leather Goods
26
3.1 Apparel, Accessories, Luggage and Leather Goods Category Overview .......... 26
3.1.1 Apparel, Accessories, Luggage and Leather Goods by Channel ................................... 26
3.1.2 Apparel, Accessories, Luggage and Leather Goods by Category .................................. 30
3.2 Apparel, Accessories, Luggage and Leather Goods Category Analysis ............ 34
3.2.1 Clothing and Footwear .................................................................................................. 34
3.2.2 Jewelry, Watches and Accessories ............................................................................... 37
3.2.3 Luggage and Leather Goods ........................................................................................ 40
4. Category Group Analysis: Books, News and Stationery ....................... 43
4.1 Books, News and Stationery Category Overview ............................................. 43
4.1.1 Books, News and Stationery by Channel ...................................................................... 43
4.1.2 Books, News and Stationery by Category ..................................................................... 47
4.2 Books, News and Stationery Category Analysis .............................................. 51
4.2.1 Printed Media ............................................................................................................... 51
4.2.2 Stationery and Cards .................................................................................................... 54
5. Category Group Analysis: Electrical and Electronics ............................ 57
5.1 Electrical and Electronics Category Overview ................................................. 57
5.1.1 Electrical and Electronics by Channel ........................................................................... 57
5.1.2 Electrical and Electronics by Category .......................................................................... 61
5.2 Electrical and Electronics Category Analysis ................................................... 65
5.2.1 Communications Equipment ......................................................................................... 65
5.2.2 Computer Hardware and Software ................................................................................ 69
5.2.3 Consumer Electronics................................................................................................... 72
5.2.4 Household Appliances .................................................................................................. 75
5.2.5 Photographic Equipment............................................................................................... 78
6. Category Group Analysis: Food and Grocery ......................................... 81
6.1 Food and Grocery Category Overview ............................................................ 81
©Conlumino 2014 | This product is licensed and is not to be photocopied or reproduced. 13
The Future of Retailing in Indonesia to 2018
Published: October 2014
6.1.1 Food and Grocery by Channel ...................................................................................... 81
6.1.2 Food and Grocery by Category ..................................................................................... 85
6.2 Food and Grocery Category Analysis.............................................................. 89
6.2.1 Drinks ........................................................................................................................... 89
6.2.2 Household Products ..................................................................................................... 92
6.2.3 Packaged Food ............................................................................................................ 95
6.2.4 Personal Care .............................................................................................................. 98
6.2.5 Tobacco ..................................................................................................................... 101
6.2.6 Unpackaged Food ...................................................................................................... 104
7. Category Group Analysis: Furniture and Floor Coverings .................. 107
7.1 Furniture and Floor Coverings Category Overview .........................................107
7.1.1 Furniture and Floor Coverings by Channel .................................................................. 107
7.1.2 Furniture and Floor Coverings by Category ................................................................. 111
7.2 Furniture and Floor Coverings Category Analysis ...........................................115
7.2.1 Floor Coverings .......................................................................................................... 115
7.2.2 Furniture ..................................................................................................................... 118
8. Category Group Analysis: Home and Garden Products ...................... 121
8.1 Home and Garden Products Category Overview ............................................121
8.1.1 Home and Garden Products by Channel ..................................................................... 121
8.1.2 Home and Garden Products by Category .................................................................... 125
8.2 Home and Garden Products Category Analysis ..............................................129
8.2.1 Gardening and Outdoor Living .................................................................................... 129
8.2.2 Home Improvement .................................................................................................... 132
8.2.3 Homewares ................................................................................................................ 135
9. Category Group Analysis: Music, Video and Entertainment Software138
9.1 Music, Video and Entertainment Software Category Overview ........................138
9.1.1 Music, Video and Entertainment Software by Channel ................................................ 138
9.1.2 Music, Video and Entertainment Software by Category ............................................... 142
9.2 Music, Video and Entertainment Software Category Analysis .........................146
9.2.1 Games Software ......................................................................................................... 146
9.2.2 Music and Video ......................................................................................................... 149
10. Category Group Analysis: Sports and Leisure Equipment.................. 152
10.1 Sports and Leisure Equipment Category Overview .........................................152
10.1.1 Sports and Leisure Equipment by Channel ................................................................. 152
10.1.2 Sports and Leisure Equipment by Category ................................................................ 156
©Conlumino 2014 | This product is licensed and is not to be photocopied or reproduced. 14
The Future of Retailing in Indonesia to 2018
Published: October 2014
10.2 Sports and Leisure Equipment Category Analysis ..........................................160
10.2.1 Sports Equipment ....................................................................................................... 160
10.2.2 Toys and Games ........................................................................................................ 163
11. Channel Group Analysis: Value Retailers .............................................. 166
11.1 Value Retailers Overview ..............................................................................166
11.1.1 Value Retailers by Channel ........................................................................................ 166
11.1.2 Value Retailers by Category ....................................................................................... 170
11.2 Value Retailers Channel Analysis ..................................................................176
11.2.1 Cash and Carries and Warehouse Club Stores ........................................................... 176
11.2.2 Value, Variety Stores and General Merchandise Retailers .......................................... 182
12. Channel Group Analysis: General Retailers .......................................... 188
12.1 General Retailers Overview ...........................................................................188
12.1.1 General Retailers by Channel ..................................................................................... 188
12.1.2 General Retailers by Category .................................................................................... 192
12.2 General Retailers Channel Analysis ...............................................................198
12.2.1 Convenience Stores (including Independents) and Gas Stations ................................. 198
12.2.2 Department Stores ..................................................................................................... 203
12.2.3 Hypermarkets, Supermarkets and Hard-Discounters ................................................... 208
12.2.4 Vending Machines ...................................................................................................... 213
12.2.5 Other General and Non-Specialist Direct Retailers ...................................................... 219
13. Channel Group Analysis: Specialist Retailers ....................................... 225
13.1 Specialist Retailers Overview ........................................................................225
13.1.1 Specialist Retailers by Channel................................................................................... 225
13.1.2 Specialist Retailers by Category ................................................................................. 232
13.2 Specialist Retailers Channel Analysis ............................................................239
13.2.1 Clothing, Footwear, Accessories and Luxury Goods Specialists .................................. 239
13.2.2 Drug Stores and Health and Beauty Stores ................................................................. 245
13.2.3 Duty Free Retailers ..................................................................................................... 251
13.2.4 Electrical and Electronics Specialists .......................................................................... 257
13.2.5 Food and Drinks Specialists........................................................................................ 263
13.2.6 Home Furniture and Homewares Retailers.................................................................. 269
13.2.7 Home Improvement and Gardening Supplies Retailers ............................................... 275
13.2.8 Music, Video, Book, Stationery and Entertainment Software Specialists ...................... 281
13.2.9 Other Specialist Retailers ........................................................................................... 287
14. Channel Group Analysis: Online Retailing............................................. 293
14.1 Online Retailing Overview .............................................................................293

©Conlumino 2014 | This product is licensed and is not to be photocopied or reproduced. 15
The Future of Retailing in Indonesia to 2018
Published: October 2014
14.1.1 Online Retailing by Category ...................................................................................... 293
15. Appendix ..................................................................................................... 300
15.1 Definitions ....................................................................................................300
15.1.1 This report provides 2013 actual sales; while forecasts are provided for 2013 – 2018.. 300
15.2 Summary Methodology .................................................................................305
15.2.1 Overview .................................................................................................................... 305
15.2.2 The triangulated market sizing method........................................................................ 305
15.2.3 Industry surveys in the creation of retail market data ................................................... 307
15.2.4 Quality control and standardized processes ................................................................ 307
15.3 About Conlumino ..........................................................................................308
15.4 Disclaimer ....................................................................................................308
©Conlumino 2014 | This product is licensed and is not to be photocopied or reproduced. 16
The Future of Retailing in Indonesia to 2018
Published: October 2014
List of Figures
Figure 1: Indonesia Overall Retail Sales and Forecast (IDR bn), by Category Group, 2008–2018 .................................. 16 Figure 2: Indonesia Overall Retail Market Dynamics, by Category, 2008–2018 ................................................................ 17 Figure 3: Indonesia Overall Retail Sales and Forecast (IDR bn), by Channel Group, 2008–2018.................................... 22 Figure 4: Indonesia Overall Retail Market Dynamics, by Channel, 2008–2018 ................................................................. 23 Figure 5: Indonesia Apparel, Accessories, Luggage and Leather Goods Retail Sales and Forecast (IDR mn), by Channel
Group, 2008–2018 ................................................................................................................................................................ 26 Figure 6: Indonesia Apparel, Accessories, Luggage and Leather Goods Retail Market Dynamics, by Channel Group, 2008–
2018 ....................................................................................................................................................................................... 27 Figure 7: Indonesia Apparel, Accessories, Luggage and Leather Goods Retail Sales and Forecast (IDR mn), by Category
2008–2018 ............................................................................................................................................................................. 30 Figure 8: Indonesia Apparel, Accessories, Luggage and Leather Goods Retail Market Dynamics, by Category 2008–2018 31 Figure 9: Indonesia Clothing and Footwear Retail Sales and Forecast (IDR mn), by Channel Group, 2008–2018 ......... 34 Figure 10: Indonesia Jewelry, Watches and Accessories Retail Sales and Forecast (IDR mn), by Channel Group, 2008–2018
............................................................................................................................................................................................... 37 Figure 11: Indonesia Luggage and Leather Goods Retail Sales and Forecast (IDR mn), by Channel Group, 2008–201840 Figure 12: Indonesia Books, News and Stationery Retail Sales and Forecast (IDR mn), by Channel Group, 2008–201843 Figure 13: Indonesia Books, News and Stationery Retail Market Dynamics, by Channel Group, 2008–2018 ................. 44 Figure 14: Indonesia Books, News and Stationery Retail Sales and Forecast (IDR mn), by Category 2008–2018 ......... 47 Figure 15: Indonesia Books, News and Stationery Retail Market Dynamics, by Category 2008–2018 ............................ 48 Figure 16: Indonesia Printed Media Retail Sales and Forecast (IDR mn), by Channel Group, 2008–2018 ..................... 51 Figure 17: Indonesia Stationery and Cards Retail Sales and Forecast (IDR mn), by Channel Group, 2008–2018.......... 54 Figure 18: Indonesia Electrical and Electronics Retail Sales and Forecast (IDR mn), by Channel Group, 2008–2018 ... 57 Figure 19: Indonesia Electrical and Electronics Retail Market Dynamics, by Channel Group, 2008–2018 ...................... 58 Figure 20: Indonesia Electrical and Electronics Retail Sales and Forecast (IDR mn), by Category 2008–2018 .............. 61 Figure 21: Indonesia Electrical and Electronics Retail Market Dynamics, by Category 2008–2018 ................................. 62 Figure 22: Indonesia Communications Equipment Retail Sales and Forecast (IDR mn), by Channel Group, 2008–201865 Figure 23: Indonesia Computer Hardware and Software Retail Sales and Forecast (IDR mn), by Channel Group, 2008–2018
............................................................................................................................................................................................... 69 Figure 24: Indonesia Consumer Electronics Retail Sales and Forecast (IDR mn), by Channel Group, 2008–2018 ........ 72 Figure 25: Indonesia Household Appliances Retail Sales and Forecast (IDR mn), by Channel Group, 2008–2018........ 75 Figure 26: Indonesia Photographic Equipment Retail Sales and Forecast (IDR mn), by Channel Group, 2008–2018 .... 78 Figure 27: Indonesia Food and Grocery Retail Sales and Forecast (IDR mn), by Channel Group, 2008–2018............... 81 Figure 28: Indonesia Food and Grocery Retail Market Dynamics, by Channel Group, 2008–2018 .................................. 82 Figure 29: Indonesia Food and Grocery Retail Sales and Forecast (IDR mn), by Category 2008–2018.......................... 85 Figure 30: Indonesia Food and Grocery Retail Market Dynamics, by Category 2008–2018 ............................................. 86 Figure 31: Indonesia Drinks Retail Sales and Forecast (IDR mn), by Channel Group, 2008–2018 .................................. 89 Figure 32: Indonesia Household Products Retail Sales and Forecast (IDR mn), by Channel Group, 2008–2018 ........... 92 Figure 33: Indonesia Packaged Food Retail Sales and Forecast (IDR mn), by Channel Group, 2008–2018 .................. 95 Figure 34: Indonesia Personal Care Retail Sales and Forecast (IDR mn), by Channel Group, 2008–2018..................... 98 Figure 35: Indonesia Tobacco Retail Sales and Forecast (IDR mn), by Channel Group, 2008–2018 ............................ 101 Figure 36: Indonesia Unpackaged Food Retail Sales and Forecast (IDR mn), by Channel Group, 2008–2018 ............ 104 Figure 37: Indonesia Furniture and Floor Coverings Retail Sales and Forecast (IDR mn), by Channel Group, 2008–2018107 Figure 38: Indonesia Furniture and Floor Coverings Retail Market Dynamics, by Channel Group, 2008–2018............. 108 Figure 39: Indonesia Furniture and Floor Coverings Retail Sales and Forecast (IDR mn), by Category Group, 2008–2018 111 Figure 40: Indonesia Furniture and Floor Coverings Retail Market Dynamics, by Category 2008–2018........................ 112 Figure 41: Indonesia Floor Coverings Retail Sales and Forecast (IDR mn), by Channel Group, 2008–2018 ................ 115 Figure 42: Indonesia Furniture Retail Sales and Forecast (IDR mn), by Channel Group, 2008–2018 ........................... 118 Figure 43: Indonesia Home and Garden Products Retail Sales and Forecast (IDR mn), by Channel Group, 2008–2018121 Figure 44: Indonesia Home and Garden Products Retail Market Dynamics, by Channel Group, 2008–2018 ............... 122 Figure 45: Indonesia Home and Garden Products Retail Sales and Forecast, by Channel Group, 2008–2018 ............ 125 Figure 46: Indonesia Home and Garden Products Retail Market Dynamics, by Category 2008–2018........................... 126 Figure 47: Indonesia Gardening and Outdoor Living Retail Sales and Forecast (IDR mn), by Channel Group, 2008–2018129 Figure 48: Indonesia Home Improvement Retail Sales and Forecast (IDR mn), by Channel Group, 2008–2018 .......... 132
©Conlumino 2014 | This product is licensed and is not to be photocopied or reproduced. 17
The Future of Retailing in Indonesia to 2018
Published: October 2014
Figure 49: Indonesia Homewares Retail Sales and Forecast (IDR mn), by Channel Group, 2008–2018....................... 135 Figure 50: Indonesia Music, Video and Entertainment Software Retail Sales and Forecast (IDR mn), by Channel Group,
2008–2018 ........................................................................................................................................................................... 138 Figure 51: Indonesia Music, Video and Entertainment Software Retail Market Dynamics, by Channel Group, 2008–2018139 Figure 52: Indonesia Music, Video and Entertainment Software Retail Sales and Forecast (IDR mn), by Category 2008–2018
............................................................................................................................................................................................. 142 Figure 53: Indonesia Music, Video and Entertainment Software Retail Market Dynamics, by Category 2008–2018 ..... 143 Figure 54: Indonesia Games Software Retail Sales and Forecast (IDR mn), by Channel Group, 2008–2018............... 146 Figure 55: Indonesia Music and Video Retail Sales and Forecast (IDR mn), by Channel Group, 2008–2018 ............... 149 Figure 56: Indonesia Sports and Leisure Equipment Retail Sales and Forecast (IDR mn), by Channel Group, 2008–2018 152 Figure 57: Indonesia Sports and Leisure Equipment Retail Market Dynamics, by Channel Group, 2008–2018 ............ 153 Figure 58: Indonesia Sports and Leisure Equipment Retail Sales and Forecast (IDR mn), by Category 2008–2018.... 156 Figure 59: Indonesia Sports and Leisure Equipment Retail Market Dynamics, by Category 2008–2018 ....................... 157 Figure 60: Indonesia Sports Equipment Retail Sales and Forecast (IDR mn), by Channel Group, 2008–2018 ............. 160 Figure 61: Indonesia Toys and Games Retail Sales and Forecast (IDR mn), by Channel Group, 2008–2018 .............. 163 Figure 62: Indonesia Value Retailers Sales and Forecast (IDR mn), by Channel, 2008–2018 ....................................... 166 Figure 63: Indonesia Value Retailers Market Dynamics, by Channel, 2008–2018 .......................................................... 167 Figure 64: Indonesia Value Retailers Sales and Forecast (IDR mn), by Category Group, 2008–2018 .......................... 170 Figure 65: Indonesia Value Retailers Market Dynamics, by Category Group, 2008–2018 .............................................. 171 Figure 66: Indonesia Cash and Carries and Warehouse Clubs Sales and Forecast (IDR mn), by Category Group, 2008–2018
............................................................................................................................................................................................. 176 Figure 67: Indonesia Value, Variety Stores and General Merchandise Retailers Sales and Forecast (IDR mn), by Category
Group, 2008–2018 .............................................................................................................................................................. 182 Figure 68: Indonesia General Retailers Sales and Forecast (IDR mn), by Channel, 2008–2018 ................................... 188 Figure 69: Indonesia General Retailers Market Dynamics, by Channel, 2008–2018....................................................... 189 Figure 70: Indonesia General Retailers Sales and Forecast (IDR mn), by Category Group, 2008–2018 ....................... 192 Figure 71: Indonesia General Retailers Market Dynamics, by Category Group, 2008–2018 .......................................... 193 Figure 72: Indonesia Convenience Stores (including Independents) and Gas Stations Sales and Forecast (IDR mn), by
Category Group, 2008–2018 .............................................................................................................................................. 198 Figure 73: Indonesia Department Stores Sales and Forecast (IDR mn), by Category Group, 2008–2018 .................... 203 Figure 74: Indonesia Hypermarkets, Supermarkets and Hard-Discounters Sales and Forecast (IDR mn), by Category Group,
2008–2018 ........................................................................................................................................................................... 208 Figure 75: Indonesia Vending Machines Sales and Forecast (IDR mn), by Category Group, 2008–2018 ..................... 213 Figure 76: Indonesia Other General and Non-Specialist Direct Retailers Sales and Forecast (IDR mn), by Category Group,
2008–2018 ........................................................................................................................................................................... 219 Figure 77: Indonesia Specialist Retailers Sales and Forecast (IDR mn), by Channel 2008–2018.................................. 225 Figure 78: Indonesia Specialist Retailers Market Dynamics, by Channel 2008–2018 ..................................................... 226 Figure 79: Indonesia Specialist Retailers Sales and Forecast (IDR mn), by Category Group, 2008–2018 .................... 232 Figure 80: Indonesia Specialist Retailers Market Dynamics, by Category Group, 2008–2018 ....................................... 233 Figure 81: Indonesia Clothing, Footwear, Accessories and Luxury Goods Specialists Sales and Forecast (IDR mn), by
Category Group, 2008–2018 .............................................................................................................................................. 239 Figure 82: Indonesia Drug Stores and Health and Beauty Stores Sales and Forecast (IDR mn), by Category Group, 2008–
2018 ..................................................................................................................................................................................... 245 Figure 83: Indonesia Duty Free Retailers Sales and Forecast (IDR mn), by Category Group, 2008–2018.................... 251 Figure 84: Indonesia Electrical and Electronics Specialists Sales and Forecast (IDR mn), by Category Group, 2008–2018 257 Figure 85: Indonesia Food and Drinks Specialists Sales and Forecast (IDR mn), by Category Group, 2008–2018 ...... 263 Figure 86: Indonesia Home Furniture and Homewares Retailers Sales and Forecast (IDR mn), by Category Group, 2008–
2018 ..................................................................................................................................................................................... 269 Figure 87: Indonesia Home Improvement and Gardening Supplies Retailers Sales and Forecast (IDR mn), by Category
Group, 2008–2018 .............................................................................................................................................................. 275 Figure 88: Indonesia Music, Video, Book, Stationery and Entertainment Software Specialists Sales and Forecast (IDR mn), by
Category Group, 2008–2018 .............................................................................................................................................. 281 Figure 89: Indonesia Other Specialist Retailers Sales and Forecast (IDR mn), by Category Group, 2008–2018 .......... 287 Figure 90: Indonesia Online Retailing Sales and Forecast (IDR mn), by Category Group, 2008–2018 ......................... 293 Figure 91: Indonesia Online Retailing Market Dynamics, by Category Group, 2008–2018 ............................................. 294 Figure 92: The Triangulated Market Sizing Methodology ...................................................................................................306
©Conlumino 2014 | This product is licensed and is not to be photocopied or reproduced. 18
The Future of Retailing in Indonesia to 2018
Published: October 2014
List of Tables
Table 1: Indonesia Overall Retail Sales (IDR bn), by Category Group, 2008–2013 .......................................................... 18 Table 2: Indonesia Overall Retail Sales Forecast (IDR bn), by Category Group, 2013–2018 ........................................... 19 Table 3: Indonesia Overall Retail Sales (USD bn), by Category Group, 2008–2013 ......................................................... 20 Table 4: Indonesia Overall Retail Sales Forecast (USD bn), by Category Group, 2013–2018 ......................................... 21 Table 5: Indonesia Overall Retail Segmentation (% value), by Category Group, 2008–2018 ........................................... 21 Table 6: Indonesia Overall Retail Sales (IDR bn), by Channel Group, 2008–2013............................................................ 23 Table 7: Indonesia Overall Retail Sales Forecast (IDR bn), by Channel Group, 2013–2018 ............................................ 24 Table 8: Indonesia Overall Retail Sales (USD bn), by Channel Group, 2008–2013 .......................................................... 24 Table 9: Indonesia Overall Retail Sales Forecast (USD bn), by Channel Group, 2013–2018........................................... 25 Table 10: Indonesia Overall Retail Segmentation (% value), by Channel Group, 2008–2018 .......................................... 25 Table 11: Indonesia Apparel, Accessories, Luggage and Leather Goods Retail Sales (IDR mn), by Channel Group, 2008–
2013 ....................................................................................................................................................................................... 27 Table 12: Indonesia Apparel, Accessories, Luggage and Leather Goods Retail Sales Forecast (IDR mn), by Channel Group,
2013–2018 ............................................................................................................................................................................. 28 Table 13: Indonesia Apparel, Accessories, Luggage and Leather Goods Retail Sales (USD mn), by Channel Group, 2008–
2013 ....................................................................................................................................................................................... 28 Table 14: Indonesia Apparel, Accessories, Luggage and Leather Goods Retail Sales Forecast (USD mn), by Channel Group,
2013–2018 ............................................................................................................................................................................. 29 Table 15: Indonesia Apparel, Accessories, Luggage and Leather Goods Retail Segmentation (% value), by Channel Group,
2008–2018 ............................................................................................................................................................................. 29 Table 16: Indonesia Apparel, Accessories, Luggage and Leather Goods Retail Sales (IDR mn), by Category 2008–201331 Table 17: Indonesia Apparel, Accessories, Luggage and Leather Goods Retail Sales Forecast (IDR mn), by Category 2013–
2018 ....................................................................................................................................................................................... 32 Table 18: Indonesia Apparel, Accessories, Luggage and Leather Goods Retail Sales (USD mn), by Category 2008–2013 32 Table 19: Indonesia Apparel, Accessories, Luggage and Leather Goods Retail Sales Forecast (USD mn), by Category, 2013–
2018 ....................................................................................................................................................................................... 33 Table 20: Indonesia Apparel, Accessories, Luggage and Leather Goods Retail Segmentation (% value), by Category, 2008–
2018 ....................................................................................................................................................................................... 33 Table 21: Indonesia Clothing and Footwear Retail Sales (IDR mn), by Channel Group, 2008–2013 ............................... 35 Table 22: Indonesia Clothing and Footwear Retail Sales Forecast (IDR mn), by Channel Group, 2013–2018 ............... 35 Table 23: Indonesia Clothing and Footwear Retail Sales (USD mn), by Channel Group, 2008–2013 ............................. 36 Table 24: Indonesia Clothing and Footwear Retail Sales Forecast (USD mn), by Channel Group, 2013–2018 .............. 36 Table 25: Indonesia Clothing and Footwear Retail Segmentation, by Channel Group, 2008–2018 ................................. 36 Table 26: Indonesia Jewelry, Watches and Accessories Retail Sales (IDR mn), by Channel Group, 2008–2013 ........... 37 Table 27: Indonesia Jewelry, Watches and Accessories Retail Sales Forecast (IDR mn), by Channel Group, 2013–201838 Table 28: Indonesia Jewelry, Watches and Accessories Retail Sales (USD mn), by Channel Group, 2008–2013.......... 38 Table 29: Indonesia Jewelry, Watches and Accessories Retail Sales Forecast (USD mn), by Channel Group, 2013–2018 39 Table 30: Indonesia Jewelry, Watches and Accessories Retail Segmentation, by Channel Group, 2008–2018 ............. 39 Table 31: Indonesia Luggage and Leather Goods Retail Sales (IDR mn), by Channel Group, 2008–2013 ..................... 40 Table 32: Indonesia Luggage and Leather Goods Retail Sales Forecast (IDR mn), by Channel Group, 2013–2018...... 41 Table 33: Indonesia Luggage and Leather Goods Retail Sales (USD mn), by Channel Group, 2008–2013.................... 41 Table 34: Indonesia Luggage and Leather Goods Retail Sales Forecast (USD mn), by Channel Group, 2013–2018 .... 42 Table 35: Indonesia Luggage and Leather Goods Retail Segmentation, by Channel Group, 2008–2018 ....................... 42 Table 36: Indonesia Books, News and Stationery Retail Sales (IDR mn), by Channel Group, 2008–2013...................... 44 Table 37: Indonesia Books, News and Stationery Retail Sales Forecast (IDR mn), by Channel Group, 2013–2018 ...... 45 Table 38: Indonesia Books, News and Stationery Retail Sales (USD mn), by Channel Group, 2008–2013 .................... 45 Table 39: Indonesia Books, News and Stationery Retail Sales Forecast (USD mn), by Channel Group, 2013–2018 ..... 46 Table 40: Indonesia Books, News and Stationery Retail Segmentation (% value), by Channel Group, 2008–2018........ 46 Table 41: Indonesia Books, News and Stationery Retail Sales (IDR mn), by Category 2008–2013 ................................. 49 Table 42: Indonesia Books, News and Stationery Retail Sales Forecast (IDR mn), by Category 2013–2018 ................. 49 Table 43: Indonesia Books, News and Stationery Retail Sales (USD mn), by Category 2008–2013 ............................... 49 Table 44: Indonesia Books, News and Stationery Retail Sales Forecast (USD mn), by Category 2013–2018 ................ 50

©Conlumino 2014 | This product is licensed and is not to be photocopied or reproduced. 19
The Future of Retailing in Indonesia to 2018
Published: October 2014
Table 45: Indonesia Books, News and Stationery Retail Segmentation (% value), by Category, 2008–2018 ................. 50 Table 46: Indonesia Printed Media Retail Sales (IDR mn), by Channel Group, 2008–2013 ............................................. 52 Table 47: Indonesia Printed Media Retail Sales Forecast (IDR mn), by Channel Group, 2013–2018 .............................. 52 Table 48: Indonesia Printed Media Retail Sales (USD mn), by Channel Group, 2008–2013 ............................................ 53 Table 49: Indonesia Printed Media Retail Sales Forecast (USD mn), by Channel Group, 2013–2018 ............................ 53 Table 50: Indonesia Printed Media Retail Segmentation, by Channel Group, 2008–2018 ................................................ 53 Table 51: Indonesia Stationery and Cards Retail Sales (IDR mn), by Channel Group, 2008–2013 ................................. 54 Table 52: Indonesia Stationery and Cards Retail Sales Forecast (IDR mn), by Channel Group, 2013–2018 .................. 55 Table 53: Indonesia Stationery and Cards Retail Sales Forecast (USD mn), by Channel Group, 2008–2013................. 55 Table 54: Indonesia Stationery and Cards Retail Sales Forecast (USD mn), by Channel Group, 2013–2018................. 56 Table 55: Indonesia Stationery and Cards Retail Segmentation, by Channel Group, 2008–2018 .................................... 56 Table 56: Indonesia Electrical and Electronics Retail Sales (IDR mn), by Channel Group, 2008–2013 ........................... 58 Table 57: Indonesia Electrical and Electronics Retail Sales Forecast (IDR mn), by Channel Group, 2013–2018 ........... 59 Table 58: Indonesia Electrical and Electronics Retail Sales (USD mn), by Channel Group, 2008–2013 ......................... 59 Table 59: Indonesia Electrical and Electronics Retail Sales Forecast (USD mn), by Channel Group, 2013–2018 .......... 60 Table 60: Indonesia Electrical and Electronics Retail Segmentation (% value), by Channel Group, 2008–2018............. 60 Table 61: Indonesia Electrical and Electronics Retail Sales (IDR mn), by Category 2008–2013 ...................................... 62 Table 62: Indonesia Electrical and Electronics Retail Sales Forecast (IDR mn), by Category 2013–2018 ...................... 63 Table 63: Indonesia Electrical and Electronics Retail Sales (USD mn), by Category 2008–2013 .................................... 63 Table 64: Indonesia Electrical and Electronics Retail Sales Forecast (USD mn), by Category 2013–2018 ..................... 64 Table 65: Indonesia Electrical and Electronics Retail Segmentation (% value), by Category, 2008–2018....................... 64 Table 66: Indonesia Communications Equipment Retail Sales (IDR mn), by Channel Group 2008–2013 ...................... 66 Table 67: Indonesia Communications Equipment Retail Sales Forecast (IDR mn), by Channel Group, 2013–2018 ...... 67 Table 68: Indonesia Communications Equipment Retail Sales (USD mn), by Channel Group 2008–2013 .................... 67 Table 69: Indonesia Communications Equipment Retail Sales Forecast (USD mn), by Channel Group, 2013–2018 ..... 68 Table 70: Indonesia Communications Equipment Retail Segmentation, by Channel Group, 2008–2018 ........................ 68 Table 71: Indonesia Computer Hardware and Software Retail Sales (IDR mn), by Channel Group, 2008–2013 ............ 69 Table 72: Indonesia Computer Hardware and Software Retail Sales Forecast (IDR mn), by Channel Group , 2013–201870 Table 73: Indonesia Computer Hardware and Software Retail Sales (USD mn), by Channel Group, 2008–2013 .......... 70 Table 74: Indonesia Computer Hardware and Software Retail Sales Forecast (USD mn), by Channel Group, 2013–201871 Table 75: Indonesia Computer Hardware and Software Retail Segmentation, by Channel Group, 2008–2018 .............. 71 Table 76: Indonesia Consumer Electronics Retail Sales (IDR mn), by Channel Group, 2008–2013 ................................ 72 Table 77: Indonesia Consumer Electronics Retail Sales Forecast (IDR mn), by Channel Group, 2013–2018................. 73 Table 78: Indonesia Consumer Electronics Retail Sales (USD mn), by Channel Group, 2008–2013 .............................. 73 Table 79: Indonesia Consumer Electronics Retail Sales Forecast (USD mn), by Channel Group, 2013–2018 ............... 74 Table 80: Indonesia Consumer Electronics Retail Segmentation, by Channel Group, 2008–2018 .................................. 74 Table 81: Indonesia Household Appliances Retail Sales (IDR mn), by Channel Group, 2008–2013 ............................... 75 Table 82: Indonesia Household Appliances Retail Sales Forecast (IDR mn), by Channel Group, 2013–2018 ................ 76 Table 83: Indonesia Household Appliances Retail Sales (USD mn), by Channel Group, 2008–2013 .............................. 76 Table 84: Indonesia Household Appliances Retail Sales Forecast (USD mn), by Channel Group, 2013–2018 .............. 77 Table 85: Indonesia Household Appliances Retail Segmentation, by Channel Group, 2008–2018 .................................. 77 Table 86: Indonesia Photographic Equipment Retail Sales (IDR mn), by Channel Group, 2008–2013............................ 78 Table 87: Indonesia Photographic Equipment Retail Sales Forecast (IDR mn), by Channel Group, 2013–2018 ............ 79 Table 88: Indonesia Photographic Equipment Retail Sales (USD mn), by Channel Group, 2008–2013 .......................... 79 Table 89: Indonesia Photographic Equipment Retail Sales Forecast (USD mn), by Channel Group, 2013–2018 ........... 80 Table 90: Indonesia Photographic Equipment Retail Segmentation, by Channel Group, 2008–2018 .............................. 80 Table 91: Indonesia Food and Grocery Retail Sales (IDR mn), by Channel Group, 2008–2013 ...................................... 82 Table 92: Indonesia Food and Grocery Retail Sales Forecast (IDR mn), by Channel Group, 2013–2018 ....................... 83 Table 93: Indonesia Food and Grocery Retail Sales (USD mn), by Channel Group, 2008–2013 ..................................... 83 Table 94: Indonesia Food and Grocery Retail Sales Forecast (USD mn), by Channel Group, 2013–2018 ..................... 84 Table 95: Indonesia Food and Grocery Retail Segmentation (% value), by Channel Group, 2008–2018 ........................ 84 Table 96: Indonesia Food and Grocery Retail Sales (IDR mn), by Category 2008–2013 ................................................. 86 Table 97: Indonesia Food and Grocery Retail Sales Forecast (IDR mn), by Category 2013–2018 .................................. 87 Table 98: Indonesia Food and Grocery Retail Sales (USD mn), by Category, 2008–2013 ............................................... 87 Table 99: Indonesia Food and Grocery Retail Sales Forecast (IDR mn), by Category 2013–2018 .................................. 88 Table 100: Indonesia Food and Grocery Retail Segmentation (% value), by Category, 2008–2018 ................................ 88

©Conlumino 2014 | This product is licensed and is not to be photocopied or reproduced. 20
The Future of Retailing in Indonesia to 2018
Published: October 2014
Table 101: Indonesia Drinks Retail Sales (IDR mn), by Channel Group, 2008–2013........................................................ 89 Table 102: Indonesia Drinks Retail Sales Forecast (IDR mn), by Channel Group, 2013–2018 ........................................ 90 Table 103: Indonesia Drinks Retail Sales (USD mn), by Channel Group, 2008–2013 ...................................................... 90 Table 104: Indonesia Drinks Retail Sales Forecast (USD mn), by Channel Group, 2013–2018 ....................................... 91 Table 105: Indonesia Drinks Retail Segmentation, by Channel Group, 2008–2018 .......................................................... 91 Table 106: Indonesia Household Products Retail Sales (IDR mn), by Channel Group, 2008–2013 ................................. 92 Table 107: Indonesia Household Products Retail Sales Forecast (IDR mn), by Channel Group, 2013–2018 ................. 93 Table 108: Indonesia Household Products Retail Sales (USD mn), by Channel Group, 2008–2013 ............................... 93 Table 109: Indonesia Household Products Retail Sales Forecast (USD mn), by Channel Group, 2013–2018 ................ 94 Table 110: Indonesia Household Products Retail Segmentation, by Channel Group, 2008–2018 ................................... 94 Table 111: Indonesia Packaged Food Retail Sales (IDR mn), by Channel Group, 2008–2013 ........................................ 95 Table 112: Indonesia Packaged Food Retail Sales Forecast (IDR mn), by Channel Group, 2013–2018 ......................... 96 Table 113: Indonesia Packaged Food Retail Sales (USD mn), by Channel Group, 2008–2013 ....................................... 96 Table 114: Indonesia Packaged Food Retail Sales Forecast (USD mn), by Channel Group, 2013–2018 ....................... 97 Table 115: Indonesia Packaged Food Retail Segmentation, by Channel Group, 2008–2018........................................... 97 Table 116: Indonesia Personal Care Retail Sales (IDR mn), by Channel Group, 2008–2013 .......................................... 98 Table 117: Indonesia Personal Care Retail Sales Forecast (IDR mn), by Channel Group, 2013–2018 ........................... 99 Table 118: Indonesia Personal Care Retail Sales (USD mn), by Channel Group, 2008–2013 ......................................... 99 Table 119: Indonesia Personal Care Retail Sales Forecast (USD mn), by Channel Group, 2013–2018........................ 100 Table 120: Indonesia Personal Care Retail Segmentation, by Channel Group, 2008–2018 ........................................... 100 Table 121: Indonesia Tobacco Retail Sales (IDR mn), by Channel Group, 2008–2013 .................................................. 101 Table 122: Indonesia Tobacco Retail Sales Forecast (IDR mn), by Channel Group, 2013–2018 .................................. 102 Table 123: Indonesia Tobacco Retail Sales (USD mn), by Channel Group, 2008–2013 ................................................ 102 Table 124: Indonesia Tobacco Retail Sales Forecast (USD mn), by Channel Group, 2013–2018 ................................. 103 Table 125: Indonesia Tobacco Retail Segmentation, by Channel Group, 2008–2018 .................................................... 103 Table 126: Indonesia Unpackaged Food Retail Sales (IDR mn), by Channel Group, 2008–2013 .................................. 104 Table 127: Indonesia Unpackaged Food Retail Sales Forecast (IDR mn), by Channel Group, 2013–2018 .................. 105 Table 128: Indonesia Unpackaged Food Retail Sales (USD mn), by Channel Group, 2008–2013 ................................ 105 Table 129: Indonesia Unpackaged Food Retail Sales Forecast (USD mn), by Channel, 2013–2018 ............................ 106 Table 130: Indonesia Unpackaged Food Retail Segmentation, by Channel Group, 2008–2018 .................................... 106 Table 131: Indonesia Furniture and Floor Coverings Retail Sales (IDR mn), by Channel Group, 2008–2013 ............... 108 Table 132: Indonesia Furniture and Floor Coverings Retail Sales Forecast (IDR mn), by Channel Group, 2013–2018 109 Table 133: Indonesia Furniture and Floor Coverings Retail Sales (USD mn), by Channel Group, 2008–2013 ............. 109 Table 134: Indonesia Furniture and Floor Coverings Retail Sales Forecast (USD mn), by Channel Group, 2013–2018110 Table 135: Indonesia Furniture and Floor Coverings Segmentation (% value), by Channel Group, 2008–2018 ........... 110 Table 136: Indonesia Furniture and Floor Coverings Retail Sales (IDR mn), by Category, 2008–2013 ......................... 112 Table 137: Indonesia Furniture and Floor Coverings Retail Sales Forecast (IDR mn), by Category 2013–2018........... 113 Table 138: Indonesia Furniture and Floor Coverings Retail Sales (USD mn), by Category, 2008–2013........................ 113 Table 139: Indonesia Furniture and Floor Coverings Retail Sales Forecast (USD mn), by Category 2013–2018 ......... 114 Table 140: Indonesia Furniture and Floor Coverings Retail Segmentation (% value), by Category, 2008–2018 ........... 114 Table 141: Indonesia Floor Coverings Retail Sales (IDR mn), by Channel Group, 2008–2013 ...................................... 116 Table 142: Indonesia Floor Coverings Retail Sales Forecast (IDR mn), by Channel Group, 2013–2018....................... 116 Table 143: Indonesia Floor Coverings Retail Sales (USD mn), by Channel Group, 2008–2013..................................... 117 Table 144: Indonesia Floor Coverings Retail Sales Forecast (USD mn), by Channel Group, 2013–2018 ..................... 117 Table 145: Indonesia Floor Coverings Retail Segmentation, by Channel Group, 2008–2018 ........................................ 117 Table 146: Indonesia Furniture Retail Sales (IDR mn), by Channel Group, 2008–2013 ................................................. 118 Table 147: Indonesia Furniture Retail Sales Forecast (IDR mn), by Channel Group, 2013–2018 .................................. 119 Table 148: Indonesia Furniture Retail Sales (USD mn), by Channel Group, 2008–2013 ................................................ 119 Table 149: Indonesia Furniture Retail Sales Forecast (USD mn), by Channel Group, 2013–2018 ................................ 120 Table 150: Indonesia Furniture Retail Segmentation, by Channel Group, 2008–2018 .................................................... 120 Table 151: Indonesia Home and Garden Products Retail Sales (IDR mn), by Channel Group, 2008–2013 .................. 122 Table 152: Indonesia Home and Garden Products Retail Sales Forecast (IDR mn), by Channel Group, 2013–2018... 123 Table 153: Indonesia Home and Garden Products Retail Sales (USD mn), by Channel Group, 2008–2013 ................ 123 Table 154: Indonesia Home and Garden Products Retail Sales Forecast (USD mn), by Channel Group, 2013–2018 . 124 Table 155: Indonesia Home and Garden Products Retail Segmentation (% value), by Channel Group, 2008–2018 .... 124 Table 156: Indonesia Home and Garden Products Retail Sales (IDR mn), by Category, 2008–2013 ............................ 126
©Conlumino 2014 | This product is licensed and is not to be photocopied or reproduced. 21
The Future of Retailing in Indonesia to 2018
Published: October 2014
Table 157: Indonesia Home and Garden Products Retail Sales Forecast (IDR mn), by Category 2013–2018 .............. 127 Table 158: Indonesia Home and Garden Products Retail Sales (USD mn), by Category, 2008–2013........................... 127 Table 159: Indonesia Home and Garden Products Retail Sales Forecast (USD mn), by Channel Group, 2013–2018 . 128 Table 160: Indonesia Home and Garden Products Retail Segmentation (% value), by Category, 2008–2018 .............. 128 Table 161: Indonesia Gardening and Outdoor Living Retail Sales (IDR mn), by Channel Group, 2008–2013 .............. 129 Table 162: Indonesia Gardening and Outdoor Living Retail Sales Forecast (IDR mn), by Channel Group, 2013–2018 130 Table 163: Indonesia Gardening and Outdoor Living Retail Sales (USD mn), by Channel Group, 2008–2013 ............. 130 Table 164: Indonesia Gardening and Outdoor Living Retail Sales Forecast (USD mn), by Channel Group, 2013–2018131 Table 165: Indonesia Gardening and Outdoor Living Retail Segmentation, by Channel Group, 2008–2018 ................. 131 Table 166: Indonesia Home Improvement Retail Sales (IDR mn), by Channel Group, 2008–2013................................ 132 Table 167: Indonesia Home Improvement Retail Sales Forecast (IDR mn), by Channel Group, 2013–2018 ................ 133 Table 168: Indonesia Home Improvement Retail Sales (USD mn), by Channel Group, 2008–2013 .............................. 133 Table 169: Indonesia Home Improvement Retail Sales Forecast (USD mn), by Channel Group, 2013–2018............... 134 Table 170: Indonesia Home Improvement Retail Segmentation, by Channel Group, 2008–2018 .................................. 134 Table 171: Indonesia Homewares Retail Sales (IDR mn), by Channel Group, 2008–2013 ............................................ 135 Table 172: Indonesia Homewares Retail Sales Forecast (IDR mn), by Channel Group, 2013–2018 ............................. 136 Table 173: Indonesia Homewares Retail Sales (USD mn), by Channel Group, 2008–2013 ........................................... 136 Table 174: Indonesia Homewares Retail Sales Forecast (USD mn), by Channel Group, 2013–2018 ........................... 137 Table 175: Indonesia Homewares Retail Segmentation, by Channel Group, 2008–2018 ............................................... 137 Table 176: Indonesia Music, Video and Entertainment Software Retail Sales (IDR mn), by Channel Group, 2008–2013139 Table 177: Indonesia Music, Video and Entertainment Software Retail Sales Forecast (IDR mn), by Channel Group, 2013–
2018 ..................................................................................................................................................................................... 140 Table 178: Indonesia Music, Video and Entertainment Software Retail Sales (USD mn), by Channel Group, 2008–2013140 Table 179: Indonesia Music, Video and Entertainment Software Retail Sales Forecast (USD mn), by Channel Group, 2013–
2018 ..................................................................................................................................................................................... 141 Table 180: Indonesia Music, Video and Entertainment Software Retail Segmentation (% value), by Channel Group, 2008–
2018 ..................................................................................................................................................................................... 141 Table 181: Indonesia Music, Video and Entertainment Software Retail Sales (IDR mn), by Category, 2008–2013 ...... 143 Table 182: Indonesia Music, Video and Entertainment Software Retail Sales Forecast (IDR mn), by Category 2013–2018 144 Table 183: Indonesia Music, Video and Entertainment Software Retail Sales (USD mn), by Category, 2008–2013 ..... 144 Table 184: Indonesia Music, Video and Entertainment Software Retail Sales Forecast (USD mn), by Category 2013–2018 145 Table 185: Indonesia Music, Video and Entertainment Software Retail Segmentation (% value), by Category 2008–2018145 Table 186: Indonesia Games Software Retail Sales (IDR mn), by Channel Group, 2008–2013..................................... 146 Table 187: Indonesia Games Software Retail Sales Forecast (IDR mn), by Channel Group, 2013–2018 ..................... 147 Table 188: Indonesia Games Software Retail Sales (USD mn), by Channel Group, 2008–2013 ................................... 147 Table 189: Indonesia Games Software Retail Sales Forecast (USD mn), by Channel Group, 2013–2018.................... 148 Table 190: Indonesia Games Software Retail Segmentation, by Channel Group, 2008–2018 ....................................... 148 Table 191: Indonesia Music and Video Retail Sales (IDR mn), by Channel Group, 2008–2013 ..................................... 149 Table 192: Indonesia Music and Video Retail Sales Forecast (IDR mn), by Channel Group, 2013–2018 ..................... 150 Table 193: Indonesia Music and Video Retail Sales (USD mn), by Channel Group, 2008–2013 ................................... 150 Table 194: Indonesia Music and Video Retail Sales Forecast (USD mn), by Channel Group, 2013–2018 .................... 151 Table 195: Indonesia Music and Video Retail Segmentation, by Channel Group, 2008–2018 ....................................... 151 Table 196: Indonesia Sports and Leisure Equipment Retail Sales (IDR mn), by Channel Group, 2008–2013 .............. 153 Table 197: Indonesia Sports and Leisure Equipment Retail Sales Forecast (IDR mn), by Channel Group, 2013–2018154 Table 198: Indonesia Sports and Leisure Equipment Retail Sales (USD mn), by Channel Group, 2008–2013 ............. 154 Table 199: Indonesia Sports and Leisure Equipment Retail Sales Forecast (USD mn), by Channel Group, 2013–2018155 Table 200: Indonesia Sports and Leisure Equipment Retail Segmentation (% value), by Channel Group, 2008–2018 155 Table 201: Indonesia Sports and Leisure Equipment Retail Sales (IDR mn), by Category, 2008–2013 ........................ 157 Table 202: Indonesia Sports and Leisure Equipment Retail Sales Forecast (IDR mn), by Category 2013–2018 .......... 158 Table 203: Indonesia Sports and Leisure Equipment Retail Sales (USD mn), by Category, 2008–2013 ....................... 158 Table 204: Indonesia Sports and Leisure Equipment Retail Sales Forecast (USD mn), by Category 2013–2018 ........ 159 Table 205: Indonesia Sports and Leisure Equipment Retail Segmentation (% value), by Category 2008–2018 ........... 159 Table 206: Indonesia Sports Equipment Retail Sales (IDR mn), by Channel Group, 2008–2013................................... 160 Table 207: Indonesia Sports Equipment Retail Sales Forecast (IDR mn), by Channel Group, 2013–2018 ................... 161 Table 208: Indonesia Sports Equipment Retail Sales (USD mn), by Channel Group, 2008–2013 ................................. 161 Table 209: Indonesia Sports Equipment Retail Sales Forecast (USD mn), by Channel Group, 2013–2018 .................. 162
©Conlumino 2014 | This product is licensed and is not to be photocopied or reproduced. 22
The Future of Retailing in Indonesia to 2018
Published: October 2014
Table 210: Indonesia Sports Equipment Retail Segmentation, by Channel Group, 2008–2018 ..................................... 162 Table 211: Indonesia Toys and Games Retail Sales (IDR mn), by Channel Group, 2008–2013 .................................... 163 Table 212: Indonesia Toys and Games Retail Sales Forecast (IDR mn), by Channel Group, 2013–2018 .................... 164 Table 213: Indonesia Toys and Games Retail Sales (USD mn), by Channel Group, 2008–2013 .................................. 164 Table 214: Indonesia Toys and Games Retail Sales Forecast (USD mn), by Channel Group, 2013–2018 ................... 165 Table 215: Indonesia Toys and Games Retail Segmentation, by Channel Group, 2008–2018 ...................................... 165 Table 216: Indonesia Value Retailers Sales (IDR mn), by Channel, 2008–2013 ............................................................. 167 Table 217: Indonesia Value Retailers Sales Forecast (IDR mn), by Channel, 2013–2018 ............................................. 168 Table 218: Indonesia Value Retailers Sales (USD mn), by Channel, 2008–2013 ........................................................... 168 Table 219: Indonesia Value Retailers Sales Forecast (USD mn), by Channel, 2013–2018 ............................................ 169 Table 220: Indonesia Value Retailers Segmentation (% value), by Channel, 2008–2018............................................... 169 Table 221: Indonesia Value Retailers Sales (IDR mn), by Category Group, 2008–2013 ................................................ 172 Table 222: Indonesia Value Retailers Sales Forecast (IDR mn), by Category Group, 2013–2018 ................................. 173 Table 223: Indonesia Value Retailers Sales (USD mn), by Category Group, 2008–2013 ............................................... 174 Table 224: Indonesia Value Retailers Sales Forecast (USD mn), by Category Group, 2013–2018 ............................... 175 Table 225: Indonesia Value Retailers Segmentation (% value), by Category Group, 2008–2018 .................................. 175 Table 226: Indonesia Cash and Carries and Warehouse Clubs Sales (IDR mn), by Category Group, 2008–2013 ....... 177 Table 227: Indonesia Cash and Carries and Warehouse Clubs Sales Forecast (IDR mn), by Category Group, 2013–2018 178 Table 228: Indonesia Cash and Carries and Warehouse Clubs Sales (USD mn), by Category Group, 2008–2013...... 179 Table 229: Indonesia Cash and Carries and Warehouse Clubs Sales (USD mn), by Category Group, 2013–2018...... 180 Table 230: Indonesia Cash and Carries and Warehouse Clubs Segmentation (% value), by Category Group, 2008–2018181 Table 231: Indonesia Value, Variety Stores and General Merchandise Retailers Sales (IDR mn), by Category Group, 2008–
2013 ..................................................................................................................................................................................... 183 Table 232: Indonesia Value, Variety Stores and General Merchandise Retailers Sales Forecast (IDR mn), by Category Group,
2013–2018 ........................................................................................................................................................................... 184 Table 233: Indonesia Value, Variety Stores and General Merchandise Retailers Sales (USD mn), by Category Group, 2008–
2013 ..................................................................................................................................................................................... 185 Table 234: Indonesia Value, Variety Stores and General Merchandise Retailers Sales Forecast (USD mn), by Category
Group, 2013–2018 .............................................................................................................................................................. 186 Table 235: Indonesia Value, Variety Stores and General Merchandise Retailers Segmentation (% value), by Category Group,
2013–2018 ........................................................................................................................................................................... 187 Table 236: Indonesia General Retailers Sales (IDR mn), by Channel, 2008–2013 ......................................................... 189 Table 237: Indonesia General Retailers Sales Forecast (IDR mn), by Channel, 2013–2018.......................................... 190 Table 238: Indonesia General Retailers Sales (USD mn), by Channel, 2008–2013........................................................ 190 Table 239: Indonesia General Retailers Sales Forecast (USD mn), by Channel, 2013–2018 ........................................ 191 Table 240: Indonesia General Retailers Segmentation (% value), by Channel 2008–2018 ............................................ 191 Table 241: Indonesia General Retailers Sales (IDR mn), by Category Group, 2008–2013............................................. 194 Table 242: Indonesia General Retailers Sales Forecast (IDR mn), by Category Group, 2013–2018 ............................. 195 Table 243: Indonesia General Retailers Sales (USD mn), by Category Group, 2008–2013 ........................................... 196 Table 244: Indonesia General Retailers Sales Forecast (USD mn), by Category Group, 2013–2018 ............................ 197 Table 245: Indonesia General Retailers Segmentation (% value), by Category Group, 2008–2018 .............................. 197 Table 246: Indonesia Convenience Stores (including Independents) and Gas Stations Sales (IDR mn), by Category Group,
2008–2013 ........................................................................................................................................................................... 199 Table 247: Indonesia Convenience Stores (including Independents) and Gas Stations Sales Forecast (IDR mn), by Category
Group, 2013–2018 .............................................................................................................................................................. 200 Table 248: Indonesia Convenience Stores (including Independents) and Gas Stations Sales (USD mn), by Category Group,
2008–2013 ........................................................................................................................................................................... 201 Table 249: Indonesia Convenience Stores (including Independents) and Gas Stations Sales Forecast (USD mn), by Category
Group, 2013–2018 .............................................................................................................................................................. 202 Table 250: Indonesia Convenience Stores (including Independents) and Gas Stations Segmentation (% value), by Category
Group, 2008–2018 .............................................................................................................................................................. 202 Table 251: Indonesia Department Stores Sales (IDR mn), by Category Group, 2008–2013 .......................................... 204 Table 252: Indonesia Department Stores Sales Forecast (IDR mn), by Category Group, 2013–2018 ........................... 205 Table 253: Indonesia Department Stores Sales (USD mn), by Category Group, 2008–2013 ........................................ 206 Table 254: Indonesia Department Stores Sales Forecast (USD mn), by Category Group, 2013–2018 ......................... 207 Table 255: Indonesia Department Stores Segmentation (% value), by Category Group, 2008–2018 ............................ 207
©Conlumino 2014 | This product is licensed and is not to be photocopied or reproduced. 23
The Future of Retailing in Indonesia to 2018
Published: October 2014
Table 256: Indonesia Hypermarkets, Supermarkets and Hard-Discounters Sales (IDR mn), by Category Group, 2008–2013
............................................................................................................................................................................................. 209 Table 257: Indonesia Hypermarkets, Supermarkets and Hard-Discounters Sales Forecast (IDR mn), by Category Group,
2013–2018 ........................................................................................................................................................................... 210 Table 258: Indonesia Hypermarkets, Supermarkets and Hard-Discounters Sales (USD mn), by Category Group, 2008–2013
............................................................................................................................................................................................. 211 Table 259: Indonesia Hypermarkets, Supermarkets and Hard-Discounters Sales Forecast (USD mn), by Category Group,
2013–2018 ........................................................................................................................................................................... 212 Table 260: Indonesia Hypermarkets, Supermarkets and Hard-Discounters Segmentation (% value), by Category Group,
2008–2018 ........................................................................................................................................................................... 212 Table 261: Indonesia Vending Machines Sales (IDR mn), by Category Group, 2008–2013 ........................................... 214 Table 262: Indonesia Vending Machines Sales Forecast (IDR mn), by Category Group, 2013–2018 ........................... 215 Table 263: Indonesia Vending Machines Sales (USD mn), by Category Group, 2008–2013 ......................................... 216 Table 264: Indonesia Vending Machines Sales Forecast (USD mn), by Category Group, 2013–2018 .......................... 217 Table 265: Indonesia Vending Machines Segmentation (% value), by Category Group, 2008–2018 ............................. 218 Table 266: Indonesia Other General and Non-Specialist Retailers Sales (IDR mn), by Category Group, 2008–2013 .. 220 Table 267: Indonesia Other General and Non-Specialist Retailers Sales Forecast (IDR mn), by Category Group, 2013–2018
............................................................................................................................................................................................. 221 Table 268: Indonesia Other General and Non-Specialist Retailers Sales (USD mn), by Category Group, 2008–2013 . 222 Table 269: Indonesia Other General and Non-Specialist Retailers Sales Forecast (USD mn), by Category Group, 2013–2018
............................................................................................................................................................................................. 223 Table 270: Indonesia Other General and Non-Specialist Retailers Segmentation (% value), by Category Group, 2008–2018
............................................................................................................................................................................................. 224 Table 271: Indonesia Specialist Retailers Sales (IDR mn), by Channel 2008–2013 ....................................................... 227 Table 272: Indonesia Specialist Retailers Sales Forecast (IDR mn), by Channel 2013–2018 ....................................... 228 Table 273: Indonesia Specialist Retailers Sales (USD mn), by Channel, 2008–2013 ..................................................... 229 Table 274: Indonesia Specialist Retailers Sales Forecast (USD mn), by Channel 2013–2018...................................... 230 Table 275: Indonesia Specialist Retailers Segmentation (% value), by Channel, 2008–2018 ........................................ 231 Table 276: Indonesia Specialist Retailers Sales (IDR mn), by Category Group, 2008–2013 .......................................... 234 Table 277: Indonesia Specialist Retailers Sales Forecast (IDR mn), by Category Group, 2013–2018 .......................... 235 Table 278: Indonesia Specialist Retailers Sales (USD mn), by Category Group, 2008–2013 ........................................ 236 Table 279: Indonesia Specialist Retailers Sales Forecast (USD mn), by Category Group, 2013–2018 ......................... 237 Table 280: Indonesia Specialist Retailers Segmentation (% value), by Category Group, 2008–2018............................ 238 Table 281: Indonesia Clothing, Footwear, Accessories and Luxury Goods Specialists Sales (IDR mn), by Category
Group,2008–2013 ............................................................................................................................................................... 240 Table 282: Indonesia Clothing, Footwear, Accessories and Luxury Goods Specialists Sales Forecast (IDR mn), by Category
Group, 2013–2018 .............................................................................................................................................................. 241 Table 283: Indonesia Clothing, Footwear, Accessories and Luxury Goods Specialists Sales (USD mn), by Category Group,
2008–2013 ........................................................................................................................................................................... 242 Table 284: Indonesia Clothing, Footwear, Accessories and Luxury Goods Specialists Sales Forecast (USD mn), by Category
Group, 2013–2018 .............................................................................................................................................................. 243 Table 285: Indonesia Clothing, Footwear, Accessories and Luxury Goods Specialists Segmentation (% value), by Category
Group, 2008–2018 .............................................................................................................................................................. 244 Table 286: Indonesia Drug Stores and Health and Beauty Stores Sales (IDR mn), by Category Group, 2008–2013 ... 246 Table 287: Indonesia Drug Stores and Health and Beauty Stores Sales Forecast (IDR mn), by Category Group, 2013–2018
............................................................................................................................................................................................. 247 Table 288: Indonesia Drug Stores and Health and Beauty Stores Sales (USD mn), by Category Group, 2008–2013 .. 248 Table 289: Indonesia Drug Stores and Health and Beauty Stores Sales Forecast (USD mn), by Category Group, 2013–2018
............................................................................................................................................................................................. 249 Table 290: Indonesia Drug Stores and Health and Beauty Stores Segmentation (% value), by Category Group, 2008–2018
............................................................................................................................................................................................. 250 Table 291: Indonesia Duty Free Retailers Sales (IDR mn), by Category Group, 2008–2013 ......................................... 252 Table 292: Indonesia Duty Free Retailers Sales Forecast (IDR mn), by Category Group, 2013–2018 .......................... 253 Table 293: Indonesia Duty Free Retailers Sales (USD mn), by Category Group, 2008–2013 ........................................ 254 Table 294: Indonesia Duty Free Retailers Sales Forecast (USD mn), by Category Group, 2013–2018......................... 255 Table 295: Indonesia Duty Free Retailers Segmentation (% value), by Category Group, 2008–2018 ........................... 256

©Conlumino 2014 | This product is licensed and is not to be photocopied or reproduced. 24
The Future of Retailing in Indonesia to 2018
Published: October 2014
Table 296: Indonesia Electrical and Electronics Specialists Sales (IDR mn), by Category Group, 2008–2013 ............. 258 Table 297: Indonesia Electrical and Electronics Specialists Sales Forecast (IDR mn), by Category Group, 2013–2018259 Table 298: Indonesia Electrical and Electronics Specialists Sales (USD mn), by Category Group, 2008–2013 ............ 260 Table 299: Indonesia Electrical and Electronics Specialists Sales Forecast (USD mn), by Category Group, 2013–2018261 Table 300: Indonesia Electrical and Electronics Specialists Segmentation (% value), by Category Group, 2008–2018 262 Table 301: Indonesia Food and Drinks Specialists Sales (IDR mn), by Category Group, 2008–2013 ........................... 264 Table 302: Indonesia Food and Drinks Specialists Sales Forecast (IDR mn), by Category Group, 2013–2018 ............ 265 Table 303: Indonesia Food and Drinks Specialists Sales (USD mn), by Category Group, 2008–2013 .......................... 266 Table 304: Indonesia Food and Drinks Specialists Sales Forecast (USD mn), by Category Group, 2013–2018........... 267 Table 305: Indonesia Food and Drinks Specialists Segmentation (% value), by Category Group, 2008–2018 ............. 268 Table 306: Indonesia Home Furniture and Homewares Retailers Sales (IDR mn), by Category Group, 2008–2013 .... 270 Table 307: Indonesia Home Furniture and Homewares Retailers Sales Forecast (IDR mn), by Category Group, 2013–2018
............................................................................................................................................................................................. 271 Table 308: Indonesia Home Furniture and Homewares Retailers Sales (USD mn), by Category Group, 2008–2013... 272 Table 309: Indonesia Home Furniture and Homewares Retailers Sales Forecast (USD mn), by Category Group, 2013–2018
............................................................................................................................................................................................. 273 Table 310: Indonesia Home Furniture and Homewares Retailers Segmentation (% value), by Category Group, 2008–2018 274 Table 311: Indonesia Home Improvement and Gardening Supplies Retailers Sales (IDR mn), by Category Group, 2008–2013276 Table 312: Indonesia Home Improvement and Gardening Supplies Retailers Sales Forecast (IDR mn), by Category Group,
2013–2018 ..................................................................................................................................................................................... 277 Table 313: Indonesia Home Improvement and Gardening Supplies Retailers Sales (USD mn), by Category Group, 2008–
2013 ............................................................................................................................................................................................... 278 Table 314: Indonesia Home Improvement and Gardening Supplies Retailers Sales Forecast (USD mn), by Category Group,
2013–2018 ..................................................................................................................................................................................... 279 Table 315: Indonesia Home Improvement and Gardening Supplies Retailers Segmentation (% value), by Category Group,
2008–2018 ..................................................................................................................................................................................... 280 Table 316: Indonesia Music, Video, Book, Stationery and Entertainment Software Specialists Sales (IDR mn), by Category
Group, 2008–2013 ........................................................................................................................................................................ 282 Table 317: Indonesia Music, Video, Book, Stationery and Entertainment Software Specialists Sales Forecast (IDR mn), by
Category Group, 2013–2018 ........................................................................................................................................................ 283 Table 318: Indonesia Music, Video, Book, Stationery and Entertainment Software Specialists Sales (USD mn), by Category
Group, 2008–2013 ........................................................................................................................................................................ 284 Table 319: Indonesia Music, Video, Book, Stationery and Entertainment Software Specialists Sales Forecast (USD mn), by
Category Group, 2013–2018 ........................................................................................................................................................ 285 Table 320: Indonesia Music, Video, Book, Stationery and Entertainment Software Specialists Segmentation (% value), by
Category Group, 2008–2018 ........................................................................................................................................................ 286 Table 321: Indonesia Other Specialist Retailers Sales (IDR mn), by Category Group, 2008–2013.......................................... 288 Table 322: Indonesia Other Specialist Retailers Sales Forecast (IDR mn), by Category Group, 2013–2018 .......................... 289 Table 323: Indonesia Other Specialist Retailers Sales (USD mn), by Category Group, 2008–2013 ........................................ 290 Table 324: Indonesia Other Specialist Retailers Sales Forecast (USD mn), by Category Group, 2013–2018......................... 291 Table 325: Indonesia Other Specialist Retailers Segmentation (% value), by Category Group, 2008–2018 ........................... 292 Table 326: Indonesia Online Retailing Sales (IDR mn), by Category Group, 2008–2013 ......................................................... 295 Table 327: Indonesia Online Retailing Sales Forecast (IDR mn), by Category Group, 2013–2018 .......................................... 296 Table 328: Indonesia Online Retailing Sales (USD mn), by Category Group, 2008–2013 ........................................................ 297 Table 329: Indonesia Online Retailing Sales Forecast (USD mn), by Category Group, 2013–2018 ........................................ 298 Table 330: Indonesia Online Retailing Segmentation (% value), by Category Group, 2008–2018 ........................................... 299 Table 331: Indonesia Exchange Rate IDR–US$ (Annual Average), 2008–2013 ....................................................................... 300 Table 332: Indonesia Exchange Rate IDR–US$ (Annual Average), 2014–2018 ....................................................................... 300 Table 333: Conlumino Retail Channel Definitions ....................................................................................................................... 301 Table 334: Conlumino Retail Category Definitions ...................................................................................................................... 303
©Conlumino 2014 | This product is licensed and is not to be photocopied or reproduced. 25
The Future of Retailing in Indonesia to 2018
Published: October 2014
About Conlumino
Conlumino Global Retail offers a comprehensive 360° view of the retail landscape. A team of analysts,
with more than 200 years of combined experience, help you identify and understand the most current
retail trends.
Last year hundreds of retail businesses across the globe used our research to make critical business
decisions.
Disclaimer
All Rights Reserved.
No part of this publication may be reproduced, stored in a retrieval system or transmitted in any form by
any means, electronic, mechanical, photocopying, recording or otherwise, without the prior permission of
the publisher, Conlumino.
The facts of this report are believed to be correct at the time of publication but cannot be guaranteed.
Please note that the findings, conclusions and recommendations that Conlumino delivers will be based on
information gathered in good faith from both primary and secondary sources, whose accuracy we are not
always in a position to guarantee. As such, Conlumino can accept no liability whatsoever for actions taken
based on any information that may subsequently prove to be incorrect.
HEAD OFFICE
John Carpenter House
7 Carmelite Street
London
EC4Y 0BS
UNITED KINGDOM
Telephone: +44 20 7936 6400
Email: [email protected]
SUBSCRIPTION INQUIRIES
To gain access to Conlumino's suite of
research products and bespoke services
contact our subscription team.
Tel: +44 20 7936 6663
Email: [email protected]
CONTACT US