Embed Size (px)
Citation preview

MNRAS 454, 1038–1057 (2015) doi:10.1093/mnras/stv2056
The impact of angular momentum on black hole accretion ratesin simulations of galaxy formation
Y. M. Rosas-Guevara,1‹ R. G. Bower,1‹ J. Schaye,2‹ M. Furlong,1 C. S. Frenk,1
C. M. Booth,3 R. A. Crain,2,4 C. Dalla Vecchia,5 M. Schaller1 and T. Theuns1,6
1Institute for Computational Cosmology (ICC), Department of Physics, University of Durham, South Road, Durham DH1 3LE, UK2Leiden Observatory, Leiden University, PO Box 9513, NL-2300 RA Leiden, the Netherlands3Department of Astronomy and Astrophysics, The University of Chicago, Chicago, IL 60637, USA4Astrophysics Research Institute, Liverpool John Moores University, 146 Brownlow Hill, Liverpool L3 5RF, UK5Max Planck Institute for Extraterrestrial Physics, Gissenbachstraße 1, D-85748 Garching, Germany6Department of Physics, University of Antwerp, Campus Groenenborger, Groenenborgerlaan 171, B-2020 Antwerp, Belgium
Accepted 2015 September 2. Received 2015 July 15; in original form 2013 November 29
ABSTRACTFeedback from energy liberated by gas accretion on to black holes (BHs) is an attractivemechanism to explain the exponential cut-off at the massive end of the galaxy stellar massfunction. Most previous implementations of BH accretion in hydrodynamical simulationsof galaxy formation have assumed that BHs grow at an accretion rate that is proportionto the Bondi rate. A major concern is that the Bondi accretion rate is inappropriate whenthe accreting material has significant angular momentum. We present an improved accretionmodel that takes into account the circularization and subsequent viscous transport of infallingmaterial, and implemented as a ‘subgrid’ model in hydrodynamic simulations. The resultingaccretion rates are generally low in low mass (� 1011.5 M�) haloes, but show outbursts ofEddington-limited accretion during galaxy mergers. During outbursts these objects stronglyresemble quasars. In higher mass haloes, gas accretion peaks at ∼10 per cent of the Eddingtonrate, which is thought to be conducive to the formation of radio jets. The resulting accretionrate depends strongly on the effective pressure of the gas surrounding the BH, which in turndepends strongly on halo mass. This induces a sharp transition in the importance of BHfeedback. In small haloes, the growth of galaxies is regulated by star formation and supernovafeedback, but above a halo mass of 1011.5 M�, rapid BH growth leads to the suppression ofstar formation and reduced growth of stellar mass with increasing halo mass.
Key words: black hole physics – methods: numerical – galaxies: active – galaxies: evolution –galaxies: formation – quasars: general.
1 IN T RO D U C T I O N
A fundamental open question in galaxy formation is the role thatblack holes (BHs) play in shaping the galaxy around them. Theobserved scaling relations between the mass of the central super-massive BH and the properties of the bulge (Magorrian et al. 1998;Tremaine et al. 2002; Mullaney et al. 2012) suggest that there is anintimate connection between the growth of the central BH and theevolution of its host galaxy. From these observations, however, it isnot clear whether the formation of the BH plays an integral part inthe galaxy formation process, or whether it is simply a biproduct ofthe process of galaxy’s evolution. There are two lines of argumentthat suggest that the first option is correct. First, the energies that are
�E-mail: [email protected] (YMR-G); [email protected](RGB); [email protected] (JS)
available from the formation of a 109 M� BH are enormous, greatlyexceeding the binding energy of a galaxy’s baryonic halo. Unlessthe coupling of the accretion energy to the surrounding baryons isextremely weak, it would be surprising if the formation of the BHhas little impact on its surroundings. Secondly, there is a strongobserved correlation between the mechanical power of radio galaxylobes in galaxy clusters and the cluster gas cooling rate. Many au-thors have argued that the energy deposited by the radio galaxy issufficient to replenish the cooling radiation of the system (McNa-mara & Nulsen 2007). Careful observations of galaxy groups haverevealed evidence of similar levels of energy input to radio galaxiesin groups (Antognini, Bird & Martini 2012; Birzan et al. 2012; Ma,McNamara & Nulsen 2013); this regime is more relevant to theconnection between BH and galaxy growth.
In phenomenological or semi-analytic models, feedback from ac-tive galactic nuclei (AGNs) is an indispensable element that enablesthe models to reproduce the stellar mass function (SMF) of the local
C© 2015 The AuthorsPublished by Oxford University Press on behalf of the Royal Astronomical Society
at Liverpool John M
oores University on N
ovember 11, 2015
http://mnras.oxfordjournals.org/
Dow
nloaded from
The impact of angular momentum on BH accretion 1039
universe (Bower et al. 2006; Croton et al. 2006; Bower, McCarthy& Benson 2008). AGN feedback is assumed to be ineffective inlow-mass haloes, where the gas cooling time is short compared tothe sound-crossing time (White & Frenk 1991), and only to coupleeffectively in quasi-hydrostatic haloes (M � 1012 M�). This di-chotomy has some observational support, since the bulk of energyoutput from quasars appears to be radiated, while the mechanicalenergy of radio galaxies is trapped in the overall potential. As aresult, a characteristic mass scale is introduced where the SMFpresents a break: accretion in low-mass haloes is dominated bycold and rapidly cooling gas (since the cooling time is less than thefree-fall or sound-crossing time), while accretion in high-mass halooccurs through quasi-hydrostatic cooling gas flows (where the gasis approximately in pressure balance, and the sound-crossing timeis less than the cooling time; White & Frenk 1991). The importanceof this distinction can be understood if the primary driver of thestar formation rate in galaxies is the balance between outflows andinflows (i.e. the star formation rate of galaxies adjusts itself so thatthe inflow and outflow are in equilibrium). In the case of low-masshaloes, the AGN feedback loop is (assumed to be) ineffective andthe balance between gas supply and outflow is set by the supernova(SN)-driven outflow rate. In higher mass haloes, the AGNs regu-late the galaxy growth either by offsetting the cooling rate (Boweret al. 2006), or by puffing up the hot gas halo (Bower et al. 2008;McCarthy et al. 2011; Bower, Benson & Crain 2012) so that thecooling rate is reduced. In either case, the result is to suppress themass of the cold gas and reduce the star formation rate in massivehaloes, creating a break in the SMF.
In this scenario, the distinction between rapid cooling and hydro-static haloes is critical. In the absence of a clear physical scale atwhich BH feedback becomes effective, the SMF behaves as a powerlaw (Benson et al. 2003; Bower et al. 2012) because the impact ofgas ejection builds up over a wide range of stellar mass. However,semi-analytic models make a variety of simplifying assumptions,and it is possible that AGN-driven and star-formation-driven out-flows might not combine as simply as is envisaged.
Hydrodynamic simulations have the great advantage that thereis no need to make an explicit distinction between hydrostatic andrapidly cooling haloes. Any dependence on the ratio of coolingand dynamical time-scales should emerge from the solution of thehydrodynamic equations. There is a long history of papers that in-clude AGN feedback in numerical simulations. Di Matteo, Springel& Hernquist (2005) and Springel, Di Matteo & Hernquist (2005)introduced BH fuelling in order to study the impact of BH accretionon galaxy mergers (Hopkins et al. 2006, 2007; Sijacki et al. 2007;Barai et al. 2013). More recently, some papers have focused onmodelling both feedback modes, quasar and radio, either makinguse of two accretion modes (Sijacki et al. 2007; Vogelsberger et al.2014) or different ways of implementing jet feedback (Dubois et al.2010; Debuhr, Quataert & Ma 2011).
The approach we follow here is extensively based on the devel-opment of the Springel et al. (2005) accretion model presented in(Booth & Schaye 2009, hereafter BS09). Booth & Schaye (2010)emphasize the importance of self-regulation: BHs grow until theirenergy output is comparable to the binding energy of the halo, re-sulting in a very tight correlation between halo mass and BH mass.They demonstrate that the slope of the correlation departs from unitybecause of the variation of halo concentration, and that changes inthe feedback efficiency result in an offset in BH mass such that therate by which the BH releases energy remains fixed. These simula-tions focused on the physics of BH accretion at high masses, andtherefore used a relatively high particle mass. The OverWhelmingly
Large Simulations (OWLS) project which consists of a large suite ofcosmological, smoothed particle hydrodynamics (SPH) simulationswith varying boxes and resolutions, includes AGN feedback in someof its simulations. The highest resolution simulations (5123 particlesfor the 25 Mpc box and gas particle mass 1.4 × 10⁶ h−1 M�), runonly up to z = 2 making it impossible to compare with the observa-tional data on the local galaxy mass function (Schaye et al. 2010) atthis resolution. Nevertheless, the analysis of the properties of galax-ies in the lower resolution OWLS simulations (8.7 × 10⁷h−1 M�)at z = 0 by Muldrew, Pearce & Power (2013) hints at the problemof a power-law SMF and the absence of a physical scale on whichthe BH becomes effective. This problem is also seen in the simu-lations of Puchwein & Springel (2013). Motivated by the successof semi-analytic models, Sijacki et al. (2007) explicitly introducedifferent feedback schemes for high- and low-mass accretion rates.This approach along with a radiative mode, that includes the effectsof a strong ionizing radiation emerging from active BHs in the netgas cooling rates, is used in the recent large volume cosmologicalsimulations of the ILLUSTRIS project (Vogelsberger et al. 2014;Sijacki et al. 2015). For a cluster-scale approach, Dubois et al.(2013) follow the evolution of a 1011- M� mass halo progenitor ofa cluster at z = 0, including SN and AGN feedback. Dubois et al.(2013) found that the feedback from star formation plays a marginalrole and that AGN feedback is able to quench star formation whenBHs are self-regulating.
In this paper we will take another look at the BH accretion mod-els used in these numerical simulations. In the models above, theBH accretion rate is based on the Bondi estimate. This assumesthat material falling through the Bondi radius free-falls into the BH.As recently discussed by several authors (e.g. Krumholz, McKee& Klein 2005; Debuhr, Quataert & Ma 2011; Power, Nayakshin& King 2011; Angles-Alcazar, AUzel & Dave 2013), neglectingthe angular momentum (AM) of the flow may lead to significanterrors. Power et al. (2011) propose a new model in which a BHparticle represents a self-regulating torus. Orbits are used to esti-mate whether particles are captured within a given accretion regionof the BH. Then gas particles are accreted on to the BH after aviscous time. Both the accretion region and viscous time are givenby free parameters in their model. Their method is suitable for ultrahigh resolution calculations (with particle mass 102 M�) where theaccretion region is ∼0.003 kpc, but it is not suitable for the multi-megaparsec scale simulations that are required to study the galaxypopulation (Muldrew et al. 2013). Debuhr et al. (2011) also proposea BH accretion model that depends on the AM. Specifically, theaccretion rate is proportional to the mean gas surface density, thelocal sound speed squared and the inverse of the rotational angu-lar frequency. They apply their model in isolated major mergers,finding self-regulation of the resulting BH but no clear evidence ofsuppression of the star formation in the resulting galaxy.
We will present a model that is similar in spirit to that of Debuhret al. (2011). We propose a simple scheme that takes into accountthe AM of the gas flow, but does not require such high resolution sothat it can be used in simulations of the cosmological population.The subgrid model that we arrive at is suitable for inclusion insimulations of galaxy formation, and thus allows us to revisit theinteraction of BH feedback and galaxy formation. We show thatincluding the AM has a profound impact on the behaviour of BHaccretion, reproducing the behaviour postulated in semi-analyticmodels. In contrast to the common interpretation, however, the BHaccretion shapes the mass function not because the efficiency ofBH feedback varies with halo mass, but because BH accretion isstrongly suppressed in cold star forming discs (relative to the rate
MNRAS 454, 1038–1057 (2015)
at Liverpool John M
oores University on N
ovember 11, 2015
http://mnras.oxfordjournals.org/
Dow
nloaded from
1040 Y. M. Rosas-Guevara et al.
estimated when AM is not accounted for). We show that the newmodel not only matches the observed galaxy stellar mass fractions,but also generates accretion patterns that strongly resemble quasarsin lower mass haloes and radio galaxies in the highest mass haloesthat we probe.
The strategy of the paper is as follows. Most cosmological sim-ulations estimate BH accretion rates on the basis of the Bondi–Hoyle–Lyttleton accretion model (Bondi & Hoyle 1944). We beginSection 2 by summarizing this model and discuss the critical lengthand critical time-scales in Bondi accretion. In the following subsec-tion, Section 2.1.2, we motivate a simple extension of the Bondi–Hoyle–Lyttleton that allows the model to account for the AM ofmaterial flowing through the Bondi radius. This model contains anuncertain parameter that accounts for the effective viscosity of thedisc/torus that forms as the flow circularizes: for plausible valuesof this parameter, the accretion rate may be suppressed by manyorders of magnitude relative to the BS09 rate.
In Section 3, we take on the challenge of the implementing theextended model as a subgrid physics module suitable for cosmo-logical scale simulations. To illustrate the impact of including AMin the calculation, we perform a suite of cosmological simulations.In Section 4, we describe the simulation code, the initial conditionsand the simulations used in this study. In Section 5, we compare theimpact of BH accretion in the Bondi-like accretion model used byBS09 and the AM-dependent extension of this model. We investi-gate the accretion history of the most massive BHs in the simulationsin Section 6. Finally, we summarize our results and discuss the fun-damental implications of the BH accretion model in Section 7. Theconclusions of the paper are presented in Section 8. Convergencetests and parameter variations can be found in Appendix A and B,respectively. Throughout we adopt the �-cold-dark-matter cosmol-ogy with h = 0.704, �� = 0.728, �m = 0.272, �b = 0.0455,σ 8 = 0.810 and ns = 0.967. These values were derived from theWilkinson Microwave Anisotropy Probe 7 year (WMAP7) data (Ko-matsu et al. 2011).
2 A B H AC C R E T I O N M O D E L TH ATAC C O U N T S FO R A N G U L A R M O M E N T U M
BH accretion models are almost universally based on the Bondiaccretion rate or its extension, usually referred to as the Bondi–Hoyle–Lyttleton rate, that extends the model to the case of a BHmoving relative to the background particles (Bondi & Hoyle 1944).The net circulation of gas around the BH is not taken into account ineither formulation. In this section, we describe a simple, physicallymotivated extension that accounts for the net AM of the surroundinggas.
2.1 The physical scales of BH accretion
In the absence of AM, the accretion rate of the BH is determined bythe gas density and effective sound speed at the Bondi radius, rB.This radius, defined as the radius at which the BH gravity dominatesover the thermal and turbulent pressure of the surrounding gas, is akey physical length scale in the problem. It is given by
rB = GMBH
c2s
≈ 430
(MBH
107 M�
)(cs
10 km s−1
)−2
pc, (1)
where MBH is the mass of the BH and cs is the sound speed of thesurrounding medium. In the Bondi estimate of the accretion rate,gas within rB falls directly into the BH. However, when the infallinggas has a net AM, the flow will instead form an accretion disc or
torus with characteristic radius, rcirc. For any significant AM, thisradius will be larger than the last stable orbit of the BH. The radiusof the disc is determined by the circularization radius of the flow
rcirc = j 2(rcirc)
GMBH, (2)
where j is the specific AM of material in a circular orbit at thecircularization radius. The estimate assumes that the mass of the BHdominates within the circularization radius. In order to be accretedby the BH, material within this radius must transfer its AM outwardsfaster than it is converted into stars or expelled from the accretionregion by feedback processes.
To produce a simple model, we assume that the accretion pro-cesses can be treated in two parts: first an almost radial infall fromthe Bondi radius to the circularization radius and then a slower flowof material through the disc to the last stable orbit. We express thespecific AM of the flow passing through rB in terms of the Bondi ra-dius and the net tangential velocity (or circulation speed, Vφ) of gasat the Bondi radius, j = rB × Vφ . Assuming angular momentum isconserved in the infall phase, the circularization radius is
rcirc = r2BVφ(rB)2
GMBH= GMBH
Vφ(rB)2
c4s
≈ 430
(MBH
107 M�
)(Vφ(rB)
10 km s−1
)2(cs
10 km s−1
)−4
pc.
(3)
This formulation implies that (rcirc/rB) ≤ 1, since material at theBondi radius is assumed to be falling into the BH. This implies(Vφ/cs) ≤ 1 at the Bondi radius. On scales larger than the Bondiradius, it is entirely possible that the circulation speed will be greaterthan the sound speed. This will be the case, for example, in arotationally supported cold gas disc.
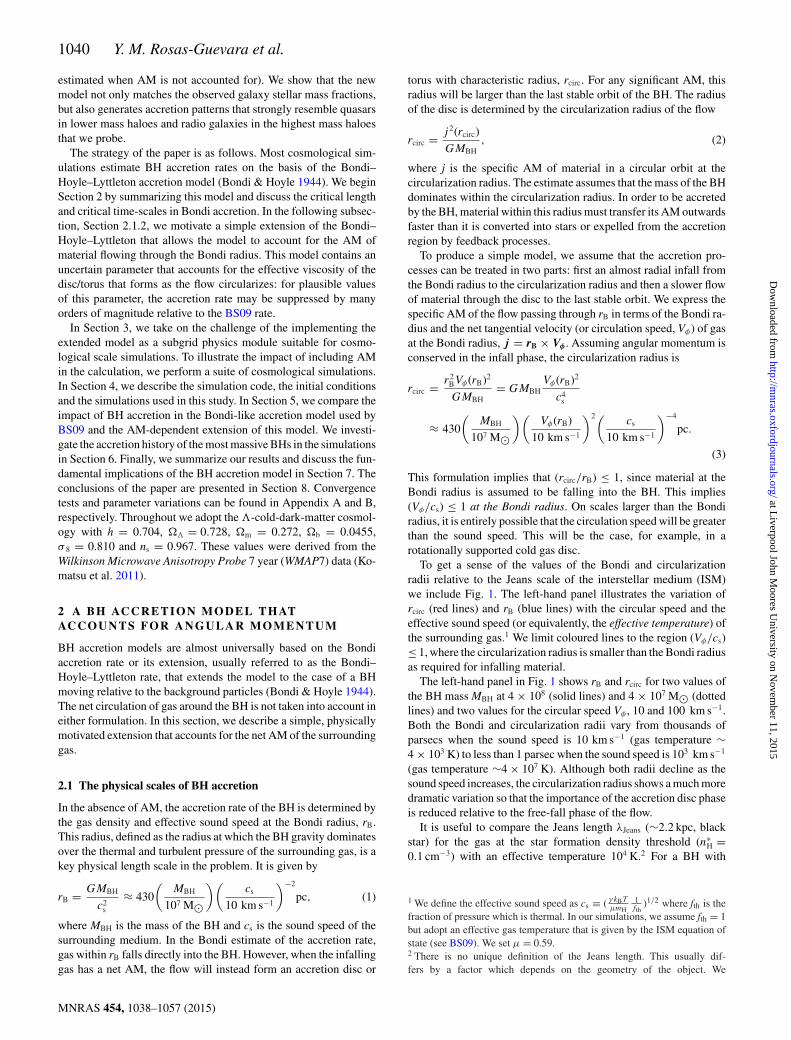
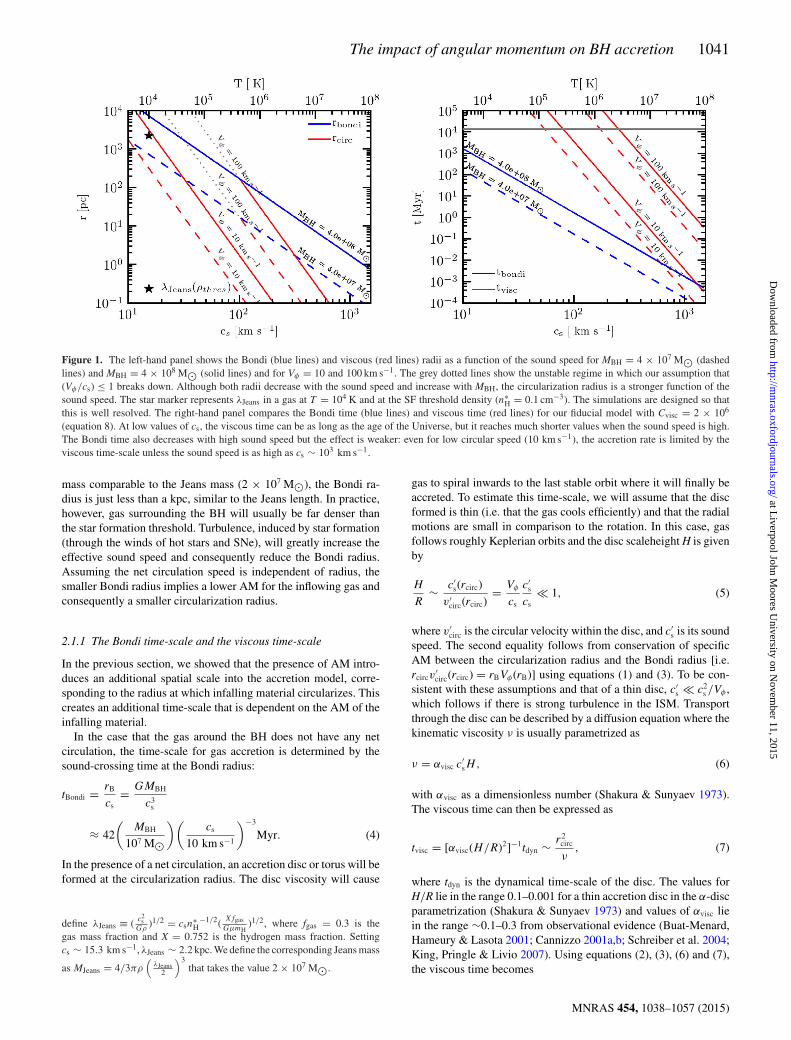
To get a sense of the values of the Bondi and circularizationradii relative to the Jeans scale of the interstellar medium (ISM)we include Fig. 1. The left-hand panel illustrates the variation ofrcirc (red lines) and rB (blue lines) with the circular speed and theeffective sound speed (or equivalently, the effective temperature) ofthe surrounding gas.1 We limit coloured lines to the region (Vφ/cs)≤ 1, where the circularization radius is smaller than the Bondi radiusas required for infalling material.
The left-hand panel in Fig. 1 shows rB and rcirc for two values ofthe BH mass MBH at 4 × 10⁸ (solid lines) and 4 × 10⁷ M� (dottedlines) and two values for the circular speed Vφ , 10 and 100 km s−1.Both the Bondi and circularization radii vary from thousands ofparsecs when the sound speed is 10 km s−1 (gas temperature ∼4 × 10³ K) to less than 1 parsec when the sound speed is 103 km s−1
(gas temperature ∼4 × 10⁷ K). Although both radii decline as thesound speed increases, the circularization radius shows a much moredramatic variation so that the importance of the accretion disc phaseis reduced relative to the free-fall phase of the flow.
It is useful to compare the Jeans length λJeans (∼2.2 kpc, blackstar) for the gas at the star formation density threshold (n∗
H =0.1 cm−3) with an effective temperature 104 K.2 For a BH with
1 We define the effective sound speed as cs ≡ ( γ kBTμmH
1fth
)1/2 where fth is thefraction of pressure which is thermal. In our simulations, we assume fth = 1but adopt an effective gas temperature that is given by the ISM equation ofstate (see BS09). We set μ = 0.59.2 There is no unique definition of the Jeans length. This usually dif-fers by a factor which depends on the geometry of the object. We
MNRAS 454, 1038–1057 (2015)
at Liverpool John M
oores University on N
ovember 11, 2015
http://mnras.oxfordjournals.org/
Dow
nloaded from
The impact of angular momentum on BH accretion 1041
Figure 1. The left-hand panel shows the Bondi (blue lines) and viscous (red lines) radii as a function of the sound speed for MBH = 4 × 10⁷ M� (dashedlines) and MBH = 4 × 10⁸ M� (solid lines) and for Vφ = 10 and 100 km s−1. The grey dotted lines show the unstable regime in which our assumption that(Vφ/cs) ≤ 1 breaks down. Although both radii decrease with the sound speed and increase with MBH, the circularization radius is a stronger function of thesound speed. The star marker represents λJeans in a gas at T = 104 K and at the SF threshold density (n∗
H = 0.1 cm−3). The simulations are designed so thatthis is well resolved. The right-hand panel compares the Bondi time (blue lines) and viscous time (red lines) for our fiducial model with Cvisc = 2 × 10⁶
(equation 8). At low values of cs, the viscous time can be as long as the age of the Universe, but it reaches much shorter values when the sound speed is high.The Bondi time also decreases with high sound speed but the effect is weaker: even for low circular speed (10 km s−1), the accretion rate is limited by theviscous time-scale unless the sound speed is as high as cs ∼ 103 km s−1.
mass comparable to the Jeans mass (2 × 10⁷ M�), the Bondi ra-dius is just less than a kpc, similar to the Jeans length. In practice,however, gas surrounding the BH will usually be far denser thanthe star formation threshold. Turbulence, induced by star formation(through the winds of hot stars and SNe), will greatly increase theeffective sound speed and consequently reduce the Bondi radius.Assuming the net circulation speed is independent of radius, thesmaller Bondi radius implies a lower AM for the inflowing gas andconsequently a smaller circularization radius.
2.1.1 The Bondi time-scale and the viscous time-scale
In the previous section, we showed that the presence of AM intro-duces an additional spatial scale into the accretion model, corre-sponding to the radius at which infalling material circularizes. Thiscreates an additional time-scale that is dependent on the AM of theinfalling material.
In the case that the gas around the BH does not have any netcirculation, the time-scale for gas accretion is determined by thesound-crossing time at the Bondi radius:
tBondi = rB
cs= GMBH
c3s
≈ 42
(MBH
107 M�
)(cs
10 km s−1
)−3
Myr. (4)
In the presence of a net circulation, an accretion disc or torus will beformed at the circularization radius. The disc viscosity will cause
define λJeans ≡ ( c2s
Gρ)1/2 = csn
∗H
−1/2(XfgasGμmH
)1/2, where fgas = 0.3 is thegas mass fraction and X = 0.752 is the hydrogen mass fraction. Settingcs ∼ 15.3 km s−1, λJeans ∼ 2.2 kpc. We define the corresponding Jeans mass
as MJeans = 4/3πρ(
λJeans2
)3that takes the value 2 × 10⁷ M�.
gas to spiral inwards to the last stable orbit where it will finally beaccreted. To estimate this time-scale, we will assume that the discformed is thin (i.e. that the gas cools efficiently) and that the radialmotions are small in comparison to the rotation. In this case, gasfollows roughly Keplerian orbits and the disc scaleheight H is givenby
H
R∼ c′
s(rcirc)
v′circ(rcirc)
= Vφ
cs
c′s
cs 1, (5)
where v′circ is the circular velocity within the disc, and c′
s is its soundspeed. The second equality follows from conservation of specificAM between the circularization radius and the Bondi radius [i.e.rcircv
′circ(rcirc) = rBVφ(rB)] using equations (1) and (3). To be con-
sistent with these assumptions and that of a thin disc, c′s c2
s /Vφ ,which follows if there is strong turbulence in the ISM. Transportthrough the disc can be described by a diffusion equation where thekinematic viscosity ν is usually parametrized as
ν = αvisc c′sH, (6)
with αvisc as a dimensionless number (Shakura & Sunyaev 1973).The viscous time can then be expressed as
tvisc = [αvisc(H/R)2]−1tdyn ∼ r2circ
ν, (7)
where tdyn is the dynamical time-scale of the disc. The values forH/R lie in the range 0.1–0.001 for a thin accretion disc in the α-discparametrization (Shakura & Sunyaev 1973) and values of αvisc liein the range ∼0.1–0.3 from observational evidence (Buat-Menard,Hameury & Lasota 2001; Cannizzo 2001a,b; Schreiber et al. 2004;King, Pringle & Livio 2007). Using equations (2), (3), (6) and (7),the viscous time becomes
MNRAS 454, 1038–1057 (2015)
at Liverpool John M
oores University on N
ovember 11, 2015
http://mnras.oxfordjournals.org/
Dow
nloaded from
1042 Y. M. Rosas-Guevara et al.
tvisc = Cviscrcirc
vcirc= Cvisc
j 3
G2M2BH
= Cviscr3
BV 3φ
G2M2BH
= CviscGMBHV 3
φ
c6s
≈ 42 Cvisc
( MBH
107 M�)( Vφ
10 km s−1
)3( cs
10 km s−1
)−6Myr. (8)
For a Shakura–Sunyaev disc, Cvisc = 2π[αvisc(H/R)2]−1. If wefully understood the transport processes in the rotating disc or torusthat feeds the BH, we would simply insert the appropriate values forαvisc and (H/R). For a thin disc model, plausible values of Cvisc liein the range 108–103. However, the structure of the circularizationdisc we are considering is completely unclear, as is the dominantviscous mechanism on relevant scales. These issues are discussedextensively in the literature (e.g. Shlosman, Begelman & Frank1990, Hopkins & Quataert 2010; King, Zubovas & Power 2011;Power et al. 2011) because the long time-scales implied by theShakura–Sunyaev formulation make it hard to understand the highefficiency of accretion required to create supermassive BHs at veryhigh redshift. On the scales relevant to our simulations, the appro-priate transport mechanism is likely to be gravitational instability(Hopkins & Quataert 2010, 2011) rather than the magnetorotationalinstability. But these simulations do not accurately treat the multi-phase structure of the ISM and stellar feedback, and the value ofCvisc is therefore extremely uncertain. We adopt an empirical ap-proach by varying Cvisc to obtain the best match to observed galaxyproperties, as discussed in Appendix B. The analysis prompts us tochoose Cvisc = 2 × 10⁶ as a fiducial value, although a wide rangeof values give qualitatively similar results.
The right-hand panel of Fig. 1 shows tBondi (blue lines) and tvisc
(red lines) as a function of the effective sound speed (or equiv-alent gas temperature) for BH masses MBH = 4 × 10⁷ M� andMBH = 4 × 10⁸ M� and Cvisc = 2.1 × 10⁶ under the same regionof our assumption(Vφ/cs ≤ 1). The Bondi time and viscous time areboth decreasing functions of the sound speed, but the viscous timehas a stronger dependence on the sound speed. For instance, for a BHwith MBH = 4 × 10⁸ M� surrounded by gas with cs ∼ 15.3 km s−1,the Bondi time-scale is ∼1 Gyr, but this drops by six orders of mag-nitude (to ∼103 yr) when cs ∼ 103 km s−1. It is important to note,however, that although the accretion time-scale is much shorterwhen cs is large, the overall accretion rate depends on the local den-sity: at fixed pressure, the accretion rate declines with increasing cs.For tvisc, the sound speed dependence is even stronger: For a circularspeed of 10 km s−1, the viscous time is ∼ 10 Gyr (∼ the age of theUniverse) for cs ∼ 90 km s−1, and ∼103 yr at cs ∼ 104 km s−1. Incontrast, both time-scales are relatively weak functions of the BHmass. The figure particularly highlights that the mass accretion ratewill be mostly predominantly limited by the viscous time becauseof the stronger dependence of tvisc on the local sound speed.
2.1.2 BH accretion rate accounting for angular momentum
Material with sufficiently low specific AM falls through the Bondiradius forming an AM supported disc or torus. This leads to a depen-dency of the viscous time and circularization radius on the effectivesound speed and the circular velocity of gas flowing through theBondi radius. In this section we propose a revised estimate of themass accretion rates of BHs that takes gas circulation into account.
The long viscous time-scale of the accretion disc creates a bot-tleneck for accretion on to the BH. As matter flows through the
Bondi radius it will pile up at the circulation radius. If the viscoustime-scale is long, this matter will form a nuclear starburst withonly a small fraction being accreted into the BH. The challenge isto estimate the mass of the accretion torus/disc, and thus the accre-tion rate. Our subgrid implementation requires an estimate of theinstantaneous accretion rate: gas that has stalled will be representedby macroscopic simulation particles (star formation and winds arehandled by other components of the simulation code). The Bonditime sets the characteristic time-scale of the problem. In the absenceof circulation, the mass within the Bondi region is ∼mBonditBondi.We assume that the viscous bottleneck results in this mass buildingup in the disc/torus and then draining into the BH at a lower rate:
mBH ∼ mBonditBondi
tvisc. (9)
The constant of proportionality is degenerate with the proportion-ality constant Cvisc. Following this argument, the critical factor is,then, the ratio of the Bondi and viscous times:
tBondi
tvisc= rBc−1
s
Cvisc[rBVφ]3[GMBH]−2
= 1
Cvisc
c3s
V 3φ
. (10)
Thus tBondi/tvisc depends only on [cs/Vφ]3. Note that if tvisc is largerthan tBondi (i.e. C1/3
viscVφ > cs) the accretion rate is limited by theBondi rate and we can ignore the time spent in the accretion discphase. We therefore write the BH accretion rate as
mBH =⎧⎨⎩ mBondi
[1
Cvisc
(csVφ
)3]
if C1/3viscVφ > cs,
mBondi otherwise,(11)
where mBondi is the mass accretion rate given in the equation (12)corresponding to the Bondi–Hoyle–Lyttleton accretion model (fol-lowing Bondi & Hoyle 1944 to allow for the bulk gas motion as wellas gas circulation) and Cvisc is a free parameter which parametrizesthe efficiency of AM transport and mass-loss from the disc. We takeCvisc = 2.1 × 10⁶ as our fiducial value.
The circular speed of material at the Bondi radius needs to exceeda critical value before the accretion time-scale is suppressed. Inthe case of our fiducial, Cvisc = 2.1 × 10⁶, this critical value isgiven by Vφ ≈ cs/128. For sound speeds of 103 km s−1, the criticalvalue of Vφ is 10 km s−1 and for low sound speeds of 10 km s−1
it is 0.1 km s−1. Below this critical value, even though a disc/torusforms, transport through the disc is more rapid than the rate at whichmaterial flows through the Bondi radius.
3 B H AC C R E T I O N M O D E L L I N G I NC O S M O L O G I C A L S I M U L AT I O N S
Most cosmological simulations include accretion on to central BHsvia a subgrid model based on the Bondi–Hoyle–Lyttleton accretionmodel (Bondi & Hoyle 1944), possibly adding a coefficient thatattempts to account for the multiphase nature of gas around the BHthat is not resolved at the finite resolution of the simulation (e.g.Di Matteo et al. 2005; Springel et al. 2005; BS09). These modelsassume that the net circulation of gas in the neighbourhood of theBH can be neglected. In this section we will discuss how thesemodels can be extended to account for the circulation of gas. Wefocus our description on the model of BS09, but the extension canequally be applied to other implementations of the Bondi–Hoyle–Lyttleton accretion model. It is inherent in the nature of submodels
MNRAS 454, 1038–1057 (2015)
at Liverpool John M
oores University on N
ovember 11, 2015
http://mnras.oxfordjournals.org/
Dow
nloaded from

The impact of angular momentum on BH accretion 1043
that the density, effective sound speed and circulation of gas at theBondi radius will need to be estimated from coarse scale quantitiesthat are resolved in the simulation.
3.1 The OWLS BH accretion model
Following Springel et al. (2005), a BH seed with a mass mseed isinjected into each new Friends-Of-Friends (FOF) halo that exceedsthe mass threshold, mhalo, min. In order to prevent the BH from beingejected by two-body encounters, the BH seed is assumed to trackthe position of the minimum potential in the halo. Subsequently,BHs grow by two processes: mergers with other BHs or accretionof nearby gas particles. The gas accretion obeys a modified versionof the Bondi–Hoyle–Lyttleton formula:
mBondi = α4πG2M2
BHρ
(c2s + v2)3/2
, (12)
where MBH is the mass of the BH, cs is the sound speed, ρ densityof the local medium and v is the velocity of the BH relative to theambient medium. The coefficient α is a dimensionless efficiencyparameter that is introduced to account for the multiphase nature ofthe gas around the BH. The complex density structure of the ISMcannot be explicitly realized unless the simulations have a resolutionsignificantly better than a few pc (Creasey, Theuns & Bower 2012).In the original Springel et al. (2005) model, α is a fixed numberthat ensures that the BHs grow rapidly during galaxy mergers. Theauthors set α = 100. In BS09, the structure of the dense star-formingISM is treated using an imposed polytropic equation of state thatmatched on to the ideal gas law at a threshold density, n∗
H (Schaye &Dalla Vecchia 2008). Gas at lower densities is assumed to be singlephase, and the macroscopic density to therefore be a good estimateof the gas density at the Bondi radius of the BH. BS09 thereforeextend the model, so that α becomes a function of local density:
α =⎧⎨⎩
1 if nH < n∗H(
nHn∗
H
)β
otherwise. (13)
BS09 show that the parameter β does not play a crucial role in thegrowth of BHs which is usually limited by the AGN feedback. Weset the parameter β to 2 which is the fiducial value in the OWLSproject. We will refer to equations (12) and (13) as the Bondi-likemodel in what follows.
The subgrid accretion model also assumes that the BH accretionrate cannot exceed the Eddington accretion rate limit,
MEdd = 4πGmpMBH
σT c εr, (14)
where mp is the proton mass, σ T is the Thomson cross-section forthe scattering of free electrons and εr is the fraction of the energyliberated per accreted rest mass energy and is set at 0.1. The finalaccretion rate is
mBH = min(mBondi, MEdd). (15)
3.2 Accounting for AM-dependent accretion on the subgridmodel
In order to implement the AM-dependent accretion rate as a sub-grid model, we need to estimate the circulation speed of the gassurrounding a BH using the SPH smoothing kernel. We determine
the weighted AM of the surrounding gas and then divide by thesmoothing length h:
Vφ =∣∣∣∣
NSPH∑i=0
r i × vi miW (r i , h)1
ρh
∣∣∣∣, (16)
where W(r, h) is the SPH smoothing kernel used in an SPH code,h is the SPH smoothing length of the BH and ρ is the smootheddensity given by ρ = ∑NSPH
i=0 miW (ri , h).The cosmological simulations almost never resolve the Bondi
radius, so the subgrid scheme must extrapolate the circularizationspeed that is measured to smaller scales, just as it is needed to extrap-olate the resolved gas density in the neighbourhood of the BH to thedensity at the Bondi radius. Following a similar approach, Vφ(rB)should be extrapolated from the resolved circulation as follows:
Vφ(rB) = (rB
h)γ Vφ(h), (17)
where γ can, in principle, be positive or negative depending on therelative mass of the BH and the structure of the surrounding gas.For simplicity, we will set γ = 0 in this paper. This assumes aflat rotation curve in the region around the BH and those processesthat disrupt the rotation of the accretion disc on resolved scaleswould also disrupt the circulation on the scale of the Bondi radius.Note that the choice of γ is largely degenerate with Cvisc, so that if adifferent value of γ was chosen, Cvisc would have to be recalibrated.
In a cold, rotationally supported gas disc, (Vφ/cs) ≥ 1 on thesmallest scales that we are able to resolve. In this situation, thecircularization lies outside the Bondi radius and we continue toapply equation (8) as the viscous time-scale. Clearly in future workit would be possible to develop a more complex model in which theviscous time-scale had a more complex dependence on the spatialscale of the circularization radius. Our present approach is intendedto be as simple as possible.
The subgrid model provides an estimate of the instantaneousaccretion rate. Following Springel et al. (2005), BH particles aredescribed by two masses, a subgrid mass used in the accretion ratecalculation and a particle mass used in gravitational calculations.This allows the subgrid BH to be less massive than the particle massused in the simulation, but ensures that gravitating mass is strictlyconserved. If the BH subgrid mass exceeds the particle mass, aparticle within the BH neighbourhood is stochastically selected andits mass added to the particle mass of the BH particle. This allowsthe two BH masses to track each other. The surrounding gas particlescontinue to form star and potentially generate outflows.
Calculating the circular velocity using equation (16) gives sta-ble values of Vφ even though the smoothing length and AM mayfluctuate wildly. In order to set an upper limit on the numericalfluctuations in Vφ , we calculate the relative change in Vφ , dVφ/Vφ ,between consecutive time steps. Fig. 2 shows the combined distri-bution for each BH with final mass >106 M�. The distribution ofdVφ/Vφ is well characterized by a Cauchy distribution; we use halfthe 16–84 percentile range to determine a Gaussian-equivalent σ
of 0.20. The distribution includes physically driven changes in theaccretion rate, but the width of the core allows us to set an upperlimit on the numerical noise arising from the SPH averaging of lessthan ∼20percent. This variation is likely to be dominated by phys-ical gas flows (as opposed to numerical noise) driven, for example,by secular evolution and feedback from stars and the BH. We alsofind that the estimated value of the circular speed is largely inde-pendent of the number of neighbours used in the smoothing kernel.Furthermore, in Appendix A1, we show that the values of Vφ and cs
converge well with increasing particle number in idealized galaxy
MNRAS 454, 1038–1057 (2015)
at Liverpool John M
oores University on N
ovember 11, 2015
http://mnras.oxfordjournals.org/
Dow
nloaded from

1044 Y. M. Rosas-Guevara et al.
Figure 2. The normalized distribution of fractional fluctuations of Vφ ,dVφ/Vφ for the BHs in the simulation AM (see Section 4). In order to placean upper limit on the numerical noise in the measurement of Vφ , we com-pute the fractional change between consecutive time steps. This variation isan upper limit on numerical nose since the fluctuations may be dominatedphysical variations in the gas flows near to the BH (driven, for example, byBH and stellar feedback). The form of the histogram is described well by aCauchy distribution with a Gaussian equivalent σ of 0.20.
simulations. Note that our approach is very different from Debuhret al. (2011), who estimate the circular speed using the gravitationalmass only. This difference is important: variations in the circularspeed (driven by local gas conditions) result in distinctive accre-tion patterns for stable discs and merger induced outbursts. Thecircular speed is then used to compute the viscous time-scale usingequation (8), and thus the modified accretion rate using equation(11). The accretion rate is also constrained to be smaller than theEddington accretion rate (see equation 14). Other aspects of the im-plementation are identical to BS09 which we will describe brieflyin Section 4.
4 TH E N U M E R I C A L C O D E A N DH Y D RO DY NA M I C S I M U L AT I O N S
The simulations we present are based on the GADGET-3 SPH code(Springel 2005), adding enhancements to reduce the simulationviscosity when the time derivative of the flow divergence is small(Cullen & Dehnen 2010) and to ensure that time steps of parti-cles receiving feedback energy are limited (Durier & Dalla Vecchia2012). These enhancements will be described in more detail inDalla Vecchia (in preparation). The code uses an extensive networkof subgrid modules to account for the turbulent pressure of the ISM,and implements star formation following the empirical Kennicutt–Schmidt law (Schaye & Dalla Vecchia 2008), chemical enrichment(Wiersma et al. 2009b) and cooling tracking 11 elements (Wiersmaet al. 2009a). These modules were originally developed for theOWLS (Schaye et al. 2010) and GIMIC (Crain et al. 2009) simu-lation projects. Here we use the metallicity-dependent gas densitythreshold of (Schaye 2004, as in OWLS model SFTHRESZ) and arevised treatment of the equation of state (Dalla Vecchia & Schaye2012). Feedback from stars is implemented as stochastic thermalenergy injection events, using a fixed heating temperature of 107.5 K,in order to avoid spurious radiative losses (Dalla Vecchia & Schaye2012, see also Creasey et al. 2011). We moderate the SN feed-back efficiency, fE (the fraction of SN energy available to performfeedback) as a function of the local dark matter velocity dispersion(Oppenheimer & Dave 2006; Okamoto, Gao & Theuns 2008) in or-der to obtain a good match to the faint end slope of the galaxy SMF.
Table 1. A list of the simulations used in this paper. Each simulation hasthe same SN feedback parameters, and a comoving volume of (25 Mpc)3.The simulation use 2 × 3603 particles, with initial baryonic particle mass1.4 × 106 h−1 M� and dark matter mass particle 6.3 × 10⁶ h−1 M�; themass of seed BHs is set mseed = 104 h−1 M� and the minimum halo massin which BH seeds are injected is 1010 h−1 M�. The columns show (1)name of the simulation; (2) efficiency with which energy emitted by a BH iscoupled into the ambient gas; (3) radiative efficiency of BH accretion disc.
Name εf εr Accretion model(1) (2) (3) (4)
NO-AGN – – –BS09 0.15 0.1 Bondi-like accretion
model equations (12) and(13).
BS09-LE 0.015 0.1 Bondi-like accretionmodel equations (12) and(13).
AM 0.15 0.1 AM accretion modelequation (11),Cvisc = 2 × 10⁶.
Appendix B 0.15 0.1 AM accretion model,Cvisc = 6 × 10⁴–6 × 10⁶.
A similar variation is commonly used in semi-analytic models (e.g.Guo et al. 2011; Bower et al. 2012) and is supported by small-scalesimulations of galaxy winds such as Creasey et al. (2012). The feed-back efficiency fE is set as a function of the equivalent halo virialtemperature, varying between 1.0 (in low-temperature haloes) and0.1 (in high-temperature systems), following the equation
fE = 1.0 − 0.9
(1
1 + exp[−2(log T − log T0)
])
. (18)
After some experimentation, we set the transition temperature toT0 = 105.5 K.
In this paper, our focus is the interaction between feedback fromBH accretion and the formation of galaxies. We fix the SN feedbackefficiency and its scaling and vary the parameters of BH feedback.Throughout the paper, for AGN feedback we use the stochasticheating model of BS09 with a heating temperature of 108 K, and adensity power β = 2 in equation (13). By default we assume thatthe energy liberated per accreted rest mass energy is εr = 0.1, andthat the heating efficiency (this is the fraction of liberated energycoupled to the surrounding gas medium) is εf = 0.15; we showthe effect of reducing the heating efficiency in Section 5. Accretionis always limited to be less than the Eddington accretion rate. BHseeds are inserted into haloes that exceed an FOF halo mass of1010 h−1 M�, corresponding to ∼1500 dark matter particles. Suchhaloes are well defined and there is no danger of injecting BHs intospurious systems (BS09). BHs are injected with an initial mass of104 h−1 M�. They are allowed to merge within their SPH smoothingkernel and have relative velocity less than 0.5 of the sound speed ofthe surrounding gas. In Section 3.2, we describe the enhancementof the standard accretion model to account for the circular speed ofgas within the smoothing kernel of the BH.
The simulations presented in this paper are summarized in Ta-ble 1. All the simulations use the same subgrid parameters to de-scribe star formation and stellar feedback, and only differ in the BHsubgrid physics. There are in total four simulations:
(i) NO-AGN: this simulation does not include BH physics.
MNRAS 454, 1038–1057 (2015)
at Liverpool John M
oores University on N
ovember 11, 2015
http://mnras.oxfordjournals.org/
Dow
nloaded from
The impact of angular momentum on BH accretion 1045
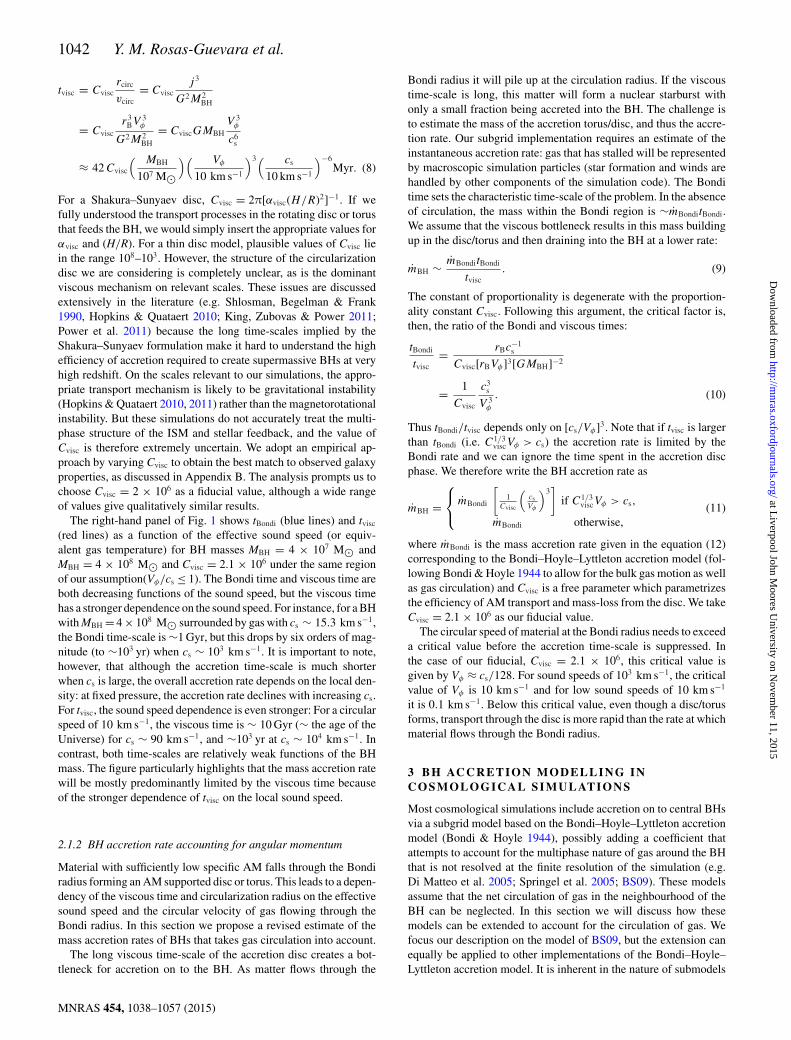
Figure 3. The left-hand panel shows the stellar mass fraction as a function of M200, while the right-hand panel shows the MBH–M200 relation. The lines showthe medians of M∗/M200 (or MBH) for the simulations NO-AGN (yellow, dotted line), BS09 (blue, solid line) and BS09-LE (red, dashed line); see Table 1.The shaded region shows the 10–90 percentile range of the data. The grey dashed and dash–dotted lines in the left-hand panel represent abundance matchingresults derived from Moster et al. (2010) and Guo et al. (2010), respectively, and the grey line in the right-hand panel indicates the observational MBH–M200
relation derived from observations by Bandara, Crampton & Simard (2009). Their observational data is shown as grey points. The figure shows that efficientBH self-regulation creates a strong correlation between BH mass and halo mass, but strongly suppresses the formation of stars across a wide range of halomass. Although changing the efficiency of BH feedback alters the normalization of the MBH–M200 relation, it has little effect on the host galaxy properties.
(ii) BS09: we use BS09’s model with the feedback efficiency setto εf = 0.15 in the Bondi-like accretion equations (12) and (13).Accretion is also limited by the Eddington rate.
(iii) BS09-LE: we set this simulation as the above except that thefeedback efficiency is set to εf = 0.015.
(iv) AM: this simulation uses the AM-dependent accretion modelequation (11), with Cvisc = 2.1 × 10⁶.
The results are not particularly sensitive to the moderate choiceof Cvisc (by two orders of magnitude), and we show some exam-ple variations in Appendix B. All of the models assume that theaccretion rate cannot exceed the Eddington limit (equation 14).
Initial conditions were generated using second-order Lagrangianperturbations (Jenkins 2010) at a starting redshift of 127. Weuse initial gas and dark matter particle masses of 1.4 × 10⁶ and6.3 × 106 h−1 M�, respectively; the comoving gravitational soften-ing lengths are set to 2 h−1 kpc with a maximum physical softeningof 0.5 h−1 kpc. The simulations are carried out in periodic boxes of25 Mpc on each side. The largest structure that forms in the sim-ulation has a mass of 1.65 × 10¹³ M� at z = 0. Comparing withlarge simulation volumes we find that a box of this size does notnoticeably bias galaxy properties as a function of virialized halomass (Haas et al. 2013), allowing us to efficiently test the impactof different subgrid models. Because of the limited box size, wecompare galaxy properties to the stellar fractions (fstar = M∗/M200)inferred from observations as a function of halo mass, rather thanto the galaxy SMF itself.
5 TH E G L O BA L I M PAC T O F B H AC C R E T I O NO N G A L A X I E S
In this section we examine the impact of BH feedback on the galax-ies in the simulations described above. We focus on the stellarmass fraction–M200 (halo mass) relation and the MBH–M200 rela-tion, in particular. We first present results based on the Bondi-like
models (BS09 and BS09-LE), and then contrast them with the AM-dependent model.
5.1 Simulations with BS09 Bondi-like accretion models
First, we look at the simulations based on the Bondi-like accre-tion models, / and BS09-LE, and compare these with the NO-AGNsimulation. The left-hand panel of Fig. 3 shows the stellar massfraction, Mstar/M200 (where the stellar mass is measured within a30 kpc radius), for central galaxies as a function of M200. Giventhe small box size, this provides a convenient way to compare withobservational data. The solid lines represent the median relation inbins of halo mass, with the 10–90 percentile range of the data indi-cated as coloured regions. Grey lines show observational estimatesbased on abundance matching from Moster et al. (2010) and Guoet al. (2010).
The NO-AGN simulation (yellow colour) is consistent with theabundance matching results up to a halo mass of 1012 M�, suggest-ing that in the physical Universe the feedback from AGNs has littleor no effect in low-mass haloes. The lack of AGN feedback leads toan overproduction of stellar mass in above 1011.5 M� haloes in dis-agreement with the abundance matching results. Fig. 3 also showsthe BS09 (blue line) and BS09-LE (red line) simulations. In bothsimulations, the impact of BH feedback has a strong effect on a widerange of halo mass, causing a reduction of the stellar mass fractionby a factor of 2 in 1011 M� haloes mass and an order of magnitudein the high haloes mass at 1012 M� relative to observations. Themodels are incompatible with the observational data across the fullhalo mass range probed.
We note that the effects of AGN feedback become significant atlower masses and are more severe than in the low-redshift OWLSsimulations, which agree well with observations (McCarthy et al.2010), because our particle masses are lower by nearly two ordersof magnitude (allowing us to convincingly resolve galaxies withstellar masses greater than 109 M� with 500 particles).
MNRAS 454, 1038–1057 (2015)
at Liverpool John M
oores University on N
ovember 11, 2015
http://mnras.oxfordjournals.org/
Dow
nloaded from
1046 Y. M. Rosas-Guevara et al.
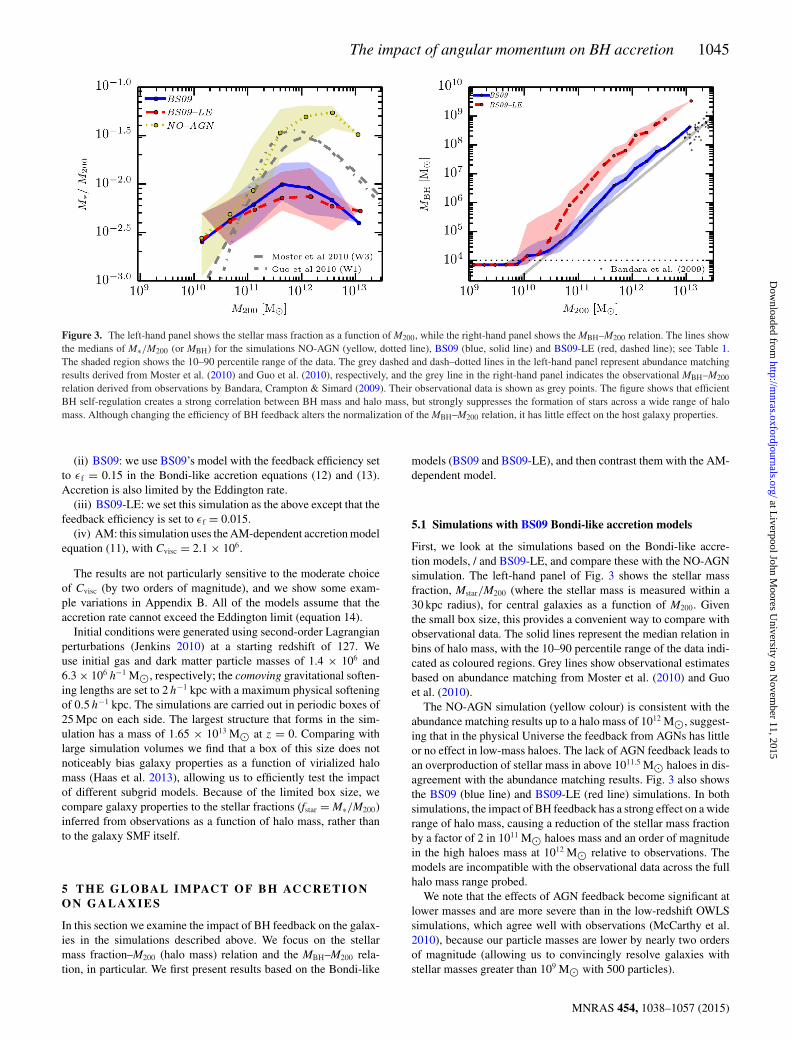
Figure 4. The left-hand panel shows the correlation of stellar mass fraction with M200 for the AM-dependent accretion model, contrasted with two of modelsconsidered in Section 5.1. The right-hand panel shows the MBH–M200 relation for the same models. The yellow dotted line and blue (here dashed) colouredlines correspond to those in Fig. 3. The AM simulation is shown in purple. The AM model results in resemble agreement with both the abundance matchingrelationship of the stellar mass fraction (grey lines) and with the observational MBH–M200 relation. The key to achieving this match is that BHs residing inhaloes with mass below ∼1012 M� grow less than required for self-regulation.
Comparing the simulations BS09 and BS09-LE, where the effi-ciency of feedback differs by an order of magnitude (εf = 0.15 and0.015, respectively), it is clear that the AGN feedback produces asimilar suppression of star formation and low stellar mass fractionsin both runs, which is consistent with the findings of BS09 andBooth & Schaye (2010).
The tendency for the BHs to self-regulate, and thus to correlatestrongly with the binding energy of the (inner) halo has been empha-sized by Booth & Schaye (2010). As a result, a strong correlation isexpected between the BH mass and M200. The right-hand panel ofthe Fig. 3 shows the BH mass as a function of M200 for the BS09 andBS09-LE simulations. In order to provide an observational baseline,black stars show estimates of the BH mass in 48 galaxy-scale stronggravitational lenses from the Sloan lens ACS (Bandara et al. 2009)and grey lines represent the fit of data from Bandara et al. (2009)based on the MBH–σ ∗ relation of Gultekin et al. (2009). The BS09simulation gives a correlation between the BH mass and halo massin good agreement with observations as found by Booth & Schaye(2010). As expected, reducing the feedback efficiency by a factorof 10 produces more massive BHs at fixed halo mass, leading toa MBH–M200 relation that is offset from the observational data. Ashas already been shown by Booth & Schaye (2010), the total feed-back energy remains the same in both models, consistent with theidea that the BHs grow until they begin to unbind the gas halo ofthe system. At this point they become self-regulating growing insynchronization with the halo mass.
The results from the two panels suggest that the self-regulatedgrowth of the BH overwhelms the stellar mass growth of the centralgalaxy if BH accretion is efficient. The gas, which would have beenable to form stars in the absence of AGN feedback, is expelled fromthe system or prevented from accreting, starving the central galaxyof fuel for further star formation. A comparison of the red andblue curves shows that the issue cannot be resolved by altering theefficiency with which energy is deposited. However, following thescenario discussed in Section 2, we have already noted that a vitalcomponent of the accretion model is missing: gas that is supportedby AM cannot accrete as rapidly as the Bondi-like BS09 formulawould suggest.
One unappealing solution is to only inject BHs into higher masshaloes i.e. suppressing the impact of BHs on lower mass galaxies byhand. For example, injecting BHs at a halo mass of 1011.5 h−1 M�provides a good description of galaxy properties. However, this isclearly unsatisfactory: at the resolution we consider, the haloes of1010 h−1 M� contain more than 1500 particles and are well defined.There is no physical justification for not attempting to model BHsin these haloes.
Another simple solution is to adopt a much lower accretionrate. Decreasing β in equation (13) where the multiphase natureof the ISM is ignored, achieves the required goal of suppressingBH growth within galaxies. However, this strongly suppresses theaccretion rates of early BHs making it difficult to form a BH popu-lation at high redshift as required by observations of massive BHsat redshifts ∼7 (Mortlock et al. 2012).
5.2 Simulation with the AM accretion model
In this section, we explore the effect of accounting for AM in themodel. Fig. 4 is similar to Fig. 3, except that we show the AMsimulation where the accretion rates account for AM as in equation(11), in purple. The left-hand panel shows that the AM simulationleads to stellar mass fractions that are in much better agreementwith the abundance matching relation (grey lines) and still able toreproduce the turnover of the relation in high-mass haloes. Note thatthe stellar mass fraction found in haloes less massive than 1012 M�is similar to those in the NO-AGN simulation, supporting the ideathat AGN feedback plays a minor role in regulating star formation insmall galaxies. Looking at the MBH–M200 relation in the right-handpanel, we see that the BHs residing in haloes with masses lower than1012 M� in the AM simulation grow more slowly than expectedfor self-regulation. However, above this halo mass, both modelslock on to the same self-regulated relation, in good agreement withobservations.
The model we have shown adopts Cvisc = 2.1 × 10⁶. The de-pendence of the outcome population on the value of this parameteris surprisingly weak – as illustrated in Appendix B. We will ar-gue below that the mass scale at which BH accretion becomes
MNRAS 454, 1038–1057 (2015)
at Liverpool John M
oores University on N
ovember 11, 2015
http://mnras.oxfordjournals.org/
Dow
nloaded from
The impact of angular momentum on BH accretion 1047
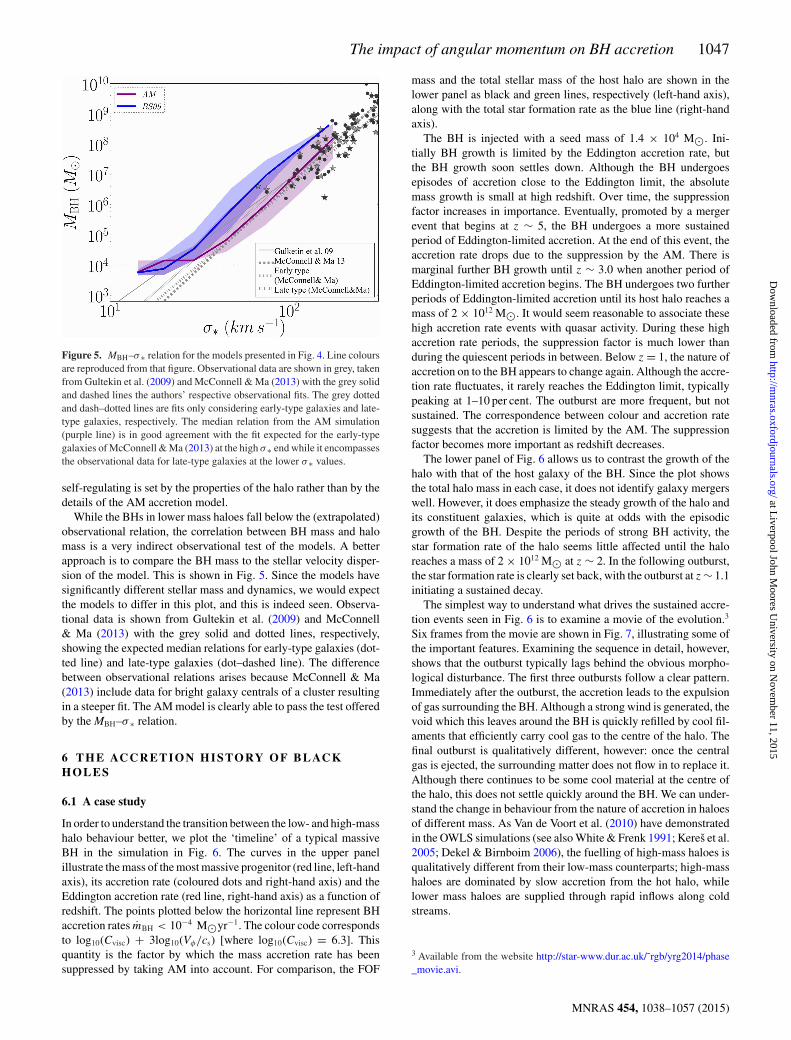
Figure 5. MBH–σ ∗ relation for the models presented in Fig. 4. Line coloursare reproduced from that figure. Observational data are shown in grey, takenfrom Gultekin et al. (2009) and McConnell & Ma (2013) with the grey solidand dashed lines the authors’ respective observational fits. The grey dottedand dash–dotted lines are fits only considering early-type galaxies and late-type galaxies, respectively. The median relation from the AM simulation(purple line) is in good agreement with the fit expected for the early-typegalaxies of McConnell & Ma (2013) at the high σ ∗ end while it encompassesthe observational data for late-type galaxies at the lower σ ∗ values.
self-regulating is set by the properties of the halo rather than by thedetails of the AM accretion model.
While the BHs in lower mass haloes fall below the (extrapolated)observational relation, the correlation between BH mass and halomass is a very indirect observational test of the models. A betterapproach is to compare the BH mass to the stellar velocity disper-sion of the model. This is shown in Fig. 5. Since the models havesignificantly different stellar mass and dynamics, we would expectthe models to differ in this plot, and this is indeed seen. Observa-tional data is shown from Gultekin et al. (2009) and McConnell& Ma (2013) with the grey solid and dotted lines, respectively,showing the expected median relations for early-type galaxies (dot-ted line) and late-type galaxies (dot–dashed line). The differencebetween observational relations arises because McConnell & Ma(2013) include data for bright galaxy centrals of a cluster resultingin a steeper fit. The AM model is clearly able to pass the test offeredby the MBH–σ ∗ relation.
6 T H E AC C R E T I O N H I S TO RY O F B L AC KH O L E S
6.1 A case study
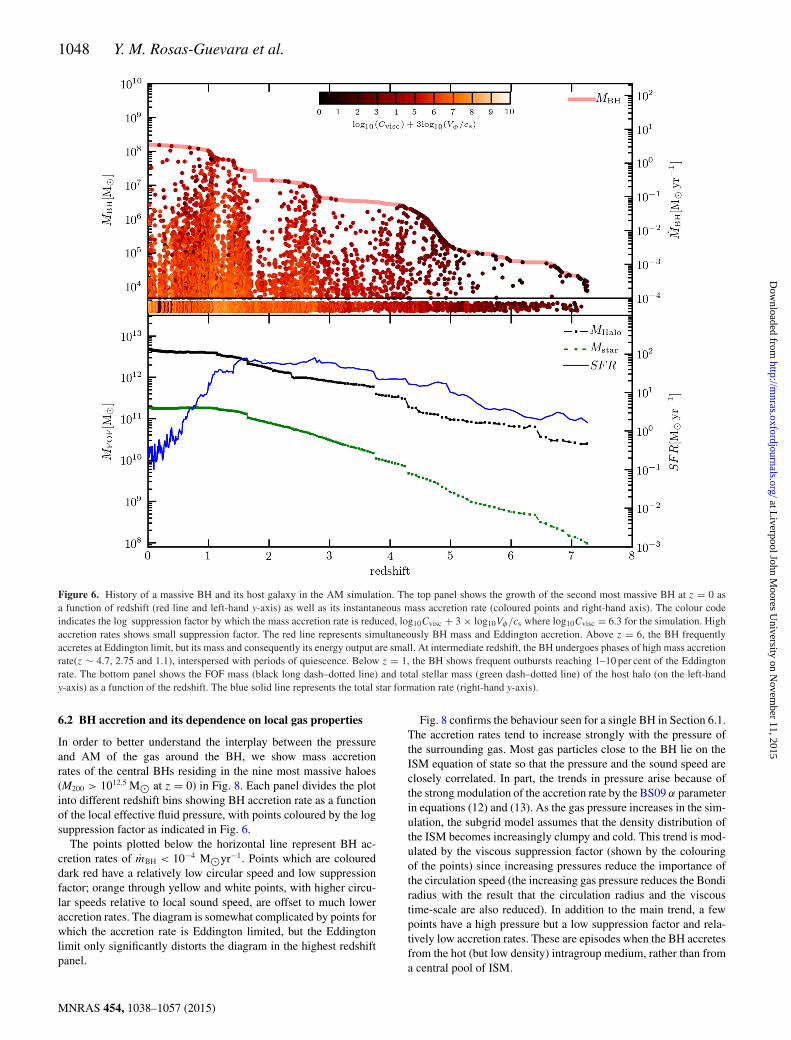
In order to understand the transition between the low- and high-masshalo behaviour better, we plot the ‘timeline’ of a typical massiveBH in the simulation in Fig. 6. The curves in the upper panelillustrate the mass of the most massive progenitor (red line, left-handaxis), its accretion rate (coloured dots and right-hand axis) and theEddington accretion rate (red line, right-hand axis) as a function ofredshift. The points plotted below the horizontal line represent BHaccretion rates mBH < 10−4 M�yr−1. The colour code correspondsto log10(Cvisc) + 3log10(Vφ/cs) [where log10(Cvisc) = 6.3]. Thisquantity is the factor by which the mass accretion rate has beensuppressed by taking AM into account. For comparison, the FOF
mass and the total stellar mass of the host halo are shown in thelower panel as black and green lines, respectively (left-hand axis),along with the total star formation rate as the blue line (right-handaxis).
The BH is injected with a seed mass of 1.4 × 10⁴ M�. Ini-tially BH growth is limited by the Eddington accretion rate, butthe BH growth soon settles down. Although the BH undergoesepisodes of accretion close to the Eddington limit, the absolutemass growth is small at high redshift. Over time, the suppressionfactor increases in importance. Eventually, promoted by a mergerevent that begins at z ∼ 5, the BH undergoes a more sustainedperiod of Eddington-limited accretion. At the end of this event, theaccretion rate drops due to the suppression by the AM. There ismarginal further BH growth until z ∼ 3.0 when another period ofEddington-limited accretion begins. The BH undergoes two furtherperiods of Eddington-limited accretion until its host halo reaches amass of 2 × 10¹² M�. It would seem reasonable to associate thesehigh accretion rate events with quasar activity. During these highaccretion rate periods, the suppression factor is much lower thanduring the quiescent periods in between. Below z = 1, the nature ofaccretion on to the BH appears to change again. Although the accre-tion rate fluctuates, it rarely reaches the Eddington limit, typicallypeaking at 1–10 per cent. The outburst are more frequent, but notsustained. The correspondence between colour and accretion ratesuggests that the accretion is limited by the AM. The suppressionfactor becomes more important as redshift decreases.
The lower panel of Fig. 6 allows us to contrast the growth of thehalo with that of the host galaxy of the BH. Since the plot showsthe total halo mass in each case, it does not identify galaxy mergerswell. However, it does emphasize the steady growth of the halo andits constituent galaxies, which is quite at odds with the episodicgrowth of the BH. Despite the periods of strong BH activity, thestar formation rate of the halo seems little affected until the haloreaches a mass of 2 × 10¹² M� at z ∼ 2. In the following outburst,the star formation rate is clearly set back, with the outburst at z ∼ 1.1initiating a sustained decay.
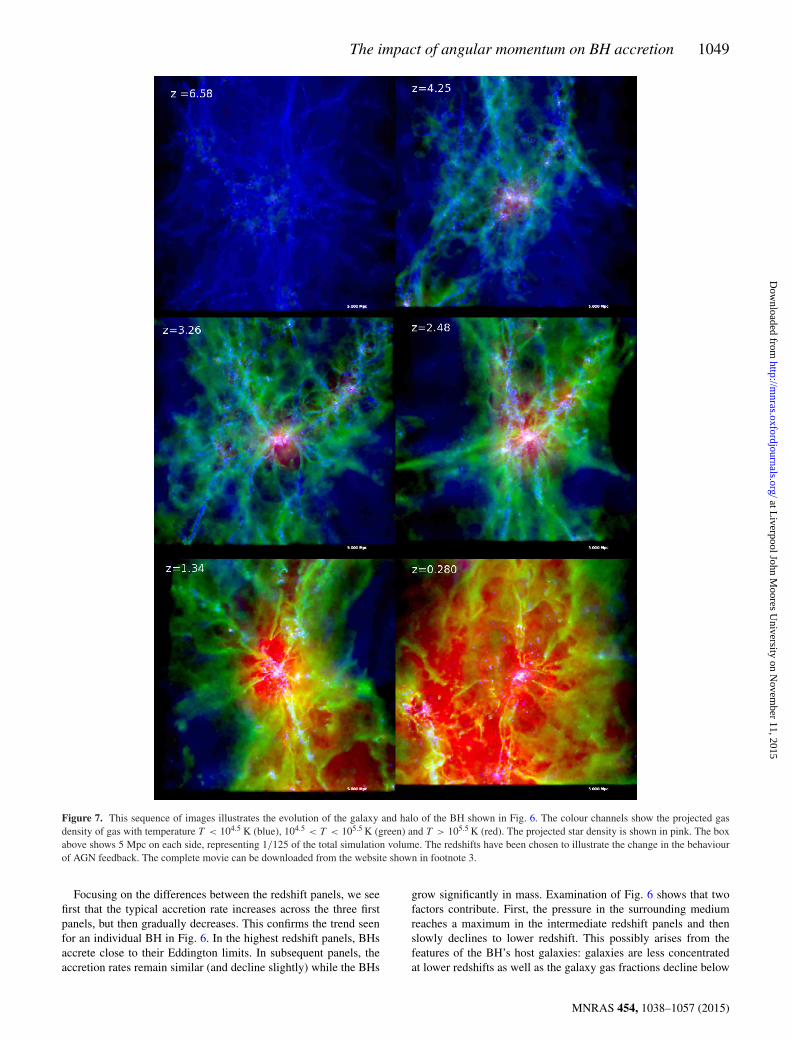
The simplest way to understand what drives the sustained accre-tion events seen in Fig. 6 is to examine a movie of the evolution.3
Six frames from the movie are shown in Fig. 7, illustrating some ofthe important features. Examining the sequence in detail, however,shows that the outburst typically lags behind the obvious morpho-logical disturbance. The first three outbursts follow a clear pattern.Immediately after the outburst, the accretion leads to the expulsionof gas surrounding the BH. Although a strong wind is generated, thevoid which this leaves around the BH is quickly refilled by cool fil-aments that efficiently carry cool gas to the centre of the halo. Thefinal outburst is qualitatively different, however: once the centralgas is ejected, the surrounding matter does not flow in to replace it.Although there continues to be some cool material at the centre ofthe halo, this does not settle quickly around the BH. We can under-stand the change in behaviour from the nature of accretion in haloesof different mass. As Van de Voort et al. (2010) have demonstratedin the OWLS simulations (see also White & Frenk 1991; Keres et al.2005; Dekel & Birnboim 2006), the fuelling of high-mass haloes isqualitatively different from their low-mass counterparts; high-masshaloes are dominated by slow accretion from the hot halo, whilelower mass haloes are supplied through rapid inflows along coldstreams.
3 Available from the website http://star-www.dur.ac.uk/˜rgb/yrg2014/phase_movie.avi.
MNRAS 454, 1038–1057 (2015)
at Liverpool John M
oores University on N
ovember 11, 2015
http://mnras.oxfordjournals.org/
Dow
nloaded from
1048 Y. M. Rosas-Guevara et al.
Figure 6. History of a massive BH and its host galaxy in the AM simulation. The top panel shows the growth of the second most massive BH at z = 0 asa function of redshift (red line and left-hand y-axis) as well as its instantaneous mass accretion rate (coloured points and right-hand axis). The colour codeindicates the log suppression factor by which the mass accretion rate is reduced, log10Cvisc + 3 × log10Vφ/cs where log10Cvisc = 6.3 for the simulation. Highaccretion rates shows small suppression factor. The red line represents simultaneously BH mass and Eddington accretion. Above z = 6, the BH frequentlyaccretes at Eddington limit, but its mass and consequently its energy output are small. At intermediate redshift, the BH undergoes phases of high mass accretionrate(z ∼ 4.7, 2.75 and 1.1), interspersed with periods of quiescence. Below z = 1, the BH shows frequent outbursts reaching 1–10 per cent of the Eddingtonrate. The bottom panel shows the FOF mass (black long dash–dotted line) and total stellar mass (green dash–dotted line) of the host halo (on the left-handy-axis) as a function of the redshift. The blue solid line represents the total star formation rate (right-hand y-axis).
6.2 BH accretion and its dependence on local gas properties
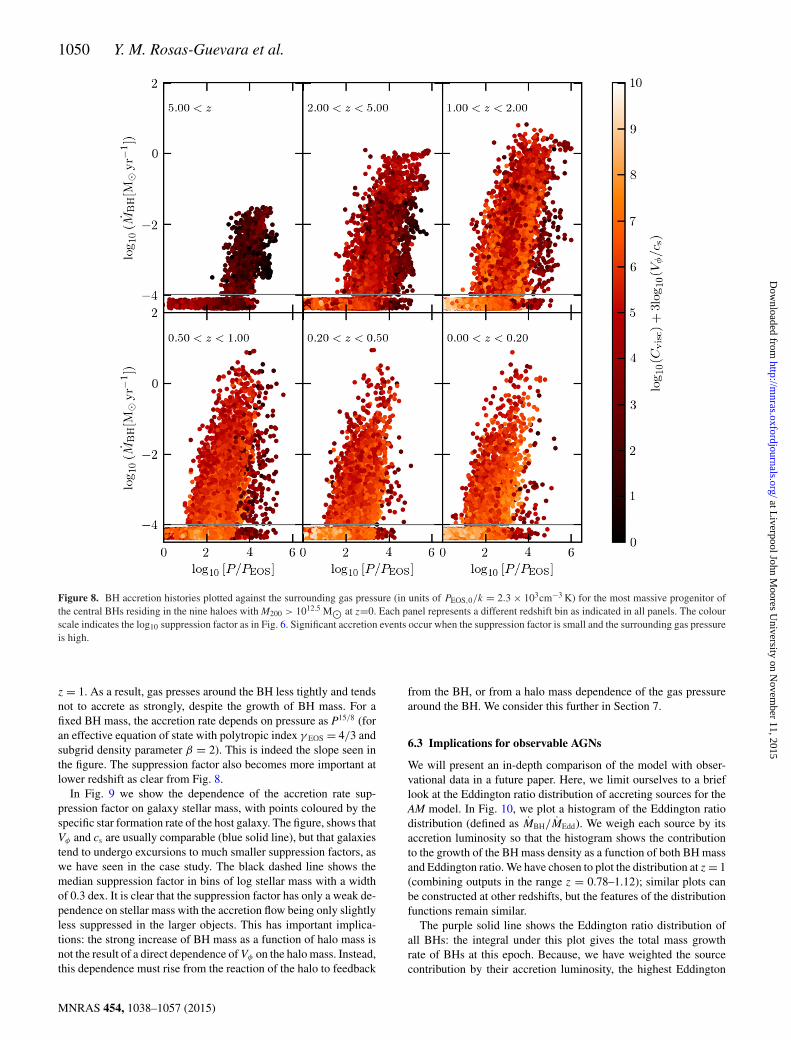
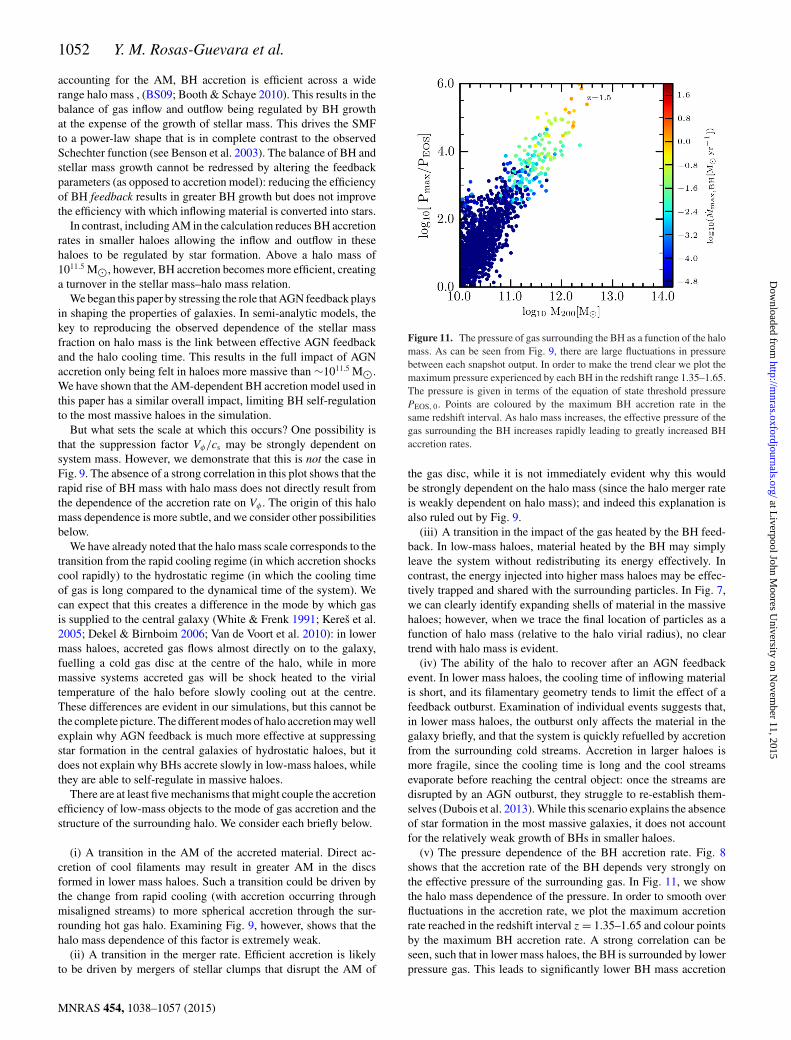
In order to better understand the interplay between the pressureand AM of the gas around the BH, we show mass accretionrates of the central BHs residing in the nine most massive haloes(M200 > 1012.5 M� at z = 0) in Fig. 8. Each panel divides the plotinto different redshift bins showing BH accretion rate as a functionof the local effective fluid pressure, with points coloured by the logsuppression factor as indicated in Fig. 6.
The points plotted below the horizontal line represent BH ac-cretion rates of mBH < 10−4 M�yr−1. Points which are coloureddark red have a relatively low circular speed and low suppressionfactor; orange through yellow and white points, with higher circu-lar speeds relative to local sound speed, are offset to much loweraccretion rates. The diagram is somewhat complicated by points forwhich the accretion rate is Eddington limited, but the Eddingtonlimit only significantly distorts the diagram in the highest redshiftpanel.
Fig. 8 confirms the behaviour seen for a single BH in Section 6.1.The accretion rates tend to increase strongly with the pressure ofthe surrounding gas. Most gas particles close to the BH lie on theISM equation of state so that the pressure and the sound speed areclosely correlated. In part, the trends in pressure arise because ofthe strong modulation of the accretion rate by the BS09 α parameterin equations (12) and (13). As the gas pressure increases in the sim-ulation, the subgrid model assumes that the density distribution ofthe ISM becomes increasingly clumpy and cold. This trend is mod-ulated by the viscous suppression factor (shown by the colouringof the points) since increasing pressures reduce the importance ofthe circulation speed (the increasing gas pressure reduces the Bondiradius with the result that the circulation radius and the viscoustime-scale are also reduced). In addition to the main trend, a fewpoints have a high pressure but a low suppression factor and rela-tively low accretion rates. These are episodes when the BH accretesfrom the hot (but low density) intragroup medium, rather than froma central pool of ISM.
MNRAS 454, 1038–1057 (2015)
at Liverpool John M
oores University on N
ovember 11, 2015
http://mnras.oxfordjournals.org/
Dow
nloaded from
The impact of angular momentum on BH accretion 1049
Figure 7. This sequence of images illustrates the evolution of the galaxy and halo of the BH shown in Fig. 6. The colour channels show the projected gasdensity of gas with temperature T < 104.5 K (blue), 104.5 < T < 105.5 K (green) and T > 105.5 K (red). The projected star density is shown in pink. The boxabove shows 5 Mpc on each side, representing 1/125 of the total simulation volume. The redshifts have been chosen to illustrate the change in the behaviourof AGN feedback. The complete movie can be downloaded from the website shown in footnote 3.
Focusing on the differences between the redshift panels, we seefirst that the typical accretion rate increases across the three firstpanels, but then gradually decreases. This confirms the trend seenfor an individual BH in Fig. 6. In the highest redshift panels, BHsaccrete close to their Eddington limits. In subsequent panels, theaccretion rates remain similar (and decline slightly) while the BHs
grow significantly in mass. Examination of Fig. 6 shows that twofactors contribute. First, the pressure in the surrounding mediumreaches a maximum in the intermediate redshift panels and thenslowly declines to lower redshift. This possibly arises from thefeatures of the BH’s host galaxies: galaxies are less concentratedat lower redshifts as well as the galaxy gas fractions decline below
MNRAS 454, 1038–1057 (2015)
at Liverpool John M
oores University on N
ovember 11, 2015
http://mnras.oxfordjournals.org/
Dow
nloaded from
1050 Y. M. Rosas-Guevara et al.
Figure 8. BH accretion histories plotted against the surrounding gas pressure (in units of PEOS,0/k = 2.3 × 103cm−3 K) for the most massive progenitor ofthe central BHs residing in the nine haloes with M200 > 1012.5 M� at z=0. Each panel represents a different redshift bin as indicated in all panels. The colourscale indicates the log10 suppression factor as in Fig. 6. Significant accretion events occur when the suppression factor is small and the surrounding gas pressureis high.
z = 1. As a result, gas presses around the BH less tightly and tendsnot to accrete as strongly, despite the growth of BH mass. For afixed BH mass, the accretion rate depends on pressure as P15/8 (foran effective equation of state with polytropic index γ EOS = 4/3 andsubgrid density parameter β = 2). This is indeed the slope seen inthe figure. The suppression factor also becomes more important atlower redshift as clear from Fig. 8.
In Fig. 9 we show the dependence of the accretion rate sup-pression factor on galaxy stellar mass, with points coloured by thespecific star formation rate of the host galaxy. The figure, shows thatVφ and cs are usually comparable (blue solid line), but that galaxiestend to undergo excursions to much smaller suppression factors, aswe have seen in the case study. The black dashed line shows themedian suppression factor in bins of log stellar mass with a widthof 0.3 dex. It is clear that the suppression factor has only a weak de-pendence on stellar mass with the accretion flow being only slightlyless suppressed in the larger objects. This has important implica-tions: the strong increase of BH mass as a function of halo mass isnot the result of a direct dependence of Vφ on the halo mass. Instead,this dependence must rise from the reaction of the halo to feedback
from the BH, or from a halo mass dependence of the gas pressurearound the BH. We consider this further in Section 7.
6.3 Implications for observable AGNs
We will present an in-depth comparison of the model with obser-vational data in a future paper. Here, we limit ourselves to a brieflook at the Eddington ratio distribution of accreting sources for theAM model. In Fig. 10, we plot a histogram of the Eddington ratiodistribution (defined as MBH/MEdd). We weigh each source by itsaccretion luminosity so that the histogram shows the contributionto the growth of the BH mass density as a function of both BH massand Eddington ratio. We have chosen to plot the distribution at z = 1(combining outputs in the range z = 0.78–1.12); similar plots canbe constructed at other redshifts, but the features of the distributionfunctions remain similar.
The purple solid line shows the Eddington ratio distribution ofall BHs: the integral under this plot gives the total mass growthrate of BHs at this epoch. Because, we have weighted the sourcecontribution by their accretion luminosity, the highest Eddington
MNRAS 454, 1038–1057 (2015)
at Liverpool John M
oores University on N
ovember 11, 2015
http://mnras.oxfordjournals.org/
Dow
nloaded from

The impact of angular momentum on BH accretion 1051
Figure 9. The dependence of the accretion suppression factor,log10[Cvisc] + 3log10[Vφ/cs], on galaxy stellar mass for the fiducial case,log10Cvisc = 6.3. The dashed line represents the median of the accretionsuppression factor in bins of log galaxy mass with a width of 0.3. The blueline shows the value of log10Cvisc. The panel shows the relation at z = 1, butthe plot is similar at other redshifts. In the majority of galaxies, Vφ and cs arecomparable and the accretion rate is suppressed by a factor Cvisc. In somegalaxies, however, the suppression factor is much smaller and the AM ofthe accreting gas is no longer the limiting time-scale. There is little trend inthe median suppression factor with galaxy mass, as illustrated by the blackdashed line, or with specific star formation rate, as indicated by the coloursof the points.
Figure 10. The distribution of Eddington ratio weighted by the mass ac-cretion rate of each accretion source (i.e. the accretion luminosity). Thisplot shows the distribution at z = 1. The total distribution is shown as apurple line; The contributions of BHs in different mass ranges are illustratedby different colours. For BHs less massive than 108 M�, the distributionsare similar, with larger BHs making a greater contribution to the BH massbudget. Above 108 M�, however, high Eddington ratio sources becomerare.
ratio sources dominate the BH mass growth budget. If we had simplycounted sources, the histogram would show that low Eddingtonratio sources are far more numerous. It is instructive, however,to examine how this distribution is built up for BHs of differentmasses. Different colour lines distinguish the contributions from
BHs of different masses, starting from the lowest mass BHs, below105 M� (grey region), and building up to show the contributionof the most massive BHs, above 108 M� (red region). Becauseof the weighting by accretion rate (or equivalent to luminosity),the smallest BHs contribute little to the total. The shape of theEddington ratio distribution is similar for BH masses up to 108 M�.The relative similarity of the distributions has previously been notedin observational data (Aird et al. 2012).
Above a BH mass of 108 M�, however, high Eddington ratiosources become rare, and the growth of these BHs is dominatedby accretion events that are ∼0.1 of Eddington. Although thereare only a handful of such high-mass BHs in the simulation, theymake a significant contribution to the energy budget because oftheir mass. Studies of quasar clustering suggest that quasars do notoccupy the most massive haloes at low redshift. Instead, massivehaloes are occupied by radio galaxies (Romano-Diaz et al. 2010;Angulo et al. 2012; Fanidakis et al. 2013), whose power outputtends to be in the form of a kinetic jet, but not in the form ofhighly visible luminosity. It is quite plausible that this dichotomyarises from a change in the Eddington rate distribution with BHmass (Meier 2001; Nemmen et al. 2006). We will test this aspect ofthe simulation against observations in more detail in a future paperusing a larger simulation volume.
7 D I SCUSSI ON
The simulations that we have presented in the previous sectionsshow the importance of accounting for the AM of accreting gas.Compared to runs that implement a Bondi-like accretion formula,accounting for the AM of gas surrounding the BH results in less BHgrowth and greater stellar mass growth. This is particularly evidentin haloes less massive than ∼1011.5 M�. Compared to runs that donot include any feedback the revised BH accretion model leads to asharp turnover in the stellar mass fraction of haloes.
In this section, we briefly consider the physical processes thatestablish this behaviour. In particular, we would like to under-stand what creates the transition in BH accretion efficiency at1011−1012 M�. It is notable that this mass scale is weakly depen-dent on the accretion viscosity parameter Cvisc (see Appendix B)which suggests than this mass scale is not caused by the subgridaccretion model. Moreover, this mass scale approximately corre-sponds to the transition between ‘rapid cooling’ haloes, in whichthe cooling time is short compared to the dynamical time, and ‘hy-drostatic’ haloes in which the cooling time is long compared tothe halo dynamical time. The key to understanding the nature ofthis transition is to examine the balance of gas accretion versusstar formation and outflows. Since the mass locked up in stars isrelatively small, the most important consideration is the outflow ofgas. This may be driven by stellar feedback or AGN feedback fromthe growth of the BH. Recent papers have emphasized that outflowslead to self-regulation, both for feedback from star formation andfrom BHs (White & Frenk 1991; Bower et al. 2006, 2008; alsoBooth & Schaye 2010; Schaye et al. 2010; Dubois et al. 2013 andPuchwein & Springel 2013). The observed dependence of stellarmass fraction on halo mass (and hence the shape of the galaxy massfunction) requires that star formation dominates the self-regulationat low-halo masses, while it is dominated by BHs at high stellarmasses. The challenge is to understand why this switchover occurs.
We begin by considering the physical behaviour of Bondi-likeaccretion models. In the simulations presented here, we use alower particle mass than BS09 to better sample star formation inlower mass galaxies, but the same ISM equation of state. Without
MNRAS 454, 1038–1057 (2015)
at Liverpool John M
oores University on N
ovember 11, 2015
http://mnras.oxfordjournals.org/
Dow
nloaded from
1052 Y. M. Rosas-Guevara et al.
accounting for the AM, BH accretion is efficient across a widerange halo mass , (BS09; Booth & Schaye 2010). This results in thebalance of gas inflow and outflow being regulated by BH growthat the expense of the growth of stellar mass. This drives the SMFto a power-law shape that is in complete contrast to the observedSchechter function (see Benson et al. 2003). The balance of BH andstellar mass growth cannot be redressed by altering the feedbackparameters (as opposed to accretion model): reducing the efficiencyof BH feedback results in greater BH growth but does not improvethe efficiency with which inflowing material is converted into stars.
In contrast, including AM in the calculation reduces BH accretionrates in smaller haloes allowing the inflow and outflow in thesehaloes to be regulated by star formation. Above a halo mass of1011.5 M�, however, BH accretion becomes more efficient, creatinga turnover in the stellar mass–halo mass relation.
We began this paper by stressing the role that AGN feedback playsin shaping the properties of galaxies. In semi-analytic models, thekey to reproducing the observed dependence of the stellar massfraction on halo mass is the link between effective AGN feedbackand the halo cooling time. This results in the full impact of AGNaccretion only being felt in haloes more massive than ∼1011.5 M�.We have shown that the AM-dependent BH accretion model used inthis paper has a similar overall impact, limiting BH self-regulationto the most massive haloes in the simulation.
But what sets the scale at which this occurs? One possibility isthat the suppression factor Vφ/cs may be strongly dependent onsystem mass. However, we demonstrate that this is not the case inFig. 9. The absence of a strong correlation in this plot shows that therapid rise of BH mass with halo mass does not directly result fromthe dependence of the accretion rate on Vφ . The origin of this halomass dependence is more subtle, and we consider other possibilitiesbelow.
We have already noted that the halo mass scale corresponds to thetransition from the rapid cooling regime (in which accretion shockscool rapidly) to the hydrostatic regime (in which the cooling timeof gas is long compared to the dynamical time of the system). Wecan expect that this creates a difference in the mode by which gasis supplied to the central galaxy (White & Frenk 1991; Keres et al.2005; Dekel & Birnboim 2006; Van de Voort et al. 2010): in lowermass haloes, accreted gas flows almost directly on to the galaxy,fuelling a cold gas disc at the centre of the halo, while in moremassive systems accreted gas will be shock heated to the virialtemperature of the halo before slowly cooling out at the centre.These differences are evident in our simulations, but this cannot bethe complete picture. The different modes of halo accretion may wellexplain why AGN feedback is much more effective at suppressingstar formation in the central galaxies of hydrostatic haloes, but itdoes not explain why BHs accrete slowly in low-mass haloes, whilethey are able to self-regulate in massive haloes.
There are at least five mechanisms that might couple the accretionefficiency of low-mass objects to the mode of gas accretion and thestructure of the surrounding halo. We consider each briefly below.
(i) A transition in the AM of the accreted material. Direct ac-cretion of cool filaments may result in greater AM in the discsformed in lower mass haloes. Such a transition could be driven bythe change from rapid cooling (with accretion occurring throughmisaligned streams) to more spherical accretion through the sur-rounding hot gas halo. Examining Fig. 9, however, shows that thehalo mass dependence of this factor is extremely weak.
(ii) A transition in the merger rate. Efficient accretion is likelyto be driven by mergers of stellar clumps that disrupt the AM of
Figure 11. The pressure of gas surrounding the BH as a function of the halomass. As can be seen from Fig. 9, there are large fluctuations in pressurebetween each snapshot output. In order to make the trend clear we plot themaximum pressure experienced by each BH in the redshift range 1.35–1.65.The pressure is given in terms of the equation of state threshold pressurePEOS, 0. Points are coloured by the maximum BH accretion rate in thesame redshift interval. As halo mass increases, the effective pressure of thegas surrounding the BH increases rapidly leading to greatly increased BHaccretion rates.
the gas disc, while it is not immediately evident why this wouldbe strongly dependent on the halo mass (since the halo merger rateis weakly dependent on halo mass); and indeed this explanation isalso ruled out by Fig. 9.
(iii) A transition in the impact of the gas heated by the BH feed-back. In low-mass haloes, material heated by the BH may simplyleave the system without redistributing its energy effectively. Incontrast, the energy injected into higher mass haloes may be effec-tively trapped and shared with the surrounding particles. In Fig. 7,we can clearly identify expanding shells of material in the massivehaloes; however, when we trace the final location of particles as afunction of halo mass (relative to the halo virial radius), no cleartrend with halo mass is evident.
(iv) The ability of the halo to recover after an AGN feedbackevent. In lower mass haloes, the cooling time of inflowing materialis short, and its filamentary geometry tends to limit the effect of afeedback outburst. Examination of individual events suggests that,in lower mass haloes, the outburst only affects the material in thegalaxy briefly, and that the system is quickly refuelled by accretionfrom the surrounding cold streams. Accretion in larger haloes ismore fragile, since the cooling time is long and the cool streamsevaporate before reaching the central object: once the streams aredisrupted by an AGN outburst, they struggle to re-establish them-selves (Dubois et al. 2013). While this scenario explains the absenceof star formation in the most massive galaxies, it does not accountfor the relatively weak growth of BHs in smaller haloes.
(v) The pressure dependence of the BH accretion rate. Fig. 8shows that the accretion rate of the BH depends very strongly onthe effective pressure of the surrounding gas. In Fig. 11, we showthe halo mass dependence of the pressure. In order to smooth overfluctuations in the accretion rate, we plot the maximum accretionrate reached in the redshift interval z = 1.35–1.65 and colour pointsby the maximum BH accretion rate. A strong correlation can beseen, such that in lower mass haloes, the BH is surrounded by lowerpressure gas. This leads to significantly lower BH mass accretion
MNRAS 454, 1038–1057 (2015)
at Liverpool John M
oores University on N
ovember 11, 2015
http://mnras.oxfordjournals.org/
Dow
nloaded from
The impact of angular momentum on BH accretion 1053
rates. This trend re-enforces itself: the lower accretion rates lead toslower BH growth and hence to a lower accretion rate at a fixed gaspressure. In contrast, higher mass haloes generate higher pressuresaround the BH, leading to higher accretion rates and higher BHmasses which, in turn, have higher accretion rates at a fixed pressure.
Qualitatively, this picture is confirmed by the images shown inFig. 7, and in the linked animation (see footnote 3). During theearly universe, haloes are able to recover quickly due to the strongfilamentary nature of their accretion. Although there are sporadicbursts of energy injection from the BH, these do little to suppressthe continuous inflow of gas filaments. At late times, however, theBH is able to couple effectively to the surrounding halo, disruptingfilamentary gas accretion and establishing a hot gas envelope thatappears to be pressure supported. The disruption of filaments isonly part of the BH impact, however. While it may explain thesuppression of gas inflow (and hence star formation) in high-masshaloes, it does not provide an explanation for the low accretionrates of BHs in low-mass haloes. The low growth rates of BHs inlower mass haloes can, however, be accounted for by looking atthe pressure of the gas surrounding the BH. The pressure shows astrong increase with halo mass, greatly increasing the resulting BHaccretion rates.
Fig. 9 shows that the suppression of the accretion rate due tothe AM does not have a strong halo mass dependence. Over longtime-scales, and averaged over the population of objects, the effectis to renormalize the accretion rate relative to the Bondi-like BS09formula 12. The AM model does however, play an important rolein the determining the duty cycle of energy input. As a result ofthe AM variations, high mBH accretion events are interspersed withquiescent periods during which the stellar component of the galaxygrows strongly, as shown in Fig. 6. The history of each individual BHis, however, complex and a combination of all the mechanisms maycontribute at some level. The net effect is similar, but not identical,to the mechanisms invoked by semi-analytic models (Bower et al.2006; Croton et al. 2006); significantly more work is required toexplore the similarities and differences, and to capture the behaviourof the simulation in a simple but quantitative model.
8 C O N C L U S I O N S
We have presented a development of the subgrid accretion modelof BS09, based on Springel et al. (2005), that takes into account theAM of the accreting gas using the local SPH kernel to estimate thecircular speed at the Bondi radius and to define the circularizationradius of the material passing through the Bondi radius. This createsan additional time-scale in the accretion of gas on to a BH whichcharacterizes the transport of material through the disc and thefraction of this material ejected out of the disc before it is accreted bythe BH. We incorporate this new time-scale into a revised accretionrate estimate that can be simply implemented as a subgrid model incosmological simulations.
Two BH accretion models are tested: one using the prescriptionof BS09 and one with the updated AM model. The cosmologicalsimulations include gas cooling, metal enrichment, star formationand SN feedback which we keep fixed. We show that simulationsthat do not account for the circulation of gas in the neighbour-hood of the BH result in self-regulation of the gas supply by BHgrowth rather than star formation. As a result BH masses correlatewell with the parent halo over a wide range of scales, but self-regulation by the BH results in insufficient star formation to matchthe observed dependence of stellar mass on halo mass in low-masshaloes.
In contrast, when the AM is taken into account, the accretion time-scale is increased and BH accretion rates are strongly suppressedin haloes less massive than 1011.5 M�. This allows stars to formefficiently and for the balance of gas inflow and outflow to be set bystellar feedback. At higher halo mass, the effective pressure of gassurrounding the BH increases, compensating for the lower accretionrates of the AM model. As a result, a strong division into two regimesof galaxy formation emerges from the model. Below a halo massof ∼1011.5 M�, we find that the presence of the BH has little effecton forming galaxies, but above this halo mass star formation issuppressed and galaxies grow much more slowly in stellar masscompared to the growth of their haloes. The model broadly matchesthe observed stellar mass fractions of haloes and reproduces theexpected correlation between the stellar velocity dispersion and BHmass (McConnell & Ma 2013). The distribution of BH accretionrates also seems compatible with that observed (Aird et al. 2012).The model thus provides a promising prescription for cosmologicalsimulations.
We speculate that there are two critical factors that establish thebreak in the galaxy SMF. The first is the ability of the BH to accretethe material; accounting for the AM of the material surrounding theBH suppresses accretion from quiescent discs allowing the growthof the galaxy in galactic mass haloes to be regulated by star for-mation. The second is the response of the halo gas to outbursts ofBH activity. This introduces a strong dependence on the ratio ofcooling time to dynamical time of the halo through (i) the abilityof the inflowing filaments to re-establish themselves following abrief episode of energy injection from the BH and (ii) the pressur-ization of the halo as a quasi-hydrostatic hot corona is established.In lower mass haloes the cold gas disc surrounding the BH quicklyrecovers because of the rapid supply of fresh material from the sur-rounding cosmic web. In high-mass haloes, filamentary accretion isdisrupted by the hot corona. As a result, star formation in the mostmassive galaxies is strongly suppressed and the break in the SMFis established.
The BH model presented here forms the basis of the accretionmodel used in the EAGLE simulation project (Schaye et al. 2015).The EAGLE simulations use β = 0, which allows the α factor,discussed in Section 3.1, to be absorbed into the parameter Cvisc. TheEAGLE simulations have larger volume than the work presentedhere allowing an examination of the observable predictions of themodel, such as the evolution of the accretion rate distribution andthe correlations between episodes of star formation and BH growthin more detail.
Although the current simulations suggest a promising way for-ward to include the AM of infalling gas in subgrid models of BHaccretion, a great deal of work remains to be done. Larger volumecalculations are required to determine accurately the break in thegalaxy SMF and to probe the quasar luminosity function, sincethese are both determined by rare objects. Clearly, one of the mostimportant future steps is to base the choice of the Cvisc parameteron finer-scale simulations that simultaneously resolve the circular-ization radius and the multiphase structure and turbulence of theISM around the BH. For the foreseeable future, such a multiscaleapproach seems the only feasible route to capture simultaneouslythe microphysics of BH accretion and the large-scale distributionof galaxies and quasars.
AC K N OW L E D G E M E N T S
We thank James Mullaney, Nicolas Tejos, James Aird and RobThacker for a careful reading of the paper, useful comments
MNRAS 454, 1038–1057 (2015)
at Liverpool John M
oores University on N
ovember 11, 2015
http://mnras.oxfordjournals.org/
Dow
nloaded from
1054 Y. M. Rosas-Guevara et al.
and discussions. This work would have not been possible with-out Lydia Heck’s technical support. YMR-G gratefully acknowl-edges financial support from the Mexican Council for Scienceand Technology (CONACYT) (Studentship no. 213183). CSF ac-knowledges an ERC Advanced Investigator grant, COSMIWAY(GA 267291). This work used the DiRAC Data Centric systemat Durham University, operated by the Institute for Computa-tional Cosmology on behalf of the STFC DiRAC HPC Facil-ity (www.dirac.ac.uk). This equipment was funded by BIS Na-tional E-infrastructure capital grant ST/K00042X/1, STFC cap-ital grant ST/H008519/1, and STFC DiRAC Operations grantST/K003267/1 and Durham University. DiRAC is part of theNational E-Infrastructure. This work was supported by the Scienceand Technology Facilities Council (ST/F001166/1,ST/L00075X/1),European Research Council under the European Union’s SeventhFramework Programme (FP7/2007-2013)/ERC Grant agreement278594-GasAroundGalaxies, the Netherlands Organization for Sci-entific Research (NWO) and Interuniversity Attraction Poles Pro-gramme initiated by the Belgian Science Policy Office [AP P7/08CHARM]. We thank contributors to SCIPY,4 MATPLOTLIB5 and thePYTHON programming language.6
R E F E R E N C E S
Aird J. et al., 2012, ApJ, 746, 90Angles-Alcazar D., AUzel F., Dave R., 2013, ApJ, 770, 5Angulo R. E., Springel V., White S. D. M., Cole S., Jenkins A., Baugh C.
M., Frenk C. S., 2012, MNRAS, 425, 2722Antognini J., Bird J., Martini P., 2012, ApJ, 756, 116Balsara D. S., 1995, J. Comput. Phys., 121, 357Bandara K., Crampton D., Simard L., 2009, ApJ, 704, 1135Barai P. et al., 2013, MNRAS, 430, 3213Benson A. J., Bower R. G., Frenk C. S., Lacey C. G., Baugh C. M., Cole S.,
2003, ApJ, 599, 38Birzan L., Rafferty D. A., Nulsen P. E. J., McNamara B. R., Rottgering H.
J. A., Wise M. W., Mittal R., 2012, MNRAS, 427, 3468Bondi H., Hoyle F., 1944, MNRAS, 104, 273Booth C. M., Schaye J., 2009, MNRAS, 398, 53 (BS09)Booth C. M., Schaye J., 2010, MNRAS, 405, L1Bower R. G., Benson A. J., Malbon R., Helly J. C., Frenk C. S., Baugh C.
M., Cole S., Lacey C. G., 2006, MNRAS, 370, 645Bower R. G., McCarthy I. G., Benson A. J., 2008, MNRAS, 390, 1399Bower R. G., Benson A. J., Crain R. J., 2012, MNRAS, 422, 2816Buat-Menard V., Hameury J.-M., Lasota J.-P., 2001, A&A 369, 925Cannizzo J. K., 2001a, ApJ, 556, 847Cannizzo J. K., 2001b, ApJ, 561, L175Crain R. A. et al., 2009, MNRAS, 399, 1773Creasey P., Theuns T., Bower G. R., Lacey C. G., 2011, MNRAS, 415, 3706Creasey P., Theuns T., Bower G. R., 2013, MNRAS, 429, 1922Croton D. J. et al., 2006, MNRAS, 365, 11Cullen L., Dehnen W., 2010, MNRAS, 408, 669Dalla Vecchia C., Schaye J., 2008, MNRAS, 387, 1431Dalla Vecchia C., Schaye J., 2012, MNRAS, 426, 140DeBuhr J., Quataert E., Ma C. -P., 2011, MNRAS, 412, 1341Dekel A., Birnboim Y., 2006, MNRAS, 368, 2Di Matteo T., Springel V., Hernquist L., 2005, Nature, 433, 604Dubois Y., Devriendt Y., Slyz A., Teyssier R., 2010, MNRAS, 409, 985Dubois Y., Pichon C., Devriendt J., Silk J., Haehnelt M., Kimm T., Slyz A.,
2013, MNRAS, 428, 2885Durier F., Vecchia D. C., 2012, MNRAS, 419, 465
4 http://www.scipy.org5 http://www.matplotlib.sourceforge.net6 http://www.python.org
Fanidakis N., Maccio A. V., Baugh C. M., Lacey C. G., Frenk C. S., 2013,MNRAS, 436, 315
Gultekin K. et al., 2009, ApJ, 698, 198Guo Q., White S., Li C., Boylan–Kolchin M., 2010, MNRAS, 404,
1111Guo Q. et al., 2011, MNRAS, 413, 101Haas M. R., Schaye J., Booth C. M., Vecchia C. D., Springel V., Theuns T.,
Wiersma P. C., 2013, MNRAS, 435, 2931Hernquist L., 1990, ApJ, 356, 359Hopkins P. F., Quataert E., 2010, MNRAS, 407, 1529Hopkins P. F., Quataert E., 2011, MNRAS, 415, 1027Hopkins P. F., Hernquist L., Cox T. J., Di Matteo T., Robertson B., Springel
V., 2006, ApJS, 163, 1Hopkins P. F., Hernquist L., Cox T. J., Keres D., 2008, ApJS, 175, 356Jenkins A., 2010, MNRAS, 403, 1859DaveKeres D., Katz N., Fardal M., Weinberg D. H., 2005, MNRAS,
353, 2King A. R., Pringle J. E., Livio M., 2007, MNRAS, 376, 1740King A. R., Zubovas K., Power C., 2011, MNRAS, 415, L6Komatsu E. et al., 2011, ApJS, 192, 18Krumholz M. R., McKee C. F., Klein R. I., 2005, ApJ, 618, 757Ma C. J., McNamara B. R., Nulsen P. E. J., 2013, ApJ, 763, 63McCarthy I. G., Schaye J., Ponman T. J., Bower R. G., Booth C. M., Dalla
Vecchia C., Crain R. A., Springel V., 2010, MNRAS, 406, 822McCarthy I. G. et al., 2011, MNRAS, 412, 1965McConnell N. J., Ma C.-P., 2013, ApJ, 764, 184McNamara B. R., Nulsen P. E. J., 2007, ARA&A, 45, 117Magorrian J. et al., 1998, ApJ, 115, 2285Meier D. L., 2001, ApJ, 548, L9Mortlock D. J., Patel M., Warren S. J, Hewett P. C., Venemans B. P., McMa-
hon R. G., Simpson C. J., 2012, MNRAS, 419, 390Moster B. P., Somerville R. S., Maulbetsch C., v. d. Bosch F. C., Maccio’
A. V., Naab T., Oser L., 2010, ApJ, 710, 903Muldrew S. I., Pearce F. R., Power C., 2013, MNRAS, preprint
(arXiv:1306.4327)Mullaney J. R. et al., 2012, ApJ, 753, 2Nemmen R. S., Bower R. G., Babul A., Storchi-Bergmann T., 2007,
MNRAS, 377, 1652Okamoto T., Gao L., Theuns T., 2008, MNRAS, 390, 920Oppenheimer B. D., Dave R., 2006, MNRAS, 373, 1265Power C., Nayakshin S., King A., 2011, MNRAS, 412, 269Puchwein E., Springel V., 2013, MNRAS, 428, 2966Romano-Diaz E., Schlosman I., Trenti M., Hoffman Y., 2010, ApJ, 736, 66Schaye J., 2004, ApJ, 609, 667Schaye J., Dalla Vechia C., 2008, MNRAS, 383, 1210Schaye J. et al., 2010, MNRAS, 402, 1536Schaye J. et al., 2015, MNRAS, 446, 521Schreiber M. R., Hameury J. -M., Lasota J.-P., 2004, A&A, 427, 621Sellwood J. A., 2012, ApJ, 751, 44Shakura N.I., Sunyaev R. A., 1973, A&A, 24, 337Shlosman I., Begelman M. C., Frank J., 1990, Nature, 345, 679Sijacki D., Springel V., Di Matteo T., Hernquist L., 2007, MNRAS, 380,
877Sijacki D., Vogelsberger M., Genel S., Springel V., Torrey P., Snyder G. F.,
Nelson D., Hernquist L., 2015, MNRAS, 452, 575Springel V., 2005, MNRAS, 364, 1105Springel V., Di Matteo T., Hernquist L., 2005, MNRAS, 361, 776Stringer M. J., Bower R. G., Cole S., Frenk C. S., Theuns T., 2012, MNRAS,
423, 1596Tremaine S. et al., 2002, ApJ, 574, 740van de Voort F., Schaye J., Booth C. M., Haas M. R., Dalla Vecchia C.,
2011, MNRAS, 414, 2458Vogelsberger M. et al., 2014, MNRAS, 444, 1518White D. M. S., Frenk S. C., 1991 ApJ, 379, 52Wiersma R. P. C., Schaye J., Theuns T., Smith B. D, 2009a, MNRAS, 393,
99Wiersma R. P. C., Schaye J., Theuns T., Dalla Vecchia C., Tornatore L.,
2009b, MNRAS, 399, 574
MNRAS 454, 1038–1057 (2015)
at Liverpool John M
oores University on N
ovember 11, 2015
http://mnras.oxfordjournals.org/
Dow
nloaded from
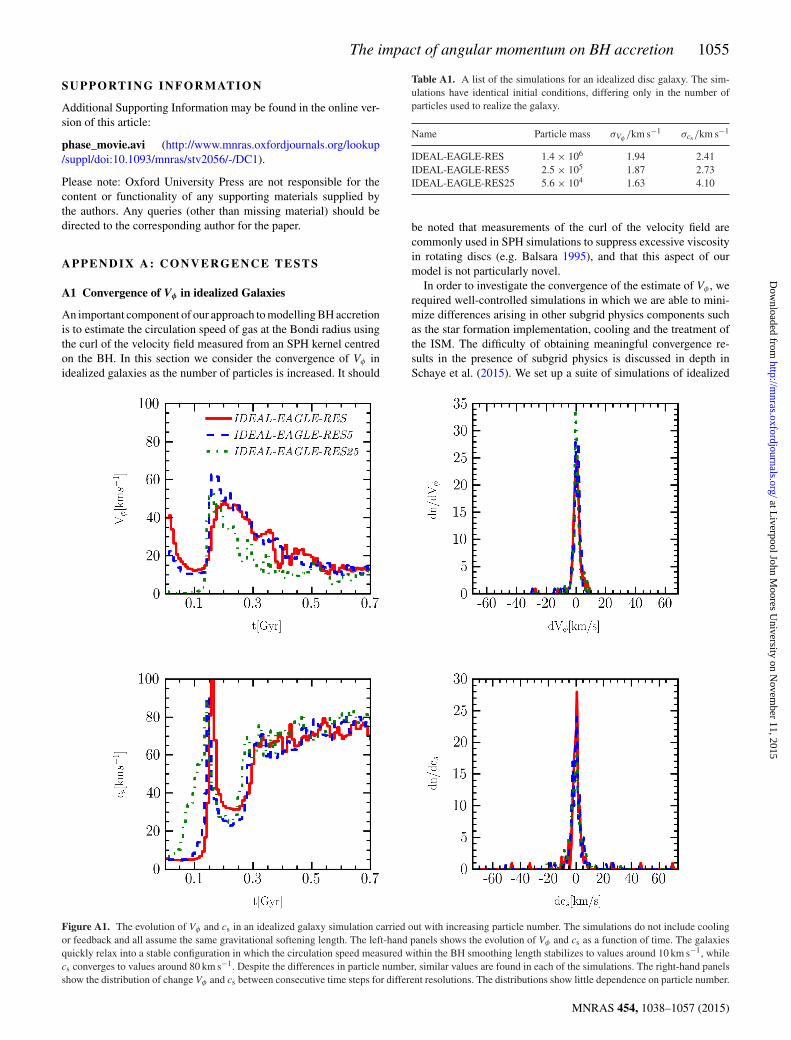
The impact of angular momentum on BH accretion 1055
S U P P O RT I N G IN F O R M AT I O N
Additional Supporting Information may be found in the online ver-sion of this article:
phase_movie.avi (http://www.mnras.oxfordjournals.org/lookup/suppl/doi:10.1093/mnras/stv2056/-/DC1).
Please note: Oxford University Press are not responsible for thecontent or functionality of any supporting materials supplied bythe authors. Any queries (other than missing material) should bedirected to the corresponding author for the paper.
A P P E N D I X A : C O N V E R G E N C E T E S T S
A1 Convergence of Vφ in idealized Galaxies
An important component of our approach to modelling BH accretionis to estimate the circulation speed of gas at the Bondi radius usingthe curl of the velocity field measured from an SPH kernel centredon the BH. In this section we consider the convergence of Vφ inidealized galaxies as the number of particles is increased. It should
Table A1. A list of the simulations for an idealized disc galaxy. The sim-ulations have identical initial conditions, differing only in the number ofparticles used to realize the galaxy.
Name Particle mass σVφ /km s−1 σcs /km s−1
IDEAL-EAGLE-RES 1.4 × 10⁶ 1.94 2.41IDEAL-EAGLE-RES5 2.5 × 10⁵ 1.87 2.73IDEAL-EAGLE-RES25 5.6 × 10⁴ 1.63 4.10
be noted that measurements of the curl of the velocity field arecommonly used in SPH simulations to suppress excessive viscosityin rotating discs (e.g. Balsara 1995), and that this aspect of ourmodel is not particularly novel.
In order to investigate the convergence of the estimate of Vφ , werequired well-controlled simulations in which we are able to mini-mize differences arising in other subgrid physics components suchas the star formation implementation, cooling and the treatment ofthe ISM. The difficulty of obtaining meaningful convergence re-sults in the presence of subgrid physics is discussed in depth inSchaye et al. (2015). We set up a suite of simulations of idealized
Figure A1. The evolution of Vφ and cs in an idealized galaxy simulation carried out with increasing particle number. The simulations do not include coolingor feedback and all assume the same gravitational softening length. The left-hand panels shows the evolution of Vφ and cs as a function of time. The galaxiesquickly relax into a stable configuration in which the circulation speed measured within the BH smoothing length stabilizes to values around 10 km s−1, whilecs converges to values around 80 km s−1. Despite the differences in particle number, similar values are found in each of the simulations. The right-hand panelsshow the distribution of change Vφ and cs between consecutive time steps for different resolutions. The distributions show little dependence on particle number.
MNRAS 454, 1038–1057 (2015)
at Liverpool John M
oores University on N
ovember 11, 2015
http://mnras.oxfordjournals.org/
Dow
nloaded from
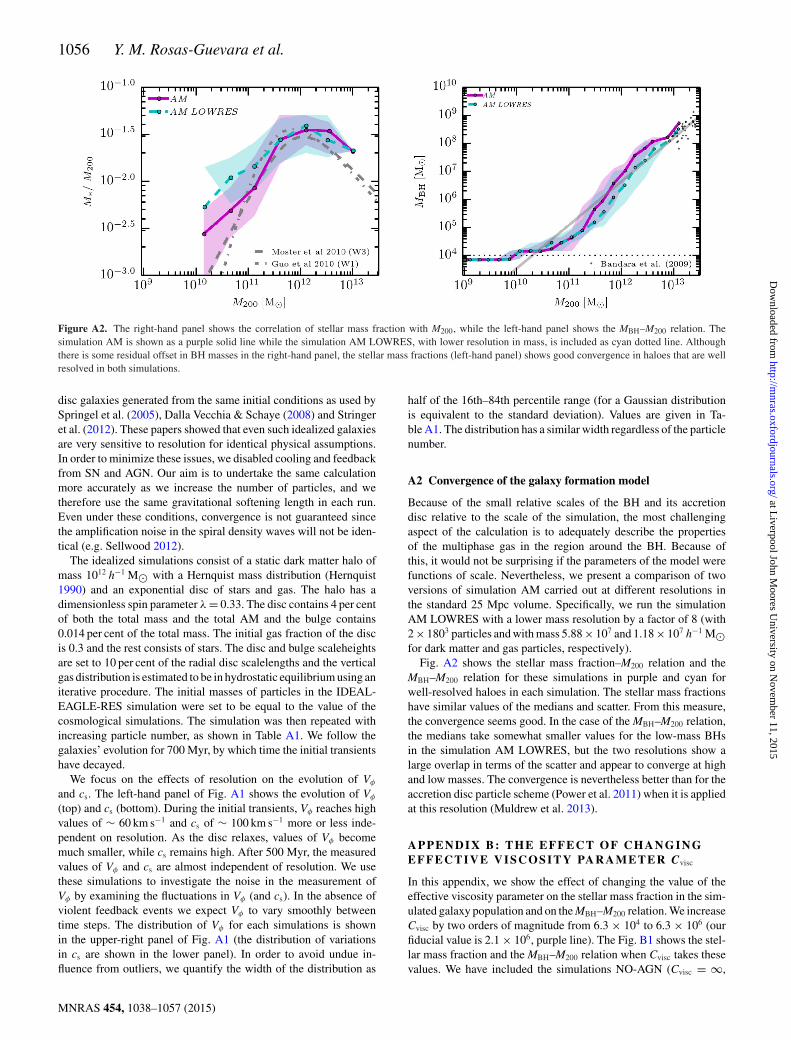
1056 Y. M. Rosas-Guevara et al.
Figure A2. The right-hand panel shows the correlation of stellar mass fraction with M200, while the left-hand panel shows the MBH–M200 relation. Thesimulation AM is shown as a purple solid line while the simulation AM LOWRES, with lower resolution in mass, is included as cyan dotted line. Althoughthere is some residual offset in BH masses in the right-hand panel, the stellar mass fractions (left-hand panel) shows good convergence in haloes that are wellresolved in both simulations.
disc galaxies generated from the same initial conditions as used bySpringel et al. (2005), Dalla Vecchia & Schaye (2008) and Stringeret al. (2012). These papers showed that even such idealized galaxiesare very sensitive to resolution for identical physical assumptions.In order to minimize these issues, we disabled cooling and feedbackfrom SN and AGN. Our aim is to undertake the same calculationmore accurately as we increase the number of particles, and wetherefore use the same gravitational softening length in each run.Even under these conditions, convergence is not guaranteed sincethe amplification noise in the spiral density waves will not be iden-tical (e.g. Sellwood 2012).
The idealized simulations consist of a static dark matter halo ofmass 1012 h−1 M� with a Hernquist mass distribution (Hernquist1990) and an exponential disc of stars and gas. The halo has adimensionless spin parameter λ = 0.33. The disc contains 4 per centof both the total mass and the total AM and the bulge contains0.014 per cent of the total mass. The initial gas fraction of the discis 0.3 and the rest consists of stars. The disc and bulge scaleheightsare set to 10 per cent of the radial disc scalelengths and the verticalgas distribution is estimated to be in hydrostatic equilibrium using aniterative procedure. The initial masses of particles in the IDEAL-EAGLE-RES simulation were set to be equal to the value of thecosmological simulations. The simulation was then repeated withincreasing particle number, as shown in Table A1. We follow thegalaxies’ evolution for 700 Myr, by which time the initial transientshave decayed.
We focus on the effects of resolution on the evolution of Vφ
and cs. The left-hand panel of Fig. A1 shows the evolution of Vφ
(top) and cs (bottom). During the initial transients, Vφ reaches highvalues of ∼ 60 km s−1 and cs of ∼ 100 km s−1 more or less inde-pendent on resolution. As the disc relaxes, values of Vφ becomemuch smaller, while cs remains high. After 500 Myr, the measuredvalues of Vφ and cs are almost independent of resolution. We usethese simulations to investigate the noise in the measurement ofVφ by examining the fluctuations in Vφ (and cs). In the absence ofviolent feedback events we expect Vφ to vary smoothly betweentime steps. The distribution of Vφ for each simulations is shownin the upper-right panel of Fig. A1 (the distribution of variationsin cs are shown in the lower panel). In order to avoid undue in-fluence from outliers, we quantify the width of the distribution as
half of the 16th–84th percentile range (for a Gaussian distributionis equivalent to the standard deviation). Values are given in Ta-ble A1. The distribution has a similar width regardless of the particlenumber.
A2 Convergence of the galaxy formation model
Because of the small relative scales of the BH and its accretiondisc relative to the scale of the simulation, the most challengingaspect of the calculation is to adequately describe the propertiesof the multiphase gas in the region around the BH. Because ofthis, it would not be surprising if the parameters of the model werefunctions of scale. Nevertheless, we present a comparison of twoversions of simulation AM carried out at different resolutions inthe standard 25 Mpc volume. Specifically, we run the simulationAM LOWRES with a lower mass resolution by a factor of 8 (with2 × 1803 particles and with mass 5.88 × 10⁷ and 1.18 × 10⁷ h−1 M�for dark matter and gas particles, respectively).
Fig. A2 shows the stellar mass fraction–M200 relation and theMBH–M200 relation for these simulations in purple and cyan forwell-resolved haloes in each simulation. The stellar mass fractionshave similar values of the medians and scatter. From this measure,the convergence seems good. In the case of the MBH–M200 relation,the medians take somewhat smaller values for the low-mass BHsin the simulation AM LOWRES, but the two resolutions show alarge overlap in terms of the scatter and appear to converge at highand low masses. The convergence is nevertheless better than for theaccretion disc particle scheme (Power et al. 2011) when it is appliedat this resolution (Muldrew et al. 2013).
A P P E N D I X B : T H E E F F E C T O F C H A N G I N GEFFECTI VE V I SCOSI TY PARAMETER Cvisc
In this appendix, we show the effect of changing the value of theeffective viscosity parameter on the stellar mass fraction in the sim-ulated galaxy population and on the MBH–M200 relation. We increaseCvisc by two orders of magnitude from 6.3 × 10⁴ to 6.3 × 10⁶ (ourfiducial value is 2.1 × 10⁶, purple line). The Fig. B1 shows the stel-lar mass fraction and the MBH–M200 relation when Cvisc takes thesevalues. We have included the simulations NO-AGN (Cvisc = ∞,
MNRAS 454, 1038–1057 (2015)
at Liverpool John M
oores University on N
ovember 11, 2015
http://mnras.oxfordjournals.org/
Dow
nloaded from
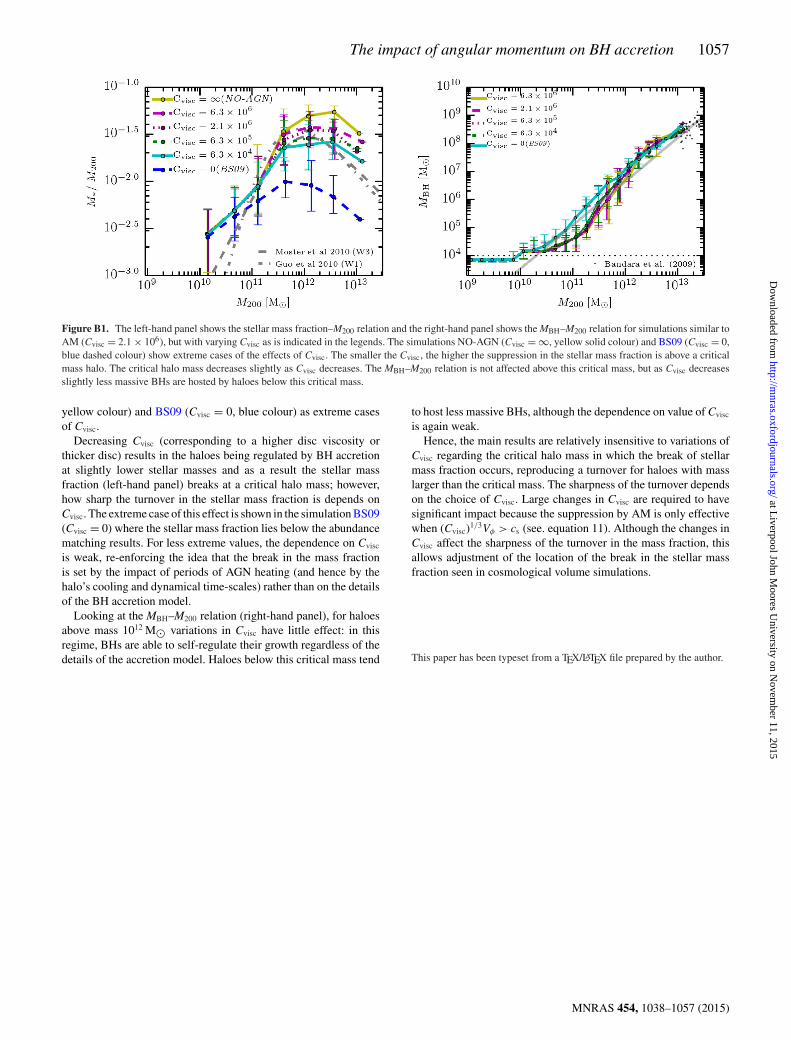
The impact of angular momentum on BH accretion 1057
Figure B1. The left-hand panel shows the stellar mass fraction–M200 relation and the right-hand panel shows the MBH–M200 relation for simulations similar toAM (Cvisc = 2.1 × 10⁶), but with varying Cvisc as is indicated in the legends. The simulations NO-AGN (Cvisc = ∞, yellow solid colour) and BS09 (Cvisc = 0,blue dashed colour) show extreme cases of the effects of Cvisc. The smaller the Cvisc, the higher the suppression in the stellar mass fraction is above a criticalmass halo. The critical halo mass decreases slightly as Cvisc decreases. The MBH–M200 relation is not affected above this critical mass, but as Cvisc decreasesslightly less massive BHs are hosted by haloes below this critical mass.
yellow colour) and BS09 (Cvisc = 0, blue colour) as extreme casesof Cvisc.
Decreasing Cvisc (corresponding to a higher disc viscosity orthicker disc) results in the haloes being regulated by BH accretionat slightly lower stellar masses and as a result the stellar massfraction (left-hand panel) breaks at a critical halo mass; however,how sharp the turnover in the stellar mass fraction is depends onCvisc. The extreme case of this effect is shown in the simulation BS09(Cvisc = 0) where the stellar mass fraction lies below the abundancematching results. For less extreme values, the dependence on Cvisc
is weak, re-enforcing the idea that the break in the mass fractionis set by the impact of periods of AGN heating (and hence by thehalo’s cooling and dynamical time-scales) rather than on the detailsof the BH accretion model.
Looking at the MBH–M200 relation (right-hand panel), for haloesabove mass 1012 M� variations in Cvisc have little effect: in thisregime, BHs are able to self-regulate their growth regardless of thedetails of the accretion model. Haloes below this critical mass tend
to host less massive BHs, although the dependence on value of Cvisc
is again weak.Hence, the main results are relatively insensitive to variations of
Cvisc regarding the critical halo mass in which the break of stellarmass fraction occurs, reproducing a turnover for haloes with masslarger than the critical mass. The sharpness of the turnover dependson the choice of Cvisc. Large changes in Cvisc are required to havesignificant impact because the suppression by AM is only effectivewhen (Cvisc)1/3Vφ > cs (see. equation 11). Although the changes inCvisc affect the sharpness of the turnover in the mass fraction, thisallows adjustment of the location of the break in the stellar massfraction seen in cosmological volume simulations.
This paper has been typeset from a TEX/LATEX file prepared by the author.
MNRAS 454, 1038–1057 (2015)
at Liverpool John M
oores University on N
ovember 11, 2015
http://mnras.oxfordjournals.org/
Dow
nloaded from