Embed Size (px)
Citation preview
The Impact of Campaign Visits on Predicted Voter Choice in the 2016 Presidential Election
Magdeline J. Hedrick
Thesis submitted to the faculty of the Virginia Polytechnic Institute and State University
in partial fulfillment of the requirements for the degree of
Master of Arts
In
Political Science
Caitlin E. Jewitt, Chair
Karen M. Hult
Jason P. Kelly
September 19, 2018
Blacksburg, VA
Keywords: 2016 Presidential Election, Campaign Effects, Campaign Visits, U.S. Presidential
Elections
The Impact of Campaign Visits on Predicted Voter Choice in the 2016 Presidential Election
Magdeline J. Hedrick
ABSTRACT
This thesis conducted research on the impact of campaign visits on levels of predicted voter
choice within the 2016 U.S. Presidential election. Data on discrete events throughout the
campaign were collected to first determine the impact of particular newsworthy events on
predicted voter choice. The data show that the impact of these events dissipates prior to Election
Day, leading to a minimal impact on voter decision making. Additionally, data were analyzed on
the occurrence of both candidate and surrogate visits, attempting to add to the field of research
regarding the impact of campaign visits on voters. Throughout the analysis, both safe and swing
states were taken into consideration, to determine if campaigns have a similar impact in different
types of states. Overall, fourteen individual states were examined, providing a rather small
sample size, but focusing on where campaigns were concentrated most. The results showed that
the minimal effects hypothesis is still mostly affirmed, but that candidate visits appear to have a
greater influence on predicted voter choice than do surrogate visits, regardless of the popularity
of the surrogate.
The Impact of Campaign Visits on Predicted Voter Choice in the 2016 Presidential Election
Magdeline J. Hedrick
GENERAL AUDIENCE ABSTRACT
This thesis conducted research on the impact that candidate visits had on voters. The research
focused on the 2016 U.S. Presidential election. In addition to focusing on the role of campaign
visits, eight specific events from the campaign were selected to attempt to determine the impact
that newsworthy events had on voters. The data show that the impact of these events is not
lasting and does not appear to have an impact on the outcome of the election. Additionally,
visits by both candidates and surrogates (those visiting on behalf of a candidate) were analyzed
in order to determine whether these visits led to a change in voter choice. Throughout the
analysis, states favoring one candidate as well as divided or swing states were taken into
consideration to determine if campaigns impacted voters in different states in different ways.
Overall, fourteen individual states were examined, providing a rather small sample size, but
focusing on where campaigning was concentrated most. The results showed that candidate visits
have very little impact on whom voters ultimately choose, but that candidate visits appear to
have a greater influence on this than do surrogate visits, regardless of the popularity of the
surrogate.
iv
Table of Contents
Abstract………………………………………………………………………………..…..….ii
General Audience Abstract…………………………………………………………..….….iii
Table of Contents………………………………………………………………………...…..iv
List of Tables…………………………………………………………………………………..v
List of Figures……………………………………………………………….…………...........vi
Chapter One: Introduction………………………………………………………………...…....1
Introduction...................................................................................................................1
Goal of Research………………………………………………………………………3
Theoretical Framework……………………………………………………………….5
Literature Review………………………………………..……………………………7
Outcome…………………………………………………………………………...…..8
Chapter Two: Research Design and Methods….……………………………………….......10
Questions and Variables………………………………………………………...….10
Hypotheses and Methods………………………………………………………..….12
Chapter Three: Findings……………………………………………………………………...20
Hypothesis One………………………………………………………………….….20
Hypothesis Two……………………………………………………………………..34
Hypothesis Three…………………………………………………………………...38
Summary…………………………………………………………………………....42
Chapter Four: Discussion and Conclusion..…………………………………………………..43
Discussion……………………………………………………………………….…..43
Conclusion…………………………………………………………………..............45
Bibliography………………………………………………………………………………..49
Appendices………………………………………………………………………………….53
Appendix A: Chart of Discrete Events…………………………………………....53
Appendix B: Change in Support Following Discrete Events- Ipsos Polls………55
Appendix C: Total Number of Visits for Each Party…………………………....69
Appendix D: Occurrence of Campaign Visits by State………………………….70
v
List of Tables
3.1 Ipsos Polls Change in Support- Ohio……………………………………………………...25
3.2 Ipsos Polls Change in Support- Pennsylvania…………………………………………….27
3.3 Ipsos Polls Change in Support- Arizona…………………………………………………..29
3.4 Ipsos Polls Change in Support- Georgia…………………………………………………..30
3.5 Ipsos Polls Change in Support- Texas……………………………………………………..31
3.6 Impact of Campaign Visits on Trump’s level of Support- Safe and Swing States……..35
3.7 Impact of Campaign Visits- Swing States……………………………….………………...36
3.8 Impact of Campaign Visits- Safe States…………………...………..……..………………37
3.9 Impact of Republican Candidate and Surrogate Visits……..…………………………...39
3.10 Impact of Democratic Candidate and Surrogate Visits…………………………….......40

vi
List of Figures
3.1 Change in Support- Swing States……………………………………………………….…21
3.2 Change in Support- Safe States……………………………………………………………22
1
Chapter One: Introduction
Introduction
The outcome of the 2016 presidential election was one of the most dynamic and
unexpected in U.S. history. Both candidates were “unprecedented” in some way and the
campaign was riddled with scandals and breaking news stories (Kurtzleben 2016). Because of
the heavy volume of news coverage on the campaign as well as the extensive use of surrogates
throughout the campaign, the 2016 election presents a good case for studying the impact of
campaign appearances on predicted voter choice. Throughout the 2016 general election
campaign, both candidates campaigned extensively and also utilized surrogates to a high degree.
In fact, in the last 100 days of the campaign, Donald Trump stopped in the six states of Florida,
Pennsylvania, Ohio, North Carolina, Michigan, and Wisconsin “a total of 133” times. “Over the
same time period, Hillary Clinton visited the first five of those states a total of 87 times,” (Terrell
2016). Although these numbers are impressive, these counts do not include the number of visits
conducted by the numerous surrogates both candidates utilized. Because of the interesting
dynamic of the campaign including that Clinton had a greater number of surrogates and that
Trump himself made a large number of campaign stops, 2016 presents a strong test case for
analyzing the impact that campaign appearances have on predicted voter choice. This thesis
examines the impact of such appearances as well as the effects that discrete events have on
polling numbers. It also examines the impact of a candidate visit versus a surrogate visit on
expressed voter preferences prior to the election.
Presidential campaigns are a widely debated phenomena in American politics.
Researchers have examined the question “do campaigns matter?” in many different ways.
2
Political science scholarship seems to be rather inconclusive when determining the answer to this
question. Holbrook (1996) states throughout his research that campaigns do in fact have an
impact on public opinion regarding the outcome of elections, but that the evidence of how great
the impact is can be difficult to measure (45). He also provides some clarity as to the goal of
campaigns, stating that “campaign events are expected to have an effect on public opinion: This
effect is to influence changes in candidate preference during the campaign period” (Holbrook
1996, 63-64). The expectation when conducting this research is that campaign appearances will
lead to a change in predicted voter choice. Because the goal of the campaign is to influence
voters regarding their choice of candidate, it is expected that candidate and surrogate
appearances will impact this choice. The goal of this project is to explore just how much of an
impact campaign visits by candidates and surrogates have on voter preferences.
Although some researchers agree that campaigns do in fact affect the outcomes of
elections, others believe that there is not enough evidence to support this. The latter argue that
because campaigns are constants, they are already taken into account in election data and so do
not impact the outcome (Bélanger and Soroka 2012, 703). Because the norm for 20th and early
21st century elections includes extensive campaigning, it is hard to determine the actual effect of
campaigns since there is no way to examine an election without the presence of campaigns
(Bélanger and Soroka 2012, 703). In addition, because both candidates campaign, some assume
that campaign effects cancel out one another, which leads to the conclusion that campaigns do
not matter in the outcome of elections (Lewis-Beck and Tien 2012, 233). Likewise, Hill,
Rodriquez, and Wooden (2010) “present no evidence that appearances by a candidate changed
the outcome of an election, either in one state or nationally” or had a meaningful impact on the
“margin of victory” (244, 246). Research conducted by Herr (2002) tends to agree, stating that
3
less than 8% of voters shift their preferences during the campaign, and that most of those that do
change their preferences during the campaign “tend to cancel one another out” (905).
Others argue that campaigns are an essential decision-making aspect of the election
process in that they help voters to decide whether they will vote and for whom they will vote.
Holbrook states that 63% of voters already know for whom they will vote by the end of the
nominating conventions. Although this would seem to be an argument against the role of
campaigns, he states that, “the remaining 37% constitute a significant portion of the electorate
that, if mobilized by a campaign, can play an important role in the outcome” (Holbrook 1996,
12). Additionally, this 37% of voters tend to be those without strong loyalty to a particular party,
and are therefore more likely to be convinced by aspects of a campaign (Holbrook 1996, 12).
Holbrook expands on these thoughts by stating that although campaigns may only influence a
very small percentage of the electorate, they could be particularly important in closer elections
(Holbrook 1996, 13). This is important to note, especially with the closeness of elections over the
past several election cycles.
Goal of Research
As elections have become more competitive in recent years with a smaller margin of
victory for the winning candidate, campaigns have narrowed in scope to target particular
audiences, specifically those in states holding larger numbers of votes in the Electoral College.
This targeted approach to campaigning raises the question of whether focused campaign events
make a difference to voters. Evidence of the changing nature of campaigns can be seen by
looking at the number of states where campaigns have been focused in more recent elections. In
2004, both candidates focused their campaign efforts across 11 states (Nagourney and Seelye
4
2004). The 2008 election saw campaigns focused in 15 states, and 2012 targeted only nine states
(Abramowitz 2012; Peters 2012). This trend continued for the 2016 election. In fact, for the 2016
election, two-thirds of all candidate visits occurred in only six states (Florida, Michigan, North
Carolina, Ohio, Pennsylvania, and Virginia) (National Popular Vote). This points to questions
surrounding the impact of campaign visits on predicted voter choice within these targeted states.
Because campaigning has narrowed to focus on fewer states in recent years, the question of how
much of an impact it actually has on voter choice becomes even more important to answer. This
project answers this question in the context of the 2016 presidential election by asking, “Did
campaign visits affect predicted voter choice?” More specifically, this research explores the role
that campaign visits played over the course of the election in shifting levels of predicted voter
choice at the state level.
Although there are several different facets of presidential campaigns, campaign visits by
major-party candidates or high-ranking surrogates from the traditional start of the campaign on
Labor Day (September 5, 2016) through Election Day (November 8, 2016) are the primary focus
of this research. Most of the current literature does not examine the impact of candidate and
surrogate visits; however, other relevant scholarship has been conducted on campaigns and
should be examined.
There have been several other compelling research projects conducted which study the
impact of campaigns and appearances; however, this project does not only assess the impact of
candidate visits, but also considers the impact that surrogate visits have on shifting voter
preferences. Previous literature tends to focus on campaigns as a whole, failing to isolate specific
facets of the campaign, such as visits. Although there has been some research on the impact of
campaign events, the work defines such events very broadly and does not focus specifically on
5
candidate visits nor does it often mention the impact of surrogate visits. In recent campaigns,
candidates have made more stops in fewer states and surrogates have been used heavily. With
this becoming the new norm of campaigns, it is important to understand the impact these aspects
have on the outcome of the election as measured through predicted voter choice. The goal of this
research is to add to empirical evidence from the 2016 presidential general election by examining
the role of campaign visits in influencing predicted voter choice as well as the impact that
discrete events have on voter preferences throughout the campaign.
Theoretical Framework
Before examining the impact that campaign visits have on predicted voter choice, the
reasoning behind this expected outcome must be explored. There has been previous research
conducted that indicates campaign visits may have an impact on predicted voter choice. Voters
have a desire and a need for knowledge about candidates that helps them decide for whom they
will vote. One of the main places they acquire this knowledge is from campaign events and the
news coverage that is generated as a result of these events. Holbrook (1996) elaborates on this
theory by explaining the “‘on-line’… model of candidate evaluation” (52). In this theory, he
states that as events occur, voters are exposed to more information regarding the candidates. The
information spread by these events “cause[s] a corresponding shift in candidate support toward
the candidate favored by the event. When the next important event occurs, it is expected that
mass opinion will again shift in the direction of the candidate favored by that event” (Holbrook
1996, 53). As voters are exposed to information throughout the campaign, they continue to “stay
‘on-line’… and update their evaluations of the candidate as events unfold and new information is
made available” (Holbrook 1996, 53).
6
Although not all voters are exposed to campaign events directly, the impact of a
campaign event, particularly a visit, reaches more potential voters than simply those that attend
the event. The news media play an important role in extending the impact of campaign events,
allowing for the information to be spread to more voters. Despite the fact that news media
coverage is not directly considered as a variable in this thesis, the impact of visits on voter
decision making is still analyzed thoroughly. The occurrences of specific campaign visits are
considered, which allow for changes in the polls surrounding these events to reflect the impact
that a visit had, whether it is from news coverage or the exposure of the voters that actually
attended the event.
When considering the audience that attends campaign events, several different schools of
thought exist on this as well. Researchers have found evidence that campaigns, and more
particularly campaign events, target both strong party members expected to vote for the
candidate as well as “swing voters and independents” (Dawkins 2017, 101). It is interesting that
these groups may be the intended target of campaign events whereas undecideds are not
mentioned, as both of the former groups are already expected to vote in the election. This is one
facet of the thesis that is greatly limited, because there is no inclusion of data on what type of
voters attended the campaign events. Although the results show the net changes in support which
helps to account for decisions made by undecideds, the results do not separate out impacts from
event exposure and news coverage. There is no way to account for which impacts come from
those attending the events and which come from additional news coverage or advertisements.
While this may be a weakness of the paper, the research still examines the overall impact that
visits appear to have on predicted voter choice, using the occurrence of visits as an indicator of
7
voter exposure to information, whether by attending an event or seeing news coverage from an
event.
Literature Review
Because of the numerous opinions that exist regarding campaign impacts, many different
studies have been conducted on this topic. These studies focus on the overall impact of
campaigns, looking at multiple factors and compiling their overall impact on the outcome of the
vote. Examples of this can be seen in the research of Holbrook. His research on the role of
campaigns analyzed the impact that conventions, debates, campaign events, and national
conditions collectively had on changes in public opinion leading up to an election (Holbrook
1996, 151). Likewise, the research conducted by Hansen and Pedersen (2014) focused on the
impact of campaigns on public opinion, but their approach took a wider perspective, defining
“election campaign” in a very loose manner, with the goal of determining if election campaigns
have an influence on voter choice (303). Additional examples can be drawn from the research of
Erikson and Wlezien. Their research tends to focus more on the durability of campaign effects
and whether or not certain effects persist throughout the campaign to Election Day. Additionally,
they focus more on the shifts in voter preference during the campaign rather than what
specifically seems to influence these fluctuations in voter preference (Erikson and Wlezien 2012,
2).
When looking at the literature that focuses more specifically on the impact of campaign
visits, several more recent studies have examined campaigns as a whole. Hill, Rodriquez, and
Wooden address the changing nature of the minimal effects hypothesis. They explain this long
term supposition by stating that “one explanation of the minimal effects hypothesis is that one
8
candidate’s efforts are offset by the efforts of his or her opponent…. The result is that any
electoral advantage from the actions of one candidate is mitigated by the responses of an
opponent. Both candidates are effective, but there is no visible change in voter support” (Hill,
Rodriquez, and Wooden 2010, 248). Although the minimal effects hypothesis has lost ground in
recent years, some researchers still support this prediction. As the hypothesis has been
reexamined, some researchers have supported it, while others have concluded that campaigns
help to increase voter awareness of the campaign, often leading to slightly increased voter
participation, if not a shift in preferences (Hill, Rodriquez, and Wooden 2010, 244; Herr 2002,
905). This increased level of participation could potentially be used as a measure for the impact
of appearances, but it would be difficult to determine which candidate’s appearances impacted
the voters if their preference was not swayed by the visit (Herr 2002, 906).
Outcomes
In order to better measure the phenomena of campaigns, campaign appearances are
examined more closely in conjunction with predicted voter choice to determine possible overall
impacts. Campaign appearances are analyzed by looking at the direct relationship between
candidate and surrogate visits and changes in each candidates’ level of support. An additional
level of analysis is present when considering the impact that discrete events have on predicted
voter choice. This analysis is presented as the first hypothesis. The research shows that the
impacts of discrete events on voter preferences are not lasting and dissipate prior to Election
Day. This finding then allows for analysis to shift focus to further research regarding campaign
appearances, since the data demonstrates that discrete events do not impact the final outcome of
the election. The second hypothesis focuses on the connection between the number of
9
appearances and the percentage change in the level of support for each candidate. This analysis is
done both in swing states and safe states. The findings indicate that there is no direct relationship
between the number of campaign appearances and the percentage change in each candidates’
support.
Finally, the third hypothesis looks at the differing impact of candidate visits versus
surrogate visits. The results show that even though there is little overall impact from campaign
appearances, candidate visits do appear to lead to greater shifts in predicted voter choice than do
surrogate visits. These findings present new evidence that can be added to the current literature
on the subject. It appears that campaign appearances do not lead to sizeable changes in predicted
voter choice. Although the results do not suggest that campaign appearances have much effect,
they still lead to important conclusions regarding the role of surrogates as well as the impact of
discrete events on levels of support for each candidate as measured through predicted voter
choice.
In the following sections, the research design of this thesis is explained. First, the
variables under consideration and the key questions are presented, followed by an examination of
the methods used to conduct this research. Throughout the methods section, three hypotheses
emerge that direct the focus of this research to discrete events throughout the campaign, the
impact of campaign visits on predicted voter choice, and the role that surrogates play in the
campaign. Following the discussion of the methods, the results are presented. The results lead to
several new conclusions, opening the door for several implications of the research, including
areas of future interest and possible extensions of this research into additional areas.
10
Chapter Two: Research Design and Methods
As Chapter One mentioned, the goal of this research is to add to the field concerning the
impact and importance of U.S. presidential campaigns, particularly candidate and surrogate
visits. As campaigns have grown longer and more expensive, it is unclear if they have grown
more effective in shifting voter preferences. It is important for future candidates, as well as those
targeted by campaigns, to know the impact that campaigns have on voters. In order to examine
the research conducted, the variables under consideration must first be described.
Questions and Variables
This thesis addresses three specific questions regarding candidate appearances and
predicted voter choice. First, how do discrete events during the campaign impact changes in
predicted voter choice in comparison with campaign visits? Second, how much do campaign
appearances impact the final outcome of voting? Third, do candidate or surrogate visits lead to
greater changes in predicted voter choice? These questions are explored through the collection of
polling data, as well as a compilation of information on campaign visits. These three questions
point to several variables that are the focus of exploration.
The main variables under consideration are campaign visits and predicted voter choice.
The dependent variable, predicted voter choice, is measured at the state and national levels and
measures the likely outcome of the election based on reported voter preference at the time of
various surveys. The independent variable, campaign appearances (including both candidate and
surrogate visits), is defined as a visit by a major party candidate (including vice-presidential
candidates) or a “high-ranking surrogate” to eligible voters in a particular state ranging from
11
Labor Day to Election Day. A “high-ranking surrogate” is defined as a surrogate mentioned in at
least three major sources tracking the campaign (selected from a list of five sources tracking the
campaign). Information is drawn from Politico, NBC News, CNN, Los Angeles Times, and The
New York Times. Democratic surrogates include Bill Clinton, Chelsea Clinton, Anne Holton, Joe
Biden, Barack Obama, Michelle Obama, Elizabeth Warren, and Bernie Sanders (Burns and
Harris 2016; Chozick and Flegenheimer 2016; Kreig 2016; Mehta 2016; Murray 2016; Ocasio
2016; Seitz-Wald and Vitali 2016; and Terrell 2016). The list of those considered to be
Republican surrogates is much shorter, including only members of Trump’s family: Donald
Trump Jr., Eric Trump, Ivanka Trump, and Melania Trump (Seitz-Wald and Vitali 2016; Kreig
2016).
Although there were several well-known party officials endorsing Trump throughout the
campaign, such as Rudy Giuliani and Ben Carson, none of these met the criteria outlined above
to be considered “high-ranking surrogates.” One of the other reasons for Trump’s lack of high-
ranking surrogates was the low number of party members endorsing Trump. The New York
Times states that “though local elected officials and some members of Congress have
campaigned with him, Mr. Trump has almost entirely lacked the political star power of a
conventional campaign” (Burns and Harris 2016). Additionally, many high-ranking Republicans,
including former Presidents George H.W. and George W. Bush, chose not to endorse Trump,
leaving him to rely on his family as his main source of campaign support (Burns and Harris
2016). The Atlantic also addresses the use of surrogates in the campaign, discussing the disparity
of surrogates between the two candidates. Clinton had several strong backers including Barack
Obama and former President Clinton. In contrast, Trump could not call upon “most of the big-
name Republicans [...]-George W. Bush, Mitt Romney, John McCain, Ted Cruz, Marco Rubio,
12
Paul Ryan- [because they were] hostile to him” (Beinart 2016). This explains the lack of
surrogates used by Trump on the campaign trail and shows that Clinton clearly holds the
advantage in this aspect of the campaign. Although she holds a numerical advantage in the
surrogate field, “the surrogate gap is unlikely to prove decisive” (Beinart 2016). Despite the fact
that Trump relied heavily on his family for campaigning, his visits alone exceeded those of
Clinton’s in the final 100 days of the campaign (Isenstien et al. 2016). These differences in
campaign tactics help to balance out the total number of visits for each party. One additional
variable considered is “discrete events” occurring throughout the campaign. This variable serves
as an additional independent variable for the first hypothesis. Once the impact of these events has
been discussed, focus shifts to the impact of campaign appearances. These discrete events will be
considered for the purpose of ruling out additional factors that affect predicted voter choice in
order to better see the impact that comes solely from campaign appearances.
Hypotheses and Methods
As previously mentioned, campaign visits are not the only factor influencing shifts in
predicted voter choice. Often, other events that occur during the time of the campaign can
influence the polls; however, these shifts in polls do not usually last until Election Day. These
events are often referred to as “October surprises,” and can be influential in the campaign.
Erikson and Wlezien address these events, concluding that “embarrassing gaffes, clever TV ads,
and the like rarely have major long-term impact” (2012, 12). The impact of these types of events
is “slight and often of temporary duration” (Erikson and Wlezien 2012, 12). Although these
events are referred to as campaign events, this research extends the notion to additional discrete
events that may occur during campaigns. This leads to the first hypothesis.
13
H-1: Discrete events during the campaign will be associated with a shift in predicted
voter choice, but state polls will return to levels closer to those preceding the event prior
to Election Day.
Although other researchers have explored similar predictions, this research isolates these events
and separates them from other campaign events. In other research, the variable campaign events
has included things such as fundraising events, canvasing or get out the vote events, as well as a
strong push in advertising. Although these additional types of events may impact voter decision
making, the scope of this paper does not allow for consideration of such effects.
Discrete events are selected based on a compilation of several election analyses, focusing
on major events that evidently affected the outcome of the election. The information for
identifying these events is drawn from ABC News, Politico, The Wall Street Journal, The New
York Times, and FiveThirtyEight. ABC News and Politico each published a list of major events
that potentially affected the election (Stracqualursi 2016; Shafer 2016). These events are then
compared to news coverage from the campaign from the other three sources to select the final
events for consideration. Events that are mentioned on one of the two lists, and also receive news
coverage by the three additional news sources, are selected. The events chosen include the three
presidential debates, Clinton’s “basket of deplorables” comment, Trump’s tax return
controversy, the release of the Access Hollywood video, the WikiLeaks of the Podesta emails,
and the Comey letter to Congress (see Appendix A). Although FiveThirtyEight also mentions the
follow-up investigation of WikiLeaks as well as Comey’s second letter regarding the Clinton
investigation, the dates of these events did not allow for sufficient polling to occur between the
event and the election. Although these events may potentially have affected the actual outcome
of the election, they do not influence the data within this paper because the polling data used to
14
measure predicted voter choice throughout this research ended on the same date (November 6,
2016) that these additional discrete events occurred or received news coverage. The discrete
events included are analyzed by looking at individual state polls from fourteen selected states.
These particular states are selected mainly because of the campaigning that took place in
them. The states chosen either have a large number of visits from both candidates (swing states)
or mainly receive visits from one candidate (safe states). Although the term “safe states” is
typically used to define states where one particular candidate has a strong base of support,
throughout this paper “safe states” refers to states where campaigning is asymmetrical in nature.
This definition still aligns with the more typical definition, as the presence of asymmetrical
campaigning indicates that the state is not highly contested by the candidates and that one
candidate likely has a strong base of support in the state. If one candidate did not have a strong
base of support within the state, campaign visits would likely be much more symmetrical in
nature. The use of asymmetrical campaigning as a measure of safe states allows for the
researcher to have a clearer picture of the impact that visits have. By looking at states with
singular visits, data are collected that potentially show the impact of only one visit, whereas in
swing states, the impacts of visits are often overlapping. All of the safe states examined except
for Arizona and Colorado also fit the more traditional definition of safe states, but are included
due to the campaigning that occurred within them. Because of the need for information on the
frequency of both candidate and surrogate visits, the focus must be on states where both parties
visited regularly but also on states where only one candidate campaigned extensively or
campaigned markedly more than his or her opponent. Using both swing and safe states provides
more diverse results that will hopefully lead to a more thorough interpretation of the data. The
“swing” states, or states with heavy campaigning, include Florida, Michigan, North Carolina,
15
Ohio, Pennsylvania, and Virginia. The “safe” the states are Arizona, California, Colorado,
Georgia, Illinois, Indiana, Missouri, and Texas.
In order to best measure the impact of these events, the FiveThirtyEight aggregated state
polls are placed on a line graph showing Trump’s change in support relative to Clinton’s. The
discrete events are also shown on the graph, allowing for an overall examination of the changes
in voter preferences over the course of the campaign, but more specifically in conjunction with
the occurrence of these events. Because most of the discrete events under consideration were
covered in national news outlets, changes in predicted voter choice in safe states are examined
within the same time frame to attempt to determine if changes in swing states likely occurred
following these discrete events and not due to some other influence. It is important to note that
there are several other factors that could also lead to changes in reported predicted voter choice
that are outside the scope of this research. Although influences such as TV, radio, and internet
advertisements; and canvassing or “get out the vote” efforts are not included within the analysis
of this data, it is important to acknowledge that they could also be influencing shifts seen in the
polls. Although they potentially play an important part in presidential campaigns, including them
within the scope of this research is not feasible.
Once discrete events are analyzed to determine their possible impact on the election, the
focus shifts to the impact that campaigns have on the outcome of the election. When looking
through the previous research on campaigns, several researchers have concluded that campaigns
matter. To clarify this further, researchers have refined the question being asked, focusing on
“where, when, for what, and for whom” campaigns matter (Jacobson 2015, 32). As mentioned
previously, this new focus on the impact of campaigns shifts away from the popular minimal
effects hypothesis, focusing more on the slight impacts that campaigns can have and attempting
16
to extrapolate these impacts to determine the contributing factors. As research has focused in on
the impact of campaign appearances, several observations have emerged. First, although one
would expect a greater impact from appearances in battleground or swing states due to the fact
that there is likely a higher number of undecided voters, the impact of these appearances is often
canceled out by the opponent’s visits, making it difficult to measure the impact. Hill, Rodriquez,
and Wooden focused on this, emphasizing the importance of distinguishing between safe states
and swing states in the data analysis. If the distinction is not made, the data can present
misleading evidence of a candidate’s impact from visits. They explain why candidates still
campaign in swing states even though it appears to have little impact on the outcome of the
election. Campaign visits to swing states are still critical to the campaign because “if candidates
do not make an appearance, they allow their opponent the opportunity to build an advantage, and
they risk losing the election as Dewy did when he did not counter Truman’s more frequent
appearances” (Hill, Rodriquez, and Wooden 2010, 248). They conclude that campaign
appearances can potentially boost candidate support or reduce support for the opponent (Hill,
Rodriquez, and Wooden 2010, 246).
Although there is evidence to support the impact of campaign appearances on the
outcome of the election, the clarifying question becomes, “How much do campaigns matter?”
Holbrook addresses this issue by stating that while the goal of campaigns is to “generate
information for the purpose of persuasion,” the outcome of this can be greatly affected if
candidates do not campaign evenly (1996, 52; 55). Additionally, when considering the role of
campaigns to “influence the behavior of individual citizens” (Jacobson 2015, 32), and that state
campaign visits tend to have a more localized impact due to more local media coverage, it
follows that:
17
H-2: As the number of campaign visits increases, support for that candidate
(relative to his/her main opponent) will increase.
In order to test this hypothesis, individual states are treated as distinct cases. Data are drawn from
an aggregated average of statewide polls calculated by FiveThirtyEight. The total number of
candidate visits, as well as the total number of surrogate visits, are taken into consideration, but
are considered together to form one variable referred to simply as “campaign visits.” As
campaigns progress, the majority of visits tend to occur in more heavily contested areas. In order
to account for this, data from both heavily visited states and sparsely visited states are
considered. As previously mentioned, the swing states are Florida, Michigan, North Carolina,
Ohio, Pennsylvania, and Virginia. These particular states have been selected due to the fact that
they were predicted to be states with close outcomes before the election and are the six states
where two-thirds of all campaigning occurred (National Popular Vote). Additionally, the states
of Arizona, California, Colorado, Georgia, Illinois, Indiana, Missouri, and Texas are selected for
examination as well due to a more asymmetrical level of campaigning. These states have been
chosen because, as explained by Hill, Rodriquez, and Wooden, “if a candidate appearance does
have an impact, it is more likely to be seen in a safe state, where there is less chance it will be
offset by an opponent’s appearance” (2010, 248). Once again, it is important to examine the safe
states as well as battleground states to compare the impact of appearances and to account for the
cancelling factor of opposing visits in the battleground states.
Additionally, data from the FiveThirtyEight national poll are used as an additional
measure for comparison to the other states being examined to show changes in the states that
may be from additional factors other than the event itself. By including the national polls in
examining this hypothesis, it is possible to examine additional factors that may be influencing
18
shifts in the polls, such as advertisements by candidates or additional coverage from the news
media, without including it as an actual variable within the study. Although advertising and the
media play a large role in the campaign, because of the narrow scope of this research, the focus
is on campaign events, specifically visits. The inclusion of discrete events in the first hypothesis
helps to account for some of the impact that the news media may have on campaigns.
When considering the campaign, some events drew more attention and attendees than
others. This is due to the nature of campaigns. The goal of campaign events is to “grab the
public’s attention,” with both “highly visible events” as well as “less visible but presumably still
consequential events” that occur throughout the campaign (Holbrook 1996, 64; 126). In
describing the differences, presidential debates fall into the former category, drawing more news
and public attention, while things such as “major campaign speeches [and] high-visibility
endorsements” fall into the latter (Holbrook 1996, 64). These lesser events still draw news
coverage and attention from voters, but not to the same degree as events involving a candidate.
This conclusion seems to imply that voters are more responsive to attention from a candidate
than from a surrogate, leading to the third hypothesis.
H-3: Visits from a presidential or vice-presidential candidate will lead to greater shifts in
predicted voter choice than when visits are made on behalf of candidates by surrogates.
Investigating this hypothesis is of interest in the 2016 election, particularly because of the nature
of some of the Democratic surrogates. With names such as Barack Obama, Michelle Obama, Bill
Clinton, and Bernie Sanders, it is possible that voters would be more influenced by these
representatives than by the candidate herself. Although this is a possibility, the study looks at the
changes that occurred in predicted voter choice for the overall group of surrogates or candidates,
rather than separating out the impacts of individual surrogates. Though this would make for an
19
interesting research project, the research here focused on the average impact that candidate and
surrogate visits have, rather than the impact that specific surrogates or candidates have on
predicted voter choice.
In order to test this hypothesis, data are analyzed from the fourteen states previously
mentioned. Visits in a particular state are compared along with the net change in candidate
support to determine if candidate visits or surrogate visits are associated with bigger shifts in
voter choice. Data collected for the first hypothesis also is relevant to testing this hypothesis. It
was important to rule out other potential sources of influence on predicted voter choice polls.
Therefore, once the impact of discrete events is determined, this is taken into account when
analyzing the level of change present in polls surrounding campaign visits that fall near the
occurrence of discrete events. In order to thoroughly test this hypothesis, aggregated data from
FiveThirtyEight are used to look at individual campaign visits by type and determine if a pattern
exists related to the shift in polls surrounding visits from either a candidate or a surrogate. In
using the aggregated state polls, changes in voter preference are measured by looking at the
change in support for a candidate from the first poll of the campaign to the last poll of the
campaign. Because the testing of these hypotheses requires the comparison of swing states and
safe states, it may lead to the conclusion that some additional factors contribute to changes in
predicted voter choice other than campaign visits, such as the influence of the news media,
campaign advertisements, or other aspects of campaigns. However, this project is limited in
scope and only focuses on the potential impact of campaign visits and a few discrete events.
Because this is just one small part of campaigns, this research will hopefully provide room for
future research into the additional impacts of campaigns on predicted voter choice.
20
Chapter Three: Findings
As Chapter Two covered the questions and methods used in this thesis, the findings and
implications of the three previously mentioned hypotheses will be discussed in Chapter Three.
The testing of these data was outlined in the previous chapter and allowed for specific results to
be collected on each hypothesis. The findings are presented below, along with more specific
details regarding the process of data collection, analysis, and the testing of each hypothesis.
Hypothesis One
The first hypothesis states that discrete events during the campaign will be associated
with a shift in predicted voter choice, but state polls will return to levels closer to those preceding
the event prior to Election Day. Examining the effects of such events is important in order to put
the possible influence of campaign appearances in the appropriate context when looking at
changes in the polls that may be related to events that occurred throughout the campaign.
In order to examine the impact that these events may have had on predicted voter choice,
the FiveThirtyEight aggregated state polling data is used to create a timeline for each state under
examination. These lines track the daily changes in the polls for each of the fourteen states in the
study; the figure also includes an average line for the states under consideration as well as
vertical lines for each of the eight events included. Polls for both Trump and Clinton are
examined, allowing for the data to show the net change in results. This is presented as Trump’s
change in support relative to Clinton’s. By examining the results in a manner that demonstrates
net change in support, the data measure actual changes in support and can help account for
undecideds that have made a decision regarding for whom they will vote. This allows for
21
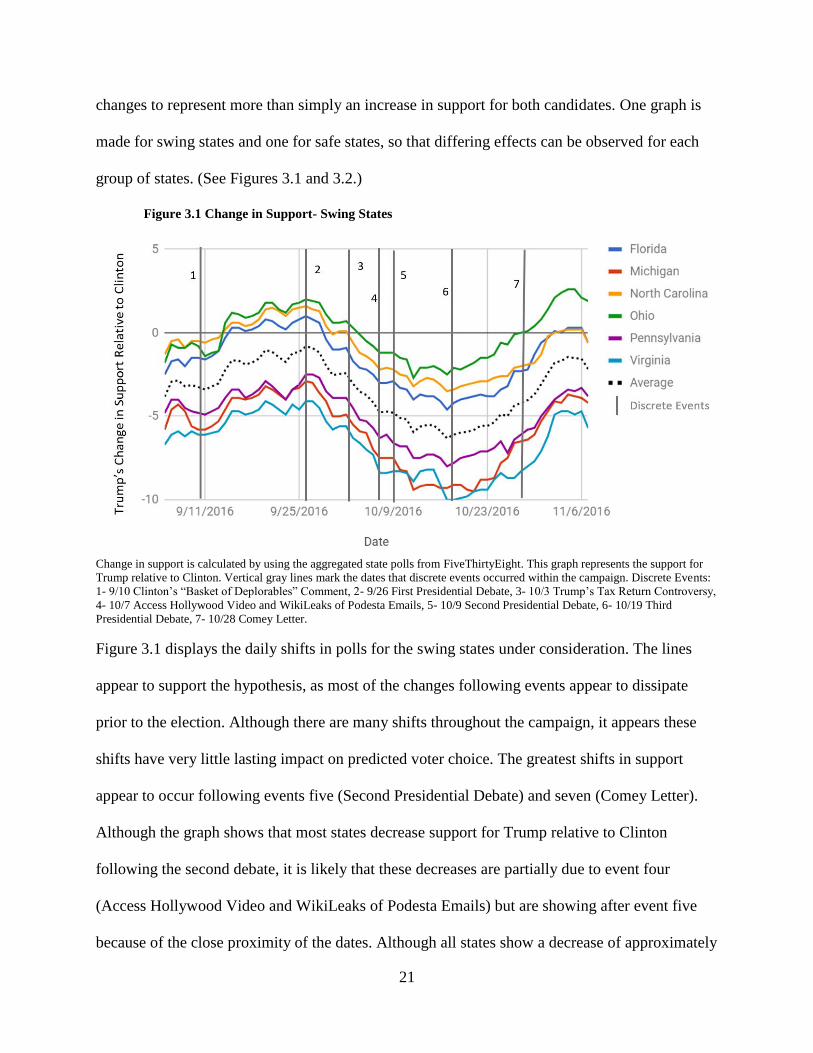
changes to represent more than simply an increase in support for both candidates. One graph is
made for swing states and one for safe states, so that differing effects can be observed for each
group of states. (See Figures 3.1 and 3.2.)
Figure 3.1 Change in Support- Swing States
Change in support is calculated by using the aggregated state polls from FiveThirtyEight. This graph represents the support for
Trump relative to Clinton. Vertical gray lines mark the dates that discrete events occurred within the campaign. Discrete Events:
1- 9/10 Clinton’s “Basket of Deplorables” Comment, 2- 9/26 First Presidential Debate, 3- 10/3 Trump’s Tax Return Controversy,
4- 10/7 Access Hollywood Video and WikiLeaks of Podesta Emails, 5- 10/9 Second Presidential Debate, 6- 10/19 Third
Presidential Debate, 7- 10/28 Comey Letter.
Figure 3.1 displays the daily shifts in polls for the swing states under consideration. The lines
appear to support the hypothesis, as most of the changes following events appear to dissipate
prior to the election. Although there are many shifts throughout the campaign, it appears these
shifts have very little lasting impact on predicted voter choice. The greatest shifts in support
appear to occur following events five (Second Presidential Debate) and seven (Comey Letter).
Although the graph shows that most states decrease support for Trump relative to Clinton
following the second debate, it is likely that these decreases are partially due to event four
(Access Hollywood Video and WikiLeaks of Podesta Emails) but are showing after event five
because of the close proximity of the dates. Although all states show a decrease of approximately
22
2 percentage points in support following event five, they all recover to the same level or higher
prior to event seven. Following event seven (Comey Letter), there appears to be a measurable
shift as well. From the release of the Comey Letter on October 28, 2016 to the end of polling on
November 7, 2016 all states appear to increase in support for Trump approximately 2.5
percentage points. Because this event occurred so close to Election Day, it is impossible to know
how predicted voter choice would have changed if more polls had been conducted after this
event. Although there was not time for this impact to dissipate, the other shifts in predicted voter
choice did not appear to linger to Election Day, at least in these swing states. It is important to
note how close in proximity some of these events occurred to one another. Because of this, it is
likely that some of the effects of these events will overlap, making it more difficult to isolate the
impact of one particular event.
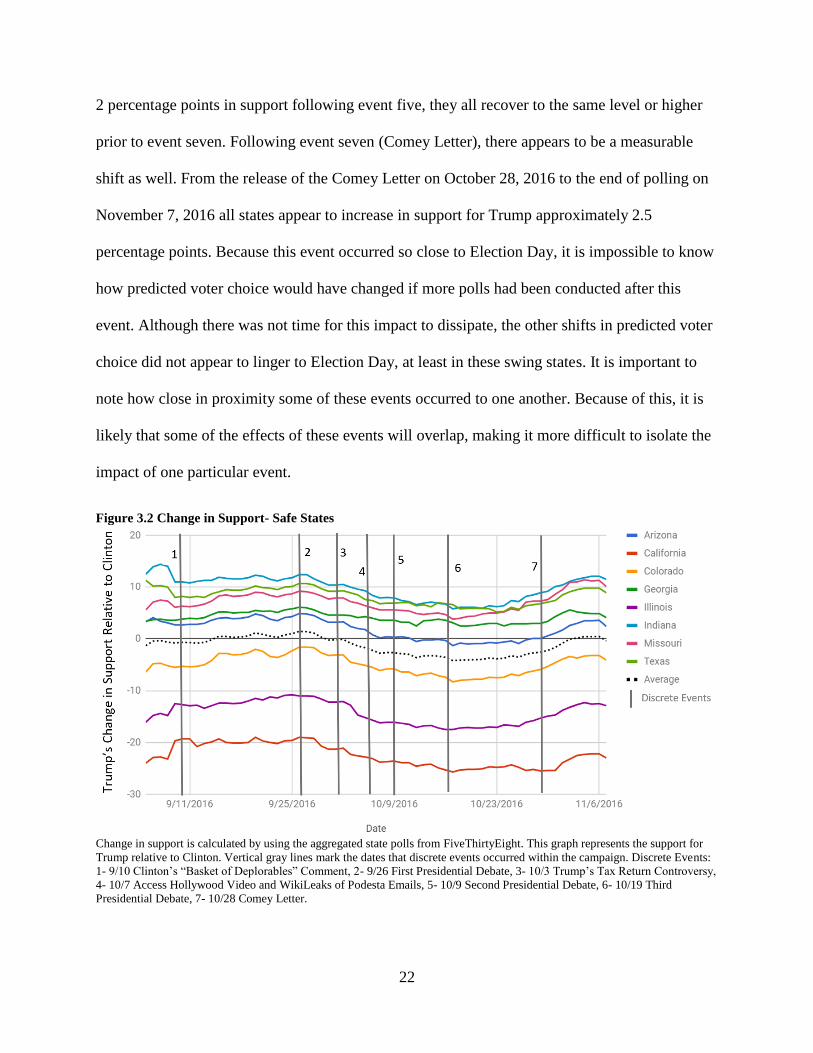
Figure 3.2 Change in Support- Safe States
Change in support is calculated by using the aggregated state polls from FiveThirtyEight. This graph represents the support for
Trump relative to Clinton. Vertical gray lines mark the dates that discrete events occurred within the campaign. Discrete Events:
1- 9/10 Clinton’s “Basket of Deplorables” Comment, 2- 9/26 First Presidential Debate, 3- 10/3 Trump’s Tax Return Controversy,
4- 10/7 Access Hollywood Video and WikiLeaks of Podesta Emails, 5- 10/9 Second Presidential Debate, 6- 10/19 Third
Presidential Debate, 7- 10/28 Comey Letter.
23
Although it could be expected that shifts in swing states would be similar to one another because
they do not favor one candidate over another, it was not expected that changes in the level of
candidate support would also be similar to one another in safe states. In safe states, one might
expect that events affecting the candidates nationally would not have as much effect in states that
already leaned heavily to one candidate or another because a majority of voters have already
decided for whom they will vote. While this does appear to be accurate to some extent in that
safe states did not show drastic changes in support, all of the safe states appear to shift by very
similar percentages throughout the campaign. The parallels in these changes from state to state
show that discrete events have a similar impact on voters across the country and the type of state
where the impacts are measured does not matter much.
The evidence suggests that the first hypothesis is supported. Although this analysis
excludes other factors that may have influenced the changes in support, Figures 3.1 and 3.2 show
that although support for the candidates is initially affected by these events, their overall support
remains largely unaltered by the end of the campaign. It appears as though certain events
affected one candidate more than another, which is also to be expected. In the swing states, it
appears that Trump’s net level of support moved in the expected direction following each event.
The events that showed Clinton in a positive light (including the three presidential debates) or
Trump in a negative light appear to have led to a decrease in net support for Trump whereas the
events that showed Trump in a positive light or Clinton in a negative light appear to have led to
an increase in net support for Trump. It also appears as though the Access Hollywood video
(event four) caused a stronger reaction among voters than did the release of the Podesta emails
(also event four) which occurred on the same day. The expectation following these two events
would be no change in support, because the Access Hollywood video would likely have a
24
negative impact on Trump’s support and the Podesta emails would likely negatively affect
Clinton’s support. However, following these events, Trump’s net support decreased in all states
except for Pennsylvania. In Pennsylvania, Trump’s support increased, but then sharply decreased
about a day after the occurrence of these events.
The directional changes from Figure 3.2 display an expected outcome, but it is surprising
that all of the safe states demonstrated such similar shifts in support where one would think that
stronger support for one candidate or another would minimize the effect that certain events had
on the level of support. Although the shifts following events are much smaller in safe states, all
of the safe states under examination appear to have shifted support in a similar pattern. Even
though actual levels of support in the safe states may have differed greatly, the percentage
change in support is similar among them. One event that did not appear to change support in the
expected direction is the third presidential debate (event six). Although most news sources
reported the results of the debate as a victory for Clinton, Trump’s support began to increase in
both safe and swing states following the debate (Cillizza 2016). One possible explanation for this
could be that his support is recovering from the release of the Access Hollywood video, returning
to a level closer to that predating the release of the video, which would also support the
hypothesis.
In order to take a closer look at the changes in the level of support for each candidate
surrounding these events, an additional poll can be utilized for analysis. Although the aggregated
state poll is useful in looking at the overall trend of changes, looking at one individual poll from
each state under consideration can also be beneficial because it provides a more detailed
examination of the changes that occur following discrete events. The aggregated data are useful,
but the individual state polls show the actual levels of support within the states being examined,
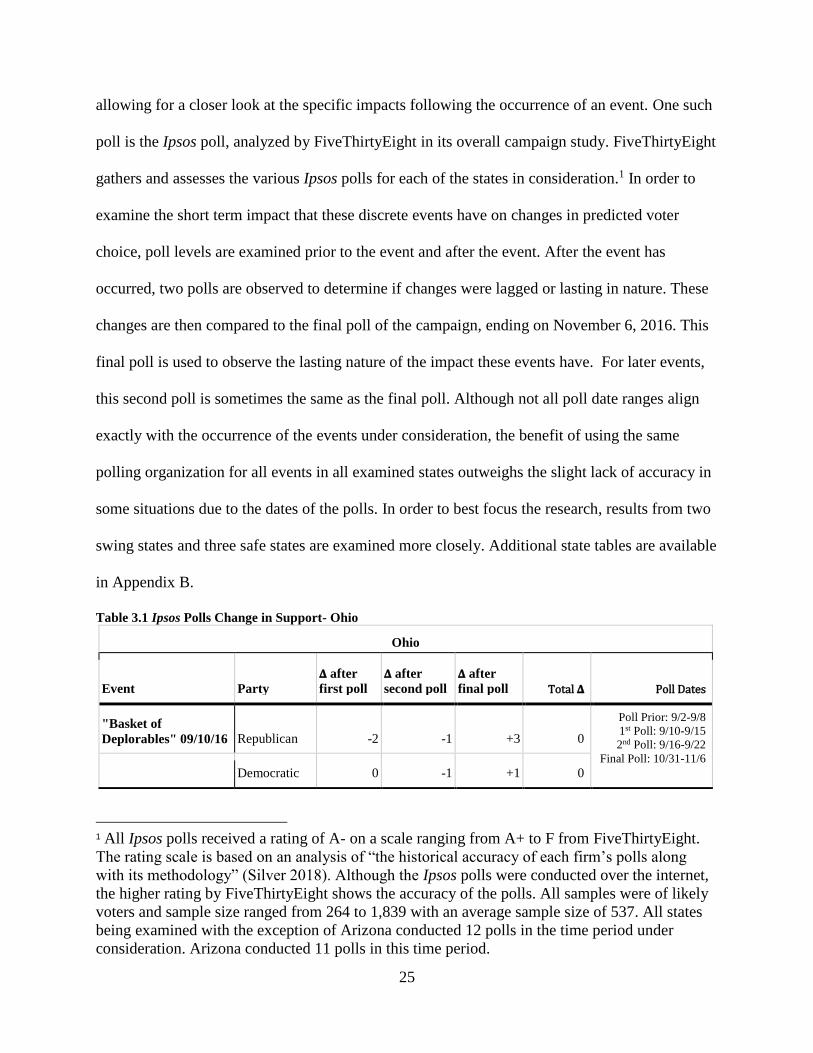
25
allowing for a closer look at the specific impacts following the occurrence of an event. One such
poll is the Ipsos poll, analyzed by FiveThirtyEight in its overall campaign study. FiveThirtyEight
gathers and assesses the various Ipsos polls for each of the states in consideration.1 In order to
examine the short term impact that these discrete events have on changes in predicted voter
choice, poll levels are examined prior to the event and after the event. After the event has
occurred, two polls are observed to determine if changes were lagged or lasting in nature. These
changes are then compared to the final poll of the campaign, ending on November 6, 2016. This
final poll is used to observe the lasting nature of the impact these events have. For later events,
this second poll is sometimes the same as the final poll. Although not all poll date ranges align
exactly with the occurrence of the events under consideration, the benefit of using the same
polling organization for all events in all examined states outweighs the slight lack of accuracy in
some situations due to the dates of the polls. In order to best focus the research, results from two
swing states and three safe states are examined more closely. Additional state tables are available
in Appendix B.
Table 3.1 Ipsos Polls Change in Support- Ohio
Ohio
Event Party
𝚫 after
first poll
𝚫 after
second poll
𝚫 after
final poll Total 𝚫 Poll Dates
"Basket of
Deplorables" 09/10/16 Republican -2 -1 +3 0
Poll Prior: 9/2-9/8
1st Poll: 9/10-9/15
2nd Poll: 9/16-9/22
Final Poll: 10/31-11/6 Democratic 0 -1 +1 0
1 All Ipsos polls received a rating of A- on a scale ranging from A+ to F from FiveThirtyEight.
The rating scale is based on an analysis of “the historical accuracy of each firm’s polls along
with its methodology” (Silver 2018). Although the Ipsos polls were conducted over the internet,
the higher rating by FiveThirtyEight shows the accuracy of the polls. All samples were of likely
voters and sample size ranged from 264 to 1,839 with an average sample size of 537. All states
being examined with the exception of Arizona conducted 12 polls in the time period under
consideration. Arizona conducted 11 polls in this time period.
26
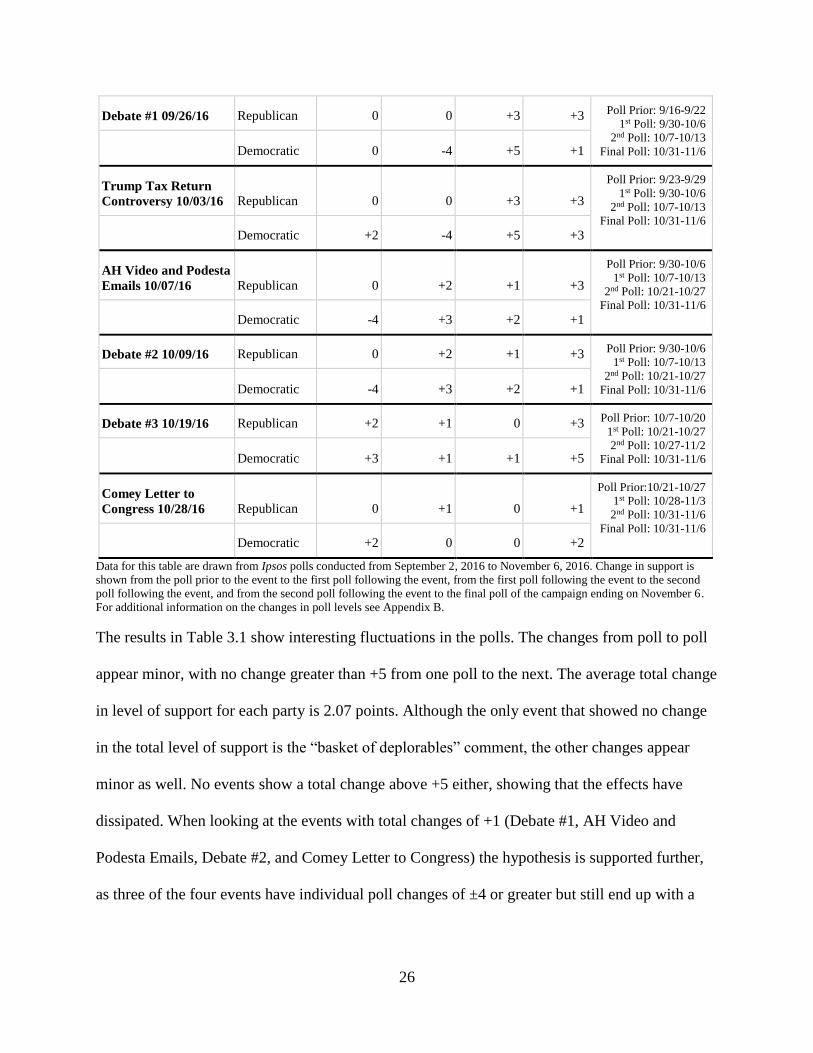
Debate #1 09/26/16 Republican 0 0 +3 +3 Poll Prior: 9/16-9/22
1st Poll: 9/30-10/6
2nd Poll: 10/7-10/13
Final Poll: 10/31-11/6 Democratic 0 -4 +5 +1
Trump Tax Return
Controversy 10/03/16 Republican 0 0 +3 +3
Poll Prior: 9/23-9/29
1st Poll: 9/30-10/6
2nd Poll: 10/7-10/13
Final Poll: 10/31-11/6 Democratic +2 -4 +5 +3
AH Video and Podesta
Emails 10/07/16 Republican 0 +2 +1 +3
Poll Prior: 9/30-10/6
1st Poll: 10/7-10/13
2nd Poll: 10/21-10/27
Final Poll: 10/31-11/6 Democratic -4 +3 +2 +1
Debate #2 10/09/16 Republican 0 +2 +1 +3 Poll Prior: 9/30-10/6
1st Poll: 10/7-10/13
2nd Poll: 10/21-10/27
Final Poll: 10/31-11/6 Democratic -4 +3 +2 +1
Debate #3 10/19/16 Republican +2 +1 0 +3 Poll Prior: 10/7-10/20
1st Poll: 10/21-10/27
2nd Poll: 10/27-11/2
Final Poll: 10/31-11/6 Democratic +3 +1 +1 +5
Comey Letter to
Congress 10/28/16 Republican 0 +1 0 +1
Poll Prior:10/21-10/27
1st Poll: 10/28-11/3
2nd Poll: 10/31-11/6
Final Poll: 10/31-11/6 Democratic +2 0 0 +2
Data for this table are drawn from Ipsos polls conducted from September 2, 2016 to November 6, 2016. Change in support is
shown from the poll prior to the event to the first poll following the event, from the first poll following the event to the second
poll following the event, and from the second poll following the event to the final poll of the campaign ending on November 6.
For additional information on the changes in poll levels see Appendix B.
The results in Table 3.1 show interesting fluctuations in the polls. The changes from poll to poll
appear minor, with no change greater than +5 from one poll to the next. The average total change
in level of support for each party is 2.07 points. Although the only event that showed no change
in the total level of support is the “basket of deplorables” comment, the other changes appear
minor as well. No events show a total change above +5 either, showing that the effects have
dissipated. When looking at the events with total changes of +1 (Debate #1, AH Video and
Podesta Emails, Debate #2, and Comey Letter to Congress) the hypothesis is supported further,
as three of the four events have individual poll changes of ±4 or greater but still end up with a
27
total change of only +1. This shows that the changes in polls are being cancelled out by later
polls.
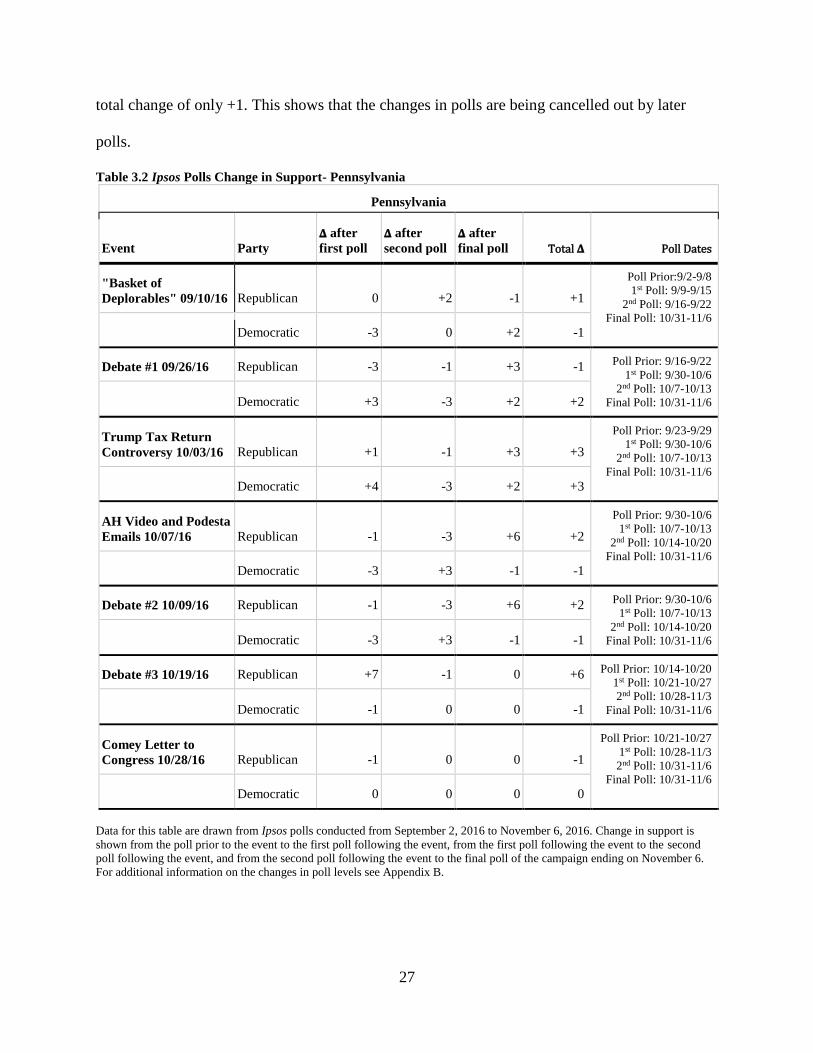
Table 3.2 Ipsos Polls Change in Support- Pennsylvania
Pennsylvania
Event Party
𝚫 after
first poll
𝚫 after
second poll
𝚫 after
final poll Total 𝚫 Poll Dates
"Basket of
Deplorables" 09/10/16 Republican 0 +2 -1 +1
Poll Prior:9/2-9/8
1st Poll: 9/9-9/15
2nd Poll: 9/16-9/22
Final Poll: 10/31-11/6 Democratic -3 0 +2 -1
Debate #1 09/26/16 Republican -3 -1 +3 -1 Poll Prior: 9/16-9/22
1st Poll: 9/30-10/6
2nd Poll: 10/7-10/13
Final Poll: 10/31-11/6 Democratic +3 -3 +2 +2
Trump Tax Return
Controversy 10/03/16 Republican +1 -1 +3 +3
Poll Prior: 9/23-9/29
1st Poll: 9/30-10/6
2nd Poll: 10/7-10/13
Final Poll: 10/31-11/6 Democratic +4 -3 +2 +3
AH Video and Podesta
Emails 10/07/16 Republican -1 -3 +6 +2
Poll Prior: 9/30-10/6
1st Poll: 10/7-10/13
2nd Poll: 10/14-10/20
Final Poll: 10/31-11/6 Democratic -3 +3 -1 -1
Debate #2 10/09/16 Republican -1 -3 +6 +2 Poll Prior: 9/30-10/6
1st Poll: 10/7-10/13
2nd Poll: 10/14-10/20
Final Poll: 10/31-11/6 Democratic -3 +3 -1 -1
Debate #3 10/19/16 Republican +7 -1 0 +6 Poll Prior: 10/14-10/20
1st Poll: 10/21-10/27
2nd Poll: 10/28-11/3
Final Poll: 10/31-11/6 Democratic -1 0 0 -1
Comey Letter to
Congress 10/28/16 Republican -1 0 0 -1
Poll Prior: 10/21-10/27
1st Poll: 10/28-11/3
2nd Poll: 10/31-11/6
Final Poll: 10/31-11/6 Democratic 0 0 0 0
Data for this table are drawn from Ipsos polls conducted from September 2, 2016 to November 6, 2016. Change in support is
shown from the poll prior to the event to the first poll following the event, from the first poll following the event to the second
poll following the event, and from the second poll following the event to the final poll of the campaign ending on November 6.
For additional information on the changes in poll levels see Appendix B.
28
The results in Pennsylvania (Table 3.2) are very similar. Although there are fewer events
with a total change of zero, there are several events with individual poll changes that cancel out.
In fact, all of the events in the figure above except for the “basket of deplorables,” Debate #3,
and Comey Letter to Congress have poll changes that cancel out. The fact that the poll changes
cancel each other out supports the argument that the impact of these events is minimal and will
dissipate prior to the election because the impact on voters is already not lasting past one or two
polls following the event.
When looking at the outcome of the changes in support in the swing states as displayed in
Tables 3.1 and 3.2, it appears as though the hypothesis is still supported. There is no clear pattern
that emerges among the states, but it is evident that most events have some sort of impact that
dissipates prior to the final poll. Additionally, the results in these states highlight the reason that
these states are classified as swing states. For example, in Table 3.1, Ohio demonstrates that the
impact of these events can be a little unpredictable in swing states, but that the effects are not
lasting to the end of the campaign. Interestingly, in Ohio, Trump’s support dips after Clinton
made the “basket of deplorables” comment, but then recovers prior to the end of the campaign.
One would expect that Clinton’s support would have been affected by this comment, not
Trump’s. This change in support is potentially a result of some additional factor that is not being
accounted for within the data. Additionally, Clinton loses support after the first debate, which
was seen as a Clinton victory, but then also recovers by the end of the campaign (Cillizza 2016).
Although these changes do not align with shifts in the expected direction, the changes do still
support the hypothesis that a shift will occur but will dissipate prior to Election Day.
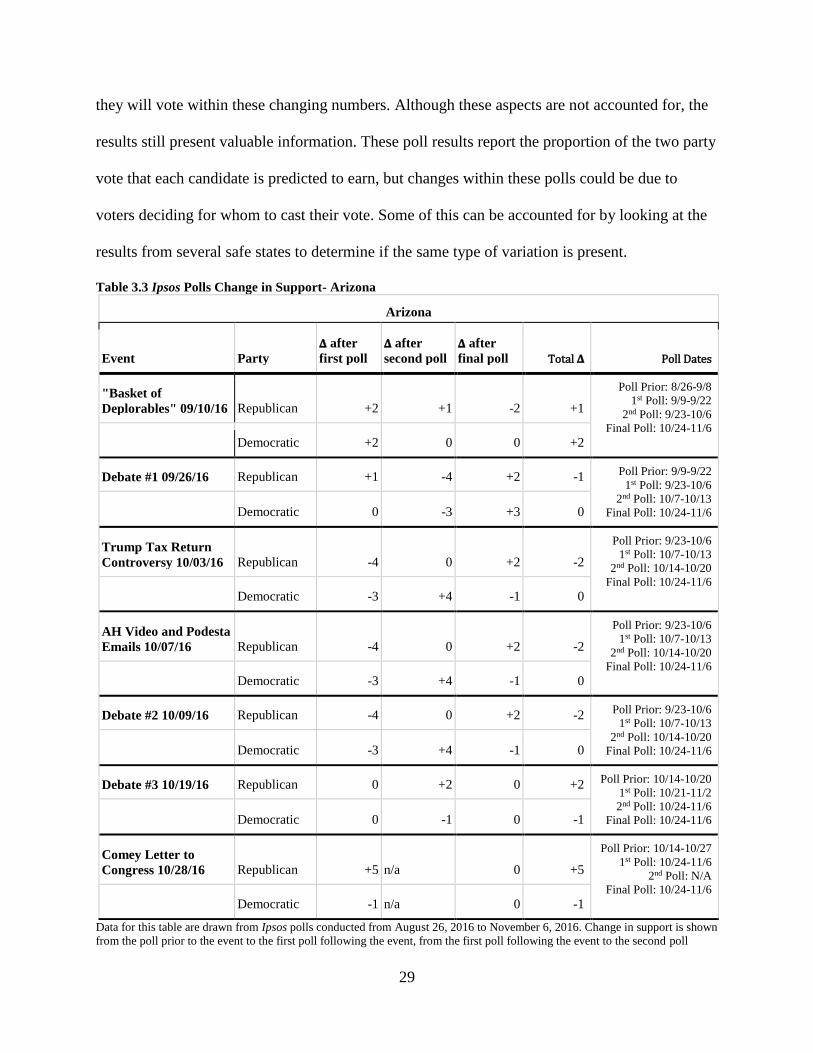
The numbers appear to support this hypothesis, but it is important to note that the data do
not account for the margin of error in the aggregated data or for undecideds choosing for whom
29
they will vote within these changing numbers. Although these aspects are not accounted for, the
results still present valuable information. These poll results report the proportion of the two party
vote that each candidate is predicted to earn, but changes within these polls could be due to
voters deciding for whom to cast their vote. Some of this can be accounted for by looking at the
results from several safe states to determine if the same type of variation is present.
Table 3.3 Ipsos Polls Change in Support- Arizona
Arizona
Event Party
𝚫 after
first poll
𝚫 after
second poll
𝚫 after
final poll Total 𝚫 Poll Dates
"Basket of
Deplorables" 09/10/16 Republican +2 +1 -2 +1
Poll Prior: 8/26-9/8
1st Poll: 9/9-9/22
2nd Poll: 9/23-10/6
Final Poll: 10/24-11/6 Democratic +2 0 0 +2
Debate #1 09/26/16 Republican +1 -4 +2 -1 Poll Prior: 9/9-9/22
1st Poll: 9/23-10/6
2nd Poll: 10/7-10/13
Final Poll: 10/24-11/6 Democratic 0 -3 +3 0
Trump Tax Return
Controversy 10/03/16 Republican -4 0 +2 -2
Poll Prior: 9/23-10/6
1st Poll: 10/7-10/13
2nd Poll: 10/14-10/20
Final Poll: 10/24-11/6 Democratic -3 +4 -1 0
AH Video and Podesta
Emails 10/07/16 Republican -4 0 +2 -2
Poll Prior: 9/23-10/6
1st Poll: 10/7-10/13
2nd Poll: 10/14-10/20
Final Poll: 10/24-11/6 Democratic -3 +4 -1 0
Debate #2 10/09/16 Republican -4 0 +2 -2 Poll Prior: 9/23-10/6
1st Poll: 10/7-10/13
2nd Poll: 10/14-10/20
Final Poll: 10/24-11/6 Democratic -3 +4 -1 0
Debate #3 10/19/16 Republican 0 +2 0 +2 Poll Prior: 10/14-10/20
1st Poll: 10/21-11/2
2nd Poll: 10/24-11/6
Final Poll: 10/24-11/6 Democratic 0 -1 0 -1
Comey Letter to
Congress 10/28/16 Republican +5 n/a 0 +5
Poll Prior: 10/14-10/27
1st Poll: 10/24-11/6
2nd Poll: N/A
Final Poll: 10/24-11/6 Democratic -1 n/a 0 -1
Data for this table are drawn from Ipsos polls conducted from August 26, 2016 to November 6, 2016. Change in support is shown
from the poll prior to the event to the first poll following the event, from the first poll following the event to the second poll
30
following the event, and from the second poll following the event to the final poll of the campaign ending on November 6. For
additional information on the changes in poll levels see Appendix B.
In Arizona, the individual poll changes are greater, but the total change for most events is low,
with all but one total change falling at or below ±2. Additionally, there are four instances where
the total change is zero. These lower changes in the level of support make sense in a safe state
because a majority of voters likely already know for whom they will vote and are less likely to
be influenced by campaign visits. Interestingly, all of these total changes of zero occur with the
Democratic results (Debate #1, Trump Tax Return Controversy, AH Video and Podesta Emails,
and Debate #2). This lack of change in support for Clinton is particularly interesting because her
chances of winning in Arizona were slated at about 33% (Silver 2016). It would follow that voter
preference would shift more in regards to Clinton, even if in a negative way in this situation,
rather than showing minimal changes in her support overall.
Table 3.4 Ipsos Polls Change in Support- Georgia
Georgia
Event Party
𝚫 after
first poll
𝚫 after
second poll
𝚫 after
final poll Total 𝚫 Poll Dates
"Basket of
Deplorables" 09/10/16 Republican -2 +5 -3 0
Poll Prior: 8/26-9/8
1st Poll: 9/9-9/22
2nd Poll: 9/23-9/29
Final Poll: 10/31-11/6 Democratic +5 0 -1 +4
Debate #1 09/26/16 Republican +2 +2 -2 +2 Poll Prior: 9/9-9/22
1st Poll: 9/30-10/6
2nd Poll: 10/7-10/20
Final Poll: 10/31-11/6 Democratic 0 -1 0 -1
Trump Tax Return
Controversy 10/03/16 Republican +1 -1 0 0
Poll Prior: 9/30-10/6
1st Poll: 10/7-10/20
2nd Poll: 10/27-11/2
Final Poll: 10/31-11/6 Democratic -2 +2 -1 -1
AH Video and Podesta
Emails 10/07/16 Republican +1 -1 0 0
Poll Prior: 9/30-10/6
1st Poll: 10/7-10/20
2nd Poll: 10/27-11/2
Final Poll: 10/31-11/6 Democratic -2 +2 -1 -1
31
Debate #2 10/09/16 Republican 0 0 0 0 Poll Prior: 9/30-10/6
1st Poll: 10/14-10/27
2nd Poll: 10/28-11/3
Final Poll: 10/31-11/6 Democratic 0 0 -1 -1
Debate #3 10/19/16 Republican -1 0 0 -1 Poll Prior: 10/7-10/20
1st Poll: 10/14-10/27
2nd Poll: 10/28-11/3
Final Poll: 10/31-11/6 Democratic +2 -1 0 +1
Comey Letter to
Congress 10/28/16 Republican 0 0 0 0
Poll Prior: 10/14-10/27
1st Poll: 10/28-11/3
2nd Poll: 10/31-11/6
Final Poll: 10/31-11/6 Democratic 0 -1 0 -1
Data for this table are drawn from Ipsos polls conducted from August 26, 2016 to November 6, 2016. Change in support is shown
from the poll prior to the event to the first poll following the event, from the first poll following the event to the second poll
following the event, and from the second poll following the event to the final poll of the campaign ending on November 6. For
additional information on the changes in poll levels see Appendix B.
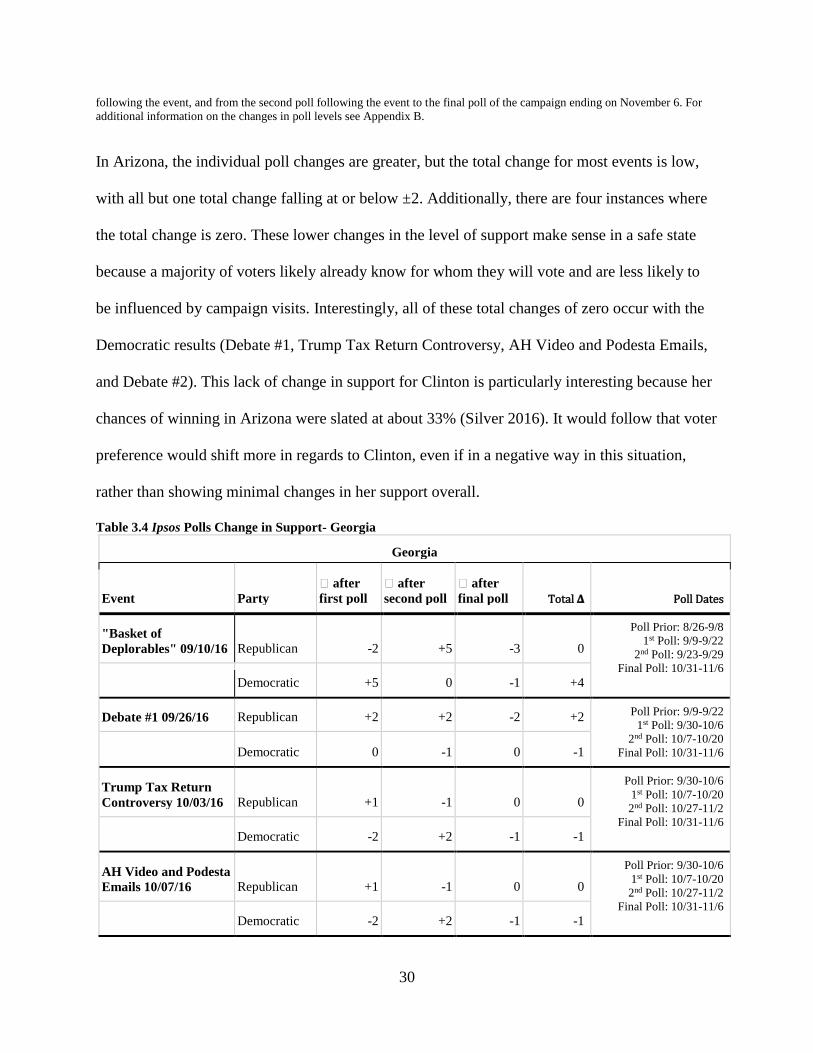
The results in Georgia are similar in that there are several instances with a total change of zero,
however these are not all focused on the Democratic candidate. Out of the fourteen results, five
show total changes of zero and only two are above +2. The remaining changes are at ±1.
Additionally, Debate #1, Trump Tax Controversy, and AH Video and Podesta Emails all show
poll changes that cancel one another out. Once again, the results in this individual state appear to
support the conclusion that the effects from these events do not linger long term.
Table 3.5 Ipsos Polls Change in Support- Texas
Texas
Event Party
𝚫 after
first poll
𝚫 after
second poll
𝚫 after
final poll Total 𝚫 Poll Dates
"Basket of
Deplorables" 09/10/16 Republican +3 -3 +1 +1
Poll Prior: 9/2-9/8
1st Poll: 9/9-9/15
2nd Poll: 9/16-9/22
Final Poll: 10/31-11/6 Democratic -2 +4 +6 +8
Debate #1 09/26/16 Republican +2 +7 -8 +1 Poll Prior: 9/16-9/22
1st Poll: 9/30-10/6
2nd Poll: 10/7-10/13
Final Poll: 10/31-11/6 Democratic +1 -2 +7 +6
Trump Tax Return
Controversy 10/03/16 Republican +2 +7 -8 +1
Poll Prior: 9/23-9/29
1st Poll: 9/30-10/6
2nd Poll: 10/7-10/13
Final Poll: 10/31-11/6 Democratic +1 -2 +7 +6
32
AH Video and Podesta
Emails 10/07/16 Republican +7 -5 -3 -1
Poll Prior: 9/30-10/6
1st Poll: 10/7-10/13
2nd Poll: 10/14-10/20
Final Poll: 10/31-11/6 Democratic -2 +7 0 +5
Debate #2 10/09/16 Republican +7 -5 -3 -1 Poll Prior: 9/30-10/6
1st Poll: 10/7-10/13
2nd Poll: 10/14-10/20
Final Poll: 10/31-11/6 Democratic -2 +7 0 +5
Debate #3 10/19/16 Republican -4 +1 0 -3 Poll Prior: 10/14-10/20
1st Poll: 10/21-10/27
2nd Poll: 10/27-11/2
Final Poll: 10/31-11/6 Democratic -5 +5 0 0
Comey Letter to
Congress 10/28/16 Republican +1 0 0 +1
Poll Prior: 10/21-10/27
1st Poll: 10/28-11/3
2nd Poll: 10/31-11/6
Final Poll: 10/31-11/6 Democratic +6 -1 0 +5
Data for this table are drawn from Ipsos polls conducted from September 2, 2016 to November 6, 2016. Change in support is
shown from the poll prior to the event to the first poll following the event, from the first poll following the event to the second
poll following the event, and from the second poll following the event to the final poll of the campaign ending on November 6.
For additional information on the changes in poll levels see Appendix B.
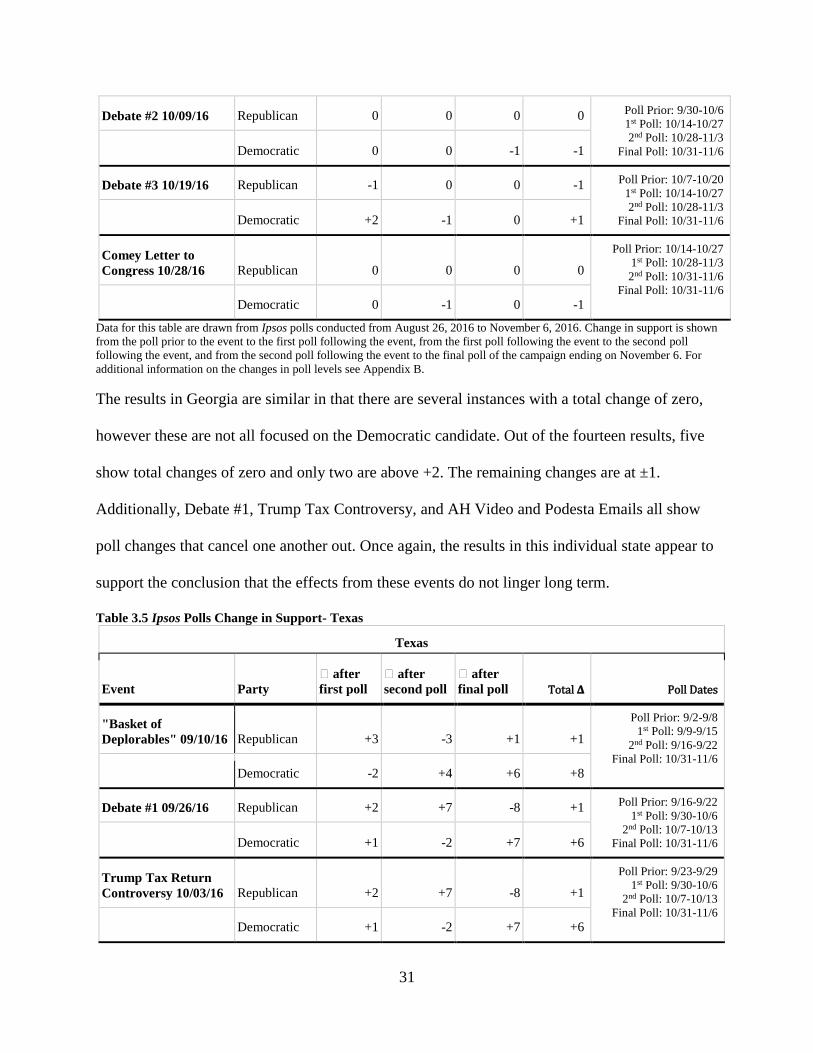
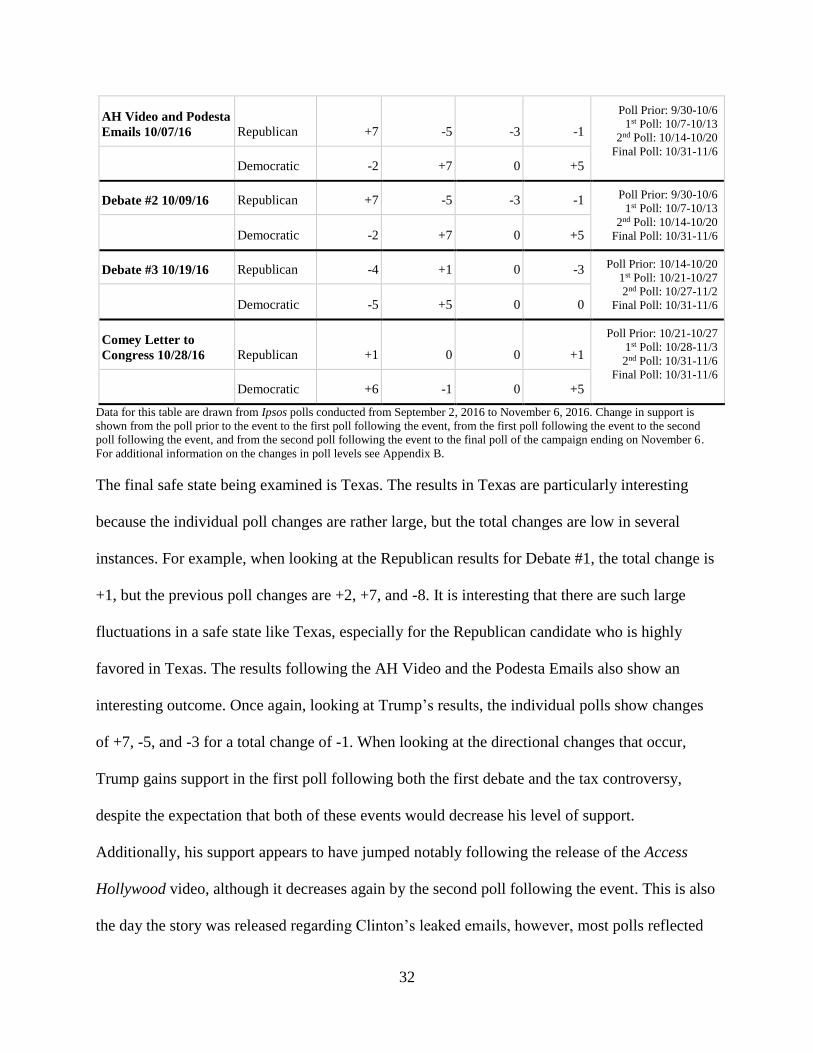
The final safe state being examined is Texas. The results in Texas are particularly interesting
because the individual poll changes are rather large, but the total changes are low in several
instances. For example, when looking at the Republican results for Debate #1, the total change is
+1, but the previous poll changes are +2, +7, and -8. It is interesting that there are such large
fluctuations in a safe state like Texas, especially for the Republican candidate who is highly
favored in Texas. The results following the AH Video and the Podesta Emails also show an
interesting outcome. Once again, looking at Trump’s results, the individual polls show changes
of +7, -5, and -3 for a total change of -1. When looking at the directional changes that occur,
Trump gains support in the first poll following both the first debate and the tax controversy,
despite the expectation that both of these events would decrease his level of support.
Additionally, his support appears to have jumped notably following the release of the Access
Hollywood video, although it decreases again by the second poll following the event. This is also
the day the story was released regarding Clinton’s leaked emails, however, most polls reflected
33
changes more in favor of Clinton than Trump in terms of these two events. These results appear
quite different from the results in other states, but they still support the hypothesis because most
of the events showed some change in support that dissipated prior to Election Day.
When considering the results for tables 3.1 through 3.5, it is important to acknowledge
the fact that some of the impacts of events overlap. Because the events occurred close to one
another, it is highly likely that some of the impacts had not fully dissipated by the time an
additional event occurred. This likely causes some changes in the results measuring the impact
on predicted voter choice. Because it is nearly impossible to separate out the impact that each
individual event caused, it is important to be aware of the potential for overlapped impacts when
viewing the results and drawing conclusions regarding the implications of the data. Although this
may weaken the conclusions drawn from this data, the results still provide meaningful insight
into the role of discrete events in the campaign.
As demonstrated in the above tables, it appears that most discrete events or “October
surprises” that occurred during the campaign had some effect on the polls, however, most of the
fluctuations dissipated by Election Day. Although it is important to account for these discrete
events when looking at polling data from the campaign, these data demonstrate that events did
not play a major role in altering the outcome of the election. Because this data analysis
establishes the role that discrete events play in the campaign, analysis can now focus on the
impact of campaign visits. Although the discrete events focused on do not cover all newsworthy
events throughout the campaign, they captured the largest stories of the campaign from
September 5, 2016 to November 6, 2016. By focusing on the major events of the campaign and
determining their impact, the same conclusion could be extended to lesser events that occurred.
With the new conclusion that these events do not directly alter the outcome of the election, more
34
focus can be given to the impact of campaign appearances without dedicating additional
resources to the impact of the media, including both the news media as well as advertising efforts
by candidates on the outcome of the election. Although the media and canvassing efforts likely
play a role in the election, the scope of this thesis does not allow for a more in depth analysis of
the role of the news media and advertising beyond the discrete events just covered.
Hypothesis Two
The second hypothesis focuses on the impact that campaign visits have on the level of
support for each candidate. The prediction is that as the number of campaign appearances
increases, so will support for that candidate, relative to his or her opponent. By looking at
relative changes in support, decisions by undecided voters can be accounted for within the data
as well. The net change shows not only an increase in support for one particular candidate, but
accounts for increases that have occurred for both candidates, which could be due to undecideds
choosing for whom to vote. Looking at net changes shows the difference in support between
candidates, accounting for potential increases for both candidates coming from undecided voters
choosing for whom they will vote. This hypothesis considers candidate and surrogate visits as
one variable, which also helps to account for the disparity between Trump’s surrogates and
Clinton’s surrogates. Because the data only tap the total number of visits and not the number of
surrogates conducting the visits, the differing number of surrogates is not relevant. Additionally,
the data do not account for visits conducted by surrogates and candidates together. Although this
consideration is not present within the analysis of the results, potential voters would have
exposure to both the candidate and the surrogate, so these visits are counted as both a surrogate
and a candidate visit. Even though Clinton had more surrogates, she made fewer visits than
35
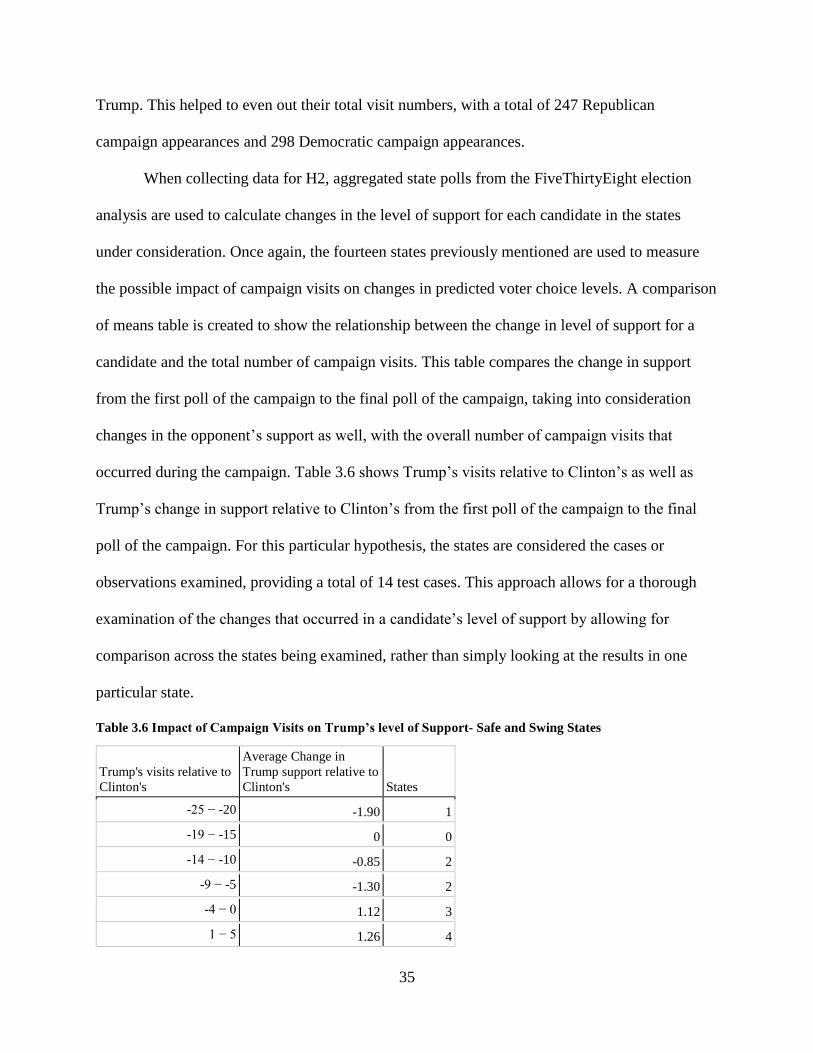
Trump. This helped to even out their total visit numbers, with a total of 247 Republican
campaign appearances and 298 Democratic campaign appearances.
When collecting data for H2, aggregated state polls from the FiveThirtyEight election
analysis are used to calculate changes in the level of support for each candidate in the states
under consideration. Once again, the fourteen states previously mentioned are used to measure
the possible impact of campaign visits on changes in predicted voter choice levels. A comparison
of means table is created to show the relationship between the change in level of support for a
candidate and the total number of campaign visits. This table compares the change in support
from the first poll of the campaign to the final poll of the campaign, taking into consideration
changes in the opponent’s support as well, with the overall number of campaign visits that
occurred during the campaign. Table 3.6 shows Trump’s visits relative to Clinton’s as well as
Trump’s change in support relative to Clinton’s from the first poll of the campaign to the final
poll of the campaign. For this particular hypothesis, the states are considered the cases or
observations examined, providing a total of 14 test cases. This approach allows for a thorough
examination of the changes that occurred in a candidate’s level of support by allowing for
comparison across the states being examined, rather than simply looking at the results in one
particular state.
Table 3.6 Impact of Campaign Visits on Trump’s level of Support- Safe and Swing States
Trump's visits relative to
Clinton's
Average Change in
Trump support relative to
Clinton's States
-25 − -20 -1.90 1
-19 − -15 0 0
-14 − -10 -0.85 2
-9 − -5 -1.30 2
-4 − 0 1.12 3
1 − 5 1.26 4
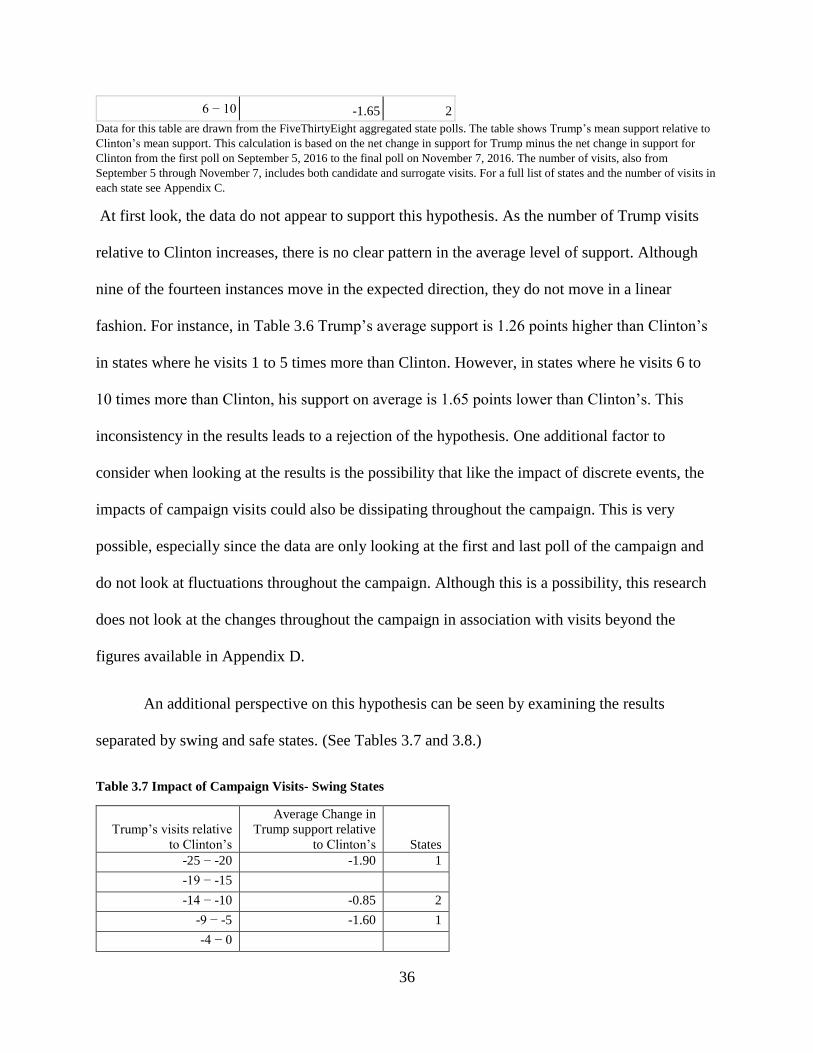
36
6 − 10 -1.65 2
Data for this table are drawn from the FiveThirtyEight aggregated state polls. The table shows Trump’s mean support relative to
Clinton’s mean support. This calculation is based on the net change in support for Trump minus the net change in support for
Clinton from the first poll on September 5, 2016 to the final poll on November 7, 2016. The number of visits, also from
September 5 through November 7, includes both candidate and surrogate visits. For a full list of states and the number of visits in
each state see Appendix C.
At first look, the data do not appear to support this hypothesis. As the number of Trump visits
relative to Clinton increases, there is no clear pattern in the average level of support. Although
nine of the fourteen instances move in the expected direction, they do not move in a linear
fashion. For instance, in Table 3.6 Trump’s average support is 1.26 points higher than Clinton’s
in states where he visits 1 to 5 times more than Clinton. However, in states where he visits 6 to
10 times more than Clinton, his support on average is 1.65 points lower than Clinton’s. This
inconsistency in the results leads to a rejection of the hypothesis. One additional factor to
consider when looking at the results is the possibility that like the impact of discrete events, the
impacts of campaign visits could also be dissipating throughout the campaign. This is very
possible, especially since the data are only looking at the first and last poll of the campaign and
do not look at fluctuations throughout the campaign. Although this is a possibility, this research
does not look at the changes throughout the campaign in association with visits beyond the
figures available in Appendix D.
An additional perspective on this hypothesis can be seen by examining the results
separated by swing and safe states. (See Tables 3.7 and 3.8.)
Table 3.7 Impact of Campaign Visits- Swing States
Trump’s visits relative
to Clinton’s
Average Change in
Trump support relative
to Clinton’s States
-25 − -20 -1.90 1
-19 − -15
-14 − -10 -0.85 2
-9 − -5 -1.60 1
-4 − 0
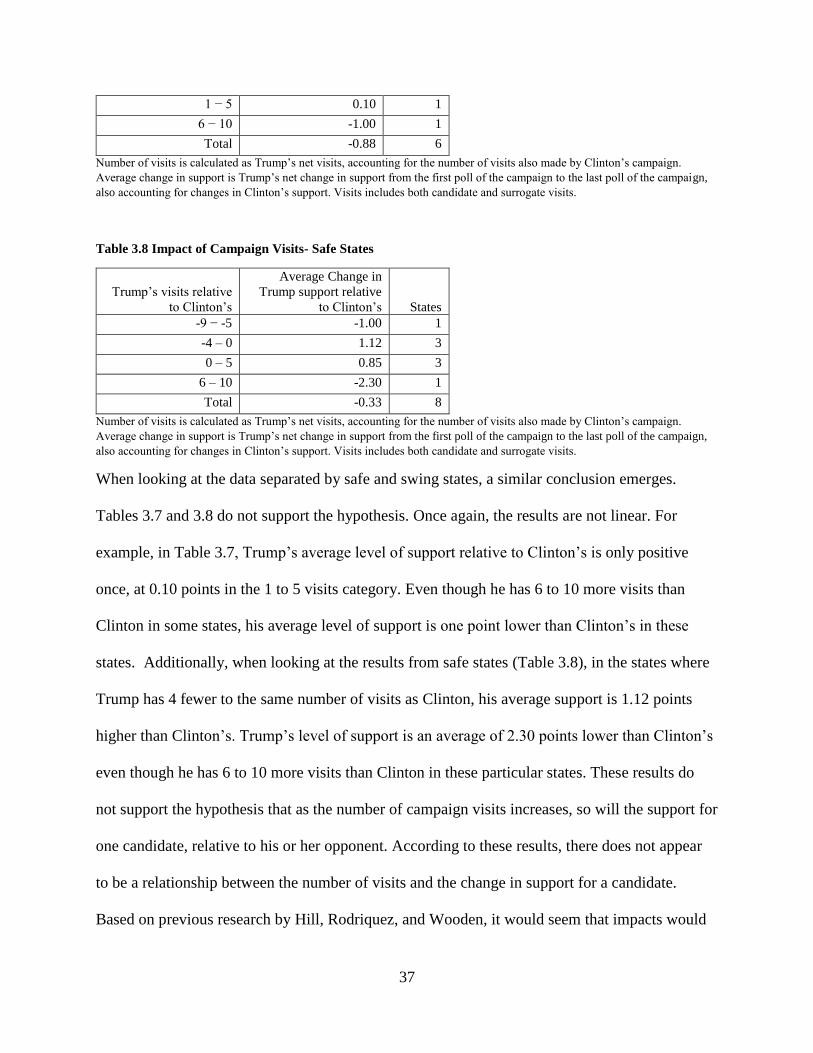
37
1 − 5 0.10 1
6 − 10 -1.00 1
Total -0.88 6
Number of visits is calculated as Trump’s net visits, accounting for the number of visits also made by Clinton’s campaign.
Average change in support is Trump’s net change in support from the first poll of the campaign to the last poll of the campaign,
also accounting for changes in Clinton’s support. Visits includes both candidate and surrogate visits.
Table 3.8 Impact of Campaign Visits- Safe States
Trump’s visits relative
to Clinton’s
Average Change in
Trump support relative
to Clinton’s States
-9 − -5 -1.00 1
-4 – 0 1.12 3
0 – 5 0.85 3
6 – 10 -2.30 1
Total -0.33 8
Number of visits is calculated as Trump’s net visits, accounting for the number of visits also made by Clinton’s campaign.
Average change in support is Trump’s net change in support from the first poll of the campaign to the last poll of the campaign,
also accounting for changes in Clinton’s support. Visits includes both candidate and surrogate visits.
When looking at the data separated by safe and swing states, a similar conclusion emerges.
Tables 3.7 and 3.8 do not support the hypothesis. Once again, the results are not linear. For
example, in Table 3.7, Trump’s average level of support relative to Clinton’s is only positive
once, at 0.10 points in the 1 to 5 visits category. Even though he has 6 to 10 more visits than
Clinton in some states, his average level of support is one point lower than Clinton’s in these
states. Additionally, when looking at the results from safe states (Table 3.8), in the states where
Trump has 4 fewer to the same number of visits as Clinton, his average support is 1.12 points
higher than Clinton’s. Trump’s level of support is an average of 2.30 points lower than Clinton’s
even though he has 6 to 10 more visits than Clinton in these particular states. These results do
not support the hypothesis that as the number of campaign visits increases, so will the support for
one candidate, relative to his or her opponent. According to these results, there does not appear
to be a relationship between the number of visits and the change in support for a candidate.
Based on previous research by Hill, Rodriquez, and Wooden, it would seem that impacts would
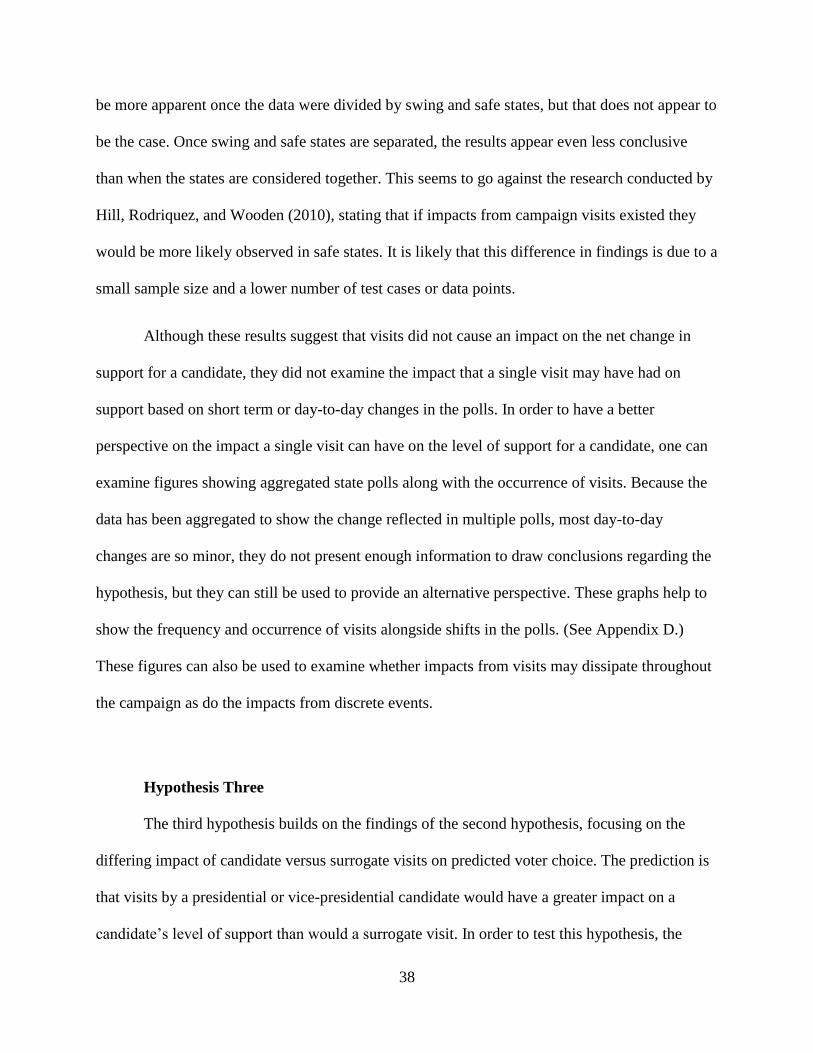
38
be more apparent once the data were divided by swing and safe states, but that does not appear to
be the case. Once swing and safe states are separated, the results appear even less conclusive
than when the states are considered together. This seems to go against the research conducted by
Hill, Rodriquez, and Wooden (2010), stating that if impacts from campaign visits existed they
would be more likely observed in safe states. It is likely that this difference in findings is due to a
small sample size and a lower number of test cases or data points.
Although these results suggest that visits did not cause an impact on the net change in
support for a candidate, they did not examine the impact that a single visit may have had on
support based on short term or day-to-day changes in the polls. In order to have a better
perspective on the impact a single visit can have on the level of support for a candidate, one can
examine figures showing aggregated state polls along with the occurrence of visits. Because the
data has been aggregated to show the change reflected in multiple polls, most day-to-day
changes are so minor, they do not present enough information to draw conclusions regarding the
hypothesis, but they can still be used to provide an alternative perspective. These graphs help to
show the frequency and occurrence of visits alongside shifts in the polls. (See Appendix D.)
These figures can also be used to examine whether impacts from visits may dissipate throughout
the campaign as do the impacts from discrete events.
Hypothesis Three
The third hypothesis builds on the findings of the second hypothesis, focusing on the
differing impact of candidate versus surrogate visits on predicted voter choice. The prediction is
that visits by a presidential or vice-presidential candidate would have a greater impact on a
candidate’s level of support than would a surrogate visit. In order to test this hypothesis, the
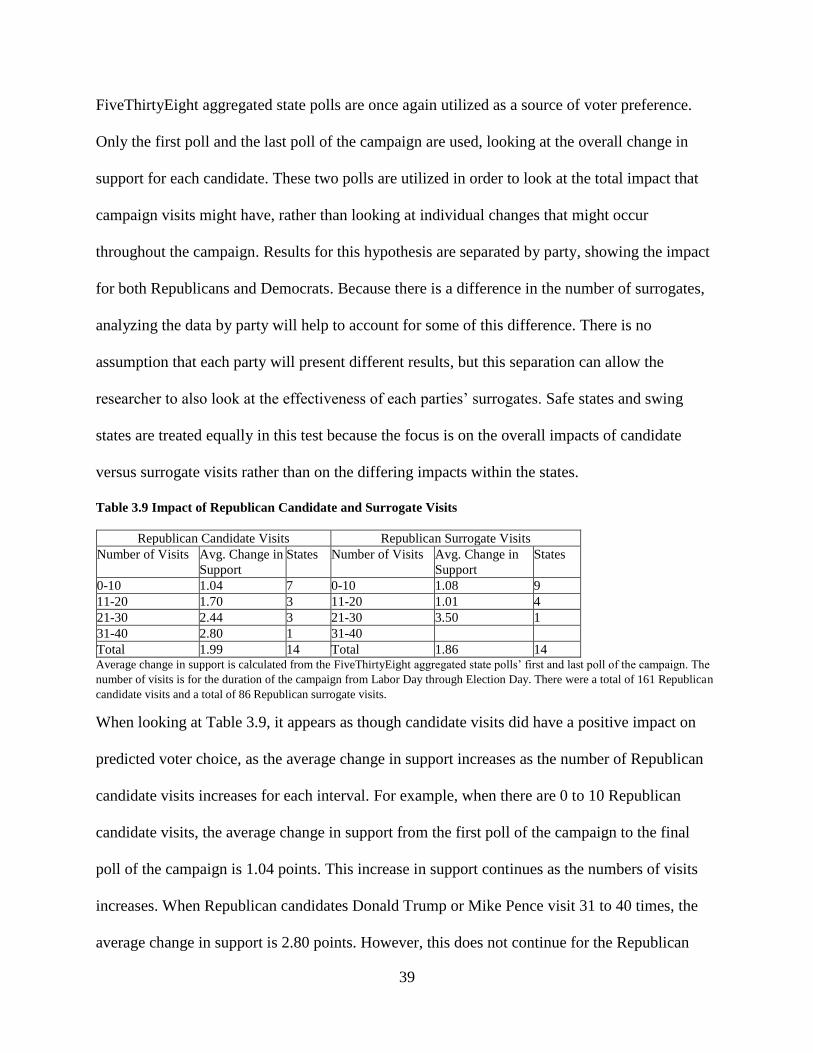
39
FiveThirtyEight aggregated state polls are once again utilized as a source of voter preference.
Only the first poll and the last poll of the campaign are used, looking at the overall change in
support for each candidate. These two polls are utilized in order to look at the total impact that
campaign visits might have, rather than looking at individual changes that might occur
throughout the campaign. Results for this hypothesis are separated by party, showing the impact
for both Republicans and Democrats. Because there is a difference in the number of surrogates,
analyzing the data by party will help to account for some of this difference. There is no
assumption that each party will present different results, but this separation can allow the
researcher to also look at the effectiveness of each parties’ surrogates. Safe states and swing
states are treated equally in this test because the focus is on the overall impacts of candidate
versus surrogate visits rather than on the differing impacts within the states.
Table 3.9 Impact of Republican Candidate and Surrogate Visits
Republican Candidate Visits Republican Surrogate Visits
Number of Visits Avg. Change in
Support
States Number of Visits Avg. Change in
Support
States
0-10 1.04 7 0-10 1.08 9
11-20 1.70 3 11-20 1.01 4
21-30 2.44 3 21-30 3.50 1
31-40 2.80 1 31-40
Total 1.99 14 Total 1.86 14 Average change in support is calculated from the FiveThirtyEight aggregated state polls’ first and last poll of the campaign. The
number of visits is for the duration of the campaign from Labor Day through Election Day. There were a total of 161 Republican
candidate visits and a total of 86 Republican surrogate visits.
When looking at Table 3.9, it appears as though candidate visits did have a positive impact on
predicted voter choice, as the average change in support increases as the number of Republican
candidate visits increases for each interval. For example, when there are 0 to 10 Republican
candidate visits, the average change in support from the first poll of the campaign to the final
poll of the campaign is 1.04 points. This increase in support continues as the numbers of visits
increases. When Republican candidates Donald Trump or Mike Pence visit 31 to 40 times, the
average change in support is 2.80 points. However, this does not continue for the Republican
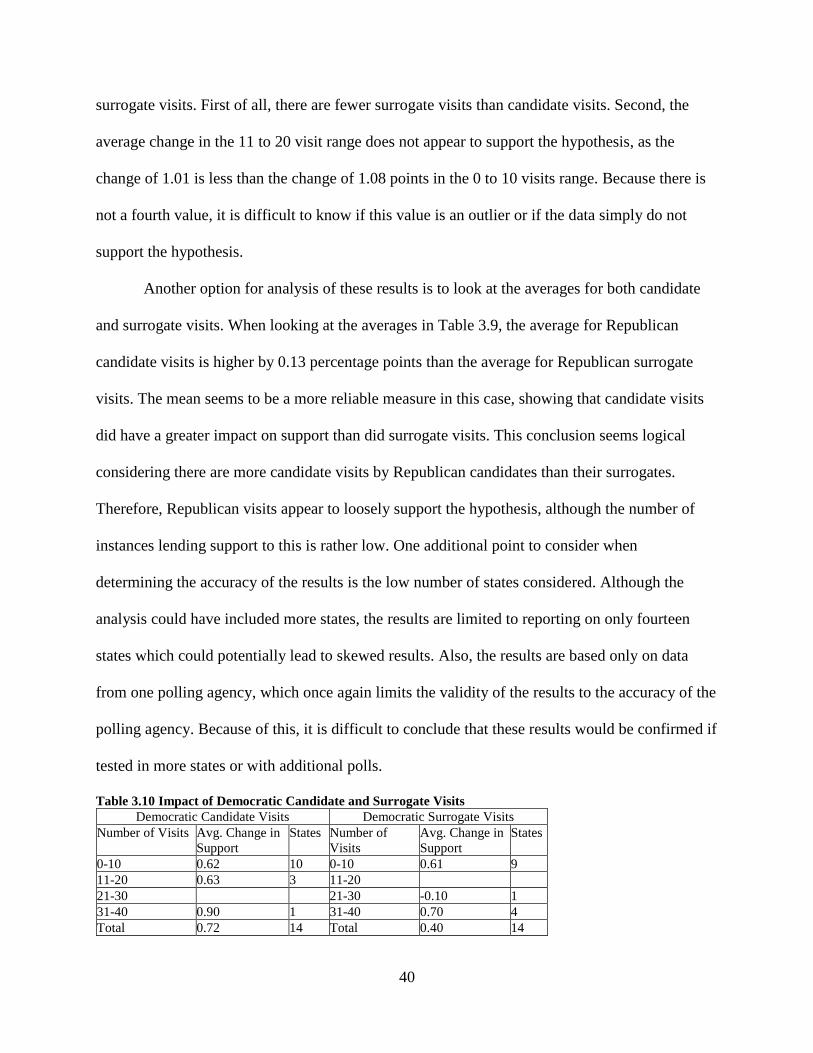
40
surrogate visits. First of all, there are fewer surrogate visits than candidate visits. Second, the
average change in the 11 to 20 visit range does not appear to support the hypothesis, as the
change of 1.01 is less than the change of 1.08 points in the 0 to 10 visits range. Because there is
not a fourth value, it is difficult to know if this value is an outlier or if the data simply do not
support the hypothesis.
Another option for analysis of these results is to look at the averages for both candidate
and surrogate visits. When looking at the averages in Table 3.9, the average for Republican
candidate visits is higher by 0.13 percentage points than the average for Republican surrogate
visits. The mean seems to be a more reliable measure in this case, showing that candidate visits
did have a greater impact on support than did surrogate visits. This conclusion seems logical
considering there are more candidate visits by Republican candidates than their surrogates.
Therefore, Republican visits appear to loosely support the hypothesis, although the number of
instances lending support to this is rather low. One additional point to consider when
determining the accuracy of the results is the low number of states considered. Although the
analysis could have included more states, the results are limited to reporting on only fourteen
states which could potentially lead to skewed results. Also, the results are based only on data
from one polling agency, which once again limits the validity of the results to the accuracy of the
polling agency. Because of this, it is difficult to conclude that these results would be confirmed if
tested in more states or with additional polls.
Table 3.10 Impact of Democratic Candidate and Surrogate Visits Democratic Candidate Visits Democratic Surrogate Visits
Number of Visits Avg. Change in
Support
States Number of
Visits
Avg. Change in
Support
States
0-10 0.62 10 0-10 0.61 9
11-20 0.63 3 11-20
21-30 21-30 -0.10 1
31-40 0.90 1 31-40 0.70 4
Total 0.72 14 Total 0.40 14
41
Average change in support is calculated from the FiveThirtyEight aggregated state polls’ first and last poll of the campaign. The
number of visits is for the duration of the campaign from Labor Day through Election Day. There were a total of 118 Democratic
candidate visits and a total of 180 Democratic surrogate visits.
Table 3.10 shows the impact that Democratic candidate and surrogate visits have on
predicted voter choice. When looking at the impact candidate visits have, it appears as though
the results did move in a positive linear direction, although the change in support at the 0 to 10
visit range (0.62) and the 11 to 20 visit range (0.63) are only 0.01 point apart. Additionally,
neither Hillary Clinton nor Tim Kaine made between 21 and 30 visits in any one state. The
results for Democratic surrogate visits do not appear to move in a positive linear manner. With
the exception of the 21 to 30 visit range which showed a decrease in support of 0.10, the results
could potentially move in this manner, but it is too difficult to conclude this since no surrogate
visited a state between 11 and 20 times. It appears as though for the Democrats, candidate visits
have more of an impact on predicted voter choice than did surrogate visits based on an average
change of 0.72 for candidate visits and an average change of 0.40 for surrogate visits. This also
appears to loosely support the hypothesis. This is particularly interesting when considering the
Democratic results because there are 180 Democratic surrogate visits and only 118 Democratic
candidate visits in the 14 states examined here; this might have meant that surrogate visits have a
greater impact due simply to the fact that there are more appearances and a greater chance for
voters to interact with surrogates. However, this does not appear to be the case and voters seem
to be impacted to a higher degree by candidates than surrogates, even if the surrogates are
making more public appearances and interacting with voters more.
Although the data appear to support this hypothesis, there are several important aspects of
this analysis to point out. First of all, because the analysis looks at Republican and Democratic
results separately, there is no consideration for visits occurring at the same time by a candidate of
the opposing party. Second, there is also no consideration for the number of times a candidate or
42
surrogate visits a particular state. This could lead to skewed results because it does not isolate the
impact that these multiple visits could be having, especially when potentially being compared to
a state without multiple visits. Third, this hypothesis looks only at the possible impact of
surrogate and candidate visits, but once again does not consider alternative factors that could
lead to changes in predicted voter choice. So although the data appear to loosely support the
hypothesis, it is important to remember the context of the tested data and also account for these
additional implications. One final aspect to note regarding these results is the fact that these
results are unlikely to produce statistically significant values if tested further and would not be
likely to be reproduced in a larger set of data or in a real-world setting. The hypothesis is loosely
supported, but there are several factors that could reverse this finding if further data testing were
conducted.
Summary
The results show that two out of the three hypotheses are supported, although loosely.
The impacts of discrete events do dissipate prior to Election Day. Campaign appearances have
minimal effects on changes in predicted voter choice, but it appears as though candidate visits
have a greater impact than do surrogate visits. Although the major expectation of the research
about campaign appearances is not supported, there are still many implications of this research.
By exploring the impact of campaign appearances with a specific focus on candidate and
surrogate visits, the conclusions of the data analysis have led to several possible expansions of
this research that could potentially develop the field of research and lead to new areas of
exploration. These implications will be discussed further in the concluding chapter.
43
Chapter Four: Discussion and Conclusion
Discussion
The research in this thesis examined two major facets of the American presidential
campaign process. By focusing the hypotheses on the impact of discrete events throughout the
campaign as well as on the influence that campaign appearances have on predicted voter choice,
a more complete picture of the importance of campaigns can be viewed. The first hypothesis
surrounding the impact of discrete events is supported. Discrete events do in fact affect voter
preferences when they occur, but the shifts in preference do not appear to endure until Election
Day. In a world where the news media essentially have unrestricted access to the lives of
candidates, this finding could be seen as a positive for the candidates. However, this dissipating
impact could be a negative for voters. It is possible that if candidates know that these “October
surprises” have little chance of changing the final outcome of the election, they will be less
concerned with avoiding scandal or other negative newsworthy events. This is just one possible
implication of this finding. On a positive note, it is also possible that these types of events could
also begin receiving less news media attention if their lack of lasting impact is revealed.
Once a conclusion is reached regarding the role that discrete events play in the campaign,
the focus is shifted to the results of the other hypotheses. The second hypothesis does not appear
to be supported. Although presidential candidates spend millions of dollars every election cycle
and travel the country visiting potential voters, the evidence presented in this thesis does not
indicate that these visits make an impact on projected voter decisions. Although it is important to
remember that there has not been a one-sided campaign by which to examine this hypothesis, it
44
is important to point out the lack of impact that campaign appearances, whether by candidates or
surrogates, have on changing support throughout the general election campaign.
This poses a potential future question for researchers surrounding the use of campaign
resources and time. Should candidates change the way they campaign in order to take advantage
of other avenues rather than visits? This question could lead to future research on other aspects
of campaigns that appear to influence voters the most. Although the second hypothesis did not
find support, the third hypothesis is supported loosely, showing that candidate appearances may
carry more weight with potential voters than do surrogate visits. It is possible that candidates
would not need endorsements from public figures in order to run a successful campaign. When
addressing the issue of endorsements and the use of surrogates, according to the findings here, it
appears that it does not matter how well known the surrogates are, voters would still prefer to
hear from a candidate. This is particularly interesting in 2016 with several former presidents on
the campaign trail. Even though the surrogates are very popular, voters evidently are more
influenced by an appearance from a candidate than by an appearance from a surrogate. While
these data show that candidates have a greater impact on voters than do surrogates, it is possible
that these differences in the reported voter preference could be due to voter turnout or other
efforts such as advertising and voter mobilization campaigns. Once again, due to the limited
nature of this thesis, the data analyzed do not account for these additional factors that could
likely have an impact on reported predicted voter choice.
Although this research covered campaign appearances extensively, several other facets of
campaigns could be examined to extend this research. In order to fully understand the dynamic
nature of campaigns, it would be necessary to analyze the role of the news media and
advertising, both at the state and national levels, as well as looking at the demographics of voters
45
and how different voters were specifically influenced by campaigns. Additionally, it would be
interesting to do further research on the use of surrogates and to attempt to determine the
individual impact that specific types of surrogates had to see if whom a candidate selects as a
surrogate plays into their impact on voters. These are possible extensions for future research that
could add to the field of campaign research.
Conclusion
Although many researchers have concluded that campaigns matter, it appears as though
campaign appearances do not matter much to voters, at least for affecting reported voter choice.
Extensive research has been conducted on the impact of campaigns with multiple findings
reported by many different researchers. Despite the fact that millions of dollars are spent on
presidential campaigns each cycle, it appears as though campaign appearances during the
presidential campaign do not ultimately influence the outcome of the election. Although
appearances do shift support slightly, none of these shifts seem to produce a weighty enough
impact to change the final outcome of the election. Additionally, discrete events throughout the
campaign appear to have an even smaller impact on the final decisions of voters. Prior to this
research, little had been explored by researchers regarding the impact of campaign visits, both by
candidates and surrogates.
This thesis has analyzed the impact that candidates and surrogates have on predicted
voter choice, focusing on the 2016 presidential election. After looking at a selection of both
swing states and safe states, the conclusion is that campaign appearances have a minimal effect
on voter decision making, but that candidate visits have a greater impact than do surrogate visits.
This finding does not align with the original prediction that campaign visits would impact
46
predicted voter choice. Although the data examined show that candidate visits have a slightly
greater impact on predicted voter choice than do surrogate visits, it is important to remember that
these results do not take into consideration the impact of media coverage, referring both to media
sponsored by candidates and news media covering the candidates, particularly in the realm of an
ad-blitz that could have coincided with the occurrence of these visits. Although the media
coverage that candidates receive and sponsor potentially has a great impact on the decision
making process of voters, the limitations of this research did not allow for a deeper investigation
into this role.
When considering the implications of this research, several areas could emerge for future
research. First, additional research could be conducted looking into the impact that media
coverage of the campaign has on the outcome of the election. Because the research showed that
campaign visits did not impact predicted voter choice, future research could look into what
aspects of the campaign do impact voter decision making. Although the focus on discrete events
helped to explain the role of some of the news media influences present in the campaign,
additional time and resources could be dedicated to this area of focus in the future, particularly
looking at the media coverage that is sponsored by a candidate. Advertising is a large area of the
campaign that could potentially be influencing changes in voter preference. Without further
research into this area, it is difficult to conclude that the results within this paper are definitive
because it is difficult to completely account for the role of advertising and media coverage.
Second, now that this research shows that campaign appearances evidently lead to minimal
changes in the outcomes of elections, further research could be dedicated to examining what
factors of the campaign do influence voter preferences, such as the previously mentioned
television advertisements, posters and signs, and press conferences. If campaign appearances are
47
not leading to consequential changes in voter preferences, it is important to investigate what is
leading to changes in order to better understand the function of campaigns but also for candidates
to run more efficient campaigns.
An additional area of potential research emerges when looking at alternative dependent
variables. It is evident that predicted voter choice is not affected by campaign appearances. In
order to extend this research in additional directions, future research could be conducted to test
whether campaign appearances lead to impacts regarding other areas of the campaign, such as
voter turnout or how knowledgeable voters are regarding the candidates and the issues of the
campaign. Looking back to the theoretical framework of this thesis, it would be interesting for
researchers to extend this exploration into how much campaign events effect how knowledgeable
different types of voters are. Knowing that certain populations of voters are targeted by the
campaign, it would be interesting to examine what impact events specifically have on different
groups of voters. Additionally, future research could focus more on voter mobilization and look
into what impacts campaign events had on voter turnout, especially among undecideds, which is
the group least likely to vote in elections. By shifting the focus of research to alternate impacts, it
is possible that researchers could learn more about how campaigns function to inform and
influence the decision making of voters, as well as to what knowledge regarding the candidates
and the election voters are most responsive.
The importance of campaign events has been debated for decades, but researchers are still
inconclusive on the role that they play. Through the collection and analysis of 2016 election data,
this thesis has concluded that campaign appearances do not cause meaningful change in
predicted voter choice, and the manner in which campaigns are conducted should be reevaluated.
Although discrete events draw major attention from the news media, voters do not appear to be
48
affected by these events in the long term. Because of these findings, clarification has been
provided on the importance that campaigns play and the door has been opened for future
research into the role that campaigns should take and on how voter preferences are most
influenced throughout the campaign.
49
Bibliography
Abramowitz, Alan. 2012. “Do Presidential Campaigns Matter? Evidence from the 2008
Election.” Sabato’s Crystal Ball, August 2. http://www.centerforpolitics.org/
crystalball/articles/do-presidential-campaigns-matter-evidence-from-the-2008-election/.
(Accessed 10 April 2018).
Bélanger, Éric, and Stuart Soroka. 2012. “Campaigns and the Prediction of Election Outcomes:
Can Historical and Campaign-Period Prediction Models be Combined?” Electoral
Studies, 31(4): 702-714.
Beinart, Peter. “Battle of the Surrogates.” The Atlantic, 26 May 2016, https://www.theatlantic.
com /politics/archive/2016/05/battle-of-the-surrogates/484352/. (Accessed 10 April
2018).
Burns, Alexander and Gardiner Harris. 2016. “Big Names Campaigning for Hillary Clinton
Underscore Donald Trump’s Isolation.” New York Times, November 4.
https://www.nytimes.com/2016/11/05/us/politics/campaign-trump-clinton.html.
(Accessed 10 April 2018).
Chozick, Amy and Matt Flegenheimer. 2016. “Liberals Hope Elizabeth Warren Will Serve as
Clinton’s Scrutinizer in Chief.” New York Times, October 24. https://www.nytimes.com
/2016/10/25/us/politics/hillary-clinton-elizabeth-warren.html. (Accessed 11 April 2018).
Cillizza, Chris. 2016. “Winners and Losers from the First Presidential Debate.” Washington
Post, September 26. https://www.washingtonpost.com/news/the-fix/wp/2016/09/26/
winners-and-losers-from-the-1st-presidential-debate/?utm_term=.ed79acff1360.
(Accessed 6 August 2018).
Cillizza, Chris. 2016. “Winners and Losers from the Second Presidential Debate.” Washington
50
Post, October 9. https://www.washingtonpost.com/news/the-fix/wp/2016/10/09/ winners-
and-losers-from-the-2nd-presidential-debate/?utm_term=.bb2527d21415
(Accessed 7 August, 2018).
Dawkins, Ryan. 2017. “Political Participation, Personality, and the Conditional Effect of
Campaign Mobilization.” Electoral Studies 45: 100-109.
Erikson, Robert S., and Christopher Wlezien. 2012. The Timeline of Presidential Elections:
How Campaigns Do (and Do Not) Matter. Chicago: University of Chicago Press.
Herr, J. Paul. 2002. “The Impact of Campaign Appearances in the 1996 Election.” The Journal
of Politics 64(3): 904-913.
Hill, Jeffrey S., Elaine Rodriquez, and Amanda E. Wooden. 2010. “Stump Speeches and Road
Trips: The Impact of State Campaign Appearances in Presidential Elections.” PS:
Political Science and Politics 43(2): 243-254.
Holbrook, Thomas M. 1996. Do Campaigns Matter? Thousand Oaks: Sage Publications.
Isenstien, Libby et al. 2016. “2016 Travel Tracker.” National Journal. http://traveltracker.
nationaljournal.com/. (Accessed 11 April, 2018).
Jacobson, Gary C. 2015. “How Do Campaigns Matter?” The Annual Review of Political Science
18: 31-47.
Kurtzleben, Danielle. 2016. “The Most ‘Unprecedented’ Election Ever? 65 Ways It Has Been.”
NPR, July 3. https://www.npr.org/2016/07/03/484214413/the-most-unprecedented-
Election-ever-65-ways-it-has-been. (Accessed 7 August 2018).
Lewis-Beck, Michael S., and Charles Tien. 2012. “Election Forecasting for Turbulent Times.”
PS: Political Science & Politics 45(4): 625-629.
Mehta, Seema. 2016. “Could a Transit Strike Affect the Vote in Battleground Pennsylvania?” LA
51
Times, November 6. http://www.latimes.com/nation/politics/trailguide/la-na-trailguide-
Updates-last-flurry-of-polls-provides-data-on-1478436452-htmlstory.html. (Accessed 11
April, 2018).
Murray, Mark. 2016. “How Clinton's Campaign is Winning the Surrogate War.” NBC News,
October 3. https://www.nbcnews.com/card/how-clinton-s-campaign-winning-
Surrogate-war-n658516. (Accessed 11 April, 2018).
Nagourney, Adam and Katharine Q. Seelye. 2004. “Bush and Kerry Focus Campaigns on 11 Key
States.” New York Times, October 24. http://www.nytimes.com/2004/10/24/politics
/campaign/bush-and-kerry-focus-campaigns-on-11-key-states.html. (Accessed 11 April,
2018).
National Popular Vote. 2016. “Two-Thirds of Presidential Campaign is in Just 6 States.”
NationalPopularVote.com. http://www.nationalpopularvote.com/campaign-events-2016.
(Accessed 11 April, 2018).
Ocasio, Bianca Padró. 2016. “Clinton Surrogates to Step Up on Trail Post-Debate.” Politico,
September 24. https://www.politico.com/story/2016/09/hillary-clinton-debate-surrogates-
Campaign-trail-228615. (Accessed 11 April, 2018).
Peters, Jeremy W. 2012. “Campaigns Blitz 9 Swing States in a Battle of Ads.” New York Times,
June 8. http://www.nytimes.com/2012/06/08/us/politics/9-swing-states-are-main-focus-
Of-ad-blitz.html. (Accessed 11 April, 2018).
Seitz-Wald, Alex and Ali Vitali. 2016. “Clinton Campaign Takes Advantage of a Surrogate
Gap.” NBC News, September 6. https://www.nbcnews.com/politics/2016-
election/clinton-campaign-takes-advantage-surrogate-gap-n643381. (Accessed 11 April,
2018).
52
Shafer, Jack. 2016. “16 Stories That Changed the 2016 Race.” Politico, November 6.
https://www.politico.com/story/2016/11/2016-election-biggest-stories-230790. (Accessed
11 April, 2018).
Silver, Nate. 2016. “FiveThirtyEight 2016 Election Forecast: Who Will Win Arizona?”
FiveThirtyEight. https://projects.fivethirtyeight.com/2016-election-forecast/arizona/
(Accessed 30 September, 2018).
Silver, Nate. 2018. “FiveThirtyEight Pollster Ratings.” FiveThirtyEight.
https://projects.fivethirtyeight.com/pollster-ratings/ (Accessed 6 August, 2018).
Stracqualursi, Veronica. 2016. “Key Moments of the 2016 Election.” ABC News, November 4.
http://abcnews.go.com/Politics/key-moments-2016-election/story?id=43289663.
(Accessed 11 April, 2018).
Terrell, Anthony. 2016. “Trump Out-Campaigned Clinton by 50 Percent in Key Battleground
States in Final Stretch.” NBC News, November 13. https://www.nbcnews.com
/politics/2016-election/trump-out-campaigned-clinton-50-percent-key-battlegrounds-
final-100-n683116. (Accessed 11 April, 2018).
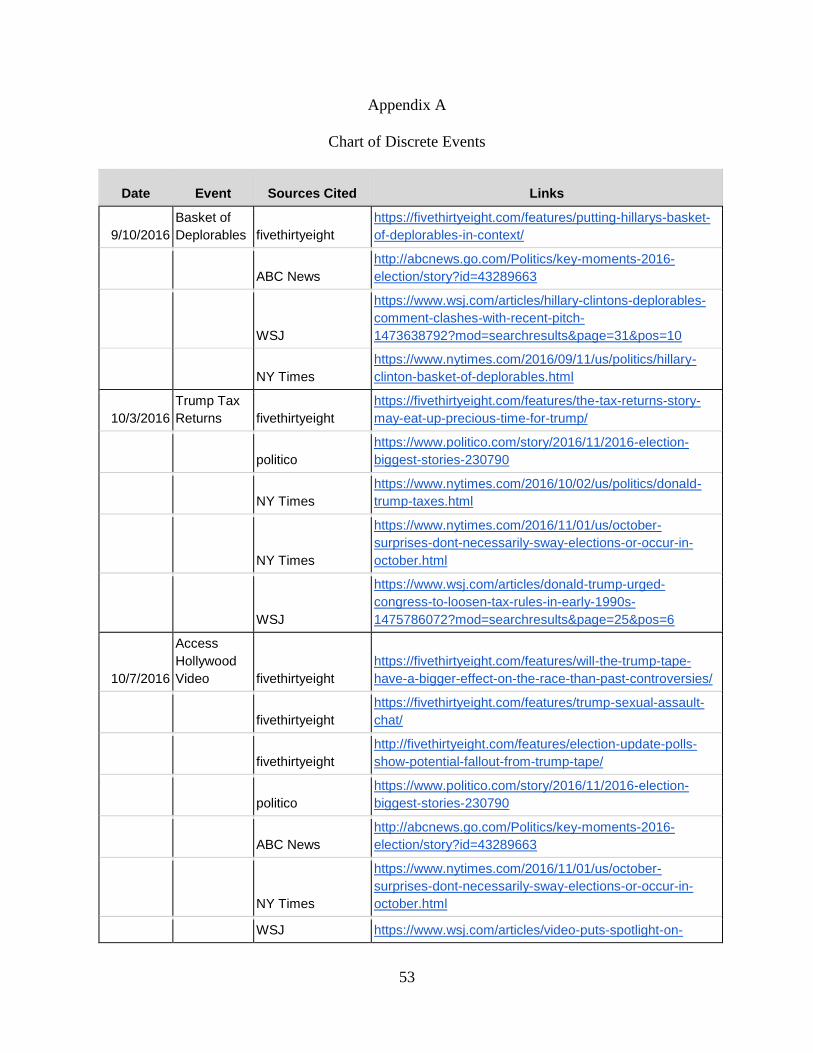
53
Appendix A
Chart of Discrete Events
Date Event Sources Cited Links
9/10/2016
Basket of
Deplorables fivethirtyeight
https://fivethirtyeight.com/features/putting-hillarys-basket-
of-deplorables-in-context/
ABC News
http://abcnews.go.com/Politics/key-moments-2016-
election/story?id=43289663
WSJ
https://www.wsj.com/articles/hillary-clintons-deplorables-
comment-clashes-with-recent-pitch-
1473638792?mod=searchresults&page=31&pos=10
NY Times
https://www.nytimes.com/2016/09/11/us/politics/hillary-
clinton-basket-of-deplorables.html
10/3/2016
Trump Tax
Returns fivethirtyeight
https://fivethirtyeight.com/features/the-tax-returns-story-
may-eat-up-precious-time-for-trump/
politico
https://www.politico.com/story/2016/11/2016-election-
biggest-stories-230790
NY Times
https://www.nytimes.com/2016/10/02/us/politics/donald-
trump-taxes.html
NY Times
https://www.nytimes.com/2016/11/01/us/october-
surprises-dont-necessarily-sway-elections-or-occur-in-
october.html
WSJ
https://www.wsj.com/articles/donald-trump-urged-
congress-to-loosen-tax-rules-in-early-1990s-
1475786072?mod=searchresults&page=25&pos=6
10/7/2016
Access
Hollywood
Video fivethirtyeight
https://fivethirtyeight.com/features/will-the-trump-tape-
have-a-bigger-effect-on-the-race-than-past-controversies/
fivethirtyeight
https://fivethirtyeight.com/features/trump-sexual-assault-
chat/
fivethirtyeight
http://fivethirtyeight.com/features/election-update-polls-
show-potential-fallout-from-trump-tape/
politico
https://www.politico.com/story/2016/11/2016-election-
biggest-stories-230790
ABC News
http://abcnews.go.com/Politics/key-moments-2016-
election/story?id=43289663
NY Times
https://www.nytimes.com/2016/11/01/us/october-
surprises-dont-necessarily-sway-elections-or-occur-in-
october.html
WSJ https://www.wsj.com/articles/video-puts-spotlight-on-
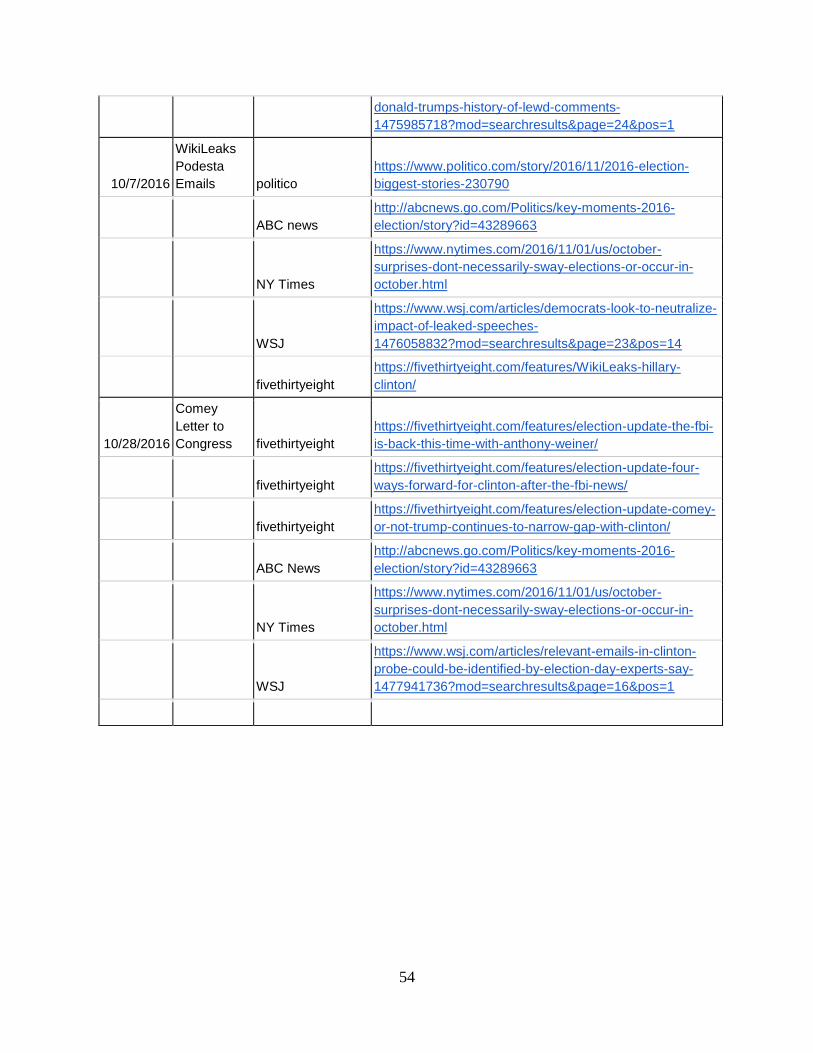
54
donald-trumps-history-of-lewd-comments-
1475985718?mod=searchresults&page=24&pos=1
10/7/2016
WikiLeaks
Podesta
Emails politico
https://www.politico.com/story/2016/11/2016-election-
biggest-stories-230790
ABC news
http://abcnews.go.com/Politics/key-moments-2016-
election/story?id=43289663
NY Times
https://www.nytimes.com/2016/11/01/us/october-
surprises-dont-necessarily-sway-elections-or-occur-in-
october.html
WSJ
https://www.wsj.com/articles/democrats-look-to-neutralize-
impact-of-leaked-speeches-
1476058832?mod=searchresults&page=23&pos=14
fivethirtyeight
https://fivethirtyeight.com/features/WikiLeaks-hillary-
clinton/
10/28/2016
Comey
Letter to
Congress fivethirtyeight
https://fivethirtyeight.com/features/election-update-the-fbi-
is-back-this-time-with-anthony-weiner/
fivethirtyeight
https://fivethirtyeight.com/features/election-update-four-
ways-forward-for-clinton-after-the-fbi-news/
fivethirtyeight
https://fivethirtyeight.com/features/election-update-comey-
or-not-trump-continues-to-narrow-gap-with-clinton/
ABC News
http://abcnews.go.com/Politics/key-moments-2016-
election/story?id=43289663
NY Times
https://www.nytimes.com/2016/11/01/us/october-
surprises-dont-necessarily-sway-elections-or-occur-in-
october.html
WSJ
https://www.wsj.com/articles/relevant-emails-in-clinton-
probe-could-be-identified-by-election-day-experts-say-
1477941736?mod=searchresults&page=16&pos=1
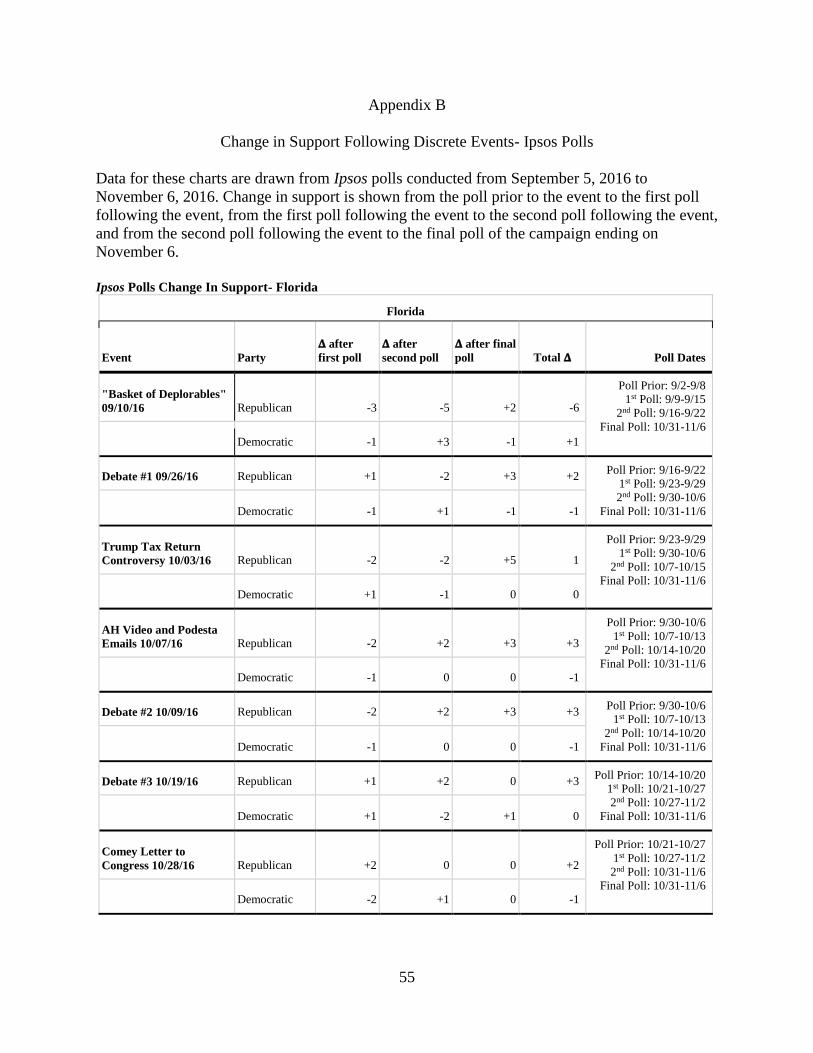
55
Appendix B
Change in Support Following Discrete Events- Ipsos Polls
Data for these charts are drawn from Ipsos polls conducted from September 5, 2016 to
November 6, 2016. Change in support is shown from the poll prior to the event to the first poll
following the event, from the first poll following the event to the second poll following the event,
and from the second poll following the event to the final poll of the campaign ending on
November 6.
Ipsos Polls Change In Support- Florida
Florida
Event Party
𝚫 after
first poll
𝚫 after
second poll
𝚫 after final
poll Total 𝚫 Poll Dates
"Basket of Deplorables"
09/10/16 Republican -3 -5 +2 -6
Poll Prior: 9/2-9/8
1st Poll: 9/9-9/15
2nd Poll: 9/16-9/22
Final Poll: 10/31-11/6
Democratic -1 +3 -1 +1
Debate #1 09/26/16 Republican +1 -2 +3 +2 Poll Prior: 9/16-9/22
1st Poll: 9/23-9/29
2nd Poll: 9/30-10/6
Final Poll: 10/31-11/6 Democratic -1 +1 -1 -1
Trump Tax Return
Controversy 10/03/16 Republican -2 -2 +5 1
Poll Prior: 9/23-9/29
1st Poll: 9/30-10/6
2nd Poll: 10/7-10/15
Final Poll: 10/31-11/6
Democratic +1 -1 0 0
AH Video and Podesta
Emails 10/07/16 Republican -2 +2 +3 +3
Poll Prior: 9/30-10/6
1st Poll: 10/7-10/13
2nd Poll: 10/14-10/20
Final Poll: 10/31-11/6
Democratic -1 0 0 -1
Debate #2 10/09/16 Republican -2 +2 +3 +3 Poll Prior: 9/30-10/6
1st Poll: 10/7-10/13
2nd Poll: 10/14-10/20
Final Poll: 10/31-11/6 Democratic -1 0 0 -1
Debate #3 10/19/16 Republican +1 +2 0 +3 Poll Prior: 10/14-10/20
1st Poll: 10/21-10/27
2nd Poll: 10/27-11/2
Final Poll: 10/31-11/6 Democratic +1 -2 +1 0
Comey Letter to
Congress 10/28/16 Republican +2 0 0 +2
Poll Prior: 10/21-10/27
1st Poll: 10/27-11/2
2nd Poll: 10/31-11/6
Final Poll: 10/31-11/6
Democratic -2 +1 0 -1
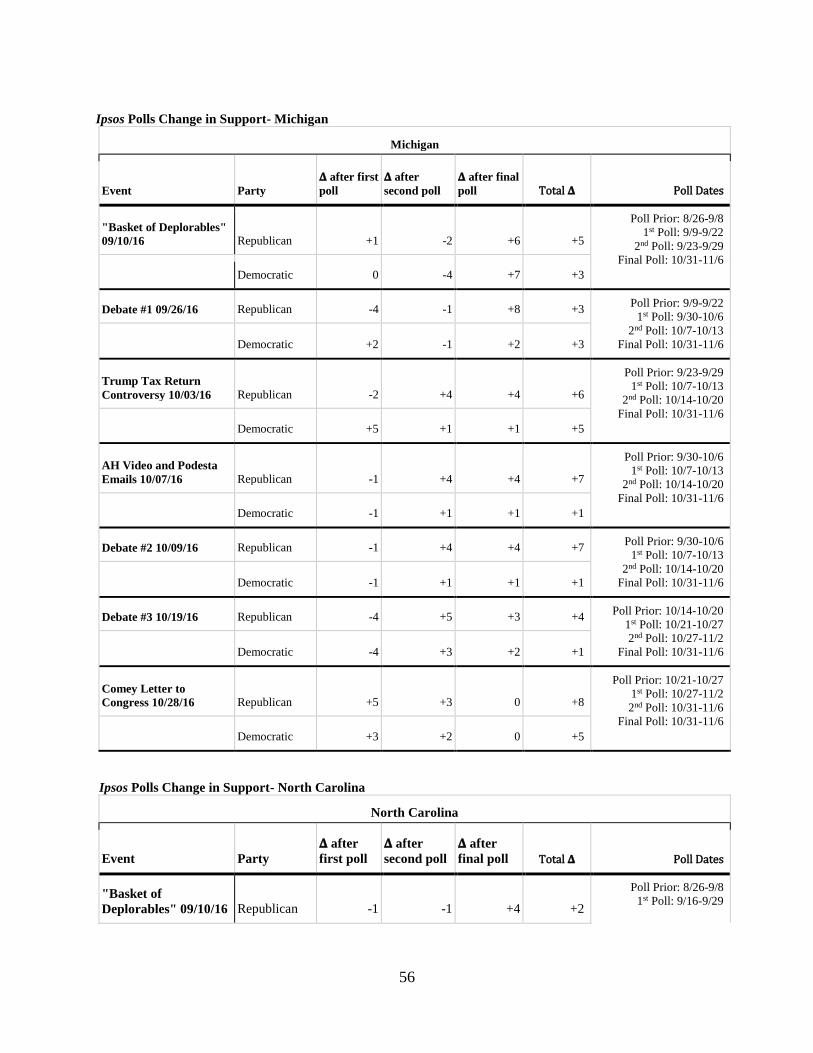
56
Ipsos Polls Change in Support- Michigan
Michigan
Event Party
𝚫 after first
poll
𝚫 after
second poll
𝚫 after final
poll Total 𝚫 Poll Dates
"Basket of Deplorables"
09/10/16 Republican +1 -2 +6 +5
Poll Prior: 8/26-9/8
1st Poll: 9/9-9/22
2nd Poll: 9/23-9/29
Final Poll: 10/31-11/6
Democratic 0 -4 +7 +3
Debate #1 09/26/16 Republican -4 -1 +8 +3 Poll Prior: 9/9-9/22
1st Poll: 9/30-10/6
2nd Poll: 10/7-10/13
Final Poll: 10/31-11/6 Democratic +2 -1 +2 +3
Trump Tax Return
Controversy 10/03/16 Republican -2 +4 +4 +6
Poll Prior: 9/23-9/29
1st Poll: 10/7-10/13
2nd Poll: 10/14-10/20
Final Poll: 10/31-11/6
Democratic +5 +1 +1 +5
AH Video and Podesta
Emails 10/07/16 Republican -1 +4 +4 +7
Poll Prior: 9/30-10/6
1st Poll: 10/7-10/13
2nd Poll: 10/14-10/20
Final Poll: 10/31-11/6
Democratic -1 +1 +1 +1
Debate #2 10/09/16 Republican -1 +4 +4 +7 Poll Prior: 9/30-10/6
1st Poll: 10/7-10/13
2nd Poll: 10/14-10/20
Final Poll: 10/31-11/6 Democratic -1 +1 +1 +1
Debate #3 10/19/16 Republican -4 +5 +3 +4 Poll Prior: 10/14-10/20
1st Poll: 10/21-10/27
2nd Poll: 10/27-11/2
Final Poll: 10/31-11/6 Democratic -4 +3 +2 +1
Comey Letter to
Congress 10/28/16 Republican +5 +3 0 +8
Poll Prior: 10/21-10/27
1st Poll: 10/27-11/2
2nd Poll: 10/31-11/6
Final Poll: 10/31-11/6
Democratic +3 +2 0 +5
Ipsos Polls Change in Support- North Carolina
North Carolina
Event Party
𝚫 after
first poll
𝚫 after
second poll
𝚫 after
final poll Total 𝚫 Poll Dates
"Basket of
Deplorables" 09/10/16 Republican -1 -1 +4 +2
Poll Prior: 8/26-9/8
1st Poll: 9/16-9/29
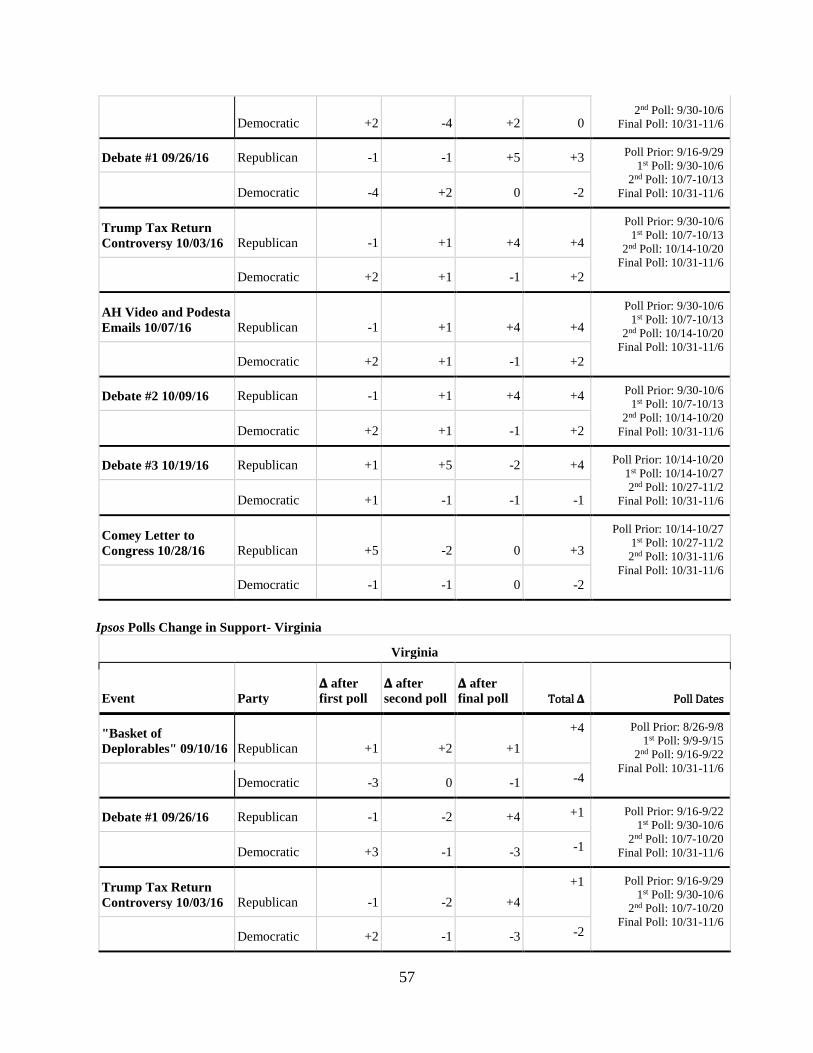
57
Democratic +2 -4 +2 0 2nd Poll: 9/30-10/6
Final Poll: 10/31-11/6
Debate #1 09/26/16 Republican -1 -1 +5 +3 Poll Prior: 9/16-9/29
1st Poll: 9/30-10/6
2nd Poll: 10/7-10/13
Final Poll: 10/31-11/6 Democratic -4 +2 0 -2
Trump Tax Return
Controversy 10/03/16 Republican -1 +1 +4 +4
Poll Prior: 9/30-10/6
1st Poll: 10/7-10/13
2nd Poll: 10/14-10/20
Final Poll: 10/31-11/6 Democratic +2 +1 -1 +2
AH Video and Podesta
Emails 10/07/16 Republican -1 +1 +4 +4
Poll Prior: 9/30-10/6
1st Poll: 10/7-10/13
2nd Poll: 10/14-10/20
Final Poll: 10/31-11/6 Democratic +2 +1 -1 +2
Debate #2 10/09/16 Republican -1 +1 +4 +4 Poll Prior: 9/30-10/6
1st Poll: 10/7-10/13
2nd Poll: 10/14-10/20
Final Poll: 10/31-11/6 Democratic +2 +1 -1 +2
Debate #3 10/19/16 Republican +1 +5 -2 +4 Poll Prior: 10/14-10/20
1st Poll: 10/14-10/27
2nd Poll: 10/27-11/2
Final Poll: 10/31-11/6 Democratic +1 -1 -1 -1
Comey Letter to
Congress 10/28/16 Republican +5 -2 0 +3
Poll Prior: 10/14-10/27
1st Poll: 10/27-11/2
2nd Poll: 10/31-11/6
Final Poll: 10/31-11/6 Democratic -1 -1 0 -2
Ipsos Polls Change in Support- Virginia
Virginia
Event Party
𝚫 after
first poll
𝚫 after
second poll
𝚫 after
final poll Total 𝚫 Poll Dates
"Basket of
Deplorables" 09/10/16 Republican +1 +2 +1
+4 Poll Prior: 8/26-9/8
1st Poll: 9/9-9/15
2nd Poll: 9/16-9/22
Final Poll: 10/31-11/6 Democratic -3 0 -1 -4
Debate #1 09/26/16 Republican -1 -2 +4 +1 Poll Prior: 9/16-9/22
1st Poll: 9/30-10/6
2nd Poll: 10/7-10/20
Final Poll: 10/31-11/6 Democratic +3 -1 -3 -1
Trump Tax Return
Controversy 10/03/16 Republican -1 -2 +4
+1 Poll Prior: 9/16-9/29
1st Poll: 9/30-10/6
2nd Poll: 10/7-10/20
Final Poll: 10/31-11/6 Democratic +2 -1 -3 -2
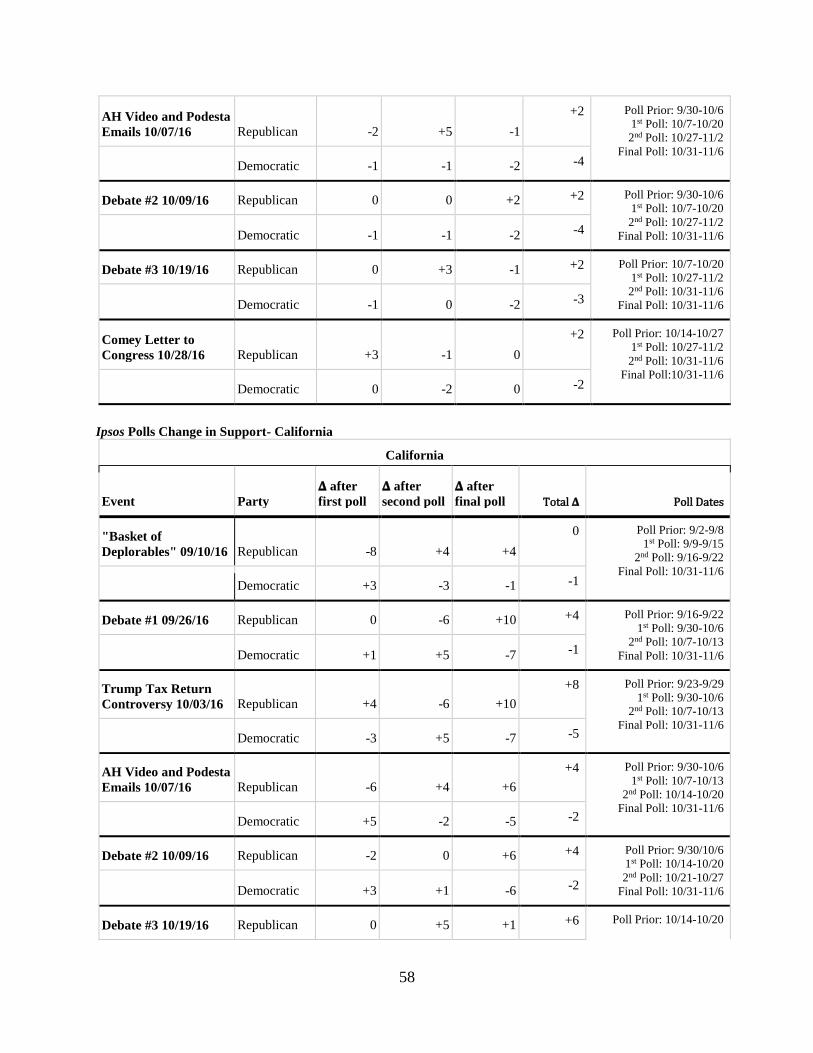
58
AH Video and Podesta
Emails 10/07/16 Republican -2 +5 -1
+2 Poll Prior: 9/30-10/6
1st Poll: 10/7-10/20
2nd Poll: 10/27-11/2
Final Poll: 10/31-11/6 Democratic -1 -1 -2 -4
Debate #2 10/09/16 Republican 0 0 +2 +2 Poll Prior: 9/30-10/6
1st Poll: 10/7-10/20
2nd Poll: 10/27-11/2
Final Poll: 10/31-11/6 Democratic -1 -1 -2 -4
Debate #3 10/19/16 Republican 0 +3 -1 +2 Poll Prior: 10/7-10/20
1st Poll: 10/27-11/2
2nd Poll: 10/31-11/6
Final Poll: 10/31-11/6 Democratic -1 0 -2 -3
Comey Letter to
Congress 10/28/16 Republican +3 -1 0
+2 Poll Prior: 10/14-10/27
1st Poll: 10/27-11/2
2nd Poll: 10/31-11/6
Final Poll:10/31-11/6 Democratic 0 -2 0 -2
Ipsos Polls Change in Support- California
California
Event Party
𝚫 after
first poll
𝚫 after
second poll
𝚫 after
final poll Total 𝚫 Poll Dates
"Basket of
Deplorables" 09/10/16 Republican -8 +4 +4
0 Poll Prior: 9/2-9/8
1st Poll: 9/9-9/15
2nd Poll: 9/16-9/22
Final Poll: 10/31-11/6 Democratic +3 -3 -1 -1
Debate #1 09/26/16 Republican 0 -6 +10 +4 Poll Prior: 9/16-9/22
1st Poll: 9/30-10/6
2nd Poll: 10/7-10/13
Final Poll: 10/31-11/6 Democratic +1 +5 -7 -1
Trump Tax Return
Controversy 10/03/16 Republican +4 -6 +10
+8 Poll Prior: 9/23-9/29
1st Poll: 9/30-10/6
2nd Poll: 10/7-10/13
Final Poll: 10/31-11/6 Democratic -3 +5 -7 -5
AH Video and Podesta
Emails 10/07/16 Republican -6 +4 +6
+4 Poll Prior: 9/30-10/6
1st Poll: 10/7-10/13
2nd Poll: 10/14-10/20
Final Poll: 10/31-11/6 Democratic +5 -2 -5 -2
Debate #2 10/09/16 Republican -2 0 +6 +4 Poll Prior: 9/30/10/6
1st Poll: 10/14-10/20
2nd Poll: 10/21-10/27
Final Poll: 10/31-11/6 Democratic +3 +1 -6 -2
Debate #3 10/19/16 Republican 0 +5 +1 +6 Poll Prior: 10/14-10/20
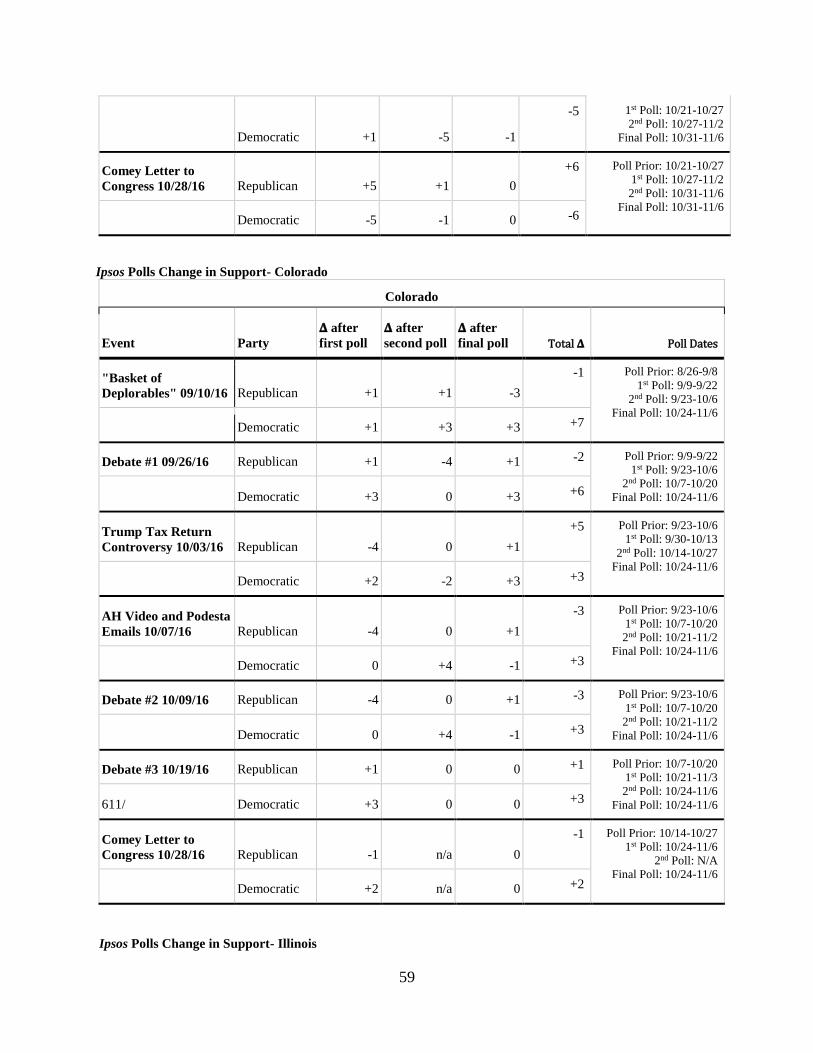
59
Democratic +1 -5 -1
-5 1st Poll: 10/21-10/27
2nd Poll: 10/27-11/2
Final Poll: 10/31-11/6
Comey Letter to
Congress 10/28/16 Republican +5 +1 0
+6 Poll Prior: 10/21-10/27
1st Poll: 10/27-11/2
2nd Poll: 10/31-11/6
Final Poll: 10/31-11/6 Democratic -5 -1 0 -6
Ipsos Polls Change in Support- Colorado
Colorado
Event Party
𝚫 after
first poll
𝚫 after
second poll
𝚫 after
final poll Total 𝚫 Poll Dates
"Basket of
Deplorables" 09/10/16 Republican +1 +1 -3
-1 Poll Prior: 8/26-9/8
1st Poll: 9/9-9/22
2nd Poll: 9/23-10/6
Final Poll: 10/24-11/6 Democratic +1 +3 +3 +7
Debate #1 09/26/16 Republican +1 -4 +1 -2 Poll Prior: 9/9-9/22
1st Poll: 9/23-10/6
2nd Poll: 10/7-10/20
Final Poll: 10/24-11/6 Democratic +3 0 +3 +6
Trump Tax Return
Controversy 10/03/16 Republican -4 0 +1
+5 Poll Prior: 9/23-10/6
1st Poll: 9/30-10/13
2nd Poll: 10/14-10/27
Final Poll: 10/24-11/6 Democratic +2 -2 +3 +3
AH Video and Podesta
Emails 10/07/16 Republican -4 0 +1
-3 Poll Prior: 9/23-10/6
1st Poll: 10/7-10/20
2nd Poll: 10/21-11/2
Final Poll: 10/24-11/6 Democratic 0 +4 -1 +3
Debate #2 10/09/16 Republican -4 0 +1 -3 Poll Prior: 9/23-10/6
1st Poll: 10/7-10/20
2nd Poll: 10/21-11/2
Final Poll: 10/24-11/6 Democratic 0 +4 -1 +3
Debate #3 10/19/16 Republican +1 0 0 +1 Poll Prior: 10/7-10/20
1st Poll: 10/21-11/3
2nd Poll: 10/24-11/6
Final Poll: 10/24-11/6 611/ Democratic +3 0 0 +3
Comey Letter to
Congress 10/28/16 Republican -1 n/a 0
-1 Poll Prior: 10/14-10/27
1st Poll: 10/24-11/6
2nd Poll: N/A
Final Poll: 10/24-11/6 Democratic +2 n/a 0 +2
Ipsos Polls Change in Support- Illinois
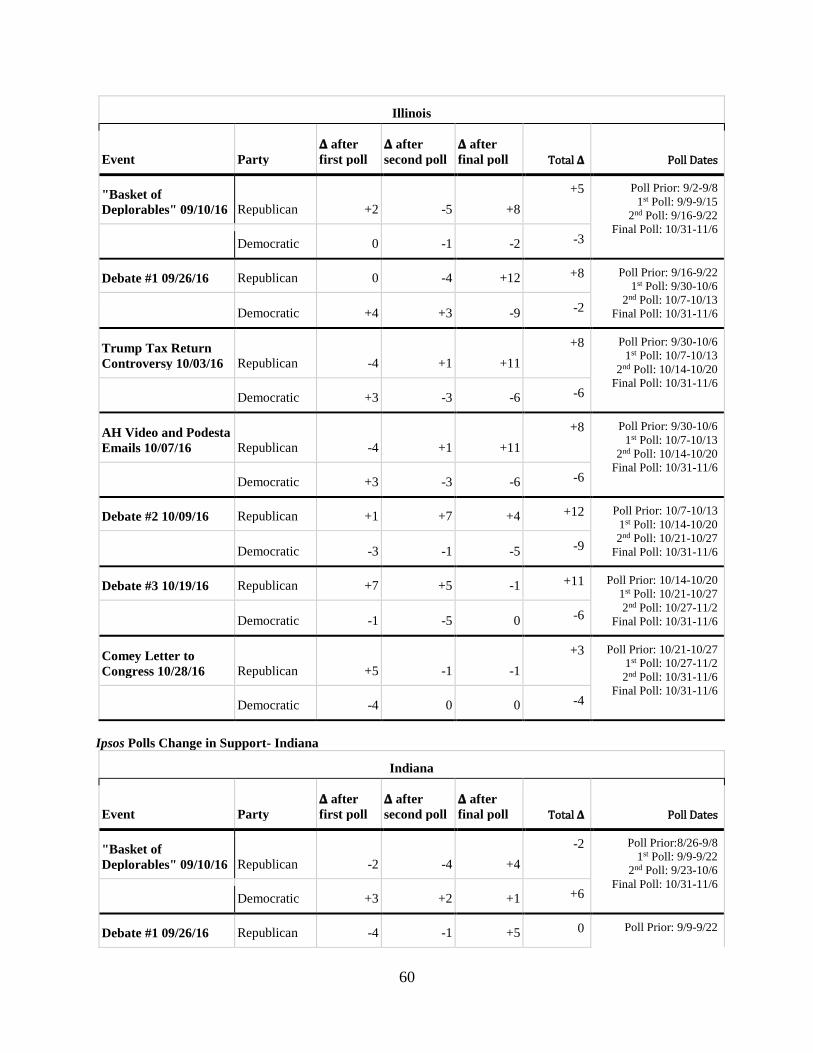
60
Illinois
Event Party
𝚫 after
first poll
𝚫 after
second poll
𝚫 after
final poll Total 𝚫 Poll Dates
"Basket of
Deplorables" 09/10/16 Republican
+2 -5 +8
+5 Poll Prior: 9/2-9/8
1st Poll: 9/9-9/15
2nd Poll: 9/16-9/22
Final Poll: 10/31-11/6 Democratic 0 -1 -2 -3
Debate #1 09/26/16 Republican 0 -4 +12 +8 Poll Prior: 9/16-9/22
1st Poll: 9/30-10/6
2nd Poll: 10/7-10/13
Final Poll: 10/31-11/6 Democratic +4 +3 -9 -2
Trump Tax Return
Controversy 10/03/16 Republican -4 +1 +11
+8 Poll Prior: 9/30-10/6
1st Poll: 10/7-10/13
2nd Poll: 10/14-10/20
Final Poll: 10/31-11/6 Democratic +3 -3 -6 -6
AH Video and Podesta
Emails 10/07/16 Republican -4 +1 +11
+8 Poll Prior: 9/30-10/6
1st Poll: 10/7-10/13
2nd Poll: 10/14-10/20
Final Poll: 10/31-11/6 Democratic +3 -3 -6 -6
Debate #2 10/09/16 Republican +1 +7 +4 +12 Poll Prior: 10/7-10/13
1st Poll: 10/14-10/20
2nd Poll: 10/21-10/27
Final Poll: 10/31-11/6 Democratic -3 -1 -5 -9
Debate #3 10/19/16 Republican +7 +5 -1 +11 Poll Prior: 10/14-10/20
1st Poll: 10/21-10/27
2nd Poll: 10/27-11/2
Final Poll: 10/31-11/6 Democratic -1 -5 0 -6
Comey Letter to
Congress 10/28/16 Republican +5 -1 -1
+3 Poll Prior: 10/21-10/27
1st Poll: 10/27-11/2
2nd Poll: 10/31-11/6
Final Poll: 10/31-11/6 Democratic -4 0 0 -4
Ipsos Polls Change in Support- Indiana
Indiana
Event Party
𝚫 after
first poll
𝚫 after
second poll
𝚫 after
final poll Total 𝚫 Poll Dates
"Basket of
Deplorables" 09/10/16 Republican -2 -4 +4
-2 Poll Prior:8/26-9/8
1st Poll: 9/9-9/22
2nd Poll: 9/23-10/6
Final Poll: 10/31-11/6 Democratic +3 +2 +1 +6
Debate #1 09/26/16 Republican -4 -1 +5 0 Poll Prior: 9/9-9/22
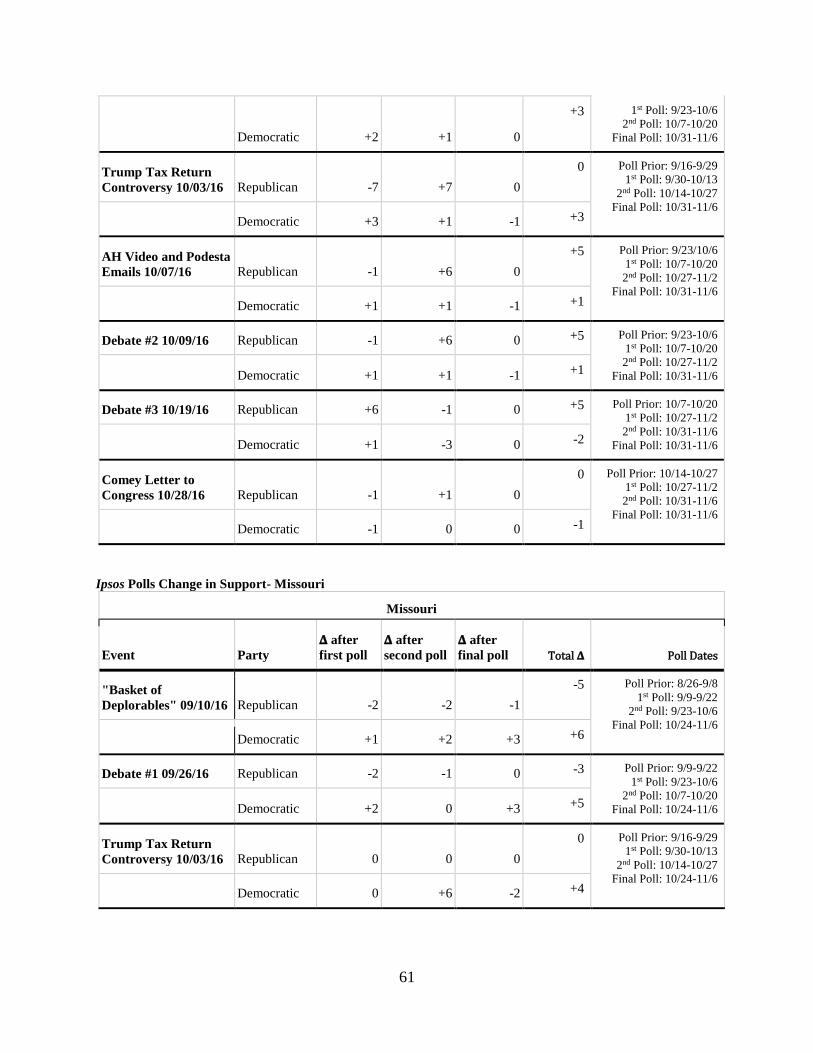
61
Democratic +2 +1 0
+3 1st Poll: 9/23-10/6
2nd Poll: 10/7-10/20
Final Poll: 10/31-11/6
Trump Tax Return
Controversy 10/03/16 Republican -7 +7 0
0 Poll Prior: 9/16-9/29
1st Poll: 9/30-10/13
2nd Poll: 10/14-10/27
Final Poll: 10/31-11/6 Democratic +3 +1 -1 +3
AH Video and Podesta
Emails 10/07/16 Republican -1 +6 0
+5 Poll Prior: 9/23/10/6
1st Poll: 10/7-10/20
2nd Poll: 10/27-11/2
Final Poll: 10/31-11/6 Democratic +1 +1 -1 +1
Debate #2 10/09/16 Republican -1 +6 0 +5 Poll Prior: 9/23-10/6
1st Poll: 10/7-10/20
2nd Poll: 10/27-11/2
Final Poll: 10/31-11/6 Democratic +1 +1 -1 +1
Debate #3 10/19/16 Republican +6 -1 0 +5 Poll Prior: 10/7-10/20
1st Poll: 10/27-11/2
2nd Poll: 10/31-11/6
Final Poll: 10/31-11/6 Democratic +1 -3 0 -2
Comey Letter to
Congress 10/28/16 Republican -1 +1 0
0 Poll Prior: 10/14-10/27
1st Poll: 10/27-11/2
2nd Poll: 10/31-11/6
Final Poll: 10/31-11/6 Democratic -1 0 0 -1
Ipsos Polls Change in Support- Missouri
Missouri
Event Party
𝚫 after
first poll
𝚫 after
second poll
𝚫 after
final poll Total 𝚫 Poll Dates
"Basket of
Deplorables" 09/10/16 Republican -2 -2 -1
-5 Poll Prior: 8/26-9/8
1st Poll: 9/9-9/22
2nd Poll: 9/23-10/6
Final Poll: 10/24-11/6 Democratic +1 +2 +3 +6
Debate #1 09/26/16 Republican -2 -1 0 -3 Poll Prior: 9/9-9/22
1st Poll: 9/23-10/6
2nd Poll: 10/7-10/20
Final Poll: 10/24-11/6 Democratic +2 0 +3 +5
Trump Tax Return
Controversy 10/03/16 Republican 0 0 0
0 Poll Prior: 9/16-9/29
1st Poll: 9/30-10/13
2nd Poll: 10/14-10/27
Final Poll: 10/24-11/6 Democratic 0 +6 -2 +4
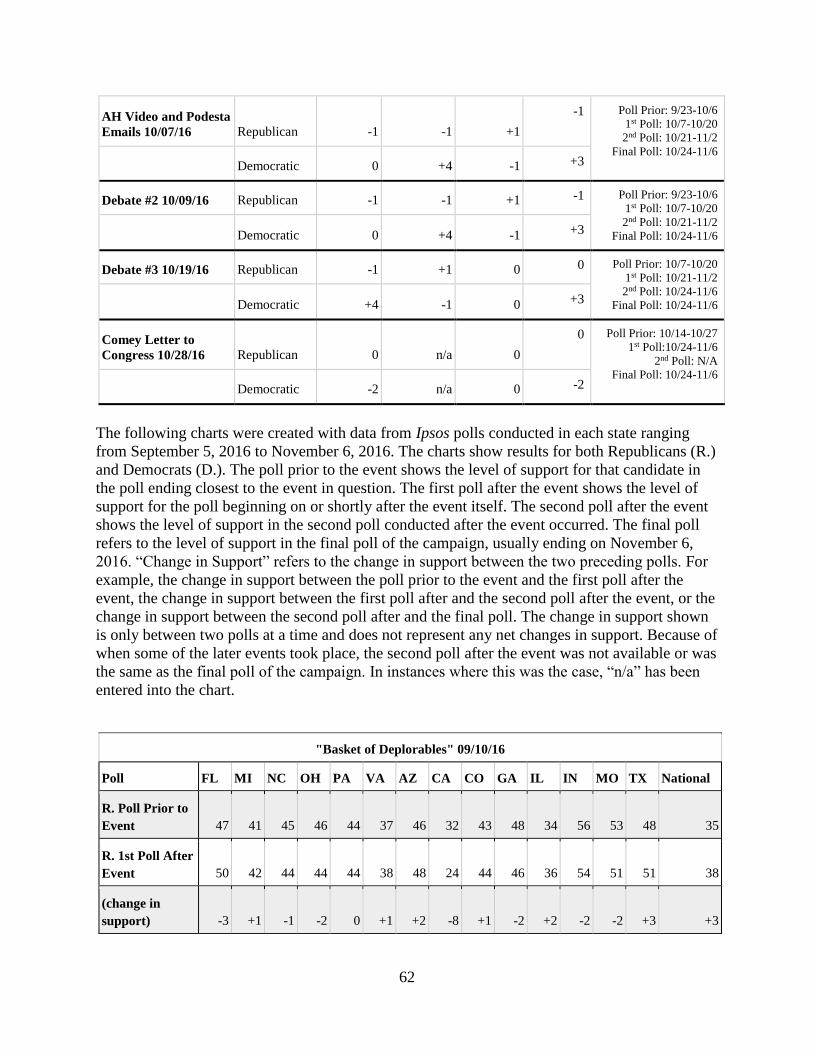
62
AH Video and Podesta
Emails 10/07/16 Republican -1 -1 +1
-1 Poll Prior: 9/23-10/6
1st Poll: 10/7-10/20
2nd Poll: 10/21-11/2
Final Poll: 10/24-11/6 Democratic 0 +4 -1 +3
Debate #2 10/09/16 Republican -1 -1 +1 -1 Poll Prior: 9/23-10/6
1st Poll: 10/7-10/20
2nd Poll: 10/21-11/2
Final Poll: 10/24-11/6 Democratic 0 +4 -1 +3
Debate #3 10/19/16 Republican -1 +1 0 0 Poll Prior: 10/7-10/20
1st Poll: 10/21-11/2
2nd Poll: 10/24-11/6
Final Poll: 10/24-11/6 Democratic +4 -1 0 +3
Comey Letter to
Congress 10/28/16 Republican 0 n/a 0
0 Poll Prior: 10/14-10/27
1st Poll:10/24-11/6
2nd Poll: N/A
Final Poll: 10/24-11/6 Democratic -2 n/a 0 -2
The following charts were created with data from Ipsos polls conducted in each state ranging
from September 5, 2016 to November 6, 2016. The charts show results for both Republicans (R.)
and Democrats (D.). The poll prior to the event shows the level of support for that candidate in
the poll ending closest to the event in question. The first poll after the event shows the level of
support for the poll beginning on or shortly after the event itself. The second poll after the event
shows the level of support in the second poll conducted after the event occurred. The final poll
refers to the level of support in the final poll of the campaign, usually ending on November 6,
2016. “Change in Support” refers to the change in support between the two preceding polls. For
example, the change in support between the poll prior to the event and the first poll after the
event, the change in support between the first poll after and the second poll after the event, or the
change in support between the second poll after and the final poll. The change in support shown
is only between two polls at a time and does not represent any net changes in support. Because of
when some of the later events took place, the second poll after the event was not available or was
the same as the final poll of the campaign. In instances where this was the case, “n/a” has been
entered into the chart.
"Basket of Deplorables" 09/10/16
Poll FL MI NC OH PA VA AZ CA CO GA IL IN MO TX National
R. Poll Prior to
Event 47 41 45 46 44 37 46 32 43 48 34 56 53 48 35
R. 1st Poll After
Event 50 42 44 44 44 38 48 24 44 46 36 54 51 51 38
(change in
support) -3 +1 -1 -2 0 +1 +2 -8 +1 -2 +2 -2 -2 +3 +3
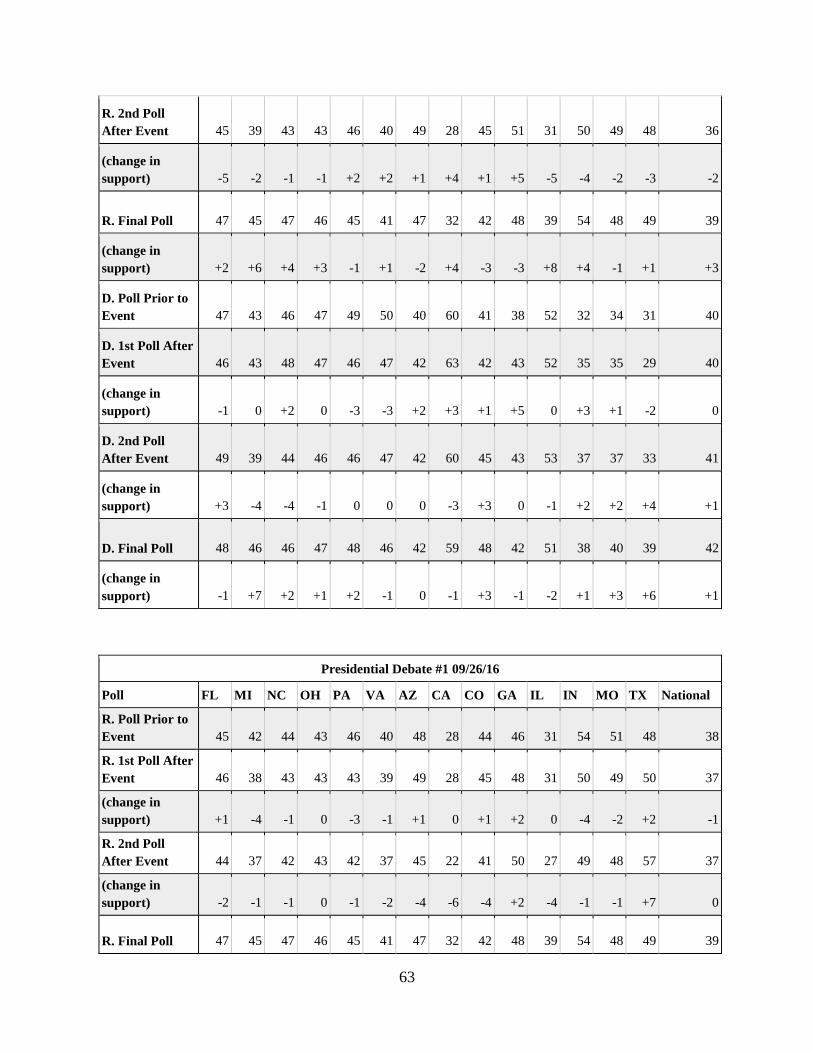
63
R. 2nd Poll
After Event 45 39 43 43 46 40 49 28 45 51 31 50 49 48 36
(change in
support) -5 -2 -1 -1 +2 +2 +1 +4 +1 +5 -5 -4 -2 -3 -2
R. Final Poll 47 45 47 46 45 41 47 32 42 48 39 54 48 49 39
(change in
support) +2 +6 +4 +3 -1 +1 -2 +4 -3 -3 +8 +4 -1 +1 +3
D. Poll Prior to
Event 47 43 46 47 49 50 40 60 41 38 52 32 34 31 40
D. 1st Poll After
Event 46 43 48 47 46 47 42 63 42 43 52 35 35 29 40
(change in
support) -1 0 +2 0 -3 -3 +2 +3 +1 +5 0 +3 +1 -2 0
D. 2nd Poll
After Event 49 39 44 46 46 47 42 60 45 43 53 37 37 33 41
(change in
support) +3 -4 -4 -1 0 0 0 -3 +3 0 -1 +2 +2 +4 +1
D. Final Poll 48 46 46 47 48 46 42 59 48 42 51 38 40 39 42
(change in
support) -1 +7 +2 +1 +2 -1 0 -1 +3 -1 -2 +1 +3 +6 +1
Presidential Debate #1 09/26/16
Poll FL MI NC OH PA VA AZ CA CO GA IL IN MO TX National
R. Poll Prior to
Event 45 42 44 43 46 40 48 28 44 46 31 54 51 48 38
R. 1st Poll After
Event 46 38 43 43 43 39 49 28 45 48 31 50 49 50 37
(change in
support) +1 -4 -1 0 -3 -1 +1 0 +1 +2 0 -4 -2 +2 -1
R. 2nd Poll
After Event 44 37 42 43 42 37 45 22 41 50 27 49 48 57 37
(change in
support) -2 -1 -1 0 -1 -2 -4 -6 -4 +2 -4 -1 -1 +7 0
R. Final Poll 47 45 47 46 45 41 47 32 42 48 39 54 48 49 39
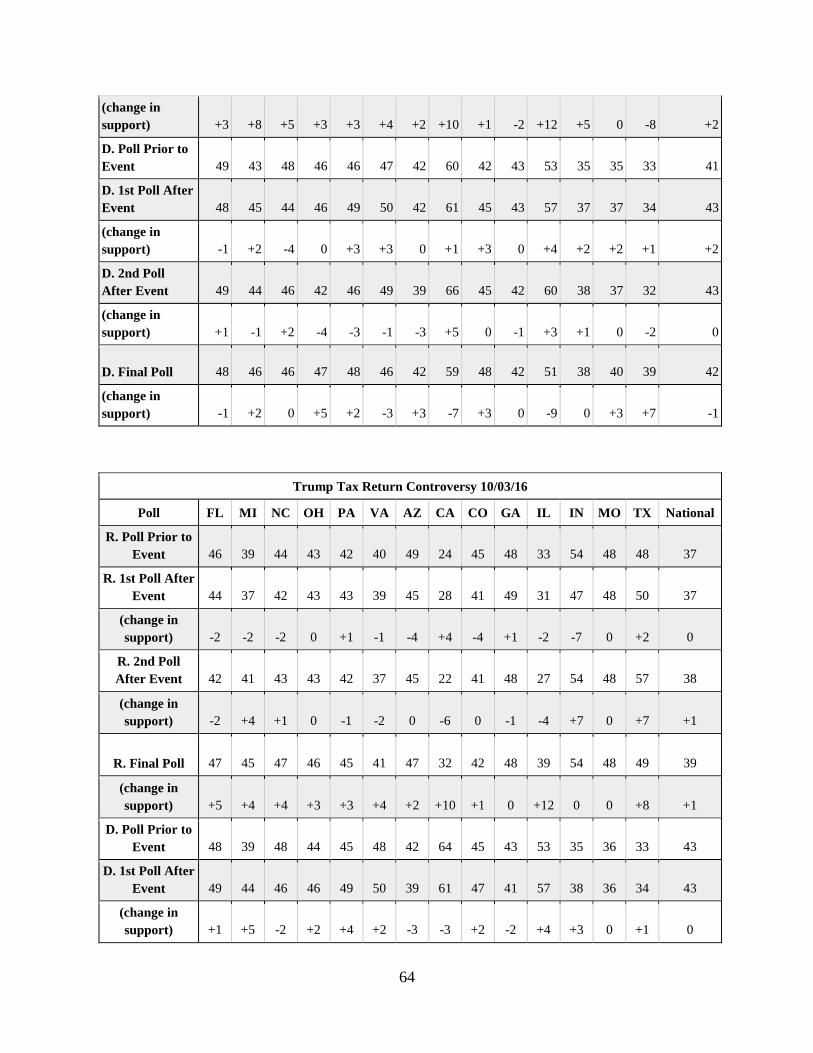
64
(change in
support) +3 +8 +5 +3 +3 +4 +2 +10 +1 -2 +12 +5 0 -8 +2
D. Poll Prior to
Event 49 43 48 46 46 47 42 60 42 43 53 35 35 33 41
D. 1st Poll After
Event 48 45 44 46 49 50 42 61 45 43 57 37 37 34 43
(change in
support) -1 +2 -4 0 +3 +3 0 +1 +3 0 +4 +2 +2 +1 +2
D. 2nd Poll
After Event 49 44 46 42 46 49 39 66 45 42 60 38 37 32 43
(change in
support) +1 -1 +2 -4 -3 -1 -3 +5 0 -1 +3 +1 0 -2 0
D. Final Poll 48 46 46 47 48 46 42 59 48 42 51 38 40 39 42
(change in
support) -1 +2 0 +5 +2 -3 +3 -7 +3 0 -9 0 +3 +7 -1
Trump Tax Return Controversy 10/03/16
Poll FL MI NC OH PA VA AZ CA CO GA IL IN MO TX National
R. Poll Prior to
Event 46 39 44 43 42 40 49 24 45 48 33 54 48 48 37
R. 1st Poll After
Event 44 37 42 43 43 39 45 28 41 49 31 47 48 50 37
(change in
support) -2 -2 -2 0 +1 -1 -4 +4 -4 +1 -2 -7 0 +2 0
R. 2nd Poll
After Event 42 41 43 43 42 37 45 22 41 48 27 54 48 57 38
(change in
support) -2 +4 +1 0 -1 -2 0 -6 0 -1 -4 +7 0 +7 +1
R. Final Poll 47 45 47 46 45 41 47 32 42 48 39 54 48 49 39
(change in
support) +5 +4 +4 +3 +3 +4 +2 +10 +1 0 +12 0 0 +8 +1
D. Poll Prior to
Event 48 39 48 44 45 48 42 64 45 43 53 35 36 33 43
D. 1st Poll After
Event 49 44 46 46 49 50 39 61 47 41 57 38 36 34 43
(change in
support) +1 +5 -2 +2 +4 +2 -3 -3 +2 -2 +4 +3 0 +1 0
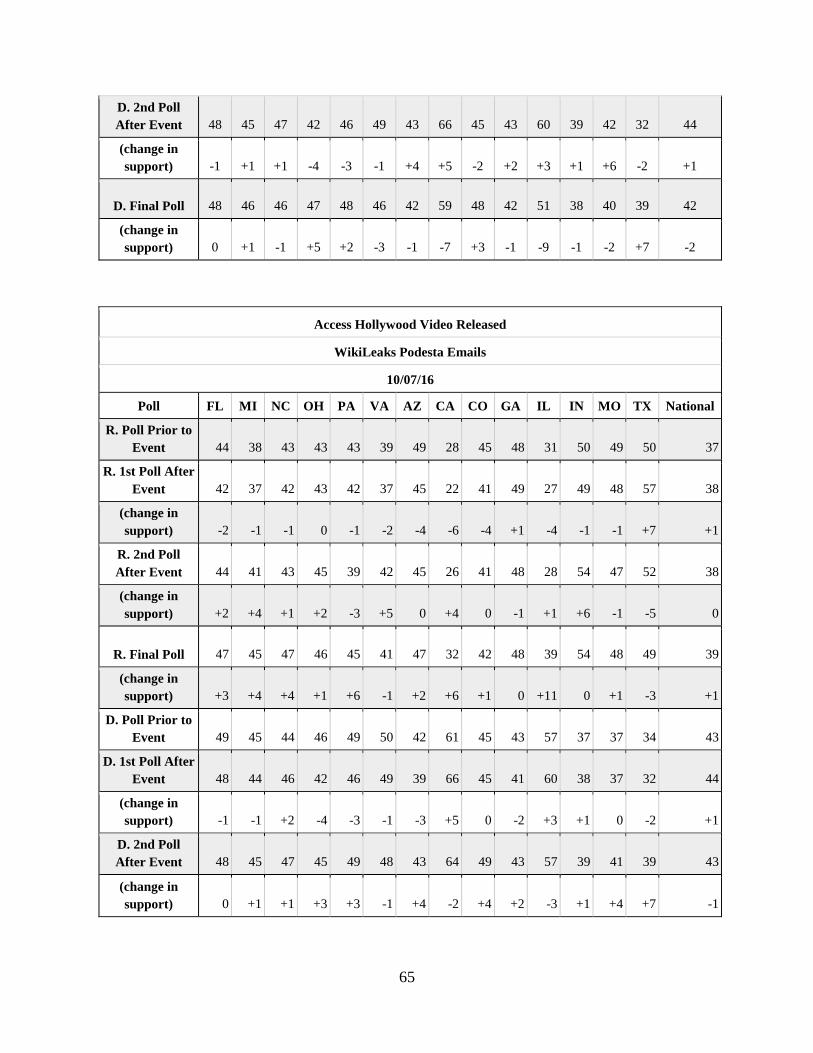
65
D. 2nd Poll
After Event 48 45 47 42 46 49 43 66 45 43 60 39 42 32 44
(change in
support) -1 +1 +1 -4 -3 -1 +4 +5 -2 +2 +3 +1 +6 -2 +1
D. Final Poll 48 46 46 47 48 46 42 59 48 42 51 38 40 39 42
(change in
support) 0 +1 -1 +5 +2 -3 -1 -7 +3 -1 -9 -1 -2 +7 -2
Access Hollywood Video Released
WikiLeaks Podesta Emails
10/07/16
Poll FL MI NC OH PA VA AZ CA CO GA IL IN MO TX National
R. Poll Prior to
Event 44 38 43 43 43 39 49 28 45 48 31 50 49 50 37
R. 1st Poll After
Event 42 37 42 43 42 37 45 22 41 49 27 49 48 57 38
(change in
support) -2 -1 -1 0 -1 -2 -4 -6 -4 +1 -4 -1 -1 +7 +1
R. 2nd Poll
After Event 44 41 43 45 39 42 45 26 41 48 28 54 47 52 38
(change in
support) +2 +4 +1 +2 -3 +5 0 +4 0 -1 +1 +6 -1 -5 0
R. Final Poll 47 45 47 46 45 41 47 32 42 48 39 54 48 49 39
(change in
support) +3 +4 +4 +1 +6 -1 +2 +6 +1 0 +11 0 +1 -3 +1
D. Poll Prior to
Event 49 45 44 46 49 50 42 61 45 43 57 37 37 34 43
D. 1st Poll After
Event 48 44 46 42 46 49 39 66 45 41 60 38 37 32 44
(change in
support) -1 -1 +2 -4 -3 -1 -3 +5 0 -2 +3 +1 0 -2 +1
D. 2nd Poll
After Event 48 45 47 45 49 48 43 64 49 43 57 39 41 39 43
(change in
support) 0 +1 +1 +3 +3 -1 +4 -2 +4 +2 -3 +1 +4 +7 -1
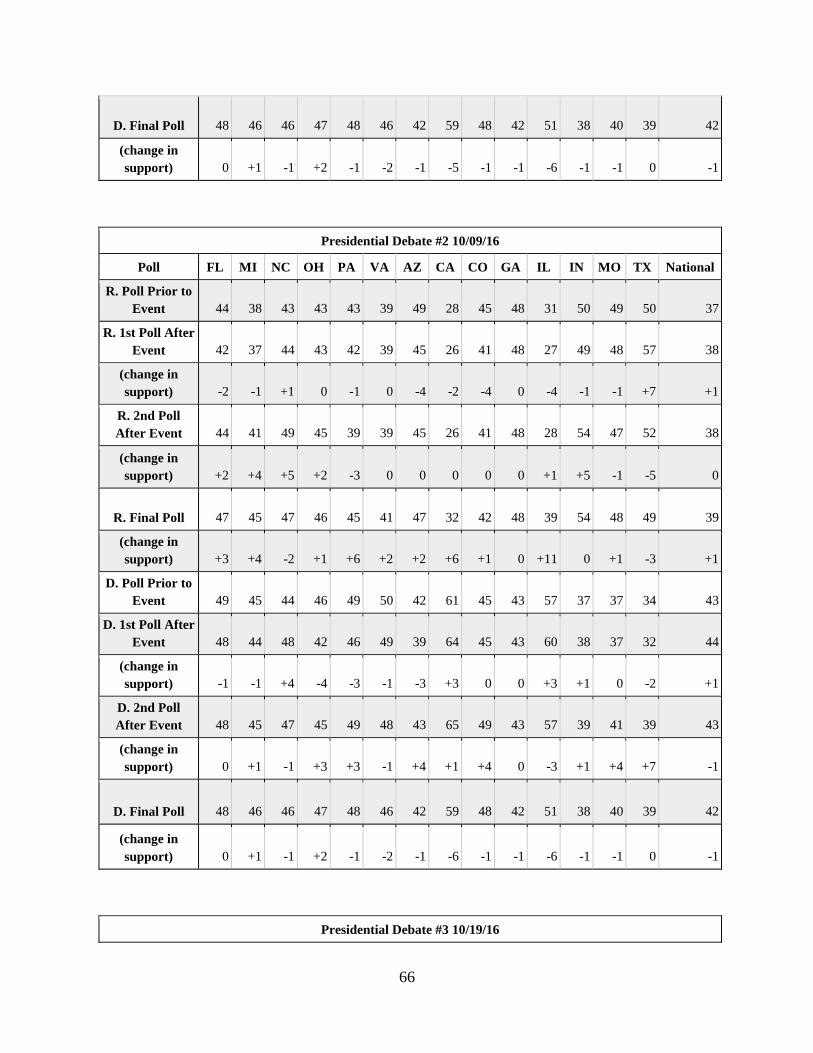
66
D. Final Poll 48 46 46 47 48 46 42 59 48 42 51 38 40 39 42
(change in
support) 0 +1 -1 +2 -1 -2 -1 -5 -1 -1 -6 -1 -1 0 -1
Presidential Debate #2 10/09/16
Poll FL MI NC OH PA VA AZ CA CO GA IL IN MO TX National
R. Poll Prior to
Event 44 38 43 43 43 39 49 28 45 48 31 50 49 50 37
R. 1st Poll After
Event 42 37 44 43 42 39 45 26 41 48 27 49 48 57 38
(change in
support) -2 -1 +1 0 -1 0 -4 -2 -4 0 -4 -1 -1 +7 +1
R. 2nd Poll
After Event 44 41 49 45 39 39 45 26 41 48 28 54 47 52 38
(change in
support) +2 +4 +5 +2 -3 0 0 0 0 0 +1 +5 -1 -5 0
R. Final Poll 47 45 47 46 45 41 47 32 42 48 39 54 48 49 39
(change in
support) +3 +4 -2 +1 +6 +2 +2 +6 +1 0 +11 0 +1 -3 +1
D. Poll Prior to
Event 49 45 44 46 49 50 42 61 45 43 57 37 37 34 43
D. 1st Poll After
Event 48 44 48 42 46 49 39 64 45 43 60 38 37 32 44
(change in
support) -1 -1 +4 -4 -3 -1 -3 +3 0 0 +3 +1 0 -2 +1
D. 2nd Poll
After Event 48 45 47 45 49 48 43 65 49 43 57 39 41 39 43
(change in
support) 0 +1 -1 +3 +3 -1 +4 +1 +4 0 -3 +1 +4 +7 -1
D. Final Poll 48 46 46 47 48 46 42 59 48 42 51 38 40 39 42
(change in
support) 0 +1 -1 +2 -1 -2 -1 -6 -1 -1 -6 -1 -1 0 -1
Presidential Debate #3 10/19/16
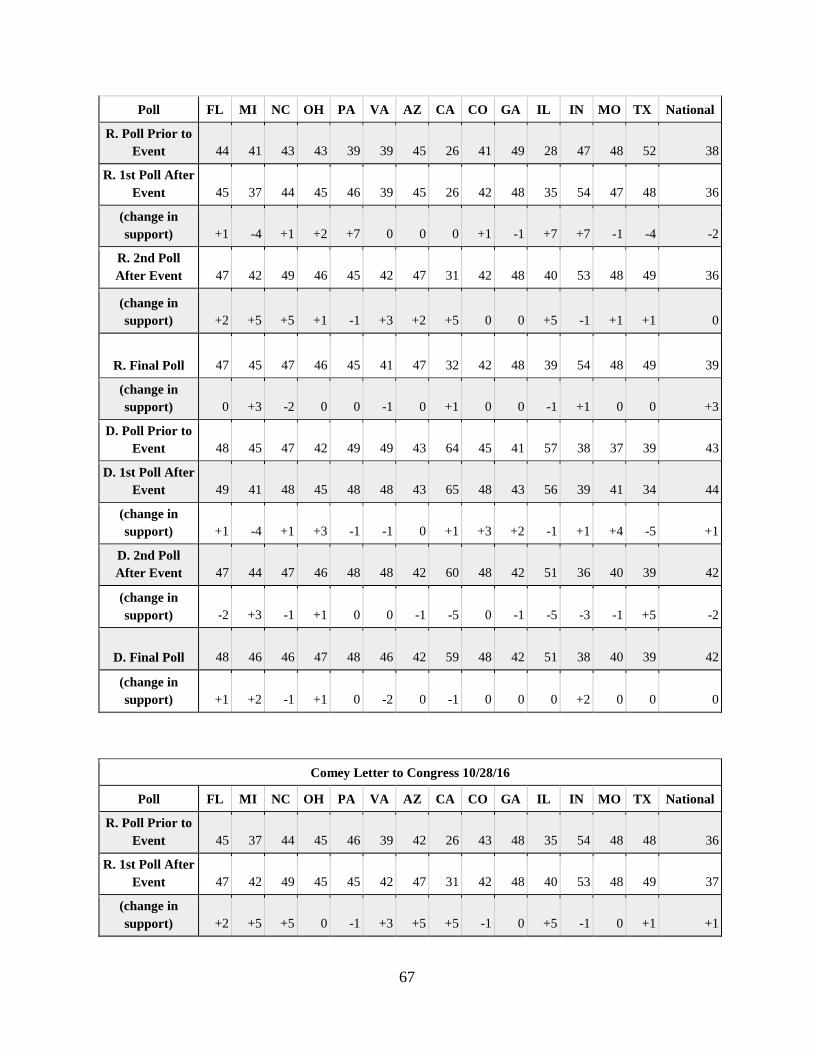
67
Poll FL MI NC OH PA VA AZ CA CO GA IL IN MO TX National
R. Poll Prior to
Event 44 41 43 43 39 39 45 26 41 49 28 47 48 52 38
R. 1st Poll After
Event 45 37 44 45 46 39 45 26 42 48 35 54 47 48 36
(change in
support) +1 -4 +1 +2 +7 0 0 0 +1 -1 +7 +7 -1 -4 -2
R. 2nd Poll
After Event 47 42 49 46 45 42 47 31 42 48 40 53 48 49 36
(change in
support) +2 +5 +5 +1 -1 +3 +2 +5 0 0 +5 -1 +1 +1 0
R. Final Poll 47 45 47 46 45 41 47 32 42 48 39 54 48 49 39
(change in
support) 0 +3 -2 0 0 -1 0 +1 0 0 -1 +1 0 0 +3
D. Poll Prior to
Event 48 45 47 42 49 49 43 64 45 41 57 38 37 39 43
D. 1st Poll After
Event 49 41 48 45 48 48 43 65 48 43 56 39 41 34 44
(change in
support) +1 -4 +1 +3 -1 -1 0 +1 +3 +2 -1 +1 +4 -5 +1
D. 2nd Poll
After Event 47 44 47 46 48 48 42 60 48 42 51 36 40 39 42
(change in
support) -2 +3 -1 +1 0 0 -1 -5 0 -1 -5 -3 -1 +5 -2
D. Final Poll 48 46 46 47 48 46 42 59 48 42 51 38 40 39 42
(change in
support) +1 +2 -1 +1 0 -2 0 -1 0 0 0 +2 0 0 0
Comey Letter to Congress 10/28/16
Poll FL MI NC OH PA VA AZ CA CO GA IL IN MO TX National
R. Poll Prior to
Event 45 37 44 45 46 39 42 26 43 48 35 54 48 48 36
R. 1st Poll After
Event 47 42 49 45 45 42 47 31 42 48 40 53 48 49 37
(change in
support) +2 +5 +5 0 -1 +3 +5 +5 -1 0 +5 -1 0 +1 +1
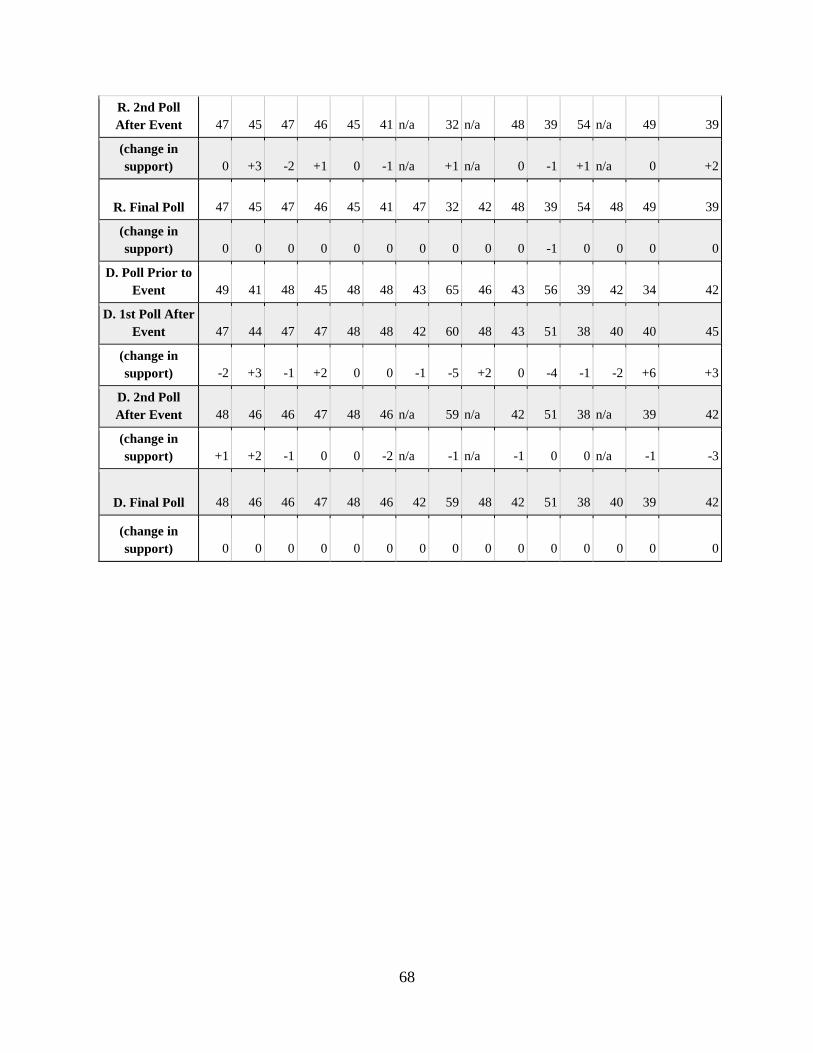
68
R. 2nd Poll
After Event 47 45 47 46 45 41 n/a 32 n/a 48 39 54 n/a 49 39
(change in
support) 0 +3 -2 +1 0 -1 n/a +1 n/a 0 -1 +1 n/a 0 +2
R. Final Poll 47 45 47 46 45 41 47 32 42 48 39 54 48 49 39
(change in
support) 0 0 0 0 0 0 0 0 0 0 -1 0 0 0 0
D. Poll Prior to
Event 49 41 48 45 48 48 43 65 46 43 56 39 42 34 42
D. 1st Poll After
Event 47 44 47 47 48 48 42 60 48 43 51 38 40 40 45
(change in
support) -2 +3 -1 +2 0 0 -1 -5 +2 0 -4 -1 -2 +6 +3
D. 2nd Poll
After Event 48 46 46 47 48 46 n/a 59 n/a 42 51 38 n/a 39 42
(change in
support) +1 +2 -1 0 0 -2 n/a -1 n/a -1 0 0 n/a -1 -3
D. Final Poll 48 46 46 47 48 46 42 59 48 42 51 38 40 39 42
(change in
support) 0 0 0 0 0 0 0 0 0 0 0 0 0 0 0
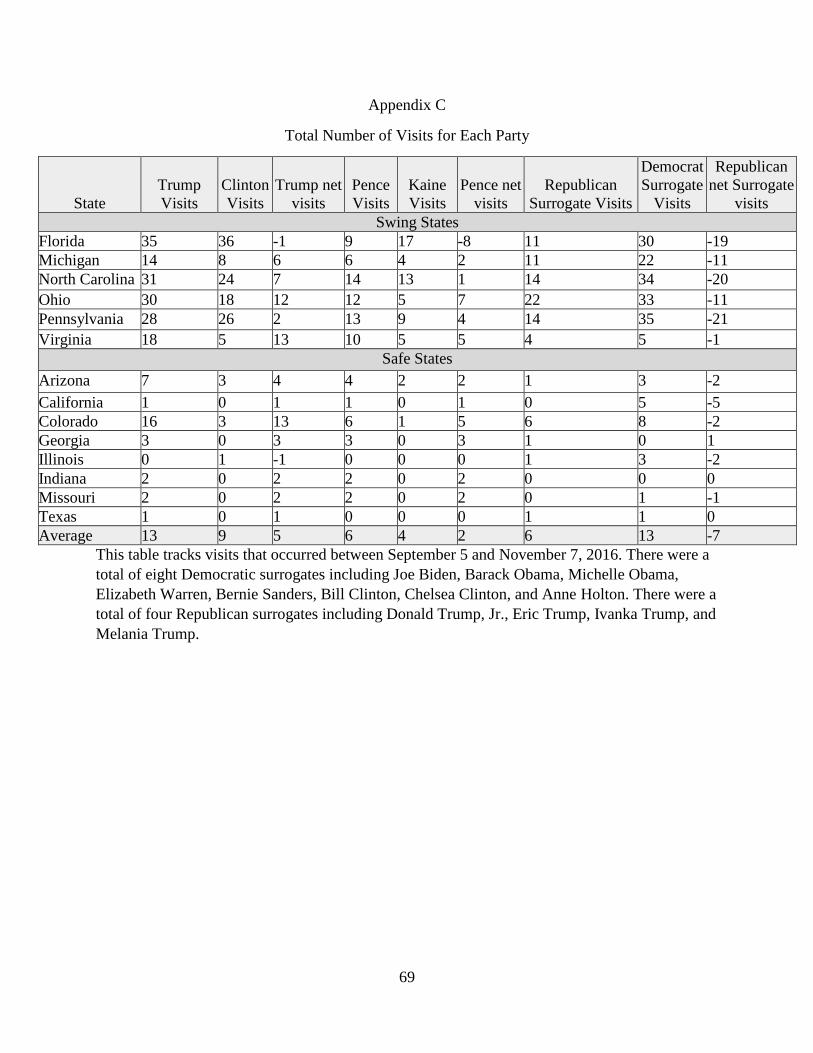
69
Appendix C
Total Number of Visits for Each Party
State
Trump
Visits
Clinton
Visits
Trump net
visits
Pence
Visits
Kaine
Visits
Pence net
visits
Republican
Surrogate Visits
Democrat
Surrogate
Visits
Republican
net Surrogate
visits
Swing States
Florida 35 36 -1 9 17 -8 11 30 -19
Michigan 14 8 6 6 4 2 11 22 -11
North Carolina 31 24 7 14 13 1 14 34 -20
Ohio 30 18 12 12 5 7 22 33 -11
Pennsylvania 28 26 2 13 9 4 14 35 -21
Virginia 18 5 13 10 5 5 4 5 -1
Safe States
Arizona 7 3 4 4 2 2 1 3 -2
California 1 0 1 1 0 1 0 5 -5
Colorado 16 3 13 6 1 5 6 8 -2
Georgia 3 0 3 3 0 3 1 0 1
Illinois 0 1 -1 0 0 0 1 3 -2
Indiana 2 0 2 2 0 2 0 0 0
Missouri 2 0 2 2 0 2 0 1 -1
Texas 1 0 1 0 0 0 1 1 0
Average 13 9 5 6 4 2 6 13 -7
This table tracks visits that occurred between September 5 and November 7, 2016. There were a
total of eight Democratic surrogates including Joe Biden, Barack Obama, Michelle Obama,
Elizabeth Warren, Bernie Sanders, Bill Clinton, Chelsea Clinton, and Anne Holton. There were a
total of four Republican surrogates including Donald Trump, Jr., Eric Trump, Ivanka Trump, and
Melania Trump.
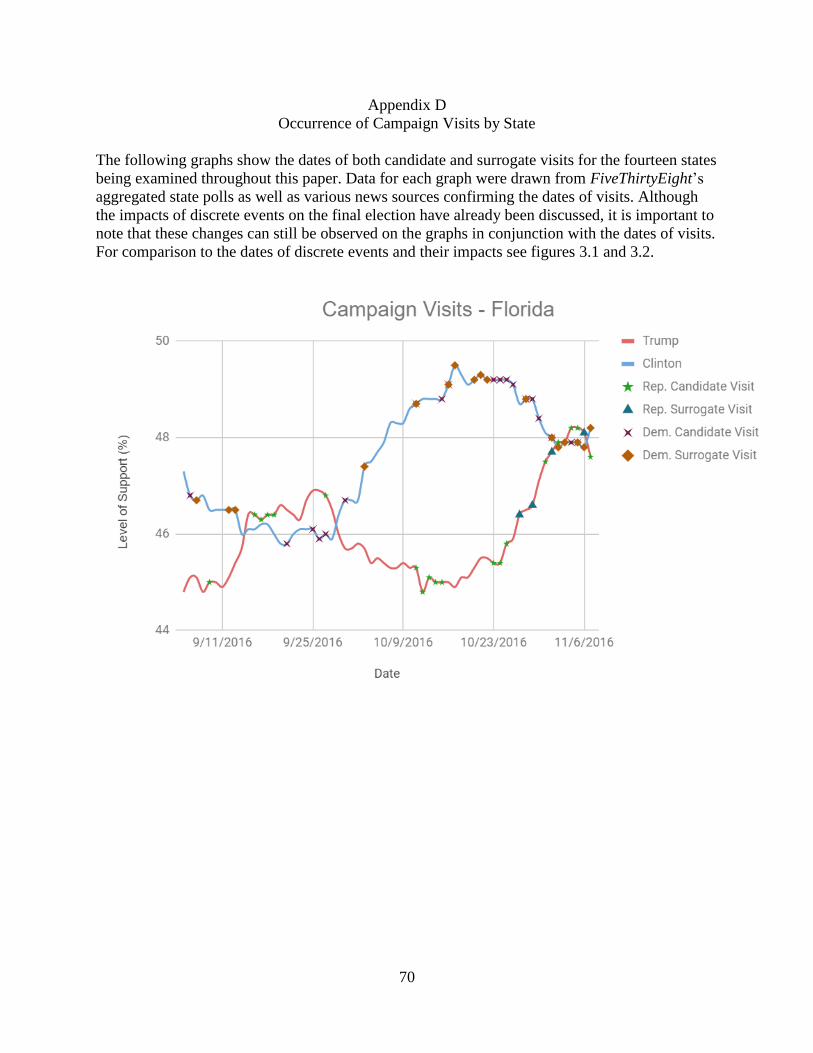
70
Appendix D
Occurrence of Campaign Visits by State
The following graphs show the dates of both candidate and surrogate visits for the fourteen states
being examined throughout this paper. Data for each graph were drawn from FiveThirtyEight’s
aggregated state polls as well as various news sources confirming the dates of visits. Although
the impacts of discrete events on the final election have already been discussed, it is important to
note that these changes can still be observed on the graphs in conjunction with the dates of visits.
For comparison to the dates of discrete events and their impacts see figures 3.1 and 3.2.
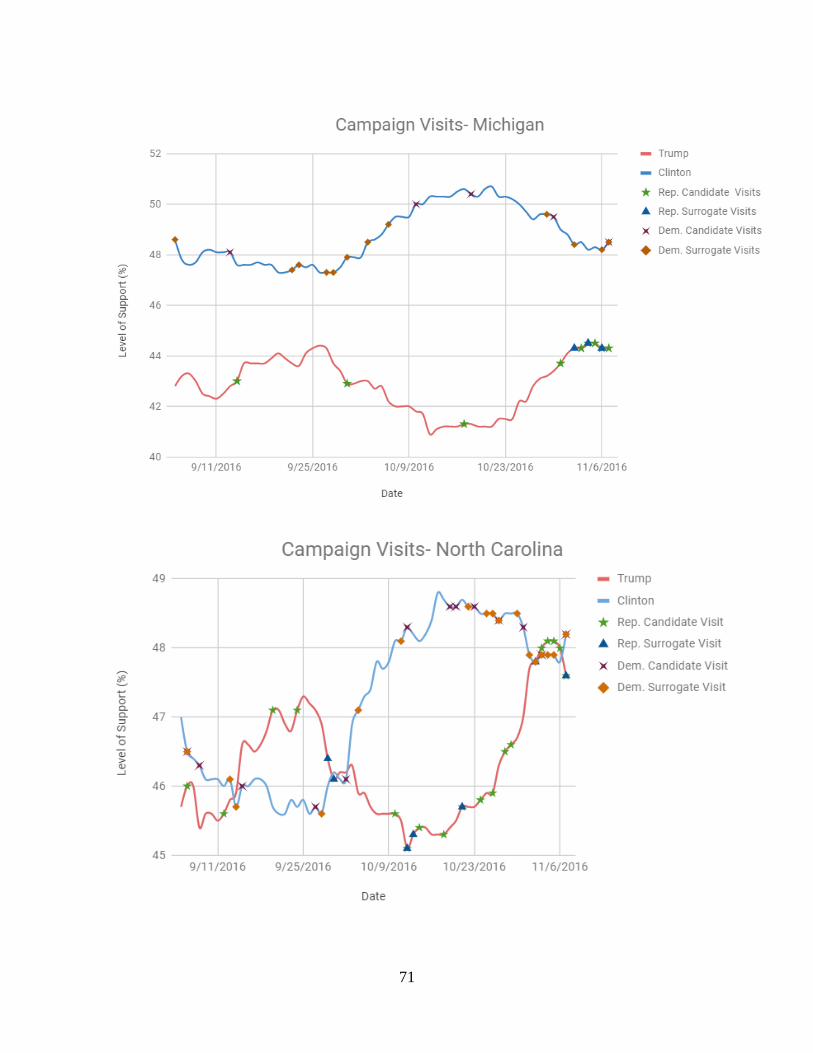
71
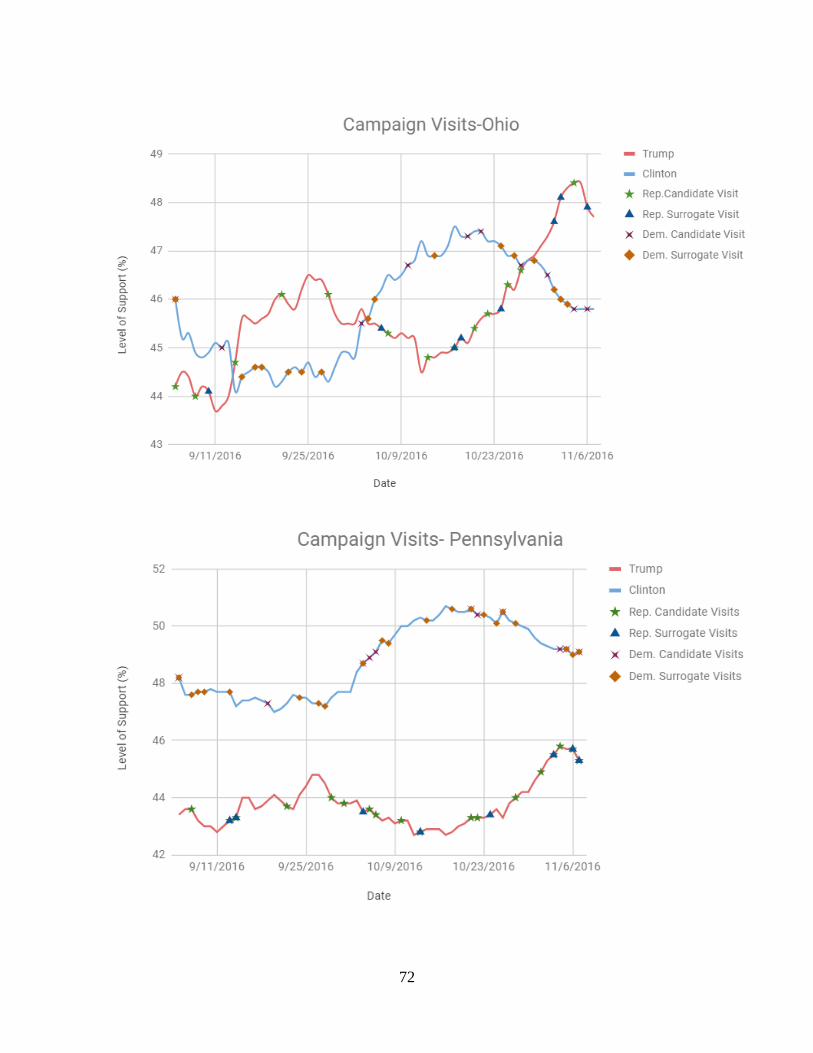
72
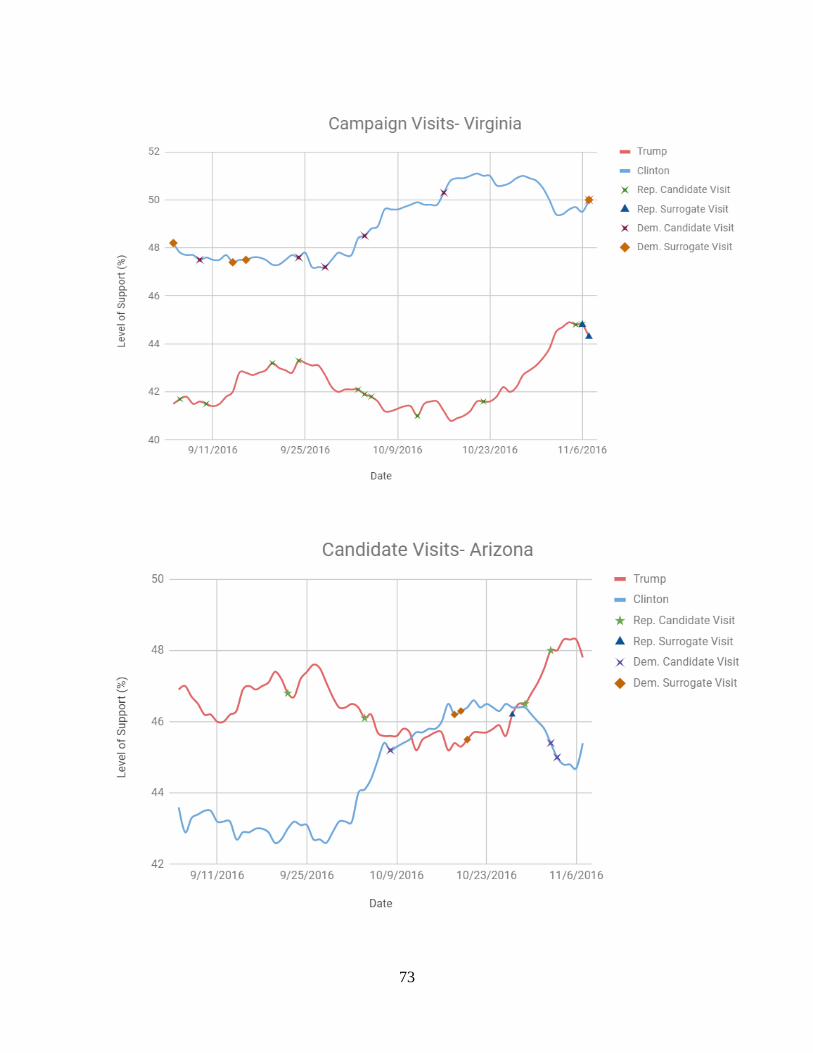
73
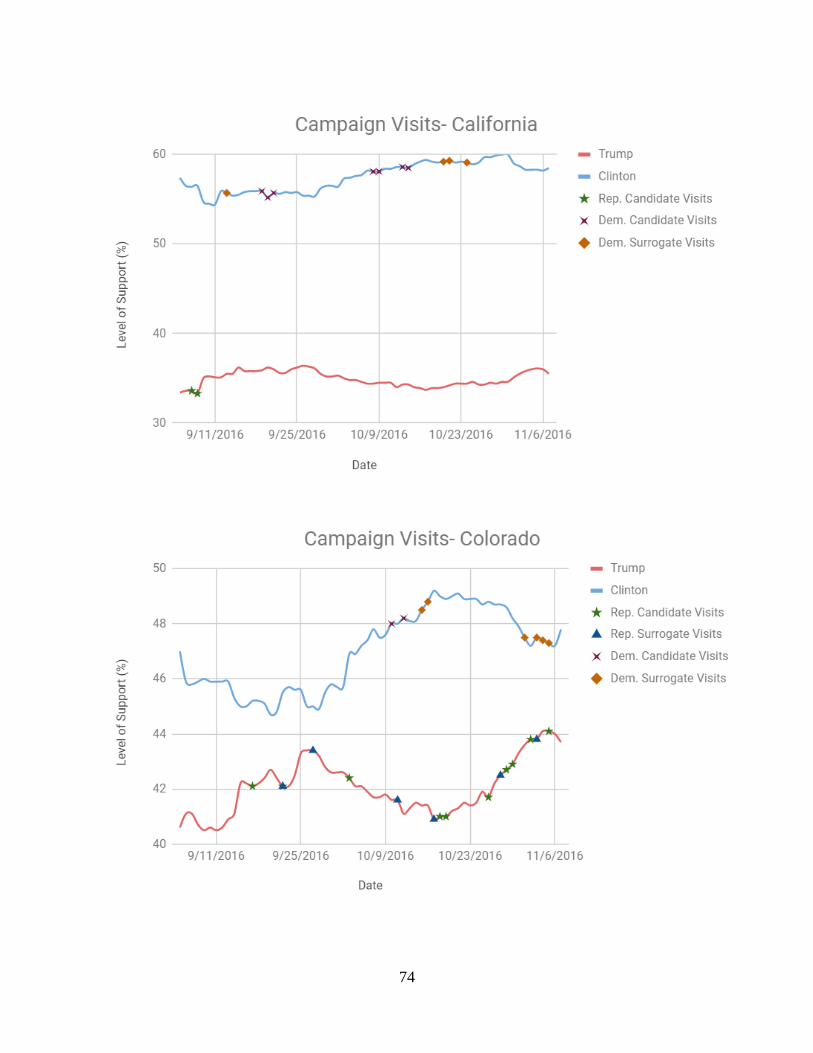
74
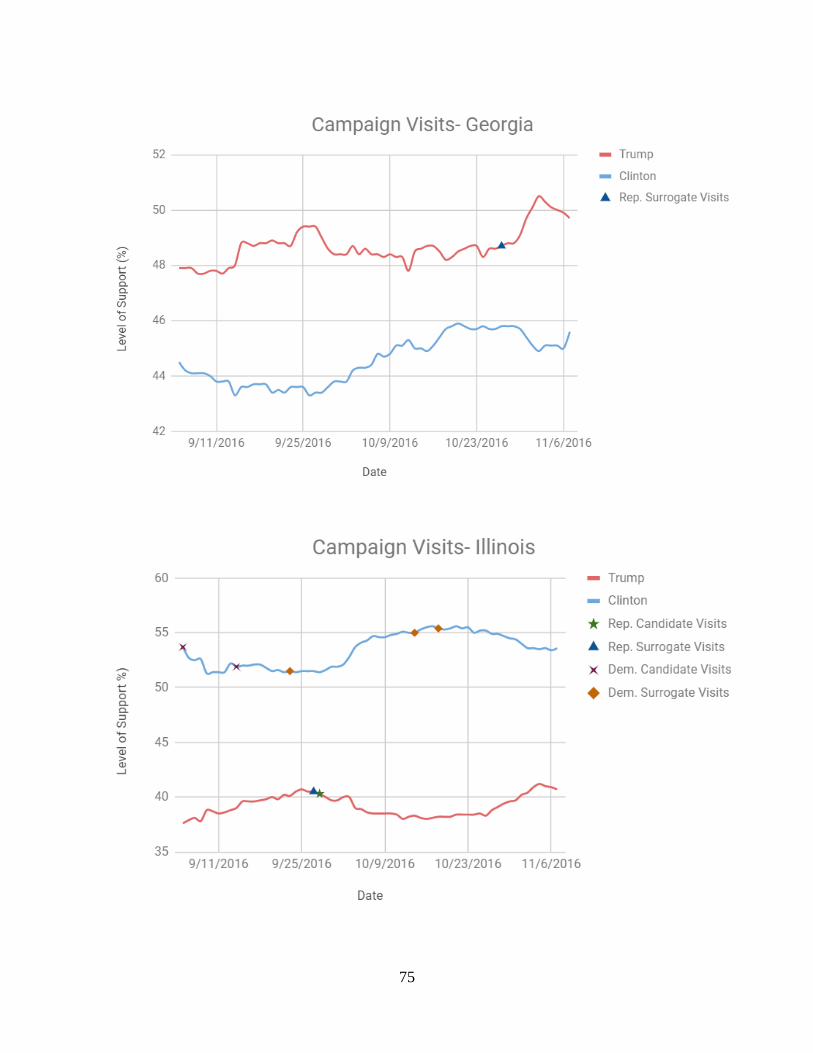
75
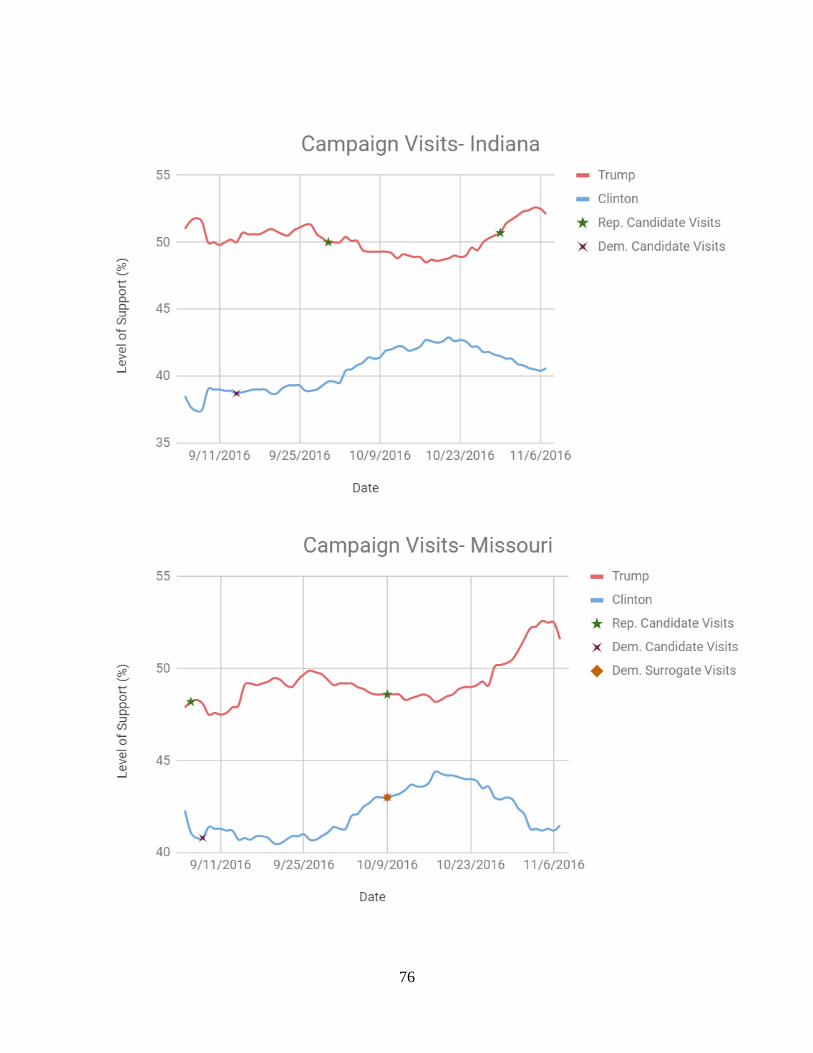
76
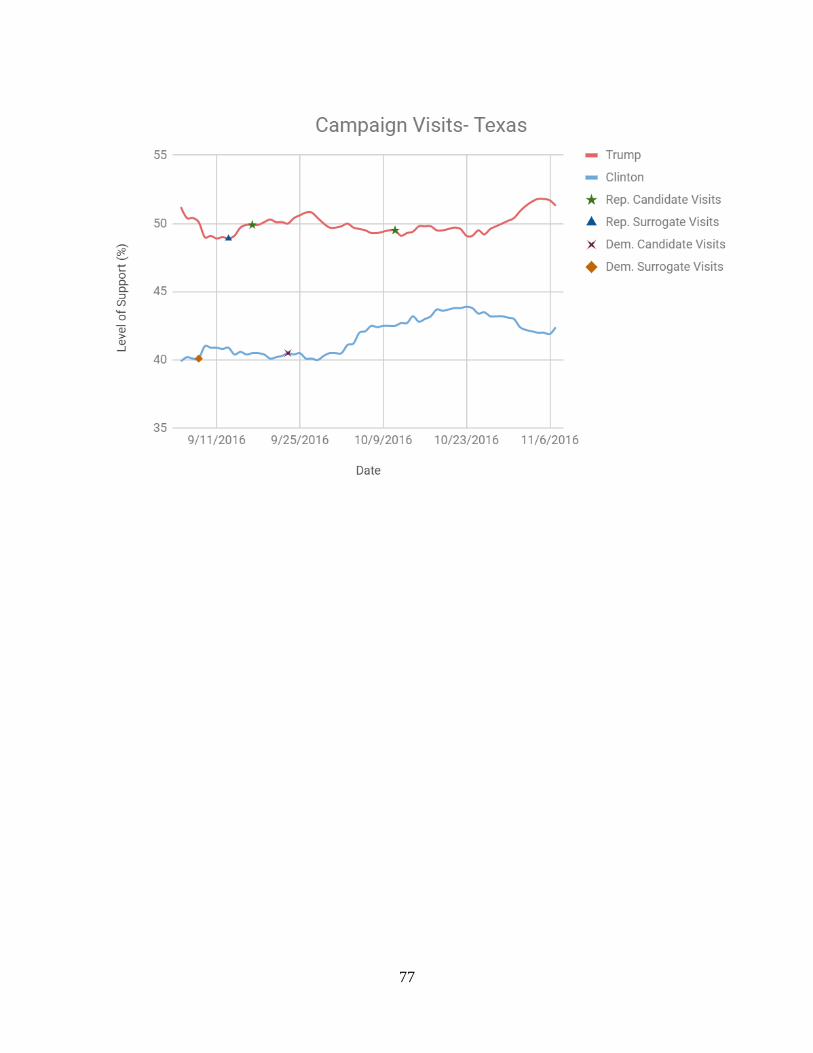
77