Embed Size (px)
Citation preview
The Impact of Congestion Charging Technique on Traffic Flow and Atmospheric Pollution in Kuwait City
Fahad AlRukaibi*, Duaij AlRukaibi*, Abdulaziz AlBurait* and Ayedh Al-Mutairi**
*Department of Civil Engineering, Kuwait University, Kuwait**Industrial Engineering Department, College of Engineering and Petroleum, Kuwait University, Kuwait *Corresponding author: [email protected]
Submitted: 25/02/2020Revised: 17/07/2020Accepted: 03/08/2020
ABSTRACTTraffic congestion is a major problem in high populated cities, due to the frequent increase on travel demand and
exponential vehicles growth. Resulting in increased vehicle queuing and slows road speed which can led to increase delays, air pollution, and fuel consumption. Poor traffic management in the congested spot result in elongated traffic jam. Therefore, this study aims to reduce traffic congestion by applying congestion charging system which is an effective method to regulate demand without increasing supply. Kuwait City network was selected to perform the system. Kuwait City is a vital city that has a lot of governmental and commercial facilities which make the city crowded especially during the peak hours. The current condition was analyzed in SYNCHRO simulation software in order to compare it with the improved condition to confirm the applicability. The genetic algorithm will be used as a practical method to apply congestion pricing in order to provide optimized solutions that will be analyzed in SYNCHRO software to examine the performance of the network. The impacts of applying congestion pricing system were remarkable. From traffic point of view, the demand was regulated, also total delays and fuel consumption were improved. The reduction of total delay is ranged between 24.4% to 40.58%, and the reduction of fuel used is ranged between 36.76% to 60.89%. From an economical point of view, the user cost decreased in a range between 27.77% and 43.75%. In addition, from an environmental aspect the emissions of HC, CO and NOx improved significantly which improved air quality.
Keywords: congestion charging, traffic relieve, traffic management, traffic pollution reduction, road pricing, traffic response.
INTRODUCTIONTraffic congestion has become one of the familiar problems in crowded cities due to exponentially growth of car
usage. Traffic congestion is distinguished by longer travel times, slower speeds and increased cars queuing which can dramatically decrease the level of service in the road network. Hence, containment of traffic congestion is very important issue in urban network due to many negative impacts such as delays, wasted fuel consumption, which rises atmospheric pollution. Traffic congestion contribute acceleration and deacceleration in vehicles that increase the chance of accidents. Also, it can lead drivers to be aggressive by the stress and associated with congested roads. Through the years increasing the capacity of the road network by adding new roads or lanes was the traditional solution to solve congestion problem but currently is ineffective under the high growth rate of car, high coast, and implementation constrains. Therefore, many studies developed new effective strategies to solve congestion problem. Congestion charging system (CCS) one of the effective techniques used to manage networks congestion which is a dynamic pricing
Journal of Engg. Research Vol. 9 No. (1) March 2021 pp. 51-62 ̀ https://doi.org/10.36909/jer.v9i1.9803
The Impact of Congestion Charging Technique on Traffic Flow and Atmospheric Pollution in Kuwait City52
strategy to manage demand by imposing fees through using the networks without increasing supply. Furthermore, applying this technique can reduce and relieve congestion and decreasing the chance of collusions. Additionally, the system is used to reduce fuel consumption and decrease vehicles emissions that are associated with congestion. Thus, by applying CCS, usage of private cars will be reduced, while increasing the usage of public transportation. Therefore, its benefits mass transit by increasing transit ridership, improving transit speeds and the reliability of transit service, and lowering costs for transit providers. On the other hand, revenue derived from congestion pricing is a crucial source of funding for the government, usually for roads infrastructure financing. Many countries and cities that have congested traffic applied the CCS to reduce traffic and air pollution, such as Singapore, Stockholm, London, Milan, and Dubai. In Kuwait City, traffic congestion is one of the main problems that face the government everyday due to the huge number of entering vehicles. Kuwait City is a vital city that has a lot of governmental and commercial facilities and companies. The city is always crowded especially during the peak hours. In this research, the congestion pricing system will be implemented on a network in Kuwait City that consists of several connected intersections to evaluate the impact of CCS on the selected area in term of traffic congestion reduction, cost of fuel consumption, and vehicles emissions where the price will be highest in peak hours and will be zero when the road is not crowded. The method will be examined by different software to conclude the impact of CCS on the network.
LITERATURE REVIEWKuwait population live in the major Governorates with 8% of the total area of the country that can contribute
traffic congestion and atmospheric pollution. Additionally, exponential growth of motor vehicles use in the state of Kuwait is the main reasons of traffic congestion where it was 77% between 20002008 that led to exponential increase in the demand for road space and transport services. That growth come as a result of Kuwait’s rapid economic evolution, and low prices of vehicle. Therefore, the main obstacles of transport sector in Kuwait that supply of transport facilities has not matched the increased in demand (General Directorate of traffic project). Therefore, recent studies have emphasized on the new strategies that reduce and manage traffic congestion in the highly congested cities by applying new effective techniques without increasing road capacity as the demand will never stop and to achieve sustainable transport development. Waters and Vickery they point out Traffic congestion, accidents, and air pollution are external costs of transport therefore one of the primary objectives of transport policy maker is to reduce their impact, where in Kuwait the economic losses from road accidents and traffic congestion are between 3-4% and 3% of the Kuwait’s GDP per annum respectively. Traffic congestion is a situation that occur when the traffic volume generate demand for space more than road capacity and it caused by limited road capacity, traffic incidents, working and facilities location, and weather conditions (Jraiw K, 1981). Traffic congestion has a negative impact on the society and individual in term of time loss, oil consumption, atmospheric pollution, and traffic accident and should be controlled (Jrawi k, 2003). Thus, over the year’s congestion charging method takes a place in managing traffic congestion as it economically sound and effective tool to reduce road congestion and atmospheric pollution (Jones, P., Hervik, A., 1992). Congestion charging is a research focus on the traffic congestion manage and relive in the charging network where the mothed has demonstrated convincingly in reducing traffic congestion in real-world examples such as Singapore (Tuan Seik, 2000), London (Sabounchi et al., 2014) and Stockholm (Eliassonet al., 2009). The main goals of implementing congestion charging is to encourage high capacity passenger transportation way, minimize vehicles numbers in the charging area to manage congestion, and public transport use encouragement which positively affect the traffic flow and reduce motor vehicles emissions (Sun Ye, 2012) and (Kottenhoff and Freij, 2009). Also, they report that after implementing congestion charging method in Singapore the number of cars that cross the selected network reduced from 74000 to 41500 during morning time additionally the average cars velocity during peak hours increased by 30% and the number of public transport users increased by 36%. Likewise, (Kehan Wu, 2017) noticed that public transport use in Beijing increased by 13% after implementing congestion charging this contributes traffic congestion reduction. Vehicles speed and travel time are associated with the traffic congestion as their relationship is inverse. (Chin, 1996; Tuan Seik, 2000) report that after applying Congestion
53Fahad AlRukaibi, Duaij AlRukaibi, Abdulaziz AlBurait and Ayedh Al-Mutairi
Charging Scheme (CCS) in Singapore 1975 according to the time of day, location, and vehicle type the result showed significant reduction in road traffic flow by 20% and speed increased by 33%. Additionally, the benefit of implementing congestion charging the positive results are shown in a short period of time where (Jonas Eliasson, 2009) report that the reduction in traffic congestion was immediate in Stockholm after implementing congestion charging technique where the traffic reduced by 30% in charging cordon by the first week. Highly congested spot in London was focused by (Sean D. Beevers, David C. Carslaw, 2004) to reschedule traffic congestion with congestion charging scheme and its noticeable that the annual average daily traffic (AADT) flows changed based on vehicle types in the zone area where the buses and taxies increased by 20% and 13% respectively, cars and heavy good trucks decreased by 29% and 11% respectively another implement in London 2003 CCS applied for the vehicle entering central London with single charge of 5 Euro between 7 to 18:30 through the weekday the total vehicle travel time reduction reduced by 15% and the average speed increased by 20%. accordingly to the high rate of cars ownership in Milan Italy it suffer from highly traffic congestion and high level of atmospheric pollution, (Marco Percoco, 2014) the CCS system achieved both safety and economical goals, and the savings reached €9.3 million by charging the vehicle from 2 to 10 Euros depending on the vehicle engine type the system start in 2008 and based on the Milanese Agency of Mobility and the Environment evaluation it is found that the traffic in Limited Traffic Zones (Zona Traffico Limitato) (ZTL) decreased by 12.3% moreover, public transportation transfers about 19,000 additional daily travelers, so the daily runs increased by 1300 runs. Also, the crowded kilometers decreased by 25.1% and incidents in the ZTL dropped by 20.6%. Many factors are associated with CCS technique not limited to manage traffic congestion it even has an effect on the environmental and country income the revenues can be used to compensate consumers by different ways such as improving transportation system by improving the quality of roads as well as public transportation (Ken Willett, 2012). There are several types of congestion pricing that are applied on roads. The variable tolls happen on present and new toll roads, tunnels and bridges. The tolls can be set in scheme, with the highest rates for the busiest times of day. Lane charging tolls is done by collecting tolls electronically in highways. This type contains charging high occupancy toll lane. Thus, there is a cordon tolls, which is a system that charge a toll for entering a vital area additionally there are seven types of congestion charging and the selection based on implementations objectives (Benko M. & Smith L., 2007). Many studies in the literature associated traffic congestion with the environmental problems as the traffic congestion and atmospheric condition are highly related due to vehicles emissions, delay, acceleration and deceleration, and long travel time which can contribute atmospheric pollution, climatic change, and global warming. Therefore, to study the impact of a congestion charging method, both traffic and vehicle emissions changes need to be considered. (Guo and Zhang, 2014), (Hallmark and Backman, 2000) and (Rakha et al., 2000) associated the atmospheric air pollution with the transportation system as the pollution resulted from energy consumption domain. Also, they report that transportation field accounted the highest percentage on the total energy consumed due to the heavy traffic density, acceleration and deceleration, and the long vehicle. These factors are the major contributor to atmospheric air pollution and energy consumption. (Midenet et. al.,2004) and (Coensel et. al., 2012) associated the atmospheric conditions with the transportation system development and operation. They found that stops and delays had the most effect on the environmental cost where traffic flow improvement led to a lower vehicle emission. Previous studies have shown the effectiveness of Congestion charging method in air pollution reduction where (Yanyan Chen et.al; 2017) noticed that after implement congestion charging technique in Beijing charging zone the total reduction in carbon dioxide (CO) and methane (HC) emissions are ranged between 60-70% and NOX emission reduced by 3545% within the charging zone. Similarly, in London congestion pricing was implement between 2002 and 2003 and the result showed that the total NOX emissions in the charging zone have reduced by −12.0% ±12% (2σ) and PM10 emissions have reduced by −11.9% in the charging zone that reduction as a result of increases in vehicle speed which is important in emissions reduction as well as the number of vehicle decreased in the zone (Sean D Beeevers et al;2004). As the vehicle travelled kilometers reduced then the total emission rate will decrease at the same time due to their relationship, therefore, emission reduction rate in Stockholm was differ between 10% and 15% depending on emissions types where carbon dioxide reduced between 2-3% (Eliasson et al. 2008). (Sean D. Beevers, 2004) In 1975 Area Licensing Scheme (ALS) which is one
The Impact of Congestion Charging Technique on Traffic Flow and Atmospheric Pollution in Kuwait City54
of the congestion charging method was in implement in Singapore that require a license to gain access to a ‘restricted zone’ and the charging procedure was based on vehicle type, time of day and location, having regard to the level of congestion and the result showed a significant positive impact road traffic flows have reduced by 20% and speed has increased by 33% (Chin, 1996; Tuan Seik, 2000). Elsewhere the environmental benefit of congestion charging has also been reported (Daniel and Bekka, 2000) estimate that vehicle emissions (NOX, CO and HC) could be reduced by up to 30% in the most congested areas.
METHODOLOGYAs discussed earlier, this case study focused on the influence of implementing congestion charging technique on
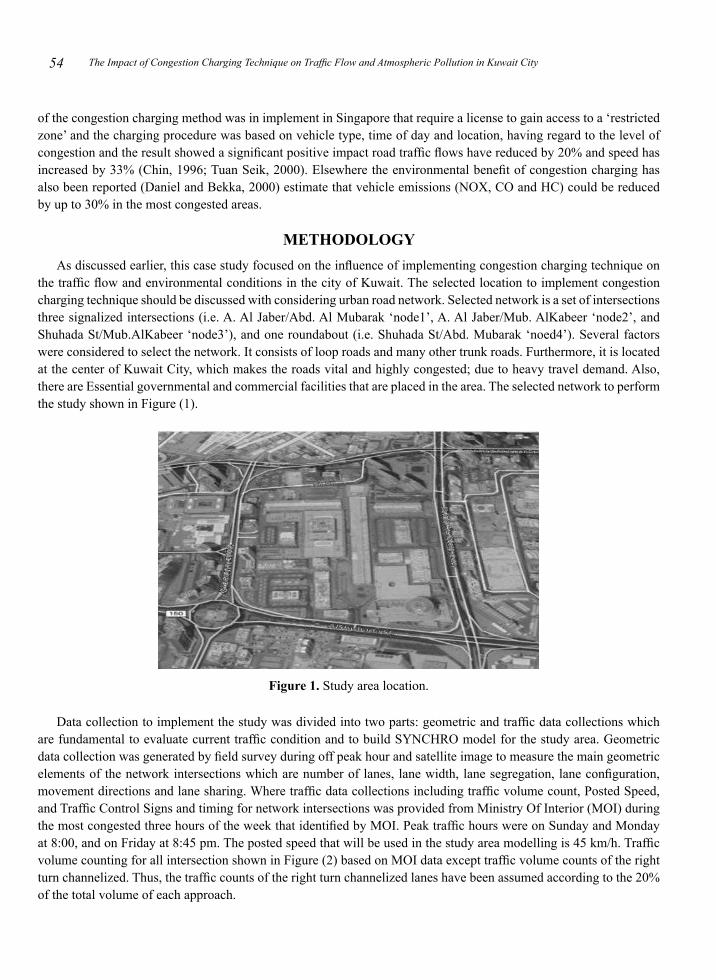
the traffic flow and environmental conditions in the city of Kuwait. The selected location to implement congestion charging technique should be discussed with considering urban road network. Selected network is a set of intersections three signalized intersections (i.e. A. Al Jaber/Abd. Al Mubarak ‘node1’, A. Al Jaber/Mub. AlKabeer ‘node2’, and Shuhada St/Mub.AlKabeer ‘node3’), and one roundabout (i.e. Shuhada St/Abd. Mubarak ‘noed4’). Several factors were considered to select the network. It consists of loop roads and many other trunk roads. Furthermore, it is located at the center of Kuwait City, which makes the roads vital and highly congested; due to heavy travel demand. Also, there are Essential governmental and commercial facilities that are placed in the area. The selected network to perform the study shown in Figure (1).
Figure 1. Study area location.
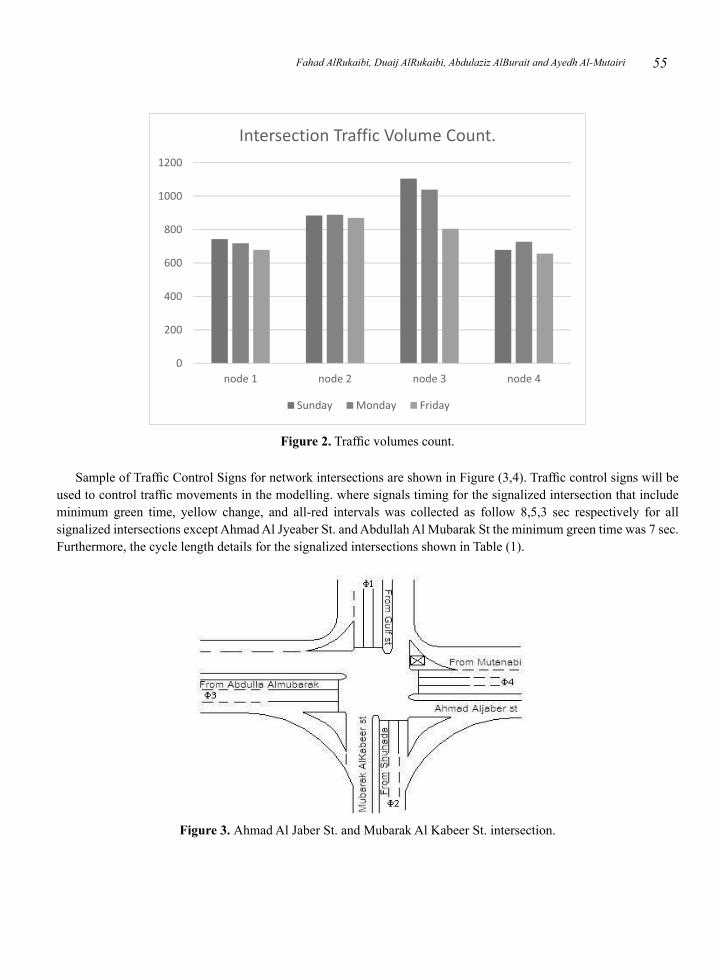
Data collection to implement the study was divided into two parts: geometric and traffic data collections which are fundamental to evaluate current traffic condition and to build SYNCHRO model for the study area. Geometric data collection was generated by field survey during off peak hour and satellite image to measure the main geometric elements of the network intersections which are number of lanes, lane width, lane segregation, lane configuration, movement directions and lane sharing. Where traffic data collections including traffic volume count, Posted Speed, and Traffic Control Signs and timing for network intersections was provided from Ministry Of Interior (MOI) during the most congested three hours of the week that identified by MOI. Peak traffic hours were on Sunday and Monday at 8:00, and on Friday at 8:45 pm. The posted speed that will be used in the study area modelling is 45 km/h. Traffic volume counting for all intersection shown in Figure (2) based on MOI data except traffic volume counts of the right turn channelized. Thus, the traffic counts of the right turn channelized lanes have been assumed according to the 20% of the total volume of each approach.
55Fahad AlRukaibi, Duaij AlRukaibi, Abdulaziz AlBurait and Ayedh Al-Mutairi
Figure 2. Traffic volumes count.
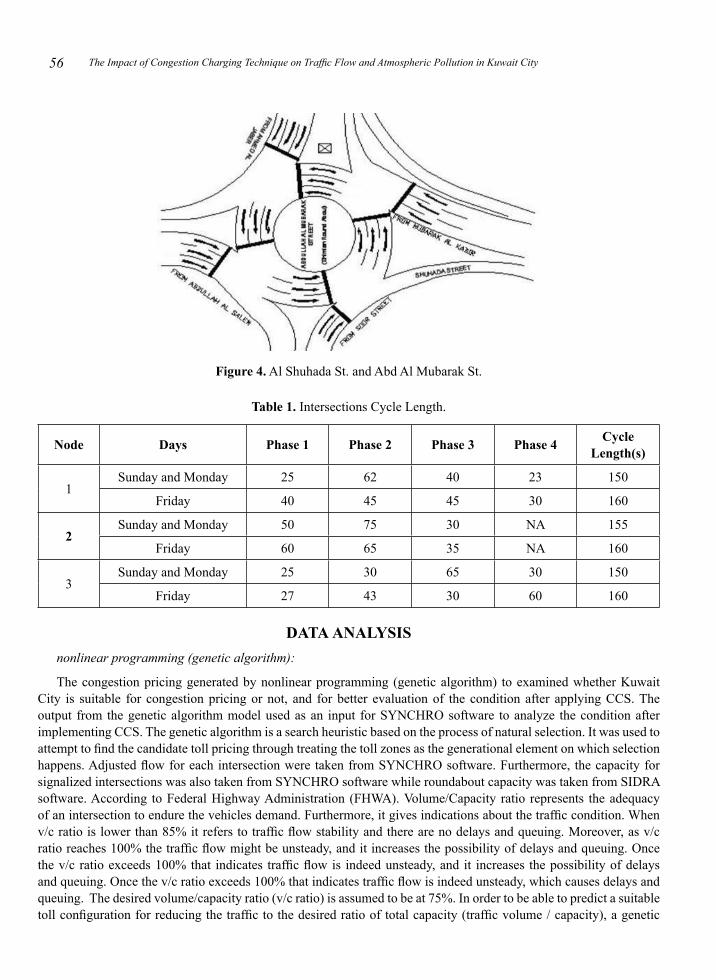
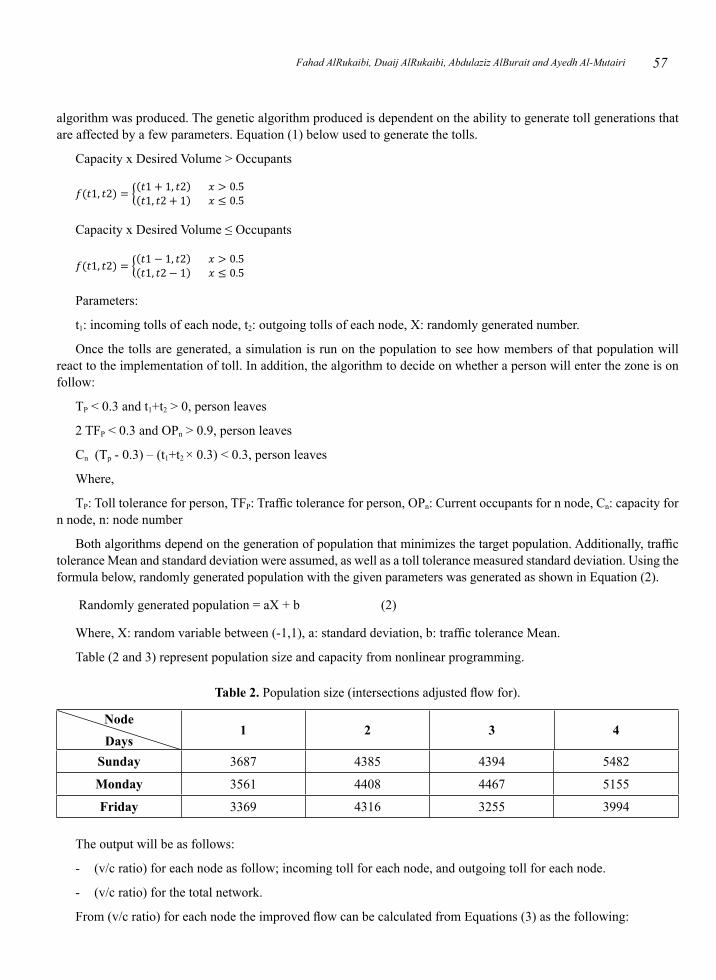
Sample of Traffic Control Signs for network intersections are shown in Figure (3,4). Traffic control signs will be used to control traffic movements in the modelling. where signals timing for the signalized intersection that include minimum green time, yellow change, and all-red intervals was collected as follow 8,5,3 sec respectively for all signalized intersections except Ahmad Al Jyeaber St. and Abdullah Al Mubarak St the minimum green time was 7 sec. Furthermore, the cycle length details for the signalized intersections shown in Table (1).
Figure 3. Ahmad Al Jaber St. and Mubarak Al Kabeer St. intersection.
The Impact of Congestion Charging Technique on Traffic Flow and Atmospheric Pollution in Kuwait City56
Figure 4. Al Shuhada St. and Abd Al Mubarak St.
Table 1. Intersections Cycle Length.
Node Days Phase 1 Phase 2 Phase 3 Phase 4 CycleLength(s)
1Sunday and Monday 25 62 40 23 150
Friday 40 45 45 30 160
2Sunday and Monday 50 75 30 NA 155
Friday 60 65 35 NA 160
3Sunday and Monday 25 30 65 30 150
Friday 27 43 30 60 160
DATA ANALYSISnonlinear programming (genetic algorithm):
The congestion pricing generated by nonlinear programming (genetic algorithm) to examined whether Kuwait City is suitable for congestion pricing or not, and for better evaluation of the condition after applying CCS. The output from the genetic algorithm model used as an input for SYNCHRO software to analyze the condition after implementing CCS. The genetic algorithm is a search heuristic based on the process of natural selection. It was used to attempt to find the candidate toll pricing through treating the toll zones as the generational element on which selection happens. Adjusted flow for each intersection were taken from SYNCHRO software. Furthermore, the capacity for signalized intersections was also taken from SYNCHRO software while roundabout capacity was taken from SIDRA software. According to Federal Highway Administration (FHWA). Volume/Capacity ratio represents the adequacy of an intersection to endure the vehicles demand. Furthermore, it gives indications about the traffic condition. When v/c ratio is lower than 85% it refers to traffic flow stability and there are no delays and queuing. Moreover, as v/c ratio reaches 100% the traffic flow might be unsteady, and it increases the possibility of delays and queuing. Once the v/c ratio exceeds 100% that indicates traffic flow is indeed unsteady, and it increases the possibility of delays and queuing. Once the v/c ratio exceeds 100% that indicates traffic flow is indeed unsteady, which causes delays and queuing. The desired volume/capacity ratio (v/c ratio) is assumed to be at 75%. In order to be able to predict a suitable toll configuration for reducing the traffic to the desired ratio of total capacity (traffic volume / capacity), a genetic
57Fahad AlRukaibi, Duaij AlRukaibi, Abdulaziz AlBurait and Ayedh Al-Mutairi
algorithm was produced. The genetic algorithm produced is dependent on the ability to generate toll generations that are affected by a few parameters. Equation (1) below used to generate the tolls.
Capacity x Desired Volume > Occupants
Capacity x Desired Volume ≤ Occupants
Parameters:
t1: incoming tolls of each node, t2: outgoing tolls of each node, X: randomly generated number.
Once the tolls are generated, a simulation is run on the population to see how members of that population will react to the implementation of toll. In addition, the algorithm to decide on whether a person will enter the zone is on follow:
TP < 0.3 and t1+t2 > 0, person leaves
2 TFP < 0.3 and OPn > 0.9, person leaves
Cn (Tp - 0.3) – (t1+t2 × 0.3) < 0.3, person leaves
Where,
TP: Toll tolerance for person, TFP: Traffic tolerance for person, OPn: Current occupants for n node, Cn: capacity for n node, n: node number
Both algorithms depend on the generation of population that minimizes the target population. Additionally, traffic tolerance Mean and standard deviation were assumed, as well as a toll tolerance measured standard deviation. Using the formula below, randomly generated population with the given parameters was generated as shown in Equation (2).
Randomly generated population = aX + b (2)
Where, X: random variable between (-1,1), a: standard deviation, b: traffic tolerance Mean.
Table (2 and 3) represent population size and capacity from nonlinear programming.
Table 2. Population size (intersections adjusted flow for).
NodeDays
1 2 3 4
Sunday 3687 4385 4394 5482
Monday 3561 4408 4467 5155
Friday 3369 4316 3255 3994
The output will be as follows:
(v/c ratio) for each node as follow; incoming toll for each node, and outgoing toll for each node. -
(v/c ratio) for the total network. -
From (v/c ratio) for each node the improved flow can be calculated from Equations (3) as the following:

The Impact of Congestion Charging Technique on Traffic Flow and Atmospheric Pollution in Kuwait City58
Improved flow = (v/c ratio) × capacity for the node (3)
The reduction of the flow in each node also can be calculated as the following:
Reduction percentage = 1 – (4)
Table 3. Capacity for each intersection.
NodeDays
1 2 3 4
Sunday 3211 4185 5120 4180
Monday 3260 4162 4489 4531
Friday 3779 4175 5160 4873
Desired volume/capacity ratio (v/c ratio): v/c ratio = 75%. After calculating reduction of each intersection, the volumes after reduction is used an input for SYNCHRO. The simulation will be done by SimTraffic to analyses the improved condition. SimTraffic reports for the improved condition are presented in appendix A.
Nonlinear programming Outputs:
The outputs from genetic algorithm model for each intersection are volume/capacity ratio and imposed tolls as shown below.
Output:
v/c ratio (node 1, node 2, node 3, node 4) (%).
Imposed toll (node 1, node 2, node 3, node 4) in KD.
On Sunday:
v/c ratio (72.75%, 68.95%, 76.03%, 73.14%).
Imposed toll (1.200 KD, 0.150 KD, 1.800 KD, 0.05 KD). on Monday: v/c ratio (69.51%, 74.82%, 81.53%, 71.91%).
Imposed toll (0.400 KD, 0.500 KD, 0.600 KD, 1.500 KD). on Friday: v/c ratio (70.55%, 80.12%, 81.96%, 63.08%).
Imposed toll (0.2 KD, 1.500 KD, 0 KD, 0.300 KD).
Sample of calculation:
On Sunday, Node 1:
Input: Adjusted flow = 3687, Capacity = 3211
Output imposed toll = 1.200 KD o v/c ratio = 72.75%
Improved flow = v/c ratio × capacity (3)
Improved flow = 0.7275 × 3211 = 2336.0025
Reduction percentage = 1 –
Reduction% = 1 – = 36.64%
59Fahad AlRukaibi, Duaij AlRukaibi, Abdulaziz AlBurait and Ayedh Al-Mutairi
Imposed toll:
The imposed tolls are results from genetic algorithms. The tolls are different for each intersection, the charge depends on congestion level of the intersection. Table (4) presents the tolls for each node.
Table 4. Intersections-imposed tolls.
Node no.Imposed tolls (KD)
Sunday Monday Friday
1 1.2 0.4 0.2
2 0.15 0.5 1.5
3 0.05 0.6 0
4 1.8 1.5 0.3
Clearly shown that the highest charge was on Sunday node 4 it was 1.8 KD. It is an indication that node 4 will be the most congested node after applying congestion pricing. Meanwhile at node 3 on Friday the toll was 0 KD, which shows that node3 has no congestion. In addition, the average toll at the week days is higher than the weekend due to congestion.
DATA ANALYSIS PROCEDUREThe collected data will be analyzed by using three software’s SYNCHRO, SimTraffic, and Sidra for both current
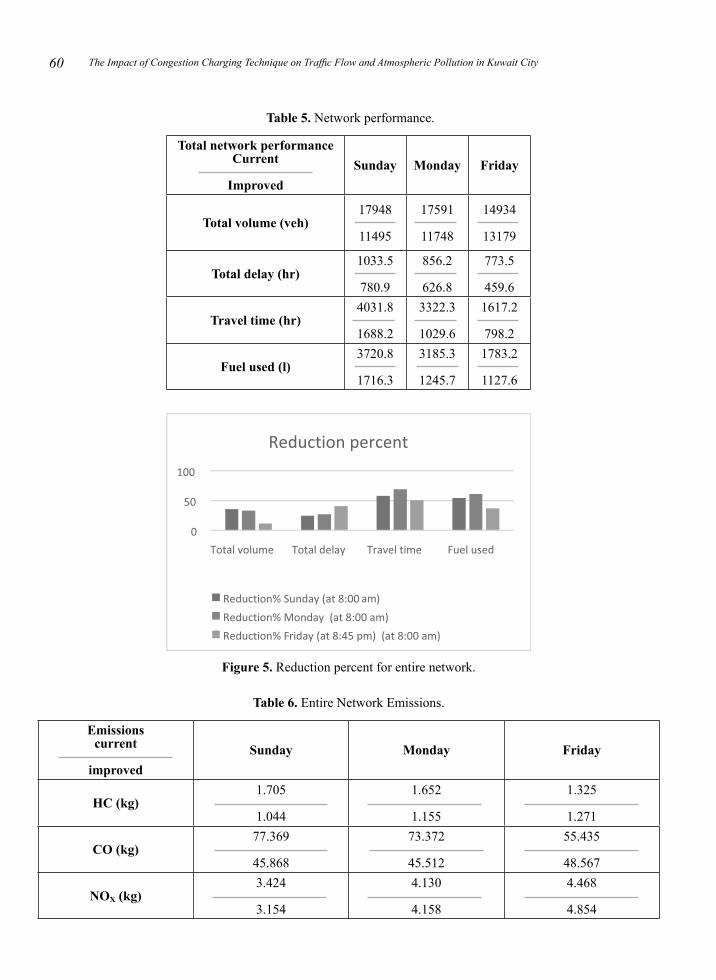
and improved traffic conditions to evaluate the influence of congestion charging method on the traffic flow and environmental condition. SYNCHRO will be used to evaluate the traffic condition in term of terms of level of service (LOS) and intersection capacity utilization (ICU). Furthermore, network performance including total delay, travel time and fuel consumption will be evaluated by SYNCHRO. In addition, pollutants emissions including carbon monoxide (CO), hydrocarbon (HC) and nitrogen oxide (NOX). (Highway Capacity Manual) method will be used to calculate the current LOS of the intersections to compute intersection delays and approach delays where it is ranked from A to F based on average control delay per vehicle. Where the intersection capacity utilization level of service (ICU LOS) for the intersections determined based on ICU method and it rank from A to H based on ICU value. Moreover, SYNCHRO will be used to build network simulation model and traffic volume movement. SimTraffic Software used to evaluate the performance of the network and to run SYNCHRO simulation. Number of 10 runs used represent the data to obtain high level of accuracy in the results, analyzing the traffic variation in the network and in run’s results is needed (Jonathan D. Wiegnd, 2011). Additionally, it used to evaluate network performance and vehicles emissions for the entire network. Moreover, SIDRA INTERSECTION software used to determine the capacity and analyze the performance of the roundabout as HCM method is not applicable. Table (5) and Figure (5) showed the analysis of the entire network performance for both conditions. And it’s clearly shown that Sunday has the highest negative impact in term of total network performance. Obviously observed that the network performance improved significantly after applying CCS. Furthermore, the vehicle entering the network were reduced such that the total volume dropped on the most congested day Sunday by 35.9%. Moreover, the total delay and the travel time on Sunday reached 24.4% and 58.12% respectively. Meanwhile on Monday total volume, total delay and travel time improved by 33.21%, 26.76% and 69%. While on Friday total volume, total delay and travel time decreased by 11.75%, 40.85% and 50.64%. The reduction in fuel used is considered significant. It dropped by 53.87%, 60.89% and 36.76% in the mentioned days respectively. Where the total pollutants emission for the entire network have been examined for the network traffic condition as shown in Table (6).
The Impact of Congestion Charging Technique on Traffic Flow and Atmospheric Pollution in Kuwait City60
Table 5. Network performance.
Total network performanceCurrent
ImprovedSunday Monday Friday
Total volume (veh)17948
11495
17591
11748
14934
13179
Total delay (hr)1033.5
780.9
856.2
626.8
773.5
459.6
Travel time (hr)4031.8
1688.2
3322.3
1029.6
1617.2
798.2
Fuel used (l)3720.8
1716.3
3185.3
1245.7
1783.2
1127.6
Figure 5. Reduction percent for entire network.
Table 6. Entire Network Emissions.
Emissionscurrent
improvedSunday Monday Friday
HC (kg)1.705
1.044
1.652
1.155
1.325
1.271
CO (kg)77.369
45.868
73.372
45.512
55.435
48.567
NOX (kg)3.424
3.154
4.130
4.158
4.468
4.854
61Fahad AlRukaibi, Duaij AlRukaibi, Abdulaziz AlBurait and Ayedh Al-Mutairi
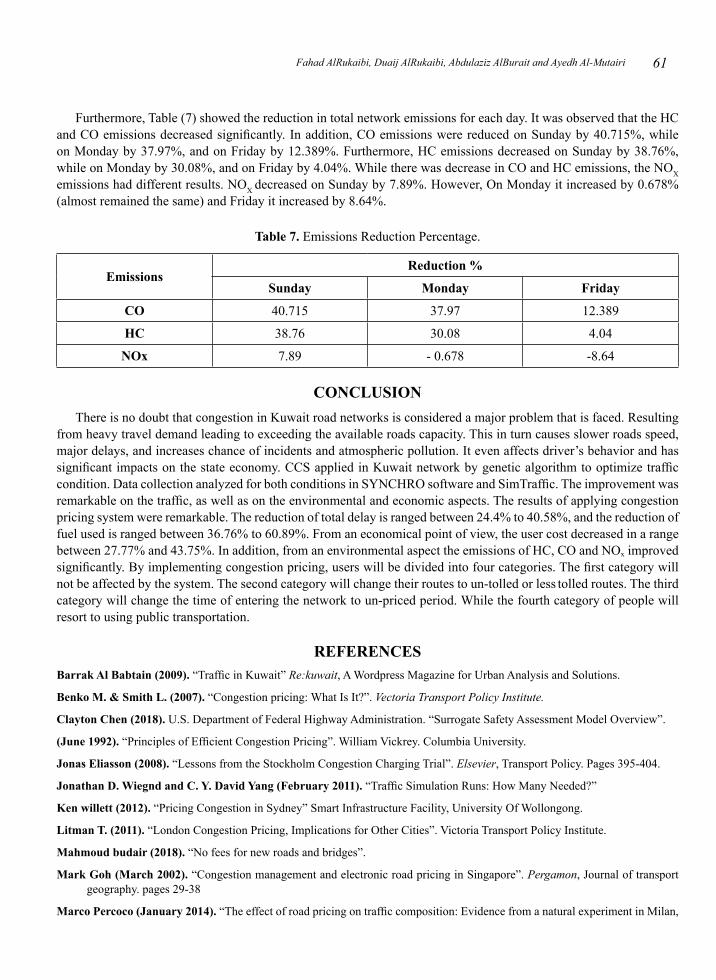
Furthermore, Table (7) showed the reduction in total network emissions for each day. It was observed that the HC and CO emissions decreased significantly. In addition, CO emissions were reduced on Sunday by 40.715%, while on Monday by 37.97%, and on Friday by 12.389%. Furthermore, HC emissions decreased on Sunday by 38.76%, while on Monday by 30.08%, and on Friday by 4.04%. While there was decrease in CO and HC emissions, the NOX emissions had different results. NOX decreased on Sunday by 7.89%. However, On Monday it increased by 0.678% (almost remained the same) and Friday it increased by 8.64%.
Table 7. Emissions Reduction Percentage.
EmissionsReduction %
Sunday Monday Friday
CO 40.715 37.97 12.389
HC 38.76 30.08 4.04
NOx 7.89 - 0.678 -8.64
CONCLUSIONThere is no doubt that congestion in Kuwait road networks is considered a major problem that is faced. Resulting
from heavy travel demand leading to exceeding the available roads capacity. This in turn causes slower roads speed, major delays, and increases chance of incidents and atmospheric pollution. It even affects driver’s behavior and has significant impacts on the state economy. CCS applied in Kuwait network by genetic algorithm to optimize traffic condition. Data collection analyzed for both conditions in SYNCHRO software and SimTraffic. The improvement was remarkable on the traffic, as well as on the environmental and economic aspects. The results of applying congestion pricing system were remarkable. The reduction of total delay is ranged between 24.4% to 40.58%, and the reduction of fuel used is ranged between 36.76% to 60.89%. From an economical point of view, the user cost decreased in a range between 27.77% and 43.75%. In addition, from an environmental aspect the emissions of HC, CO and NOx improved significantly. By implementing congestion pricing, users will be divided into four categories. The first category will not be affected by the system. The second category will change their routes to un-tolled or less tolled routes. The third category will change the time of entering the network to un-priced period. While the fourth category of people will resort to using public transportation.
REFERENCESBarrak Al Babtain (2009). “Traffic in Kuwait” Re:kuwait, A Wordpress Magazine for Urban Analysis and Solutions.
Benko M. & Smith L. (2007). “Congestion pricing: What Is It?”. Vectoria Transport Policy Institute.
Clayton Chen (2018). U.S. Department of Federal Highway Administration. “Surrogate Safety Assessment Model Overview”.
(June 1992). “Principles of Efficient Congestion Pricing”. William Vickrey. Columbia University.
Jonas Eliasson (2008). “Lessons from the Stockholm Congestion Charging Trial”. Elsevier, Transport Policy. Pages 395-404.
Jonathan D. Wiegnd and C. Y. David Yang (February 2011). “Traffic Simulation Runs: How Many Needed?”
Ken willett (2012). “Pricing Congestion in Sydney” Smart Infrastructure Facility, University Of Wollongong.
Litman T. (2011). “London Congestion Pricing, Implications for Other Cities”. Victoria Transport Policy Institute.
Mahmoud budair (2018). “No fees for new roads and bridges”.
Mark Goh (March 2002). “Congestion management and electronic road pricing in Singapore”. Pergamon, Journal of transport geography. pages 29-38
Marco Percoco (January 2014). “The effect of road pricing on traffic composition: Evidence from a natural experiment in Milan,

The Impact of Congestion Charging Technique on Traffic Flow and Atmospheric Pollution in Kuwait City62
Italy”. Elsevier, Transport Policy. pages 55-60
Nicole Badstuber (March 2018). “London congestion charge: why it’s time to reconsider one of the city’s great successes”.
Road Traffic Technology (2003). “Stockholm Congestion Charge”.
Salik (2016). Road and Transport Authority, Government of Dubai.
Shunfeng Song (2015). “Should China Implement Congestion Pricing?” Chinese economy. Pages 57-67.
Sidra for Roundabout (2018). Sidra Intersection 8.
Sock-Yong Phang & Rex S.Toh (1997). “From Manual to Electronic Road Congestion Pricing: The Singapore Experience and experiment”. Transportation Research Part E: Logistics and Transportation Review. Page 97-106. Research Collection School Of Economics.
Tim Richardson, Korolina Isaksson & Anders Gullberg (2010). “Changing Frames of Mobility through Radical Policy Interventions? The Stockholm Congestion Tax”. International Planning Studies. Pages 53-67.
Zachary J. Ridder (2016). “The efficacy of congestion pricing”. Honors theses, University of Tennessee at Chattanooga.