Embed Size (px)
Citation preview

DI
SC
US
SI
ON
P
AP
ER
S
ER
IE
S
Forschungsinstitut zur Zukunft der ArbeitInstitute for the Study of Labor
The Impact of Cultural Diversity on Innovation: Evidence from Dutch Firm-Level Data
IZA DP No. 6000
October 2011
Ceren OzgenPeter NijkampJacques Poot
The Impact of Cultural Diversity on Innovation:
Evidence from Dutch Firm-Level Data
Ceren Ozgen VU University Amsterdam
Peter Nijkamp
VU University Amsterdam and IZA
Jacques Poot University of Waikato
and IZA
Discussion Paper No. 6000 October 2011
IZA
P.O. Box 7240 53072 Bonn
Germany
Phone: +49-228-3894-0 Fax: +49-228-3894-180
E-mail: [email protected]
Any opinions expressed here are those of the author(s) and not those of IZA. Research published in this series may include views on policy, but the institute itself takes no institutional policy positions. The Institute for the Study of Labor (IZA) in Bonn is a local and virtual international research center and a place of communication between science, politics and business. IZA is an independent nonprofit organization supported by Deutsche Post Foundation. The center is associated with the University of Bonn and offers a stimulating research environment through its international network, workshops and conferences, data service, project support, research visits and doctoral program. IZA engages in (i) original and internationally competitive research in all fields of labor economics, (ii) development of policy concepts, and (iii) dissemination of research results and concepts to the interested public. IZA Discussion Papers often represent preliminary work and are circulated to encourage discussion. Citation of such a paper should account for its provisional character. A revised version may be available directly from the author.
IZA Discussion Paper No. 6000 October 2011
ABSTRACT
The Impact of Cultural Diversity on Innovation: Evidence from Dutch Firm-Level Data*
Due to the growth in international migration in recent decades, the workforce of firms in host countries has become considerably more diverse, both demographically and culturally. It is an important question for firms and for governments to ask whether there are some productivity-enhancing externalities gained from this growing diversity within firms. In recent years migration research has demonstrated positive economic impacts of cultural diversity on productivity and innovation at the regional level. However, there is a dearth of research on the links between innovation and migrant diversity at the firm level. In this paper we construct and analyse a unique linked employer-employee micro-dataset of 4582 firms, based on survey and administrative data obtained from Statistics Netherlands. Excluding firms in the hospitality industry and other industries that employ low-skilled migrants, we use the local number of restaurants with foreign cuisines and the historical presence of migrant communities as valid instruments of endogenous migrant settlement. We find that firms in which foreigners account for a relatively large share of employment are somewhat less innovative. However, there is strong evidence that firms that employ a more diverse foreign workforce are more innovative, particularly in terms of product innovations. JEL Classification: D22, F22, O31 Keywords: immigration, innovation, cultural diversity, knowledge spillovers,
linked employer-employee data, Netherlands Corresponding author: Ceren Ozgen Department of Spatial Economics VU University Amsterdam De Boelelaan 1105 1081 HV Amsterdam The Netherlands E-mail: [email protected]
* This research is part of the Migrant Diversity and Regional Disparity in Europe (MIDI-REDIE) project, funded by the NORFACE research programme Migration in Europe – Social, Economic, Cultural and Policy Dynamics. We are grateful to Henri de Groot, Dave Maré, other members of the MIDI-REDIE team, participants at the 50th European Congress of the Regional Science Association International, Jönköping, Sweden, 19-23 August 2010, and at the international conference Migration: Economic Change, Social Challenge, University College London, 6-9 April 2011, for comments on an earlier version of the paper.
1
1. Introduction
One of the major mechanisms for the transfer and diffusion of knowledge is the mobility of people. The
geographic mobility of high-skilled labour causes a relocation of human capital that essentially contains
embodied knowledge combined with personal experiences (Döring and Schnellenbach, 2006). Moreover,
multinational firms also play a specific role in transmitting institutionalized knowledge in the form of the
experience and work practices of internationally transferred employees.
On the one hand, the global economy is creating an unprecedented demand for a diversified and open-
minded work force while, on the other hand, highly-skilled workers are seeking opportunities to enhance
their human capital and increase their income and experience. For example, an estimated 900,000 highly-
skilled professionals entered the US between 1990 and 2000. Moreover, temporary workers account for
one-sixth of the total IT workforce in the US (OECD, 2002). Such phenomena increase the rate of
circulation of talent over space and across firms, leading to much greater cultural diversity of the
workforce than a few decades ago. Today, large, and often export-oriented, companies are seeking
knowledge workers from all over the world (Saxenian, 2006; Page, 2007). It is an important question for
firms and for governments to ask whether there are some productivity-enhancing externalities gained
from this growing diversity within firms.
It is widely argued that the knowledge available in localities with a diverse population generates positive
externalities for economic growth, especially in the form of greater innovativeness. Contrary to the
complete knowledge spillover assumption of neoclassical theory, persistent regional inequalities and
migration of highly-skilled workers to globally-connected cities suggest that knowledge is neither
instantaneously nor evenly dispersed across space, and that more attention should be drawn to the
complex mechanisms that drive knowledge spillovers. Regions that do not generate or absorb new
productive ideas often fall behind in development (Romer, 1993), while others that are able to attract
“global minds” benefit from the circulation of tacit and codified knowledge. Besides the circulation of
knowledge, the circulation of ideas and the encouragement of creativity also generates growth. The latter
are often enhanced by culture-specific skills.
A recent branch of migration literature has been focusing on the association between innovation and the
presence of foreign workers, generally reporting a statistically significant positive relationship, reviewed
in, e.g., Ozgen et al. (2011). The main argument of this literature is that immigrant workers not only
contribute to innovation by means of their high skills and innate abilities, but that they also bring into
firms and host countries new ideas and perspectives from their different cultural backgrounds. The
empirical evidence supports this hypothesis explicitly with data at the regional level or at the level of
micro-data on individual workers.
However, the innovation literature to date has tended to treat high-skilled R&D workers as a rather
homogeneous group of employees. The cultural features, skill complementarities, and ethnic background
of the employees have not been explicitly taken into account. Most studies use various firm
2
characteristics as determinants of innovation and estimate a so-called knowledge production function
(e.g., Audretsch and Feldman, 2004; Cohen and Levinthal, 1990). Yet, such studies have often overlooked
the characteristics of the individual workers. The latter are clearly needed to assess the impact of worker
diversity on the innovativeness of firms.
Consequently, in this paper we focus on the effects of knowledge and creativity of foreign employees
with diverse backgrounds, and the spillovers of these effects for productive capacity through reported
technological improvements at the firm level. To date – with the exception of Parotta et al. (2011), Lee
and Nathan (2010), Simonen and McCann (2008) and Almeida and Kogut (1999) – there has actually been
very little empirical evidence which addresses the determinants of innovation at the firm level, and which
either takes the presence and characteristics of foreigners into account, or considers labour mobility as a
source of new knowledge.
In addition to knowledge flows, there are also other types of externalities resulting from immigrant
diversity. The presence of a diverse group of immigrants increases the demand for goods from the home
country. The resulting increase in the variety of consumption goods and services also benefits the host
population. A stream of literature focuses on this issue (Clark, 2002; Shapiro, 2003; Florida, 2003). While
the presence of consumption externalities is not central to our study, it is clear that a diverse workforce
may facilitate the development of a new range of cultural goods or services that may be reflected in
measures of innovation.
We utilize high-quality linked employee-employer data at the firm-level, obtained from the Central
Bureau of Statistics for the Netherlands (hereafter Statistics Netherlands). We combine survey and
administrative information from four different collections, relating to the period 2000-2002. By means of
the resulting unique micro-dataset of 4582 firms, we study whether the presence, or relative numerical
importance, of migrants influences the innovative capacity of a firm. We also test whether cultural
diversity among the migrants is more conducive to innovativeness. As far as we are aware, this is the first
study in the Netherlands that analyses the innovation effects of foreign employees by means of a
representative micro-dataset at the firm level.
Clearly, a potentially important issue is that of reverse causality: foreign knowledge workers may self-
select into regions and seek employment in firms that are innovative and have a diverse workforce. We
address this issue by an instrumental variable approach. Excluding firms in the hospitality industry and
other industries that employ low-skilled migrants, we use the local number of foreign restaurants and the
historical presence of migrant communities as valid instruments for endogenous migrant settlement. We
find that, in general, firms that employ a relatively large share of foreigners are less innovative, but there
is clear evidence that a greater diversity of the foreign workers significantly enhances product innovation.
3
2. Theoretical Links between the Presence of Foreigners and Innovation
An innovation is the introduction of something new that is primarily built by means of analytical
knowledge. It must lead to radical, major and dramatic change.1 In addition, improvement of an existing
product can also be viewed as an innovation. All industries and sectors can be innovative, since
innovation is not equal to, but more than, R&D intensity. Subsequently, all innovations have complex
technological, human, and organizational dimensions.
Technological advances come from things that people do (Romer, 1990). People carry, bring in and add to
knowledge, or take knowledge with them. Many workers’ characteristics, such as age, education,
occupation, cultural background and language may affect their knowledge acquisition and their mobility
(Poot, 2008). Even when people belong to the same occupational group, any differences in their cultural
backgrounds may influence their outlook, as well as their productivity, in carrying out their work or doing
business. If one considers the presence of more than 200 million immigrants in the world, the massive
flows of knowledge, cultures, and languages through the mobility of these people create opportunities
that can help firms in being innovative. Current knowledge is the outcome of accumulated efforts. Each
inventor begins from where its predecessors left off. The inventor explores the latest generation of
products, and makes use of market knowledge that embodies a cumulative investment in time to develop
products and processes (Grossman and Helpman, 1994). The presence of foreigners with diverse
backgrounds in a labour market may serve to enrich this cumulative effort.
There has been a massive number of studies that have analysed the impact of infrastructural and
organizational aspects of firms on innovativeness. Yet, the importance of ideas rather than physical assets
has only recently entered the economic agenda (Jones and Romer, 2010). The biggest change in the
recent scientific literature is that it is now not the firm but the employees that are seen as a major source
of innovation. One key focus of this new approach is the impact of foreign workers on the innovativeness
and productivity of host firms and countries. Thus, one branch of this literature analyses the impact of
foreign entrepreneurs, students or inventors on innovation (Kerr, 2010; Lobo and Strumsky, 2008;
Faggian and McCann, 2008; Kerr and Lincoln 2010; Hunt and Gauthier-Loiselle, 2008; and Zucker and
Darby, 2007). Such evidence of spillover benefits from skilled foreigners joining an organisation applies
even to professional sports (see Alvarez et al. 2011 for the case of basketball in Europe). The merit of such
studies lies in determining the success and spillover benefits of skilled immigrant on the host economies.
These studies rely on detailed information about the ‘inventors’, which allows the researchers to control
for education and knowledge acquisition of foreigners in the host countries.
1 Globalization has a major impact on spreading the effect of breakthrough innovations. The speed at which such
innovations become known and available worldwide has been increasing fast. For example, Cooper and Edgett (2009) report that it took Sony 10 years to sell 50 million Walkmans, while about the same number of iPods were sold in only 4.5 years. Clearly, dramatic change may lead to dramatic economic gains for the innovators and a rapid change in product mix. Such examples are not restricted to the private sector only. The US Internal Revenue Service collected 33 percent more dollars from delinquent taxpayers with half of its former staff, and a third fewer branch offices after achieving major reductions in process cost or time, and improvements in quality and flexibility (Davenport, 1993).
4
Another branch of this literature discusses the innovative and productive effects of externalities created
by clusters of immigrant groups with diverse backgrounds in particular regions (Ozgen et al., 2011;
Niebuhr, 2010; Mazzolari and Neumark, 2009; Südekum, 2009). These analyses are mostly carried out at
the regional level, and group immigrant populations into a number of sub-continental large area origins
based on their place of birth/nationality. Hence, the major focus of the latter type of studies is the
average effect of immigrant diversity on regional productivity or innovation.
On the innovation research side, the major methodological approach to analysing the innovativeness of
firms has been through utilizing the knowledge production function (KPF) (Acs et al., 2002). This approach
considers the number of R&D workers and the quantity of human capital generally (mostly accounted for
by the educational attainment of the employees) as inputs into innovation, no matter what cultural
background the workers have. The general KPF specification is as follows:
ii i iI RD HK , (1)
Where the dependent variable I is the degree of innovative activity; the RD variable denotes all kinds of
R&D inputs; and HK represents human capital inputs. The subscript i refers to the unit of observation,
which is usually the firm or establishment.
However, the spatial dimension of innovation activity has led regional scientists to focus predominantly
on the external forces and internal features of firms that stimulate innovations. Numerous studies
scrutinize the significance of the external environment of a firm in terms of demand-supply links,
industrial clusters, and diversity of production. The studies on the internal features of a firm emphasize
the importance of a firm’s resources for innovations, such as R&D expenditures and the presence of high-
skilled workers. However, while the location of a firm matters in order to benefit from locally produced
knowledge, the absorptive capacity of a firm is important to utilize this available information, as well as to
improve it, and turn it into creative outputs (Cohen and Levinthal 1990; Caragliu and Nijkamp 2011).
There are studies that focus on the role of inventors, and their networks, while taking inventors to be
independent of the firms for which they work. These studies highlight the significance of spatial
proximity, and knowledge exchange among diverse groups of inventors (e.g. Agrawal et al., 2008). In fact,
very few studies undertake their analysis at the firm level, the smallest local production unit, where the
transfer of tacit knowledge is most likely to take place.
Innovation is a major motivation for firms, since the possibility to invent ‘things’ with economic value
provides monopoly rents to the firm. To increase the chance of innovating, firms need a more
heterogeneous workforce to sustain diversified knowledge. As would be expected, the compositional
structure of a firm is determined by the type of production and activities. For instance, if the firm
comprises of various sub-units, and require good understanding and cooperation between these units,
then this firm will be more concerned about the transferability of the knowledge across these units,
rather than diversity (Prat, 2002). Therefore, it is important to control for firm structure when considering
the innovation behaviour of firms in different sectors.
5
The firm is an important component of knowledge exchange, but knowledge accumulation that provides
an input to innovation may appear within and outside the firm. For instance, the firms’ investments in
R&D, and machinery, and other fixed capital assets are examples of such internal inputs. However, firms
can also import new knowledge via employing “talent” that already embodies such knowledge. Some
firms are more likely to hire a foreign workforce, for example because they produce a wide range of
products and services or because they sell to a wide range of countries (multinationals like Google are a
perfect example). Alternatively, for many sectors spatial proximity provides a critical mechanism through
which knowledge flows may take place. Hence, firms may enjoy the presence of cumulative knowledge
that is present in their vicinity, and this knowledge may be enhanced by a diverse community.
3. Description of the Unique Dataset
This research analyses those Dutch firms which have responded to the Community Innovation Survey in
the 2000-2002 period in the Netherlands, and specifically focuses on the effect of varying employee
characteristics in addition to other determinants of innovation in these firms. For this purpose, several
micro datasets are combined to create the Master dataset. All of the micro-datasets are obtained from
Statistics Netherlands under a confidentiality agreement.2 Combining these micro-datasets made it
possible to identify the employees, on the one hand, by workplace (firm), job mobility, and
industry/sector and, on the other hand, by various socio-economic and background characteristics. The
firm is our unit of observation. Statistics Netherlands defines a firm as “a company with autonomous
production and decision features, while there is a strong outward orientation” (Statistics Netherlands,
2009).
The micro-data sets that are used to create our Master dataset are as follows: (i) the Social Statistics
Database (Sociaal Statistisch Bestand) that is composed of tax data (REOS) and Dutch municipality
registrations (GBA); (ii) the Community Innovation Survey (CIS); (iii) the Dutch Labour Force Survey (EBB).
Detailed information about these data sets is given in the Data Appendix.
By using this available information, we created a Master dataset in which we could identify firm-level
information of the employees, their ethnic origin and location at the municipality level, while we also
have extensive knowledge about the firms’ fixed capital assets, and innovative resources/potentials. The
Master dataset is created in three steps. Firstly, CIS is merged with REOS to identify the number of
employees per firm by using firm ID as a key variable. Secondly, we merged this new data set with the
municipality registrations, from which we obtain the birthplaces, and various other features of
employees. Finally, because none of these data sets include information on the occupation and
professional background of employees, the CIS_REOS data set is merged with the labour force survey EBB
to retrieve skills information. However, this step reduces the data set from a census of firms to a survey
of employees in Dutch firms. As a result of this final merge, 45 percent of the firms that are in the CIS
2 Access to the data is restricted to certain locations and data terminals.
6
2002 (referred to as CIS 3.5) version remain included in the Master dataset. This process of merging data
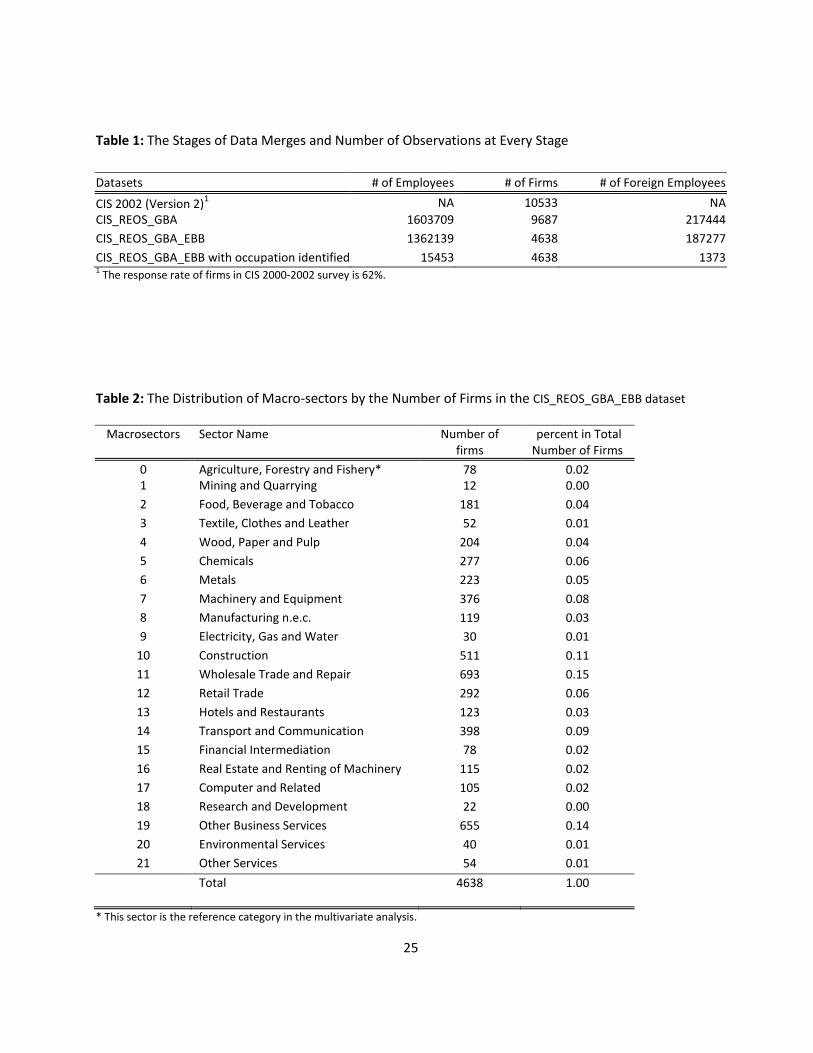
sources is further detailed in Table 1.
Table 1 about here
Employees who are under 18 years old, and those who earn less than €10 a month are excluded from the
database. The REOS database reveals information about people who were active in the labour market on
31 December 2000. They are assigned to the firm they worked for on that date, irrespective of when they
started to work in that firm, or if they changed jobs subsequently. If the worker was observed in the
dataset multiple times (multiple job), the job with the longest job spell was selected. Personal
characteristics (age, marital status, citizenship, etc.) are those corresponding with the most recent
residential location (in 2000), and each individual is counted only once. The data on personal
characteristics were obtained from the municipality registrations (GBA). If an employee changed address
more than once in one year, the most recent location defined the household address. The same
methodology was applied to the observations from the EBB survey.
Since foreign employees are central to our analysis, a clear definition of foreigners is essential. During the
life course, an employee may move from one country to another and obtain a second citizenship, or
change citizenship. Moreover, countries may categorize non-natives in different ways. The Kingdom Act
on Dutch Nationality identifies a Dutchman according to his parents’ birthplace and/or the individual’s
birthplace. Thus, a person in The Netherlands is called ‘allochtoon’ if at least one parent was born abroad
and/or that person was born abroad. The number of ‘foreigners’ clearly depends on the chosen
definition. We use for non-native Dutch employees their country of birth as an exogenous indicator of
cultural or ethnic identity, while we also observe acquired Dutch citizenship and time spent in the host
country. In addition, we are able to identify non-native Dutch employees by their current citizenship, as
well as their parents’ place of birth, which we name “employee origin”. Any employee who was not born
in the Netherlands is referred to as a foreign employee in our analyses.
4. Methodology
In this section, we briefly explain the techniques used by the Statistics Netherlands to sample firms in the
CIS 3.5 from the population of firms. Moreover, we provide details of how the sample was modified.
Finally, we describe the econometric modelling methodology used.
To create the sample used for the CIS 3.5, firms were selected from the General Business Register (ABR)
maintained at Statistics Netherlands. Only firms with SBI (business activity code) 1 through 74, 90, 92 and
93 were included. The excluded codes refer mainly to public-sector and NGO-type of activities. A further
selection was made based on firm size. Firms employing less than 10 persons were not included in the
sample. Firms employing more than 50 persons were all included in the sample. For firms employing 10 to
50 persons, only a fraction was randomly selected into the sample. The size of this fraction depends on
7
the SBI code and firm size. After the survey, a weighting factor is calculated per stratum. A stratum is
defined on the basis of two indicators: namely the 2-digit SBI and firm size.3
To estimate the impact of foreign workers on firms’ innovations we utilize a binomial logit model of the
data in the constructed cross-sectional sample for 2000-2002. In our model the probability that a firm
reports any innovation is a function of various firm characteristics as well as employee characteristics
(summary statistics are given in Table 3). The dependent variable takes the value of 1 when the firm is an
innovator and 0 otherwise. The CIS survey provides information on innovation generally, but also sub-
categories of innovation (product and process innovations). Hence we will estimation logit regression
models for three different innovation categories (innovations in general; product innovations; and
process innovations). The econometric specification we estimate is as follows:
Pr (Innovate)i = f (Firms characteristics, Employee characteristics)i + εi, (2)
where the dependent variable is one of the three innovation types mentioned above, and i stands for a
firm, i= 1,2,…..N. The independent variables include firm size, firms’ fixed capital resources, organizational
changes made in the last two years, human capital stock, and a set of other variables on foreign
employees. The firms are more likely to employ foreign workers if they are more export-oriented and
internationally connected. We control for the international orientation of firms by adding the location of
the firm’s headquarters into the econometric modelling. Moreover, 22 macro-sector fixed effects account
for sector-specific shocks and unobserved heterogeneity.4
Cooperation for innovation is an important source of knowledge acquisition of firms. Therefore, we
estimate the effect of international and domestic cooperation on firm-level innovation. We utilize the
reported obstacles to the innovation process to account for the availability of innovation inputs.5 Hence,
we take account of whether a firm reports a lack of good personnel or technology as a constraint to
innovation. Long-term planning of a knowledge acquisition strategy is an important factor for the success
of innovation activity. We include knowledge acquisition strategy planning as another control factor in
our estimations.6
3 To correct for a possible sample selection issue, we reweight all of our observations by using the total sum of
weights for each stratum in the CIS 3.5 based on the two criteria given in the text. Therefore, it is possible to compare the distribution of firms in our sample with that of the population. This exercise reveals that our estimations are based on a sample in which firms with more than 50 employees are somewhat overrepresented, and those with less than 50 employees are fairly underrespresented. For that reason, the results are more representative of the impact of foreigners on large firms, rather than capturing their impact on small firms. Additionally, non-responses are treated as an absence of innovation. This imputation makes little difference. 4 2-digit sector codes are adjusted to the Standard Industrial Classification (SIC). 5 Other input variables, such as total R&D expenditures, predict innovation activity perfectly. In other words, in our
sample, all firms that reported R&D expenditures between 2000-2002 were innovative. 6 The detailed description of the variables used in the estimations is given in Table A.1 in the Data Appendix.
8
The employee features considered in the analysis include the ethnic, demographic and occupational
characteristics of the workers. The age composition of a firm’s workforce, measured by the shares of
specific age groups in total employment, is used to test whether more youthful firms are more innovative
(e.g. Poot, 2008). Similarly, the shares of various skill categories in total employment are used to test the
impact of skills on innovation. We use the ratio of the number of foreigners to the total number of
employees per firm as an indicator of the firm’s overall ethnic structure. Additionally, we complement
this ‘share of foreigners’ measure with measures of diversity, in which the country of birth composition is
more explicitly taken into account.
The impact of diversity within firms is an important aspect of our analysis. The literature suggests various
diversity measurements. The selection of a diversity measure depends on the research question and the
nature of the data. Our main measure is a diversity index which is referred to as the fractionalization
index by Alesina et al. (2003). This index accounts for the share of various groups of foreigners in the
firm’s employment. We exclude the native population from calculating the diversity index, i.e. the
measure reflects diversity among immigrant employees, not between the native born and immigrants. If
natives are included in the measure, the diversity index is in practice (given that in most cases the native
born account for 80 to 90 percent of employment) highly correlated with the share of migrants in total
employment. However, the diversity among migrants index and the share of migrants in total
employment are only weakly correlated (see also Ozgen et al., 2011). The index is calculated as follows:7
Divi = 2
1
1N
ji
j
s
, (3)
in which sij is the share of the group j (j=1, ..., N) in employment of firm i. The diversity of a firm increases with an increasing value of the index. The index value can range between 0 (all migrants originate from the same country) and 1-1/N (there are an equal number of migrants from each of all N countries). The innovativeness of a firm may also be influenced by a different form of diversity: that is to say, not a unique composition of employment, but simply the maximum variety of people present. If one considers that each country has its own distinct features, the way people think, act, and work will vary with the number of countries represented in each firm. Therefore, a simple count of the unique number of countries of birth represented in each firm might be an alternative measure of diversity at the firm level:
Uniquei=
N
ji
j
U (4)
7 The diversity index is also sensitive to the presence of dominant migrant groups among all foreign born.
Consequently, we measure the diversity index by dividing the world into 6 supra-national regions: EU15, other European countries, North America, South-east Asia, East Asia and Oceania, Rest of the world. Hence N is 6 in equation (3), but about 200 in equation (4).
9
in which Uji is a dummy variable that is equal to one when country j is represented in firm i and zero
otherwise. The value of Unique increases with the increasing number of countries represented in each
firm. Its value ranges between 1 and N.8 The value 1 means that the firm is solely composed of
Netherlands born workers.
5. Descriptive Statistics
Description of Firms
Our dataset consists of 4638 firms out of the 10,533 firms surveyed in CIS 3.5 over the period 2000-2002.
As mentioned before, the main reason why the dataset only captures 44 percent of the number of CIS 3.5
firms is due to the merging of the dataset with the Dutch Labour Force Survey; but this was the only way
to obtain the occupation of the employees.9 The total number of employees in the dataset is 1.3 million
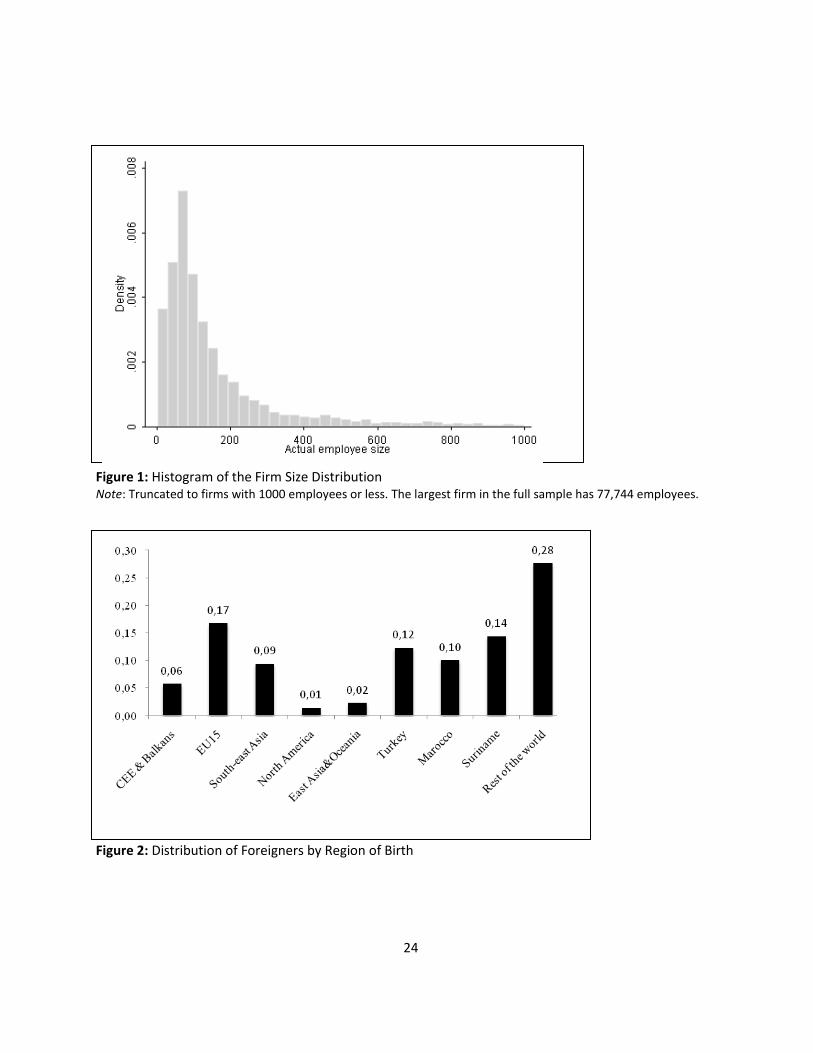
(about 10 percent of the active working population) and total number of foreign employees is 187,277 (about 13 percent of the employees in the sample). 50 percent of firms have 100 employees or more (see
Figure 1).
Figure 1 about here
Manufacturing accounts for 31 percent of the firms (Macro-sectors 2 to 8, see Table 2) and 55 percent are
in the services sector. The most common macro-sector is Wholesale Trade and Repair (15 percent of
firms), followed by Other Business Services (14 percent) and construction (11 percent). Many of these
firms are located in the large agglomerations of the country. The primary agglomeration is the ‘Randstad’
region.10 Besides Randstad, there are two other large clusters of firms: in the South-east, the s’-
Hertogenbosch-Maastricht corridor, and in the North-east around Groningen. Summary statistics on the
firms and their employees are given in Table 3.
Table 2 about here
The CIS survey recorded 3 types of innovations: a) product/services innovations, b) process innovations,
and c) marketing innovations. Deleting some firms with missing information, 38 percent of the remaining
4582 firms innovate with respect to at least one of these categories. If a firm is innovating in one of these
categories, it is often active in the other categories as well. Overall, 28 percent of firms report new
product or services innovations and 21 percent report new process innovations. The five most innovative
8 The number of countries of birth represented in a firm varies between 1 (Netherlands only) and 197. The average
is ten countries. 9 Given that the Labour Force Survey is a representative random sample of the Dutch workers, the final dataset is
broadly representative of Dutch firms (with 10 or more employees) as well. 10
The Randstad region is a large conurbation which is composed of four major Dutch cities (Amsterdam, Rotterdam, The Hague, and Utrecht) and their hinterlands. The region generates 46 percent of the total GDP and houses 41 percent of the population in the Netherlands.
10
sectors in the dataset are Research and Development; Machinery and Equipment; Electricity, Gas and
Water, Chemicals; and, finally, Computer and related activities.
Table 3 about here
Multi-national firms are more likely to employ foreign workers, and larger firms are more innovative than
small firms. In our dataset 83 percent of the firms’ headquarters are in the Netherlands, while the rest are
predominantly in neighbouring countries such as the UK, Germany, and France. Obviously, some sectors
are more likely to operate internationally than others. The largest number of firms with headquarters
abroad can be found in the Mining and Quarrying, Chemicals, and Machinery and Equipment sectors, in
that order.
The survey provided also information on whether the firms cooperated with one or more partners in the
product or process development stages. About 17 percent of all firms (or 44 percent of firms that are
innovators) reported such cooperation and most of these firms cooperated with domestic partners
(enterprises, universities, semi-public or semi-private institutions, suppliers and consultants). Another
important pillar of the innovation process is the availability of R&D inputs. Not all firms employ R&D
researchers or have R&D expenditures. Only 31 percent of firms reported the presence of R&D personnel
(researchers with or without a PhD, and research assistants). On average, firms employ close to 300
employees among which 23 R&D personnel. The variable total R&D expenditure is a perfect predictor of
whether a firm is an innovator or not. All firms with zero R&D expenditure are not innovating while those
with positive R&D expenditure are. Consequently, the R&D variable cannot be used as an explanatory
variable in a model that tests the impact of the presence of migrants on the likelihood that the firm
reported to be innovative.
Description of Foreigners
As noted earlier, a foreigner is defined as a person who was born outside the Netherlands. The total
number of foreign employees in our data set is 187,277, which is approximately 13 percent of the total
workforce of 1,362,139 employees (see Table 1). However, the occupation of only 15,453 employees
(including 1373 foreigners) could be traced with the labour force survey EBB. As expected, most of the
foreign employees are concentrated in the large firms in our sample.
About 17 percent of the foreign born originate from the EU 15, 6 percent from Central and Eastern
European and Balkan countries, and 9 percent from South-East Asia. The three most commonly referred
source countries of migrants in The Netherlands are Suriname (14 percent), Turkey (12 percent) and
Morocco (10 percent) (see Figure 2). The Netherlands has a long tradition of attracting foreigners from its
former colonies Indonesia and Suriname, from countries like Turkey and Morocco where the initial flows
were initiated by the bilateral guest worker agreements and, moreover, from Eastern European
countries. The European continent experienced highly transformative political events in the 1990s, just a
decade before our period of analysis. These included the fall of the Iron Curtain, the unification of East
11
and West Germany, as well as prolonged wars in the Balkan area. These events created substantial
migration flows in an East-West direction, although recent statistics suggest that not all of these migrants
became permanent settlers. Notwithstanding that, these events would have had an impact on the
composition of our sample.
Figure 2 about here
In general, the foreign born in the Netherlands are relatively young and low-skilled. 53 percent of the
foreigners are less than 35 years old, while 80 percent of them are less than 45 years old (for all
employees the corresponding percentages are 45 and 72 respectively, see Table 3). These values are
substantially higher than those of the natives in the corresponding categories. Many of the foreign
employees are working in low-skilled jobs in the Other Business Services, Retail Trade and Wholesale
Trade and Repair sectors. Common jobs include secretarial, agricultural, and cleaning services. Compared
with the natives, the foreigners are mainly employed in the large companies with more than 250
employees.
6. Results of Multivariate Analysis
Logit regression Analysis
This section presents the results of the multivariate analysis. First, we show the results for the full sample.
We also discuss the effects of various employee diversity measures on the different innovation
categories. Subsequently, we re-estimate the regressions models with a sub-sample that excludes the
sectors that employ most of the unskilled immigrants (Other Business Services and Retail Trade). Finally,
we account by means of instrumental variables estimation for the endogeneity and bias due to the self-
selection of foreigners to particular firms.11
Logit models estimated with the full sample are reported in Table 4. The first column reports the results
for firms reporting innovation activity generally, the second column refers to product innovation and the
third column to process innovation. In accordance with the literature, we find that firm size is an
important determinant of the innovativeness of the firms. Larger firms have more resources for
innovation, and perhaps have a greater ability to appropriate returns to their innovation efforts.
Cooperation for innovation has also a positive effect on product and process innovations.12 The impact of
whether the firm is part of a group or has its headquarters abroad is statistically less conclusive. The firm
being part of a group is significantly positive in product innovation, whereas having headquarters abroad
positively impacts on process innovation.
11
All the estimations are carried out with Stata 11. 12
All firms cooperating for innovation were innovative. The variable therefore dropped out of the first regression. It is also possible to distinguish between cooperation domestically and internationally. However, the correlation between these two variables is high. The simple correlation coefficient is 0.7.
12
Table 4 about here
In all three logit models, the openness of the firm to change its organizational structure appears to be a
very positive and strong indicator of innovation. The effect is significant at the 1 percent level. Although it
may sound counterintuitive, lack of personnel or technology are also shown to boost firms’
innovativeness generally. Firms suffering from lack of personnel and technology are forced to innovate by
circumstances. A lack of personal is also positively associated with product and process innovations. This
is not the case with a lack of technology. Finally, the firms that have a prepared knowledge acquisition
strategy for the present or for the coming two years are significantly more likely to innovate. The effect of
a prepared knowledge strategy is statistically significant and positive at the 1 percent level.
All equations include sector dummies. As expected, some sectors are more prone to innovate compared
with others. The coefficients of sector fixed-effects (not included in Table 4) show that the sectors Wood,
Paper and Pulp; Chemicals; Metals; and Machinery and Equipment have a higher probability to innovate
than the reference category Agriculture, Forestry and Fishery. Labour intensive sectors, such as
Wholesale Trade and Repair; Retail Trade; and Hotels and Restaurants, are less likely to innovate.
Moving on to the employee variables, the skill level of employees appears to be an important
determinant of innovation overall. In particular, the medium and highly-skilled workforce has a positive
and significant effect on product innovations at, respectively the 5 and 1 percent levels. However, we did
not find any statistically significant effect of skill categories on the process innovations. On the other
hand, the results based on the age composition of the employees of the firm show that a more youthful
workforce generates more innovation. Among the four age categories included in the regressions13, the
age groups 25-34 and 35-44 turn out to have a very considerable effect on all innovation categories.
Interestingly, a statistically significant positive effect is also found for employees aged 55-64 in the case of
innovativeness as a whole. However, the coefficient is smaller than the corresponding coefficients for
employees aged 25-34 or 35-44.
Table 4 shows that a greater share of foreigners in employment is associated with lower innovation as a
whole. This result was also found in Ozgen et al. (2011) for aggregate data at the NUTS 2 level. Brunow et
al. (2011) found a similar effect with respect to firm productivity, using micro-level firm data from
Germany. The negative effect of a relatively larger share of foreigners in overall employment is plausible
when one considers that the reservation wages of the migrant workers are likely to be lower than those
of the native born population. Consequently, by recruiting more foreign workers, firms lower the cost of
labour relative to capital. This induces more labour-intensive production, which is less likely to be
encouraging innovation than capital-intensive production technologies.
13
Employees aged 18-24 is the reference category.
13
However, the benefit from migration for innovativeness of the firm may come from the diversity of the
foreign workforce. This effect is tested by adding diversity measures to the logit regressions that are
reported in Table 4. The results are in Table 5. The first measure we use is the natural logarithm of a
measure called ‘unique’, which stands for the total number of unique birthplaces of foreigners for each
firm, and which was explained in Section 4. The idea behind this measure is that every country has its
own way of functioning, thinking, and performing; therefore, an employee composition based on a
variety of birthplaces should induce new ideas and heterogeneous perspectives into a firm. However, we
find that for innovations as a whole, and also for product and process innovations, an increasing number
of birthplaces does not have a statistically significant effect on the probability to innovate for firms.
Table 5 about here
The second measure of diversity we utilize is what is called the diversity index as defined in equation (3)
in Section 4. The index excludes the native born, and, therefore, signals diversity among the migrant
population. This is quite a different way of measuring diversity than counting the number of countries of
birth present in the firm, but the two measures are nonetheless correlated: the correlation coefficient of
the natural logarithm of the number of birthplaces represented in the firm and the diversity index is 0.75. We find that the diversity index has a positive effect on the likelihood of product innovations that is
statistically significant at the 5 percent level. The effect is inconclusive for innovations as a whole and
process innovations.
Robustness Checks
We re-estimate the models with a sub-sample that excludes the two sectors that recruit predominantly
unskilled immigrants: Other Business Services and Retail Trade. The purpose of this is to check whether
the impact of the presence of foreigners and the impact of diversity among the foreigners are different in
sectors that do not employ predominantly unskilled migrants. The sub-sample consists of 3645 firms. The
results are reported in Table 6. Many firm and worker characteristics that have a statistically significant
and positive effect on the firms’ probability to innovate are also valid for the sub-sample; namely,
product/services, and process innovations. Firm size, cooperation for innovation, openness to change,
lack of personnel, and prepared knowledge strategy all prove to be important inputs for innovation. All
these variables are positive and significant at the 1 percent level. Additionally, having headquarters
abroad is now also significant for product innovation, but only at the 10 percent level.
Table 6 about here
Interestingly, while Table 4 suggested that the share of foreign employees in total employment has a
negative effect on the innovativeness of firms in the Netherlands, when a sub-sample is taken from the
dataset, the impact of the share of foreigners becomes statistically insignificant for innovations as a
14
whole, and product innovations. However, the same coefficient becomes positive and significant at the 1
percent level for process innovations.
With respect to the different skill and age categories, the results are somewhat different from those in
Table 6. The fraction of scientifically-skilled employees is no longer significant for innovation as a whole.
Similarly, while the share of employees aged 35-44 is still statistically significant in all three columns, the
age group 25-34 is no longer statistically significant in product and process innovations. The share of high-
skilled employees in overall employment level proves to be an important determinant of product
innovations. However, the skill categories do not have an effect on process innovations. This result is
consistent with all the other estimations, and rather plausible, since it could be argued that product
innovations require more technical and scientific knowledge compared with process innovations.14
Our results reconfirm that younger employees make a positive contribution to innovation generally.
Employees between ages the 25-34 and 35-44 are shown to improve the likelihood of a firm to innovate,
although the effect of the former group is not statistically significant for product and process innovations.
On the other hand, the share of employees aged 45-54 has a negative and statistically significant
coefficient for innovations as a whole and process for innovations. This reinforces the expectation that
more youthful firms tend to be more innovative (see also Poot 2008).
With respect to the migration related variables, the share of foreigners is now positive and statistically
significant only in the case of process innovations. Moreover, diversity as measured by the natural
logarithm of the number of countries represented in the firm has a statistically significant positive impact
on process innovation (but only at the 10 percent level). This can be seen in Table 7. Similarly, the effect
of within-firm labour diversity among migrants on product innovations is again positive and statistically
significant at the 5 percent level.15 Hence, we conclude that, concerning the process innovations, every
different culture counts as a positive input, while for product innovation a unique combination of these
different cultures are more relevant in boosting innovativeness. Finally, we also consider a potential
interaction between firm size and the migration variables to test whether the impact of the presence, and
diversity of immigrants differs between large firms and small firms. It was found that the interaction
between the share of foreigners and the natural logarithm of firm size is statistically insignificant.
14
We show in other regressions, not included due to space constraints, that the effect of high-skilled foreign employees (quality of foreign stock at the firm level) on innovativeness is inconclusive on firm level innovativeness. Moreover, the entry year of foreigners does not have an effect on their contribution to innovation. The coefficient of time spent in the Netherlands is statistically insignificant. Many immigrants enter the host country at a young age, and therefore, the age variables might have captured the effect of time spent at the destination. These results are available on request. 15
If these two variables are included at the same time in the three estimations in Table 7, the coefficients of the unique variable and the diversity index are both insignificant for innovations as a whole and for product innovations. Only for process innovations, the natural logarithm of the number of birthplaces has a coefficient of 0.306 which is statistically significant at the 5 percent level; whereas the coefficient of diversity index is -0.582, which is also statistically significant at the 5 percent level.
15
However, the interaction between the diversity index and the log of firm size has a negative coefficient
that is statistically significant at the 5 percent level for product innovations only.
Table 7 about here
Treating Endogeneity Issues
The self-selection of immigrants into the more innovative firms, that perhaps pay better or offer better
career opportunities, can introduce a biased estimation of the relationship between innovativeness and
the foreign employees. To control for the possible bias, we apply a two-stage least squares estimation,
where we employ a couple of instruments to treat the endogeneity of the share of foreigners.
The literature suggests the past stock of immigrants should be used to account for the current stock,
arguing that the economic conditions that attracted the earlier immigrants would not be same as today.
On the other hand, it is widely accepted that new immigrants follow “well trodden paths” in terms of
their location preferences. Consequently, we use the number of allochtoon population by municipalities
in 1996 as the first instrument. That year is the earliest date for which the allochtoon population of the
Netherlands can be disaggregated to the municipal level.
Secondly, the concentration of foreigners in certain localities may create demand for “home goods”. The
migrants can import these products themselves or start producing them in the host country, for example,
by opening restaurants and shops specialized in ethnic cuisines. Although one may argue that the native
population will increasingly demand the same goods due to the demonstration effect, the presence of
such products and services is an externality resulting from the concentration of foreigners in a certain
region. However, at the firm level there is no reason to expect that the innovativeness of firms
determines the location of restaurants offering foreign cuisine. We will, therefore, use the total number
of foreign restaurants per municipality in the year 2000 as an indication of the localization of immigrant
groups. If the total number of foreign restaurants in a region is relatively high, then the number of
foreigners is expected to be high as well. The dataset comes from the HORECA database in the
Netherlands, and was made available at no cost. 16
Together, the two instruments passed the formal exogeneity test, and turn out to to be strong
instruments with t-values equal and higher than 4.8 (i.e. F values greater than 10). Two instruments
together explain about 8 percent of the variation in share of foreigners, and they have no correlation with
any of the dependent variables that are the innovation categories.
16 HORECA is an acronym for Hotels, Restaurants and Cafes. This dataset covers the registered bars, restaurants, hotels and all the other businesses in this sector. The data coverage is good. The data are currently available from 1995 until 2007. The number of foreign restaurants is counted at the municipal level by the nationality of the cuisine, at the time of registry. For each restaurant, the main topographical area is registered; therefore no side kitchens are registered. This leads to unique listing, and excludes double counting.
16
Table 8 presents the results of instrumental variables estimations. The IV estimations include again all the
previous control variables. We include both the diversity index and the share of foreign born employees.
The IV estimation shows that, as in Table 4, the sheer share of foreigners is not a beneficial input that
increases the firms’ probability to innovate. The coefficient of share of foreigners is negative, and
statistically significant for innovations as a whole and product innovations. The other covariates included
in all of the estimations are quite robust to previous findings. However, within firm diversity of foreign
employment impacts always positively and is significant at the 5 percent level for innovations as a whole
and 1 percent for product innovations.
Given the non-linear nature of the probability model, we calculate the magnitude of changes in the
probabilities by plugging in two values that are equally distant from the mean of share of foreigners as
well as the mean of the diversity index. For example, the probability to innovate products rises by 4
percentage points, as a result of going from 0.1 below the mean (0.45) of the index to going to 0.1 above
the mean, holding all other variables at their means. For innovations as a whole, the corresponding
increase is 3 percentage points.17 On the other hand, when the share of foreigners in the firm’s
employment goes from a 1 percentage point decrease to a 1 percentage point increase from its mean of
0.1, the predicted probability to innovate products and innovate overall decreases by 2.4 and 2.6
percentage points respectively. Overall, we observe that when foreigners account for a large share of
employment, a firm is less likely to report innovative activities, but the effect is quantitatively small.
However, diversity among these foreign workers is a very significant booster of innovation.18
Table 8 about here
7. Conclusion
In this paper we have focussed on estimating the impact of immigrant employees on the innovativeness
of Dutch firms. The core data on innovation were obtained from the Community Innovation Survey (CIS)
of 2002. However, this survey provides little information on the size and composition of the workforce of
the firms. Such information was obtained by linking the CIS with administrative data; namely, the Social
17
Ozgen et al. (2011), by using a panel data of 170 NUTS 2 level in twelve European countries, showed that a 0.2 increase around the mean of the diversity index (0.49) increases the regional patent applications by about 4 percent. Here we find that the same increase in the diversity index at the mean increases the probability of all innovation and product innovation by 3 and 4 percentage points respectively. 18 We also predicted the interaction effects between the diversity of the workforce and the share of foreigners in
employment. The interaction effects are statistically inconclusive, while the positive and significant impact of workforce diversity persists for product innovations. Moreover, the negative effect of share of foreigners persists as well. The instrumental variables interaction effects are calculated by means Stata, whereby in the first stage the endogenous variable is regressed on all the covariates and instruments; and in the second stage, the predicted value of the endogenous variable is used to create the interaction term, and then included in the logit estimation.
17
Statistics Database, which – in turn – is made up of tax data, and population registration data at the
municipality level. However, while this linked dataset provided measures of the presence and diversity of
migrants, it provided no direct information on the skill level of the migrants. The latter was obtained by
linking the data to the Dutch Labour Force Survey (EBB). Because the EBB is a representative sample
survey, but not a census, many observations are lost in the linking process. Ultimately, the analysis had to
be restricted to a sample of 4582 firms, employing around 1.3 million workers (and around 15000
workers with known occupations) of whom about 13 percent are foreign born.
The results of the regression analysis confirm many of the determinants of innovation that have been
found repeatedly in previous studies. Larger firms are more innovative. This is true in general, but also
specifically with respect to product innovations and process innovations. Firms that are more open to
change provide a business environment that nurtures creativeness, and that is more conducive to
innovation. However, on the other hand, obstacles to business expansion and profitability also force firms
to seek solutions by means of innovative business practices. Such obstacles can be either a lack of
personnel or a lack of technical know-how. Those businesses that explicitly develop a knowledge strategy
are those that reap the fruits in terms of implementing new product and process innovations. The
regressions showed that such activity requires the relative abundance of medium and high-skilled
employees. In terms of age composition, a relative abundance of employees aged 35-44 boosts
innovativeness, but, intriguingly, an older workforce, particularly in terms of staff aged 45-54, is an
impediment to innovation.
All these factors that determine innovation do not refer specifically to the role of migrants in the
workplace. However, given that migration is highly age-selective, with the majority of adult migrants
being aged between 25 and 45, the results do suggest that firms employing migrants have a more
youthful workforce. The regression results show that this contributes to better outcomes with respect to
innovation.
However, the main purpose of the paper was to investigate whether the explicit presence and diversity of
migrants boosts the innovativeness of firms. Generally speaking, a larger share of foreigners among a
firm’s employees lowers the innovativeness of firms. Only in a sub-sample of firms that excluded other
business services and retail trade (the two sectors in which immigrants are the most unskilled) do we find
a positive effect of an increasing presence of foreign workers on process innovations, significant at the 1
percent level. This is only the case, however, when there is no control for reverse causality, i.e. the fact
that the most innovative firms may be more inclined to recruit workers from a wider labour market,
including those born overseas. Once endogeneity is controlled for by means of valid instruments (the
number of foreign restaurants per municipality, and the historical presence of migrant communities in
the municipality), the impact of the share of foreign workers on the firm’s workforce becomes negative
and statistically significant. This finding is, of course, consistent with neoclassical economic theory: when
there is an abundance of migrant workers with lower reservation wages, firms will develop expansion
strategies that involve the use of labour-intensive production technologies. These technologies tend to be
18
older and well-established. Following existing blueprints for production will imply that fewer resources
will be devoted to innovation.
On the other hand, there is some evidence that greater diversity among the foreign workers stimulates
product or process innovations. Intriguingly, the results are sensitive to the measurement of diversity. A
simple measure of the unique number of foreign countries of birth represented among the firm’s staff,
assumed to be exogenous to the innovation outcomes, has a positive impact on process innovations (at
the 10 percent significance level), but has no impact on product innovations. Conversely, our diversity
index, the opposite of the Herfindahl index of concentration, is with IV estimation positively associated
with innovations generally as well as with product innovations, but not with process innovations. Given
the ever-increasing ease of accessibility to the micro-data in various countries, further research is
encouraged to disentangle the components of diversity measures and the role of migrants in the
innovation process to uncover the causes of this difference.
One of the major limitations of the present study was the small sample size that resulted from the
merging of the firms surveyed in the CIS with the employees surveyed in the Dutch Labour Force Survey.
To overcome this problem, it may be more fruitful to identify additional migrant characteristics from only
the administrative data. Moreover, since the CIS is conducted every two years a panel data set may also
be constructed. This would allow accounting for firm heterogeneity and an alternative means of
establishing causal relationship. These ideas, and the exploration of a wider range of measures of
diversity, are the objective of our future research.
19
References
Acs, Z.J., Groot, H.L.F. de, Nijkamp, P. 2002. The Emergence of the Knowledge Economy: A Regional Perspective Series, Advances in Spatial Science, Springer.
Agrawal, A., Kapur, D., McHale, J. 2008. How do spatial and social proximity influence knowledge flows.
Evidence from patent data, Journal of Urban Economics, 64 (2): 86-111.
Alesina, A., Devleeschauwer, A., Easterly, W., Kurlat, S. and Wacziarg, R. 2003. Fractionalization. Journal of
Economic Growth, 8: 155-194.
Almeida, P., Kogut, B. 1999. Localization of knowledge and the mobility of engineers in regional networks.
Management Science, 45: 905-916.
Audretsch, D.B., Feldman, M.P. 2004 Knowledge spillovers and the geography of innovation, Handbook of
Regional and Urban Economics, 4: 2713-2739.
Alvarez, J., Forrest, D., Sanz, I., Tena, J.D. 2011. Impact of importing foreign talent on performance levels
of local co-workers. Labour Economics. 18: 287–296.
Caragliu, A., Nijkamp, P. 2011. The impact of regional absorptive capacity on spatial knowledge spillovers: The Cohen and Levinthal model revisited. Applied Economics, First published on: 23 February 2011 (iFirst) Clark, T.N., Lloyd, R., Wong, K.K., Jain, P. 2002. Amenities drive urban growth. Journal of Urban Affairs,
24: 493-515.
Cohen, W.M., Levinthal, D.A. 1990. Absorptive capacity: a new perspective on innovation and learning,
Administrative Sciences Quarterly, 35: 128-152.
Cooper, R.G. Edgett, S.J. 2009. Product Innovation and Technology Strategy. Product Development
Institute Inc.
Davenport, T.H. 1993. Process innovation: reengineering work through information technology, Harvard
Business School Press.
Statistics Netherlands. 2009. Documentatierapport CIS 2002V2 (Innovatie-enquête 2000-2002 CIS3,5).No.
090218.
Döring, T., Schnellenbach, J. 2006. What Do We Know about Geographical Knowledge Spillovers and
Regional Growth?: A Survey of the Literature, Regional Studies, 403(3): 375-395.
20
Faggian, A., McCann, P. 2008. Human capital, graduate migration and innovation in British regions.
Cambridge Journal of Economics. 33 (2):317-333.
Florida, R. 2003. Cities and the Creative Class. City & Community. 2:1 March.
Godin, B. 2002. The Rise of Innovation Surveys: Measuring a Fuzzy Concept, Project on the History and Sociology of STI Statistics, Paper No. 16, Communication presented at the International Conference in Honour of K. Pavitt "What We Know About Innovation", 13-15 November 2003, SPRU, University of Sussex, Brighton (UK).
Grossman, G.M., Helpman, E. 1994. Endogenous Innovation in the Theory of Growth. The Journal of
Economic Perspectives, 8 (1): 23-44.
Hunt, J., Gauthier-Loiselle, M. 2008. How Much Does Immigration Boost Innovation? NBER Working Paper
14312, National Bureau of Economic Research, Cambridge Mass.
Jones, CI., Romer, PM. 2010. The New Kaldor Facts: Ideas, Institutions, Population, and Human Capital.
American Economic Journal: Macroeconomics. 2(1): 224-245.
Kerr, W.R. 2010. Breakthrough Inventions and Migrating Clusters of Innovation. Journal of Urban
Economics. 67:46-60.
Kerr, W.R., Lincoln, W. 2010. The Supply Side of Innovation: H1-B Visa Reform and US Ethnic Invention.
NBER Working Paper 15768, National Bureau of Economic Research, Cambridge Mass.
Lee, N., Nathan, M. 2010. Knowledge workers, cultural diversity and Innovation: Evidence from London.
International Journal on Knowledge-Based Development. 1 (½): 53-78.
Lobo, J., Strumsky, D. 2008. Metropolitan patenting, inventor agglomeration and social networks: A tale of two effects. Journal of Urban Economics 63: 871–884.
Mazzolari, F., Neumark D. 2009. Beyond Wages: The Effects of Immigration on the Scale and Composition
of Output. NBER Working paper 14900, National Bureau of Economic Research, Cambridge Mass.
Niebuhr, A. 2010 Migration and Innovation: Does Cultural Diversity Matter for Regional R&D Activity?
Papers in Regional Science, 89: 563–585.
OECD. 2002. International Mobility of the Highly-skilled. Policy Brief, July 2002.
Ozgen, C., Nijkamp, P., Poot, J. 2011. Immigration and Innovation in European Regions. IZA DP No. 5676.
Bonn: IZA Institute for the Study of Labour.
21
Page, S. 2007. The Difference: How the Power of Diversity Creates Better Groups, Firms, Schools, and
Societies. Princeton University Press.
Parotta, P., Pozzoli, D., Pytlikova, M. 2011. The Nexus between Labour Diversity and Firm’s Innovation.
Norface Migration Discussion Paper No. 2011-5, www.norface-migration.org.
Poot, J. 2008. Demographic change and regional competitiveness: The effects of immigration and ageing.
International Journal of Foresight and Innovation Policy, 4(½): 129-145.
Prat, A. 2002. Should a team be homogeneous?. European Economic Review, 46; 1187-1207.
Romer, P. 1993. Idea gaps and object gaps in economic development. Journal of Monetary Economics, 32:
543-573.
Romer, P.M. 1990. Endogenous Technological Change. Journal of Political Economy, 98 (2): S71-S102.
Saxenian, A.L. 2006. The New Argonauts: Regional Advantage in a Global Economy. Cambridge, MA,
Harvard University Press.
Shapiro, J.M. 2003. Smart Cities: Explaining the Relationship between City Growth and Human Capital. National Bureau of Economic Research Working paper (June 13).
Simonen, J., McCann, P. 2008. Firm innovation− The influence of R&D cooperation and the geography of
human capital inputs, Journal of Urban Economics, 64 (1): 146-154.
Südekum, J., Wolf, K., Blien, U. 2009. Cultural Diversity and Local Labour Markets, IZA Discussion paper
4619.
Brunow, S., Südekum, J., Trax, M. 2011. Cultural diversity and plant productivity. Paper presented at the
51st European Congress of the Regional Science Association International, Barcelona, 30th August – 3rd
September.
Zucker, L.G., Darby, M.R. 2007. Star Scientists, Innovation and Regional and National Immigration. NBER
Working Paper 13547, National Bureau of Economic Research, Cambridge Mass.
22
Data Appendix
Social Statistics Survey
The unit records of the Social Statistics Survey database are very detailed and informative about 10
million jobs per year (a job is a matched combination of employer/business entity data with employee
data and recorded start/end date, if applicable). The job data include the location of residence and work
of an employee, information on the labour market and income level. In the case of a non-native
employee, we are informed about the year of entry in the Netherlands. Municipality registrations (GBA)
are a natural extension of the Social Statistics Survey provided by Statistics Netherlands, and allow us to
calculate the exact number of employees per firm at the municipal level, when combined with the tax
data (REOS).
Community Innovation Survey
The Community Innovation Survey (CIS) is conducted every two years (in even years). Sets of micro-data
available cover the decade 1996 to 2006. To create the sample used for the CIS 3.5, enterprises were
selected from the Business Registers maintained at Statistics Netherlands. The sample selection was
described in the Methodology section of this paper. CIS provides extensive information on the innovating
activities of firms in the Netherlands; and their resources, and motivations and problems. In this study we
use the CIS 3.5 version, in other words, the survey conducted in the period 2000-2002, where the final
reporting year is 2002. This version of the survey includes 10533 firms. Each firm has a firm identification
number ‘BEID’. The continuity of surveys provides a regular snapshot of various aspects of innovation. It is
not only informative about technological innovations on new products/services and goods, but also
includes a certain amount of information on non-technological/business/organizational changes and
newness. The survey allows us to classify firms by 5-digit ‘SBI93’ codes that stand for Standard Industrial
Classification of Statistics Netherlands, and these codes are directly analogous with the 2-digit NACE
codes. The survey in principle addresses the characteristics of the firms in terms 5 themes. These are:
1. General Business Information;
2. Product (Goods/Service) Innovation;
3. Process Innovation (new or significantly improved methods for the production or supply of
products);
4. Innovation Related Activity (R&D, cooperation for innovation, marketing innovations);
5. Strategic Innovation (new management techniques, organisation structure, marketing concepts or strategies).
The questions that inquire about the innovativeness of the firms are measuring innovation as an activity
rather than as an output (Godin, 2002). There are no particular questions regarding the number of
inventions. However, the survey is informative about the ongoing innovation processes, cancellations,
and reasons for cancellations, or postponed activities.
23
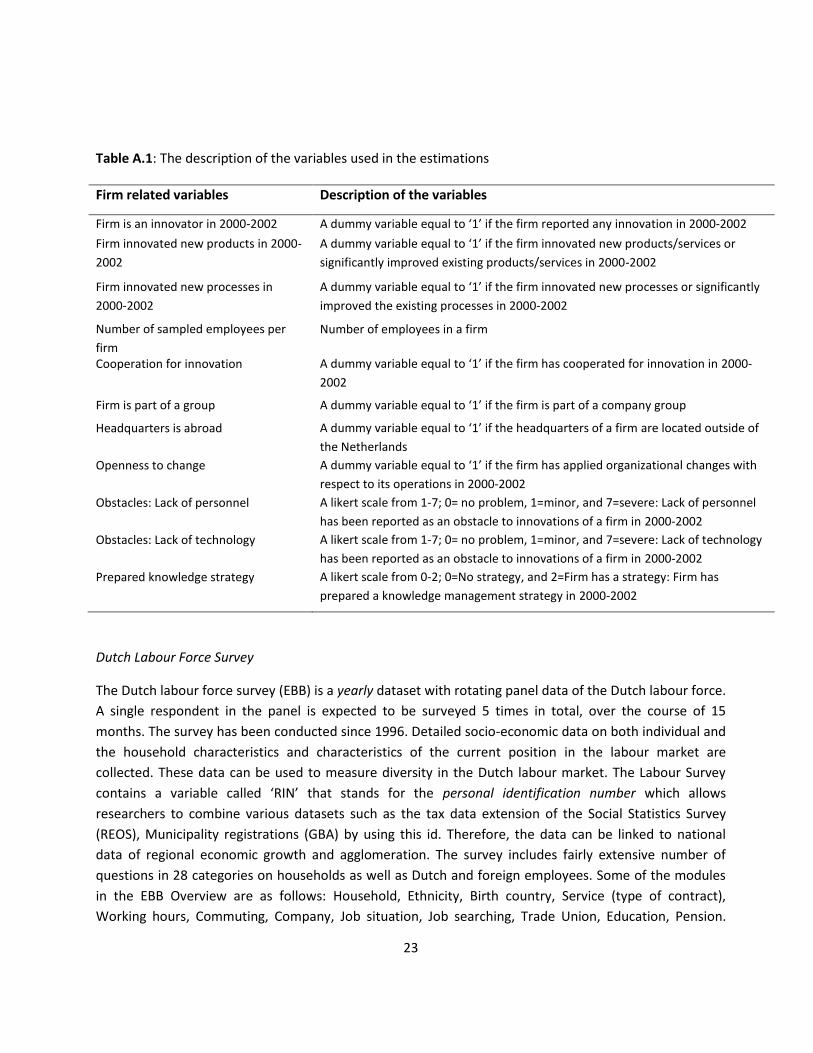
Table A.1: The description of the variables used in the estimations
Firm related variables Description of the variables
Firm is an innovator in 2000-2002 A dummy variable equal to ‘1’ if the firm reported any innovation in 2000-2002
Firm innovated new products in 2000-
2002
A dummy variable equal to ‘1’ if the firm innovated new products/services or
significantly improved existing products/services in 2000-2002
Firm innovated new processes in
2000-2002
A dummy variable equal to ‘1’ if the firm innovated new processes or significantly
improved the existing processes in 2000-2002
Number of sampled employees per
firm
Number of employees in a firm
Cooperation for innovation A dummy variable equal to ‘1’ if the firm has cooperated for innovation in 2000-
2002
Firm is part of a group A dummy variable equal to ‘1’ if the firm is part of a company group
Headquarters is abroad A dummy variable equal to ‘1’ if the headquarters of a firm are located outside of
the Netherlands
Openness to change A dummy variable equal to ‘1’ if the firm has applied organizational changes with
respect to its operations in 2000-2002
Obstacles: Lack of personnel A likert scale from 1-7; 0= no problem, 1=minor, and 7=severe: Lack of personnel
has been reported as an obstacle to innovations of a firm in 2000-2002
Obstacles: Lack of technology A likert scale from 1-7; 0= no problem, 1=minor, and 7=severe: Lack of technology
has been reported as an obstacle to innovations of a firm in 2000-2002
Prepared knowledge strategy A likert scale from 0-2; 0=No strategy, and 2=Firm has a strategy: Firm has
prepared a knowledge management strategy in 2000-2002
Dutch Labour Force Survey
The Dutch labour force survey (EBB) is a yearly dataset with rotating panel data of the Dutch labour force.
A single respondent in the panel is expected to be surveyed 5 times in total, over the course of 15
months. The survey has been conducted since 1996. Detailed socio-economic data on both individual and
the household characteristics and characteristics of the current position in the labour market are
collected. These data can be used to measure diversity in the Dutch labour market. The Labour Survey
contains a variable called ‘RIN’ that stands for the personal identification number which allows
researchers to combine various datasets such as the tax data extension of the Social Statistics Survey
(REOS), Municipality registrations (GBA) by using this id. Therefore, the data can be linked to national
data of regional economic growth and agglomeration. The survey includes fairly extensive number of
questions in 28 categories on households as well as Dutch and foreign employees. Some of the modules
in the EBB Overview are as follows: Household, Ethnicity, Birth country, Service (type of contract),
Working hours, Commuting, Company, Job situation, Job searching, Trade Union, Education, Pension.
24
Figure 1: Histogram of the Firm Size Distribution Note: Truncated to firms with 1000 employees or less. The largest firm in the full sample has 77,744 employees.
Figure 2: Distribution of Foreigners by Region of Birth
25
Table 1: The Stages of Data Merges and Number of Observations at Every Stage
Datasets # of Employees # of Firms # of Foreign Employees
CIS 2002 (Version 2)1 NA 10533 NA
CIS_REOS_GBA 1603709 9687 217444
CIS_REOS_GBA_EBB 1362139 4638 187277
CIS_REOS_GBA_EBB with occupation identified 15453 4638 1373 1 The response rate of firms in CIS 2000-2002 survey is 62%.
Table 2: The Distribution of Macro-sectors by the Number of Firms in the CIS_REOS_GBA_EBB dataset
Macrosectors Sector Name Number of firms
percent in Total Number of Firms
0 Agriculture, Forestry and Fishery* 78 0.02 1 Mining and Quarrying 12 0.00
2 Food, Beverage and Tobacco 181 0.04
3 Textile, Clothes and Leather 52 0.01
4 Wood, Paper and Pulp 204 0.04
5 Chemicals 277 0.06
6 Metals 223 0.05
7 Machinery and Equipment 376 0.08
8 Manufacturing n.e.c. 119 0.03
9 Electricity, Gas and Water 30 0.01
10 Construction 511 0.11
11 Wholesale Trade and Repair 693 0.15
12 Retail Trade 292 0.06
13 Hotels and Restaurants 123 0.03
14 Transport and Communication 398 0.09
15 Financial Intermediation 78 0.02
16 Real Estate and Renting of Machinery 115 0.02
17 Computer and Related 105 0.02
18 Research and Development 22 0.00
19 Other Business Services 655 0.14
20 Environmental Services 40 0.01
21 Other Services 54 0.01
Total 4638 1.00
* This sector is the reference category in the multivariate analysis.
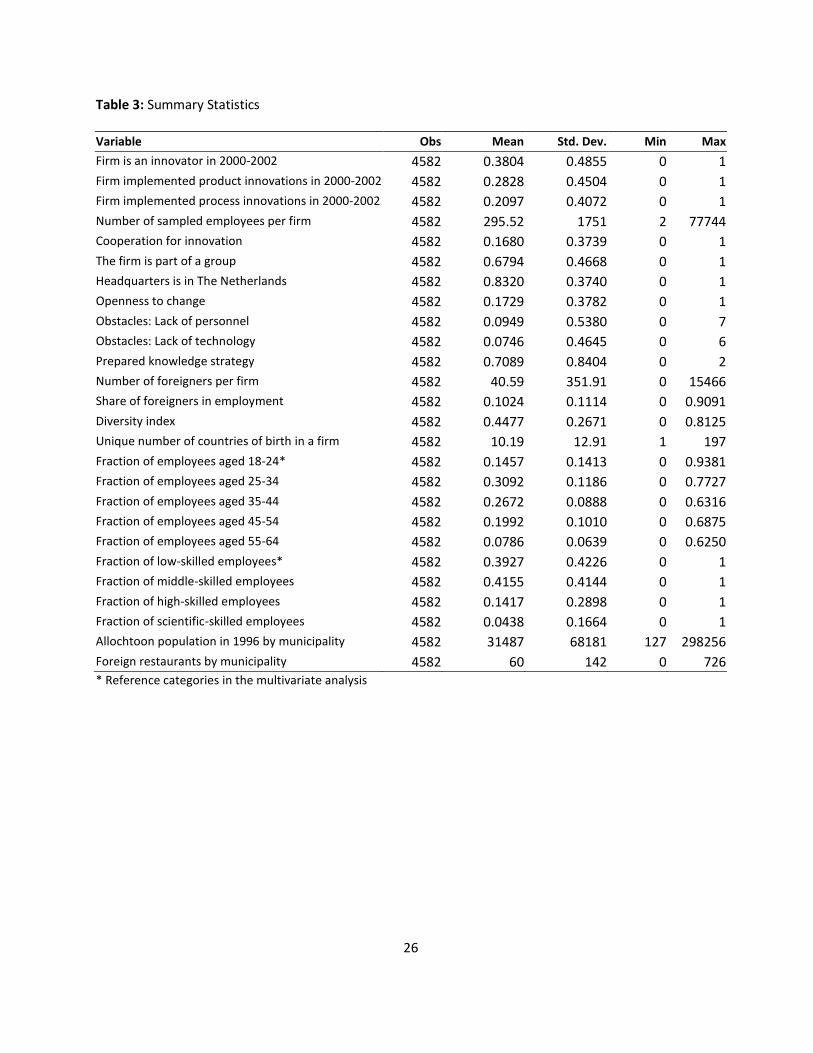
26
Table 3: Summary Statistics
Variable Obs Mean Std. Dev. Min Max
Firm is an innovator in 2000-2002 4582 0.3804 0.4855 0 1
Firm implemented product innovations in 2000-2002 4582 0.2828 0.4504 0 1
Firm implemented process innovations in 2000-2002 4582 0.2097 0.4072 0 1
Number of sampled employees per firm 4582 295.52 1751 2 77744
Cooperation for innovation 4582 0.1680 0.3739 0 1
The firm is part of a group 4582 0.6794 0.4668 0 1
Headquarters is in The Netherlands 4582 0.8320 0.3740 0 1
Openness to change 4582 0.1729 0.3782 0 1
Obstacles: Lack of personnel 4582 0.0949 0.5380 0 7
Obstacles: Lack of technology 4582 0.0746 0.4645 0 6
Prepared knowledge strategy 4582 0.7089 0.8404 0 2
Number of foreigners per firm 4582 40.59 351.91 0 15466
Share of foreigners in employment 4582 0.1024 0.1114 0 0.9091
Diversity index 4582 0.4477 0.2671 0 0.8125
Unique number of countries of birth in a firm 4582 10.19 12.91 1 197
Fraction of employees aged 18-24* 4582 0.1457 0.1413 0 0.9381
Fraction of employees aged 25-34 4582 0.3092 0.1186 0 0.7727
Fraction of employees aged 35-44 4582 0.2672 0.0888 0 0.6316
Fraction of employees aged 45-54 4582 0.1992 0.1010 0 0.6875
Fraction of employees aged 55-64 4582 0.0786 0.0639 0 0.6250
Fraction of low-skilled employees* 4582 0.3927 0.4226 0 1
Fraction of middle-skilled employees 4582 0.4155 0.4144 0 1
Fraction of high-skilled employees 4582 0.1417 0.2898 0 1
Fraction of scientific-skilled employees 4582 0.0438 0.1664 0 1
Allochtoon population in 1996 by municipality 4582 31487 68181 127 298256
Foreign restaurants by municipality 4582 60 142 0 726 * Reference categories in the multivariate analysis
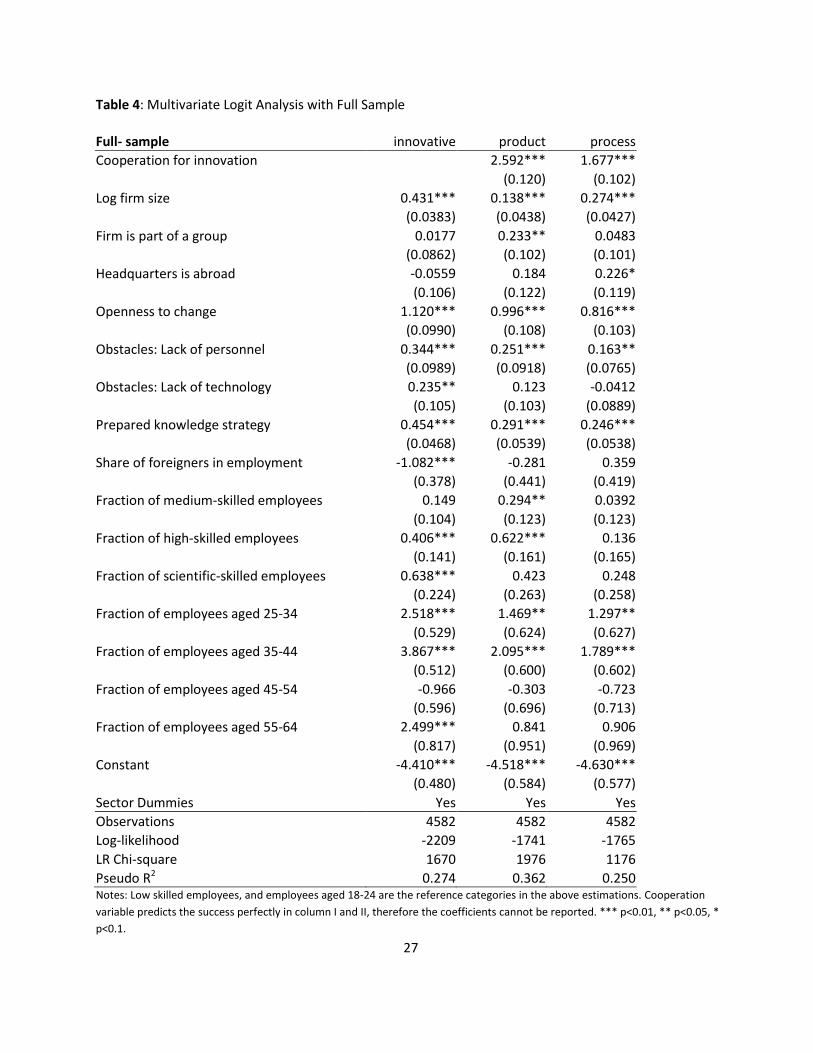
27
Table 4: Multivariate Logit Analysis with Full Sample
Full- sample innovative product process
Cooperation for innovation 2.592*** 1.677***
(0.120) (0.102)
Log firm size 0.431*** 0.138*** 0.274***
(0.0383) (0.0438) (0.0427)
Firm is part of a group 0.0177 0.233** 0.0483
(0.0862) (0.102) (0.101)
Headquarters is abroad -0.0559 0.184 0.226*
(0.106) (0.122) (0.119)
Openness to change 1.120*** 0.996*** 0.816***
(0.0990) (0.108) (0.103)
Obstacles: Lack of personnel 0.344*** 0.251*** 0.163**
(0.0989) (0.0918) (0.0765)
Obstacles: Lack of technology 0.235** 0.123 -0.0412
(0.105) (0.103) (0.0889)
Prepared knowledge strategy 0.454*** 0.291*** 0.246***
(0.0468) (0.0539) (0.0538)
Share of foreigners in employment -1.082*** -0.281 0.359
(0.378) (0.441) (0.419)
Fraction of medium-skilled employees 0.149 0.294** 0.0392
(0.104) (0.123) (0.123)
Fraction of high-skilled employees 0.406*** 0.622*** 0.136
(0.141) (0.161) (0.165)
Fraction of scientific-skilled employees 0.638*** 0.423 0.248
(0.224) (0.263) (0.258)
Fraction of employees aged 25-34 2.518*** 1.469** 1.297**
(0.529) (0.624) (0.627)
Fraction of employees aged 35-44 3.867*** 2.095*** 1.789***
(0.512) (0.600) (0.602)
Fraction of employees aged 45-54 -0.966 -0.303 -0.723
(0.596) (0.696) (0.713)
Fraction of employees aged 55-64 2.499*** 0.841 0.906
(0.817) (0.951) (0.969)
Constant -4.410*** -4.518*** -4.630***
(0.480) (0.584) (0.577)
Sector Dummies Yes Yes Yes
Observations 4582 4582 4582
Log-likelihood -2209 -1741 -1765
LR Chi-square 1670 1976 1176
Pseudo R2 0.274 0.362 0.250 Notes: Low skilled employees, and employees aged 18-24 are the reference categories in the above estimations. Cooperation
variable predicts the success perfectly in column I and II, therefore the coefficients cannot be reported. *** p<0.01, ** p<0.05, *
p<0.1.

28
Table 5: Estimations with the Full Sample, including Diversity Measures
α These estimations include all the other variables in the Table 4. The results for these variables are robust to the introduction of
the diversity measures. *** p<0.01, ** p<0.05, * p<0.1.
Full-sampleα innovative product process
ln(unique) -0.054 0.045 0.048
(0.066) (0.078) (0.08)
N 4582 4582 4582
innovative product process
Diversity index (excl. Netherlands born) 0.266 0.417** 0.037
(0.175) (0.205) (0.209)
N 4582 4582 4582
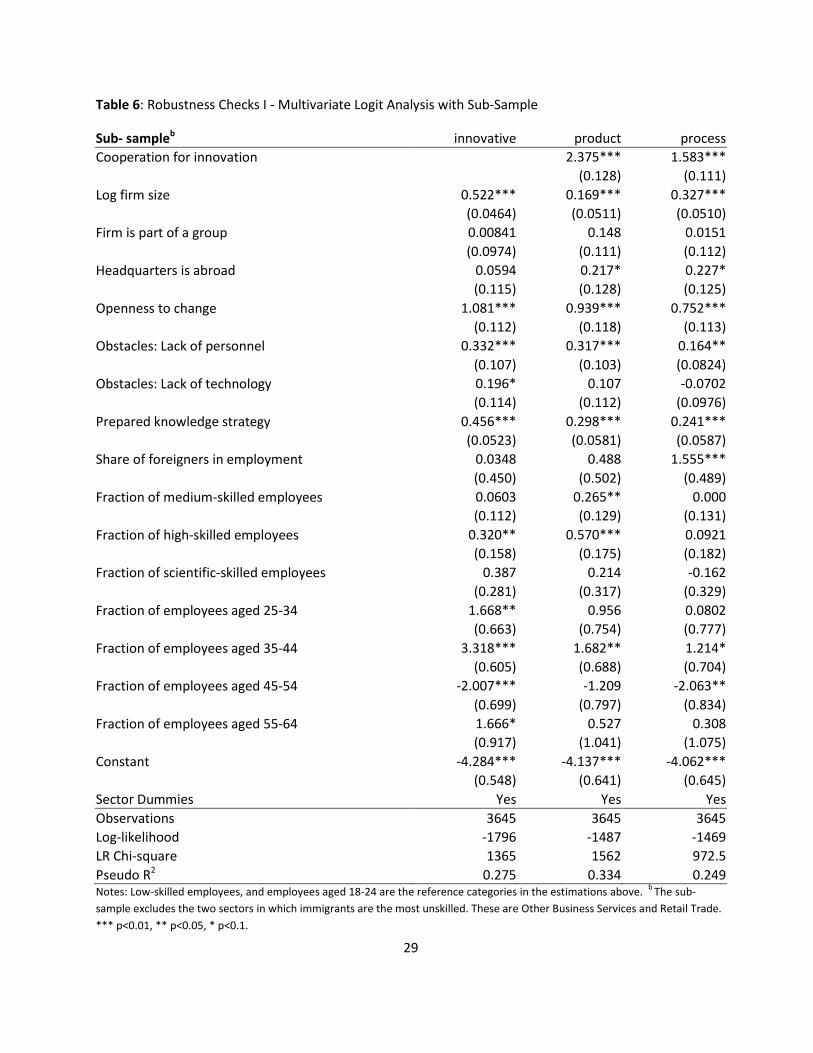
29
Table 6: Robustness Checks I - Multivariate Logit Analysis with Sub-Sample
Sub- sampleb innovative product process
Cooperation for innovation 2.375*** 1.583***
(0.128) (0.111)
Log firm size 0.522*** 0.169*** 0.327***
(0.0464) (0.0511) (0.0510)
Firm is part of a group 0.00841 0.148 0.0151
(0.0974) (0.111) (0.112)
Headquarters is abroad 0.0594 0.217* 0.227*
(0.115) (0.128) (0.125)
Openness to change 1.081*** 0.939*** 0.752***
(0.112) (0.118) (0.113)
Obstacles: Lack of personnel 0.332*** 0.317*** 0.164**
(0.107) (0.103) (0.0824)
Obstacles: Lack of technology 0.196* 0.107 -0.0702
(0.114) (0.112) (0.0976)
Prepared knowledge strategy 0.456*** 0.298*** 0.241***
(0.0523) (0.0581) (0.0587)
Share of foreigners in employment 0.0348 0.488 1.555***
(0.450) (0.502) (0.489)
Fraction of medium-skilled employees 0.0603 0.265** 0.000
(0.112) (0.129) (0.131)
Fraction of high-skilled employees 0.320** 0.570*** 0.0921
(0.158) (0.175) (0.182)
Fraction of scientific-skilled employees 0.387 0.214 -0.162
(0.281) (0.317) (0.329)
Fraction of employees aged 25-34 1.668** 0.956 0.0802
(0.663) (0.754) (0.777)
Fraction of employees aged 35-44 3.318*** 1.682** 1.214*
(0.605) (0.688) (0.704)
Fraction of employees aged 45-54 -2.007*** -1.209 -2.063**
(0.699) (0.797) (0.834)
Fraction of employees aged 55-64 1.666* 0.527 0.308
(0.917) (1.041) (1.075)
Constant -4.284*** -4.137*** -4.062***
(0.548) (0.641) (0.645)
Sector Dummies Yes Yes Yes
Observations 3645 3645 3645
Log-likelihood -1796 -1487 -1469
LR Chi-square 1365 1562 972.5
Pseudo R2 0.275 0.334 0.249 Notes: Low-skilled employees, and employees aged 18-24 are the reference categories in the estimations above.
b The sub-
sample excludes the two sectors in which immigrants are the most unskilled. These are Other Business Services and Retail Trade.
*** p<0.01, ** p<0.05, * p<0.1.
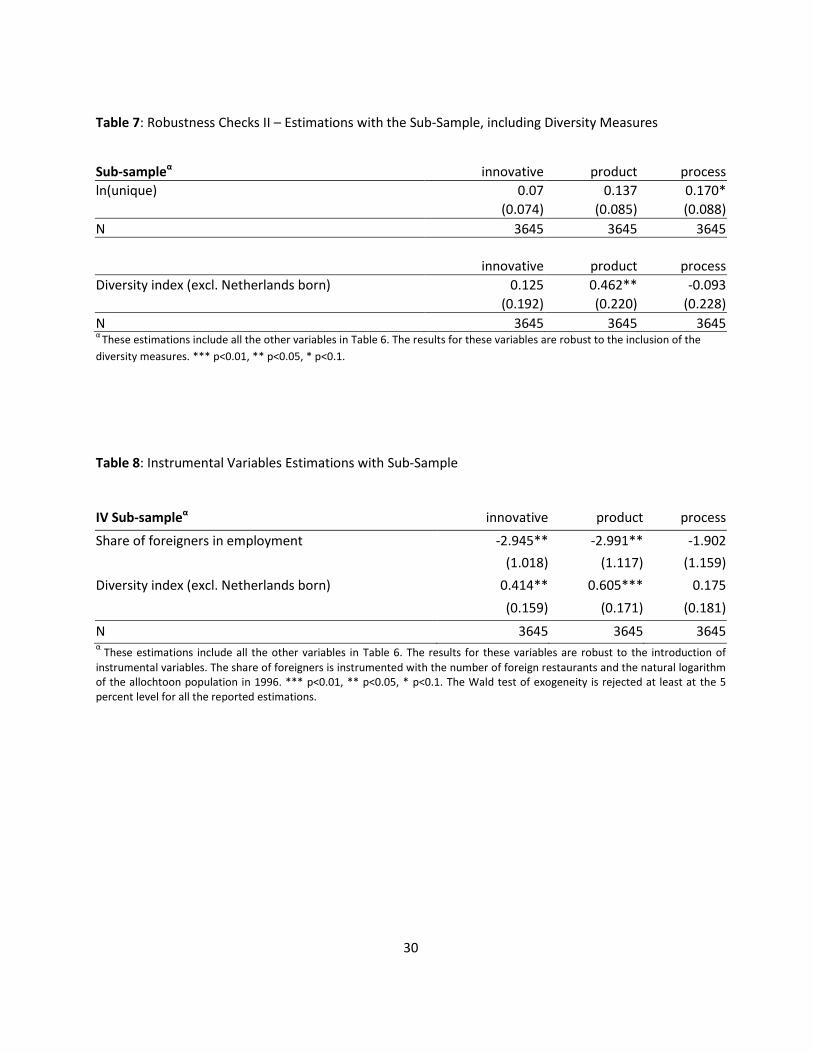
30
Table 7: Robustness Checks II – Estimations with the Sub-Sample, including Diversity Measures
Sub-sampleα innovative product process
ln(unique) 0.07 0.137 0.170*
(0.074) (0.085) (0.088)
N 3645 3645 3645
innovative product process
Diversity index (excl. Netherlands born) 0.125 0.462** -0.093
(0.192) (0.220) (0.228)
N 3645 3645 3645 α
These estimations include all the other variables in Table 6. The results for these variables are robust to the inclusion of the
diversity measures. *** p<0.01, ** p<0.05, * p<0.1.
Table 8: Instrumental Variables Estimations with Sub-Sample
IV Sub-sampleα innovative product process
Share of foreigners in employment -2.945** -2.991** -1.902
(1.018) (1.117) (1.159)
Diversity index (excl. Netherlands born) 0.414** 0.605*** 0.175
(0.159) (0.171) (0.181)
N 3645 3645 3645 α
These estimations include all the other variables in Table 6. The results for these variables are robust to the introduction of
instrumental variables. The share of foreigners is instrumented with the number of foreign restaurants and the natural logarithm of the allochtoon population in 1996. *** p<0.01, ** p<0.05, * p<0.1. The Wald test of exogeneity is rejected at least at the 5 percent level for all the reported estimations.