Embed Size (px)
Citation preview

The Economic Value of Cultural Diversity:
Evidence from US Cities∗
Gianmarco I.P. Ottaviano (Universita di Bologna, FEEM and CEPR)Giovanni Peri (UC Davis and CESifo)
December 2003
Abstract
We use data on wages and rents in different U.S. cities to assess theamenity effects on production and consumption of cultural diversity asmeasured by diversity of countries of birth of city residents. We showthat US-born citizens living in metropolitan areas where the share offoreign-born increased between 1970 and 1990 have experienced a sig-nificant average increase in their wage and in the rental price of theirhousing. Such finding is economically significant and robust to omittedvariable bias and endogeneity bias. We then present a model in whichcultural diversity may have both production and consumption amenityor disamenity effects. As people and firms are mobile across cities in thelong run, the model implies that the joint results from the wage and rentregressions are consistent with a dominant production amenity effect ofcultural diversity.
Key Words: Cultural Diversity, Productivity, Local Amenities, Ur-ban Economics
JEL Classification Codes: O4, R0, F1
∗Addresses: Gianmarco I.P. Ottaviano, Department of Economics, University of Bologna,Strada Maggiore 45, 40125 Bologna, Italy. Phone: +39-051-2092602. Email: [email protected]. Giovanni Peri, Department of Economics, University of Califor-nia, Davis, One Shield Avenue, Davis, Ca, 95616, USA. Phone: +1-530-756-3593. Email:[email protected]. We are grateful to Alberto Alesina, Richard Arnott, Liz Cascio, MasaFujita, Ed Glaeser, Vernon Henderson, Eliana LaFerrara, Doug Miller, Dino Pinelli as wellas workshop participants at FEEM Milan, RSAI Philadelphia, and UBC Vancouver for help-ful discussions and suggestions. We thank Elena Bellini for outstanding research assistanceand Paola Franceschi for her extremely competent assistance in editing the paper. Financialsupport from Bocconi University and FEEM is gratefully acknowledged. Errors are ours.
1

1 Introduction
In recent years there has been a resurgence of international migration directedto industrialized countries. As a consequence, the share of foreign-born resi-dents has increased dramatically in the population of traditionally ‘receivingcountries’, such as the United States, as well as of several European countries(most notably, France, Germany, and the UK; more recently, Italy, Spain, andAustria). Rising immigrant pressures in industrialized countries have generatedan intense policy debate on the opportunity of imposing additional restrictionson legal and illegal migration flows.The debate has been accompanied by a large empirical literature on the
consequences of migration (see, e.g. Borjas, 1994, 1995; Boeri, Hanson and Mc-Cormick, 2002, Card 1990, 2001). Such literature has mostly focused on theshort-run distributional consequences of migration in terms of lower wages andhigher unemployment for unskilled natives, and on the rising costs of social se-curity resulting from the inflow of relatively unskilled labor. A similar emphasisalso characterizes the discussion on the long-run consequences of immigrationthat has been mainly framed within the neoclassical growth model (see, e.g.,Dolado et al., 1994; Barro and Sala-i-Martin, 1995; Canova and Ravn, 2000).From such perspective, international immigration is assimilated to an increasein the rate of growth of the unskilled labour force resulting in a dilution of phys-ical and human capital in the receiving countries. Migration has been studied asa mechanism that fosters convergence in income per capita and wages betweencapital-abundant receiving countries and capital-scarce sending ones.Our work takes a different angle in looking at this issue. Rather than study-
ing the short-run effects of new immigration on the receiving country in a classicmodel of skill supply and demand, we consider a multi-city model of productionand consumption and we ask what is the value of the cultural diversity thatforeign-born bring to each city. If cultural diversity is a city characteristic (cer-tainly endogenous) we can learn about its value from the long-run equilibriumdistribution of wages and prices across cities.Diversity over several dimensions has been praised by economists as valuable
in consumption and production. Jacobs (1969) attributes the success of citiesto their industrial diversity. Glaeser et al. (2001) identify in the diversityof available consumption goods one of the attractive features of cities. Moregenerally, Fujita et al (1999) use ‘love of variety’ in preferences and technologyas the building block of their theory of spatial development.We believe that cultural diversity may very well be an important aspect of
diversity with consequences on production as well as consumption. The aim ofthis paper is to quantify the value of cultural diversity, as measured by the pres-ence of foreign-born in a city, to US-born people. “It’s hard to put a number onbuzz but there must be some value” (Richard Freeman, cited by The Economist,2002). Who can deny that Italian restaurants, French beauty shops, Germanbreweries, Belgian chocolate stores, Russian ballets, Indian tea houses and Thaimassages constitute valuable consumption amenities inaccessible to Americanswere not for their foreign-born residents? Similarly the skills and abilities of
2
foreign-born workers and thinkers may complement those of native workers andthus boost problem solving and efficiency on the workplace.1 Cultural diversitywould act as a production amenity in this case. On the other hand, natives maynot like to live in a multicultural environment in so far as this may endangertheir own cultural values or intercultural frictions may reduce their productivity.Cultural diversity would, then, act as a consumption or production disamenityrespectively.We focus on cities in the US as a natural laboratory, the reason being that
cultural diversity has long been one of the hallmarks of US society. For thisreason, our analysis on US cities serves as a benchmark for studies on otherdeveloped countries in Europe and Asia that are becoming increasingly diversedue to recent inflows of foreign workers. As US-born people are highly mobileacross US cities, following Roback (1982) we develop a model of a multiculturalsystem of open cities that allows us to use the observed variations of wages andrents of US-born workers to identify the nature of the externalities associatedwith cultural diversity. Our main finding is that, on average, US-born citizensattribute a dominant production amenity value to cultural diversity. We believethat this result is interesting, robust and new in the literature.The rest of the paper is organized as follows. Section 2 reviews the literature
on the economic consequences of cultural diversity. Section 3 introduces ourdataset of 160 US metropolitan areas during the period 1970-1990 and surveysthe main stylized facts: cultural diversity in a city is significantly positivelycorrelated with the average wage and rent of US-born citizens in that city.Section 4 develops the theoretical model that is used to design our estimationstrategy in terms of joint wage and rent equations. Section 5 runs the regressionsand checks the results for robustness and endogeneity. Section 6 discusses theresults and concludes.
2 Literature on Diversity
Cultural diversity and its effects, often defined in specific ways, have attractedthe attention of many applied economists for a long time. The applied ‘labor’ lit-erature has analyzed ethnic diversity and ethnic ‘segregation’ in the U.S. as wellas its impact on economic discrimination and the achievements of minorities.The focus of attention has often been the black-white gap. Few examples amongmany contributions are Card and Krueger (1992), (1993), Cutler and Glaeser(1997), Arrow (1998), Eckstein and Wolpin (1999), Mason (2000). While theblack-white issue can be reduced to different ‘countries of origin’ going far backin the past, this paper does not focus on this aspect of cultural diversity. Wecontrol for black-white composition issues but we never focus on them.
1The anedoctical evidence of the contribution of foreign born to ‘big thinking’ in the US isquite rich. One striking example is the following. In the last ten years, out of the 47 US-basedNobel laureates in Chemistry, Physics and Medicine, 25 per cent (14 laureates) were not US-born. During the same time period the share of foreign-born in the general population was onaverage only 13 per cent. From our perspective, such example is interesting because researchin hard sciences is typically based on large team work.
3

Much more closely related to our analysis is the literature on the impact ofimmigration on the US labor market. Several contributions by George Borjas(1994), (1995), and (1999) focus on the issue of new immigrants into the USand their effect on native workers. Similarly important contributions by DavidCard (notably, Card, 1990; Card and Di Nardo, 2000; Card, 2001) analyze thereactions of domestic workers and their wages to inflows of new immigrants.These contributions do not seem to achieve a consensus view either on the ef-fect of new immigrants on wages of low skilled domestic workers (which seems,however, small) or on the effect of new immigrants on the migration behavior ofdomestic workers. More recently, quite convincing evidence of a positive effectof immigrant inflows on rents in cities has been provided by Saiz (2003a,b). Allthese studies share some common features especially in terms of their method-ological approach. They all focus on the impact of new immigrants on wages(rents) and domestic migration in the short run (within years) and use a classicframe of labor demand-supply to analyze the effects. They assume that im-migrant and domestic workers, within a skill group, are homogeneous so thatimmigration is a shift in labor supply, which affects local wages (rents) moreor less depending on the mobility of domestic workers. Our approach takes arather different stand. We consider that being ‘foreign-born’ is a feature thatpermanently differentiates individuals (either new or old immigrants) in termsof their non-market attributes and such feature may have consumption andproduction amenity (or disamenity) value for US-born workers. Moreover, weconsider long-run variations of wages and rents relying on the assumption ofperfect mobility of US-born workers and firms across cities in the long run.Fewer contributions have focused on other aspects of diversity (cultural and
linguistic) or looked at its relationships with productivity and welfare of US-bornpeople. Most of the studies focus on the downside of diversity in terms of itsstatic costs associated with lack of communication and transaction barriers. Forexample, Lazear (1995) assumes that a common culture and a common languagefacilitate exchange and trade between individuals. He argues that minoritieshave incentives to become assimilated and to learn the language of the majorityin order to participate into a larger pool of potential trading partners. In hismodel, as individuals do not properly internalize the social value of assimilation,multiculturalism is bad. Alesina, Baqir and Easterly (1999) look at the relationbetween the heterogeneity of preferences and the provision of public goods inUS cities. They show that the share of spending on productive public goodsis inversely related to the ethnic fragmentation of cities even after controllingfor other socioeconomic and demographic determinants. Here again culturaldiversity is bad.Interestingly, and related to our work, several researchers in social sciences
have related diversity with urban agglomerations. The functioning and thrivingof urban clusters seem to rely on the effective interaction of many units whichare ‘diverse’ in many respects. A first example is given by urban studies. Jacobs(1969) sees economic diversity as the key factor of a city’s success. Sassen (1994)studies ‘global cities’ - such as London, Paris, New York, and Tokyo - and theirstrategic role in the development of activities that are central to world economic
4

growth and innovation, such as finance and specialized services. A key featureof these cities is the cultural diversity of their populations. Similarly, Bairoch(1998) sees cities and their diversity as the engine of economic growth. Suchdiversity, however, has been mainly investigated in terms of diversified provisionof consumers’ goods and services as well as productive inputs (see, e.g., Quigley,1998; Glaeser et al., 2001). In his work at the interface between sociologyand economics, Richard Florida (2003) argues that ‘diverse’ and tolerant cities,populated by artists, bohemians, and other creative people are also the mostinnovative cities in terms of high tech sectors. Our analysis of the role of culturaldiversity is an extension of these lines of research.Another literature is also potentially relevant to our work in that it mo-
tivates the positive ‘production value’ of diversity. It consists of studies onthe organization and the management of teams. A standard assumption isthat diversity leads to more innovation and creativity because diversity impliesdifferent ways of framing problems, a richer set of alternative solutions, andtherefore higher quality decisions. Lazear (1999) provides an attempt to modelteam interactions. He defines the ‘global firm’ as a team whose members comefrom different cultures or countries. Combining workers who have different cul-tures, legal systems, and languages imposes costs on the firm that would notbe present if all the workers were similar. However, complementarity betweenworkers, in terms of disjoint and relevant skills, offsets the costs of cross-culturalinteraction.2 Here, again, multiculturalism is good.Finally, there is a strand of studies in political economics that looks at
the historical effects of cultural and ethnic diversity on the formation and thebehavior of institutions. Across countries, the extent of government corruption,bureaucratic red tape, and black market activities as well as the protection ofproperty rights seem to be all affected by the degree of ethnical fragmentation.The traditional wisdom (confirmed by Easterly and Levine, 1997) used to be thatmore fragmented (i.e. diverse) societies promote more conflict and predatorybehavior, and generate less growth. However, recent studies have questionedthat logic by showing that higher ethnic diversity is not harmful to economicdevelopment (see, e.g., Liam and Oneal, 1997). Collier (2001) actually findsthat, as long as their institutions are democratic, fractionalized societies havebetter economic performance in their private sector than more homogenousones. In our work we take institutions as given and equal across US cities andwe only look at the effect of diversity on production and consumption withinsuch institutional framework. It is interesting to notice, however, that alsofrom a historical perspective the issue of how diversity affects productivity anddevelopment is still somewhat controversial.
2Fujita and Berliant (2003) model ‘assimilation’as a result of team work: the very processof cooperative knowledge creation reduces the heterogeneity of team members through the ac-cumulation of knowledge in common. Under this respect, a perpetual reallocation of membersacross different teams may be necessary to keep creativity alive.
5

3 Cultural Diversity, Wages and Rents
This paper takes a very US-based approach to the issue of cultural diversity.The question we are interested in is: What is there in cultural diversity for theUS-born people ? Do they benefit at all from the presence of foreign-born? Dothey value it? If they do, how do we measure such benefits?Our analysis extracts the answers to those questions from the equilibrium
outcome deriving from the implicit evaluation of diversity that the US-bornmake by ‘voting with their feet’. The underlying assumption is that US-bornworkers and US firms are very mobile across cities in the long run. This assump-tion is motivated by extensive empirical evidence that shows very large grossmigration flows across states and cities. For instance, using census data, wecalculate that 36% of the population moved from one state to another between1985 and 1990. As people respond to changes in the local working and livingenvironment of cities, the wage and rent variations that we observe in the longrun should reflect a spatial equilibrium: workers and firms are indifferent amongalternative locations because they have eliminated any systematic difference inindirect utility and profits through migration.3 While postponing the formal-ization of these ideas to Section 4, here we introduce our measure of culturaldiversity and present some suggestive stylized facts about its relationship withaverage wages and rents in US cities.
3.1 Data and Diversity Index
Data at the Metropolitan Statistical Area (MSA) level for the United Statesare available from different sources. We use mostly the Census Public UseMicrodata Sample (PUMS) for year 1971 and 1991 in order to calculate wagesand rents for specific groups of citizens in each MSA. We use the 1/100 samplefrom the 15% PUMS of 1970 and the 5% PUMS for 1990. We also use data fromthe ‘County and City Data Book’ from several years in order to obtain someaggregate variables such as employment, income, population, spending for localpublic goods. We consider 160 Standard MSAs (SMSAs) that are identifiedin each of the census years considered. We have around 1,200,000 individualobservations for 1990, and 500,000 for 1970. We use them to construct aggregatevariables and indices at the SMSA level. The reason for focusing on SMSAs istwofold. First, SMSAs constitute closely connected economic units within whichinteractions are intense. Thus, they seem to fit our theoretical model in whichcommuting takes place within cities but not between cities. Second, they exhibita higher degree of diversity than the rest of the country as new immigrants andtheir offsprings traditionally settle down in larger cities.We measure the average wage of native workers in an MSA using the yearly
wage of white US-born male residents between 40 and 50 years of age. Theaverage yearly wage constructed using this procedure for city c in year t, call itwct with c = 1, ...,160, is neither affected by composition effects nor distorted by
3We are grateful to Ed Glaeser for drawing our attention to the potential dividends of thisapproach.
6
potential discrimination factors (across genders or ethnicity) and it is thereforea good proxy of the average wage of US-born workers in the city. In particular,the construction of wct is not affected by the degree of diversity of a city. Thecorrelation between diversity and wct comes only from the equilibrium effect ofdiversity on labor demand and labor supply.As measure of the average land rent in a MSA we use the average monthly
rent paid per room in the house (i.e., the monthly rent divided by the numberof rooms) by white US-born people in working age (16-65). We call rct suchmeasure for city c in year t.Turning to our key explanatory variable, our measure of cultural diversity
considers the country of origin of people as defining their cultural identity. Cul-tural diversity is certainly a multidimensional concept and could stem fromdifferent ethnicity, religion, national origin or other characteristics. Here, how-ever, we focus on differences in country of birth as such diversity is likely toincrease as a result of migration and it is highly correlated with linguistic andnational identity. foreign-born have always been an important share of the USpopulation and their proportion has been growing in the past decades. In 1970they were 8 percent of the total working age population. In 1990 they reached12 percent and they kept on growing afterwards.To keep our dataset comparable with existing cross-country studies, we use
a rather standard measure of diversity, namely, the so called ‘index of fractional-ization’ (henceforth, simply ‘diversity index’). Such index has been popularizedin cross-country studies by Mauro (1995) and largely used thereafter. It isnothing but the Simpson index used to measure biodiversity and embeds theprobability that two randomly selected individuals in a community belong todifferent groups. It accounts for the two main dimensions of diversity, i.e., ‘rich-ness’ (number of groups) and ‘evenness’ (balanced distribution of individualsacross groups).4 The index is calculated as 1 minus the Herfindal index of con-centration across groups. Specifically, in the case of the variable CoB (countryof birth) the corresponding index is defined as:
div(CoB)ct = 1−MXi=1
(CoBci )2t (1)
where (CoBci )t is the share of people born in country i among the residents ofcity c in year t. This index reaches its maximum value 1 when each individualis in a different group, i.e. there are no individuals born in the same country,and its minimum value 0 when all individuals belong to the same group, i.e.all individuals were born in the same country. However, in measuring diversitythere is something specific to our data set. First, in each city the largest group,by far, is always represented by the US-born. Second, most of the variationacross cities in div(CoB)ct depends on the variation of the share of foreign-born
(Foreignc) =PMi6=US(CoB
ci )t rather than on the variation in the countries of
4Despite differences that may seem notable at first sight, most statistical measures ofdiversity are either formally equivalent or at least highly correlated when run on the samedata set. See Maignan et al (2003) for details.
7
origin. On both counts, an alternative, and sometimes preferable, measure ofdiversity could simply be the share of foreign-born. We will present results usingboth measures.The 1970 and 1990 PUMS data report the country of birth of each individual.
We consider as separate groups each country of origin of migrants contributingat least 0.5 percent of the total foreign-born living and working in the US. Theother countries of origin are gathered in a residual group. Such choice impliesthat we consider 35 countries of origin in 1970 as well as in 1990. Such choicecovers about 92 percent of all foreign-born immigrants while the remaining 8percent are merged into one group. The complete list of countries for eachcensus year is reported in the data appendix and the largest 15 of these groupsare reported in Table 1. As the table shows, between 1970 and 1990, the originof migrants has become increasingly polarized towards Mexican immigrants, butthe share of foreign-born has increased so that, overall, the diversity index hasincreased. As to the main sources of immigrants, we also notice the well knownshift from European countries to Asian and Latin American countries.
3.2 Diversity Across U.S. Cities
In order to convince the reader that US cities are a very differentiated universein terms of diversity and that there is enough variation across them to be ableto learn something precise from their analysis, Table 2 shows the percentageof foreign-born and the Diversity Index for a group of important Metropolitanareas.To put into context the extent of diversity in US cities, their diversity can be
compared with the cross-country values of the index of linguistic fractionaliza-tion reported by the Atlas Narodov Mira and published in Taylor and Hudson(1972) for year 1960. Such values have been largely used in the growth literature(see, e.g., Easterly and Levine, 1997, and Collier, 2001). As foreign-born im-migrants normally use their country’s mother tongue at home and in turn thissignals their country’s cultural identity, our diversity index captures culturaland linguistic fragmentation just as that index does at the country level. Thecomparison yields intriguing results. Diversified cities, such as New York or LosAngeles, have diversity indices in the range from 0.5 to 0.6, which are compa-rable to the values calculated for countries such as Rhodesia (0.54), which isoften disrupted by ethnic wars, or Pakistan (0.62), which also features a prob-lematic mix of conflicting cultures. Afghanistan, a well known quagmire ofdifferent cultural identities, reaches a value of 0.66 that is only slightly higher.More homogenous cities, such as Cincinnati and Pittsburgh, exhibit a degree offractionalization equal to 0.05, which is the same as that of very homogenousEuropean countries, such as Norway or Denmark in the sixties. Between thesetwo extremes US cities span a range of diversity that is about two thirds of therange spanned by countries in the world. Table 2 also shows that, even thoughpeople born in Mexico constitute an important group in many cities, the varietyof origin of the foreign-born migrants across US cities is still remarkable.Finally, from Table 2 we also get the impression of a very high positive
8
correlation between the share of foreign-born people in a city and its diversityindex. This confirms what was anticipated above: the presence of a large shareof foreign-born, more than their group composition, is the largest source ofdiversity in US cities. Over the whole sample of 160 MSAs, the correlationcoefficient between the two measures is 0.86 for 1990 and 0.87 for 1990. Similarly,for the 1970-90 period the correlation coefficient between the increase in theshare of foreign-born and the increase in the diversity index is 0.84. Differently,the correlation between the increase in the diversity index calculated for thewhole population and the diversity index calculated only within the group offoreign-born is a mere 0.08.
3.3 Stylized Facts
Previewing the final results of our analysis, the key empirical finding is readilystated: keeping every other city characteristic equal, on averageUS-born workersliving in cities with richer cultural diversity are paid higher wages and pay higherrents than those living in cities with poorer cultural diversity. Our main effortin section 5 will be to show that not only is this correlation not driven by anyother (omitted) variable, but it is the result of causation running from diversityto wages and rents. To support such effort, section 4 will develop a theoreticalmodel arguing that, when firms and workers are freely mobile across cities, theabove finding can be explained in equilibrium only if diversity has a dominantproduction amenity effect. As a natural first step in that direction, the presentsubsection reports the raw correlations between diversity on the one hand andwages as well as rents on the other.While there is a strong positive correlation in the cross section, it is more
effective to report the correlation across the 160 cities between the change, from1970 to 1990, of the share of foreign-born, ∆(Foreignc), and the percentagechange in the wage of the US-born, ∆ ln( wc), or the percentage change in rentspaid by the US-born, ∆ ln( rc). Any fixed characteristic of cities, such as theirlocation, their fixed amenities (e.g., weather conditions), and their traditions,does not affect that correlation and this is why we prefer it as stylized fact.Figure 1 and 2 show the scatter-plots for these two partial correlation andreport the OLS regression. Cities that have substantially increased their shareof foreigners in the twenty years considered, such as Los Angeles, Miami andSan Francisco, have experienced increases in wages larger than average; similarly(with the exception of Miami) Los Angeles, San Francisco, San Jose, and JerseyCity, which experienced a large increase in foreign-born, also experienced largeincreases in rents. The OLS coefficient implies that a 10 percent increase of theshare of foreign-born (the difference between, say, Oklahoma City and Chicagoin 1990) is associated with 7 percent higher wages and 11 percent higher rentsfor same sized houses. Similar estimates would be obtained using the 1990 crosssection (rather than changes): a difference of 10 percent in foreign-born peoplewould be associated with differences of 9 percent in wages and 15 percent inrents. The raw positive correlation is very significant. Let us anticipate that,even when controlling for increases in average schooling and for the change in
9
city-employment, the effect on wages still stands at 5.6 percent (standard error1.6 percent). Analogously, when controlling for the changes in city populationdensity and in per-capita income, the effect on rents still stands at 5.3 percent(standard error 2 percent).
4 A Multicultural City System
To structure our empirical investigation, we develop a stylized model of an opensystem of cities in which ‘diversity’ affects both the productivity of firms and thesatisfaction of consumers through a localized external effect. Both the modeland the identification procedure of the impact of diversity on city dwellers buildon Roback (1982).
4.1 The Model
We consider an open system of a large number N of non-overlapping cities,indexed by c = 1, ..., N . There are two factors of production, labor and land.Labor is perfectly mobile between and within cities. We assume that intercitycommuting costs are prohibitive so that for any worker the cities of work andresidence coincide. We also ignore intra-city commuting costs, which allows usto focus on the intercity allocations of workers.The overall amount of labor available in the economy is equal to L. It is in-
elastically supplied by urban residents and, without loss of generality, we chooseunits such that each resident supplies one unit of labor. Accordingly, we call Lcthe number of workers employed and resident in city c. Workers are all identicalin terms of attributes that are relevant for market interactions. However, theydiffer in terms of non-market attributes, which exogenously classifies them intoM different groups (‘cultural identities’) indexed by i = 1, ...,M . Hence, calling
Li the overall number of workers belonging to group i, we havePMi=1 Li = L.
In each city cultural diversity dc, measured in terms of the number (‘richness’)and relative sizes Lic (‘evenness’) of resident groups, enters both production andconsumption as an externality that, in principle, can be positive (‘amenity’) ornegative (‘disamenity’). To establish the existence and the sign of such exter-nality is the final aim of the paper. Differently from labor, land is fixed amongcities. It is nonetheless mobile between uses within the same city. We call Hcthe amount of land available in city c. As to land ownership, we assume thatthe land of a city is owned by locally resident landlords.5
To summarize, while the intercity allocation of land is exogenously given,the intercity allocation of labor will be endogenously determined in equilibrium.Accordingly, while the city system as a whole is characterized by an exogenous
5This assumption is made only for analytical convenience. What is crucial for what followsis that the rental income of workers, if any, is independent of locations and, thus, it does notaffect the migration choice. The alternative assumptions of absentee landlords or balancedownership of land across all cities would also serve that purpose.
10

degree of cultural diversity, within city diversity is endogenously determined bythe entry decisions of firms and the migration decision of workers.Preferences are defined over the consumption of land H and a homogeneous
good Y that is freely traded among cities. Specifically, the utility of a typicalworker of group i in city c is given by:
Uic = AU(dc)H1−µic Y µic (2)
with 0 < µ < 1. In (2) Hic and Yic are land and good consumption respec-tively while Au(dc) captures the consumption externality associated with localdiversity dc. If the first derivative A0u(dc) is positive, diversity is a consumptionamenity; if negative it is a consumption disamenity.We assume that workers move to the city that offers them the highest indirect
utility. Given (2), utility maximization yields:
rcHic = (1− µ)Eic, pcYic = µEic (3)
which implies that the indirect utility of the typical worker of group i in city cis:
Vic = (1− µ)1−µµµAu(dc) Eic
r1−µc pµc(4)
where Eic is her expenditures while rc and pc are the local land rent and goodprice respectively.As to production, good Y is supplied by perfectly competitive firms using
both land and labor as inputs. The typical firm in city c produces according tothe following technology:
Yjc = AY (dc)H1−αjc Lαjc (5)
with 0 < α < 1. In (5) Hjc and Ljc are land and labor inputs respectivelywhile AY (dc) captures the production externality associated with local diversitydc. If A
0Y (dc) is positive, diversity is a production amenity; if negative it is a
production disamenity.Given (5) and perfect competition, profit maximization yields:
rcHjc = (1− α)pcYjc, wcLjc = αpcYjc (6)
which implies marginal cost pricing:
pc =r1−αc wαc
(1− α)1−αααAY (dc)(7)
so that firms make no profits in equilibrium. Given our assumption on landownership, this implies that aggregate expenditures in the city equal local factorincomes and that workers’ expenditures consist of wages only: Eic = wc. Asgood Y is freely traded, its price is the same everywhere. We choose the goodas numeraire, which allow us to write pc = 1.
6
6Anticipating the empirical implementation of the model, by setting pc = 1 for all citieswe are requiring the law-of-one-price to hold for tradable goods and non-tradable goods pricesto be reasonably proxied by land rents. This seems to be supported by the large positivecorrelation between local price indices and land rents at the SMSA level.
11
In a spatial equilibrium there exists a set of prices (wc, rc, c = 1, ..., N)such that in all cities workers and landlords maximize their utilities given theirbudget constraints, firms maximize profits given their technological constraints,factor and product markets clear. Moreover, no firm has an incentive to exitor enter. This is granted by (7) that, given our choice of numeraire, can berewritten as:
r1−αc wαc = (1− α)1−αααAY (dc) (8)
We will refer to (8) as the ‘free entry conditions’. Finally, in a spatial equilibriumno worker has an incentive to migrate. For an interior equilibrium (i.e., Lc > 0∀c = 1, ...,N) that is the case when workers are indifferent between alternativecities:
Vic = Vik, ∀c, k = 0, ..., N (9)
We will refer to (9) as the ‘free migration conditions’.To conclude the solution of the model we have to determine the spatial
allocation of workers Lic. This is achieved by evaluating the implications ofmarket clearing for factor prices. Specifically, given Lc =
Pj Ljc and Yc =P
j Yjc, (6) imply wcLc = αpcYc. Given Hc =Pj Hjc +
PiHic, (6) and (3)
imply µrcHc = (1−αµ)pcYc. Together with Eic = wc and pc = 1, those resultscan be plugged into (4) to obtain:
Vic = µ
µ1− µ1− αµ
¶1−µµHcLc
¶1−αµAU (dc) [AY (dc)]
µ (10)
Substituting (10) into (9) completes the system of equations that can be solvedfor the equilibrium spatial allocation of workers. In particular, such substitutiongivesM(N −1) free migration conditions that, together with the M group-wise
full-employment conditionsPNc=1 Lic = Li, assign Lic mobile workers of each
group i = 1, ..,M to each city c = 1, ..., N .Due to constant returns to scale and fixed land, (10) shows that the indirect
utility offered to a worker in each city is a decreasing function of the total numberof local workers. This ensures the uniqueness of the spatial equilibrium in termsof city sizes Lc’s. Moreover, (10) also shows that the local indirect utility tendsto infinity as all workers abandon a certain city, which ensures that the uniqueequilibrium has indeed a positive number of workers in every city (‘no ghosttown’). Finally, whether in equilibrium cities have a more or less diversifiedgroup composition (dc high or low), depends on the combined consumption andproduction external effects of diversity AU (dc) [AY (dc)]
µ. If such combination
generates a net amenity effect, cities will tend to be diversified; if it generatesa net disamenity effect, they will tend to be homogeneous. More precisely, dueto symmetry among groups, in the presence of a net amenity effect of diversity,cities will have a uniform distribution of workers across groups (‘multiculturalcities’); if a net disamenity effect arises, different groups will tend to concentratein different cities (‘unicultural cities’).7
7In the case of net amenity, the multicultural equilibrium configuration is unique. In the
12

4.2 Identification: Wage and Rent Equations
To prepare the model for empirical investigation, it is useful to evaluate wagesand land rents at the equilibrium allocation. This is achieved by solving togetherthe logarithmic versions of the free entry condition (8) and the free mobilitycondition (9) that takes (4) into account. Specifically, call v the equilibriumvalue of indirect utility. Due to free mobility such value, call it v, is commonamong cities and, due to the large number of cities, it is unaffected by city-levelidiosyncratic shocks. Then, solving (8) and (9) for factor prices gives the ‘rentequation’:
ln rc =ηY + αηU1− αµ
+1
1− αµln (AY (dc) [AU (dc)]
α) (11)
and the ‘wage equation’:
lnwc =(1− µ)ηY − (1− α)ηU
1− αµ+
1
1− αµln
Ã[AY (dc)]
1−µ
[AU(dc)]1−α
!(12)
where ηY ≡ ln(1− α)1−ααα and ηU ≡ (1− µ)1−µµµ/v.Equations (11) and (12) constitute the theoretical foundations of our follow-
ing regressions. They capture the equilibrium relation between diversity andfactor prices. In the wake of Roback (1982), they have to be estimated togethersince they clearly show that any regression of one equation alone runs into aproblem of lack of identification. To see this, consider (11) in isolation. Apositive correlation between dc and rc is consistent with both a dominant con-sumption amenity effect of diversity (A0U (dc) > 0) and a dominant productionamenity effect (A0Y (dc) > 0). Analogously, if one considers (12) in isolation, apositive correlation between dc and wc is consistent with both a dominant con-sumption disamenity effect (A0U (dc) < 0) and a dominant production amenityeffect (A0Y (dc) > 0). Only the joint estimation of (11) and (12) allows one toestablish which effect is indeed dominating. Specifically:
∂ rc∂ dc
> 0 and∂ wc∂ dc
> 0 iff dominant production amenity (A0Y (dc) > 0) (13)
∂ rc∂ dc
> 0 and∂ wc∂ dc
< 0 iff dominant consumption amenity (A0U (dc) > 0)
∂ rc∂ dc
< 0 and∂ wc∂ dc
< 0 iff dominant production disamenity (A0Y (dc) < 0)
∂ rc∂ dc
< 0 and∂ wc∂ dc
> 0 iff dominant consumption disamenity (A0U (dc) < 0)
Figure 3 provides a graphical intuition of the proposed identification. In thefigure wc and rc are measured along the horizontal and vertical axes respectively.
case of net disamenity, the unicultural equilibrium configuration is unique if there are morecities than groups (N ≥ M): any city hosts only one group of workers. On the contrary, ifthere are more groups than cities, N < M multiple equilibria exist as some groups have tocoexist within the same city.
13

For given v and diversity dc, the free entry condition (8) is met along thedownward sloping curve, while the free migration condition (9) holds along theupward sloping curve. The equilibrium factor prices are found at the intersectionof the two curves. Diversity dc acts as a shift parameter on the two curves: anyshock to diversity shifts both curves. An increase in dc shifts (8) up (down) ifdiversity has a production amenity (disamenity) effect. It shifts (9) up (down)if diversity has a consumption amenity (disamenity) effect. Thus, by lookingat the impact of a diversity shock on the equilibrium wage and rent, we areable to identify the dominant effect of diversity. For example, consider theinitial equilibrium A and the new equilibrium A0 that prevails after a shock todiversity. In A0 both wc and rc have risen. Our identification argument statesthat both factor prices rise if and only if an upward shift of (8) dwarfs any shiftof (9), i.e., the production amenity effect dominates.With respect to Roback (1982), however, we face an additional problem.
While her focus is on fixed amenities (e.g., “clean air”, “lack of severe snowstorms”, Roback, 1982, p.1260-61), diversity in our model is endogenous sinceit is determined by the migration decisions of workers. This implies that, inorder to test any causal relation from diversity to wages and rents, diversity hasto be instrumented. We will take due account of this endogeneity problem insubsection 5.3.8
5 Wage and Rent Regressions
The theoretical model provides us with a consistent framework to structure ourempirical analysis. In particular, in the wake of Roback (1982) it suggests howto use wage and rent regressions to identify the external effect of diversity onproduction and consumption.
5.1 Basic Specifications
Our units of observation are the 160 Metropolitan Statistical Areas (MSAs)listed in the Appendix. The years of observation are 1970 and 1990. As anempirical implementation of the wage equation (12), we run the following basicregression:
ln(wc,t) = β1 (sc,t) + β2 ln (Emplc,t) + β3div(CoB)c,t + ec + et + ect (14)
The dependent variable wc,t is the average wage in city c in year t. That ismeasured as the average wage of US-born white males between 40 and 50 yearsof age (see Section 3.1 for details). This allows us to avoid issues of age, gender,and race composition. The focal independent variable is div(CoB)c,t, which isthe diversity index defined in equation (1). The other independent variables
8See, e.g., Glaeser and Mare (2001) for a discussion of the many pitfalls in estimating wageequations when firms and workers are mobile.
14
are controls. Specifically, sc,t measures the average years of schooling for thegroup of white US-born males aged from 40 to 50. Emplc,t is total non-farmemployment in city c and year t. We control for unobserved factors that mayvary across cites (and not over time) such as location, climate and traditions byincluding 160 city fixed effects ec.We also control for common effects over time(such as the generalized increase in immigrants as well as in wages and rents)by including a year dummy et. Finally, ect is a zero-mean random error termindependent from the other regressors.Under this assumption, the coefficient β3 captures the equilibrium effect on
wages of a change in cultural diversity. However, as discussed in the subsection4.2, the sign of β3 cannot be directly interpreted as evidence of any amenityeffect of diversity. The reason is that it may signal either a dominant positiveexternal effect of diversity in production, which increases labor demand, or adominant negative external effect of diversity in consumption, which decreaseslabor supply. Identification, thus, requires to estimate a parallel rent regression.Based on the rent equation (11), we run the basic regression:
ln(rc,t) = γ1 ln(y)c,t + γ2 ln (Popc,t) + γ3div(CoB)c,t + εc + εt + εct (15)
The dependent variable rc,t is the average monthly rent per room paid by whiteUS-born males in city c in year t. The focal independent variable is againthe diversity index div(CoB)c,t. The other independent variables are controls.Specifically, (y)c,t is the average yearly income of the group of white US-bornmales in city c in year t, while Popc,t is the population density in the city. Againwe control for city fixed effects εc, a year dummy εt, and we assume that εct isa zero-mean random error uncorrelated with the regressors. The coefficient γ3captures the equilibrium effect of a change in cultural diversity on average cityrents. Then, by crossing the information on the signs of β3 and γ3, we are ableto use (13) to identify the net external effect of diversity: dominant productionamenity if and only if β3 > 0 and γ3 > 0; dominant consumption amenity ifand only if β3 < 0 and γ3 > 0; dominant production disamenity if and only ifβ3 < 0 and γ3 < 0; dominant consumption disamenity if and only if β3 > 0 andγ3 < 0.The results of the regressions (14) and (15) are reported in Table 3 and 4
respectively. These results are obtained by OLS estimation with city and timefixed effects while correcting the standard errors to be heteroskedasticity robust.In Table 3, Specification 1 is exactly the one described in (14). Returns to oneyear of schooling are estimated around 10 percent and the change in employmentis not significantly correlated with wages. The diversity index has a positive andvery significant effect with an estimate of β3 equal to 1.29 (standard error 0.29).In Specification 2 we decompose the effect of diversity into the effect of theincreased share of foreign-born and the effect of increased diversity among theforeign-born. Both measures have a positive and significant effect on wages, butthe effect from increased share of foreign-born is much more precisely estimatedat 0.58 with standard error 0.1. Increased diversity of foreigners has an impact
15
significant at the 10-per-cent level only. Specifications 3 and 4 estimate theeffect of diversity on the average income of white US-born males with 40 to 50years of age, which includes returns to capital and entrepreneurship. As long asdiversity acts as a local production externality, its effect should also affect thesereturns. Reassuringly diversity has a positive and significant effect on personalincome as well, and even larger than on wage income. According to the estimatesin Specification 3, increasing the diversity index by 10 percent would cause anincrease in average personal income of US-born by 15 percent. Decomposing theeffect of diversity into the effects of the share of foreign-born and of diversityamong foreign-born, the former turns out to be the key component while thelatter effect is positive but not significant. An increase in foreign-born by 10percent would increase average personal income of US-born by 8.2 percent.Vis a vis the positive and significant effect of diversity on wages, it is then
crucial for identification to measure the impact of diversity on rents. Table 4reports the results from the rent regression (15). Specification 1 and 2 controlonly for population density plus city and year fixed effects. Specification 3and 4 control for personal income too. Again we estimate the effect of overalldiversity (Specifications 1 and 3) and then we decompose it into the effects ofthe share of foreign-born and of diversity of foreign-born (Specifications 2 and4). Considering the impact of the share of foreign-born, which turns out to bethe most important component of diversity, when we do not control for personalincome (Specification 2), an increase of the share of foreign-born by 10 percent isassociated with an increase in rents for US-born close to 11 percent. As reportedin Table 3, though, an increase in diversity is associated with an increase inpersonal income so that the effect on rents may be a consequence of higheraverage income in the city without any independent additional effect. However,when we control for average income of the US-born group (Specification 4), westill have a positive and significant effect on US-born rents although half thesize of the one estimated in Specification 1. An increase of the share of foreign-born by 10 percent would increase price of housing by 5.3 percent, even aftercontrolling for the fact that higher diversity is associated with higher income,and 1 percent higher income generates 0.6 percent higher rents.To sum up, diversity has positive and highly significant correlations with
both wage (β3 > 0) and land rent (γ3 > 0). According to (13), such posi-tive correlations can be interpreted as consistent with a dominant productionamenity effect of diversity. To gain further insight on this result, the rest ofthe paper is devoted to two tasks. First, in Section 5.2 we check whether thosepositive correlations survive the inclusion of several additional controls. Second,in Section 5.3 we tackle the issue of endogeneity raised at the end of Section4.2. In particular, we try to assess the causal direction of those correlations byinstrumental variables techniques.Before doing that, however, let us check another correlation that may re-
inforce our interpretation that the positive effects on wages and rents are theequilibrium result of a dominant production amenity. The theoretical modelmakes clear (see (6)) that, in the presence of a production amenity, labor de-mand would shift up in cities where diversity increased. Table 5 reports the
16

correlation between changes in diversity and changes in employment as well aspopulation of US cities between 1970 and 1990. If the labor supply curve hadshifted up with labor demand unchanged, that would have caused the observedincrease in wages but this would have been associated with a decrease in em-ployment. On the contrary, Table 5 shows mildly positive effects of diversityon employment and population, not significant the former and significant thelatter. Such results, therefore, point to some dominant upward shift of labordemand as expected in the presence of a dominant production amenity.
5.2 Check of Robustness
Our basic specifications for the wage and rent regressions omit several variablesthat, in principle, could affect both the degree of diversity and local externalities.In so far as they change over time, the impacts of such omitted variables arenot captured by the city fixed effects.This section is devoted to testing whether the estimated effects of diversity
are robust to the inclusion of omitted variables. While the list of potentialcontrols is never complete, we include here some important ones for which onecan think of plausible stories that would lead to the estimated correlations.Table 6 reports the estimates of the coefficients of the diversity index, the shareof foreign-born, and foreign-born diversity in the wage equation as we includeadditional controls, one at a time and together. Table 7 presents analogousresults for the rent regression.In addition, our theoretical model shows that equilibrium wages and rents
are simultaneously determined. This suggests that there may be correlationbetween the unobservable idiosyncratic shocks to wages, εct, and rents, ect. Todeal with this potential source of inefficiency in OLS estimations, Table 8 reportsthe coefficients of the diversity index or the share of foreign-born in the wageand rent equations when simultaneously estimated by SUR.
5.2.1 Skills’ Complementarity/Externality from Foreign-Born
The positive effect of the foreign-born on the US-born wage could simply be a re-sult of the foreigners’ measurable skills. If the foreign-born had higher (or lower)schooling achievements than US-born, then, through some complementarity orexternality effects, that could increase the wages of the US-born independentlyfrom any role of diversity. Ciccone and Peri (2002) find a significant comple-mentarity between human capital and labor in US cities and Moretti (2003)finds significant externalities from schooling. Thus, there is some ground tosuspect that we might be attributing to diversity an effect more simply due tothe observable levels of schooling of the foreign-born.Specifications (2) in Tables 6 and 7 include the average years of schooling
of the foreign-born as a control variable in the wage and rent regressions re-spectively. The effect of diversity is still significant and positive in both cases.Interestingly, the effect (not reported) of average schooling of the foreign-bornon the wages of the US-born is not significant, while it is small and positive on
17

US-born rents. When decomposing the overall diversity effect (column 2 and3 in the tables) we find a significant and positive effect of the share of foreign-born on both rents and wages, while the diversity of foreigners has significantpositive impact on wages but not on rents. As in most specifications, in thiscase too the estimated effect implies that an increase of 10 percent in the shareof foreign-born increases average US-born wages as well as rents by 5.8.
5.2.2 Unobserved Shocks to Productivity and Amenities
Another plausible reason to find positive correlations of diversity with wagesand rents may be that migration into the city responds to positive shocks toproductivity and local amenities. In so far as we do not observe these shocks, weare omitting the common underlying cause of increased wages, increased rents,and increased diversity. To address this issue we use two strategies. The firststrategy, which we postpone to Section 5.3, tries to identify a variable correlated(or more correlated) with the share of foreign-born but not otherwise correlatedwith productivity or amenities. Then, it uses such variable as instrument forthe estimation.The second strategy, pursued here, exploits the fact that, if shocks to pro-
ductivity attract workers into a city, this should work for US-born as well as forforeign-born workers. Therefore, if we included the share of US-born citizenscoming from out of state (i.e., born in a different state than the state of thecity of residence) in the wage and rent regressions, such variable should be cor-related with productivity and amenities shocks too, and therefore its inclusionshould decrease significantly the estimated coefficients β3 and γ3. Moreover, weshould find a significant positive correlation between wages as well as rents andthe share of people born out of state. Specification (3) in Tables 6 and 7 in-clude the share of US-born citizens who were born out of state. The coefficientson this variable (not reported) are not significant in either regression, whilethe effects of diversity and of the share of foreign-born on wages and rents arestill significantly positive and virtually unchanged. These results suggest thatthe presence of the foreign-born does not simply signal that cities have someunobserved positive characteristics that would lure both foreign- and US-bornworkers.
5.2.3 Tolerance for Diversity
Some sociologists have advanced the hypothesis that environments that aretolerant towards diversity are more productive and more pleasant to live in:they are more open to contribution of ideas from different groups and they aremore amenable. Along these lines Richard Florida (see, e.g., Florida, 2002) hasargued that cities where the number of artists and bohemian professionals islarger are more innovative in high tech sectors. It is quite likely that part ofour correlations may actually depend on this good attitude of cities towardsdiversity. However, to show that there is nonetheless something specific to thepresence of foreign-born in generating the positive correlation of diversity with
18

wages and rents, we include another measure of diversity in our regressions.The share of US-born people identifying themselves as ‘non-white’, is en-
tered in specification (4) of Tables 6 and 7. Since we consider only US-bornpeople, such index essentially captures the white-black composition of a city.The coefficients (not reported) on this variable turn out to be positive in thewage regression (0.20) and negative in the rent regression (−0.22). Accordingto (13), this would suggest a dominant consumption disamenity effect of theshare of non-white US-born. While it might be tempting to read this result asevidence of the aversion of white US-born against living close to large non-whitecommunities, the standard errors (in both cases around 0.2) make the estimatedcoefficients not significant.As to the coefficients of the diversity index and of the share of foreign-born,
they are still positive, significant (except in one case for the rent regression), andsimilar to previous estimates. Thus, independently from the impact of diversityalong the ethnic dimension, diversity in terms of the country of birth maintainsits own importance and specificity.
5.2.4 Quality of Local Public Goods
Several public services in US cities are supplied by local governments. Publicschools, public health care, and public security are all desirable local services.Therefore, cities where their quality has improved in the period of observationmay have experienced both an increase in the share of foreign-born (possiblylarger users of these services) and a rise in property values. From the Countyand City Databook we have gathered data on the spending of local governmentper person in a city and on its breakdown across different categories such aseducation, health care, and security (local police). Specification (5) includesoverall spending by local government whereas Specification (6) includes spend-ing on education, a very important determinant of the quality of schools, whichin turn largely affects property value.Once more, while the effect of public spending per person on rents (not
reported) is positive in both specifications, the inclusion of the controls doesnot change the effect of diversity. In particular, the coefficient on the share offoreign-born is around 0.6 (standard error 0.17) in the wage regression and 0.53(standard error 0.24) in the rent regression. As a final and most conservativecheck, Specification (7) includes together all the controls included separately inspecifications from 2 to 6. Reassuringly, the coefficient of the share of foreign-born is still positive, very stable, and significant in both regressions. The coef-ficient of the diversity index is also positive, very stable, and significant in thewage regression while it turns out not significant in the rent regression.9
9Some authors (see, e.g., Sivitanidou and Wheaton, 1992) have argued that also the in-stitutional constraints on land use (‘zoning’) can affect land values. Thus, higher propertyvalues may be associated with more efficient institutional constraints in the presence of marketfailures. Also this effect should be captured by our local public goods measures.
19
5.2.5 Outliers and State by Year Fixed Effects
In the last two specifications of Tables 6 and 7 we try to push our data as far asthey can go. Specification (8) estimates the wage and rent regressions excludingthe three states with the highest shares of foreign-born, namely California, NewYork and Florida. The aim is to check whether few highly diverse cities in thosestates generate the correlations of diversity with wages and rents estimated forthe whole data set. This is not the case. In the wage regression the coefficientof diversity decreases somewhat but remains both positive and significant. Inthe rent equation the coefficient of diversity becomes much larger but also muchless precisely estimated. In general, however, there is no evidence that in thelong run the effect of diversity is different for high immigration states than forlow immigration states.In Specification (9), rather than the panel with city and year dummies, we
use instead the differences between 1990 and 1970 of the basic variables. Wealso include state fixed effects to control for differences in state-specific growthrates of wages and rents. In so doing we identify the effects of diversity on wagesand rents through the variation across cities within states. Indeed, the inclusionof state fixed effects in the difference regression is equivalent to the inclusionof state by time fixed effects in the panel regression. This is an extremelyconservative specification as we are probably eliminating a lot of the variationneeded to identify the results and we are estimating 48 dummies using 160observations. Remarkably, the positive effect of diversity on productivity stillstands and its point estimate is similar to those of previous specifications. Theeffect of diversity on rents, however, while still positive, is no longer significant.
5.2.6 Efficient Estimation: SUR
The theoretical model shows that in equilibrium wages and rents are simulta-neously determined (see equations (11) and (12)). This implies that there maybe correlation between the unobservable idiosyncratic shocks to wages, εct, andrents, ect. If so, we could increase the efficiency of our estimates by explicitlyaccounting for such correlation and estimating the wage and rent equations asa system through SUR. While OLS estimates are still consistent and unbiasedeven when εct and ect are correlated, SUR estimates are more efficient.Table 8 reports the coefficients on the diversity index or the share of foreign-
born in the wage and rent equations when estimated simultaneously by SUR.Specifications (1) through (9) are identical to (1) through (9) in Tables 6 and 7.In general, the estimates of the coefficients on the diversity index are somewhatlarger when using SUR in both the wage and the rent equations. When weuse the share of foreign-born instead, the estimated coefficients are similar tothe OLS results for wages but somewhat higher for rents. Indeed, while theelasticity of wages to the share of foreign-born is between 0.6 and 0.7 in mostspecifications (just as in Table 6), the elasticity of rents is between 0.6 and 1.1(versus 0.6− 0.8 in Table 7). The only case in which the effect of diversity onwages is only borderline significant is when we exclude the large immigration
20
states (just as in the OLS estimates). As to rents, the effect of diversity isnot significant only when we introduce state-specific trends (again, as in theOLS estimates). Therefore, SUR estimates strongly confirm the qualitative andquantitative results obtained under OLS.
5.2.7 Overview of Robustness Checks
To summarize the results of our robustness checks, in Tables 6, 7 and 8 mostwage and rent regressions yield positive and significant coefficients for both thediversity index and the share of foreign-born. In only one case (Specification(8)) the OLS estimates of the single wage regression produce an insignificanteffect of the share of foreign-born. In only three cases the coefficient of diver-sity (Specifications (4), (7), (9)) or the coefficient of the share of foreign-born(Specification (9)) are not significant in the OLS estimates of the single rentregression. As to SUR estimation, in Table 8 only two specifications find aninsignificant effect of diversity either on wages (Specification (8)) or on rents(Specification (9)). We do not find any specification such that the coefficientsof the same variable are simultaneously not significant in both wage and rentregressions.Therefore, our identification (13) allows us to conclude that all specifications
support the hypothesis of a production amenity value of diversity. Indeed, byusing Figure 3, in subsection 4.2 we have already argued that, when the coef-ficients of our diversity measures are positive and significant in both the wageand the rent regressions, this is evidence of a dominant production amenity (seepoint A0). In addition, it is readily established that a significant positive impactof diversity on wages and no significant impact on rents is consistent only with aproduction amenity and a consumption disamenity (see point B). Analogously,a significant positive impact of diversity on rents and no significant impact onwages is consistent only with both a production amenity and a consumptionamenity (see point C).
5.3 Endogeneity and Instrumental Variables
Short of a randomized experiment in which diversity across cities is changed ex-ogenously and randomly, we cannot rest assured that our correlations reveal anycausal link from diversity to wages and rents. Nonetheless, some steps towardstackling such endogeneity problem can be taken by instrumental variables (IV)estimation. Our instruments should be correlated with the change in diversity ofcities in the 1970-1990 and not otherwise correlated with changes in wages andrents. We propose two instruments satisfying the foregoing properties. Bothexploit the fact that, presumably exogenously from the characteristics of anysingle city, the overall immigration to the US increased significantly between1970 and 1990.
21

5.3.1 Ports of entry
To construct the first instrumental variable, we build on the fact that immigrantstend to enter the US through few ‘ports of entry’. Each year the US Office ofTourism publishes the percentage of inbound travellers by port of entry. Look-ing at the data for the eighties, we see that the three main gateways were NewYork, Miami, and Los Angeles. Through the airports and ports of these citiesabout 30 percent of the foreign (immigrant and non-immigrant) travellers en-tered the US. Accordingly, foreign-born immigrants from countries other thanCanada or Mexico were quite likely to go through one of those cities. Moreover,due to networks, costs of travelling, and costs of spreading information, suchimmigrants were more likely to settle down in cities closer to those gateways.Therefore, cities at a smaller distance from those ports of entry were more likelyto receive foreign-born immigrants during the 1970-1990 period. A similar ar-gument can be made for Canadian and Mexican immigrants. For them it seemsreasonable to assume that the US borders with their own countries constitutetheir natural port of entry. Thus, as before, cities at a smaller distance from theborders were more likely to receive Canadian and Mexican immigrants duringthe 1970-1990 period.Such considerations suggest the use of the overall distance of a city from the
main ‘ports of entry’ (New York, Miami, Los Angeles, and the US borders withCanada and Mexico) to instrument its share of foreign-born or its diversityindex. On the one hand, such distance should be negatively correlated withdiversity. As stated above, cities closer to the ports of entry experienced largerinflows of foreign-born in the 1970-1990 period. On the other hand, during thesame period the distance of a city from the ports of entry should also be littlecorrelated with changes in its wages and rents.This strategy is open to an obvious critique. If, for example, the three cities
(New York, Miami, and Los Angeles) had experienced above average growthin the considered time period, this could have had positive spillover effects onnearby cities. As a result, the distance of a city from them would be negativelycorrelated with the increases in wages and rents due to the spillovers. To seewhether this indeed happened in our data set, we have calculated employmentgrowth for the three cities in the period of observation. It turns out that ineach of those three cities employment growth was actually lower than average(respectively, +45 percent in Los Angeles, +42 percent in Miami, and a mere+7 percent in New York, against an average +48 percent). Also populationgrowth was below average in both New York and Los Angeles, while it wasabove average in Miami. Therefore, overall the three cities did not really growfaster than other cities. However, since Miami still exhibited better performancethan the other two ports of entry, we have also used only distances from NewYork and Los Angeles as instruments: the results are virtually unchanged.Table 9 and 10 report the first and second stage estimates of the described
IV regression. Columns 1 and 2 show the basic specification; columns 3 and4 include 48 state fixed-effects; columns 5 and 6 exclude all the coastal citiesfrom the regression to make sure that our results are not simply driven by the
22

difference in shares of foreigners and productivity between the coast and theinland. The first stage regressions confirm that our instruments are excellentand explain about 50 percent of the variation of diversity across cities. Fartherfrom the ports of entry diversity is significantly lower.Considering specifications 1 and 2, we find that the OLS results are con-
firmed, the effect of the share of foreign-born on wages and rents across citiesis positive and significant. Moreover, the IV estimates are somewhat higherthan the OLS ones, so that we are reassured that endogeneity did not cause asignificant OLS bias. Again, the coefficients on the wage regression confirm thatan increase in foreign-born by 1 percent is associated with 0.7 percent increasein wages. As for the rents, the impact is around 1 percent. For the wage re-gressions we obtain a positive significant effect of diversity also when controllingfor 48 state fixed effects (specifications 2 and 3) and when we eliminate coastalcities (specifications 5 and 6). These last two specifications have quite largestandard errors, however, but certainly reinforce our thesis that foreign-bornhave a positive effect also in non-coastal cities. As to the rent regressions, theshare of foreigners has a positive and significant effect in specification 2 and 6.When we include state dummies, the effect of foreign-born is not significant anylonger (but still positive) as in Table 7. Again, the estimates on non-coastalcities have large standard errors but the coefficient estimate on the share offoreign-born is robustly positive and close to one. Differently, the coefficient ofthe diversity index is positive and significant only for non-coastal cities.
5.3.2 Shift-Share Methodology
A second instrumental variable, independent of idiosyncratic city shocks towages and rents, could be constructed by adopting the ‘shift-share method-ology’ used by Card (2001) and, more recently, applied also by Saiz (2003b) tomigration in MSAs. Immigrants tend to settle where other immigrants fromthe same country already reside. Therefore, we can use the share of residentsof an MSA in 1970 born in each country to attribute to each group the growthrate of its share within the whole US population in the 1970-1990. In so doingwe compute the predicted composition of the city based on its 1970 composi-tion and attributing to each group the average growth rate of its share in theUS population. Once we have constructed these ‘predicted’ shares for 1990we can calculate the ‘attributed’ diversity index and the ‘attributed’ share offoreign-born for each city in 1990.Let us use the notation introduced in section 3.1 where (CoBcj )t labels the
share of people born in country j among the residents of city c in year t. Hence,(CoBj)t =
Pc(CoB
cj )t is the share of people born in country j among US
residents in year t so that between 1970 and 1990 its growth rate is:
(gj)1970−90 = [(CoBj)1990 − (CoBj)1970]/(CoBj)1970 (16)
This allows us to calculate the ‘attributed’ share of people born in country jand residing in city c in 1990 as:
( dCoBcj )1990 = (CoBcj )1970 • [1 + (gj)1970−90] (17)
23
The attributed share of foreign-born and the attributed diversity index canevaluated accordingly. In particular, the latter equals:
div(dCoB)c1990 = 1−Xj
( dCoBcj )21990 (18)
As the attributed values for each city in 1990 are built using the city’s sharesin 1970 and the national growth rates of groups from 1970 to 1990, they areindependent from any city-specific event that period. Thus, being orthogonalto city-specific shocks, they can be used as instruments for the actual values.Table 11 and 12 present the results of the IV estimation of the wage and
rent regressions using the shift-share instruments. Unfortunately in terms ofperfect comparability with previous results, some adjustments in the groupingof countries of birth is unavoidable. The reason is that, as we input the sharesin 1990 based on the initial shares in 1970 and the national growth of groups,we need to identify the same groups across census years. This is achieved byallocating more than one country of birth to the same group. In so doing, wefollow the classification adopted by Card (2001), Table 5, as described in thedata appendix.In Tables 11 and 12, columns 1 and 2 report the OLS estimates of the
basic specifications for the two measures of diversity. The point estimates ofthe OLS specification are very similar to the previous estimates (respectivelyTable 3 Columns 1 and 2 and Table 4 columns 3 and 4) confirming that thereclassification of groups has only negligible effects. The first stage regressionsshows that the attributed and the actual changes are positively correlated, withthe former explaining 30-50 percent of the variation of the latter when all statesare included.The IV-estimated effect of diversity on wages is reported in column 3 and 4
of Table 11. The effect is still positive and significant when diversity is measuredusing the diversity index (specification 3). When we include only the share offoreign-born as measure of diversity, however, its coefficient is still positive butthe standard error increases and the estimate is not significant. Similarly whenwe exclude the high-immigration states, the effect of diversity is estimated tobe positive but not significant. However, the main problem when we excludeCalifornia, Florida, and New York is that the instruments lose much of theirexplanatory power (only 20 percent of the variance of the endogenous variableis explained by the instrument). Therefore, insignificance is mostly driven bylarge standard errors rather than by evidence of endogeneity bias (i.e., changesin point estimates).In Table 12 the rent regression exhibits a similar qualitative pattern but
sharper results. Using the shift-share instruments both the diversity index andthe share of foreign-born have a positive and significant effect (specifications 3and 4). Also in this regression, when we exclude California, Florida, and NewYork, the standard errors increase significantly. However, the point estimates ofthe effect of diversity are still firmly in the positive range. Somewhat surprisingand possibly driven by some outliers is the very large (and imprecisely estimated)
24

effect of diversity on rents in specification 5. As similar results emerged in Table10 when coastal cities were excluded.
5.3.3 Overview of Instrumental Variables
As the theoretical model makes clear, endogeneity is a potential problem forour results. We have tackled such problem by IV estimation using two differentsets of instruments.When distance from the ports of entry is used, the estimated coefficients of
both diversity measures are always positive and significant in the wage regres-sions. Differently, in the rent regressions they are significant, and positive, in onecase only, namely, when we use the diversity index while excluding non-coastalcities.When the shift-share approach is adopted instead, we have symmetric re-
sults. In the rent regressions diversity measures have always positive and signif-icant coefficients except in one case. The exception is when we use the share offoreign-born while excluding California, Florida, and New York, in which casethe estimated coefficient is not significant. Differently, in the wage regressionsthe estimated coefficients of the diversity measures are significant, and positive,in one case only, namely, when we use the diversity index without excludingCalifornia, Florida, and New York.All in all, these results mirror the results of the OLS regressions. In particu-
lar, in the IV regressions we find only one specification such that the coefficientsof the same variable are simultaneously not significant in both wage and rentequations. This is never the case in the OLS regressions. Thus, on the basis ofthe discussion in subsection 5.2.7, we can conclude that our data support thehypothesis of a production amenity value of diversity with causation runningfrom diversity to the location decisions of firms and workers.
6 Discussion and Conclusions
We have developed a theoretical model of an urban system of open cities inwhich cultural diversity affects production and consumption as an external-ity. In principle, the external effects of diversity can be positive (‘amenity’) ornegative (‘disamenity’). Since our model handles all cases (i.e. production orconsumption amenity; production or consumption disamenity), it has allowedus to design an identification procedure to figure out which case receives empiri-cal support based on cross-city wage and rent variations. Moreover, by allowingfor both firm and labor mobility, our model has also stressed the problem ofendogeneity: does diversity causes wage and rent changes or vice-versa?We have estimated the model through wage and rent regressions across US
cities in the period 1970-1990. Either higher wage or higher rent or both havebeen shown to be significantly correlated with richer diversity. This resulthas survived several robustness checks against possible alternative explanationsbased on omitted variables.
25

To investigate the direction of causality of the above correlations, we haveproposed to instrument diversity in two different ways, both exploiting the factthat, presumably exogenously from the characteristics of any single city, theoverall migration into the US increased significantly between 1970 and 1990.Both instruments support the view that, during the period of observation.Richer diversity caused higher wages or higher rents or both for US-born resi-dents across US cities.Given our identification procedure, these findings are consistent only with
a dominant production amenity effect of diversity: a more multicultural urbanenvironment makes US-born citizens more productive. The choice of US cities asunits of observation makes this result clean from most institutional differencesthat are generally shown to drive comparable cross-country studies. To thebest of our knowledge, in terms of both data and identification procedure, ourresults are new. These results shed new light on the ongoing policy debate on theopportunity of imposing additional restrictions to migration flows in developedcountriesIt is worth mentioning, as a concluding remark, that while we established
the positive effect of foreign-born residents, we did not ”open the black box”to analyze theoretically and empirically what are the channels through whichthis effect works. We mentioned in the paper two interesting avenues throughwhich this effect may work and we briefly qualify them here. First, foreign-born may have skills which are complementary to those of US-born. Even atthe same level of education, problem solving, creativity and adaptability maydiffer between native and foreign-born workers so that reciprocal learning maytake place. Second, foreign-born workers may provide services which are notperfectly substitutable with those of natives. An Italian stylist, a Mexicancook, a Russian dancer, simply provide different services than their US-borncounterparts and, because of a taste for variety, this may increase the valueof total production. The first effect described is likely to be stronger for thehighly educated and in High Tech sectors. The second effect is likely to beimportant in the service sector. Suggestively, we run two separate specificationsas (14) using one time the wage of low skilled (High School educated) and theother time that of high skilled (College educated) US-born white males 40 -50as dependent variable10. The effect of the share of foreign-born is significantlypositive on the high skilled returns (0.45 std. error 0.16) and zero on low-skilledreturns (0.16 std. error 0.23). This result suggests that foreign-born’s skills aremore complementary to highly skilled US workers and explains also why mostof the research that focused on low-skilled workers ( Borjas 1999, Card 1990)did not find any positive effect of foreign-born. As suggestive exploration ofthe second channel, we run specification (14) separately on three subsamples.One only for the Low-Tech Manufacturing sector, another for the High-TechManufacturing sector and the third for the Service sector. Interestingly, theeffect of the share or foreign-born workers on the average wage of US-born
10The results of these last few regressions are not reported in the tables but are availableon request.
26
(white, male, 40-50) was 0.02 (std. error 0.19) in Low Tech Manufacturing,0.55 (std. error 0.30) in High tech Manufacturing and 1.00 (std. error 0.19) inthe service sector. This again is consistent with the idea that foreigners providevaluable complementary skills in High Tech manufacturing, but not in Low Techmanufacturing. Even more, they provide services which are not close substituteswith those of natives and increase substantially the productivity in the servicesector. Overall we find our findings plausible and encouraging, leaving to futureresearch the important goal of pursuing further the analysis of the mechanismsthrough which foreign-born residents affect the US economy.
27
References
[1] Alesina A., Baqir R. and W. Easterly (1999) Public goods and ethnic di-visions, Quarterly Journal of Economics, 114, 1243-84.
[2] Bairoch P. (1988) Cities and Economic Development: from the Dawn ofHistory to the Present (Oxford: Oxford University Press).
[3] Barro R. and X. Sala-i-Martin (1995) Economic Growth (New York: McGraw-Hill).
[4] Berliant, M. and M. Fujita (2003) Knowledge creation as a square danceon the Hilbert Cube, Washington University, Department of Economics,mimeo.
[5] Boeri T., Hanson G. and B. McCormick (2002) Immigration Policy and theWelfare System (Oxford: Oxford University Press).
[6] Borjas G. (1994) The economics of immigration, Journal of Economic Lit-erature, 32, 1667-1717.
[7] Borjas G. (1995) The economic benefits of immigration, Journal of Eco-nomic Perspectives, 9, 3-22.
[8] Borjas G. (1999) Heaven’s Doors (Princeton: Princeton University Press).
[9] Card D. (1990) The Impact of the Mariel Boatlift on the Miami labormarket, Industrial and Labor Relations Review, 43, 245-257.
[10] Card D. (2001) Immigrant inflows, native outflows and the local labor mar-ket impacts of higher immigration, Journal of Labor Economics 19, 22-61.
[11] Card D. and J. Di Nardo (2000) Do immigrant inflows lead to native out-flows?, American Economic Review, 90, 360-367.
[12] Card D. and A. Krueger (1992) School quality and black-white relativeearnings: A direct assessment, Quarterly Journal of Economics, 107, 151-200.
[13] Card D. and A. Krueger (1993) Trends in relative black-white earningsrevisited, American Economic Review, Papers and Proceedings, 83, 85-91.
[14] Canova, F. and M. Ravn (2000) The macroeconomic effect of German Uni-fication: Real adjustments and the welfare State, Review of Economic Dy-namics, 3, 423-60.
[15] Ciccone A. and G.Peri (2002) Identifying human capital externalities: The-ory with an application to US cities, Universitat Pompeu Fabra, WorkingPaper n.611.
[16] Collier P. (2001) Implications of ethnic diversity, Economic Policy: a Eu-ropean Forum, 0, 127-55.
28

[17] Cutler D. and E. Glaeser (1997) Are ghettos good or bad?, Quarterly Jour-nal of Economics, 112, 827-72.
[18] Davis D. and D. Weinstein (2002) Technological superiority and the lossesfrom migration, Columbia University Department of Economics, DiscussionPaper n.0102-60.
[19] Dolado J., Goria A. and A. Ichino (1994) Immigration, human capital andgrowth in the host country, Journal of Population Economics, 7, 193-215.
[20] Easterly W. and R. Levine (1997) Africa’s growth tragedy: Policies andethnic division, Quarterly Journal of Economics, 112, 1203-50.
[21] Eckstein Z. and K. Wolpin (1999) Estimating the effect of racial discrim-ination on first job wage offers, Review of Economics and Statistics, 81,384-392.
[22] Economist (2002), Who gains from immigration?, June 29th, 37-38.
[23] EEAG - European Economic Advisory Group (2003) Report on the Euro-pean Economy 2003 (Munich: CESifo).
[24] Florida R. (2002) Bohemia and Economic Geography, Journal of EconomicGeography, 2, 55-71.
[25] Fujita, M., Krugman P. and A.J. Venables (1999) The Spatial Economy.Cities, regions and international trade (Cambridge MA: MIT Press).
[26] Glaeser E., and D. Mare (2001) Cities and skills, Journal of Labor Eco-nomics, 19, 316-342.
[27] Glaeser E., Kolko J. and A. Saiz (2001) Consumer city, Journal of EconomicGeography, 1, 27-50.
[28] Jacobs J. (1969) The Economy of Cities (New York: Random House).
[29] Lazear E. (1995) Culture and language, NBER, Working Paper n.5249.
[30] Lazear E. (1999) Globalization and the market for team-mates, EconomicJournal,109, C15-C40.
[31] Lian B. and J. Oneal (1997) Cultural diversity and economic development:A cross-national study of 98 Countries, 1960-1985, Economic Developmentand Cultural Change, 46, 61-77.
[32] Maignan, C., Ottaviano G., Pinelli D. and F. Rullani (2003) Bio-EcologicalDiversity vs Socio-Economic Diversity: A Comparison of Existing Mea-sures, FEEM, Working Paper n.13.2003.
[33] Mason P. (2000) Persistent discrimination: Racial disparity in the UnitedStates, 1967-1998, American Economic Review, 90, 312-16.
29
[34] Mauro P. (1995) Corruption and growth, Quarterly Journal of Economics,110, 681-712.
[35] Moretti E. (2003) Estimating the external return to higher education: Evi-dence from cross-sectional and longitudinal data, Journal of Econometrics,forthcoming.
[36] Park J. (1994) Estimation of sheepskin effects and returns to schoolingusing the old and new CPS measures of educational attainment, PrincetonUniversity Industrial Relation Section, Working Paper n.338.
[37] Roback J. (1982) Wages, rents and the quality of life, Journal of PoliticalEconomy, 90, 1257-78.
[38] Saiz A. (2003a) Room in the kitchen for the melting pot: Immigration andrental prices, Review of Economics and Statistics, forthcoming.
[39] Saiz A. (2003b) Immigration and housing rents in American cities, FederalReserve Bank of Philadelphia, Working Paper n.03-12.
[40] Sassen S. (1994) Cities in a World Economy (Thousand Oaks: Pine ForgePress).
[41] Sivitanidou R. and W. Wheaton (1992) Wage and rent capitalization in thecommercial real estate market, Journal of Urban Economics 31, 206-229.
[42] Taylor C. and M. Hudson (1972) World Handbook of Political and SocialIndicators, Second Edition (New Haven: Yale University Press).
30

A Data Appendix
A.1 Data for MSA’s
The data on cultural diversity and foreign-born are obtained from the 1970-1990Public Use Microdata Sample (PUMS) of the US Census. We selected all peoplein working age (16-65) in each year and we identified the city where they livedusing the SMSA code for 1990, while in 1970 we used the county group code toidentify the metropolitan area. We used the variable ‘Place of birth’ in order toidentify the country of origin of the person. We consider only the countries oforigin that generate at least 0.5 percent of all foreign-born in the US workingage population obtaining 35 groups for 1970 and 40 for 1990.We use the Variable ‘Salary and Wage’ to measure the yearly wage income
of each person. We transform the wage in real 1990 US $ terms by deflatingit for the GDP deflator. To construct the average wage at the MSA level weselect only white male US-born individual between 40 and 50 years of age. Theyconstitute our group of homogeneous US-born citizen. The years of schoolingfor individuals of this group are measured using the variable ‘higrad’ for the1970 census, which indicates the highest grade attended, while for 1990 thevariable ‘grade completed’ is converted into years of schooling using Park (1994)correspondence Table 4. Average rents paid by the US-born are calculated usingthe group of white US-born males in working age and averaging by MSA theirgross monthly rent per room (i.e. Rent divided by number of rooms) expressedin real 1990 US $ terms. The data on total city employment, total local publicspending, and public spending in education are from the ”County and CityDatabook”.The list of metropolitan areas used in our study is reported in the following
table.
31

Name and state of the cities used
Abilene, TX Dayton-Springfield, OH Lexington, KY Rockford, IL
Akron, OH Decatur, IL Lima, OH Sacramento, CA
Albany-Schenectady-Troy, NY
Denver, CO Lincoln, NE Saginaw-Bay City-Midland, MI
Albuquerque, NM Des Moines, IA Little Rock-North Little Rock, AR
St. Louis, MO-IL
Allentown-Bethlehem-Easton, PA
Detroit, MI Los Angeles-Long Beach, CA Salem, OR
Altoona, PA Duluth-Superior, MN-WI Louisville, KY-IN Salinas, CA
Amarillo, TX El Paso, TX Lubbock, TX Salt Lake City-Ogden, UT
Appleton-Oshkosh-Neenah, WI
Erie, PA Macon, GA San Antonio, TX
Atlanta, GA Eugene-Springfield, OR Madison, WI San Diego, CA
Atlantic-Cape May, NJ Fayetteville, NC Mansfield, OH San Francisco, CA
Augusta-Aiken, GA-SC Flint, MI Memphis, TN-AR-MS San Jose, CA
Austin-San Marcos, TX Fort Lauderdale, FL Miami, FL Santa Barbara-Santa Maria-Lompoc, CA
Bakersfield, CA Fort Wayne, IN Milwaukee-Waukesha, WI Santa Rosa, CA
Baltimore, MD Fresno, CA Minneapolis-St. Paul, MN-WI Seattle-Bellevue-Everett, WA
Baton Rouge, LA Gainesville, FL Modesto, CA Shreveport-Bossier City, LA
Beaumont-Port Arthur, TX Gary, IN Monroe, LA South Bend, IN
Billings, MT Grand Rapids-Muskegon-Holland, MI
Montgomery, AL Spokane, WA
Biloxi-Gulfport-Pascagoula, MS
Green Bay, WI Muncie, IN Springfield, MO
Binghamton, NY Greensboro--Winston-Salem--High Point, NC
Nashville, TN Stockton-Lodi, CA
Birmingham, AL Greenville-Spartanburg-Anderson, SC
New Orleans, LA Syracuse, NY
Bloomington-Normal, IL Hamilton-Middletown, OH New York, NY Tacoma, WA
Boise City, ID Harrisburg-Lebanon-Carlisle, PA
Newark, NJ Tampa-St. Petersburg-Clearwater, FL
Brownsville-Harlingen-San Benito, TX
Honolulu, HI Norfolk-Virginia Beach-Newport News, VA-NC
Terre Haute, IN
Buffalo-Niagara Falls, NY Houston, TX Odessa-Midland, TX Toledo, OH
Canton-Massillon, OH Huntington-Ashland, WV-KY-OH
Oklahoma City, OK Trenton, NJ
Cedar Rapids, IA Indianapolis, IN Omaha, NE-IA Tucson, AZ
Champaign-Urbana, IL Jackson, MI Orlando, FL Tulsa, OK
Charleston-North Charleston, SC
Jackson, MS Pensacola, FL Tuscaloosa, AL
Charlotte-Gastonia-Rock Hill, NC-SC
Jacksonville, FL Peoria-Pekin, IL Tyler, TX
Chattanooga, TN-GA Jersey City, NJ Philadelphia, PA-NJ Utica-Rome, NY
Chicago, IL Johnstown, PA Phoenix-Mesa, AZ Vallejo-Fairfield-Napa, CA
Cincinnati, OH-KY-IN Kalamazoo-Battle Creek, MI Pittsburgh, PA Waco, TX
Cleveland-Lorain-Elyria, OH Kansas City, MO-KS Portland-Vancouver, OR-WA Washington, DC-MD-VA-WV
Colorado Springs, CO Kenosha, WI Raleigh-Durham-Chapel Hill, NC
Waterloo-Cedar Falls, IA
Columbia, MO Knoxville, TN Reading, PA West Palm Beach-Boca Raton, FL
Columbia, SC Lafayette, LA Reno, NV Wichita, KS
Columbus, OH Lafayette, IN Richmond-Petersburg, VA Wilmington-Newark, DE-MD
Corpus Christi, TX Lancaster, PA Riverside-San Bernardino, CA
Wilmington, NC
Dallas, TX Lansing-East Lansing, MI Roanoke, VA York, PA
Davenport-Moline-Rock Island, IA-IL
Las Vegas, NV-AZ Rochester, NY Youngstown-Warren, OH
32

A.2 Grouping by Country of Birth
In Tables 1-9 we consider the diversity index constructed using 35 groups, cor-responding to the 35 country of origin of immigrants which top the list of allcountries of origin plus a residual group called ‘others’. These 35 countriesaccount for more than 90 percent of all foreign-born, both in 1970 and 1990,and a country that is not in this list supplies not more than 0.5 percent ofall foreign-born living in the US. Here is the list of the non-residual countries,in alphabetical order. For year 1970 the countries are: Argentina, Australia,Canada, Czechoslovakia, China, Colombia, Cuba, Dominican Republic, Eng-land, France, Germany, Greece, Hungary, India, Ireland, Italy, Jamaica, Japan,Korea, Latvia, Lithuania, Mexico, Netherlands, Norway, Philippines, Poland,Portugal, Romania, Scotland, Sweden, Syria, Ukraine, URSS, Yugoslavia, Oth-ers. For 1990 the countries are: Argentina, Canada, China, Colombia, Cuba,Dominican Republic, Ecuador, England, France, Germany, Greece, Guyana,Haiti, Honduras, Hong-Kong, India, Iran, Ireland, Italy, Jamaica, Japan, Korea,Mexico, Nicaragua, Panama, Peru, Philippines, Poland, Portugal, El Salvador,Taiwan, Trinidad and Tobago, USSR, Vietnam, Yugoslavia.In Tables 10 and 11, to have the same group classification in 1970 and 1990,
we allocate more than one non-residual country to the same group based ongeographical proximity. Our fifteen groups are almost the same as those definedand used in Card (2001), Table 5. This is the list: Mexico, Caribbean Coun-tries, Central America, China-Honk Kong-Singapore, South America, SouthEast Asia, Korea and Japan, Philippines, Australia-New Zealand-Canada-UK,India and Pakistan, Russia and Central Europe, Turkey, North Africa and Mid-dle East, Northwestern Europe and Israel, South-western Europe, Sub-SaharanAfrica, Cuba.
33

34
Tables and Figures
Table 1 Foreign Born living in 161 U.S. MSA’s,
15 Largest Groups 1970-1990
Source: Authors’ Elaborations on 1970 and 1990 PUMS Census Data.
Country of Origin Percentage of total Foreign Born 1970
Country of Origin Percentage of total Foreign Born 1990
Canada 9.0% Mexico 20.0% Italy 8.1% Philippines 6.0% Germany 7.8% Cuba 4.2% Mexico 7.3% Germany 3.2% Syria 7.0% Canada 3.2% Cuba 5.1% China 2.8% Poland 4.5% India 2.8% UK 4.4% Viet-Nam 2.7% Philippine 2.3% El Salvador 2.6% USSR 2.3% Italy 2.4% Ireland 2.3% Korea 2.2% China 2.3% UK 2.2% Yugoslavia 1.7% Japan 1.8% Greece 1.6% Jamaica 1.7% Hungary 1.6% Colombia 1.6% Foreign Born as % of working age total population , 1970
8.0% Foreign Born as % of working age total population , 1990
11.9%

35
Table 2 Diversity in some U.S. MSA’s, 1990
Source: Authors’ Elaborations on 1970 and 1990 PUMS Census Data.
city Share of Foreign Born
Country of Origin of the Five Largest foreign Groups
Diversity Index
Atlanta, GA 5.8% Germany, Mexico, India, England, Korea
0.11
Chicago, IL 15.2% Mexico, Poland, Philippines, India, Germany
0.28
Cincinnati, OH-KY-IN 2.3% Germany, England, India, Canada, Viet-Nam
0.057
Dallas, TX 10.6% Mexico, Salvador, Viet-Nam, India, Germany
0.20
El Paso, TX 29% Mexico, Japan, Korea, Canada, Panama
0.43
Indianapolis, IN 2.3% Germany, England, Korea, Canada, Philippines
0.046
Las Vegas, NE 12% Mexico, Philippines, Germany, Canada, Cuba
0.23
Los Angeles, CA 37% Mexico, Salvador, Philippines, Guatemala, Korea
0.58
New York, NY 31% Dominican Republic, China, Jamaica, Italy, Colombia
0.51
Oklahoma City, OK 4.1% Mexico, Viet-Nam, Germany, England, Japan
0.08
Philadelphia, PA-NJ 5% Germany, India, Italy, England, Philippines
0.10
Pittsburgh, PA 2.3% Italy, Germany, India, England, Canada
0.04
Sacramento, CA 10.6% Mexico, Philippines, Germany, China, Canada
0.19
San Francisco, CA 30.3% Philippines, China, Mexico, Salvador, Hong Kong
0.50
Washington, DC-MD-VA-WV 14.8% Salvador, Germany, India, Korea, Viet-Nam
0.27

36
Table 3 Basic Panel Wage Regression
Explanatory Variables:
1: Dependent Variable: ln(Wage)
2: Dependent Variable: ln(Wage)
3: Dependent Variable: ln(Income)
4: Dependent Variable: ln(Income)
Average Schooling
0.10** (0.01)
0.10** (0.01)
0.07* (0.01)
0.07* (0.01)
Ln(Employment) 0.02 (0.02)
0.01 (0.02)
0.14* (0.03)
0.10** (0.03)
Diversity Index 1.29** (0.29)
1.55** (0.70)
Share of Foreign Born
0.58** (0.11)
0.82* (0.27)
Diversity Index Among Foreign Born
0.14* (0.08)
0.05 (0.10)
City Fixed Effects
Yes Yes Yes Yes
Time Fixed Effects
Yes Yes Yes Yes
R2 0.99 0.99 0.99 0.99 Observations 320 320 320 320 I and II: Dependent Variable: ln average yearly wage of white, U.S. Born, males 40-50 years in 1990 U.S. $. III and IV: Dependent Variable: ln average yearly income of white, U.S. Born, males in 1990 U.S. $. ** significant at 5%, * significant at 10% In Parenthesis: Heteroskedasticity-Robust Standard Errors.

37
Table 4
Basic Panel Rent Regression Explanatory Variables:
1: Dependent Variable: ln(Rent)
2: Dependent Variable: ln(Rent)
3: Dependent Variable: ln(Rent)
4: Dependent Variable: ln(Rent)
Ln(Income per Capita)
0.67** (0.08)
0.66** (0.08)
Ln(Population) 0.10** (0.04)
0.02 (0.04)
0.03 (0.04)
0.06 (0.04)
Diversity Index 1.80** (0.60)
0.95** (0.50)
Share of Foreign Born
1.06** (0.27)
0.53** (0.20)
Diversity Index Among Foreign Born
0.11 (0.16)
0.16 (0.13)
City Fixed Effects
Yes Yes Yes Yes
Time Fixed Effects
Yes Yes Yes Yes
R2 0.97 0.99 0.98 0.99 Observations 320 320 320 320 Dependent Variable: ln average monthly rent per room paid by white, U.S. Born, expressed in 1990 U.S. $. ** significant at 5%, * significant at 10% In Parenthesis Heteroskedasticity Robust Standard Errors.

38
Table 5 Correlation between Diversity and Employment/Population
Index of
Diversity
City Fixed Effects
Time fixed effects
R2 Observations
Ln(Employment) 0.72 (1.12)
Yes Yes 0.97 320
Ln(Population)
1.70* (1.02)
Yes Yes 0.97
320
** significant at 5%, * significant at 10% In Parenthesis Heteroskedasticity Robust Standard Errors.

39
Table 6 Wage Regression: Robustness Checks
Specification 1
Coefficient on the Diversity Index
2 Coefficient on the Share of Foreign Born
3 Coefficient on Diversity Index Among Foreign Born
Specification: (1) Basic 1.29**
(0.29) 0.58** (0.11)
0.14* (0.08)
(2) Including schooling of Foreign Born
1.25** (0.38)
0.58** (0.16)
0.14* (0.09)
(3) Including share of Out of State Born
1.34** (0.38)
0.61** (0.16)
0.09 (0.09)
(4) Including share of non Whites 1.38** (0.40)
0.68** (0.18)
0.13 (0.10)
(5) Including Public Spending on local Services per capita
1.28** (0.38)
0.62** (0.17)
0.16** (0.08)
(6) Including Public Spending in Education per capita
1.24** (0.38)
0.61** (0.16)
0.15* (0.08)
(7) Including All of the Above 1.40** (0.40)
0.74** (0.18)
0.09 (0.08)
(8) Basic without CA, FL, NY 0.97** (0.50)
0.30 (0.27)
0.21** (0.10)
(9) in Changes 1990-1970 with State-Fixed Effects
1.05** (0.33)
0.64** (0.18)
0.03 (0.10)
Dependent Variable: ln average yearly wage to white, U.S. Born, 40-50 years old expressed in 1990 U.S. $.
(1) Basic: Specification from Table 3 Column I (for coefficient 1) and Column II (for coefficients 2 and 3)
(2) Includes average years of schooling of foreign born (3) Includes the share of U.S. born outside the state in which they live (4) Includes the share of non-white people in working age (5) Include the Spending per capita on local government services. (6) Includes the Spending in Education per Capita (7) Includes all the variables in (1)-(6) together as controls (8) Excluding from the regression MSAs in the biggest immigrations states (CA, FL,
NY) (9) Regression in Changes including 49 State Fixed-Effects
** significant at 5%, * significant at 10% In Parenthesis Heteroskedasticity Robust Standard Errors.

40
Table 7 Rent Regression: Robustness Checks
Specification 1
Coefficient on the Diversity Index
2 Coefficient on the Share of Foreign Born
3 Coefficient on Diversity Index Among Foreign Born
Specification: (1) Basic 0.95**
(0.50) 0.53** (0.20)
0.11 (0.16)
(2) Including schooling of Foreign Born
0.92* (0.49)
0.58** (0.22)
0.17 (0.14)
(3) Including share of Out of State Born
0.86* (0.50)
0.52** (0.24)
0.16 (0.15)
(4) Including share of non Whites 0.71 (0.50)
0.44** (0.25)
0.14 (0.13)
(5) Including Public Spending on local Services per capita
0.89* (0.50)
0.53** (0.24)
0.18 (0.14)
(6) Including Public Spending in Education per capita
0.94** (0.50)
0.53** (0.24)
0.14 (0.14)
(7) Including All of the Above 0.72 (0.50)
0.53** (0.24)
0.15 (0.14)
(8) Basic without CA, FL, NY 2.99** (1.19)
0.74* (0.39)
0.10 (0.10)
(9) in Changes 1990-1970 with State-Fixed Effects
0.13 (0.42)
0.03 (0.23)
0.15 (0.17)
Dependent Variable: ln average monthly Rent paid by white, U.S. Born, expressed in 1990 U.S. $.
(1) Basic: Specification from Table 4 Column II (for coefficient 1) and Column IV (for coefficients 2 and 3)
(2) Includes average years of schooling of foreign born (3) Includes the share of U.S. born outside the state in which they live (4) Includes the share of non-white people in working age (5) Include the Spending per capita on local government services. (6) Includes the Spending in Education per Capita (7) Includes all the variables in (1)-(6) together as controls (8) Excluding from the regression MSAs in the biggest immigrations states
(CA, FL, NY) (9) Regression in Changes including 49 State Fixed-Effects
** significant at 5%, * significant at 10% In Parenthesis Heteroskedasticity Robust Standard Errors.

41
Table 8
SUR Estimation of the system of Wage and Rent equations
Dependent Variable Wage Rents Coefficient Estimate on: Diversity
Index
Share of Foreign Born
Diversity Index
Share of Foreign Born
Specification: (1) Basic 1.78**
(0.42) 0.56** (0.11)
1.24** (0.27)
1.05** (0.19)
(2) Including schooling of Foreign Born
1.77** (0.40)
0.56** (0.11)
1.24** (0.26)
1.09** (0.18)
(3) Including share of Out of State Born
1.80** (0.42)
0.61** (0.11)
1.30** (0.26)
1.07** (0.19)
(4) Including share of non Whites 1.41** (0.43)
0.67** (0.13)
1.36** (0.28)
0.88* (0.20)
(5) Including Public Spending on local Services per capita
1.77** (0.42)
0.59** (0.11)
1.27** (0.26)
1.05** (0.18)
(6) Including Public Spending in Education per capita
1.80** (0.42)
0.58** (0.11)
1.23** (0.26)
1.06** (0.19)
(7) Including All of the Above 1.13** (0.27)
0.58** (0.13)
0.79** (0.35)
0.56** (0.17)
(8)Basic without CA, FL, NY 1.09* (0.60)
0.34 (0.21)
3.50** (0.90)
1.21* (0.30)
(9) in Changes 1990-1970 with State-Fixed Effects
1.05** (0.34)
0.64** (0.16)
0.11 (0.19)
0.03 (0.19)
System estimation, Dependent variables : ln average yearly wage to white, U.S. Born, 40-50 years old expressed in 1990 U.S. $. ln average monthly Rent paid by white, U.S. Born, expressed in 1990 U.S. $.
(1)Basic: Specification (2) Includes average years of schooling of foreign born (3) Includes the share of U.S. born outside the state in which they live (4) Includes the share of non-white people in working age (5) Include the Spending per capita on local government services. (6) Includes the Spending in Education per Capita (7) Includes all the variables in (1)-(6) together as controls (8) Excluding from the regression MSAs in the biggest immigrations states
(CA, FL, NY) (9) Regression in Changes including 49 State Fixed-Effects
** significant at 5%, * significant at 10%

42
Table 9 IV Estimation, Instrument: Distance from port of Entry.
Wage Regression Dependent Variable : ∆ln(Wage) 1970-1990
1 Diversity Index
2 Share of Foreign Born
3 Diversity Index
4 Share of Foreign Born
5 Non-Coastal Cities
6 Non-Coastal Cities
∆Schooling 0.11** (0.01)
0.10** (0.01)
0.10** (0.02)
0.11** (0.02)
0.11** (0.02)
0.10** (0.02)
∆ln(Empl) 0.02 (0.02)
0.01 (0.02)
0.07 (0.04)
0.05 (0.04)
0.04 (0.04)
0.07 (0.05)
∆(Foreign Born) 0.72* (0.12)
0.69** (0.20)
1.60** (0.47)
∆(Diversity) 1.55** (0.47)
1.23** (0.42)
4.70* (2.40)
State Fixed Effects No No Yes Yes No No R2 0.35 0.35 0.65 0.66 0.30 0.30 Observations 160 160 160 160 144 144
First Stage Estimation Ln(Distance from LA) -0.038**
(0.004) -0.015** (0.001)
-0.038** (0.004)
-0.015** (0.001)
-0.034** (0.006)
-0.007** (0.001)
Ln(Distance from NY) -0.004** (0.002)
-0.004** (0.001)
-0.004** (0.002)
-0.004** (0.001)
-0.003 (0.003)
-0.004** (0.001)
Ln(Distance from Miami) -0.023** (0.003)
-0.012* (0.001)
-0.023** (0.003)
-0.012* (0.001)
-0.023** (0.007)
-0.0005 (0.0005)
Ln(Distance from Border)
-0.002** (0.001)
-0.001 (0.001)
-0.002** (0.001)
-0.001 (0.001)
-0.004** (0.002)
-0.001** (0.0005)
R2 0.55 0.54 0.55 0.54 0.36 0.30 Dependent Variable: Change between 1970 and 1990 in ln average yearly wage of white, U.S. Born, 40-50 years, expressed in 1990 U.S. $. ** significant at 5%, * significant at 10% In Parenthesis Heteroskedasticity Robust Standard Errors.

43
Table 10
IV Estimation, Instrument: Distance from Port of Entry. Rent Regression
Dependent Variable : ∆ln(Rent) 1970-1990
1 Diversity Index
2 Share of Foreign Born
3 Diversity Index
4 Share of Foreign Born
5 Non-Coastal Cities
6 Non-Coastal Cities
∆ln(Income) 0.65** (0.10)
0.65** (0.10)
0.47** (0.12)
0.46** (0.12)
0.39* (0.17)
0.29** (0.11)
∆ln(Pop) 0.03 (0.04)
0.03 (0.04)
0.04 (0.08)
0.03 (0.08)
0.02 (0.14)
0.02 (0.10)
∆(Foreign Born) 1.05** (0.50)
0.20 (0.33)
1.40** (0.68)
∆(Diversity) 1.60 (1.00)
0.17 (0.48)
5.90** (1.80)
State Fixed Effects No No Yes Yes No No R2 0.35 0.36 0.73 0.73 0.14 0.18 Observations 160 160 160 160 144 144
First Stage Estimation Ln(Distance from LA) -0.038**
(0.004) -0.015** (0.001)
-0.038** (0.004)
-0.015** (0.001)
-0.034** (0.006)
-0.007** (0.001)
Ln(Distance from NY) -0.004** (0.002)
-0.004** (0.001)
-0.004** (0.002)
-0.004** (0.001)
-0.003 (0.003)
-0.004** (0.001)
Ln(Distance from Miami) -0.023** (0.003)
-0.012* (0.001)
-0.023** (0.003)
-0.012* (0.001)
-0.023** (0.007)
-0.0005 (0.0005)
Ln(Distance from Border)
-0.002** (0.001)
-0.001 (0.001)
-0.002** (0.001)
-0.001 (0.001)
-0.004** (0.002)
-0.001** (0.0005)
R2 0.55 0.54 0.55 0.54 0.36 0.30 Dependent Variable: Change between 1970 and 1990 in ln average monthly rent paid by white, U.S. Born, expressed in 1990 U.S. $. ** significant at 5%, * significant at 10% In Parenthesis Heteroskedasticity Robust Standard Errors.
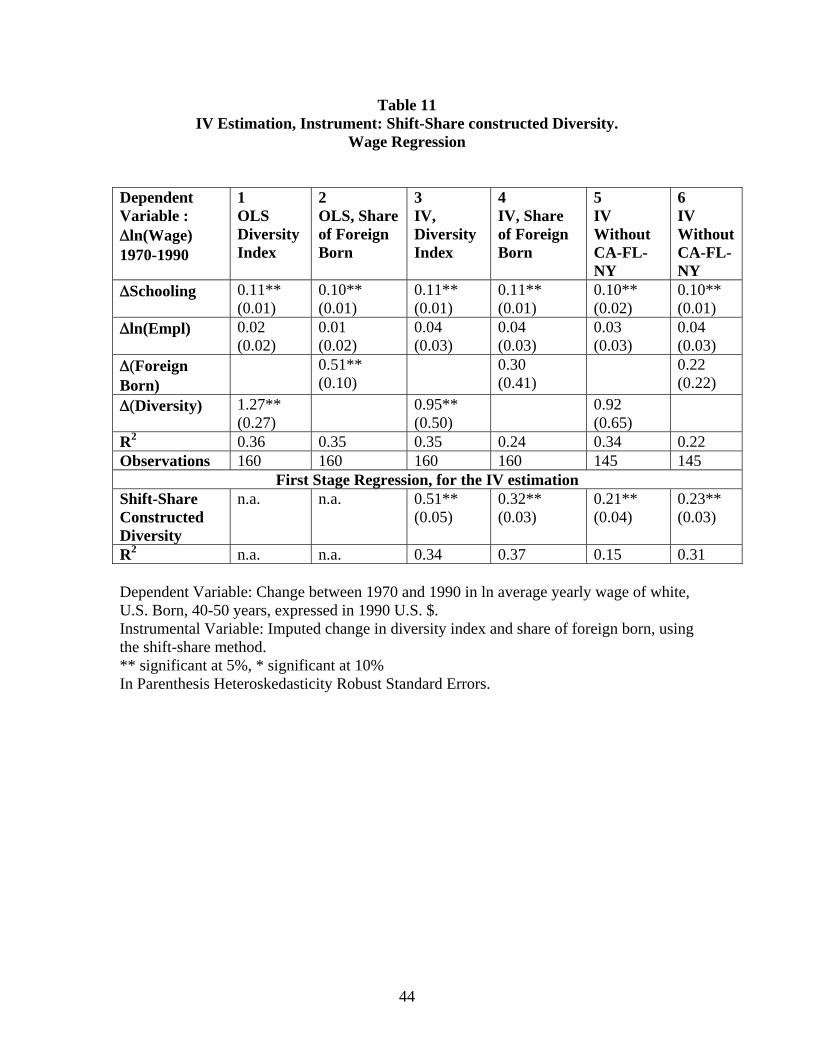
44
Table 11 IV Estimation, Instrument: Shift-Share constructed Diversity.
Wage Regression Dependent Variable : ∆ln(Wage) 1970-1990
1 OLS Diversity Index
2 OLS, Share of Foreign Born
3 IV, Diversity Index
4 IV, Share of Foreign Born
5 IV Without CA-FL-NY
6 IV Without CA-FL-NY
∆Schooling 0.11** (0.01)
0.10** (0.01)
0.11** (0.01)
0.11** (0.01)
0.10** (0.02)
0.10** (0.01)
∆ln(Empl) 0.02 (0.02)
0.01 (0.02)
0.04 (0.03)
0.04 (0.03)
0.03 (0.03)
0.04 (0.03)
∆(Foreign Born)
0.51** (0.10)
0.30 (0.41)
0.22 (0.22)
∆(Diversity) 1.27** (0.27)
0.95** (0.50)
0.92 (0.65)
R2 0.36 0.35 0.35 0.24 0.34 0.22 Observations 160 160 160 160 145 145
First Stage Regression, for the IV estimation Shift-Share Constructed Diversity
n.a. n.a. 0.51** (0.05)
0.32** (0.03)
0.21** (0.04)
0.23** (0.03)
R2 n.a. n.a. 0.34 0.37 0.15 0.31 Dependent Variable: Change between 1970 and 1990 in ln average yearly wage of white, U.S. Born, 40-50 years, expressed in 1990 U.S. $. Instrumental Variable: Imputed change in diversity index and share of foreign born, using the shift-share method. ** significant at 5%, * significant at 10% In Parenthesis Heteroskedasticity Robust Standard Errors.
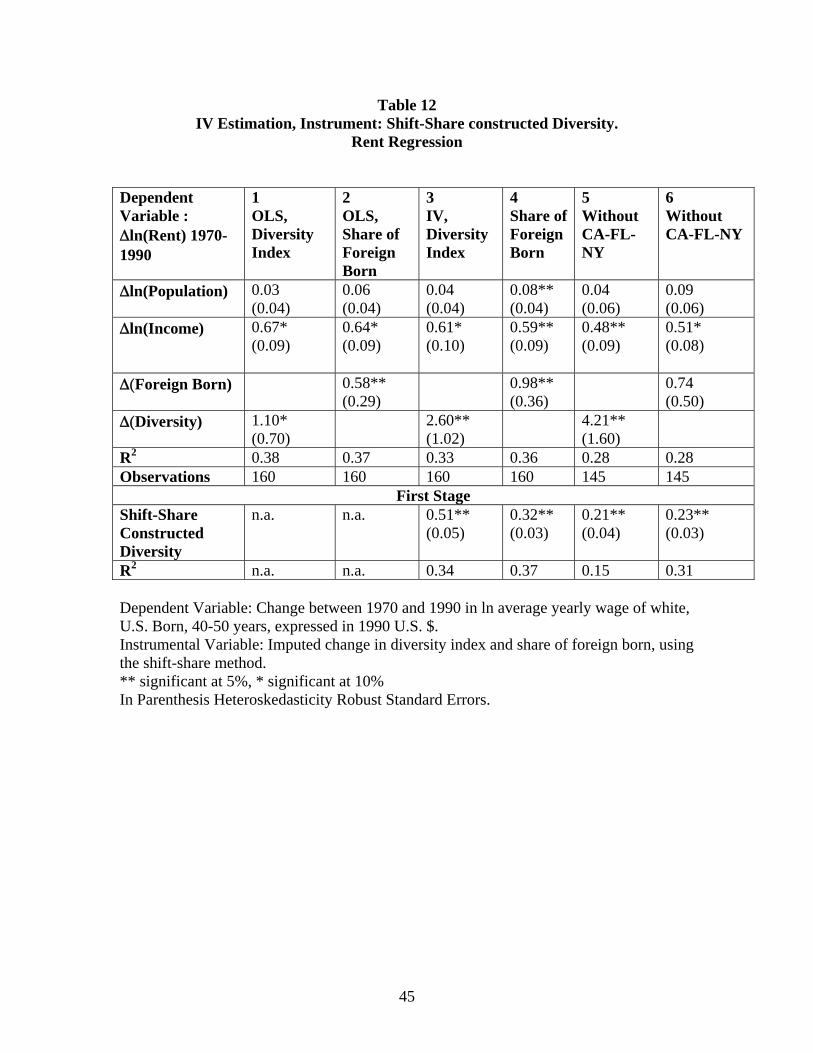
45
Table 12 IV Estimation, Instrument: Shift-Share constructed Diversity.
Rent Regression Dependent Variable : ∆ln(Rent) 1970-1990
1 OLS, Diversity Index
2 OLS, Share of Foreign Born
3 IV, Diversity Index
4 Share of Foreign Born
5 Without CA-FL-NY
6 Without CA-FL-NY
∆ln(Population) 0.03 (0.04)
0.06 (0.04)
0.04 (0.04)
0.08** (0.04)
0.04 (0.06)
0.09 (0.06)
∆ln(Income) 0.67* (0.09)
0.64* (0.09)
0.61* (0.10)
0.59** (0.09)
0.48** (0.09)
0.51* (0.08)
∆(Foreign Born) 0.58** (0.29)
0.98** (0.36)
0.74 (0.50)
∆(Diversity) 1.10* (0.70)
2.60** (1.02)
4.21** (1.60)
R2 0.38 0.37 0.33 0.36 0.28 0.28 Observations 160 160 160 160 145 145
First Stage Shift-Share Constructed Diversity
n.a. n.a. 0.51** (0.05)
0.32** (0.03)
0.21** (0.04)
0.23** (0.03)
R2 n.a. n.a. 0.34 0.37 0.15 0.31 Dependent Variable: Change between 1970 and 1990 in ln average yearly wage of white, U.S. Born, 40-50 years, expressed in 1990 U.S. $. Instrumental Variable: Imputed change in diversity index and share of foreign born, using the shift-share method. ** significant at 5%, * significant at 10% In Parenthesis Heteroskedasticity Robust Standard Errors.
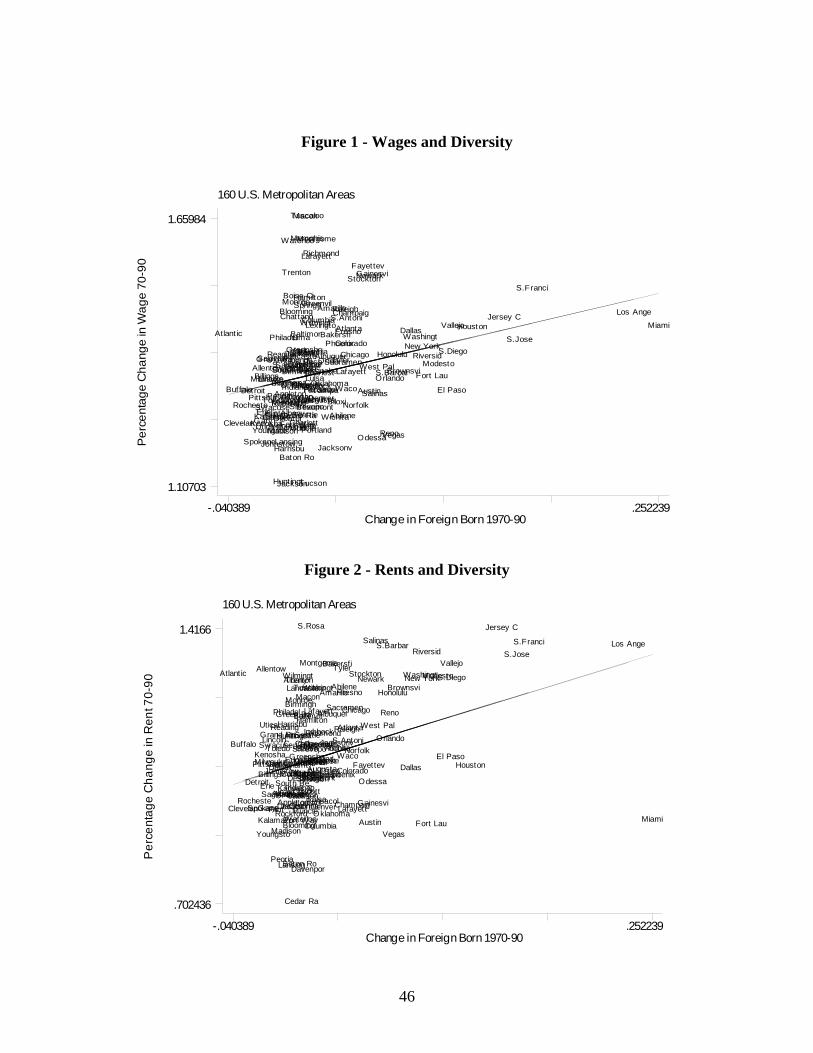
46
Figure 1 - Wages and Diversity
160 U.S. Metropolitan Areas
Pe
rce
ntag
e C
ha
nge
in W
ag
e 70
-90
Change in Foreign Born 1970-90-.040389 .252239
1.10703
1.65984
AbileneAkron
Albany
Albuquer
Allentow
Altoona
Amarillo
Appleton
AtlantaAtlantic
AugustaAustin
BakersfiBaltimor
Baton Ro
Beaumont
Billings
Biloxi
Binghamt
Birmingh
Blooming
Boise Ci
Brownsvi
Buffalo
CantonCedar Ra
Champaig
Charlest
Charlott
Chattano
Chicago
Cincinna
Clevelan
Colorado
Columbia
Columbia
Columbus
C. Chris
Dallas
Davenpor
Dayton
Decatur
Denver
DesMoine
Detroit
Duluth
El Paso
ErieEugene
Fayettev
Flint
Fort Lau
Fort Way
Fresno
Gainesvi
Gary
Grand RaGreen Ba
Greensbo
GreenvilHamilton
Harrisbu
Honolulu
Houston
Huntingt
Indianap
Jackson
Jackson
Jacksonv
Jersey C
Johnstow
Kalamazo
Kansas C
Kenosha
Knoxvill
Lafayett
Lafayett
Lancaste
LansingVegas
Lexingto
Lima
Lincoln
L.Rock
Los Ange
Louisvil
Lubbock
Macon
MadisonMansfiel
Memphis
Miami
Milwauke
Minneapo
Modesto
Monroe
Montgome
Muncie
Nashvill
N. Orlea
New York
Newark
Norfolk
Odessa
Oklahoma
Omaha
Orlando
PensacolPeoria
PhiladelPhoenix
Pittsbur
Portland
Raleigh
Reading
Reno
Richmond
Riversid
Roanoke
Rocheste Rockford
SacramenSaginawS. Louis
Salem
Salinas
SaltLake
S.Antoni
S.Diego
S.Franci
S.Jose
S.BarbarS.Rosa
SeattleShrevepo
South Be
Spokane
Springfi
Stockton
Syracuse
TacomaTampaTerre Ha
Toledo
Trenton
Tucson
Tulsa
Tuscaloo
Tyler
Utica
Vallejo
Waco
Washingt
Waterloo
West Pal
Wichita
Wilmingt
Wilmingt
York
Youngsto
Figure 2 - Rents and Diversity
160 U.S. Metropolitan Areas
Pe
rce
ntag
e C
ha
nge
in R
ent 7
0-9
0
Change in Foreign Born 1970-90-.040389 .252239
.702436
1.4166
Abilene
Akron
Albany
Albuquer
Allentow
Altoona
Amarillo
Appleton
Atlanta
Atlantic
Augusta
Austin
Bakersfi
Baltimor
Baton Ro
BeaumontBillings
Biloxi
Binghamt
Birmingh
Blooming
Boise Ci
Brownsvi
Buffalo
Canton
Cedar Ra
Champaig
Charlest
Charlott
Chattano
Chicago
CincinnaClevelan
Colorado
Columbia
Columbia
Columbus
C. Chris
Dallas
Davenpor
Dayton
Decatur Denver
DesMoineDetroit
DuluthEl Paso
Erie
EugeneFayettev
Flint
Fort LauFort Way
Fresno
GainesviGary
Grand Ra
Green Ba
Greensbo
Greenvil
HamiltonHarrisbu
Honolulu
Houston
Hunt ingt
Indianap
JacksonJackson
Jacksonv
Jersey C
Johnstow
Kalamazo
Kansas C
Kenosha
Knoxvill
Lafayett
Lafayett
Lancaste
Lansing
Vegas
LexingtoLimaLincoln
L.Rock
Los Ange
Louisvil
Lubbock
Macon
Madison
Mansfiel
Memphis
Miami
Milwauke
Minneapo
Modesto
Monroe
Montgome
Muncie
NashvillN. Orlea
New YorkNewark
Norfolk
Odessa
Oklahoma
Omaha
Orlando
Pensacol
Peoria
Philadel
PhoenixPittsbur
Portland
RaleighReading
Reno
Richmond
Riversid
Roanoke
Rocheste
Rockford
Sacramen
SaginawS. Louis
Salem
Salinas
SaltLake
S.Antoni
S.Diego
S.Franci
S.JoseS.Barbar
S.Rosa
Seattle
Shrevepo
South Be
Spokane
Springfi
Stockton
Syracuse
TacomaTampa
Terre Ha
Toledo
Trenton
Tucson
Tulsa
Tuscaloo
Tyler
Utica
Vallejo
Waco
Washingt
Waterloo
West Pal
Wichita
Wilmingt
Wilmingt
York
Youngsto

47
Figure 3 – The Spatial Equilibrium
wc
rc
Free migration
Free entry (dc)Free entry (dc’>dc)
AA’
BC